tm49 internationalisation transnationalisation of the
TRANSCRIPT
Baranyi Márton – Endrıdi-Kovács Viktória – Miklós Gábor – Nagy
Sándor Gyula – Palánkai Tibor
Internationalisation (Transnationalisation) of the Enterprise Sector*
TM 49. Working paper
* The study was supported by European Union and the Hungarian Government (project nr. TÁMOP4.2.1B-09/1KMR-2010-2010-005). It is the result of the research activities in the subproject “The international economic processes and the competitiveness of domestic business.

2
Jelen mőhelytanulmány A nemzetközi gazdasági folyamatok c. mőhelyben készült. Mőhelyvezetı: Magas István
A tanulmány szakmai tartalma a forrás megjelölésével és a hivatkozási szokások betartásával felhasználható és hivatkozható.

3
Content
SUMMARY ....................................................................................................................................................... 4
INTRODUCTION................................................................................................................................................ 4
1. THEORIES OF INTERNATIONALISATION ........................................................................................................ 6
1.1. INTERNATIONALISATION – INTEGRATION - TRANSNATIONAL COMPANIES ..................................................................... 6
1.2. PROCESS OF INTERNATIONALISATION - EUROPEAN INTEGRATION................................................................................ 7
1.3. INTERNATIONALISATION – TRANSNATIONAL COMPANY NETWORK............................................................................. 13
1.4. THEORIES ON FACTORS AND MODELS OF INTERNATIONALIZATION OF COMPANY SECTOR.............................................. 15
2. STATE OF INTERNATIONALIZATION EUROPEAN SMES BY THE EARLY 2000S ............................................... 19
2.1. THE EUROPEAN SITUATION GENERALLY ............................................................................................................... 19
2.2. THE RESULTS OF THE COMMISSION REPORT ......................................................................................................... 20
3. CHARACTERISTICS OF INTERNATIONALIZATION OF THE HUNGARIAN SME SECTOR ................................... 22
3.1. TRENDS IN INTERNATIONALISATION OF HUNGARIAN SME SECTOR............................................................................ 22
3.2. ROLE OF PROPERTY RELATIONS AND SIZE OF ENTERPRISES IN THE INTERNATIONALIZATION.............................................. 24
3.3. MOTIVATION AND DESTINATION OF TRADE AND INVESTMENTS ............................................................................... 26
3.4. PERFORMANCE OF HUNGARIAN SME SECTOR BETWEEN 2000 AND 2009 (IN NUMBERS) ............................................ 29
3.5 INTERNATIONALIZATION OF HUNGARIAN SMES (RESULT OF AN ONLINE SURVEY).......................................................... 39
4. THE INTERNATIONALIZATION OF THE SPANISH SME SECTOR ..................................................................... 45
4.1 THE PROCESS AND STATE OF INTERNATIONALIZATION OF SPANISH ECONOMY ............................................................... 45
4.2. BARRIERS OF INTERNATIONALISATION ................................................................................................................. 51
4.3. SOME BEST PRACTICES ..................................................................................................................................... 53
4.4 THE POSSIBLE STATE SUPPORTS AND SERVICES TO HELP THE PROCESS OF INTERNATIONALISATION OF SMES ....................... 56
SUMMARY CONCLUSIONS.............................................................................................................................. 59
NOTES OF TABLES AND CHARTS ..................................................................................................................... 60
REFERENCES ................................................................................................................................................... 61
4
Summary
As part of a wider research program we analysed the theoretical framework and the recent
developments of the process of internationalisation (transnationalisation) of the small- and medium-
sized enterprises generally in the European Union and with a specific view on Hungary and Spain. We
tried to highlight the trends and barriers of internationalisation. We carried out document analyses,
interviews, analyses of statistical databases and an own data collection with online survey.
Keywords: internationalisation, SME, competitiveness JEL: F15, F29, If cite this paper please use: Nagy-Palánkai-Miklós-Endrıdi-Baranyi (2011): Internationalisation
(Transnationalisation) of the Enterprise Sector. Working Paper, Corvinus University of Budapest
Introduction
Introduction
The emerging global integration in the last decades was marked by rapid and intensive
internationalization of company sectors. The main product of this process was the appearance of
Transnational Companies (TNCs). Their first emergence can be put for the 1960s years, but we can
experience their rapid and substantial expansion mainly from the 1970s years.
In the present global economy, the transnational company with its internal and external
cooperation and business relations is such a modern production and entrepreneur organisation, which
closely follows from the technological and social challenges of our age, and strives for global
optimalisation of its resources and activities. The global company* structures organically emerged from
* Transnational company is a syntetic term, officially used by international organisations (UN). Multinational company is a sub-cathegory of TNCs with multinational ownership, while „nationalally” owned companies can be TNCs if they operate abroad. „Global” companies are rather jounalistic refferences to TNCs. „International” companies existed since long time, as many companies had branches or investments abroad already from 19th century. TNCs optimise their activities in global dimensions. That is new, which applies only for the last 50 years of world economy.

5
the cooperation of developed economies, while their role and relations to other regions (developing
countries) was exogenous and contradictory for a long time. Several forms and structures of
international companies had existed before, but TNCs could be considered as new phenomenon, as
totally new entities. Now, they have growingly become global (appearance of TNCs of emerging
countries).
We define transnational companies in a broad and general sense, the multinational or
„international concerns” are considered as their special forms. There are contradictory and varying
definitions of TNCs, but according to some UN terminologies, those companies can be considered
„transnational”, which with more than 25% of their activity (production, capital, turn over or employment)
abroad operate in more than one country. The transnationality extends to production activities,
ownership relations and management. Besides transnationality, the existence of global business
strategy, central decision making and economic power (market influence and size) are often stressed.
The TNC integrates and optimizes its activities on global scale. Their novelty lies in all of these features.

6
1. Theories of Internationalisation
1.1. Internationalisation – Integration - Transnational Companies
According to estimates TNCs give about 20 to 30% of global GDP, and about 70% of
international trade is related to them in some way or other. They control about 80% of global technology
trade, and about 90% of technology transfers are realised inside the TNCs. The R&D capacities of
developed countries are concentrated overwhelmingly to TNCs, the extra profits from innovation and
technological reconstructions have been realised primarily by TNCs. The ICR greatly contributed to
global allocation of resources and maximalisation of efficiency on global scale. On their basis, the global
company infrastructures and method of organisation of production and business have been developed
and broadly extended.
Primarily, the globally organised and manoeuvring companies are able the minimize
expenditures and utilize resources and production factors. The TNCs are the main actors, who are able
maximally exploit the advantages of global division of labour, and the world market prices are on a large
extent based on expenditures of their globally organised and optimised production.
The TNCs are characterised by great mobility and flexibility. They easily and rapidly can transfer
capacities and production from one country to another, especially when the technology is easily
removable, the fix expenditures are limited, and the trained labour is available. The main producers
usually are followed by their suppliers, but TNCs often tend to rely on local partners. These background
industries (local SMEs) may play important role in the economic development of a country.
The TNCs are often connected with oligopolistic behaviours. Inside the companies the so called
transfer prices are broadly applied, which helps the hidden and illegal transfer and redistribution of
incomes, and tax evasion. This way the advantages of global division of labour are distributed inside the
companies, while for the outsiders, high monopolistic type of prices (on components or services) are
charged. That can put the partners outside the transnational company spheres in competition at
disadvantage.
The expansion of transnational company division of labour have greatly contributed to
globalisation of national markets. The opening of national economies in the last decades was a large
extent realised by TNCs. In the developed countries, the impacts of growing import competition are
7
directly felt on the domestic markets. According to estimates, in USA, greater part of industrial products
faces global competition even on local markets.
“The spread of the capitalist mode of production and free trade following the World War II led to
the development of a complex and highly integrated world economy in which international trade and
investments flows occur on a massive scale at increasingly rapid rates. International economic
structures based on finance and trade have led to increasing interdependence and closer ties between
countries. An important part of this process is associated with the growth of transnational production,
with the increasing ability of firms to locate parts of their production overseas, while still maintaining
direct control over the activities of foreign subsidiaries. This move by many enterprises to spread their
activities into other countries has bolstered the globalization process, broadening the links between
countries.” (O’Brien et al., 2007: 184).
From points of view of global integration, and transnationalisation the spectacularly rapid
expansion and growing internationalisation of capital markets from the 1980s should be particularly
stressed. The liberalization and deregulation of capital markets played an important role, which was
accompanied by the new communication and information technologies (round the clock stock
exchanges). The globalization of financial relations showed extraordinary expansion, particularly in
comparison to real economy. The process in Europe was accelerated by the single market and the
introduction of the Euro.
1.2. Process of Internationalisation - European integration
In the last more than 50 years we can experience a very rapid and intensive internationalisation
of European economies. The EU members reached high level of integration of their economies, which
had broad impacts on economic development, mutual cooperation and structure of the economies of
member states. This can be measured both in terms of trade, and flows of factors of production.
In the last 50 years the trade among the members grew very dynamically, in fact on the long run,
about one and half times more rapidly than their GDP. As result, the economy of the member states
have become strongly internationalised, and achieved a high level of interdependence. In fact, we can
state that this lead to a very dynamic and high level of integration.

8
1. table Trade flows of goods and services (in %of GDP %, EU15)
1960 1970 1980 1990 2000 2004 2008
Total export 19,6 21,8 27,2 28,1 37,4 36,9 42,0
Total import 19,2 21,4 28,6 27,5 36,9 35,4 41,2
Internal EU export 7,7 9,9 13,2 14,4 20,3 19,8 21,5
Internal EU import 7,9 11,0 13,2 14,6 21,8 22,2 22,3
Sources: European Commission: 2001 Broad Economic Policy Guidelines. Europe in Figures, Eurostat
Yearbook 2009. Eurostat. 2010.
The data show that the EU economies are characterised by relatively high levels of external
dependence, which in the last half of the century more than doubled (it grew from about 20% in 1960, to
42% in 2008).
Even greater dynamism characterise the growth of internal trade among the EU members.
Between 1960 and 2008, the share of internal export and import of goods and services almost tripled (it
increased from 8% to 22 of GDP), which resulted in a high level of interdependence among the EU
members. If we accept the 10% as a minimum dependence threshold, then the practically by the early
1970s they overstepped the threshold of interdependence, and by the 2000s years they produced
double of this level. That reflects a high level of real integration among the EU members.
The interdependence was strengthened by technological and production cooperation, and high
level of infrastructure of integration was built up (transport, communication, financial services etc.). On
the basis of intensive internationalisation and transnationalisation of company sector, the strong
foundations of integration were created, the process have become irreversible. Under these
circumstances, the quitting the integration process would mean such high costs, which would be
unacceptable for any partners, and therefore, it is not a relevant alternative. At the high intensity of
integration that applies equally to euro-zone membership as well.
Of course, there are great differences among the countries, which depend on several factors.
Among them, the size of the country, its level of development, and structural openness of economy
should be particularly stressed.
9
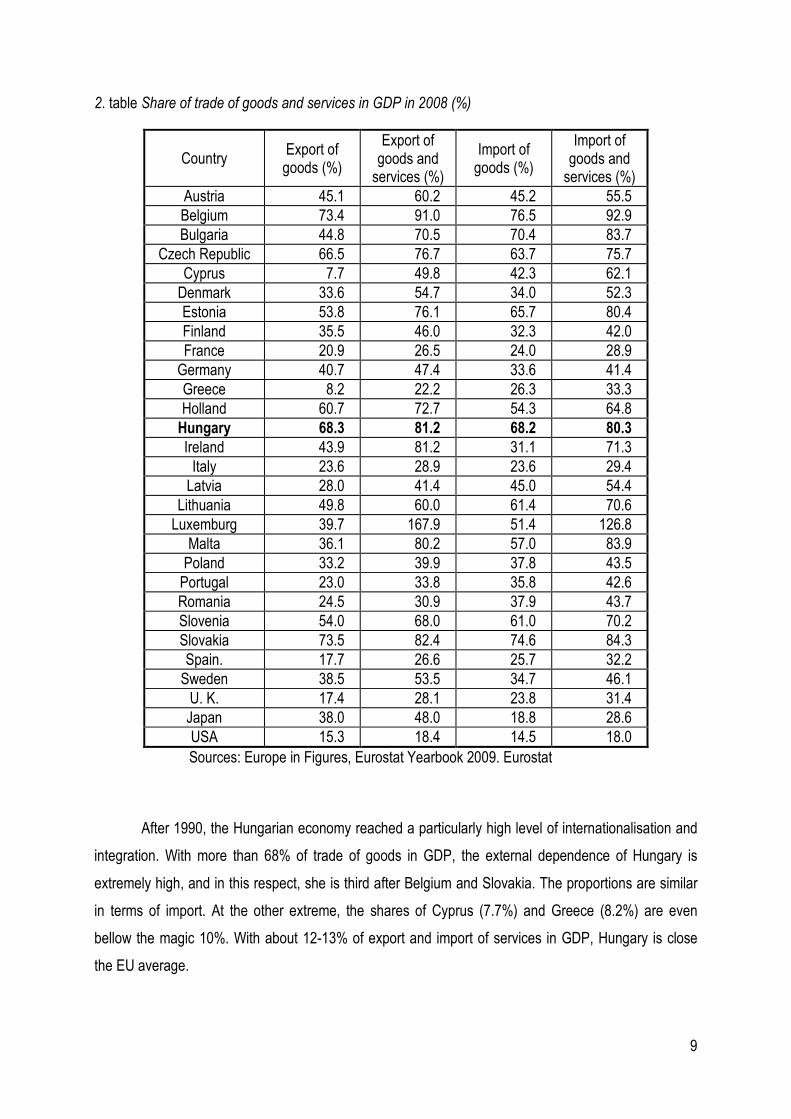
2. table Share of trade of goods and services in GDP in 2008 (%)
Country Export of goods (%)
Export of goods and
services (%)
Import of goods (%)
Import of goods and
services (%) Austria 45.1 60.2 45.2 55.5 Belgium 73.4 91.0 76.5 92.9 Bulgaria 44.8 70.5 70.4 83.7
Czech Republic 66.5 76.7 63.7 75.7 Cyprus 7.7 49.8 42.3 62.1
Denmark 33.6 54.7 34.0 52.3 Estonia 53.8 76.1 65.7 80.4 Finland 35.5 46.0 32.3 42.0 France 20.9 26.5 24.0 28.9
Germany 40.7 47.4 33.6 41.4 Greece 8.2 22.2 26.3 33.3 Holland 60.7 72.7 54.3 64.8
Hungary 68.3 81.2 68.2 80.3
Ireland 43.9 81.2 31.1 71.3 Italy 23.6 28.9 23.6 29.4
Latvia 28.0 41.4 45.0 54.4 Lithuania 49.8 60.0 61.4 70.6
Luxemburg 39.7 167.9 51.4 126.8 Malta 36.1 80.2 57.0 83.9
Poland 33.2 39.9 37.8 43.5 Portugal 23.0 33.8 35.8 42.6 Romania 24.5 30.9 37.9 43.7 Slovenia 54.0 68.0 61.0 70.2 Slovakia 73.5 82.4 74.6 84.3 Spain. 17.7 26.6 25.7 32.2
Sweden 38.5 53.5 34.7 46.1 U. K. 17.4 28.1 23.8 31.4 Japan 38.0 48.0 18.8 28.6 USA 15.3 18.4 14.5 18.0
Sources: Europe in Figures, Eurostat Yearbook 2009. Eurostat
After 1990, the Hungarian economy reached a particularly high level of internationalisation and
integration. With more than 68% of trade of goods in GDP, the external dependence of Hungary is
extremely high, and in this respect, she is third after Belgium and Slovakia. The proportions are similar
in terms of import. At the other extreme, the shares of Cyprus (7.7%) and Greece (8.2%) are even
bellow the magic 10%. With about 12-13% of export and import of services in GDP, Hungary is close
the EU average.
10
In spite of liberalization of movements of production factors, historically the integration
processes in the company sector was slow and contradictory in the first decade of EEC. The integration
concentrated to trade relations, while till early 1970s the capital fusions or joint enterprises were only
sporadic, and company relations were limited only loose production cooperation.
The structural crisis from early 1970s forced the companies to increased technological and
structural adjustment, and the improved efficiency and management became a requirement. On the
long run, the constraints for integration were strengthened, and the companies growingly exploited the
integration as a source of cutting costs and increasing efficiency.
From the 1970s, the growing internationalization (transnationalisation) of company sectors was
one of the most important developments of European integration. By the 1980s, as result of re-
arrangement of production and capital relations, the former one way character of transnationalisation
process (expansion of American companies into Western-Europe) changed, and it become growingly
global. The big European companies took also global strategies and expansion, and they were joined by
the Japanese, who also became actively participants of global and regional integration processes. It
was an important new development, that from the 1970s-1980s, the relative isolation of American
economy, among others due to rapidly growing European and Japanese investments came to end, and
the internal American economy have become part of global competition and cooperation, or put it
otherwise, that of global integration. The so called newly industrialised countries, particularly from Asia,
actively joined the global integration processes.
By the years of 2000s, the transnationalisation of European reached a high level, and the
European TNCs become active participants of global integration. The EU gives about 20% of world
production, but its role in globalization is much greater. “In our days, more than half of the transnational
companies of the world have European headquarters. One third of the largest firms of the world are
from the Union. The globalization of companies has two dimensions. On the one hand, they extend their
activities through expansion of their foreign investments, buying up companies or in form of green field
investments. On the other hand, they cooperate or merger with other transnational firms. These giant
companies have their own representation of interests (Round table of European Industrialists) and they
are able to influence the institutions of the EU. The European direct investments were boosted
particularly after 1992, due to creation of the European single market, the increased global competition,
and opening of the East-European markets.” (Zádor, 2001:115).

11
3. table Stock of FDI in GDP in 2007, relation of stock of exported and imported capital in the European
Union
Country Stock of imported FDI in GDP
Stock of exported FDI in GDP
Export in % of imported capital
Austria 24,1 22,7 95 Bulgaria 63,2 0,9 1,5 Czech Rep. 54,2 3,0 5,5 Estonia 72,7 20,7 28 Finland 30,3 42,7 140 France. 35,3 49,1 139 Germany 24,5 33,5 137 Greece 14,7 8,0 61 Holland 70,6 101,1 143 Hungary. 98,9 40,2 41
Ireland 68,1 53,6 82 Italy 15,1 19,4 128 Poland 34,7 4,5 12,9 Portugal 37,3 25,1 67 Romania 35,3 0,7 2 Slovenia 22,2 11,4 50 Spain. 34,0 39,4 116 Sweden 49,4 59,8 121 U. K. 44,9 57,2 140 EU27 17,7 23,2 131
USA 12,9 17,2 133 Japan 2,3 9,8 470
Sources: Eurostat Yearbook 2009. Eurostat. European Commission.
The intensity of integration can be measured by the flows of factors of productions, particularly
that of capital and labour. In fact, both the flow and the stock data are important. The capital export (Cx)
and capital import (Cm) refers to dynamics of integration, while the stock indices, which can be
expressed in GDP (Cx/GDPX100) and Cm/GDPX100), signal the intensity of integration in a given
moment.
The high shares of FDIs in the GDPs indicate the strong intensity of integration processes. At
the same time, it is striking that there are substantial differences among the EU member countries. This
signals differences in intensity of their integration, but other factors play also important role. It is obvious
that the size, structure and level of development of the country may substantially influence the
proportions, but such factors as geographical position, historical and cultural traditions and not at last
the social and political factors have to be taken into account. The proportions of FDIs to GDP as relation
12
to size and level of development of the country are in the band of 30-50%, but the EU average is only
around 20%. Some countries, like Hungary, Estonia, Ireland or Netherlands are characterised by
extremely high proportions, which may express the traditional capital exporter role (Netherlands), or the
high capacity for attraction of foreign direct investments (new members). The proportions of Greece,
Italy and Slovenia are deeply bellow average, but again the reasons behind are different. In case of
Greece, it refers to the low level of intensity of its integration, while in case of Slovenia the economic
policy factors are the explanations. It is also striking, that Japan intensively joined the
internationalisation-transnationalisation processes from the 1980s, but its capital flows kept its one-way
character.
The internationalisation process is characterised by strong capital interconnections. The mutual
investments, the export and import of capital are one of the main indicators of global integration, and its
positive balance
The relation of capital export to import (Cx/CmX100) is one of the important indicators of
interdependence and intensity of integration. It closely correlates with the level of development of the
region or the country. In a country, the share of foreign investments can be very high, and it can indicate
the intensive participation in global or regional integration. But if the country has no or minimal capital
export, then it is expression of one sided dependencies, and it signals the asymmetries of its integration.
The highly developed countries are characterized not only by high shares of foreign investments
in GDP, but also by their positive balances. In the majority of OECD countries the capital export exceeds
the capital import by roughly 30-40%. Besides substantial mutual capital turnover, the developed countries
of the EU are characterized also by net foreign capital investment positions. The dynamics of this change is
therefore, good indicator also the process of integration and level of development. In this respect, Spain
produced a remarkable development, in the last 15-20 years they have become important capital exporters.
Spain now is one of the main capital exporters to Latin-America, which indicates its global orientation. From
the old members only few are net capital importer, but their position may be substantially different. Ireland
has high intensity (FDI in GDP), while the balanced position of Austria is accompanied by a lower intensity.
The Greek and Portuguese positions are similar, but with very different intensities.
In the last few years, the capital export of the new members also started. Slovenia, Hungary
and Estonia are the pioneers in the process. It is remarkable development from points of view of their
integration. (The Hungarian data seem to be exaggerated, according the Hungarian statistics, the direct
capital export of the country in 2009 was around €15bn, which is only 20% of the registered capital
import.) In the other new members the capital export just started, and it signals the still existing
asymmetries of their integration. “The capital export is closely related to the level of development, and in
13
case of an expanding economy its increase is inevitable. At the same time, there is no rule, that to a
given level of development how large capital export is needed. Therefore, in an absolute way, it is
impossible to decide, that Hungary is ahead or behind to the “normal”. This is also influenced by level of
development of geographically near countries, and its capacity to attract capital.” (Világgazdaság, 2004.
június 30.)
1.3. Internationalisation – transnational company network
The global production and business form a complex system, in which besides the big TNCs the
cooperating and contracting SMEs, banks and other service companies play an important role. That is
why now days we must rather speak about transnational company structures or networks. “Today, the
globalization of production is organised in a large measure by MNCs. Their pre-eminence in world
output, trade, investment and technology transfer is unprecedented. Even when MNCS have a clear
national base, their interest is in global profitability above all. MNCs have grown from national firms to
global concerns using international investment to exploit their competitive advantages. Increasingly,
however, they are using joint ventures and strategic alliances to develop and exploit those advantages
and to share the costs of technological innovation. But the growing globalization of production is not
limited to MNC activity, for over the last decades there has been a significant growth in producer-driven
and buyer-driven global production and distribution networks. The globalization of business is thus no
longer confined to the MNCs but also embraces SMEs.” (Held, 2005: 282). As the development of the
last period shows, these networks have been growingly institutionalised and taken legal forms. „While
there has been a significant expansion of transnational production in the last three decades it has also
become more institutionalized as strategic alliances, subcontracting, joint ventures and other forms of
contractual arrangements regularize interfirm networks.” (Held, 2005: 274).
The emergence of transnational networks shows contradictory development in the EU. In most
countries, the big foreign companies built up complex cooperation networks with national small and medium
companies. These SMEs can be daughter companies, but often they are connected to one or more big
companies as contractual partners, service providers or suppliers. The other part of the SME sector claims
a transnational company status on its own rights. These SMEs comply with the requirement of a TNC
(minimum 25% of its activity is in more than one country), and they not only conduct foreign trade, but they
have foreign investments, they conclude production, research and service contracts with foreign partners,
and in their business strategies they follow the pattern of the large TNCs.

14
In our analysis, we consider the transnational networking one of the most important
characteristics and indicator of internationalisation and integration. It has particular importance from
points of view of balancedness and quality of integration. As the SMEs are organic parts of transnational
networks, their position and success greatly influence the development of integration processes.
The main deficit of European integration is that the internationalisation of SME sector in the EU
is far not satisfactory, and it is far bellow the potentials and the necessities. According to the
Observatory of European SMEs, only 8% of total EU27 SMEs are involved in export, only 12% of the
input of an average SME are purchased abroad and 5% of SMEs in the EU receive some income from
foreign business partnerships either from subsidiaries or joint ventures abroad.
The picture is more positive and encouraging in the developed countries of the EU. There are
many SMEs, which not only contract with big TNCs, but follow transnational company strategies, invest
abroad, and have direct and permanent foreign partners. According to a German surveys (Going
International 2007), the average German medium sized company has business relation with 16
countries. 72% of the questioned have partners in the new member countries, but this proportion is 63%
for Asia and 53% for North-America. (Világgazdaság, 28 November 2007, 6. o)
The internationalisation of SME sector is considered as a crucial factor both points of view of
increasing competitiveness of their own, and also for their country. “The SMEs are likely to benefit
disproportionately from pro-competitive effects of internationalisation: internationalisation provides the
SME with both growth and increased competitiveness, and is thus a fundamental engine for its long
term sustainability.” EU Commission, 2007: 17) In the EU the internal market and the euro can play a
role. “The internal market has the potential to be a main engine for SME growth. It can allow them to
face international competition better, both at home and abroad.” (ibid. 30)
In the new members and consequently in Hungary, the weakness of local supply to big foreign
investors is still generally characteristic. The foreign investors bring their traditional suppliers, and limit
their local activity mostly to assembling. For a local SME, it is very difficult to gain a supplier status. The
main reason is that difficult to meet the high technological and quality standards, but the insistence and
devotion to traditional partners also play a role. The local supply to foreign production is often minimal,
but it generally hardly exceeds the 20-30%. It is even rarer that a SME can gain exporter status,
supplying to a production base in abroad.
In Hungary, still there are only few SMEs, who venture for foreign business. In 2005, in case of
locally owned companies, their export was only 10% of their net turnover. In 2007, only 19,4% of export
revenues came from Hungarian SMEs. „Most of the Hungarian small firms, including many „gazelles”,
15
have no export, but many have to confront with the fact, that their domestic markets have been
tightened by import competition.” * (Papanek: 2010:359) The asymmetries of integration of new
members is reflected in the weaknesses of their participation in the transnational networks.
In many respects, Hungary is characterised by high intensity of its global and European
integration, but as far as the participation of its SME sector in integration processes is concerned, it is
seriously lagging behind. That is a serious distortion, and it reduces the quality of its integration. It
should be stressed also that even most of the “local” companies are parts (often suffering) of that
interdependence, as a part of their inputs comes from foreign TNCs, or they have to face foreign
competition often in direct ways (small shops contra chains of large supermarkets).
In the last 20 years, the Hungarian economy has become organic part of transnationalisation
processes. At the same time, this process is still largely one sided, and it only started to change. In this
respect, Hungary is somewhat before the other countries of the region. The process is accompanied by
the transnationalisation of local company structures (in Hungary, MOL and OTP Bank, Trigranit, Matáv
or Fornetti), but one can mention only few SMEs among them (Lipóti Pékség). The expansion of
Hungarian „transnationals” concentrates mostly to the neighbouring Central European countries. As it is
stressed by the Commission study on the issue relating to SMEs: “a pro-active attitude to global
competition and markets is increasingly becoming not a choice but matter of necessity.” (EU
Commission, 2007: 7).
1.4. Theories on Factors and Models of Internationalization of Company Sector
There are several factors, which influence the process and efficiency of internationalization,
when they invest abroad and decide about their operation or business strategies. While they follow,
usually, a general strategy and policy, when they turn to international markets, their attitude and finally
their success depend on different external and internal factors, both in micro- and macro-economic,
social and political circumstances.
1. Effects of technology and innovation. The innovation is one of the main factors of business
success on international market, and maximalisation (optimalisation) of company profits. According to
* In the international literature, „gazelles” are the rapidly growing small firms.
16
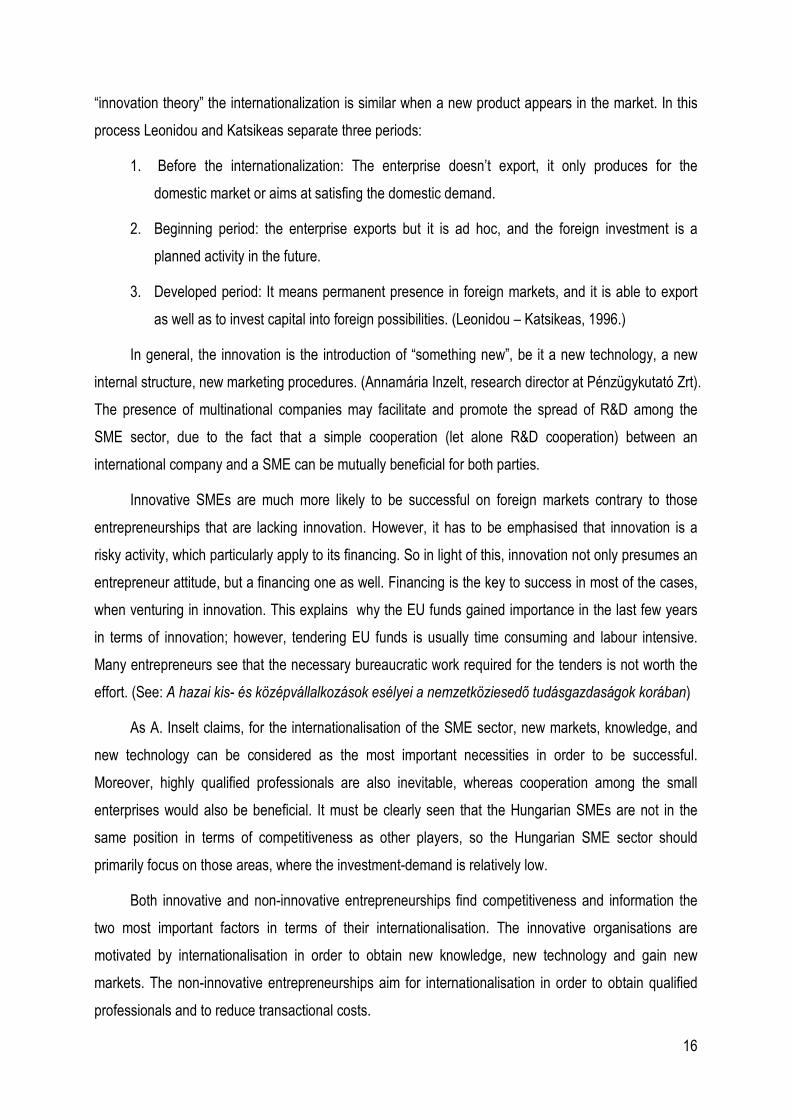
“innovation theory” the internationalization is similar when a new product appears in the market. In this
process Leonidou and Katsikeas separate three periods:
1. Before the internationalization: The enterprise doesn’t export, it only produces for the
domestic market or aims at satisfing the domestic demand.
2. Beginning period: the enterprise exports but it is ad hoc, and the foreign investment is a
planned activity in the future.
3. Developed period: It means permanent presence in foreign markets, and it is able to export
as well as to invest capital into foreign possibilities. (Leonidou – Katsikeas, 1996.)
In general, the innovation is the introduction of “something new”, be it a new technology, a new
internal structure, new marketing procedures. (Annamária Inzelt, research director at Pénzügykutató Zrt).
The presence of multinational companies may facilitate and promote the spread of R&D among the
SME sector, due to the fact that a simple cooperation (let alone R&D cooperation) between an
international company and a SME can be mutually beneficial for both parties.
Innovative SMEs are much more likely to be successful on foreign markets contrary to those
entrepreneurships that are lacking innovation. However, it has to be emphasised that innovation is a
risky activity, which particularly apply to its financing. So in light of this, innovation not only presumes an
entrepreneur attitude, but a financing one as well. Financing is the key to success in most of the cases,
when venturing in innovation. This explains why the EU funds gained importance in the last few years
in terms of innovation; however, tendering EU funds is usually time consuming and labour intensive.
Many entrepreneurs see that the necessary bureaucratic work required for the tenders is not worth the
effort. (See: A hazai kis- és középvállalkozások esélyei a nemzetköziesedı tudásgazdaságok korában)
As A. Inselt claims, for the internationalisation of the SME sector, new markets, knowledge, and
new technology can be considered as the most important necessities in order to be successful.
Moreover, highly qualified professionals are also inevitable, whereas cooperation among the small
enterprises would also be beneficial. It must be clearly seen that the Hungarian SMEs are not in the
same position in terms of competitiveness as other players, so the Hungarian SME sector should
primarily focus on those areas, where the investment-demand is relatively low.
Both innovative and non-innovative entrepreneurships find competitiveness and information the
two most important factors in terms of their internationalisation. The innovative organisations are
motivated by internationalisation in order to obtain new knowledge, new technology and gain new
markets. The non-innovative entrepreneurships aim for internationalisation in order to obtain qualified
professionals and to reduce transactional costs.

17
2.. “Psychical Distance”. According to “psychical distance” theories, the enterprise expanded
firstly in the neighbouring countries. It was particularly true to countries, where significant national
minority of the mother country of the enterprise lives (it can apply also before the evolution of the free
trade areas/zones or custom unions). It means that small and medium enterprises of a given country
want to expand, primarily to those countries which are very similar considering the cultural features
(Szerb – Márkus, 2008, p.43).
Of course, the internationalization is based primarily on economic factors and processes. These
macro and micro aspects cancel the idea of the size of enterprises and use the so called OLI-paradigm
by Dunning:
1. ownership advantages
2. locational advantages
3. internationalization advantages (Dunning, 1993).
Similarly to other countries, the Hungarian corporate sector is not homogeneous. The companies’
size, activity, aims, ownerships are very different; and firms have different motivations when they make
investments abroad. Based on the motivation of investment John Dunning distinguished four types of
foreign direct investments: 1) resource seeking investments, which are made in order to access to some
basic resource or input; 2) market seeking investments, which are made in order to access or enter to a
new market; 3) efficiency seeking investments with which companies can increase their efficiency
(generally with reducing their costs) and 4) strategic seeking investments, with which companies gain
competitive advantages against their competitors (Dunning. 1993).
3. The “Born Global”. The so called „Born Global” theory can show some similar features with
the previous ones. The “evolutionary learning” and “innovation theory” may interconnect, because the
evolution periods can be jumped over as the companies appear in the international market already at
their foundation (Sass, 2010, p.12). As result, building up strategies for domestic and external markets
overlap, and usually they have their own crucial innovation capacity to be able to participate and be
successful in the process of internationalization during (very) short time. They generally work in the
high-tech sector or in the pharmaceutical industry (Morgan – Thomas, Jones, 2009).
4. The Uppsala-model. According to this theory (basis of Johanson–Vahlne, 1977) the firms
internationalise slowly in different steps and the most important feature of the model is the path

18
dependency. The first step is to export to overseas market(s) through independent channels (e.g. sales
agents). In the second step companies establish sales outlet in overseas market(s) (by acquiring local
firm or by setting up new facility). The third step is to license foreign manufacturer to produce for
overseas market(s). In the fourth step firms establish production facility overseas by acquiring local firm
or by setting up new facility. To set up a new facility is more risky and more expensive. According to this
approach the reasons of internationalisation can be divided in two groups: domestic push factors as e.g.
openness, not sufficient (not large) size of country and international pull factors as e.g. huge and open
foreign markets. This theory was born and was popular in the 1970s, the mentioned authors examined
the internationalisation of Swedish companies. Their main conclusion was, that the internationalisation
of companies is slow; and happens in little steps. The theory could be criticized from several viewpoints;
for example the order of steps can be reversed or one/few step/steps can be skipped. Moreover, the
model examined primarily the internationalisation of Swedish companies and in the 1970, when getting
suitable information from foreign markets was more difficult, problematic, time-consuming and risky than
nowadays.
Generally, in the case of several Hungarian enterprises we can observe the steps of the
Uppsala theory. The first step of internationalisation is to open sales agencies abroad (in most cases
this already have happened in the 1970s and 1980s). This facilitates to gather information about the
foreign market and makes to realise market expectation easier. The next step is to establish commercial,
then production facilities. The pharmaceutical factories, companies are good examples to the Uppsala
theory (Antalóczy-Éltetı, 2002)

19
2. State of internationalization European SMEs by the early 2000s
The European Commission published a report in 2010, which goal was to provide an updated and
comprehensive overview of the level of internationalisation of European SMEs and derive conclusions
and recommendations from it. According to the Commission internationalisation means not only exports
or foreign direct investments but all activities that put small and medium size enterprises into a
meaningful business relationship with a foreign partner. So it refers to exports, imports, foreign direct
investments, international subcontracting and international technical co-operation as well. The data,
conclusions and recommendations are based on a survey of 9480 SMEs in 33* European countries
during Spring 2009 (European Commission, 2010).
2.1. The European situation generally
The report states that a considerable number of European SMEs are internationalised, but
generally their international activities realise in the Internal Market. So partner markets are mostly other
EU countries, but in the field of import, China’s role is very important. The European SMEs are more
internationalised than Japanese or American companies (which are not surprising, because of the
relevant role of Internal Market). Moreover, the two most common modes of internationalisation are
exports and imports. For example, within the EU 27, 25% of SMEs export, of which about 50% goes
beyond the Internal Market. Similarly, within the EU27, 29% of SMEs import, of which 50% originate
from countries outside the Internal Market. In addition, 7% of member states’ SMEs are involved in
technological co-operation with a foreign partner, 7% are a subcontractor, 7% have foreign
subcontractor and 2% are active in foreign direct investment. The Commission claimed that there is a
direct link between the level of internationalisation and the size of company, so a larger company tends
more to internationalise. For example, in terms of exports, 24% of micro, 38% of small and 53% of
medium-sized SMEs are active on foreign markets (for imports these percentages are 28-39-55).
Moreover, there is a correlation between the size of country and internationalisation: generally, the
* The survey examined the 27 member states of EU and 6 non-EU countries: Croatia, Iceland, Liechtenstein, the Former Yugoslav Republic of Macedonia, Norway and Turkey.

20
smaller countries’ SMEs are more internationalised. Furthermore, trade, manufacturing, transport,
communication and research are the most internationalised sectors; exporting and importing activities
augment in intensity by the age of companies (e.g. every third company exports that have existed for 25
years or more). In addition, most often SMEs start international activities by importing, and if SMEs both
import and export, they start with import twice as often as starting with export (39% vs. 18%). 42% of
enterprises started with imports and exports in the same year. Unfortunately, only a few - about 4% - of
all internationally inactive SMEs plan to start international activities in the near future. But it is a
considerable progress that companies involved in e-commerce are more internationally active; the use
of Internet erased some barriers for internationalisation. But some serious barriers can be observed.
According to SMEs the most important internal barriers are: price of their own product or service and the
high cost of internationalisation. The most important external barriers are: lack of capital, lack of
adequate information, lack of adequate public support and the costs of or difficulties with paperwork
associated with transport. Moreover, the awareness of public support programmes among SMEs is low
and also use of public support is rather limited (financial support is used more by the larger SMEs while
non-financial support by the smaller ones) (European Commission, 2010]).
2.2. The results of the Commission Report
The European Commission supports the internationalisation of SMEs because being
internationally active has lots of advantages: these companies reach higher turnover growth, have
higher growth of employment (the partners enjoy the same higher growth) and they are also more active
with process innovations. The Commission’s most important recommendations for SME Policy Support
are: 1) awareness and use of public support programmes need to be promoted much more actively, 2)
easier access to support measures for micro enterprises, 3) because of the link between innovation and
internationalisation, it is useful to design and present policy support measures aimed at stimulating
innovation and internationalisation in conjunction. 4) Not only focus on export, because import is also an
important activity for SMEs, this is a stepping stone to broader internationalisation. 5) Foster e-
commerce, because it may increase internationalisation and can erase the barriers. Finally, 6) lack of
information is an important barrier for internationalisation and might be due to a market failure. So it is
important at EU level to collect and analyse information on foreign markets. The study shows that in
Hungary 5% of the internationally active SMEs use financial public support. With this, Hungary standed
at 12th place of 33 in 2009. There are six countries where this percentage is above than 10% (Austria

21
where 47% of internationally active SMEs use financial public support, the next is Turkey – 32%,
Greece and Latvia – 17%, Germany and Norway – 14%). In Hungary, the use of non financial public
support is not relevant (European Commission, 2010).
The survey states that lots of European SMEs do not export at all; only 8% of these companies
were involved in exports in 2005. Generally, small and open economies’ enterprises have a much higher
involvement in exports. This is true in case of Hungary: 9% of companies have some turnover from
exports, this is little higher than the average in the European Union – 8%. But other small and open
economies’ enterprises have higher proportion. (The first is Estonia with 23%; moreover, our
neighboring countries such as Slovenia, Austria and Slovakia also have much higher proportions: 21%,
14% and 12% of enterprises have revenue from exports). If we examine the exports’ share in the
revenues, Hungary does not perform well, only 3,3% of incomes derive from exports (only a few
countries have lower proportion. The average of EU 25 and EU27 is 4,6%, EU15 is 4,4% and NMS10
and 12 are 5,3 and 5,1%). It can be considered positive that the Hungarian expectations in this field are
optimistic, most of the asked SMEs assume that their exports’ share in their income will increase in the
future (The Gallup Organization [2007]). There are lots of SMEs in Hungary (99,9% of companies are
SMEs), but their share of total exports was only 37% in 2008 (the micro and small enterprises’ share is
23%, medium sized companies’: 14%, big companies’: 63%). So we can state that it is necessary to
increase the role of SMEs in the field of export. At the same time, it is encouraging, that we can observe
a progress in this dcirection: in the last years the Hungarian SMEs developed a lot and converged to the
general level European SMEs (Kállay et al. 2008 and 2010).

22
3. Characteristics of Internationalization of the Hungarian SME sector
3.1. Trends in internationalisation of Hungarian SME sector
Recently, the importance of internationalization of company sector was more and more
recognised both as factor of improving competitiveness and success of integration by the experts and
the economic politicians as well. In the last years, in Hungary several studies were published on the
issue.
László Szerb and Gábor Márkus published one of the most detailed reports about the topic in
2008. They examined not only the export activity, but they also analyzed the foreign capital and the
property relations as well. Additionally, they surveyed the domestic activity of the firms with foreign
property and they tested a hypothesis about the significance of relation between the knowledge of
foreign language and the foreign trade activity.
László Kállay and Imre Lengyel showed in a detailed report that the two most important indicators
of the internationalization of SME sector were the export activity and the foreign direct investments
(Kállay – Lengyel, 2008, p.55 - 66.).
In a conference summary, Ildikó Neumanné Virág’s made some conclusions about the export
activity of Hungarian SMEs. According to her paper from the investigated fifty companies with significant
export ratio in revenues, 20 ones could realize 90 % of their revenues from export.
In sectoral breakdown, 25 % of the export revenues of SMEs came from the manufacturing
industry. About 30 % export revenues were realized at the firms with small value-added products or
which were involved only in trade. And finally 55 % of the export revenues originated from companies
producing chemical products or machines. (Neumanné, 2008, p. 412).
The importance of relation between openness and internationalisation should be particularly
stressed. “At macro-economic level, the internationalization can be indicated with the openness of a
country”. (Szerb – László, 2008, p. 37). Hungary is a classical small export-orientated country (Kállay –
Lengyel, 2008, p. 55). According the intensity of her trade and capital integration with the world
economy, she is one of the most internationalised economies in the world. The similar high level of
openness and integration characterises the other countries in the Central-European region.
23
After 1990, the economic openness of Hungary has greatly increased as result of rapid expansion
of volume of her external trade. Before 1989 the Hungarian external trade was about 70 % of the GDP.
Since then, this had been increasing and hit the maximum around 150% of GDP in 2001. This period
was separated into two parts by Kállay and Lengyel: the first one is the “early period of evolution of the
market economy” and the second is the “developed period” (Kállay – Lengyel, 2008, p.55).
We should call attention to the fact, that the Hungarian capital export is one of the most significant
FDI considering the capital export from the new EU members. After the enlargement in 2004 the volume
of Hungarian capital export rose by 281 %, so Budapest is the first in this comparison (Szerb – Márkus,
2008, p. 38). As it is pointed out by László Kállay and Imre Lengyel: the Hungarian (and generally the
Central-European) situation, due to EU membership is very special, because Budapest (and the others)
had to adapt itself (themselves) to the new conditions and to step into a new, more intensive
competition. “The internationalization of the SMEs evolved with internationalization of their domestic
business environment.” (Meyer – Skak, 2002, p. 180).
László Szerb and Gábor Márkus research tried to make observation on which theories apply
better at the investigated questions. Their survey includes answers of 502 enterprises. It is stratified and
representative and covers the Hungarian situation from the period between 2003 and 2006 (it overlaps
the years accession to EU).
According to he survey of László Szerb and Gábor Márkus, the Hungarian SME sector face several
problems:
1. Just 39,6 % of the analyzed enterprises had foreign relations and only 15,4 % could create
export and import relations in parallel.
2. In these relations the EU-members have dominant positions; the ratio of EU was 87 %. These
data could prop up the „evolutionary theory” better than the „network one”.
3. The structure of the incomes was investigated, particularly how much of them were from
export revenues. The export revenues could be realised mostly by those enterprises, whose
export revenues was more than 10 % of their whole incomes.
4. According the survey, just 4 % of the companies had more than 75 % of their total income
from export. This value is still bigger than in the case of those companies which had 10-24 %
or 50-74% export revenue from their total income; all of these companies represent only a
dozen from the total 502. If we consider the geographical shares the network theory is the
dominant, while Germany’s role is much stronger than Austria’s, Slovakia’s or Romania’s.

24
5. The foreign ownership was higher in the medium enterprises (20 %) and in the lower in the
small ones (11 %).
6. The summary classification of these SMEs distinguished according to export revenues seems
particularly interesting: 86,6 % of the asked companies does not have any export revenues,
11,6 % of them are in (at least) one domestic alliance with foreign partners and only 1,8 % of
the enterprises participates in international cooperation (it means just 9 firms) (Szerb –
Márkus, 2008, p.52).
7. Finally the authors looked for some correlation between the existing of foreign relations and
language knowledge. According to their results in the case of those managers who engaged
in import too, can speak a foreign language by 20 % more than who buys inputs only from the
domestic market. (Szerb – Márkus, 2008, p.55)
The insufficiencies of the language knowledge were also strengthened by GKI (Institute of
Economic Research). According to it, the Hungarian SMEs don’t value it as much as it should be
necessary, particularly in comparison with similar data from other developed - first of all OECD –
countries. Worse result can be found only in Japan and Spain (Dr. Papanek, 2009, p.46).
3.2. Role of property relations and size of enterprises in the internationalization
The research by Szerb – Márkus focus on function between property relations and
internationalisation. Their conclusion was that: the internationalization of property relations is more
significant than the internationalization in terms of export. An explanation can be that there are some
SMEs with foreign background and they produce exclusively on the domestic (Hungarian) market.
(Szerb – Márkus, 2008, p. 39).
In contrast, Kállay – Lengyel authors brought the size of enterprises into focus. They concluded
that the size of enterprises had primary role considering the level of the internationalization (Kállay –
Lengyel, 2008, p.55). The export ratio of SMEs in the analyzed 19 European countries was 13% and in
Hungary 9,9%. In the case of companies with more than 250 employees, the export ratio is about 21 %
(it is more by 8 % points than at the SMEs) while this ratio in Hungary is 32 % (the difference is 20,1 %
points!) (Kállay – Lengyel, 2008, p.64).

25
László Szerb and Gábor Márkus got similar results. They examined data of the year 2003 and
they received that 39,6 % of the SMEs could realize export revenue. But at the same time, these are
less than 15 % of total net revenue of SME sector.
A survey from 2006 made by GEM (Global Entrepreneurship Monitor), with 500 SMEs which have
one employee at least [by the Hungarian law micro firms are the ones employing less than 10 people
(i.e. 0-9)]. came to similar results. Only 23 % of the asked companies exported and the value of their
export exceeded the half of the whole revenues only at 6 % of the companies. In the meantime 32 % of
the firms imported and around 40 % of them had external relations. (Dr. Papanek (edit.), 2009, p.43).
It is interesting to note that the export revenue decreased on all level – level of the micro, small
and medium enterprises between 2005 and 2007. The value of the decrease was 14 % at the small
enterprises and a bit less and 11,2 % at the medium ones. These bad data were produced by the
Hungarian firms when there was prosperity in the world economy. Only the big companies could
increase their export incomes by 3,7 %. In sectoral terms, the process was also unfavourable: the value
of the export of manufacturing industry fell down by 30 % between 2004 and 2007 (it was an 8 % points
decrease) while the export of commercial services rose by 17 % (a 4 % points increase) (Dr. Papanek
(edit.), 2009, p.44).The size of companies was emphatic in Neumanné’s survey too. According to her
“the export of enterprises and their export intensity (export/income) goes up with their own number”
(Neumanné, 2008, p. 413). We can complete this statement with those companies with at least 50 %
public property exports least and ones with at least 50 % foreign property exports the most (Incze,
2008.)
According to geographical proportions, the least export orientated SMEs are located in the
Southern-Transdanube Region and in the regions of Plain (Alföld). And it isn’t a surprising that the most
export orientated firms are situated in the Western-Danube and the Central – Hungarian Region
(Budapest and Pest County). The micro and the big companies in Central-Hungarian Region can realize
the largest revenues from export and the medium and big ones in the Western-Danube Region are the
most export orientated (Neumanné, 2008, p. 413).
If we analyze the sales in terms of market share, in 2003 we can see that the size of firms is very
important. The medium enterprises can sell just 20% of their goods and services in export markets. But
this number is much less concerning the small enterprises (the ratio is just 6,8 %), while there aren’t any
similar data concerning the micro enterprises (in practice, this value is about 1,5). The Kállay – Lengyel
paper emphasizes, the bigger companies intend to export more (Kállay – Lengyel, 2008, p. 67-68).

26
Kállay – Lengyel calls attention to the importance of the effects of FDI on the internationalization
of SMEs. According to their report, the foreign interest of enterprises increases in direct proportion to
their size. Only 28 % of the small firms had foreign interests, while at the medium enterprises which
employ 50-249 persons, this value is 49,1 % and it is 52,9 % in the case of big (non-SME) companies.
In addition, there is a very strong relation between the export-orientation and the foreign ownership.
This correlation is even more striking if we take that in Hungary the foreign-owned small enterprises can
export more than the big (non-SME) enterprises with Hungarian ownership (Kállay – Lengyel, 2008, p.
71-72).
3.3. Motivation and Destination of Trade and Investments
The comparisons of the research by Szerb – Márkus, Kállay – Lengyel etc. with that of Katalin
Antalóczy and Andrea Éltetı bring interesting results. In the beginning of 2000 they made a research to
analyse the Hungarian companies’ motivation, problems which invested money in abroad, how they did
it and with what effects. (They also examined Estonian, Czech and Slovenian companies and they
compared the results.) Because of lack of data, in order to better understand the investors’ behaviour,
the survey was based on questionnaire. One weakness of the sample is that among the asked 57 firms,
only 22 have sent back the questionnaire and even these were incomplete. They did not answer some
questions. Moreover, the sample was mostly based on old big companies, which are represented in the
manufacturing industry, had foreign ownerships and had shares on stock exchange. (But these
companies invested abroad mostly, so the sample can be considered representative.) (Antalóczy-Éltetı,
2002).
82% of the asked Hungarian companies said that the main reason of his foreign direct investment
was to gain and enter into a new market. At the same time, the motivation for reducing costs as a
strategic goal; was not considered relevant. (The results are similar to what surveys has found in the
case of inflow foreign direct investments, namely why foreigners invest in Hungary.) Moreover,
according to the survey, in the 1990s the stronger competition also motivated the Hungarian companies
to make more foreign direct investments. The motivation to gain new markets had the desired result: the
export and market share of companies increased and the firms’ financial performance improved (this
result was surprising because foreign direct investments are very costly in the beginning). The impact of
foreign direct investments on employment and import were not relevant. Furthermore, the Hungarian
companies were able to obtain cheap resources also (Antalóczy-Éltetı, 2002).

27
The companies’ risks of foreign direct investments can be various. We can distinguish company
and country specific risks. Antalóczy and Éltetı divided the risks of investments into five groups in their
questionnaire: financing, lack of financial resources, lack of suitable workforce, lack of information and
country specific risks. According to the survey the problems of the internationalisation are: problems
with the target country, lack of financial sources and lack of suitable workforce. 63,6% of Hungarian
companies said that the most important risks were in connection with the target country (its country risk,
investment climate). This is not surprising because most of the subsidiaries have been established in
Eastern Europe (mostly in Ukraine and Romania), where market economy is less stable than in Central
or Western Europe. The second, but less considerable problem is financing (according to 41% of
companies). In the case of smaller companies, however, this is bigger, more important problem. 36,3%
of respondents said that the lack of suitable workforce is an important or very important problem of
internationalisation. The domestic factors (as administrative obstacles and regulation) and the lack of
information were considered less important problems. According to the asked enterprises the economic
policy, which helps the Hungarian enterprises to acquire foreign markets, to get information, tax
allowances or supported by bank credits are very important. The government should give political
support, guarantee and power of lobby and even help to sustain the foreign offices abroad. The
decrease of bureaucracy and the economic treaties among countries can better facilitate the possibility
of the foreign investment (Antalóczy – Éltetı, 2002).
A study received similar results in 2002 who investigated the possibilities of international
expansion of a Hungarian small enterprise (the Turris Babel Ltd, which is in the interpreter and
translation services) (Bognár). During the survey the Turris Babel Ltd. used the data from the
Association of Hungarian Translation Bureaus and of Romanian Translation Bureaus and two interviews
were made with one of the heads of enterprise and the head and founder of the other firm. Additionally
as a potential client he asked some bids in letter from 15 local translation bureaus and bigger
international ones in Hungary and Romania too. His analysis could show that Turris Babel Kft was
motivated by the market acquiring and a stronger presence in the East-Central European Region to
expand in Romania. On the other hand decrease of the costs and some competition advantages were
also important. But to tell the truth the size of the Romanian market was the main motivation of the
company. Furthermore they could receive information easier about the foreign market, the special
features of the business environment due to common culture, the closeness of market and perhaps the
known language. Significant factor was the human relation capital and some bigger projects appeared
in the markets. The main obstacle of the internationalization was the capital deficit (heads of the smaller
enterprises prefer the domestic markets). Moreover many companies have bad strategies, so the

28
Hungarian firms (we mean translation bureaus) concentrate the Hungarian market and prefer the
smaller, domestic contracts.
In the case of Hungary (similarly to other member states) the main export destination of
enterprises in the European Union is Germany. According to the study of the Commission Hungary’s
main destination of exports is the European Union (68% of exports is realised within EU). This
proportion is close to the EU average. Hungary keeps close commercial contacts with European non-
EU countries (e.g. with countries of Former Yugoslavia). 25% of Hungarian export goes to Europe
outside of EU. This value is high, just Slovenia has higher proportion: 51%, which is not surprising
because of his traditional relationship with the countries of Former Yugoslavia. At the same time, the
proportion of exports to outside Europe is not significant (8% of total exports), this does not reach
neither the average of the European Union, nor the average of the new member states (e.g. in case of
Poland and Czech Republic this proportions are 22 and 30%). According to Hungarian SMEs the main
constraints to exporting are: lack of capital, regulation in non-EU countries and different regulations in
other EU countries. Differently from other member states lack of knowledge of foreign markets is not
considered as a relevant constraint. On the other hand, the companies feel the lack of capital as the
biggest constraint: every fifth enterprises say that this is the most important problem of exporting. This
problem is not unique, in most of the new member states feel the same way (e.g. in Czech Republic,
Lithuania and also in Austria, Belgium and Ireland) (The Gallup Organization, 2007).
SMEs do not sell only their product abroad, but also buy inputs (raw materials, energy, capital
and labour) from the global market. So it is important to examine the percentage of inputs purchased
abroad. In EU average, it is 12% of the total inputs of SMEs. This percentage is the highest in the
smallest and most open economies in Europe, e.g. in Malta (46%), Luxembourg (40%) or Ireland (35%).
In Poland and Slovakia this proportion is 14%. In case of Hungary this is 12%, which is the average of
the European Union and the new member states.
One of main the shortcomings of the Hungarian SMEs is in relation to their foreign business
partnerships. Overall, 5% of SMEs in the EU receive income from foreign business partnerships, either
from subsidiaries or joint ventures abroad. In case of Hungary the proportion of enterprises gaining any
revenue from foreign subsidiary or joint venture abroad is only 0,2%. This is lower just in Bulgaria
(0,1%). Hungarian SMEs should invest in foreign subsidiaries or joint ventures because it has lots of
advantages (e.g. they can get closer to final costumers, can easily adapt the changes of costumers’
expectations, can access to finance or can reduce the labour/administrative costs). With these the
companies can easily increase their competitiveness.) (The Gallup Organization, 2007).
In sum we can state that the Hungarian SMEs made significant progress in the field of
internationalisation: the proportions of foreign exports and imports reach the average of the EU; they

29
diversify the export relations, but most of the exports is realised in the area of the European Union. It is
important to progress in the field of foreign business partnerships, and it is necessary to decrease the
role of the main constraints to exporting, mostly the lack of capital.
3.4. Performance of Hungarian SME sector between 2000 and 2009 (in numbers)
Although some features of market economy were already created during the last decade of the
planned economy, the true characteristics of SME sector in Hungary only emerged and became clearly
visible after the economic transition of the country. The transition process had many effects on the
country’s economy, including the infant SME sector: the shift of economic activity, the radical
modification of the ownership proportions, the alteration of the traditional external economic relations,
and the slow but steady shrink of the intervention of the state. Although the most important
characteristics of the Hungarian economy – including the SME sector – have already evolved, the traits
are not static and constant but rather altering. In order to understand and grasp the essence of the
current state of the Hungarian sector, the most important figures regarding the SME sector will be
demonstrated by primarily relying on researcher Zoltán Pitti’s current analysis (“A gazdasági
teljesítmények vállalkozási méretfüggı jellemzıi Magyarországon, Köz-Gazdaság 2011 október”). The
following paragraphs show the most important characteristics of the Hungarian economy and SME
sector, namely the number of companies, the distribution of enterprises regarding their ownership
proportions, size, average number of employees, and added value.
One of the most crucial statistics regarding a country’s economy is the number of enterprises and
companies. Regarding the enterprises, the following table gives a broad overview of the type of
economic activities, and institutional forms in Hungary:

30
4. table The number of enterprises (unit: number of companies)
2000 2002 2004 2006 2008 2009
Private entrepreneur* 682925 708513 717323 670203 1000022 1012770 Ltd. 167033 182242 209720 238411 292165 319849
Limited partnership 188136 208454 219023 221152 211823 202173 Co-op 7516 6768 6532 5860 5245 4365
Corporation, CLP. 4372 4425 4357 4373 4828 5020 State owned company 4917 2039 652 388 275 241
Other 39547 39780 41021 43566 46088 48173 Registered enterprises altogether 1094446 1152221 1198628 1183953 156446 1592591
Source: Pitti (2011) Köz-Gazdaság, Vol. 6., No. 3.
In order to obtain a valid analysis of the achievements of the SME-sector in Hungary one has to
take a closer look at the companies of the country and differentiate between companies with and
without economic activity. The number of registered, de facto functioning, and continually functioning
companies in Hungary is as follows:
5. table Structure of the Hungarian companies regarding its functioning (Unit: number of companies)
2000 2002 2004 2006 2007 2008 2009
Statistically registered companies 411 521 443 708 481 306 497 942 531 109 561 424 579 821 Statistically de facto functioning
companies 308 642 325 344 341 439 346 401 351 853 368 472 382 482
Companies possessing formal accounting
288 778
303 729
315 898
330 105
337 933
357 094
353 649
Continually functioning companies 232 478 253 420 261 663 281 295 294 150 308 299 310 389
Source: Pitti (2011) Köz-Gazdaság, Vol. 6., No. 3.
The numbers – that are also validated by the Hungarian Central Statistical Office’s official
presentation (“The SME sector in the jungle of statistics”) – demonstrate that not only the aggregate
number of SME-s but also the number of continually functioning enterprises is steadily growing in
Hungary. However, one also has to note that the ratio of continually functioning enterprises and
statistically registered companies was only 54% in 2009 that implies that roughly only halve of the
statistically registered enterprises are actually and continually functioning.
Furthermore, an important aspect of the SME sector is the proportion of propriety. In this regard,
Hungary’s economy went through crucial changes since the country opened its economy and aimed
* There was a methodological change between 2006 and 2008.

31
(and is still aiming) at attracting foreign investment into the county. Although FDI and portfolio
investments have been essential in economic terms in the last two decades, statistics demonstrate that
foreign property is still not that much significant regarding the country’s SME sector.
6. tableThe distribution of ownership regarding the de facto functioning and continuously functioning
enterprises (Unit: percentage)
2000 2002 2004 2006 2007 2008 2009
Exclusively Hungarian property 91.3 90.6 91.2 91.4 92.0 92.1 92.3 Mixed (Hungarian majority shareholding) 2.7 2.9 2.1 1.8 1.0 1.0 0.9
Mixed (foreign majority shareholding) 1.2 1.3 1.4 1.3 1.2 1.1 1.0 Exclusively foreign property 4.8 5.2 5.4 5.5 5.8 5.8 5.8
Altogether 100.0 100.0 100.0 100.0 100.0 100.0 100.0
Source: Pitti (2011) Köz-Gazdaság, Vol. 6., No. 3.
It is interesting to note that despite the constant growth of the aggregate number of enterprises,
the ratio of foreign property did not increase in the last few years that may be primarily due to the
general detrimental effects of the global economic crisis. This fact may not come as a surprise since the
FDI inflow shows a similar trend.
Apart from the number of companies and the distribution of their ownership it may be also worth
to analyze the size of the de facto and continually functioning companies. Regarding the Hungarian
(and the European Union’s) legal regulation only those companies can be regarded as “micro” sized
organizations that employ a maximum of 9 people, small enterprises are those that employ a maximum
of 49 people. Middle sized enterprises have maximally 249 employees, while big enterprises are those
that employ 250 employees or more. (The SME sector consists of the micro, small, and medium size
enterprises.)
7. table Distribution of the de facto and continuously functioning enterprises regards size
(Unit: percentage)
2000 2002 2004 2006 2007 2008 2009
Micro enterprises 87.8 88.6 88.5 88.4 88.3 88.7 88.9 Small enterprises 8.1 7.8 8.2 8.2 8.1 7.7 7.4
Medium size enterprises 1.8 1.5 1.5 1.5 1.5 1.4 1.3 Other
From other: big enterprises 2.3 0.4
2.1 0.4
1.8 0.3
1.9 0.3
2.1 0.3
2.2 0.2
2.3 0.2
Altogether 100.0 100.0 100,0 100.0 100.0 100.0 100.0
Source: Pitti (2011) Köz-Gazdaság, Vol. 6., No. 3.

32
As for the latest figures and the overall trend, one can easily draw the conclusion that the vast majority
of companies are the micro sized companies – their proportion even reach 99% of the total
entrepreneurships, according to Szabó (2010). The large companies do not even reach one percent
regarding the total distribution of the companies and their small proportion is even declining, while the
proportion of the micro sized companies does change neither.
The depicted picture is basically identical with the analysis of the Statistical Office. As for an official
presentation of the Office, the proportion of the Hungarian de facto functioning entrepreneur sector is as
follows:
1. chart Proportion of the Hungarian de facto functioning enterprises
Source: A KKV-k a statisztika rengetegében (Kotulics)
The chart of the Statistical Office demonstrates that the big and medium sized enterprises did not reach
1% regarding the distribution of the enterprises in 2008, while the distribution of the micro sized
enterprises is overwhelming, so this picture depicted by the Statistical Office is even more extreme then
the research of Pitti suggests. Yet keeping these figures in mind it is interesting to see the various
employment figures of the companies.

33
8. table Distribution of employees regarding proprietary proportions (Unit: percentage)
2000 2002 2004 2006 2007 2008 2009
Exclusively Hungarian property 73.3 74.4 76.0 76.4 75.4 74.4 75.7 Mixed (Hungarian majority
shareholding) 4.4 3.9 3.5 3.0 2.8 2.8 2.5
Mixed (foreign majority shareholding) 7.2 7.3 6.1 5.5 5.4 6.0 5.3 Exclusively foreign property 15.1 14.4 14.4 15.2 16.4 16.8 16.5
Total employees 100.0 100.0 100.0 100.0 100.0 100.0 100.0
Source: Pitti (2011) Köz-Gazdaság, Vol. 6., No. 3.
9. table Distribution of employees regarding the size of the entrepreneurship (Unit: percentage)
2000 2002 2004 2006 2007 2008 2009
Micro enterprises 21.6 22.1 22.2 21.0 23.1 23.7 24.3 Small enterprises 18.8 19.2 19.7 20.0 22.0 22.3 22.7
Medium size enterprises 19.5 19.4 18.9 18.2 20.5 20.4 20.6 Other
From other: big enterprises 38.1 37.5
36.6 36.2
35.5 35.0
34.4 34.1
34.3 33.3
33.7 31.9
32.4 30.2
Total employees 100.0 100.0 100.0 100.0 100.0 100.0 100.0
Source: Pitti (2011) Köz-Gazdaság, Vol. 6., No. 3.
The data from the two tables leads to the conclusion that although only 5.8% of the enterprises in
Hungary in 2009 had foreign ownership, these foreign owned enterprises employed 16.5% of the total
employees. This proportion is similar in terms of the size of the enterprises: while the proportion of big
enterprises was only 0.2% (!) in Hungary in 2009, they employed 30.2% of the total employees. The
bottom line of these figures is that although the number of foreign owned companies and the big
enterprises can be perceived as relatively low in Hungary, this observation is not valid regarding their
employment due to the fact that these enterprises/companies employ significantly more employees than
their size would suggest. The same logic applies for the micro sized companies and the exclusively
Hungarian owned entrepreneurships: while in 2009 92.3% of the entrepreneurships were in exclusive
Hungarian property, these only accounted for 75.7% of the total number of employees (more than 2
million employees – according to Szabó (2010)), and the micro sized enterprises (that possess a
proportion of 88.9%) only employed 24.3% of the total employees. Apart from these figures it is also to
be clearly seen that the Hungarian SME sector (micro, small, and medium sized enterprises altogether)
employs around 68% of the total employees.
According to the data provided by the Hungarian Statistical Office for 2008, 73% of the total employees
working in enterprises were employed by the SME-sector while the big enterprises engaged 27% of the
employees in 2008. These figures basically correspond with the former ones and show that although the
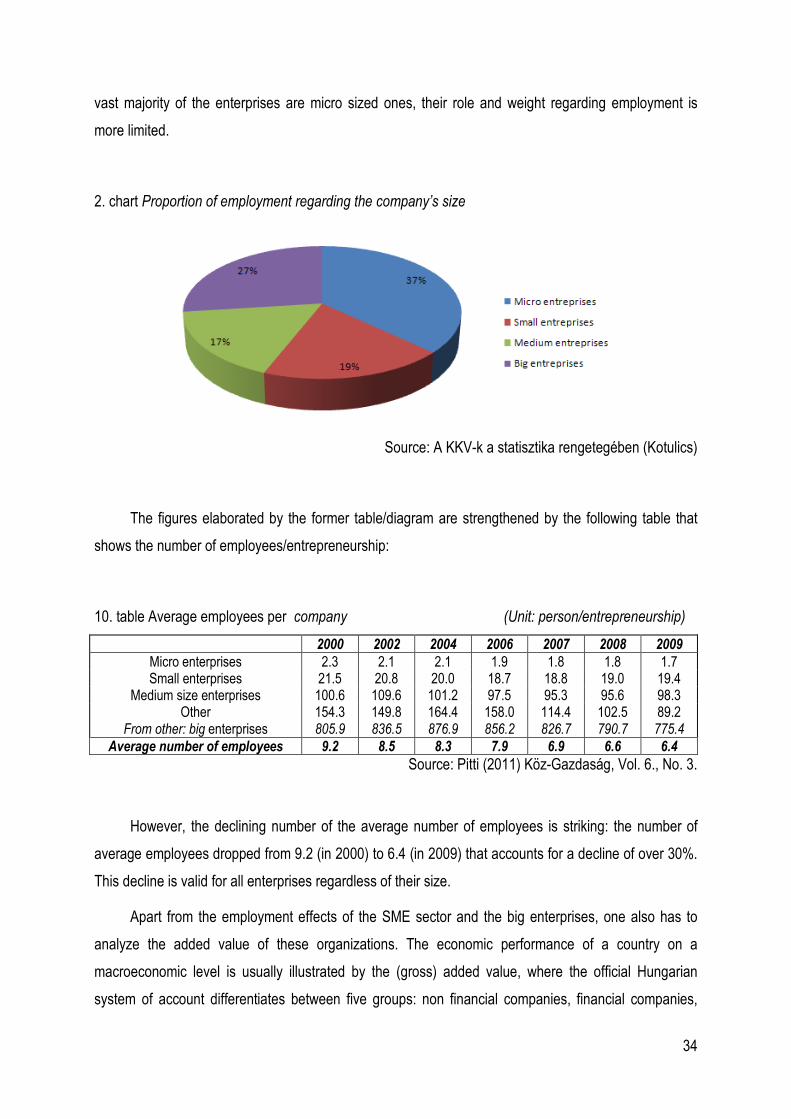
34
vast majority of the enterprises are micro sized ones, their role and weight regarding employment is
more limited.
2. chart Proportion of employment regarding the company’s size
Source: A KKV-k a statisztika rengetegében (Kotulics)
The figures elaborated by the former table/diagram are strengthened by the following table that
shows the number of employees/entrepreneurship:
10. table Average employees per company (Unit: person/entrepreneurship)
2000 2002 2004 2006 2007 2008 2009
Micro enterprises 2.3 2.1 2.1 1.9 1.8 1.8 1.7 Small enterprises 21.5 20.8 20.0 18.7 18.8 19.0 19.4
Medium size enterprises 100.6 109.6 101.2 97.5 95.3 95.6 98.3 Other
From other: big enterprises 154.3 805.9
149.8 836.5
164.4 876.9
158.0 856.2
114.4 826.7
102.5 790.7
89.2 775.4
Average number of employees 9.2 8.5 8.3 7.9 6.9 6.6 6.4
Source: Pitti (2011) Köz-Gazdaság, Vol. 6., No. 3.
However, the declining number of the average number of employees is striking: the number of
average employees dropped from 9.2 (in 2000) to 6.4 (in 2009) that accounts for a decline of over 30%.
This decline is valid for all enterprises regardless of their size.
Apart from the employment effects of the SME sector and the big enterprises, one also has to
analyze the added value of these organizations. The economic performance of a country on a
macroeconomic level is usually illustrated by the (gross) added value, where the official Hungarian
system of account differentiates between five groups: non financial companies, financial companies,

35
governmental sector, households, and non-profit sector. The added value of these various sectors is as
follows:
11. table The gross added value performance of the economy’s various sectors (Unit: Billion HUF)
2000 2002 2004 2006 2008 2009
Gross added value altogether 13 368.9 17 231.3 20 822.4 23 730.0 22 829.2 22 069.1
Sectors Non-financial companies 6 511.4 8 372.8 9 948.8 11 893.7 13 550.6 13 029.1 Financial companies 366.1 498.5 626.7 826.0 879.7 955.9 Government 1 969.0 2 842.2 3 257.0 3 625.7 3 918.4 3 81.,2 Households 2 551.8 2 967.1 3 622.0 3 966.1 4 229.4 4 015.9 Non-profit organisations 84.4 127.0 199.9 223.9 251.2 254.1
The share of non-financial companies regarding the added value
56.7%
56.5%
56.4%
57.9%
59.4%
59.0%
Source: Pitti (2011) Köz-Gazdaság, Vol. 6., No. 3.
The table clearly demonstrates that the non-financial companies are the key players of the
Hungarian economy (with 59% share in gross value added); however, in the European Union this
average is around 63-64%. Apart from the distribution of the added value regarding the various sectors
one also has to systemize the added value in other manners in order to obtain the weight of the SME
sector in Hungary. The following three tables provide the necessary adequate information on the role of
the SME sector regarding their gross added value.
12. table The distribution of gross added value regarding the size of the entrepreneurship
(Unit: percentage)
2000 2002 2004 2006 2007 2008 2009
Micro enterprises 11.9 11.1 10.8 11.6 12.2 13.0 13.0 Small enterprises 13.9 12.4 14.8 15.1 15.0 15.4 15.0
Medium size enterprises 18.2 17.2 16.4 16.6 16.9 17.5 17.6 Other
From other: big enterprises 56.0 52.2
59.3 52.0
58.0 51.7
56.7 50.4
56.0 47.4
54.1 47.4
54.3 45.7
Gross added value altogether 100.0 100.0 100.0 100.0 100.0 100.0 100.0
Source: Pitti (2011) Köz-Gazdaság, Vol. 6., No. 3.
The data provided by the Statistical Office is basically similar. According to the presentation carried out
by the Office focusing on the Hungarian SME sector in 2008, the following proportions were in terms of
the distribution of gross added value regarding the size of the enterprises.

36
3. chart Distribution of gross added value regarding the size of the enterprises
Source: A KKV-k a statisztika rengetegében (Kotulics)
The chart demonstrates that the 45% of the gross added value is provided by the big enterpirses, while
the SME sector accounted for 55% of the gross added value in 2008.
13. table Average added value performance pro entrepreneurship
(Unit: million HUF/entrepreneurship)
2000 2002 2004 2006 2007 2008 2009
Micro enterprises 3.4 3.8 4.1 5.0 6.4 7.2 6.4 Small enterprises 42.9 47.5 60.7 68.1 79.2 84.3 82.3
Medium size enterprises 253.6 340.4 355.0 428.4 495.5 525.2 550.0 Other
From other: big enterprises 616.9
3 069.5 854.0
4 312.4 1 086.4 5 324.1
1 253.3 6 529.4
1 055.8 6 695.5
964.5 7 009.3
847.9 6 657.7
Average 25.1 29.9 33.5 37.9 39.2 38.6 36,1
Source: Pitti (2011) Köz-Gazdaság, Vol. 6., No. 3.
The first table demonstrates that the Hungarian SME sector accounted for only 45% of the added
value in 2009, while it employed around 68% of the total employees (this data is echoed by Szabó
(2010)). The data is also striking due to the fact that the SME sector usually accounts for around 55% of
the total added value in the Western European economies (Mózes, 2006). Meanwhile, the big
enterprises delivered a gross added value of 45.7% with employing only 30.2% of the total employees in
2009, what clearly indicates the better efficiency of the big enterprises. The effectiveness of the bigger
companies contrary to the SME sector can be derived from the table that contains the “average value
added performance pro entrepreneurship” data as well, since the big enterprises compared to the SME
sector deliver performances of another magnitude. The difference of the gross added value between the
various sized enterprises can also be traced upon the following table.

37
14. table Gross added value performance pro employee (Unit: million HUF/employee)
2000 2002 2004 2006 2007 2008 2009
Micro enterprises 1.5 1.8 2.4 2.8 2.9 3.1 3.0 Small enterprises 2.0 2.3 3.0 3.6 3.9 4.1 3.8
Medium size enterprises 2.5 3.1 3.5 4.4 4.7 5.0 4.8 Other
From other: big enterprises 4.0 3.8
5.7 5.2
6.6 6.1
7.9 7.6
9.2 8.1
9.4 8.9
9.5 8.6
Average 2.7 3.5 4.0 4.8 5.7 5.9 5.7
Source: Pitti (2011) Köz-Gazdaság, Vol. 6., No. 3.
The gross value added performance pro employee irrevocably demonstrates the huge gap of
efficiency between the SME sector and the big enterprises: the gross added value performance is
nearly three times as much at a big enterprise then at a micro enterprise, and the SME average (3.87
million HUF/employee) is clearly behind the big enterprises’ average (8.6 million HUF/employee). This
table shows also that the micro, small, and medium enterprises are lagging far behind the other players
of the economy in terms of economic (gross added value) performance.
The quantity and distribution of the external economic relations is an important aspect of the
internationalisation of the economy and its enterprises. The following table shows the primary directions
of the Hungarian external economic relations:
15. table Hungary’s export regarding the main partners (Unit: percentage)
2000 2002 2004 2006 2008 2009 2010
EU-27 countries 85.1 84.7 83.1 78.7 78.3 78.9 77.3 EU-15 countries 76.4 75.1 70.8 57.5 59.2 61.2 57.1 EU-12 countries 8.7 9.6 12.3 20.8 19.7 17.5 20.2
Non-EU countries 14.9 15.3 16.9 21.3 21.7 21.1 22.7 Export altogether 100.0 100.0 100.0 100.0 100.0 100.0 100.0
Source: Pitti (2011) Köz-Gazdaság, Vol. 6., No. 3.
It may not come as a surprise that the most important trade partners of Hungary consist of the
Member States of the European Union, although their importance was continually declining in the last
decade, while the Hungarian export to non-EU countries increased. However – despite the current
trends – the Hungarian export to the EU-countries (77% in 2009) still significantly exceeds that of the
EU27 average (67% in 2009).
A more interesting aspect of the Hungarian export structure can be seen on the following table
that shows the distribution of exporters:
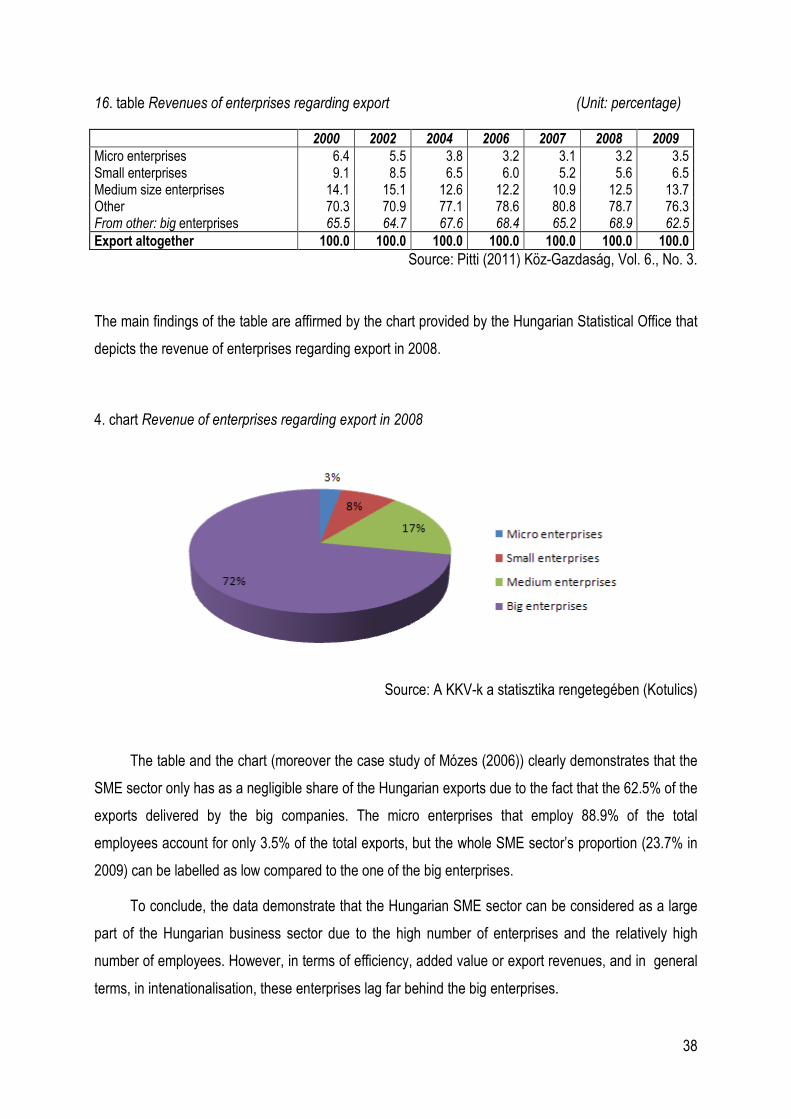
38
16. table Revenues of enterprises regarding export (Unit: percentage)
2000 2002 2004 2006 2007 2008 2009
Micro enterprises 6.4 5.5 3.8 3.2 3.1 3.2 3.5 Small enterprises 9.1 8.5 6.5 6.0 5.2 5.6 6.5 Medium size enterprises 14.1 15.1 12.6 12.2 10.9 12.5 13.7 Other From other: big enterprises
70.3 65.5
70.9 64.7
77.1 67.6
78.6 68.4
80.8 65.2
78.7 68.9
76.3 62.5
Export altogether 100.0 100.0 100.0 100.0 100.0 100.0 100.0
Source: Pitti (2011) Köz-Gazdaság, Vol. 6., No. 3.
The main findings of the table are affirmed by the chart provided by the Hungarian Statistical Office that
depicts the revenue of enterprises regarding export in 2008.
4. chart Revenue of enterprises regarding export in 2008
Source: A KKV-k a statisztika rengetegében (Kotulics)
The table and the chart (moreover the case study of Mózes (2006)) clearly demonstrates that the
SME sector only has as a negligible share of the Hungarian exports due to the fact that the 62.5% of the
exports delivered by the big companies. The micro enterprises that employ 88.9% of the total
employees account for only 3.5% of the total exports, but the whole SME sector’s proportion (23.7% in
2009) can be labelled as low compared to the one of the big enterprises.
To conclude, the data demonstrate that the Hungarian SME sector can be considered as a large
part of the Hungarian business sector due to the high number of enterprises and the relatively high
number of employees. However, in terms of efficiency, added value or export revenues, and in general
terms, in intenationalisation, these enterprises lag far behind the big enterprises.

39
3.5 Internationalization of Hungarian SMEs (result of an online survey)
With the help of the Hungarian Chamber of Commerce and Industry and its regional affiliates we
managed to send our online survey to all members of the Chamber. We received 430 surveys which
were at least partially completed with the necessary data to be analysed. There has to stated that the
results are not representative of the total SME sector, but with a quite balanced regional and size
distribution the survey is able to give a strong impression about the internationalization of the Hungarian
SME sector. 50% of the responding SMEs were from Budapest, the other half were from all over the
countryside.
5. chart Size of the responding enterprises
Source: own research
Generally 22,33% of the responding SMEs have some kind of export income with an average of 34% of
their total revenue. Half of the enterprises are exporting in an amount of less than 25% of their income.
MICRO 72,56%
SMALL 22,09%
MEDIUM 5,35%

40
17. table Ratio of export in the SMEs’ income
% of the companies which have export income
average ratio of export of the exporting companies in their income
MICRO 16,35 % 29,28 % SMALL 41,05 % 36,32 % MEDIUM 26,09 % 59,02 %
Source: own research
This data shows a concentration of export activity among the Hungarian SMEs, which means that a
small amount of SMEs are responsible for the export revenue of the sector. The results are showing as
well, that the companies which have reached the “threshold size” are much more willing and able to
trade with foreign companies. We also questioned the ownership structure of the company and we have
found very interesting that the family owned companies are significantly less willing or able to step into
foreign markets. The export activity ratio of family owned companies is 14 % versus the 27% of the non-
family enterprises.
We also tried to measure the ratio of supply to multinational enterprises in the SMEs’ income. We have
found that 23,26% of the SMEs are suppliers to multinational companies (within the Hungarian borders)
with a quite high share of their income (35,79%) which means, that one quarter of the responding SMEs
are depending heavily on Hungarian affiliates of multinational companies.
18. table Share and ratio of companies which have supply activity to multinationals
% of the companies which have supply activity
average ratio of supply to multinationals in their income
MICRO 22,44 % 34,24 % SMALL 27,37 % 44,31 % MEDIUM 17,39 % 27,00 %
Source: own research
This data shows a more equilibrated dependence of the SME sector towards multinational firms, even
the difference between family and non-family owned businesses regarding this dependency on
multinationals has changed in favour of family owned ones, which means that a higher share of
responding family-enterprises have supply-connections with MNC-s than non-family owned ones. We
have analysed how many companies are exporting and supplying a multinational inside Hungary. The

41
results are very interesting: only 7,67 % of the responding SMEs were able to do the two activities
parallel, in which the share of small sized enterprises is nearly double of the average ratio (13,68 %).
We analysed some other type of international activities of the enterprises, like owning shares in foreign
companies, membership of professional organisation, or other forms of networking.
97,2% of the responding SMEs has not any share of foreign companies. The 2,8% which have, are
owning companies basically in the neighbouring countries. The results are showing that 80% of the
responding SMEs does not have any type of international relations.
6. chart Ratio and type of international relations of SMEs
Source: own research
The only interesting differences which could be seen by division of size, that the medium size
companies are much more likely to participate in franchise networks and international professional
organisations.

42
We were interested in asking the opinion and demand of the responding SMEs about how to help them
to maintain or increase their competitiveness. To “warm up” these questions we were questioning the
enterprises about their subjective view on the change of competition in Hungary after the EU-accession
in 2004. The answers were not surprising: nearly two third of the SMEs feel an increased and 30 % of
them a standard high level of competition. Which is however surprising is that more than 50% of the
SMEs could adapt its functioning maintaining or even increasing its market shares, and the medium size
enterprises perform with an above average success rate.
19. table View on the change of competition in Hungary after 2004
ALL TOGETHER MICRO SMALL MEDIUM 1. Fighting to survive with declining market position 46,50% 48,82% 41,67% 33,33% 2. Maintained its market position 43,30% 41,75% 48,81% 42,86% 3. Strengthened its market position 10,20% 9,43% 9,52% 23,81%
Source: own research
We asked the causes of the above written tendencies with offering some fixed answers and one open
possibility. We received the following results:
20. table Possible causes of the change of competition in Hungary after 2004
significant positive effect
little positive effect
No effect little negative
effect
significant negative
effect State- and EU-subsidies 9,3% 18,8% 61,2% 3,3% 7,5% Széchenyi-card program* 16,0% 16,0% 64,7% 1,0% 2,3% Changing of domestic market demand
6,2% 22,1% 15,4% 27,2% 29%
Possibilities of the international / EU market
5,2% 14,3% 67,5% 7,0% 6,0%
Competition with foreign companies / MNCs
1,3% 2,8% 48,8% 24,8% 22,2%
New technological developments
14,0% 28,4% 50,6% 4,4% 2,6%
Source: own research
* The Széchenyi-card is a type of credit card, which’ interest rate is supported by the state following special rules and in cooperation with the Hungarian Chamber of Commerce and Industry.

43
We can say that the EU-subsidies had in general none or little positive effect on the responding SMEs,
however 32% of them are regarding the Széchenyi-card program helpful. Obviously the change in the
demand of domestic market had mostly negative effect on the responding enterprises, however a
quarter of them could take the challenge and were able to adapt to the new situation. What is very sad
and disappointing that the majority SME sector seemingly could not have used the advantage of the
single internal EU market, just 20% of enterprises responded positively on that question. Another
unsurprising result was that the competition with the multinational companies did not help the SMEs,
however lot of the responding firms could take advantage of the new technological developments.
After unfolding the problems and its roots in general we asked the SMEs to give a hint from which
institutions they are expecting what kind of help, if any. The enterprises were allowed to mark more than
one answer! The results were the following:
21. table The share of expected help from different institutions
Chamber of Commerce and Industry
Local governments and city halls
Hungarian government
European Union
Training and education programs for the employees and for the management
81,3% 9,2% 24,4% 10,4%
Professional consulting services 83,6% 13,2% 18,0% 10,9% Unfolding of foreign market demands and helping to enter these markets
50,3% 7,9% 50,7% 38,4%
Unfolding of domestic market demands 67,8% 33,4% 33,1% 1,9% Interest-subsidized loan 9,3% 6,1% 89,1% 27,3%
Source: own research
It is absolutely clear that the responding SMEs are expecting a lot from the Hungarian Chamber of
Commerce and Industry and its regional affiliates in the fields of training and education, professional
consulting and helping to explore domestic and foreign market demands, so they should try to expand
their businesses in Hungary and abroad. It is clear as well, that the expectation to promote and expand
the interest-subsidized loan from Hungarian government and partially from the EU is very high!

44
7. chart The share of expected help from different institutions
Source: own research
To the open question we received various options, some of them were: eliminating the “gridlock*,
countable and simple tax system, eliminating corruption, stable legal system, stable exchange rates
(especially EUR-HUF)
However 11,6% of the responding SMEs are not expecting any help from the EU or the local
governments. This result partially reflects the very bad state (mostly financial) of the local governments
and cities, and of course it reflects disappointment in the EU-funds and in the European Union itself, as
well.
We were interested as well, what SMEs are willing or able to give in exchange of expected help. To
answer this question we offered a multiple choice possibility where the enterprises could rank their
preferences. The result of this ranking is that the responding SMEs are much more willing to create jobs
and increase their turnovers than introduce environment friendly technologies or obligatory increase of
their export-income.
* Gridlock is the process, in which an entrepreneur, having fulfilled its contractual obligations for, is not receiving the money for it because the client company is temporarily insolvent because of the debt other companies (or the state) owe them. This means a whole "chain of non-payment".

45
4. The internationalization of the Spanish SME sector
4.1 The process and state of internationalization of Spanish economy
Spain is a developed country in the European Union, with the GDP of 101% of the EU-average
(Eurostat 2011). The analyses of its SME sector and of their internationalization first may look not so
relevant to Hungary. But if we regard its way from dictatorship to democracy (in the late 70’s), its
transition from a closed autarchic economy to liberal market economy in the 1980’s with the accession
to the European Union, and its success of cohesion process (with the obvious problems, e.g. the
infrastructural boom in the years of 2000, and differences from Hungary), and regarding the size and
importance of the SME sector in the economy, we can say it holds several good and bad practices
which is worth to examine, to follow or to avoid.
A Europe- and worldwide-acknowledged – but unfortunately in Hungary less-known – best practice in
Spain is the Barcelona Activa, an initiative of the City Barcelona and the Government of Catalonia,
which won in 2011 the European Enterprise Awards from the European Commission for its work in the
last 20 years.
The growth of the European (incl. Spanish and Hungarian) economy depends heavily on its SME sector.
In 2008 78% of business economy workforce in Spain was employed in an SME while in Hungary it was
73%. The added value of the SME sector in share of the national GDP in 2005 in Spain was 68,5% (one
of the highest in the EU) in the same time in Hungary just above 50%, well below the EU-average
(57,6%) (Eurostat, 2008 and MITC, 2011). These numbers indicate that the Hungarian SME sector in
average is much less productive (efficient) than the Spanish. There are several factors which could be
listed regarding the causes: the Hungarian SMEs are working in high labour intensive sectors, because
their capitalization is low, just 20-22% of them could apply for bank-loan (the EU average is 70-78%)
while they share in employment is high. (NGM, 2010) The big question is: how could a government help
the SME sector to be more competitive and with this stimulate economic growth.
The growth of an enterprise can be increased by better management of intellectual property and
knowledge, acquiring new technologies or innovation, mergers and acquisitions and internationalization.
The internationalization could have a lot of advantages: diversification of risks, increasing sales and
knowledge of the market, exploiting the economy of scale and improving the “corporate image”.
(Martínez, 2010) Several external factors could contribute to that like business and macroeconomic

46
environment (incl. tax-system), geographical conditions, education level of the potential workforce, and
internal factors like corporate entrepreneurship, resources (e.g. capitalization and access to finance)
and motivation.
Every company with or without international presence is exposed to the competition of the external
markets. The technologies, the connection with clients, the way of negotiation, the domestic market are
all affected by the globalization. Inside the European Union this competition is even harsher between
member states, which is pushing the economies to be more efficient, to modernise its structures, to
professionalise its ways of direction and organisation. (Camisón & de Lucio, 2010)
European SMEs are in an advanced state of internationalization, 69% of them agree that their
competitiveness increased because of the process of internationalization. (Buisán & Espinosa, 2007)
The OECD and the European Commission are highlighting the internationalisation as a highly relevant
factor for survival, development and competitiveness of the SMEs. Following the definition of the OECD
we consider internationalization not just as export of goods or FDI, but network building and contribution
in international projects (e.g. research and development), as well.
The literature is mentioning a long list of different types and advantages of internationalisation. The
main differentiation in the type of SME’s internationalisation is in terms of the start of the process. If an
SME internationalise its business practically from the start, than it is an international new venture or
born global. (Rialp, Rialp & Knight, 2010) Some literature names these type of firms as “gazelle”
enterprises, because of their rapid growth. (Amat et all, 2010)
Traditionally, the enterprises are constructing their solid bases in their own domestic markets before
stepping to the international stage gradually far from its host country. The school of Uppsala defines the
model of internationalization as a long term process. (Johanson & Vahlne, 1977, 1990)
The theory of organizational learning states the younger an enterprise is on the time when it steps to
external markets, the more prepared will be to face the challenges, to adapt and to gain the necessary
knowledge to compete in the international market. On the other hand an early internationalization can
contribute to the enterprise to be more efficient, to promote organizational learning and to develop
competences, which helps to gain competitive advantage. (Rialp, Rialp & Knight, 2010)
Till the late ‘90s the Spanish companies were concentrating to their domestic markets and lacked
projection and international reputation. In less than a decade all have been changed. Their size
increased and in a record speed they become international. (Santiso, 2007) The number of Spanish
companies which have gone to international markets increased significantly in the ‘90s, and nearly
doubled between 1998 and 2004. This process of international expansion of Spanish firms was
47
unexpected and the new Spanish multinationals gained an active role in sectors like banking, energy,
infrastructure and telecommunication. This group of companies were called in the Anglo-Saxon
newspapers as the new “Invincible Armada”. (Camisón & de Lucio, 2010) However the world ranking of
Spain in the market share of exportation is just nr. 15, which is quite low comparing its size (nr. 8th
compared to GDP) in the world economy. Some countries with high energy sector and export are above
in the ranking (Russia and Mexico) and countries like the Netherlands and Belgium with their traditional
role of intermediates in the world trade. This however does not mean that they have higher production
of goods and services. (Quintana Navío, 2007)
The factors, which are determining the intensity of the presence in international market, are closely
linked to size, productivity, innovation capacity and the appropriate structure of financial costs. (Banco
de Espańa, 2009) In the centre of this Spanish success was a model of innovation of making business
and a highly innovative production and distribution processes. When we speak about innovation it is not
just about high level technology of production, but it refers also to management processes, which
proved to be highly innovative in many cases. (Santiso, 2007) This Spanish development was marked
by two key elements: a complicated past with a stagnating, controlled and isolated economy and a
brilliant start of the 21. century with rapid structural changes. (Quintana Navío, 2007) In the ‘90s the
internationalization of Spanish firms started in Latin-America, which in the years of 2000 turned to the
market of United States, to the European and Asian markets. With this process the “multilatinas”
developed to multinationals. (Santiso, 2007) This phenomenon happened in a unique constellation of
world economy boom, loose financial market (time of free money) and with a prosperous and strong
Spanish economy.
Although, the number of international enterprises were increasing and reached in 2006 the threshold of
100.000 (which is just 3% of all Spanish companies), in 2007, a decline begun, and several thousands
disappeared or finished their international activities. Parallel of this process the international activity of
the companies frequently remains quite sporadic and passive. The high cost of establishing
international commercial relations with foreign companies and that of maintaining in the long run means,
that an enterprise need stable and high capacity exportation to cover these costs. 61% of the Spanish
companies, who have sold products to international markets, could maintain their international operation
just for one year, 12% for two years. (Camisón & de Lucio, 2010)
In Spain 73% of SMEs with international connection are firms, whose internationalization was a long
process, which means, that exporting was just the last step in their way to the foreign market. Only 27%
of the SMEs confirmed that it was a sudden decision. Most of the companies made this step following a
client or costumer who was expanding its activities to external markets. The fundamental reason in

48
general was strategic: the company realized that its own growth and expansion strategy, practically to
survive on the market, needs an international presence, and every other reasons were secondary:
diversifying risks, to get nearer to the customer, increasing the image of the company, getting faster
access to high technology. Cost-reduction was not really relevant reason. (Buisán & Espinosa, 2007)
The practice shows that exporting firms are producing a better level of performance in terms of
productivity, size, survival, paid salary, capital-intensity and sophisticated technology, than the
enterprises which doesn’t export. To compete in foreign markets the exporting firms are able to gain
knowledge about the newest technology and implement it faster than non-exporting enterprises, and
this accumulation of information allows them to incorporate it to their own functioning and to increase
the productivity. The experience that exporting firms are more productive than non-exporting firms does
not indicate clearly the causality between exporting and the higher entrepreneurial achievement. In the
case of Spain the competitiveness of the SMEs increased just very slightly as a result of exportation
activity. The only indicator which significantly and positively affected the competitiveness was the
profitability, however just 1-3 years after the start of exportation. The effect of “value added” is positive
but not significant statistically. (Avella & Garcia, 2010)
The internationalisation is acknowledged as one the most relevant strategic decisions related the
competitiveness of an enterprise. However the empirical evidence for the causality between the relation
of exportation and competitiveness should be conclusive. Some good entrepreneurial results allow an
SME to step to international markets and/or they increase their achievement because of the exportation.
(Avella & Garcia, 2010)
Impact of ownership is also important. The family enterprises have less dynamic growth prospects, and
even less in the international markets. The lack of financial resources, the inflexibility and the resistance
to change the leadership from the members of family to professionals, the differences of the objectives,
values and necessities between family and enterprise, together with the conflict between the potential
successors are all factors why the family enterprises’ growth is limited. (Ward, 1998)
The attitude to risk of the family enterprises is differing to non-family firms. The firsts are more
conservatives and are averse to risk, which is hardly surprising regarding that the family’s wealth is
based on the functioning of the company. That is why they have little interest to assume high risk. The
decision of international expansion is a risky one, especially the first phase of the process, where the
firm have little knowledge and information. That is why this strategy is less attractive to family
enterprises. (Fernández & Nieto, 2006) However the attitude and behaviour of the family enterprises
can vary depending the generation in leadership, which can have different interests, styles of
management and objective. (Okorafo, 1999) The funding generation is mostly concentrating on

49
consolidating the firm’s position on the domestic market, while the new generation of leadership would
like to demonstrate its braveness and independence and would like to find its place in the company, and
that is why it is more willing to change. (Fernández & Nieto, 2006)
The analysis of Spanish case by Fernández and Nieto (2005 and 2006) shows, that there is a negative
relation between the family ownership and internationalisation. There are not too many enterprises
which are exporting and if so they do it in moderate extent than the rest. Two possible ways were
analysed which could help the internationalisation of family business: 1. incorporation of new generation
to leadership and 2. introduction of new resources (human, capital, management knowledge) to the firm.
They have found that the arrival of a new generation to the leadership could ease the access to new
resources and the following generation of family business shows a more inclining and intensive
exportation than in the times of the founding generation. Another study shows that the second
generations in family firms are a positive factor for internationalization. (Menéndez-Requejo, 2005) The
opening up the family enterprise to corporate shareholders (fresh capital) has also a major implication in
international markets. Another question of the study is whether alliance with firms on the potential new
market do help internationalisation? The finding shows that it affected negatively the results of the
process of internationalisation. (Fernández & Nieto, 2005) In general the Spanish family firms are not
especially limited by their resources and capabilities in comparison with non family firms. (Menéndez-
Requejo, 2005)
The study of Okorafo (1999) in the USA shows, that one of the variables that can determine significant
differences between family firms is the generation involved in their ownership and control. The
coexistence of multiple generations of family members can encourage risk taking and thus international
growth. The second generation could be more motivated and prepared to start projects abroad, while
founders could prefer stability. If a family business does not get involved in foreign markets in the first or
second generations, it is unlikely to do so in later generations.
The majority of the internationalized enterprises are SMEs with less than 200 employees. However
67,7% of the firms have more than 50 workers and the companies who have the most advanced level of
internationalization are employing between 100-200. From this data we could conclude that size does
matter. The result of several researches shows that the process of internationalization demands a
certain level of firm-structure. The critical mass to a company to step into international market is
somewhat above 20 employees in Spain. The study states that there is a correlation between the size
and a external openness in general, because the companies with bigger structure are able to support
better the use of resources and to handle the risk which goes together with the development of foreign

50
activities. (Buisán & Espinosa, 2007) Other studies concluded as well, that size is a positive factor for
internationalization. (Menéndez-Requejo, 2005; Fernández & Nieto, 2005)
In a study among the member companies of the Instituto de la Empresa Familiar (Institute of Family
Enterprises) the state of internationalisation of 103 firms was analysed, which represent perfectly the
great Spanish family enterprises (with an average turnover of 1000 million euro per year). The results
show that the sector in which a family enterprise is functioning does not influence significantly its
internationalisation with two examples. The companies in the construction and commercial distribution
are simply not present on international markets. The reasons are unclear but the significant barriers
could be the lack of financial assets. (Quintana Navío, 2007) The research of the Spanish Institute of
External Trade (Instituto Español de Comercio Exterior, ICEX) of the Ministry of Industry, Tourism and
Trade in Spain came to the conclusion that the most internationalized sectors are the trade (all above
whole sale) and the manufacturing industry. (Buisán & Espinosa, 2007)
The human capital is crucial element to the successful development of foreign projects. The knowledge
of former experiences is very useful to overcome the difficulties that a company could face during the
process of internationalization and the penetration of a new external market. The main difficulty during
the primary phase of the internationalization is the lack of knowledge about the target country, the
cultural and entrepreneurial differences, language, and the searching for business partners. (Buisán &
Espinosa, 2007)
A study of Lopez Rodríguez (2006) came to the conclusion that the education in general and trainings in
specific fields have positive effects and are highly significant in the process of internationalization of
Spanish firms, also in the phase of entry to the new market, as well in the realization of products in the
foreign market. The better human capital is increasing the level of productivity of the employees, and
above all the enterprise gain a higher competitiveness in the international arena. (Lopez Rodríguez,
2006)
There is a huge literature which finds that exporters are more productive than non-exporters. Several
causes could occur why that is true. Foreign markets are not continuation of the home market; there are
some differences that involve specific costs to access them. Then, only firms that have the necessary
advantages to overcome the entry costs will do it. Firms which are present in international markets may
learn about different production technologies, managerial techniques, and/or find additional stimulus to
develop more efficient methods. A study of Merino (2004) finds that in 18 industries (out of 20) the
productivity of exporters was, in statistical terms, superior to that of domestically focused firms. The
productivity of firms with subsidiaries abroad was greater than that of exporters. In the case of Spanish
51
manufacturers, firms which are at a more advanced stage of the internationalization are more productive.
(Merino, 2004)
According to a study of ICEX (of the of the Ministry of Industry, Tourism and Trade in Spain) 89% of the
Spanish enterprises are confirming that their competitiveness increased as an effect of
internationalization, and half of them are willing to enter new markets in this order: China, Mexico, USA,
Brasilia and Eastern European countries. (Buisán & Espinosa, 2007)
4.2. Barriers of internationalisation
Today practically in all sectors the access to international markets is much less risky than before, mostly
thankful to the commercial liberalisation, the opening up of international markets and the more and
better information because of the new information technologies. The internationalisation for many
companies is a purely defensive and the only strategy to remain competitive. (Quintana Navío, 2007)
However there are several barriers which remain in the way of internationalization of SMEs. According
to the OECD (OECD, 2008 and OECD, 2009a) the main barriers to greater internationalisation as
reported from SMEs are:
1. Shortage of working capital to finance exports (limitations in finance and related physical resources);
2. Identifying foreign business opportunities;
3. Limited information to locate/analyse markets (this was the most cited internationalisation barrier
among the responding firms in the OECD’s research, suggesting that information gaps remain a critical
challenge to SMEs);
4. Inability to contact potential overseas customers;
5. Obtaining reliable foreign representation;
6. Lack of managerial time to deal with internationalisation;
7. Inadequate quantity of and/or untrained personnel for internationalisation;
The OECD research found some indication that firms within certain sectors face particular industry-
specific internationalisation barriers, which provides continuing justification for the segmentation- or
needs-based approach widely adopted by export credit agencies (ECAs) and trade promotion
organisations (TPOs). (OECD, 2009a)

52
According to the analyses of the European Commission (EC, 2007) the problems could be grouped in
the three main areas of concern:
1. Insufficient managerial time and/or skills required for internationalisation
2. Lack of financial resources
3. Lack of knowledge of foreign markets, mostly consequence of the previous two.
The EC report underlines the importance of support in the area of managerial, particularly in terms of
lack of international strategy of SMEs, which is growingly considered as one of the main SME problems
of preparedness for internationalisation. This situation is closely related to size: on average the smaller
the SME the more management building capabilities required. Small SMEs tend to have lesser
structured management procedures and a tendency to making opportunistic rather than systematic
strategic decisions. A structured management system is fundamental for a successful
internationalisation and may be one of the key elements that hinder further SME internationalisation.
(EC, 2007)
There are three main groups of enterprises more or less homogenous which can be differentiated in the
process of internationalization in Spain (Buisán & Espinosa, 2007):
1. big multinational firms, mostly in sectors of infrastructure building, finance, telecommunication, energy
and services
2. big and medium sized family enterprises, which are in average present in three or four countries
preferably in Latin-America and Europe, and are developing a commercial strategies based on affiliates
or branches.
3. the small and medium sized enterprises which are characterized by a minor international presence.
Concluding the results of different researches in Spain (Quintana Navío, 2007; Buisán & Espinosa,
2007; Merino, 2004; Lopez Rodríguez, 2006; Avella & Garcia, 2010; Fernández & Nieto, 2005 and
2006; Menéndez-Requejo, 2005; Crick & Barr, 2007 and others) there can be stated the
internationalization in the first group of firms (the multinationals) is in advanced phase in European
comparison as well. (At least until the world economic crisis.) The trend in the second group of
enterprises (among the big and medium size family firms) is that the companies are aware that to
remain competitive and to survive on the market, an international presence is needed for different
reasons (diversifying risks, getting nearer to the customer, increasing the image of the company, getting
faster access to high technology). But in the group of small and medium size enterprises the process of
internationalization is declining in the last years, although until 2007 it was an increasing trend. However

53
under internationalization in the group of SMEs we mostly understand exporting, which is for their
majority just is for one year, and it is not stable international connection. The causes and barriers for this
lack of real international presence are connected with:
1. The internationalization is demanding a certain level of professionalization in the leadership, which is
a necessary but not sufficient condition.
2. There is a direct connection between capacity of leadership, knowledge of foreign languages,
university degree, previous residence in abroad and between the result of the internationalization. This
means that human resource is an import factor and barrier at the level of SMEs.
3. The decline of exporting (internationalized) enterprises in Spain after 2007 shows that the economic
crisis (which includes a financial crisis) is causing – well understandable – serious barrier to
internationalization.
4.3. Some best practices
4.3.1. Joung European Enterprises (Empresa Joven Europea, EJE in Asturia,
Spain)
The programme has been included in the secondary education curriculum as an optional subject and is
aimed at students aged 12-16 years. Throughout a full academic course, students start up and manage
import-export companies involved in real trade activities with daughter companies abroad. Students will
communicate via video-conference and email with partner companies abroad, place and dispatch orders
and sell imported goods at the local trade fair. Eventually, profits are distributed among the partners of
the company and a portion of profits goes to an NGO or any other community project. Besides fostering
the entrepreneurial skills of pupils, the programme considers new technologies as an integral part of the
teaching-learning process. Positive attitudes are promoted toward foreign language learning as an
instrument of communication between partner mini-companies located in different countries. (EC, 2005
and EC, 2007)
4.3.2. Program of Aid to Investment Projects in Spain (Programa de Apoyo a
Proyectos de Inversión, PAPI)

54
The Spanish Institute of External Trade (Instituto Español de Comercio Exterior, ICEX) of the Ministry of
Industry, Tourism and Trade in Spain launched its Program of Aid to Investment Projects in 1995 which
aimed to cover some of the costs related to internationalization. The preparation to step into foreign
market and to start a project demand the elaboration of several studies in economic, technical, financial
and legal fields or in marketing. In this delicate phase of the internationalization the PAPI tries to
strengthen the training of the company’s workers and the initial management of the project. The
program is directed to aid the initiatives of Spanish companies to invest and to cooperate with any
country in the world, and it should be a new project or an expansion, modernization, rehabilitation or
privatization of existing enterprises in any type of service, production or industry. The results of the
Program show the declining tendency from after 2006, with a 60% fall of the number of supported
projects after an increasing tendency for a decade. The overall success of the Program is undeniable.
84% of the supported feasibility studies turned into reality in a form of a project in external markets. The
main geographical targets were Latin-America, Asia (mostly China) and Eastern-Central Europe.
(Buisán & Acena, 2007 and MITC 2011)
The main reasons for internationalization of the Spanish companies participating in the Program were
the following:
• following a main multinational client to external markets,
• maintaining or achieving leading market position in Spain,
• specialization in the advanced phases of the value chain (mostly the projects in China),
• securing and taking advantage of the row material supply (mostly in agricultural processing
industry),
• adaptation to local markets.
4.3.3. Barcelona Activa
The European Enterprise Award winner Barcelona Activa* is one of the Spanish (Catalan) best practices
in the field of enterprise development initiative which deserves to be highlighted. Barcelona Activa is the
local development agency of the City of Barcelona. It was created in 1986 to promote quality
employment and innovative businesses and started modestly as a business incubator coaching 14
business projects. Some 20 years later, its role and reputation has grown and it is the primary instigator
* http://ec.europa.eu/enterprise/policies/sme/best-practices/european-enterprise-awards/winners/index_en.htm (29.08.2011.)

55
of employment and innovation in the city. Its clients are drawn from different parts of the population and
a distinguishing feature is its personalized offer to participants in its programmes. It has a modest
budget but plays a central role in economic development in the city as the agent which designs and
executes municipal policy in the field. One of Barcelona Activa’s strengths is its capacity to be close to
the City Council – President of Barcelona Activa is also the Deputy Mayor and has led on economic
promotion – whilst also able to operate at arm’s length. (OECD, 2009b)
Barcelona Activa had four big services in 2008-11 period:
• Business creation and entrepreneurship culture:
o professional services for potential entrepreneurs in order to promote the creation of new
businesses,
o personalised coaching of entrepreneurs and assist them in taking the step from the
business idea to the creation of their own business with the help of a powerful website,
with contents, activities and self access tools in order to coach on line the business
plan.
• Innovative business consolidation and growth:
o incubator houses and technology parks to facilitate the future of innovative recently
created businesses by generating cooperation networks, stimulating innovation, and
contributing to improving their competitiveness and growth,
o facilitating access to funding, access to local and especially global markets, and
facilitating tools, experts, mentors for improving management,
o introducing Anglo-Saxon methodologies such as investment readiness seminars,
o complete agenda of contacts and training for internationalisation.
• Human capital development and new employment opportunities:
o seek to develop the workforce in the evolving context of the labour market and to
reduce the mismatch between the offer and demand of skills in the labour market.
• Access and improvement of employment:
o seeks to inform, orientate, motivate, train, and promote employment.
The business survival rate after the fourth year has attained 84% for the companies in the incubator. On
average, at the fourth year they employ of 9.8 employees and their annual turnover was EUR 980,000.
This shows the success of the Barcelona Activa.

56
4.4 The possible state supports and services to help the process of
internationalisation of SMEs
The report of the European Commission’s expert group on “Supporting the internationalization of SMEs”
has suggested, that in order maximise the effectiveness of government funds devoted to supporting
internationalisation of SMEs policies should consider:
• The barriers that impede or restrain the internationalisation of SMEs and the drivers that move
companies to internationalise.
• Each country will have to build its own set of policies based on “on the ground” experience. A
continuous, integrative and consultative process between all the stakeholders (Government,
support agencies and SMEs) is possibly the best key for successful policy development.
• One of the main reasons for non utilisation of support is that enterprises lack awareness. In
general, smallest SMEs do not have the desirable knowledge about the support measures due
to the lack of resources devoted to internationalisation. This calls for a simplified information
and access.
• Effective support to SMEs must consider the variables that influence the process of
internationalisation: available financial and human resources, company size and stage of
internationalisation, sector, geographical location, target markets, etc. All this strongly suggests
an approach, based on individualised support to each SME
The report differentiates several types of potential supports:
• Individualised support: should start by screening the “internationalisation capacities” and by a
long term consultancy support, information and support on finances for internationalisation,
access to information, networks, etc. The need to work with management teams rather than
offer generic assistance to address problems in internationalising is shown clearly by other
analysis as well. (Crick & Barr, 2007)
• Financial support: because one of the main barriers to SME internationalisation is the lack of
financial resources and access to sufficient and affordable finance. For trade related finance,
the existing mechanisms (commercial credit insurance, guarantees, factoring, etc.), and the
level and availability of information are good across most European countries. It has to be
mentioned that in the cohesion countries the Structural Funds are including programmes for
improving competitiveness (incl. internationalisation) and which are accessible to SMEs. (Yserte
& Pindado, 2010)

57
• Networks, which expand the capacity of the individual SME to internationalise, remain one of
the vital components of support to internationalise.
- Support networks managed mostly by governments (commercial offices abroad) or big
business associations with a key role as a support measure with directly usable
information for any type of internationalisation.
- Networks are focused on promoting direct co-operation between companies (co-
operative approaches, alliances etc.).
• Sectoral programmes are needed, because not all industries are equally affected by
globalisation. High and medium-high technology industries are on average generally more
internationalised than less technology-intensive industries (such as Spain).
The main recommendations of the report are:
• National level is the most adequate for the development of policies and programmes (rather
than regional or local).
• Co-ordination of all actors is paramount, which should also help prevent a “support jungle”.
• Internationalisation is needed for all SME, regardless of size. For programmes to be effective,
scanning of companies and “negative screening” must be introduced.
• Tailoring support to the individual SME and sufficient network support.
• The focus must be supporting long term co-operation between companies rather than trade
development: search of partners rather than customers.
• Evaluation of programmes is a must.
The recent challenges to Spanish enterprises, beyond the “standard” global transformation, are in the
first place is the dislocation, the depletion yond the cost advantages, the low productivity and the
predominance of the low added value technology sectors. Second, the promotion of innovation as the
motor of competitiveness. Third, the challenge to improve the technology base of the enterprises to
guarantee the sustainability. And finally, the need to generate external economies to the Spanish SMEs.
(Yserte & Pindado, 2010)
It has to stated, that any kind of state support has to follow the European regulations in regards of equal
competition in the single European market. There is a special regulation, called “de minimis”, which
helps the national governments to support the SME sector. The reason for this exception is based on
EC regulation No 1998/2006. “In the light of the Commission's experience, it can be established that aid
not exceeding a ceiling of EUR 200 000 over any period of three years does not affect trade between
Member States and/or does not distort or threaten to distort competition.”

58
Until October of 2009 16.000 different type of support program was set up in Spain from which 5600
was running. Following the analysis of Yserte & Pindado (2010) the important development of support
instruments of regional level is responding to the recognition of needs and challenges to help the SMEs
and it has generated results, and the possible perverse effects of which needs further examination. We
can conclude that the Spanish system of supporting SMEs is functioning within the European
frameworks, but evidently it is not following the recommendations of the expert group to “prevent a
support jungle”. However the best practices are worth to look at more closely, and which are in
accordance with the above mentioned recommendation.

59
Summary conclusions
Our research highlights the problem of the duality of the enterprise sector. The results are
showing that a weaker Hungarian currency would only be favourable to multinationals which represents
the overwhelming share of the Hungarian export, however they depend on import as well, but that
balance partially the positive effect of the weaker Hungarian Forint for them. The SME sector which
depends on import but have hardly any export activity will be however negatively impacted by the
weakening of the national currency.
An other massage of the research is that the Hungarian economic policy should more intensively
focus in the inflow of such FDI, which uses the Hungarian SME sector as sub-contractor, which is a kind
of participation in export, could be called indirect export activity. That will help the SME sector to
internationalize a bit and will give new chance to maintain or expend their activities. We think that these
thoughts should be included into a new strategy for SME-development including a concentrated
industry- and service-development (in some specific fields) and a bigger focus of the available EU-funds
for there purposes.
The global and European trends are all suggesting that an average SME has three possibilities to
follow: First, may find its own way on a local / regional surroundings and tries to compete with
multinationals relying on the specific knowledge of domestic demand it can supply; or second, tries to
gain economy of scale with exploring new markets and production possibilities, and/or tries to gain
access to international networks or third; it will struggle and slowly (or rapidly) go bust.
We think that next to the local, regional and national governments’ campaigns to “buy local” (go the first
way), there should be given help to SMEs to follow the above mentioned second possibility as well.
Hungary needs first, a strategy to help SMEs’ internationalisation; second, partnership with the interest
groups of the SMEs (including the chambers of commerce) and third, to establish an institution which
may give support to SMEs which have the intention to internationalise. This support should include:
training and education in various fields of management knowledge, enterprise incubation services,
search for possible financial investors (e.g. business angels and venture capital companies), financial
help to research foreign market needs and demands (including a chain of trade promotion offices in
target countries), all this possibly following best practices of EU member states (like Barcelona Activa in
Spain).

60
Notes of tables and charts
1. table Trade flows of goods and services (in %of GDP %, EU15) ......................................................... 8
2. table Share of trade of goods and services in GDP in 2008 (%) .......................................................... 9
3. table Stock of FDI in GDP in 2007, relation of stock of exported and imported capital in the European
Union...................................................................................................................................................... 11
4. table The number of enterprises (unit: number of companies) ........................................................ 30
5. table Structure of the Hungarian companies regarding its functioning (Unit: number of companies) . 30
6. tableThe distribution of ownership regarding the de facto functioning and continuously functioning
enterprises (Unit: percentage) .............................................................................. 31
7. table Distribution of the de facto and continuously functioning enterprises regards size.................... 31
1. chart Proportion of the Hungarian de facto functioning enterprises.................................................... 32
8. table Distribution of employees regarding proprietary proportions (Unit: percentage)........................ 33
9. table Distribution of employees regarding the size of the entrepreneurship (Unit: percentage) ......... 33
2. chart Proportion of employment regarding the company’s size.......................................................... 34
10. table Average employees per company (Unit: person/entrepreneurship)........................................ 34
11. table The gross added value performance of the economy’s various sectors (Unit: Billion HUF) .... 35
12. table The distribution of gross added value regarding the size of the entrepreneurship .................. 35
3. chart Distribution of gross added value regarding the size of the enterprises .................................... 36
13. table Average added value performance pro entrepreneurship ....................................................... 36
14. table Gross added value performance pro employee (Unit: million HUF/employee) ..................... 37
15. table Hungary’s export regarding the main partners (Unit: percentage) ........................................ 37
16. table Revenues of enterprises regarding export (Unit: percentage) .............................................. 38
4. chart Revenue of enterprises regarding export in 2008 ..................................................................... 38
5. chart Size of the responding enterprises............................................................................................ 39
17. table Ratio of export in the SMEs’ income ....................................................................................... 40
18. table Share and ratio of companies which have supply activity to multinationals............................. 40
6. chart Ratio and type of international relations of SMEs...................................................................... 41
19. table View on the change of competition in Hungary after 2004 ...................................................... 42
20. table Possible causes of the change of competition in Hungary after 2004 ..................................... 42
21. table The share of expected help from different institutions ............................................................. 43
7. chart The share of expected help from different institutions ............................................................... 44

61
References
Alexander C., Warwick K. (2007): Governments, Exports and Growth: Responding to the Challenges
and Opportunities of Globalisation. The World Economy, 2007
Almodóvar, P., Navas López, J. E. y Huerta Riveros, P. (2009): La tipología estratégica como factor
determinante de la empresa conjunta internacional. Investigaciones Económicas, 33(3), pp. 407-438.
Amat Salas O., Fontrodona Francolí J., Hernandez Gasción J.M., Stoyanova A. (2010): Las empresas
de alto crecimiento y las gacelas, Generalitat de Catalunya, Department d’Innovació, Universitats i
Empresa, Barcelona, 2010
Andrási, Zoltán – Dr- Borsi Balázs – Farkas László – Némethné Pál Katalin – Dr. Papanek Gábor –
Viszt Erzsébet (2009) A mikro-, kis és közepes vállalatok növekedésének feltételei, editor: Dr.
Papanek Gábor, GKI Gazdaságkutató Zrt., Budapest, p.1-142.
Antalóczy, Katalin – Éltetı, Andrea (2002) Magyar vállalatok nemzetköziesedése – indítékok, hatások
és problémák., Közgazdasági Szemle, Vol. 49. No. 2. p. 158-172.
Audretsch D.B. (2007): Entrepreneurship capital and economic growth. Oxford Review of Economic
Policy, Volume 23, Nr 1, pp. 63-78
Audretsch D.B. (2007): Entrepreneurship capital and economic growth. Oxford Review of Economic
Policy, Volume 23, Number 1, 2007, pp.63–78
Autio, Erkko (2005) Creative tension: the significance of Ben Oviatt’s and Patricia McDougall’s
artical ’toward a theory of international new ventures’, Journal of International Business Studies, Vol.
36. No. 1.
Avella-Camarero L., Garcia-Perez F. (2010): La actividad exportadora: Causa o efecto de la
competitividad de las pymes manufactureras espańolas? Revista de Globalización, Competitividad &
Gobernabilidad, 2010 VOL. 4 NUM. 1, GCG Georgtown University
Banco de Espana (2009): Encuesta a empresas no financieras sobre condiciones de acceso al crédito.
Boletín Económico del Banco de Espańa, Mayo 2009
Bell, J. (1995) The Internationalisation of Small Computer Software Firms: A Further Challenge to
„Stage Theories”, European Journal of Marketing, Vol.29 No. 8, p.60-75.

62
Bognár, Kamilla (2010) A nemzetközi piacra lépés lehetıségei és nehézségei: egy hazai kisvállalkozás
esete, Budapesti Corvinus Egyetem, Gazdálkodástudományi Kar, Vezetéstudományi Intézet, MA
szakdolgozat.
Buisán García M., Aceña Moreno F (2007): Estrategias de internacionalización de la Pyme española:
una visión desde el programa de apoyo a proyectos de inversión (PAPI). Información Comercial
Española, ICE, La Internacionalización de la Empresa Espanola, Noviembre-Diciembre 2007. N.º
839
Buisán García M., Espinosa Malo E. (2007): Una aproximación al perfil de la empresa espanola
internacionalizada: Datos y reflexiones. Información Comercial Española, ICE, La
Internacionalización de la Empresa Espanola, Noviembre-Diciembre 2007. N.º 839
Camisón C., de Lucio J. (2010): La competitividad de las PYMES espanolas ante el reto de la
globalización. Revista Economia Industrial, Núm. 375. 2010/1,
Campa J.M., Guillén M. (1999): The Internalization of Exports: Ownership and Location-Specific Factors
in a Middle-Income Country. Management Science, November. 1999
Crick D. and Barr P. (2007): SMEs' Barriers Towards Internationalisation and Assistance Requirements
in the UK. Journal of Small Business & Entrepreneurship, 20 (3), 233-244.
de Lucio J., Mínguez Fuentes R., Valero Calero M., Mednik Abeijón G. (2008): Permanencia de las
empresas en la exportación: Una mirada a las características de su actividad exterior. Información
Comercial Española, ICE, Tribuna de Economía, Enero-Febrero 2008. N.º 840
de Pastors Pérez D: Algunos casos de estrategias de internacionalización: la influencia del entorno
genérico del sector y las claves de la cadena de valor. Información Comercial Española, ICE, La
Internacionalización de la Empresa Espanola Noviembre-Diciembre 2007. N.º 839
Díaz Matalobos A., Lorenzo O., Solís L. (2005): Procesos de negocios de Pymes insertas en redes
colaborativas. Revista Latinoamericana de Administración, 34, Cladea, Bogotá, 2005
Díaz-Chao A, Torrent-Sellens J. (2010): ¿Pueden el uso de las TIC y los activos intangibles mejorar la
competitividad? Un análisis empírico para la empresa catalána. Estudios de Economía Aplicada
VOL.28–X, 2010
Dr. Szabó Antal (2009) Kis és Középvállalkozások helyzete Magyarországon, Centre of Development of
SME, Corvinus University of Budapesti, p.1-16.
Dunning, J. (1993) Multinational Enterprises and the Global Economy, MA: Addison-Wesley Publishing
Company, Reading

63
Ellis, P. (2000) Social Ties and Foreign Market Entry, Journal of International Business Studies, Vol. 31.
p.443-469.
European Commission – EUROSTAT (2000): A Community of Fifteen: key figures. EUROSTAT, 2000
European Commission (2005): Mini-companies in secondary education. Best procedure project: final
report of the expert group, European Commission, Directorate-General for Enterprise and Industry,
September 2005
European Commission (2006): regulation No 1998/2006 of 15 December 2006 on the application of
Articles 87 and 88 of the Treaty to de minimis aid http://eur-
lex.europa.eu/LexUriServ/LexUriServ.do?uri=OJ:L:2006:379:0005:0010:en:PDF (18.08.2011.)
European Commission (2007): Final Report of the Expert Group on Supporting the internationalisation
of SMEs. European Commission. 2007.
European Commission (2007): Supporting the internationalisation of SMEs, Final Report of the Expert
Group, European Commission DG Enterprise and Industry, December 2007
European Commission (2009): Europe in Figures, Eurostat Yearbook 2009. Eurostat. Statistical Books.
European Commission, 2009
European Commission (2010) Internationalisation of European SMEs, Brussels
Eurostat (2008): Enterprises by size class - overview of SMEs in the EU
http://epp.eurostat.ec.europa.eu/cache/ITY_OFFPUB/KS-SF-08-031/EN/KS-SF-08-031-EN.PDF
(01.08.2011.)
Eurostat (2011): GDP per capita in PPS
http://epp.eurostat.ec.europa.eu/tgm/table.do?tab=table&init=1&plugin=1&language=en&pcode=tsie
b010 (01.08.2011.)
Fernández Z., Nieto M.J. (2002): La estretegia de internacionalización de la pequena empresa familiar,
Working Paper No. 2, Carlos III Universidy, Madrid, Spain, Vol. 28, No. 2, pp.337-360.
Fernández, Z., Nieto, M.J. (2005): La estrategia de internacionalización de la pequeña empresa familiar.
Cuadernos de Economía y Dirección de Empresas, 22, pp. 107-125.
Fernández, Z., Nieto, M.J. (2006): The impact of ownership on the international involvement of SMEs.
Journal of International Business Studies, Vol. 37, No. 3 (May, 2006), pp. 340-351, Pilgrave
Macmillan Journals

64
Gemser, G. - Brand M. J. - Sorge A. (2004) Exploring the Internationalisation Process of Small
Businesses: A Study of Dutch Old and New Economy Firms, Management International Review,
p.44-150.
Guillén M.F., García Canal E. (2007): La expansión internacional de la empresa españolauna nueva
base de datos sistemática. Información Comercial Española, ICE, La Internacionalización de la
Empresa Espanola, Noviembre-Diciembre 2007. N.º 839
Held, D. and al. (2005) Global Transformations, Polity Press, Cambridge.
Hernandez Gasción J.M., Fontrodona Francolí J., Pezzi A. (2005): Map of Local Industrial Production
Systems in Catalonia, Generalitat de Catalunya, Department de Treball i Indústriam Secretaria
d’Indústria, October 2005
Hernandez Gasción J.M., Pezzi A., Soy i Casals A. (2010): Clusters y competitividad: el caso de
Cataluna (1993-2010), Generalitat de Catalunya, Department d’Innovació, Universitats y Empresa,
diciembre 2010
Incze, Emma (2008) A vállalatok nemzetközi terjeszkedésének jellemzıi in Versenyben a világgal 2004-
2006 Gazdasági versenyképességünk vállalati nézıpontból (research paper No. 18.)
Inzelt Annamária (2010) A finanszírozói magatartás változására is szükség van, downloaded: 12 August
2011, http://www.euractiv.hu/nyomtathato-verzio/interju/inzelt-annamaria-a-finanszirozoi-magatartas-
valtozasara-is-szkseg-van-002736
Iyigun M.F. y Owen A.L. (1999): Entrepreneurs, Professionals, and Growth. Journal of Economic
Growth, 4 (2), pp. 213-232., 1999
Johanson J., Vahlne J.E. (1977). The internationalization process of the firm: A model of knowledge
development and increasing foreign market commitments. Journal of International Business Studies,
8 (1), 23-32.
Johanson J., Vahlne J.E. (1990). The mechanism of internationalization. International Marketing Review,
7(4), 11–24.
Johanson, J. - Vahlne, J-E. (1977) The Internationalisation Process of the Firm, Journal of International
Business Studies, Vol. 8. Spring/Summer, p.23-32.
Jones, M.V. - Crick, D. (2004) Internationalising High-Technology - Based UK Firms’ Information –
Gathering Activities, Journal of Small Business and Enterprise Development, Vol.11 No.1, p.84-94.

65
Kállay László – Lengyel Imre (2008) A magyar kis- és középvállalkozások nemzetköziesedésének fıbb
jellemzıi az Európai Uniós csatlakozás elıtt, Vállalkozás és innováció, Vol. 2. No.I., p.54 – 76.
Kállay, László – Kıhegyi, Kálmán - Kissné Kovács, Eszter – Maszlag, Ludmilla ed. (2008): A kis- és
középvállalkozások helyzete 2007. Éves jelentés. Gazdasági és Közlekedési Minisztérium.
Kállay, László – Kıhegyi, Kálmán - Kissné Kovács, Eszter – Maszlag, Ludmilla ed. (2010): A kis- és
középvállalkozások helyzete 2009. Éves jelentés. Gazdasági és Közlekedési Minisztérium.
Kopint-Datorg Konjunktúra Kutatási Alapítvány (2000) A magyar gazdaság európai felzárkózásának
nemzetközi környezete és belsı feltételei, downloaded: 25 August 2011
http://telnet.datanet.hu/~kopint/alapitvany-old/kutatas-01-04.html
Leonidou, L. C. et Katsikeas, C. S. (1996) The Export Development Process an Integrative Review of
Empirical Models, Journal of International Business Studies, Vol. 27,
López, J. (2006): La Internacionalización de la empresa manufacturera española: Efectos del capital
humano genérico y específico. Cuadernos de Gestión, Vol 6, nº 1
Luostarinen, R. (1994) Internationalisation of Finnish Firms and their Response to Global Challenges.
World Institute for Development Economics Research. WIDER, Helsinki.
Madrid-Guijarro A., Garcia D., Van Auken H. (2009): Barriers to Innovation among Spanish
Manufacturing SMEs. Journal of Small Business Management 2009 47(4), pp. 465–488
Martínez Rodríguez S. (2010): Competitividad, innovación y empresas de alto crecimiento en Espana,
Dirección General de Política de la Pequeña y Mediana Empresa, MINISTERIO DE INDUSTRIA,
TURISMO Y COMERCIO Septiembre de 2010
Menéndez, S. (2005): “Growth and Internationalisation of Family Businesses”, International Journal of
Globalisation and Small Business, 1(2), pp. 122–133.
Merino, F. (2004): “Firms’ productivity and internationalization: a statistical dominance test”, Applied
Economics Letters, 11, pp. 851–854.
Meyer , K. – Skak, A. (2002) Networks, Serendipity and SME Entry into Eastern Europe, European
Management Journal, Vol.20. No.2., p.179-188.
MITC (2007): Informe de Actividades de la Dirección General de Política de la Pequeña y Mediana
Empresa, MINISTERIO DE INDUSTRIA, TURISMO Y COMERCIO, 2007
MITC (2010): Retrato de la PYME 2011, Subdirección General de Fomento Empresarial, MINISTERIO
DE INDUSTRIA, TURISMO Y COMERCIO, 2010

66
MITC (2011): Programa de apoyo a proyectos de inversión (PAPI) del Instituto Español de Comercio
Exterior (ICEX), MINISTERIO DE INDUSTRIA, TURISMO Y COMERCIO
http://www.icex.es/icex/cda/controller/pageICEX/0,6558,5518394_5529462_5586834_3015453_0_-
1,00.html (17.08.2011.)
Morga-Thomas, A. and Jones, M.V. (2009) Post-entry Internationalization Dynamics, Differences
between SMEs in the Development Speed of their International Sales, International Small Business
Journal, Vol.27 No.1, p.71-97.
Nello O. (2010): The challenges of urban renewal. Ten lessons from the Catalan experience, Análise
Social, vol. XLV (197), 2010, 685-715
Neumanné Virág Ildikó (2008) A magyar kis- és középvállalkozások exporttevékenysége, Summary of
International Conference on Management, Enterprise and Benchmarking, 30-31 May 2008.,
Budapest, p.411-423.
NGM: A kis- és középvállalkozások helyzete 2009, Éves jelentés, Nemzetgazdasági Minisztérium,
Budapest, 2010
O’Brian Robert – Williams, Mark (2004): Global Political Economy: Evolution and Dynamics. Palgrave
Macmillan, Basingstoke
OECD (1977): Economic Outlook, No. 22, December 1977, OECD, Paris.
OECD (2008): Removing Barriers to SME Access to International Markets, OECD 2008.
OECD (2009a): “Top Barriers and Drivers to SME Internationalisation”, Report by the OECD Working
Party on SMEs and Entrepreneurship, OECD 2009.
OECD (2009b): Promoting entrepreneurship, employment and business competitiveness – The
Experience of Barcelona. LEED Program, OECD, 2009
http://www.barcelonactiva.cat/barcelonactiva/images/en/Estudi%20BA_Promoting_tcm84-50466.pdf
(17.08.2011.)
Okorafo S.C. (1999): Internationalisation of family businesses: Evidence from NorthwestOhio, USA.
Family Business Review 12. pp147-158.
Outlook for 2010-14 Spain, Country Report October 2010, The Economist Intelligence Unit Limited 2010
p. 517-551.
Palánkai Tibor, Kengyel Ákos, Kutasi Gábor, Benczes István és Nagy Sándor Gyula (2011) A globális
és regionális integráció gazdaságtana, Akadémiai Kiadó, Budapest.

67
Papanek, Gábor (2010) A gyorsan növekvı magyar kis- és középvállalatok a gazdaság motorjai.
Közgazdasági szemle. LVII. évf. 2010. április.
Pénzügykutató ZRt. (2010) A hazai kis- és középvállalkozások esélyei a nemzetköziesedı
tudásgazdaságok korában, downloaded: 14 August 2011, http://www.penzugykutato.hu/hu/node/613
Pénzügykutató ZRt. (2010) Biotechnológiai kis- és középvállalkozások a nemzetköziesedı
tudásháromszögben, downloaded: 16 August 2011, http://www.penzugykutato.hu/hu/node/800
Pénzügykutató ZRt. (2010) Kis és középvállalkozások válaszúton: versenyképesség, innováció,
nemzetköziesedés, downloaded: 16 August 2011, http://www.penzugykutato.hu/hu/node/802
PIMEC (2010): Anuari de la PIME Catalana 2010. Petita i Mitjana Empresa de Catalunya, Barcelona,
2010
Pitti Zoltán (2011) A gazdasági teljesítmények vállalkozási méretfüggı jellemzıi Magyarországon, Köz-
Gazdaság, Vol. 06., No.3.
Sass Magdolna (2010) Kis és közepes mérető vállalatok nemzetköziesedése az orvosimőszer-gyártás
ágazatban: Magyarország példája, Istitute of Economics, Hungary Academy of Sciences, Budapest,
p.1-73.
Szerb László – Márkus Gábor (2008) Nemzetköziesedési tendenciák a kis- és középes mérető
vállalatok körében Magyarországon a 2000-es évek közepén, Vállalkozás és innováció, Vol.2. No.2.,
p.36 – 58.
The Gallup Organization (2007) Survey of the Observatory of European SMEs, Flash Eurobarometer
Series #196 – Enterprise Observatory Survey.
World Investment Report, U.N. New York, Geneva. 2007, 2009.
Zádor, M. (2001) A világkereskedelem legújabb tendenciái és az Európai Unió pozíciója. II. Bıvülı
Európa. Ecostat. IV. negyedév. 8. szám.
Quintana Navío J. (2007): La internacionalización de la empresa familiar española. Información
Comercial Española, ICE, La Internacionalización de la Empresa Espanola Noviembre-Diciembre
2007. N.º 839
Rialp A., Rialp J., Knight G.A. (2010): La vocación global de los nuevos modelos de PYMES – el caso
de las empresas Born Globals. Revista Economia Industrial, Núm. 375. 2010/1,
Rubio Bañón A., Aragón Sánchez A. (2006): Competitividad y recursos estratégicos en las pymes.
Revista de Empresa Nº17 Julio - Septiembre 2006

68
Santiso Guimaras J. (2007): La internacionalización de las empresas españolas: hitos y retos,
Información Comercial Española, ICA, La Internacionalización de la Empresa Espanola Noviembre-
Diciembre 2007. N.º 839
Segarra-Blasco A. (2010): Innovation and productivity in manufacturing and service firms in Catalonia: a
regional approach. Economics of Innovation and New Technology, Vol. 19, No. 3, April 2010, 233–
258
UNCTAD (2010): World Investment Report 2010, UNCTAD
Yserte G.R., Pindado F.P. (2010): Estretegias regionales para la promoción de la competitividad
empresarial. Revista Economia Industrial, Núm. 375. 2010/1,
Ward J.L. (1998): Growing of family business: Special challenges and best practices. Family Business
Review, 10. pp 323-337.
Jelen tanulmány a VERSENYKÉPESSÉG KUTATÁS MŐHELYTANULMÁNYSOROZAT kötetét képezi. BCE Versenyképesség Kutató Központ Kiadásért felelıs: Chikán Attila igazgató
ISNN 1787-6915