tmus q1 2015 investor factbok
TRANSCRIPT

0
1
T-Mobile US, Inc. Investor Factbook T-Mobile US Reports First Quarter 2015 Results Strong Start to the Year with 1 Million Postpaid Phone Net Adds and Record Low Branded Postpaid Phone Churn
—John Legere President and CEO of T-Mobile
First Quarter 2015 Highlights: Continued subscriber momentum and record low churn for the fastest growing wireless company in America:
1.8 million total net adds – 8th consecutive quarter over 1 million 1.1 million branded postpaid net adds – 3rd consecutive quarter over 1 million 1.0 million branded postpaid phone net adds – expect to capture all of industry postpaid phone growth in
1Q15 Best-ever branded postpaid phone churn of 1.30%, down 43 bps QoQ and 17 bps YoY
Strong financial performance with industry-leading growth in revenues and Adjusted EBITDA:
Service revenues of $5.8 billion, up 9.0% YoY Total revenues of $7.8 billion, up 13.1% YoY Adjusted EBITDA of $1.4 billion, up 27.6% YoY, even with investment in customer growth
Adjusted EBITDA margin of 24%, up from 20% in 1Q14
Continued expansion of the nation’s fastest 4G LTE network:
275 million 4G LTE POPs at end of 1Q15 – targeting 300 million by year-end 2015 157 Wideband LTE market areas – more than 200 market areas targeted by year-end 2015 700 MHz A-Block spectrum already deployed in 55 market areas
Raising subscriber outlook for 2015 while maintaining Adjusted EBITDA target:
Guidance range for branded postpaid net adds increased to 3.0 to 3.5 million Maintaining target of $6.8 to $7.2 billion of Adjusted EBITDA Maintaining target of $4.4 to $4.7 billion of cash capex
“We’ve had eight consecutive quarters with more than one million total net customer additions proving that customers want value. We expect to once again capture 100% of the industry’s postpaid phone growth in Q1 and we’ve done it while delivering an all-time record low 1.3% churn. #WeWon’tStop.”

2
CUSTOMER METRICS
Branded Postpaid Customers
Branded postpaid net customer additions were 1,125,000 in the first quarter of 2015 compared to 1,276,000 in the fourth quarter of 2014 and 1,323,000 in the first quarter of 2014. This marked the third consecutive quarter in which branded postpaid net customer additions were greater than one million, a clear indicator of the continued success of the Un-carrier initiatives and strong uptake of promotions for services and devices.
T-Mobile is expected to again lead the industry in branded postpaid phone net customer additions with 991,000 in the first quarter of 2015, compared to 1,037,000 in the fourth quarter of 2014 and 1,256,000 in the first quarter of 2014. Branded postpaid phone gross additions in the first quarter of 2015 declined by 18% on a sequential basis due to heightened seasonal and competitive activity in the fourth quarter of 2014, and were down 14% year-over-year primarily due to the introduction of Un-carrier 4.0, T-Mobile’s Early Termination Fee (ETF) offer, in the first quarter of 2014. T-Mobile is expected to have captured all of the industry’s postpaid phone growth in the first quarter of 2015.
Branded postpaid mobile broadband net customer additions were 134,000 in the first quarter of 2015, compared to 239,000 in the fourth quarter of 2014 and 67,000 in the first quarter of 2014.
Branded postpaid phone churn was 1.30% in the first quarter of 2015, down 43 basis points compared to 1.73% in the fourth quarter of 2014 and down 17 basis points compared to 1.47% in the first quarter of 2014. This quarter marked the best ever branded postpaid phone churn performance in the Company’s history. The sequential improvement was due to seasonal factors as well as a reduction in competitive activity compared to the fourth quarter of 2014. Additionally, the sequential and year-over-year decline in churn reflects ongoing improvements in the Company’s network, customer service, and the overall value of its offerings in the marketplace, resulting in increased customer satisfaction and loyalty.
1,256 579 1,175 1,037 991
67 329 204
239 134
1Q14 2Q14 3Q14 4Q14 1Q15
Total Branded Postpaid Net Adds (in thousands)
Phone Mobile Broadband
1,323 908 1,379 1,276 1,125
1.47% 1.48% 1.64% 1.73%
1.30%
1Q14 2Q14 3Q14 4Q14 1Q15
Branded Postpaid Phone Churn
3
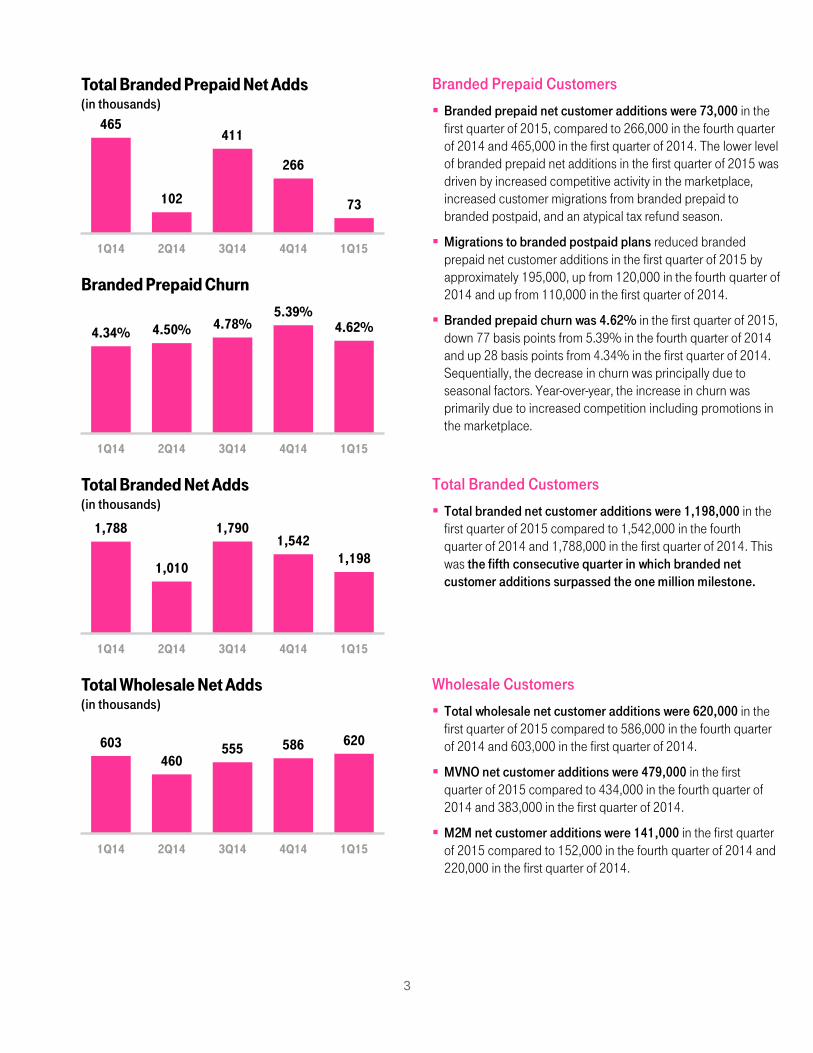
Branded Prepaid Customers
Branded prepaid net customer additions were 73,000 in the first quarter of 2015, compared to 266,000 in the fourth quarter of 2014 and 465,000 in the first quarter of 2014. The lower level of branded prepaid net additions in the first quarter of 2015 was driven by increased competitive activity in the marketplace, increased customer migrations from branded prepaid to branded postpaid, and an atypical tax refund season.
Migrations to branded postpaid plans reduced branded prepaid net customer additions in the first quarter of 2015 by approximately 195,000, up from 120,000 in the fourth quarter of 2014 and up from 110,000 in the first quarter of 2014.
Branded prepaid churn was 4.62% in the first quarter of 2015, down 77 basis points from 5.39% in the fourth quarter of 2014 and up 28 basis points from 4.34% in the first quarter of 2014. Sequentially, the decrease in churn was principally due to seasonal factors. Year-over-year, the increase in churn was primarily due to increased competition including promotions in the marketplace.
Total Branded Customers
Total branded net customer additions were 1,198,000 in the first quarter of 2015 compared to 1,542,000 in the fourth quarter of 2014 and 1,788,000 in the first quarter of 2014. This was the fifth consecutive quarter in which branded net customer additions surpassed the one million milestone.
Wholesale Customers
Total wholesale net customer additions were 620,000 in the first quarter of 2015 compared to 586,000 in the fourth quarter of 2014 and 603,000 in the first quarter of 2014.
MVNO net customer additions were 479,000 in the first quarter of 2015 compared to 434,000 in the fourth quarter of 2014 and 383,000 in the first quarter of 2014.
M2M net customer additions were 141,000 in the first quarter of 2015 compared to 152,000 in the fourth quarter of 2014 and 220,000 in the first quarter of 2014.
465
102
411
266
73
1Q14 2Q14 3Q14 4Q14 1Q15
Total Branded Prepaid Net Adds (in thousands)
4.34% 4.50% 4.78% 5.39%
4.62%
1Q14 2Q14 3Q14 4Q14 1Q15
Branded Prepaid Churn
1,788
1,010
1,790 1,542
1,198
1Q14 2Q14 3Q14 4Q14 1Q15
Total Branded Net Adds (in thousands)
603 460
555 586 620
1Q14 2Q14 3Q14 4Q14 1Q15
Total Wholesale Net Adds (in thousands)
4
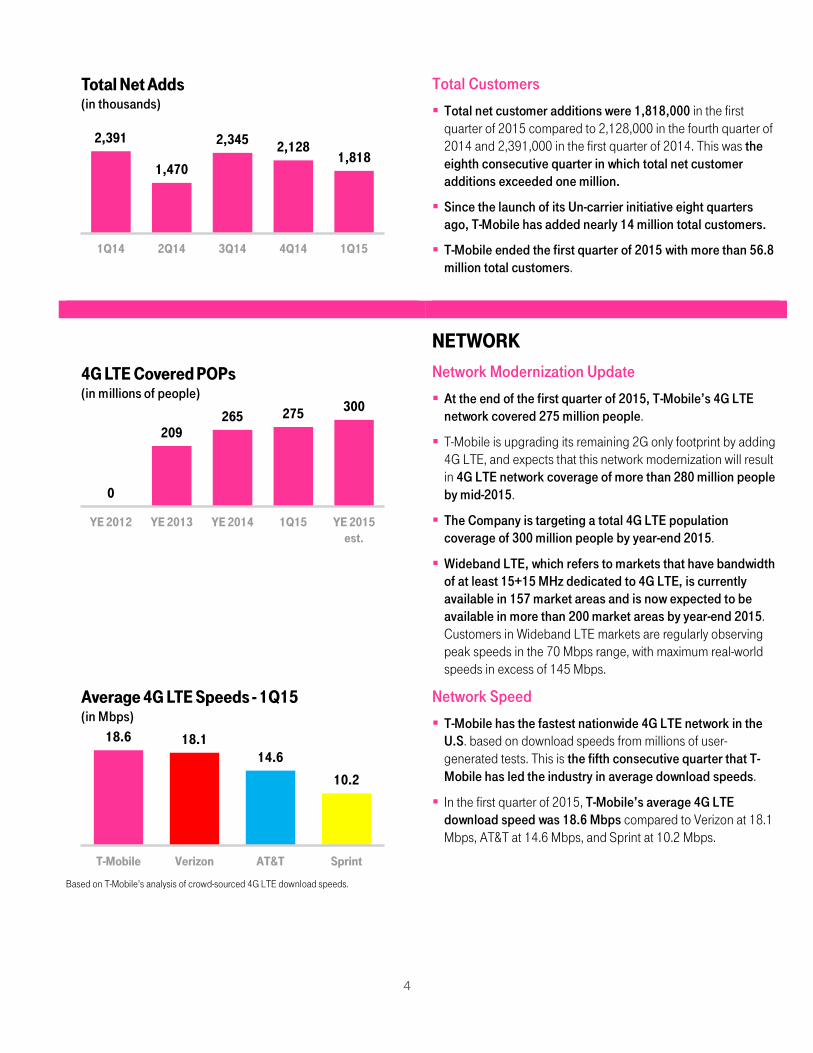
Total Customers
Total net customer additions were 1,818,000 in the first quarter of 2015 compared to 2,128,000 in the fourth quarter of 2014 and 2,391,000 in the first quarter of 2014. This was the eighth consecutive quarter in which total net customer additions exceeded one million.
Since the launch of its Un-carrier initiative eight quarters ago, T-Mobile has added nearly 14 million total customers.
T-Mobile ended the first quarter of 2015 with more than 56.8 million total customers.
NETWORK
Network Modernization Update
At the end of the first quarter of 2015, T-Mobile’s 4G LTE network covered 275 million people.
T-Mobile is upgrading its remaining 2G only footprint by adding 4G LTE, and expects that this network modernization will result in 4G LTE network coverage of more than 280 million people by mid-2015.
The Company is targeting a total 4G LTE population coverage of 300 million people by year-end 2015.
Wideband LTE, which refers to markets that have bandwidth of at least 15+15 MHz dedicated to 4G LTE, is currently available in 157 market areas and is now expected to be available in more than 200 market areas by year-end 2015. Customers in Wideband LTE markets are regularly observing peak speeds in the 70 Mbps range, with maximum real-world speeds in excess of 145 Mbps.
Based on T-Mobile’s analysis of crowd-sourced 4G LTE download speeds.
Network Speed
T-Mobile has the fastest nationwide 4G LTE network in the U.S. based on download speeds from millions of user- generated tests. This is the fifth consecutive quarter that T-Mobile has led the industry in average download speeds.
In the first quarter of 2015, T-Mobile’s average 4G LTE download speed was 18.6 Mbps compared to Verizon at 18.1 Mbps, AT&T at 14.6 Mbps, and Sprint at 10.2 Mbps.
2,391
1,470
2,345 2,128
1,818
1Q14 2Q14 3Q14 4Q14 1Q15
Total Net Adds (in thousands)
0
209 265 275 300
YE 2012 YE 2013 YE 2014 1Q15 YE 2015est.
4G LTE Covered POPs (in millions of people)
18.6 18.1 14.6
10.2
T-Mobile Verizon AT&T Sprint
Average 4G LTE Speeds - 1Q15 (in Mbps)
5
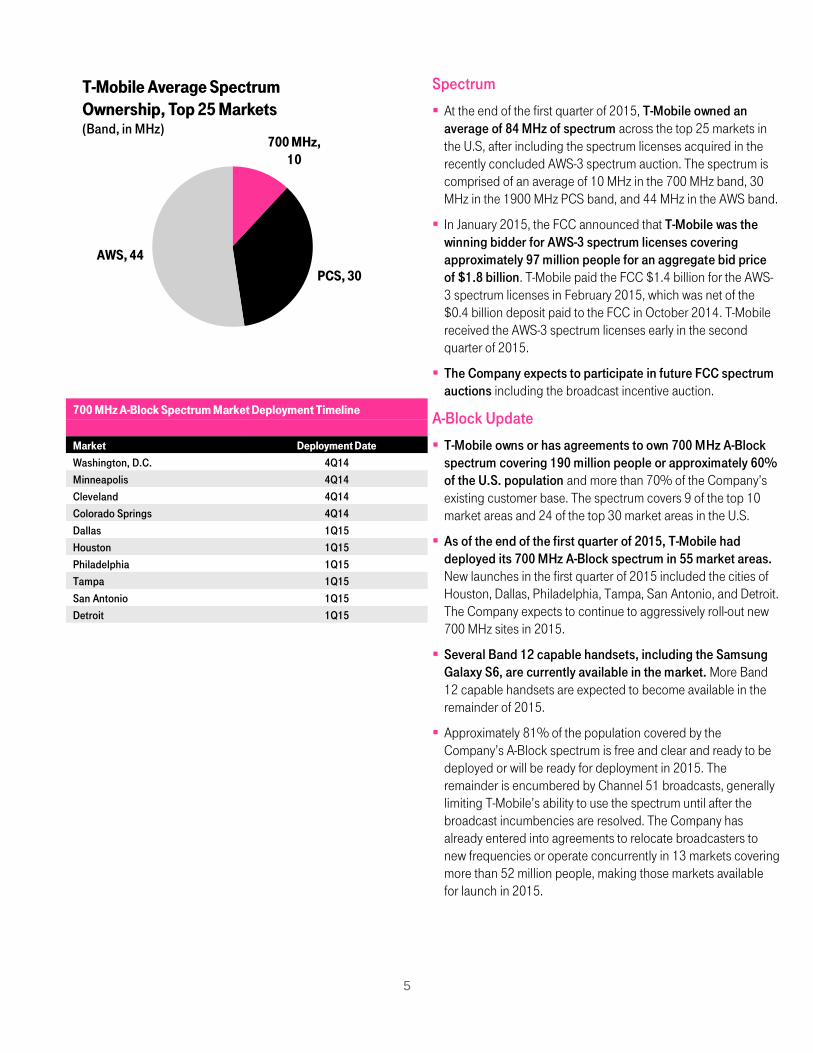
Spectrum
At the end of the first quarter of 2015, T-Mobile owned an average of 84 MHz of spectrum across the top 25 markets in the U.S, after including the spectrum licenses acquired in the recently concluded AWS-3 spectrum auction. The spectrum is comprised of an average of 10 MHz in the 700 MHz band, 30 MHz in the 1900 MHz PCS band, and 44 MHz in the AWS band.
In January 2015, the FCC announced that T-Mobile was the winning bidder for AWS-3 spectrum licenses covering approximately 97 million people for an aggregate bid price of $1.8 billion. T-Mobile paid the FCC $1.4 billion for the AWS-3 spectrum licenses in February 2015, which was net of the $0.4 billion deposit paid to the FCC in October 2014. T-Mobile received the AWS-3 spectrum licenses early in the second quarter of 2015.
The Company expects to participate in future FCC spectrum auctions including the broadcast incentive auction.
700 MHz A-Block Spectrum Market Deployment Timeline
Market Deployment Date
Washington, D.C. 4Q14
Minneapolis 4Q14
Cleveland 4Q14
Colorado Springs 4Q14
Dallas 1Q15
Houston 1Q15
Philadelphia 1Q15
Tampa 1Q15
San Antonio 1Q15
Detroit 1Q15
A-Block Update
T-Mobile owns or has agreements to own 700 MHz A-Block spectrum covering 190 million people or approximately 60% of the U.S. population and more than 70% of the Company’s existing customer base. The spectrum covers 9 of the top 10 market areas and 24 of the top 30 market areas in the U.S.
As of the end of the first quarter of 2015, T-Mobile had deployed its 700 MHz A-Block spectrum in 55 market areas. New launches in the first quarter of 2015 included the cities of Houston, Dallas, Philadelphia, Tampa, San Antonio, and Detroit. The Company expects to continue to aggressively roll-out new 700 MHz sites in 2015.
Several Band 12 capable handsets, including the Samsung Galaxy S6, are currently available in the market. More Band 12 capable handsets are expected to become available in the remainder of 2015.
Approximately 81% of the population covered by the Company’s A-Block spectrum is free and clear and ready to be deployed or will be ready for deployment in 2015. The remainder is encumbered by Channel 51 broadcasts, generally limiting T-Mobile’s ability to use the spectrum until after the broadcast incumbencies are resolved. The Company has already entered into agreements to relocate broadcasters to new frequencies or operate concurrently in 13 markets covering more than 52 million people, making those markets available for launch in 2015.
700 MHz, 10
PCS, 30
AWS, 44
T-Mobile Average Spectrum Ownership, Top 25 Markets (Band, in MHz)
6
METROPCS
Integration and Expansion
The MetroPCS customer base continues to rapidly migrate off the legacy CDMA network. Currently, less than 500,000 customers remain on the MetroPCS CDMA network.
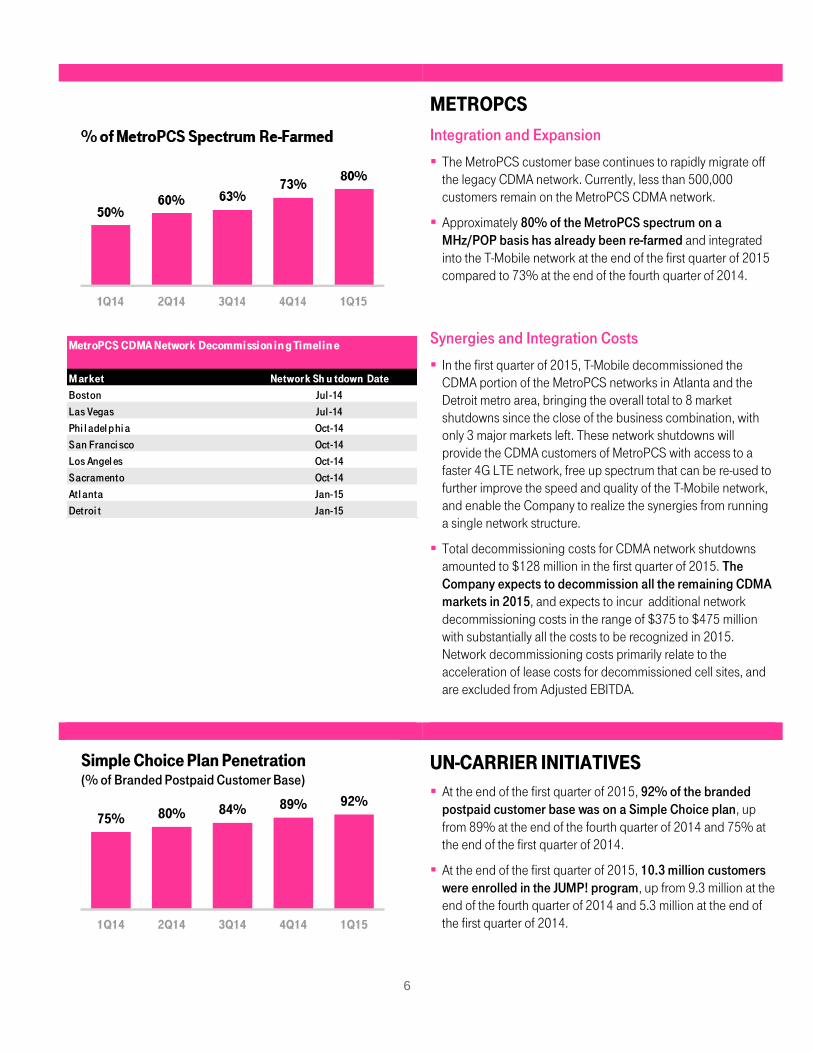
Approximately 80% of the MetroPCS spectrum on a MHz/POP basis has already been re-farmed and integrated into the T-Mobile network at the end of the first quarter of 2015 compared to 73% at the end of the fourth quarter of 2014.
Synergies and Integration Costs
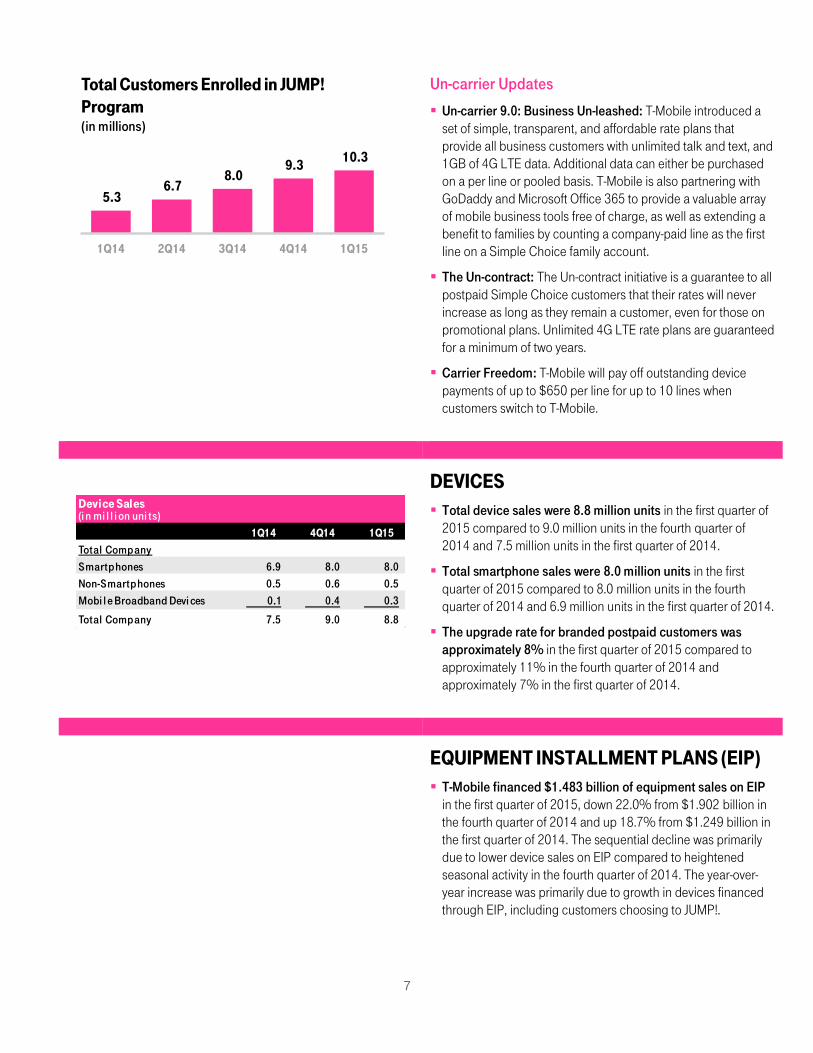
In the first quarter of 2015, T-Mobile decommissioned the CDMA portion of the MetroPCS networks in Atlanta and the Detroit metro area, bringing the overall total to 8 market shutdowns since the close of the business combination, with only 3 major markets left. These network shutdowns will provide the CDMA customers of MetroPCS with access to a faster 4G LTE network, free up spectrum that can be re-used to further improve the speed and quality of the T-Mobile network, and enable the Company to realize the synergies from running a single network structure.
Total decommissioning costs for CDMA network shutdowns amounted to $128 million in the first quarter of 2015. The Company expects to decommission all the remaining CDMA markets in 2015, and expects to incur additional network decommissioning costs in the range of $375 to $475 million with substantially all the costs to be recognized in 2015. Network decommissioning costs primarily relate to the acceleration of lease costs for decommissioned cell sites, and are excluded from Adjusted EBITDA.
UN-CARRIER INITIATIVES
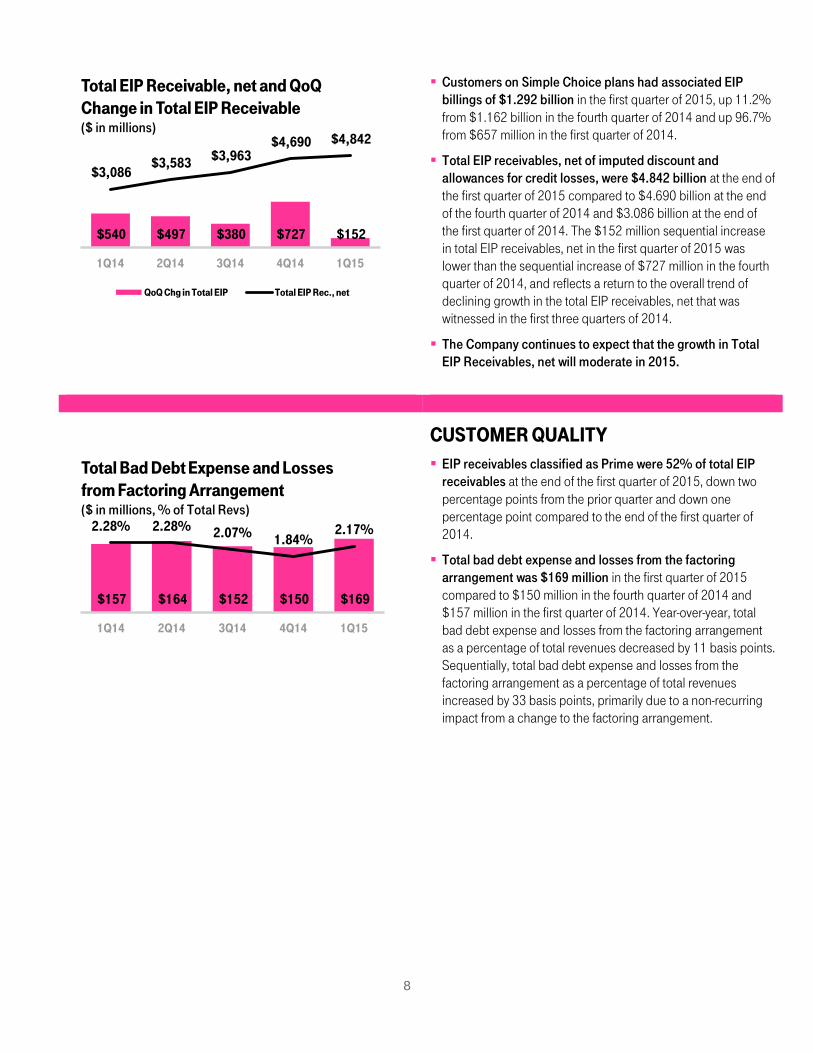
At the end of the first quarter of 2015, 92% of the branded postpaid customer base was on a Simple Choice plan, up from 89% at the end of the fourth quarter of 2014 and 75% at the end of the first quarter of 2014.
At the end of the first quarter of 2015, 10.3 million customers were enrolled in the JUMP! program, up from 9.3 million at the end of the fourth quarter of 2014 and 5.3 million at the end of the first quarter of 2014.
M ar ket Networ k Sh u tdown Date
Boston Jul -14
Las Vegas Jul -14
Phi l adel phi a Oct-14
San Franci sco Oct-14
Los Angel es Oct-14
Sacramento Oct-14
Atl anta Jan-15
Detroi t Jan-15
MetroPCS CDMA Network Decommi ssi on i n g Ti mel i n e
75% 80% 84% 89% 92%
1Q14 2Q14 3Q14 4Q14 1Q15
Simple Choice Plan Penetration (% of Branded Postpaid Customer Base)
7
Un-carrier Updates
Un-carrier 9.0: Business Un-leashed: T-Mobile introduced a set of simple, transparent, and affordable rate plans that provide all business customers with unlimited talk and text, and 1GB of 4G LTE data. Additional data can either be purchased on a per line or pooled basis. T-Mobile is also partnering with GoDaddy and Microsoft Office 365 to provide a valuable array of mobile business tools free of charge, as well as extending a benefit to families by counting a company-paid line as the first line on a Simple Choice family account.
The Un-contract: The Un-contract initiative is a guarantee to all postpaid Simple Choice customers that their rates will never increase as long as they remain a customer, even for those on promotional plans. Unlimited 4G LTE rate plans are guaranteed for a minimum of two years.
Carrier Freedom: T-Mobile will pay off outstanding device payments of up to $650 per line for up to 10 lines when customers switch to T-Mobile.
DEVICES
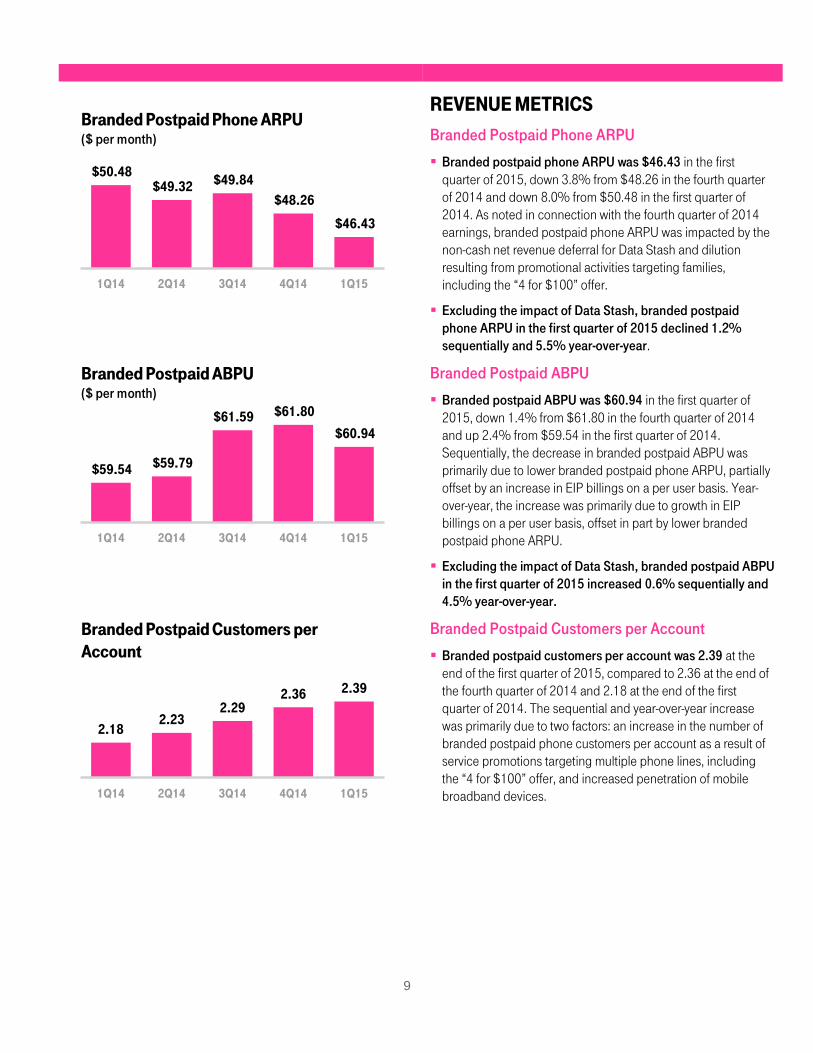
Total device sales were 8.8 million units in the first quarter of 2015 compared to 9.0 million units in the fourth quarter of 2014 and 7.5 million units in the first quarter of 2014.
Total smartphone sales were 8.0 million units in the first quarter of 2015 compared to 8.0 million units in the fourth quarter of 2014 and 6.9 million units in the first quarter of 2014.
The upgrade rate for branded postpaid customers was approximately 8% in the first quarter of 2015 compared to approximately 11% in the fourth quarter of 2014 and approximately 7% in the first quarter of 2014.
EQUIPMENT INSTALLMENT PLANS (EIP)
T-Mobile financed $1.483 billion of equipment sales on EIP in the first quarter of 2015, down 22.0% from $1.902 billion in the fourth quarter of 2014 and up 18.7% from $1.249 billion in the first quarter of 2014. The sequential decline was primarily due to lower device sales on EIP compared to heightened seasonal activity in the fourth quarter of 2014. The year-over-year increase was primarily due to growth in devices financed through EIP, including customers choosing to JUMP!.
5.3 6.7
8.0 9.3
10.3
1Q14 2Q14 3Q14 4Q14 1Q15
Total Customers Enrolled in JUMP! Program (in millions)
Devi ce Sal es(i n mi l l i on uni ts)
1Q14 4Q14 1Q15
Total Company
Smartphones 6.9 8.0 8.0
Non-Smartphones 0.5 0.6 0.5
Mobi l e Broadband Devi ces 0.1 0.4 0.3
Total Company 7.5 9.0 8.8
8
Customers on Simple Choice plans had associated EIP billings of $1.292 billion in the first quarter of 2015, up 11.2% from $1.162 billion in the fourth quarter of 2014 and up 96.7% from $657 million in the first quarter of 2014.
Total EIP receivables, net of imputed discount and allowances for credit losses, were $4.842 billion at the end of the first quarter of 2015 compared to $4.690 billion at the end of the fourth quarter of 2014 and $3.086 billion at the end of the first quarter of 2014. The $152 million sequential increase in total EIP receivables, net in the first quarter of 2015 was lower than the sequential increase of $727 million in the fourth quarter of 2014, and reflects a return to the overall trend of declining growth in the total EIP receivables, net that was witnessed in the first three quarters of 2014.
The Company continues to expect that the growth in Total EIP Receivables, net will moderate in 2015.
CUSTOMER QUALITY
EIP receivables classified as Prime were 52% of total EIP receivables at the end of the first quarter of 2015, down two percentage points from the prior quarter and down one percentage point compared to the end of the first quarter of 2014.
Total bad debt expense and losses from the factoring arrangement was $169 million in the first quarter of 2015 compared to $150 million in the fourth quarter of 2014 and $157 million in the first quarter of 2014. Year-over-year, total bad debt expense and losses from the factoring arrangement as a percentage of total revenues decreased by 11 basis points. Sequentially, total bad debt expense and losses from the factoring arrangement as a percentage of total revenues increased by 33 basis points, primarily due to a non-recurring impact from a change to the factoring arrangement.
$540 $497 $380 $727 $152
$3,086 $3,583 $3,963
$4,690 $4,842
1Q14 2Q14 3Q14 4Q14 1Q15
Total EIP Receivable, net and QoQ Change in Total EIP Receivable ($ in millions)
QoQ Chg in Total EIP Total EIP Rec., net
$157 $164 $152 $150 $169
2.28% 2.28% 2.07% 1.84% 2.17%
1Q14 2Q14 3Q14 4Q14 1Q15
Total Bad Debt Expense and Losses from Factoring Arrangement ($ in millions, % of Total Revs)
9
REVENUE METRICS
Branded Postpaid Phone ARPU
Branded postpaid phone ARPU was $46.43 in the first quarter of 2015, down 3.8% from $48.26 in the fourth quarter of 2014 and down 8.0% from $50.48 in the first quarter of 2014. As noted in connection with the fourth quarter of 2014 earnings, branded postpaid phone ARPU was impacted by the non-cash net revenue deferral for Data Stash and dilution resulting from promotional activities targeting families, including the “4 for $100” offer.
Excluding the impact of Data Stash, branded postpaid phone ARPU in the first quarter of 2015 declined 1.2% sequentially and 5.5% year-over-year.
Branded Postpaid ABPU
Branded postpaid ABPU was $60.94 in the first quarter of 2015, down 1.4% from $61.80 in the fourth quarter of 2014 and up 2.4% from $59.54 in the first quarter of 2014. Sequentially, the decrease in branded postpaid ABPU was primarily due to lower branded postpaid phone ARPU, partially offset by an increase in EIP billings on a per user basis. Year-over-year, the increase was primarily due to growth in EIP billings on a per user basis, offset in part by lower branded postpaid phone ARPU.
Excluding the impact of Data Stash, branded postpaid ABPU in the first quarter of 2015 increased 0.6% sequentially and 4.5% year-over-year.
Branded Postpaid Customers per Account
Branded postpaid customers per account was 2.39 at the end of the first quarter of 2015, compared to 2.36 at the end of the fourth quarter of 2014 and 2.18 at the end of the first quarter of 2014. The sequential and year-over-year increase was primarily due to two factors: an increase in the number of branded postpaid phone customers per account as a result of service promotions targeting multiple phone lines, including the “4 for $100” offer, and increased penetration of mobile broadband devices.
$50.48 $49.32 $49.84
$48.26
$46.43
1Q14 2Q14 3Q14 4Q14 1Q15
Branded Postpaid Phone ARPU ($ per month)
$59.54 $59.79
$61.59 $61.80
$60.94
1Q14 2Q14 3Q14 4Q14 1Q15
Branded Postpaid ABPU ($ per month)
2.18 2.23
2.29 2.36 2.39
1Q14 2Q14 3Q14 4Q14 1Q15
Branded Postpaid Customers per Account
10
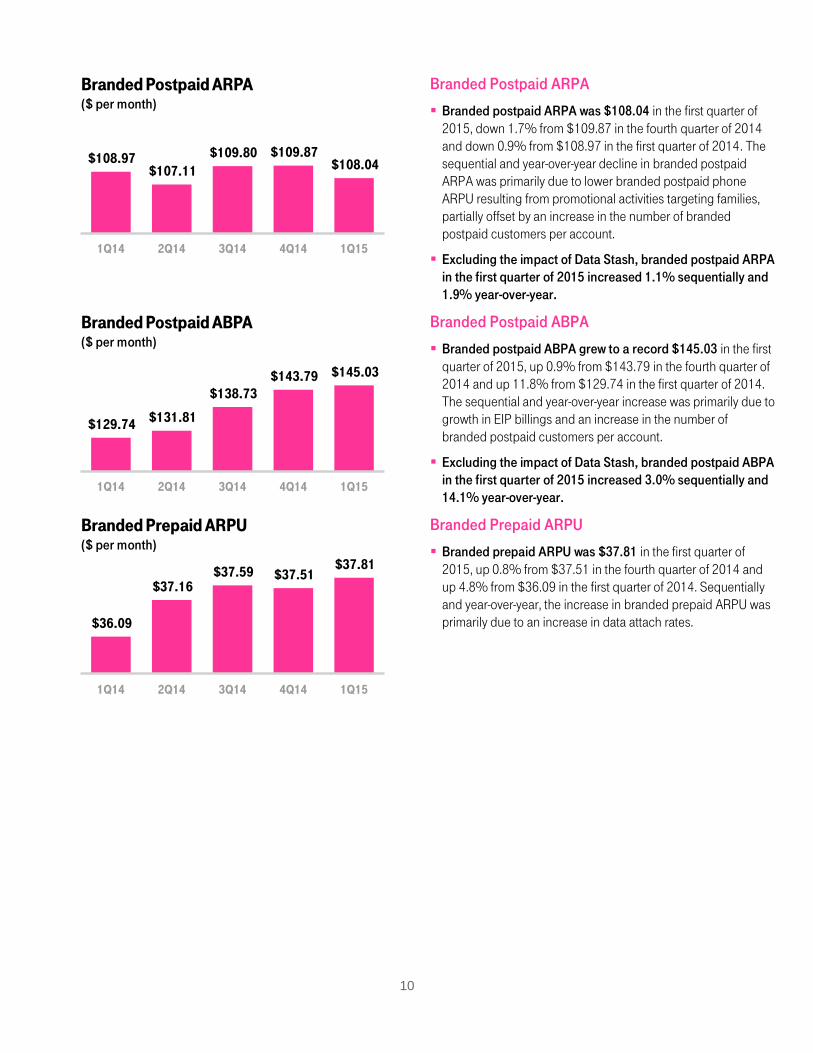
Branded Postpaid ARPA
Branded postpaid ARPA was $108.04 in the first quarter of 2015, down 1.7% from $109.87 in the fourth quarter of 2014 and down 0.9% from $108.97 in the first quarter of 2014. The sequential and year-over-year decline in branded postpaid ARPA was primarily due to lower branded postpaid phone ARPU resulting from promotional activities targeting families, partially offset by an increase in the number of branded postpaid customers per account.
Excluding the impact of Data Stash, branded postpaid ARPA in the first quarter of 2015 increased 1.1% sequentially and 1.9% year-over-year.
Branded Postpaid ABPA
Branded postpaid ABPA grew to a record $145.03 in the first quarter of 2015, up 0.9% from $143.79 in the fourth quarter of 2014 and up 11.8% from $129.74 in the first quarter of 2014. The sequential and year-over-year increase was primarily due to growth in EIP billings and an increase in the number of branded postpaid customers per account.
Excluding the impact of Data Stash, branded postpaid ABPA in the first quarter of 2015 increased 3.0% sequentially and 14.1% year-over-year.
Branded Prepaid ARPU
Branded prepaid ARPU was $37.81 in the first quarter of 2015, up 0.8% from $37.51 in the fourth quarter of 2014 and up 4.8% from $36.09 in the first quarter of 2014. Sequentially and year-over-year, the increase in branded prepaid ARPU was primarily due to an increase in data attach rates.
$108.97 $107.11
$109.80 $109.87 $108.04
1Q14 2Q14 3Q14 4Q14 1Q15
Branded Postpaid ARPA ($ per month)
$129.74 $131.81
$138.73 $143.79 $145.03
1Q14 2Q14 3Q14 4Q14 1Q15
Branded Postpaid ABPA ($ per month)
$36.09
$37.16 $37.59 $37.51
$37.81
1Q14 2Q14 3Q14 4Q14 1Q15
Branded Prepaid ARPU ($ per month)
11
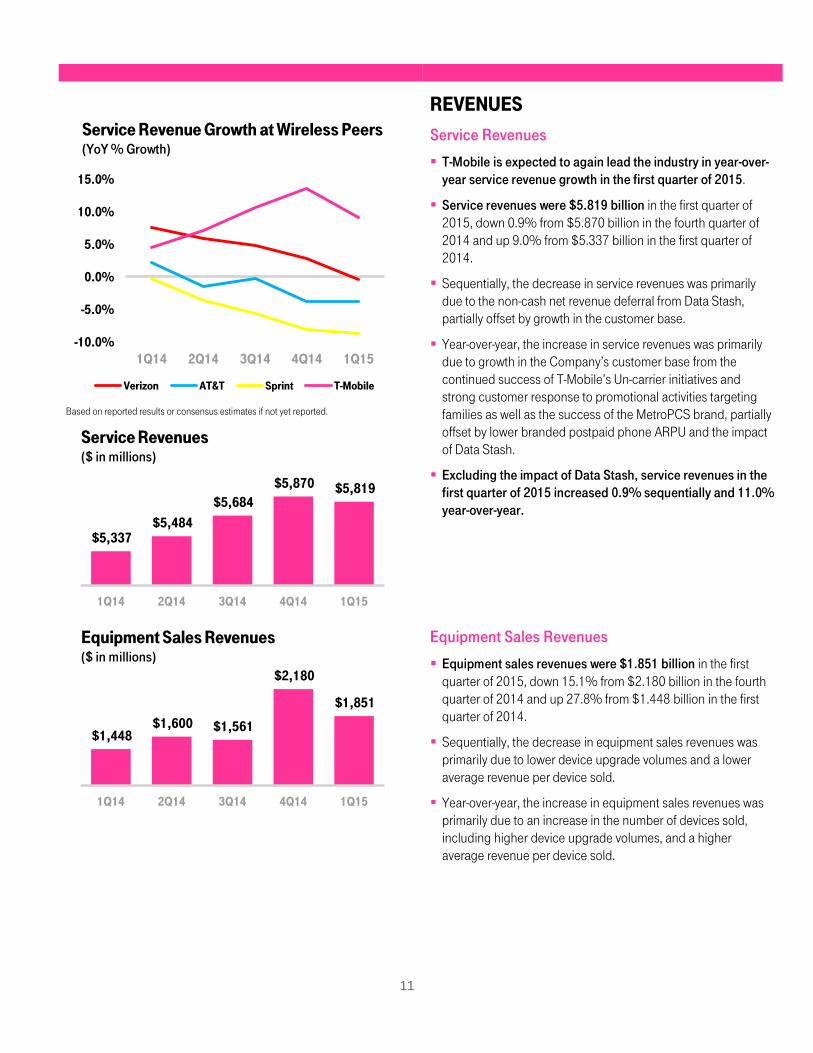
Service Revenue Growth at Wireless Peers (YoY % Growth)
Based on reported results or consensus estimates if not yet reported.
REVENUES
Service Revenues
T-Mobile is expected to again lead the industry in year-over-year service revenue growth in the first quarter of 2015.
Service revenues were $5.819 billion in the first quarter of 2015, down 0.9% from $5.870 billion in the fourth quarter of 2014 and up 9.0% from $5.337 billion in the first quarter of 2014.
Sequentially, the decrease in service revenues was primarily due to the non-cash net revenue deferral from Data Stash, partially offset by growth in the customer base.
Year-over-year, the increase in service revenues was primarily due to growth in the Company’s customer base from the continued success of T-Mobile’s Un-carrier initiatives and strong customer response to promotional activities targeting families as well as the success of the MetroPCS brand, partially offset by lower branded postpaid phone ARPU and the impact of Data Stash.
Excluding the impact of Data Stash, service revenues in the first quarter of 2015 increased 0.9% sequentially and 11.0% year-over-year.
Equipment Sales Revenues
Equipment sales revenues were $1.851 billion in the first quarter of 2015, down 15.1% from $2.180 billion in the fourth quarter of 2014 and up 27.8% from $1.448 billion in the first quarter of 2014.
Sequentially, the decrease in equipment sales revenues was primarily due to lower device upgrade volumes and a lower average revenue per device sold.
Year-over-year, the increase in equipment sales revenues was primarily due to an increase in the number of devices sold, including higher device upgrade volumes, and a higher average revenue per device sold.
-10.0%
-5.0%
0.0%
5.0%
10.0%
15.0%
1Q14 2Q14 3Q14 4Q14 1Q15
Verizon AT&T Sprint T-Mobile
$5,337 $5,484
$5,684
$5,870 $5,819
1Q14 2Q14 3Q14 4Q14 1Q15
Service Revenues ($ in millions)
$1,448 $1,600 $1,561
$2,180
$1,851
1Q14 2Q14 3Q14 4Q14 1Q15
Equipment Sales Revenues ($ in millions)
12
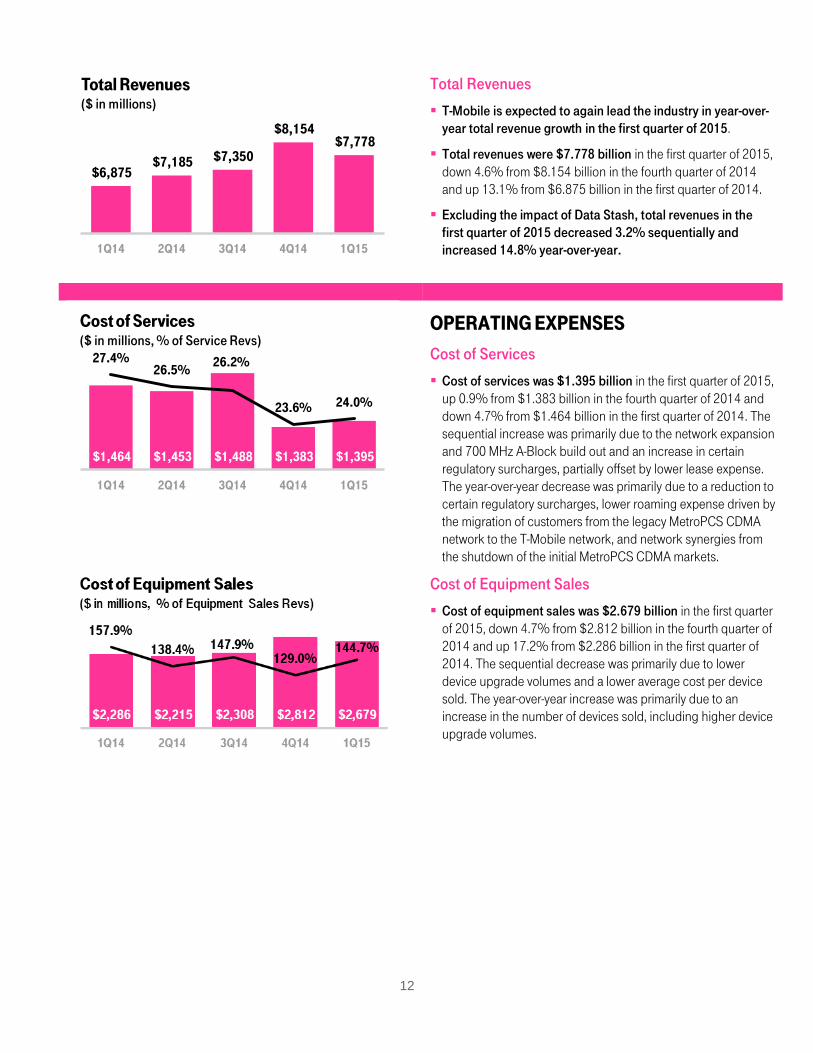
Total Revenues
T-Mobile is expected to again lead the industry in year-over-year total revenue growth in the first quarter of 2015.
Total revenues were $7.778 billion in the first quarter of 2015, down 4.6% from $8.154 billion in the fourth quarter of 2014 and up 13.1% from $6.875 billion in the first quarter of 2014.
Excluding the impact of Data Stash, total revenues in the first quarter of 2015 decreased 3.2% sequentially and increased 14.8% year-over-year.
OPERATING EXPENSES
Cost of Services
Cost of services was $1.395 billion in the first quarter of 2015, up 0.9% from $1.383 billion in the fourth quarter of 2014 and down 4.7% from $1.464 billion in the first quarter of 2014. The sequential increase was primarily due to the network expansion and 700 MHz A-Block build out and an increase in certain regulatory surcharges, partially offset by lower lease expense. The year-over-year decrease was primarily due to a reduction to certain regulatory surcharges, lower roaming expense driven by the migration of customers from the legacy MetroPCS CDMA network to the T-Mobile network, and network synergies from the shutdown of the initial MetroPCS CDMA markets.
Cost of Equipment Sales
Cost of equipment sales was $2.679 billion in the first quarter of 2015, down 4.7% from $2.812 billion in the fourth quarter of 2014 and up 17.2% from $2.286 billion in the first quarter of 2014. The sequential decrease was primarily due to lower device upgrade volumes and a lower average cost per device sold. The year-over-year increase was primarily due to an increase in the number of devices sold, including higher device upgrade volumes.
$6,875 $7,185 $7,350
$8,154 $7,778
1Q14 2Q14 3Q14 4Q14 1Q15
Total Revenues ($ in millions)
$1,464 $1,453 $1,488 $1,383 $1,395
27.4% 26.5%
26.2%
23.6% 24.0%
1Q14 2Q14 3Q14 4Q14 1Q15
Cost of Services ($ in millions, % of Service Revs)

13
Selling, General and Admin. (“SG&A”) Expenses
SG&A expenses were $2.372 billion in the first quarter of 2015, up 1.7% from $2.333 billion in the fourth quarter of 2014 and up 13.2% from $2.096 billion in the first quarter of 2014. The year-over-year increase was primarily due to higher promotional costs and higher employee-related expenses associated with an increase in the number of retail and customer support employees, to support the growing customer base.
ADJUSTED EBITDA T-Mobile is expected to again lead the industry in year-over-
year Adjusted EBITDA growth in the first quarter of 2015.
Adjusted EBITDA was $1.388 billion in the first quarter of 2015, down 20.7% from $1.751 billion in the fourth quarter of 2014 and up 27.6% from $1.088 billion in the first quarter of 2014.
Adjusted EBITDA in the first quarter of 2015 was impacted by a non-cash net revenue deferral for Data Stash that reduced Adjusted EBITDA by $112 million. The net revenue deferral for the initial 10GB allotment per qualifying customer from Data Stash is expected to fully reverse itself during 2015.
Sequentially, the decrease in Adjusted EBITDA was primarily due to the non-cash net revenue deferral for Data Stash and higher losses on equipment sales which were strategic investments in growth in the early part of 2015, consistent with the Company’s previously announced intentions. Excluding the impact from Data Stash, Adjusted EBITDA in the first quarter of 2015 decreased 14.3% sequentially.
Year-over-year, the increase in Adjusted EBITDA was primarily due to higher branded postpaid and prepaid revenues from growth in the customer base, offset in part by higher SG&A expenses associated with customer growth and a reduction of Adjusted EBITDA from the net revenue deferral for Data Stash. Excluding the impact from Data Stash, Adjusted EBITDA in the first quarter of 2015 increased 37.9% year-over-year.
Adjusted EBITDA margin was 24% in the first quarter of 2015 compared to 30% in the fourth quarter of 2014 and 20% in the first quarter of 2014.
$2,096 $2,151 $2,283 $2,333 $2,372
39.3% 39.2% 40.2% 39.7%
40.8%
1Q14 2Q14 3Q14 4Q14 1Q15
SG&A Expenses ($ in millions, % of Service Revs)
$1,088 $1,451 $1,346 $1,751 $1,388
20% 26%
24%
30%
24%
1Q14 2Q14 3Q14 4Q14 1Q15
Adjusted EBITDA ($ in millions, % of Service Revs)
14
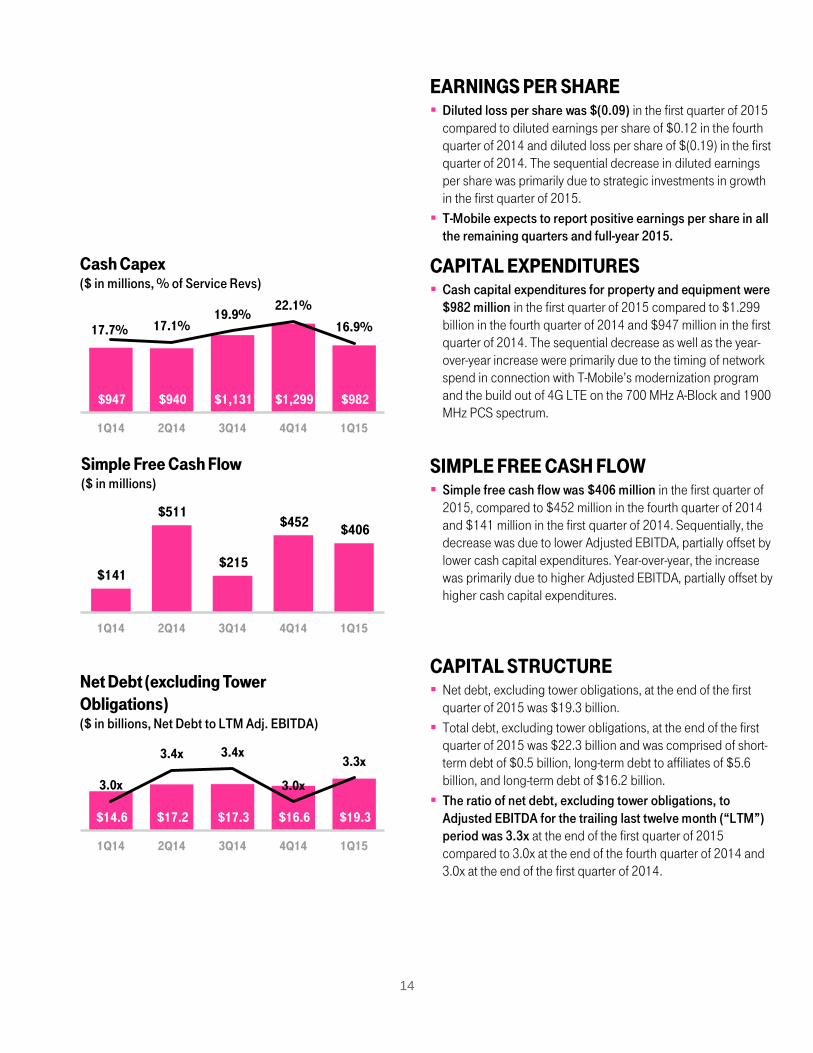
EARNINGS PER SHARE Diluted loss per share was $(0.09) in the first quarter of 2015
compared to diluted earnings per share of $0.12 in the fourth quarter of 2014 and diluted loss per share of $(0.19) in the first quarter of 2014. The sequential decrease in diluted earnings per share was primarily due to strategic investments in growth in the first quarter of 2015.
T-Mobile expects to report positive earnings per share in all the remaining quarters and full-year 2015.
CAPITAL EXPENDITURES Cash capital expenditures for property and equipment were
$982 million in the first quarter of 2015 compared to $1.299 billion in the fourth quarter of 2014 and $947 million in the first quarter of 2014. The sequential decrease as well as the year-over-year increase were primarily due to the timing of network spend in connection with T-Mobile’s modernization program and the build out of 4G LTE on the 700 MHz A-Block and 1900 MHz PCS spectrum.
SIMPLE FREE CASH FLOW Simple free cash flow was $406 million in the first quarter of
2015, compared to $452 million in the fourth quarter of 2014 and $141 million in the first quarter of 2014. Sequentially, the decrease was due to lower Adjusted EBITDA, partially offset by lower cash capital expenditures. Year-over-year, the increase was primarily due to higher Adjusted EBITDA, partially offset by higher cash capital expenditures.
CAPITAL STRUCTURE Net debt, excluding tower obligations, at the end of the first
quarter of 2015 was $19.3 billion.
Total debt, excluding tower obligations, at the end of the first quarter of 2015 was $22.3 billion and was comprised of short-term debt of $0.5 billion, long-term debt to affiliates of $5.6 billion, and long-term debt of $16.2 billion.
The ratio of net debt, excluding tower obligations, to Adjusted EBITDA for the trailing last twelve month (“LTM”) period was 3.3x at the end of the first quarter of 2015 compared to 3.0x at the end of the fourth quarter of 2014 and 3.0x at the end of the first quarter of 2014.
$947 $940 $1,131 $1,299 $982
17.7% 17.1% 19.9%
22.1%
16.9%
1Q14 2Q14 3Q14 4Q14 1Q15
Cash Capex ($ in millions, % of Service Revs)
$141
$511
$215
$452 $406
1Q14 2Q14 3Q14 4Q14 1Q15
Simple Free Cash Flow ($ in millions)
$14.6 $17.2 $17.3 $16.6 $19.3
3.0x
3.4x 3.4x
3.0x
3.3x
1Q14 2Q14 3Q14 4Q14 1Q15
Net Debt (excluding Tower Obligations) ($ in billions, Net Debt to LTM Adj. EBITDA)
15
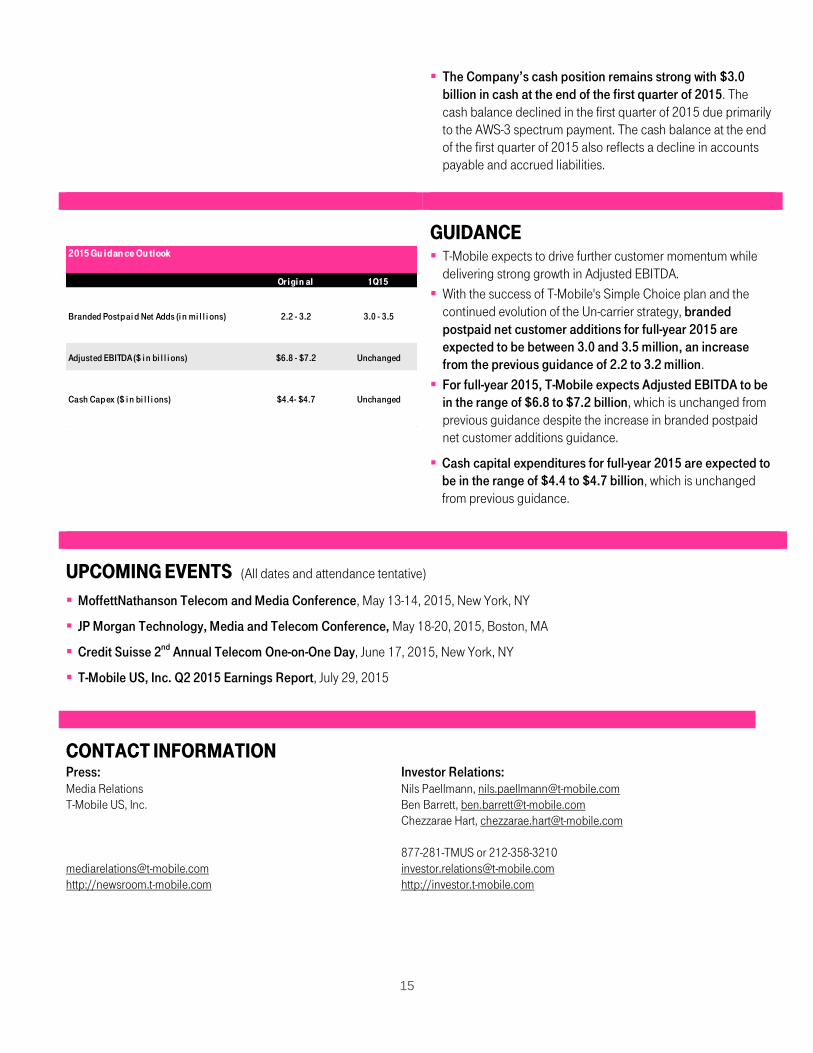
The Company’s cash position remains strong with $3.0 billion in cash at the end of the first quarter of 2015. The cash balance declined in the first quarter of 2015 due primarily to the AWS-3 spectrum payment. The cash balance at the end of the first quarter of 2015 also reflects a decline in accounts payable and accrued liabilities.
GUIDANCE T-Mobile expects to drive further customer momentum while
delivering strong growth in Adjusted EBITDA.
With the success of T-Mobile's Simple Choice plan and the continued evolution of the Un-carrier strategy, branded postpaid net customer additions for full-year 2015 are expected to be between 3.0 and 3.5 million, an increase from the previous guidance of 2.2 to 3.2 million.
For full-year 2015, T-Mobile expects Adjusted EBITDA to be in the range of $6.8 to $7.2 billion, which is unchanged from previous guidance despite the increase in branded postpaid net customer additions guidance.
Cash capital expenditures for full-year 2015 are expected to be in the range of $4.4 to $4.7 billion, which is unchanged from previous guidance.
UPCOMING EVENTS (All dates and attendance tentative)
MoffettNathanson Telecom and Media Conference, May 13-14, 2015, New York, NY
JP Morgan Technology, Media and Telecom Conference, May 18-20, 2015, Boston, MA
Credit Suisse 2nd Annual Telecom One-on-One Day, June 17, 2015, New York, NY
T-Mobile US, Inc. Q2 2015 Earnings Report, July 29, 2015
CONTACT INFORMATION Press: Investor Relations: Media Relations Nils Paellmann, [email protected] T-Mobile US, Inc. Ben Barrett, [email protected] Chezzarae Hart, [email protected] 877-281-TMUS or 212-358-3210 [email protected] [email protected] http://newsroom.t-mobile.com http://investor.t-mobile.com
2015 Gu i dan ce Ou tl ook
Or i gi n al 1Q15
Branded Postpai d Net Adds (i n mi l l i ons) 2.2 - 3.2 3.0 - 3.5
Adjusted EBITDA ($ i n bi l l i ons) $6.8 - $7.2 Unchanged
Cash Capex ($ i n bi l l i ons) $4.4- $4.7 Unchanged
16
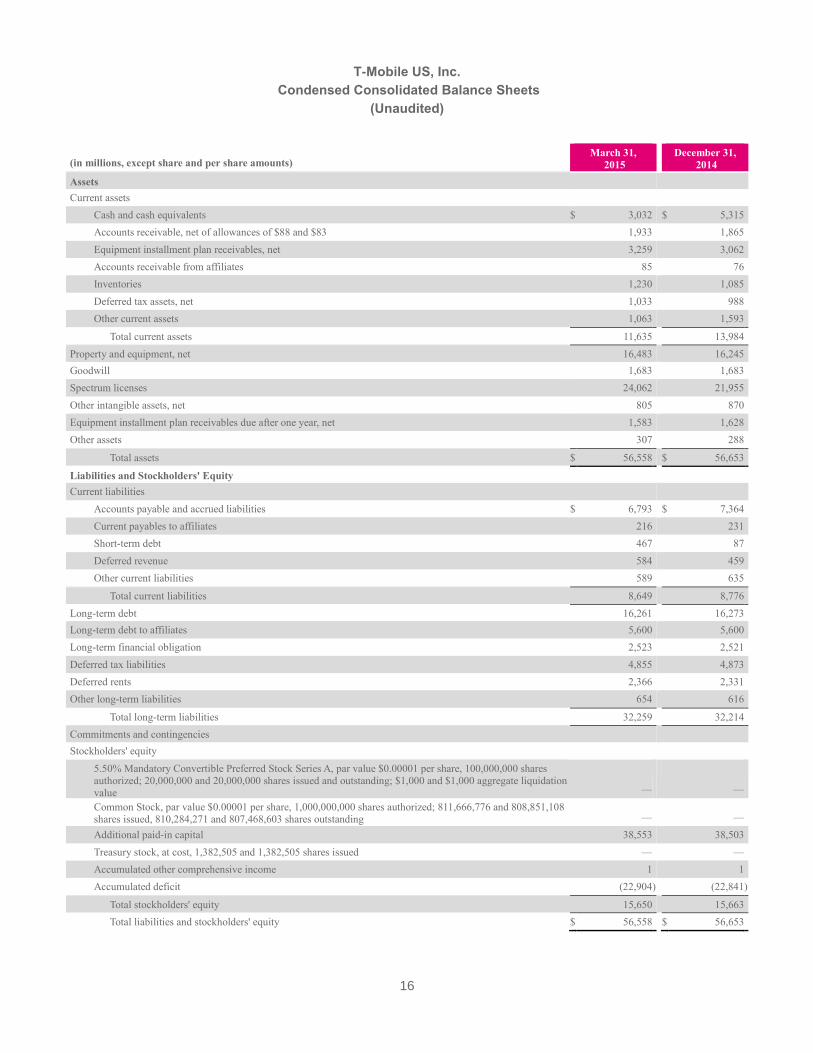
T-Mobile US, Inc.
Condensed Consolidated Balance Sheets
(Unaudited)
(in millions, except share and per share amounts) March 31,
2015 December 31,
2014
Assets Current assets
Cash and cash equivalents $ 3,032 $ 5,315
Accounts receivable, net of allowances of $88 and $83 1,933 1,865
Equipment installment plan receivables, net 3,259 3,062
Accounts receivable from affiliates 85 76
Inventories 1,230 1,085
Deferred tax assets, net 1,033 988
Other current assets 1,063 1,593
Total current assets 11,635 13,984
Property and equipment, net 16,483 16,245
Goodwill 1,683 1,683
Spectrum licenses 24,062 21,955
Other intangible assets, net 805 870
Equipment installment plan receivables due after one year, net 1,583 1,628
Other assets 307 288
Total assets $ 56,558 $ 56,653
Liabilities and Stockholders' Equity Current liabilities
Accounts payable and accrued liabilities $ 6,793 $ 7,364
Current payables to affiliates 216 231
Short-term debt 467 87
Deferred revenue 584 459
Other current liabilities 589 635
Total current liabilities 8,649 8,776
Long-term debt 16,261 16,273
Long-term debt to affiliates 5,600 5,600
Long-term financial obligation 2,523 2,521
Deferred tax liabilities 4,855 4,873
Deferred rents 2,366 2,331
Other long-term liabilities 654 616
Total long-term liabilities 32,259 32,214
Commitments and contingencies Stockholders' equity
5.50% Mandatory Convertible Preferred Stock Series A, par value $0.00001 per share, 100,000,000 shares authorized; 20,000,000 and 20,000,000 shares issued and outstanding; $1,000 and $1,000 aggregate liquidation value —
—
Common Stock, par value $0.00001 per share, 1,000,000,000 shares authorized; 811,666,776 and 808,851,108 shares issued, 810,284,271 and 807,468,603 shares outstanding —
—
Additional paid-in capital 38,553 38,503
Treasury stock, at cost, 1,382,505 and 1,382,505 shares issued — —
Accumulated other comprehensive income 1 1
Accumulated deficit (22,904 ) (22,841 )
Total stockholders' equity 15,650 15,663
Total liabilities and stockholders' equity $ 56,558 $ 56,653
17
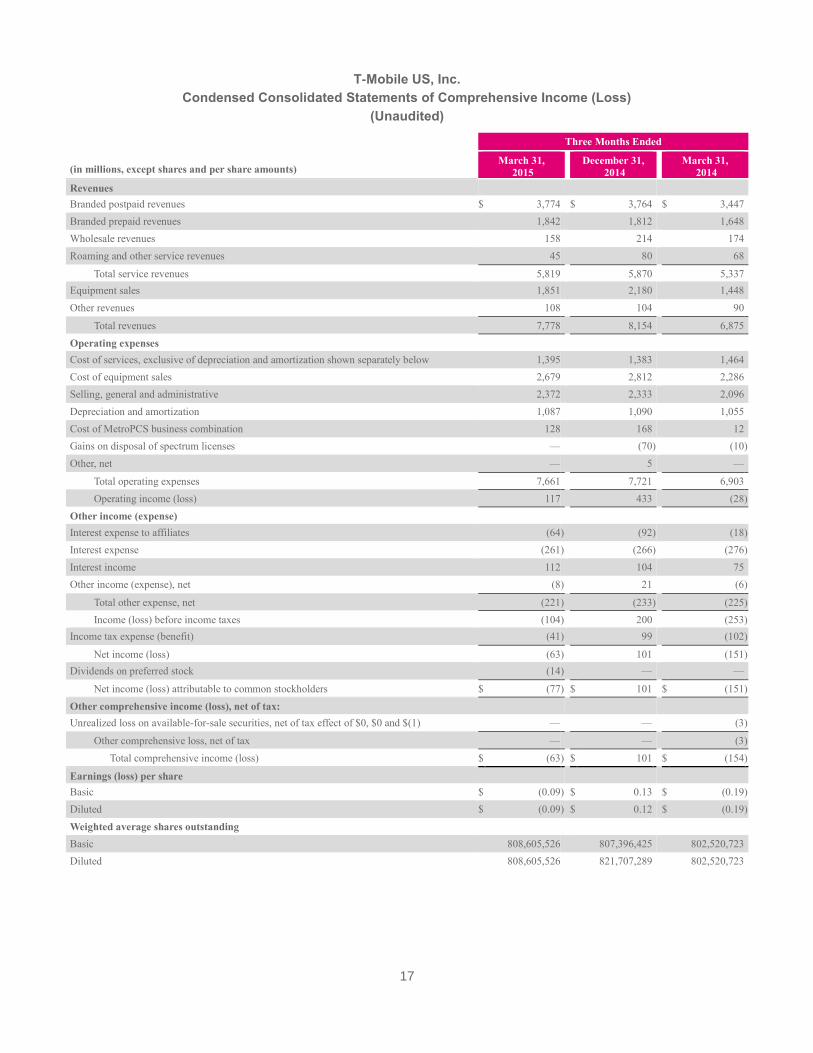
T-Mobile US, Inc.
Condensed Consolidated Statements of Comprehensive Income (Loss)
(Unaudited)
Three Months Ended
(in millions, except shares and per share amounts) March 31,
2015 December 31,
2014 March 31,
2014
Revenues Branded postpaid revenues $ 3,774 $ 3,764 $ 3,447
Branded prepaid revenues 1,842 1,812 1,648
Wholesale revenues 158 214 174
Roaming and other service revenues 45 80 68
Total service revenues 5,819 5,870 5,337
Equipment sales 1,851 2,180 1,448
Other revenues 108 104 90
Total revenues 7,778 8,154 6,875
Operating expenses Cost of services, exclusive of depreciation and amortization shown separately below 1,395 1,383 1,464
Cost of equipment sales 2,679 2,812 2,286
Selling, general and administrative 2,372 2,333 2,096
Depreciation and amortization 1,087 1,090 1,055
Cost of MetroPCS business combination 128 168 12
Gains on disposal of spectrum licenses — (70 ) (10 )
Other, net — 5 —
Total operating expenses 7,661 7,721 6,903
Operating income (loss) 117 433 (28 )
Other income (expense) Interest expense to affiliates (64 ) (92 ) (18 )
Interest expense (261 ) (266 ) (276 )
Interest income 112 104 75
Other income (expense), net (8 ) 21 (6 )
Total other expense, net (221 ) (233 ) (225 )
Income (loss) before income taxes (104 ) 200 (253 )
Income tax expense (benefit) (41 ) 99 (102 )
Net income (loss) (63 ) 101 (151 )
Dividends on preferred stock (14 ) — —
Net income (loss) attributable to common stockholders $ (77 ) $ 101 $ (151 )
Other comprehensive income (loss), net of tax: Unrealized loss on available-for-sale securities, net of tax effect of $0, $0 and $(1) — — (3 )
Other comprehensive loss, net of tax — — (3 )
Total comprehensive income (loss) $ (63 ) $ 101 $ (154 )
Earnings (loss) per share Basic $ (0.09 ) $ 0.13 $ (0.19 )
Diluted $ (0.09 ) $ 0.12 $ (0.19 )
Weighted average shares outstanding Basic 808,605,526 807,396,425 802,520,723
Diluted 808,605,526 821,707,289 802,520,723
18
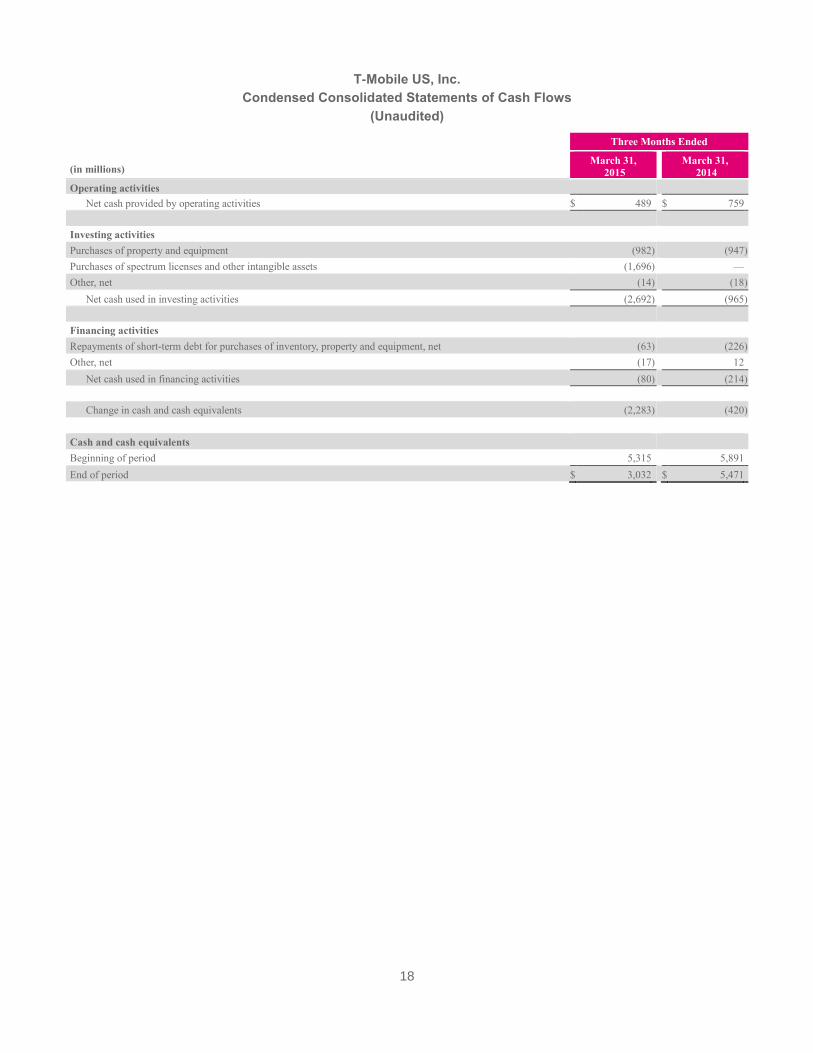
T-Mobile US, Inc.
Condensed Consolidated Statements of Cash Flows
(Unaudited)
Three Months Ended
(in millions) March 31,
2015 March 31,
2014
Operating activities Net cash provided by operating activities $ 489 $ 759
Investing activities Purchases of property and equipment (982 ) (947 )
Purchases of spectrum licenses and other intangible assets (1,696 ) —
Other, net (14 ) (18 )
Net cash used in investing activities (2,692 ) (965 )
Financing activities Repayments of short-term debt for purchases of inventory, property and equipment, net (63 ) (226 )
Other, net (17 ) 12
Net cash used in financing activities (80 ) (214 )
Change in cash and cash equivalents (2,283 ) (420 )
Cash and cash equivalents Beginning of period 5,315 5,891
End of period $ 3,032 $ 5,471

19
T-Mobile US, Inc. Supplementary Operating and Financial Data
(in thousands) Q1 2014 Q2 2014 Q3 2014 Q4 2014 Q1 2015
Customers, end of period Branded postpaid phone customers 23,054 23,633 24,807 25,844 26,835
Branded postpaid mobile broadband customers 568 897 1,102 1,341 1,475
Total branded postpaid customers 23,622 24,530 25,909 27,185 28,310
Branded prepaid customers 15,537 15,639 16,050 16,316 16,389
Total branded customers 39,159 40,169 41,959 43,501 44,699
M2M customers 3,822 4,047 4,269 4,421 4,562
MVNO customers 6,094 6,329 6,662 7,096 7,575
Total wholesale customers 9,916 10,376 10,931 11,517 12,137
Total customers, end of period 49,075 50,545 52,890 55,018 56,836
(in thousands) Q1 2014 Q2 2014 Q3 2014 Q4 2014 Q1 2015
Net customer additions Branded postpaid phone customers 1,256 579 1,175 1,037 991
Branded postpaid mobile broadband customers 67 329 204 239 134
Total branded postpaid customers 1,323 908 1,379 1,276 1,125
Branded prepaid customers 465 102 411 266 73
Total branded customers 1,788 1,010 1,790 1,542 1,198
M2M customers 220 225 222 152 141
MVNO customers 383 235 333 434 479
Total wholesale customers 603 460 555 586 620
Total net customer additions 2,391 1,470 2,345 2,128 1,818
Note: Certain customer numbers may not add due to rounding.
Q1 2014 Q2 2014 Q3 2014 Q4 2014 Q1 2015
Branded postpaid phone churn 1.47 % 1.48 % 1.64 % 1.73 % 1.30 %
Branded prepaid churn 4.34 % 4.50 % 4.78 % 5.39 % 4.62 %
20
T-Mobile US, Inc. Supplementary Operating and Financial Data (continued)
Q1 2014 Q2 2014 Q3 2014 Q4 2014 Q1 2015
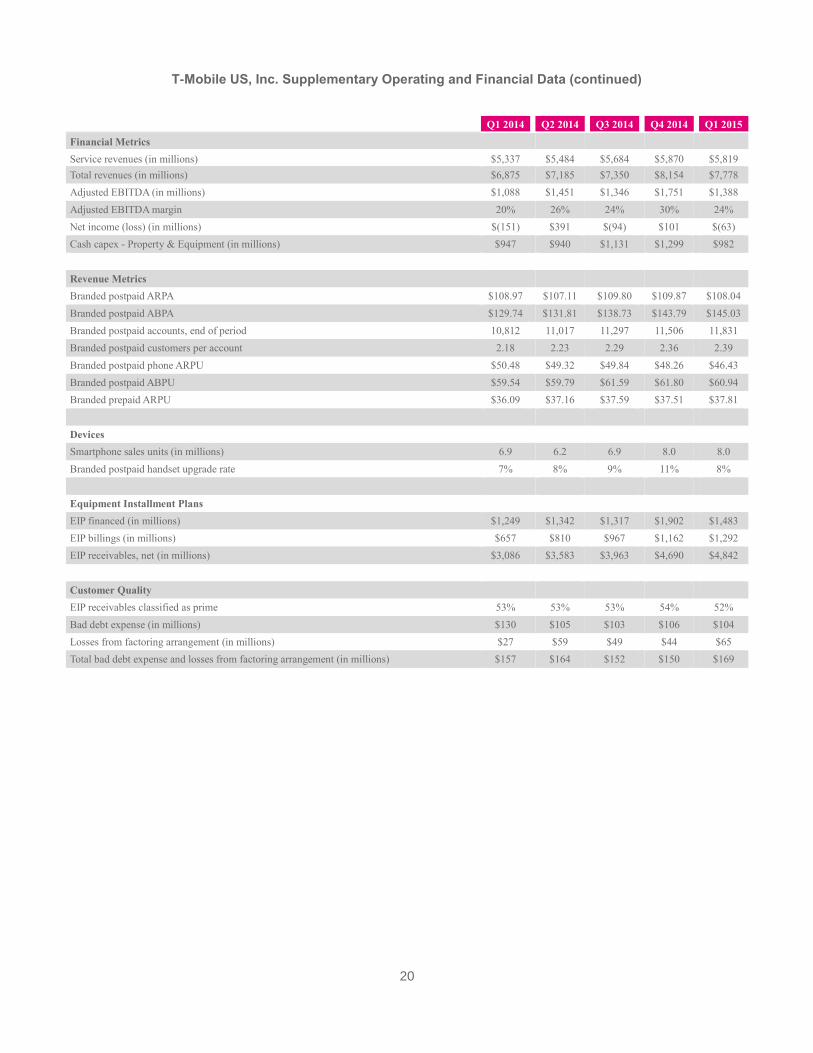
Financial Metrics Service revenues (in millions) $5,337 $5,484 $5,684 $5,870 $5,819
Total revenues (in millions) $6,875 $7,185 $7,350 $8,154 $7,778
Adjusted EBITDA (in millions) $1,088 $1,451 $1,346 $1,751 $1,388
Adjusted EBITDA margin 20% 26% 24% 30% 24%
Net income (loss) (in millions) $(151) $391 $(94) $101 $(63)
Cash capex - Property & Equipment (in millions) $947 $940 $1,131 $1,299 $982
Revenue Metrics Branded postpaid ARPA $108.97 $107.11 $109.80 $109.87 $108.04
Branded postpaid ABPA $129.74 $131.81 $138.73 $143.79 $145.03
Branded postpaid accounts, end of period 10,812 11,017 11,297 11,506 11,831
Branded postpaid customers per account 2.18 2.23 2.29 2.36 2.39
Branded postpaid phone ARPU $50.48 $49.32 $49.84 $48.26 $46.43
Branded postpaid ABPU $59.54 $59.79 $61.59 $61.80 $60.94
Branded prepaid ARPU $36.09 $37.16 $37.59 $37.51 $37.81
Devices Smartphone sales units (in millions) 6.9 6.2 6.9 8.0 8.0
Branded postpaid handset upgrade rate 7% 8% 9% 11% 8%
Equipment Installment Plans EIP financed (in millions) $1,249 $1,342 $1,317 $1,902 $1,483
EIP billings (in millions) $657 $810 $967 $1,162 $1,292
EIP receivables, net (in millions) $3,086 $3,583 $3,963 $4,690 $4,842
Customer Quality EIP receivables classified as prime 53% 53% 53% 54% 52%
Bad debt expense (in millions) $130 $105 $103 $106 $104
Losses from factoring arrangement (in millions) $27 $59 $49 $44 $65
Total bad debt expense and losses from factoring arrangement (in millions) $157 $164 $152 $150 $169

21
T-Mobile US, Inc.
Reconciliation of Non-GAAP Financial Measures to GAAP Financial Measures
(Unaudited)
This Investor Factbook includes non-GAAP financial measures. The non-GAAP financial measures should be
considered in addition to, but not as a substitute for, the information provided in accordance with GAAP.
Reconciliations for the non-GAAP financial measures to the most directly comparable GAAP financial measures are
provided below.
Adjusted EBITDA is reconciled to net income (loss) as follows:
(in millions) Q1 2014 Q2 2014 Q3 2014 Q4 2014 Q1 2015
Net income (loss) $ (151 ) $ 391 $ (94 ) $ 101 $ (63 )
Adjustments: Interest expense to affiliates 18 85 83 92 64
Interest expense 276 271 260 266 261
Interest income (75 ) (83 ) (97 ) (104 ) (112 )
Other expense (income), net 6 12 14 (21 ) 8
Income tax expense (benefit) (102 ) 286 (117 ) 99 (41 )
Operating income (loss) (28 ) 962 49 433 117
Depreciation and amortization 1,055 1,129 1,138 1,090 1,087
Cost of MetroPCS business combination 12 22 97 168 128
Stock-based compensation (1) 49 63 45 54 56
Gains on disposal of spectrum licenses (1) — (731 ) 11 — —
Other, net (1) — 6 6 6 —
Adjusted EBITDA $ 1,088 $ 1,451 $ 1,346 $ 1,751 $ 1,388
(1) Stock-based compensation includes tax impacts and may not agree to stock based compensation expense in the consolidated financial
statements. Gains on disposal of spectrum licenses and Other, net transactions may not agree in total to the Gains on disposal of
spectrum licenses and Other, net in the Condensed Consolidated Statements of Comprehensive Income (Loss) primarily due to certain
routine operating activities, such as insignificant or routine spectrum license exchanges that would be expected to reoccur, and are
therefore included in Adjusted EBITDA.
22
T-Mobile US, Inc.
Reconciliation of Non-GAAP Financial Measures to GAAP Financial Measures (continued)
(Unaudited)
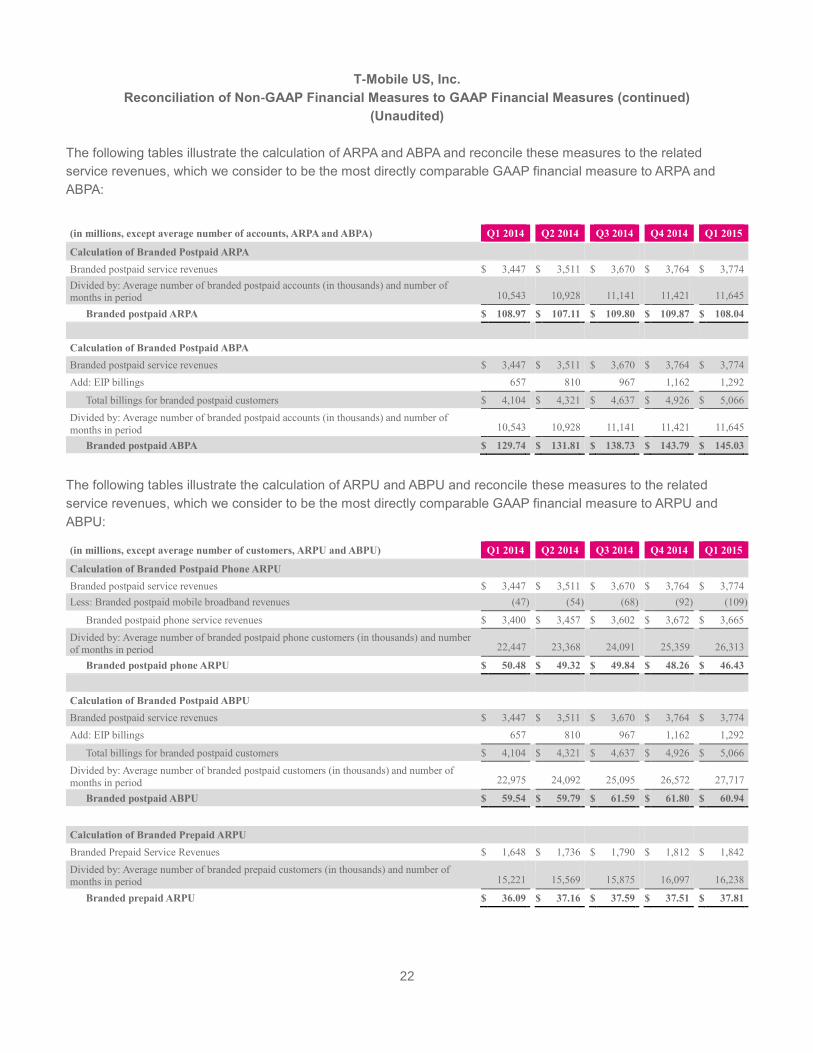
The following tables illustrate the calculation of ARPA and ABPA and reconcile these measures to the related
service revenues, which we consider to be the most directly comparable GAAP financial measure to ARPA and
ABPA:
(in millions, except average number of accounts, ARPA and ABPA) Q1 2014 Q2 2014 Q3 2014 Q4 2014 Q1 2015
Calculation of Branded Postpaid ARPA Branded postpaid service revenues $ 3,447 $ 3,511 $ 3,670 $ 3,764 $ 3,774
Divided by: Average number of branded postpaid accounts (in thousands) and number of months in period 10,543
10,928
11,141
11,421
11,645
Branded postpaid ARPA $ 108.97 $ 107.11 $ 109.80 $ 109.87 $ 108.04
Calculation of Branded Postpaid ABPA Branded postpaid service revenues $ 3,447 $ 3,511 $ 3,670 $ 3,764 $ 3,774
Add: EIP billings 657 810 967 1,162 1,292
Total billings for branded postpaid customers $ 4,104 $ 4,321 $ 4,637 $ 4,926 $ 5,066
Divided by: Average number of branded postpaid accounts (in thousands) and number of
months in period 10,543 10,928 11,141 11,421 11,645
Branded postpaid ABPA $ 129.74 $ 131.81 $ 138.73 $ 143.79 $ 145.03
The following tables illustrate the calculation of ARPU and ABPU and reconcile these measures to the related
service revenues, which we consider to be the most directly comparable GAAP financial measure to ARPU and
ABPU:
(in millions, except average number of customers, ARPU and ABPU) Q1 2014 Q2 2014 Q3 2014 Q4 2014 Q1 2015
Calculation of Branded Postpaid Phone ARPU Branded postpaid service revenues $ 3,447 $ 3,511 $ 3,670 $ 3,764 $ 3,774
Less: Branded postpaid mobile broadband revenues (47 ) (54 ) (68 ) (92 ) (109 )
Branded postpaid phone service revenues $ 3,400 $ 3,457 $ 3,602 $ 3,672 $ 3,665
Divided by: Average number of branded postpaid phone customers (in thousands) and number of months in period 22,447 23,368 24,091 25,359 26,313
Branded postpaid phone ARPU $ 50.48 $ 49.32 $ 49.84 $ 48.26 $ 46.43
Calculation of Branded Postpaid ABPU Branded postpaid service revenues $ 3,447 $ 3,511 $ 3,670 $ 3,764 $ 3,774
Add: EIP billings 657 810 967 1,162 1,292
Total billings for branded postpaid customers $ 4,104 $ 4,321 $ 4,637 $ 4,926 $ 5,066
Divided by: Average number of branded postpaid customers (in thousands) and number of
months in period 22,975 24,092 25,095 26,572 27,717
Branded postpaid ABPU $ 59.54 $ 59.79 $ 61.59 $ 61.80 $ 60.94
Calculation of Branded Prepaid ARPU Branded Prepaid Service Revenues $ 1,648 $ 1,736 $ 1,790 $ 1,812 $ 1,842
Divided by: Average number of branded prepaid customers (in thousands) and number of months in period 15,221
15,569
15,875
16,097
16,238
Branded prepaid ARPU $ 36.09 $ 37.16 $ 37.59 $ 37.51 $ 37.81
23
T-Mobile US, Inc.
Reconciliation of Non-GAAP Financial Measures to GAAP Financial Measures (continued)
(Unaudited)
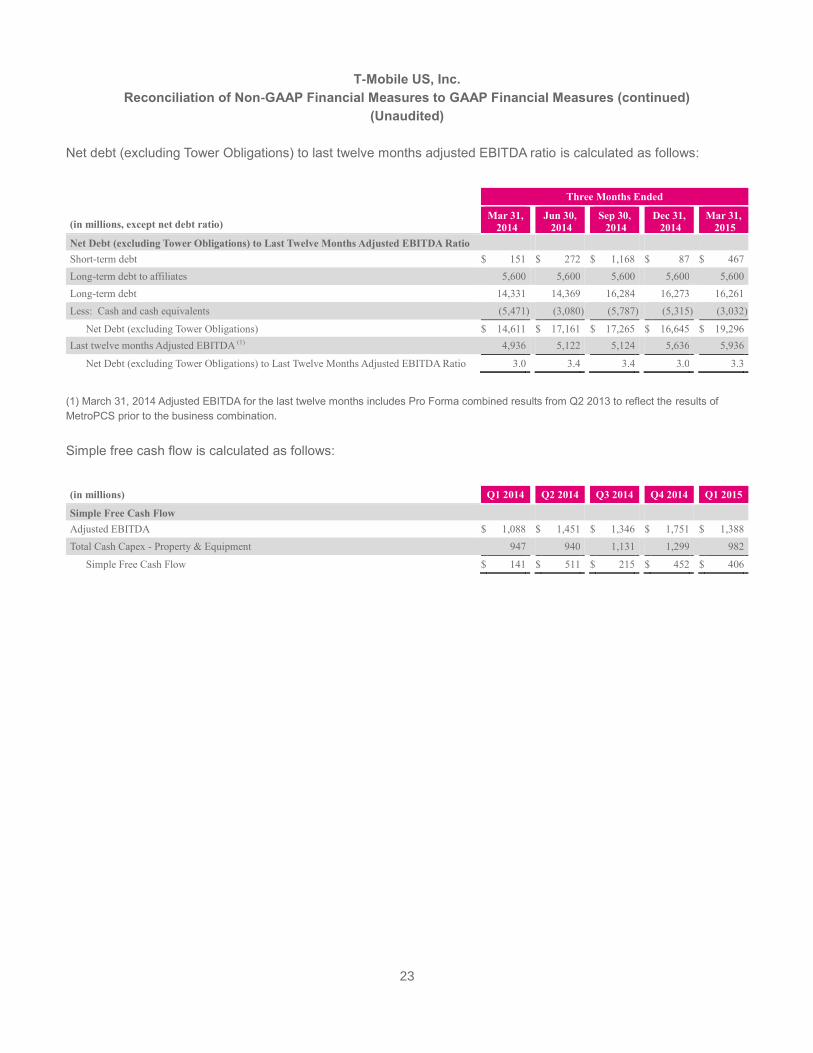
Net debt (excluding Tower Obligations) to last twelve months adjusted EBITDA ratio is calculated as follows:
Three Months Ended
(in millions, except net debt ratio) Mar 31,
2014 Jun 30,
2014 Sep 30,
2014 Dec 31,
2014 Mar 31,
2015
Net Debt (excluding Tower Obligations) to Last Twelve Months Adjusted EBITDA Ratio Short-term debt $ 151 $ 272 $ 1,168 $ 87 $ 467
Long-term debt to affiliates 5,600 5,600 5,600 5,600 5,600
Long-term debt 14,331 14,369 16,284 16,273 16,261
Less: Cash and cash equivalents (5,471 ) (3,080 ) (5,787 ) (5,315 ) (3,032 )
Net Debt (excluding Tower Obligations) $ 14,611 $ 17,161 $ 17,265 $ 16,645 $ 19,296
Last twelve months Adjusted EBITDA (1) 4,936 5,122 5,124 5,636 5,936
Net Debt (excluding Tower Obligations) to Last Twelve Months Adjusted EBITDA Ratio 3.0 3.4 3.4 3.0 3.3
(1) March 31, 2014 Adjusted EBITDA for the last twelve months includes Pro Forma combined results from Q2 2013 to reflect the results of
MetroPCS prior to the business combination.
Simple free cash flow is calculated as follows:
(in millions) Q1 2014 Q2 2014 Q3 2014 Q4 2014 Q1 2015
Simple Free Cash Flow Adjusted EBITDA $ 1,088 $ 1,451 $ 1,346 $ 1,751 $ 1,388
Total Cash Capex - Property & Equipment 947 940 1,131 1,299 982
Simple Free Cash Flow $ 141 $ 511 $ 215 $ 452 $ 406
24
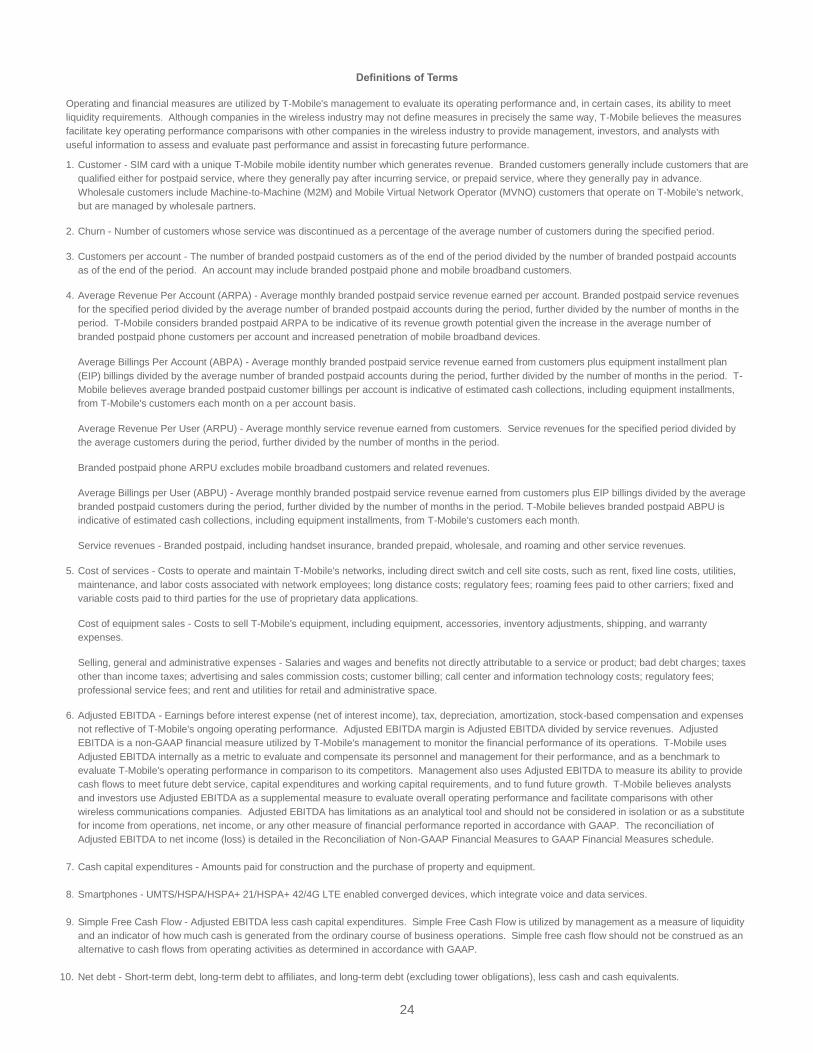
Definitions of Terms
Operating and financial measures are utilized by T-Mobile's management to evaluate its operating performance and, in certain cases, its ability to meet
liquidity requirements. Although companies in the wireless industry may not define measures in precisely the same way, T-Mobile believes the measures
facilitate key operating performance comparisons with other companies in the wireless industry to provide management, investors, and analysts with
useful information to assess and evaluate past performance and assist in forecasting future performance.
1. Customer - SIM card with a unique T-Mobile mobile identity number which generates revenue. Branded customers generally include customers that are
qualified either for postpaid service, where they generally pay after incurring service, or prepaid service, where they generally pay in advance.
Wholesale customers include Machine-to-Machine (M2M) and Mobile Virtual Network Operator (MVNO) customers that operate on T-Mobile's network,
but are managed by wholesale partners.
2. Churn - Number of customers whose service was discontinued as a percentage of the average number of customers during the specified period.
3. Customers per account - The number of branded postpaid customers as of the end of the period divided by the number of branded postpaid accounts
as of the end of the period. An account may include branded postpaid phone and mobile broadband customers.
4. Average Revenue Per Account (ARPA) - Average monthly branded postpaid service revenue earned per account. Branded postpaid service revenues
for the specified period divided by the average number of branded postpaid accounts during the period, further divided by the number of months in the
period. T-Mobile considers branded postpaid ARPA to be indicative of its revenue growth potential given the increase in the average number of
branded postpaid phone customers per account and increased penetration of mobile broadband devices.
Average Billings Per Account (ABPA) - Average monthly branded postpaid service revenue earned from customers plus equipment installment plan
(EIP) billings divided by the average number of branded postpaid accounts during the period, further divided by the number of months in the period. T-
Mobile believes average branded postpaid customer billings per account is indicative of estimated cash collections, including equipment installments,
from T-Mobile's customers each month on a per account basis.
Average Revenue Per User (ARPU) - Average monthly service revenue earned from customers. Service revenues for the specified period divided by
the average customers during the period, further divided by the number of months in the period.
Branded postpaid phone ARPU excludes mobile broadband customers and related revenues.
Average Billings per User (ABPU) - Average monthly branded postpaid service revenue earned from customers plus EIP billings divided by the average
branded postpaid customers during the period, further divided by the number of months in the period. T-Mobile believes branded postpaid ABPU is
indicative of estimated cash collections, including equipment installments, from T-Mobile's customers each month.
Service revenues - Branded postpaid, including handset insurance, branded prepaid, wholesale, and roaming and other service revenues.
5. Cost of services - Costs to operate and maintain T-Mobile's networks, including direct switch and cell site costs, such as rent, fixed line costs, utilities,
maintenance, and labor costs associated with network employees; long distance costs; regulatory fees; roaming fees paid to other carriers; fixed and
variable costs paid to third parties for the use of proprietary data applications.
Cost of equipment sales - Costs to sell T-Mobile's equipment, including equipment, accessories, inventory adjustments, shipping, and warranty
expenses.
Selling, general and administrative expenses - Salaries and wages and benefits not directly attributable to a service or product; bad debt charges; taxes
other than income taxes; advertising and sales commission costs; customer billing; call center and information technology costs; regulatory fees;
professional service fees; and rent and utilities for retail and administrative space.
6. Adjusted EBITDA - Earnings before interest expense (net of interest income), tax, depreciation, amortization, stock-based compensation and expenses
not reflective of T-Mobile's ongoing operating performance. Adjusted EBITDA margin is Adjusted EBITDA divided by service revenues. Adjusted
EBITDA is a non-GAAP financial measure utilized by T-Mobile's management to monitor the financial performance of its operations. T-Mobile uses
Adjusted EBITDA internally as a metric to evaluate and compensate its personnel and management for their performance, and as a benchmark to
evaluate T-Mobile's operating performance in comparison to its competitors. Management also uses Adjusted EBITDA to measure its ability to provide
cash flows to meet future debt service, capital expenditures and working capital requirements, and to fund future growth. T-Mobile believes analysts
and investors use Adjusted EBITDA as a supplemental measure to evaluate overall operating performance and facilitate comparisons with other
wireless communications companies. Adjusted EBITDA has limitations as an analytical tool and should not be considered in isolation or as a substitute
for income from operations, net income, or any other measure of financial performance reported in accordance with GAAP. The reconciliation of
Adjusted EBITDA to net income (loss) is detailed in the Reconciliation of Non-GAAP Financial Measures to GAAP Financial Measures schedule.
7. Cash capital expenditures - Amounts paid for construction and the purchase of property and equipment.
8. Smartphones - UMTS/HSPA/HSPA+ 21/HSPA+ 42/4G LTE enabled converged devices, which integrate voice and data services.
9. Simple Free Cash Flow - Adjusted EBITDA less cash capital expenditures. Simple Free Cash Flow is utilized by management as a measure of liquidity
and an indicator of how much cash is generated from the ordinary course of business operations. Simple free cash flow should not be construed as an
alternative to cash flows from operating activities as determined in accordance with GAAP.
10. Net debt - Short-term debt, long-term debt to affiliates, and long-term debt (excluding tower obligations), less cash and cash equivalents.
25
Forward-Looking Statements
This Investor Factbook includes "forward-looking statements" within the meaning of the U.S. federal securities laws. Any statements made herein
that are not statements of historical fact, including statements about T-Mobile US, Inc.'s plans, outlook, beliefs, opinion, projections, guidance,
strategy, integration of MetroPCS, expected network modernization and other advancements, are forward-looking statements. Generally,
forward-looking statements may be identified by words such as "anticipate," "expect," "suggests," "plan," “project,” "believe," "intend,"
"estimates," "targets," "views," "may," "will," "forecast," and other similar expressions. The forward-looking statements speak only as of the date
made, are based on current assumptions and expectations, and involve a number of risks and uncertainties. Important factors that could affect
future results and cause those results to differ materially from those expressed in the forward-looking statements include, among others, the
following: our ability to compete in the highly competitive U.S. wireless telecommunications industry; adverse conditions in the U.S. and
international economies and markets; significant capital commitments and the capital expenditures required to effect our business plan; our
ability to adapt to future changes in technology, enhance existing offerings, and introduce new offerings to address customers' changing
demands; changes in legal and regulatory requirements, including any change or increase in restrictions on our ability to operate our network;
our ability to successfully maintain and improve our network, and the possibility of incurring additional costs in doing so; major equipment
failures; severe weather conditions or other force majeure events; and other risks described in our filings with the Securities and Exchange
Commission, including those described in our Annual Report on Form 10-K filed with the Securities and Exchange Commission on February 19,
2015. You should not place undue reliance on these forward-looking statements. We do not undertake to update forward-looking statements,
whether as a result of new information, future events or otherwise, except as required by law.
About T-Mobile US, Inc.
As America's Un-carrier, T-Mobile US, Inc. (NYSE: TMUS) is redefining the way consumers and businesses buy wireless services through
leading product and service innovation. The Company's advanced nationwide 4G LTE network delivers outstanding wireless experiences to
approximately 57 million customers who are unwilling to compromise on quality and value. Based in Bellevue, Washington, T-Mobile US provides
services through its subsidiaries and operates its flagship brands, T-Mobile and MetroPCS. For more information, please visit http://www.T-
Mobile.com.