tn 44: the determination of trace anions in concentrated...
TRANSCRIPT

Technical Note 44 1
The Determination of Trace Anions in ConcentratedPhosphoric Acid
Technical Note 44
INTRODUCTIONThe determination of trace anions in phosphoric acid
is hampered by a large excess of phosphate ion. Chloridedetermination at 0.1 mg/L (ppm) in 85% (w/w) phosphoricacid represents a concentration ratio of 1:106 (chloride tophosphate). Diluting the concentrated sample overcomesthe problem of a large concentration of the interferingmatrix ion, but lacks the required sensitivity for thecontaminant ions of interest. An improved method fordetermining trace anions in concentrated phosphoric acidhas been developed to overcome this problem.1,2 Traceinorganic anions are separated from the high concentrationof phosphate by an ion-exclusion separation prior to anion-exchange separation.
This Technical Note describes the theory, set up, andanalytical procedure for the determination of chloride,nitrate, and sulfate at sub-mg/L (ppm) levels in 85% (w/w)phosphoric acid.
SUMMARY OF THE METHODAn IonPac® ICE-AS6 ion-exclusion column is used
to separate the analyte ions from an excess of phosphatematrix ions. A selected fraction from the ion-exclusionseparation is “cut” and sent to a 4-mm IonPac AS11-HCanion-exchange concentrator column. The concentratedions are then eluted onto a 2-mm IonPac AS11-HC columnset, where the anions of interest are separated and detectedby suppressed conductivity.
EQUIPMENTDionex DX-500 Ion Chromatography system consisting of:
GP50 Gradient Pump, microbore configurationCD20 Conductivity Detector with a temperature-controlled conductivity cell (DS3)LC20 Enclosure with 2 Rheodyne valves, PEEK,rear loading
Dionex RP-1 single piston pumpPressurizable Reservoir Chamber (P/N 37053)
(Three) 4-L Plastic bottle assemblies, 2 for external waterand 1 for rinse solution (P/N 39164)
1 O-ring, Teflon encapsulated, for rinse solution bottle(P/N 43523)
2 O-rings Teflon encapsulated, for Reservoir Chamber(P/N 055703)
1 Air pressure gauge, 0–171 kPa (0–25 psi) (for external water)
305 cm (120 in.) of green PEEK tubing, diameter of0.75 mm (0.030 in.), to connect columns and make a200-µL sample loop
Teflon bottles as sample containers (VWR, P/N 16071-041or Nalge, P/N 1600-0004 for 125 mL narrow mouthbottles)
PeakNet Chromatography Workstation
ColumnsIonPac AG11-HC guard column, 2 mm (P/N 52963)
IonPac AS11-HC analytical column, 2 mm (P/N 52961)
IonPac AG11-HC concentrator column, 4 mm (P/N 52962)
IonPac AG10 as trap column, 4 mm (P/N 43119)
IonPac ICE-AS6 analytical column, 9 x 250 mm (P/N 46023)
Anion Self-Regenerating Suppressor® (ASRS®),2 mm (P/N 53947)

2 The Determination of Trace Anions in Concentrated Phosphoric Acid
REAGENTS AND STANDARDSDeionized water (DI H
2O), Type I reagent grade,
17.8 MΩ-cm resistance or better
Sodium hydroxide, 50% (w/w) aqueous solution(Fisher Scientific)
Chloride standard 1000 mg/L, 100 mL (Dionex, P/N 37159)
Sulfate standard 1000 mg/L, 100 mL (Dionex, P/N 37160)
Nitrate standard 1000 mg/L, 100 mL (Ultra Scientific,VWR, P/N ULICC-004)
CONDITIONSIon Exclusion
Column: IonPac ICE-AS6
Trap Column: IonPac AG10, 4 mm
Eluent: Deionized water
Flow Rate: 0.50 mL/min
Ion ChromatographyAnalytical Column: IonPac AS11-HC, 2 mm
Guard Column: IonPac AG11-HC, 2 mm
ConcentratorColumn: IonPac AG11-HC, 4 mm
Eluent: 20 mM sodium hydroxide, step to
200 mM sodium hydroxide
Flow Rate: 0.38 mL/min
Sample Volume: 200 µL
Detection: Suppressed conductivity, ASRS,
AutoSuppression® external watermode
SuppressorCurrent Setting: 300 mA
Expected SystemBackpressure: 16.5 MPa (2400 psi) (with concentrator
column in line)
ExpectedBackgroundConductivity: 2–3 µS
PREPARATION OF SOLUTIONS AND REAGENTSEluent Solutions20 mM Sodium hydroxide (IC eluent)
Dilute 1.60 g of 50% (w/w) sodium hydroxide withdegassed, deionized water (having a specific resistance of17.8 MΩ-cm or greater) to a final weight of 1000 g in theeluent bottle. Avoid the introduction of carbon dioxidefrom air.
200 mM Sodium hydroxide (IC eluent and AG10 trapcolumn regeneration)
Dilute 16.00 g of 50% (w/w) sodium hydroxide withdegassed, deionized water (having a specific resistance of17.8 MΩ-cm or greater) to a final weight of 1000 g in theeluent bottle. Avoid the introduction of carbon dioxidefrom air.
Standard SolutionsStock standard solution (1000 mg/L)
Use Dionex or commercially available 1000 mg/L ionstandard solution.
Working standard solution (1 mg/L)To prepare a mixed working standard solution,
combine 1.00 mL of each anion stock solution withdeionized water and dilute to a final volume of 1000 mL.
CALIBRATIONPrepare calibration standards at a minimum of three
concentration levels by diluting the working standard.Select a range similar to the expected concentrations in thesamples. The method of standard addition (adding one ormore increments of a standard solution to sample aliquotsof the same size) can be used to minimize the effect of theconcentrated acid matrix on the measured conductivity ofthe analytes of interest.3
To minimize dilution of the concentrated acid sample,it is recommended that small aqueous aliquots be used forthe method of standard addition. Each of these additionswill have a consistent volume while the concentration forthe anions of interest varies. A convenient sample size forspiked standards in 85% phosphoric acid is 20 mL (34 g)with a 0.020 mL aqueous spike. This represents a dilutionof 0.1% (0.020 mL spike/20 mL sample = 0.1% dilution).To minimize introducing contamination through samplehandling, the concentrated acid can be dispensed directlyinto the sample container, by weight, on a top-loadingbalance. Table 1 illustrates how aqueous standards arediluted and prepared. The following formula can be used tocalculate concentrations in mg/L for dilutions:
(Conc. of stock solution, mg/L) * (Vol. of stock solution, mL) =(Conc. of dilute standard, mg/L) * (Vol. of dilute standard, mL)
Technical Note 44 3
IONPAC AG10 TRAP COLUMN REGENERATIONThe AG10 column must first be regenerated. Monitor-
ing the blank will indicate when regeneration is necessary.Typically, monthly regeneration is necessary, but it willdepend on the quality of the deionized water and usage rateof the instrument. Increased contamination in the waterblank indicates that the AG10 needs to be regenerated. Theprocedure is as follows:1. Pump 200 mM sodium hydroxide through the AG10
at 1.0 mL/min for 50 minutes.2. Follow with a rinse of deionized water at the same
flow rate for 20 minutes.
DISCUSSION OF METHODThis method addresses the challenge of determining
trace concentrations of contaminant ions such as nitrate,chloride, and sulfate in a matrix composed of a highconcentration of phosphate ion. This is accomplished intwo steps: an ion-exclusion (ICE) pre-separation followedby injection of a portion of the ICE separation to an ionchromatographic (IC) separation.
The ion-exclusion mechanism separates ionizedspecies from nonionized or weakly ionized species. Thisoccurs because of a negatively charged hydration shell onthe stationary phase surface called the Donnan membrane.4
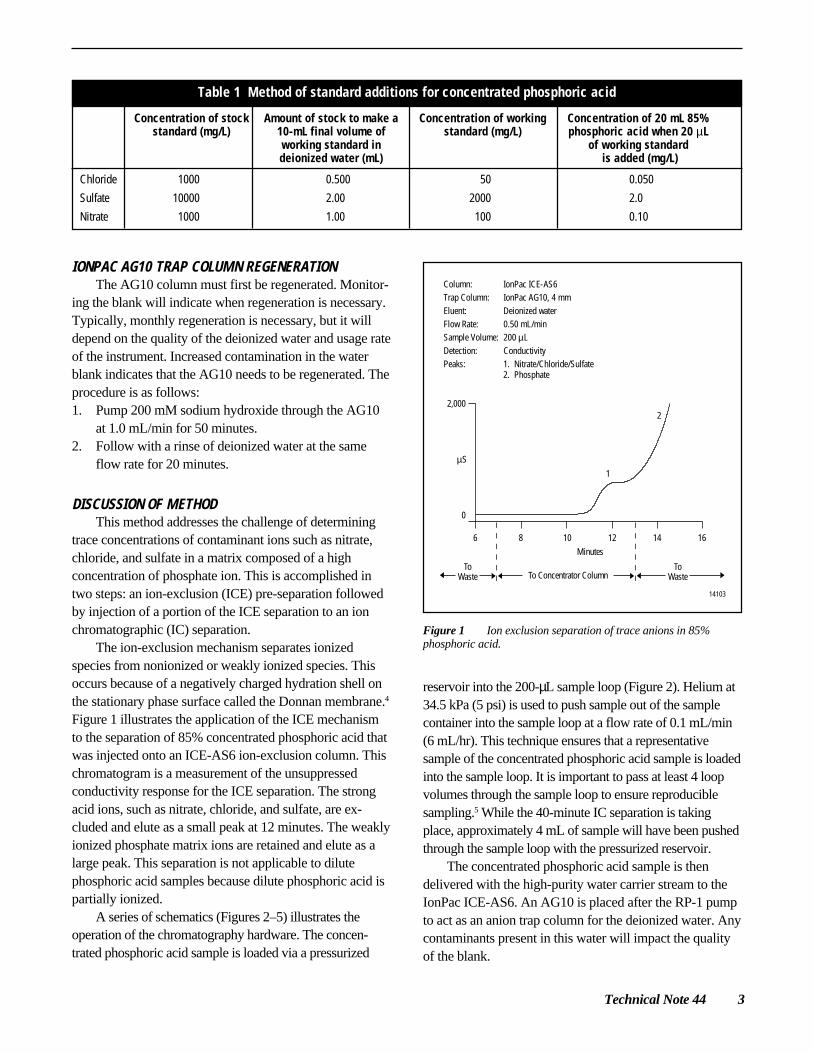
Figure 1 illustrates the application of the ICE mechanismto the separation of 85% concentrated phosphoric acid thatwas injected onto an ICE-AS6 ion-exclusion column. Thischromatogram is a measurement of the unsuppressedconductivity response for the ICE separation. The strongacid ions, such as nitrate, chloride, and sulfate, are ex-cluded and elute as a small peak at 12 minutes. The weaklyionized phosphate matrix ions are retained and elute as alarge peak. This separation is not applicable to dilutephosphoric acid samples because dilute phosphoric acid ispartially ionized.
A series of schematics (Figures 2–5) illustrates theoperation of the chromatography hardware. The concen-trated phosphoric acid sample is loaded via a pressurized
reservoir into the 200-µL sample loop (Figure 2). Helium at34.5 kPa (5 psi) is used to push sample out of the samplecontainer into the sample loop at a flow rate of 0.1 mL/min(6 mL/hr). This technique ensures that a representativesample of the concentrated phosphoric acid sample is loadedinto the sample loop. It is important to pass at least 4 loopvolumes through the sample loop to ensure reproduciblesampling.5 While the 40-minute IC separation is takingplace, approximately 4 mL of sample will have been pushedthrough the sample loop with the pressurized reservoir.
The concentrated phosphoric acid sample is thendelivered with the high-purity water carrier stream to theIonPac ICE-AS6. An AG10 is placed after the RP-1 pumpto act as an anion trap column for the deionized water. Anycontaminants present in this water will impact the qualityof the blank.
Concentration of stock Amount of stock to make a Concentration of working Concentration of 20 mL 85%standard (mg/L) 10-mL final volume of standard (mg/L) phosphoric acid when 20 µL
working standard in of working standarddeionized water (mL) is added (mg/L)
Chloride 1000 0.500 50 0.050
Sulfate 10000 2.00 2000 2.0
Nitrate 1000 1.00 100 0.10
Table 1 Method of standard additions for concentrated phosphoric acid
Figure 1 Ion exclusion separation of trace anions in 85%phosphoric acid.
Column: IonPac ICE-AS6Trap Column: IonPac AG10, 4 mmEluent: Deionized waterFlow Rate: 0.50 mL/minSample Volume: 200 µLDetection: ConductivityPeaks: 1. Nitrate/Chloride/Sulfate
2. Phosphate
6 8
1
22,000
µS
0
10Minutes
ToWaste
ToWasteTo Concentrator Column
12 14 16
14103

4 The Determination of Trace Anions in Concentrated Phosphoric Acid
The first portion of the ICE separation from 0.0 to 7.0minutes is sent to waste (Figure 3). Then, the concentratorcolumn is placed in-line with the ICE column and the portionfrom 7.0 to 13.0 minutes is captured on the concentratorcolumn (Figure 4). After 13.0 minutes the 4-mm AG11-HCconcentrator column is placed in-line with the 2-mmAS11-HC analytical column set and the concentrated ionsare separated (Figure 5). This time window should ensurethe concentration of all the nitrate, chloride, and sulfatewith minimal concentration of phosphate.
The IC separation utilizes the AS11-HC with anisocratic eluent of 20 mM sodium hydroxide. The highcapacity of the AS11-HC allows injection of these rela-tively concentrated samples without overloading. Figure 6
Figure 3 First portion of the ICE separation (time 0.0–7.0 min).
Sample
DIH2O
GP50Eluent In
AnalyticalColumns
ConcentratorColumn
12
34
5
61
2
34
5
6
SampleLoop
AG10TrapColumn
SampleValve
ICE-A&6
InjectionValve
Waste
Waste
SampleIn
ICE-AS6
RP-1
AG11-HC
AG11-HC, 4 mm
AS11-HC2 mm
Figure 2 Loading the sample loop.
Sample
DIH2O
GP50Eluent In
AnalyticalColumns
ConcentratorColumn
12
34
5
61
2
34
5
6
RP-1
SampleLoop
AG10TrapColumn
SampleValve
ICE-A&6
InjectionValve
AG11-HC
AG11-HC, 4 mm
AS11-HC2 mm
Waste
Waste
SampleIn
ICE-AS6
shows a separation of the common anions with the 4-mmAS11-HC under standard conditions. The attractive featureof this separation is that phosphate elutes last.
A 2-mm microbore column was chosen because it hasa 4-fold increase in mass sensitivity over the standard borecolumn. This facilitates faster loop loading because smallersample amounts are required. The microbore format alsooffers low eluent consumption as well as less wastegeneration. An IonPac AG11-HC ion exchange columnwas used as the concentrator column in the 50 x 4 mmformat instead of 50 x 2 mm because the 4-mm columnhad four times more capacity than the 2-mm column andlower back pressure at the microbore flow rate. Nosignificant degradation in separation efficiency was
14096
14097

Technical Note 44 5
Figure 4 Concentrating the "cut" portion from the ICE separation (time 7.0–13.0 min).
Sample
DIH2O
GP50Eluent In
AnalyticalColumns
Inj.
12
34
5
6
1
2
3
4
5
6
SampleLoop
AG10TrapColumn
Waste
SampleIn
SampleValve
Waste
ICE-AS6
InjectionValve
RP-1
AG11-HC AS11-HC2 mm
AG11-HC, 4 mmConcentrator Column
Figure 5 Separating the retained ions.
observed when coupling a 4-mm concentrator column witha 2-mm analytical column set.
For this method the AS11-HC standard conditionswere modified. The eluent strength was reduced from30 mM to 20 mM sodium hydroxide to optimize theseparation of the trace anions from the excess of phosphatematrix ions. The method was run at ambient temperature.
During the IC separation, the pressurized vessel isfilling the sample loop for the next analysis. The deionizedwater rinses the ICE-AS6 and associated tubing to ensurethere is no contamination from the previous sample.
After the phosphate has eluted from the column, theeluent concentration is stepped from 20 to 200 mM sodiumhydroxide for 5 minutes. This ensures that the column is
rinsed of residual phosphate. The method returns thesystem to equilibrate at 20 mM sodium hydroxide for thenext injection. If this cleanup step is not used, phosphatewill continue to build up on the analytical column andcause a gradual decrease in retention time for phosphateand the other analytes.
SYSTEM PREPARATION AND TESTRefer to the system configuration schematics in
Figures 2–5 and Table 2, which summarize the types andlengths of tubing required for system configuration. Thechromatography hardware is divided into two parts: theion-exclusion pretreatment portion with the ICE-AS6 andthe IC analysis portion with the AS11-HC.
14098
14099
Sample
DIH2O
GP50Eluent In
AnalyticalColumns
Load
AG11-HC, 4 mmConcentrator Column
12
34
5
6
1
2
3
4
5
6
SampleLoop
AG10TrapColumn
Waste
SampleIn
SampleValve
Waste
ICE-AS6
InjectionValve
RP-1
AG11-HC AS11-HC2 mm

6 The Determination of Trace Anions in Concentrated Phosphoric Acid
IC SYSTEM1. Prepare the ASRS by following the Quickstart
instructions (Dionex Document 031368-01) includedwith the Instructions and Troubleshooting Guide forthe ASRS.
2. Install the 2-mm AG11-HC and AS11-HC column setby using the red 0.125-mm (0.005 in.) tubing. Tominimize dead volume, use the smallest possiblelengths of tubing and ensure that the ends of the tubingare smooth and level.
3. Construct a 5-µL sample loop by cutting a 9.9-cm(3.9 in.) portion of the black 0.25-mm (0.010 in.)PEEK tubing.
4. Install this loop in place of the 4-mm AG11-HCconcentrator column between ports 1 and 4 of theinjection valve in the IC analysis system.
5. Install the ASRS and configure it in the external watermode as described in the SRS manual.
6. Establish eluent flow through the 2-mm AG11-HCand AS11-HC analytical column set. The expectedbackground conductivity is 2–3 µS. (Note: For traceanalysis, it will take at least 5 hours for the system toachieve a stable background conductivity.)
Connection Tubing Length RemarksPoints Description (cm)
ICE exit Green 30to Port 5 0.75 mm (0.030 in.)
ICE input Green 70to Port 3 0.75 mm (0.030 in.)
Port 1 to Green 44 200-µL samplePort 4 0.75 mm (0.030 in.) loop
4-mm AG11-HC Red 3 Should be as shortto Port 4 0.125 mm (0.005 in.) as possible
4-mm AG11-HC Black 25to Port 1 0.25 mm (0.010 in.)
Port 3 to Red 3 Should be as shortanalytical 0.125 mm (0.005 in.) as possiblecolumn
Table 2 Details of tubing configuration for traceanions in phosphoric acid
10
µS
0
0 2 64 8 10Minutes
12
3
45
6
7
Column: IonPac AS11-HC, 4 mmEluent: 30 mM Sodium hydroxideTemperature: 30 °CFlow Rate: 1.5 ml/minInj. Volume: 10 µLDetection: Suppressed conductivity,
AutoSuppression mode
Figure 6 Isocratic separation of the common anions.
7. Verify proper operation of the IC portion of thesystem by injecting a low-level ppm standard toreplicate the column test chromatogram.
8. Remove the 5-µL sample loop and install the 4-mmAG11-HC concentrator column. Make sure that thearrow indicating flow on the column is pointed fromport 1 to port 4 and that the tubing length connectingthe outlet of this column and port 4 is as short aspossible.
9. Configure the IC valve so that the 4-mm AG11-HCconcentrator column is in-line with the 2-mmAG11-HC and AS11-HC analytical column set. Checkfor leaks. The expected system backpressure for thesethree columns at 0.38 mL/min is ~2,400 psi (16.5 MPa).
ION-EXCLUSION SAMPLE PRETREATMENT SYSTEMThis section describes the preparation of the pretreat-
ment portion of the system. It is important that the sametype and length of tubing as described in Table 2 be usedto successfully perform this analysis. Changes in tubinglength will result in a different “cut” from the ICE-AS6column being delivered to the AS11-HC concentratorcolumn.
Peaks: 1. Fluoride 2 mg/L (ppm)2. Chloride 53. Nitrite 104. Sulfate 105. Bromide 206. Nitrate 207. Phosphate 30
13339
Technical Note 44 7
1. Cut a 44-cm (17 in.) portion of the 0.75-mm (0.030in.) PEEK green tubing to make a 200-µL sample loopand install this loop between port 1 and 4 of thesample valve.
2. Prepare the AG10 trap column according to thedirections in the section titled “IonPac AG10 TrapColumn Regeneration.” (Caution: Before the AG10 isinstalled in the system it is important that the sodiumhydroxide solution used for storage or cleaning becompletely rinsed away. The ICE-AS6 is notcompatible with sodium hydroxide eluents.)
3. The entire pathway from the RP-1 pump to port 5 ofthe IC valve is plumbed with the 0.75 mm (0.030 in.)PEEK green tubing. Install the AG10 at the exit portof the RP-1 pump.
4. Install the ICE-AS6 column using a 70-cm piece ofgreen tubing between the exit of the ICE-AS6 and port5 of the injection valve. Use a 30-cm portion of greenPEEK tubing between port 3 of the sample valve andthe input of the ICE-AS6.
5. Check to see that there is about 34.5 kPa (5 psi) ofhead pressure on the incoming deionized water thatfeeds the RP-1 pump.
6. Connect the exit port of the reagent reservoir to port 5of the sample valve with the 0.75-mm (0.030 in.)green tubing.
7. Configure a waste line from port 6 of the sample valvewith the green tubing.
8. Connect the reagent reservoir to helium pressure ofabout 34.5 KPa (5 psi).
9. Begin with a container filled with deionized wateras a sample to rinse the sample lines of any tracecontamination.
10. Set a flow rate of 0.50 ± 0.02 mL/min for the RP-1pump by adjusting the dial on the pump. This shouldbe measured with the 4-mm AG11-HC concentratorcolumn out of line. Measure the flow rate by collect-ing the waste coming out of port 6 of the IC valve. It iscritical for the success of this method that the flow ratebe consistent.
11. Pump deionized water at 0.50 mL/min through theICE-AS6 to waste without the 4-mm AG11-HC in linefor 1 hour. This will remove the 0.4 mMheptafluorobutyric acid storage solution. Sulfate isusually found in the blank. Typical initial blank sulfatevalues will be ~200 µg/L.
12. The ICE-AS6 can be further conditioned by rinsing itwith 100 mM phosphoric acid for 2 hours at 0.50 mL/minfollowed by a 1-hour rinse with 17.8 MΩ-cm deion-ized water. This will reduce the sulfate blank to150 µg/L or less. Continue to monitor the blank,especially when starting up the system after it has beenidle for more than two days.
SYSTEM OPERATIONAfter all aspects of the instrumentation have been
prepared, the system is ready for analysis.1. Load the PeakNet method shown in Table 3.2. Fill the 200-µL sample loop with deionized water.
Use helium gas pressure to push the deionized watersample using the reagent reservoir (Figure 2).
3. Analyze a blank by loading deionized water as thesample. It may take several runs until the system hasbeen rinsed of contamination.
4. After an acceptable blank has been established, thesystem is ready for analysis.
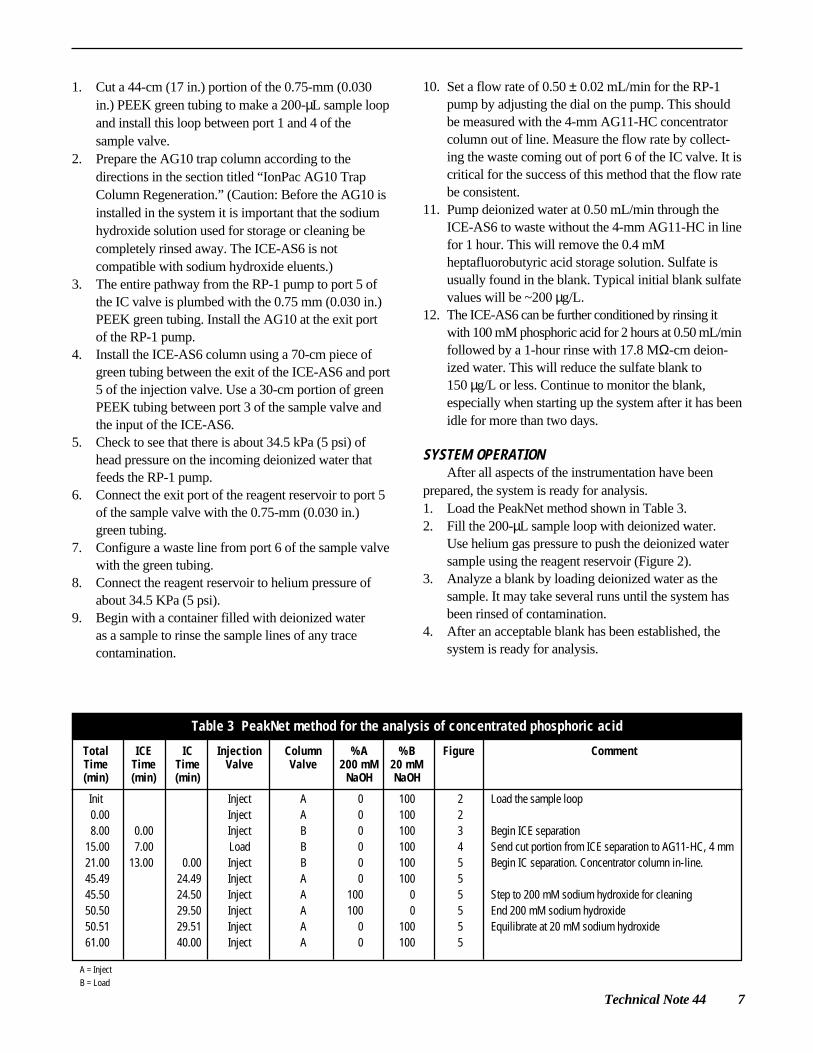
Total ICE IC Injection Column %A %B Figure CommentTime Time Time Valve Valve 200 mM 20 mM(min) (min) (min) NaOH NaOH
Init Inject A 0 100 2 Load the sample loop0.00 Inject A 0 100 28.00 0.00 Inject B 0 100 3 Begin ICE separation
15.00 7.00 Load B 0 100 4 Send cut portion from ICE separation to AG11-HC, 4 mm21.00 13.00 0.00 Inject B 0 100 5 Begin IC separation. Concentrator column in-line.45.49 24.49 Inject A 0 100 545.50 24.50 Inject A 100 0 5 Step to 200 mM sodium hydroxide for cleaning50.50 29.50 Inject A 100 0 5 End 200 mM sodium hydroxide50.51 29.51 Inject A 0 100 5 Equilibrate at 20 mM sodium hydroxide61.00 40.00 Inject A 0 100 5
Table 3 PeakNet method for the analysis of concentrated phosphoric acid
A = InjectB = Load

8 The Determination of Trace Anions in Concentrated Phosphoric Acid
5. Exercise caution when handling concentrated phos-phoric acid. Consult the applicable Material SafetyData Sheet (MSDS) for specific details about protec-tive equipment, reactivity, storage, disposal, andhealth effects.
6. Concentrated phosphoric acid, 85% (w/w), can beloaded directly into the 200-µL loop by the reagentdelivery module. At this concentration the phosphoricacid is viscous and moves slowly to fill the sampleloop. Ensure that the loop has had enough sample passthrough by collecting the liquid that exits port 6 of thesample pretreatment valve. A good practice is to loadat least 4 loop volumes. The method is set up so thatthe reagent reservoir pushes sample into the sampleloop during the IC separation. With a pressure of34.5 KPa (5 psi), 4 mL of concentrated phosphoricacid will have been passed through the sample loop in40 minutes.
7. Ensure that the RP-1 pump is consistently delivering0.50 ± 0.02 mL/min. Figure 7 illustrates what happenswhen the flow rate is faster or slower. At the slowerflow rate, not enough of the sample is cut from theICE separation, resulting in incomplete recovery of theanions of interest. At the faster flow rate, too much ofthe ICE separation is cut, resulting in the phosphatepeak almost obscuring the analytes of interest.
8. Other factors will also affect the quality and consis-tency of the ICE preseparation. Changing the cut timewindow specified in the method (7.0 to 13.0 minutes)will impact the amount of analyte and matrix ions thatare delivered to the concentrator column. Varying thesample volume will also affect the character of theICE separation. For example, doubling the samplevolume from 200 to 400 µL increases the sensitivityfor trace determinations. Method development will beneeded to ascertain the impact of any changes fromthe specified method.
9. Quantifying the levels of anions in phosphoric acid isbest accomplished by the method of standard addi-tions. This involves adding one or more increments ofa standard solution to sample aliquots of the same size(see the Calibration section).
40
µS
0
0 5
1
2
A
B
C
1510 20 25Minutes
40
µS
0
0 5 1510 20 25Minutes
40
µS
0
0 5 1510 20 25Minutes
3
3
3
1
2
1
2
Ion ExclusionColumn: IonPac ICE-AS6Trap Column: IonPac AG10, 4 mmEluent: Deionized waterFlow Rate: A: 0.55 mL/min
B: 0.50 mL/minC: 0.45 mL/min
Ion ChromatographyAnalytical Column: IonPac AS11-HC,
2 mmGuard Column: IonPac AG11-HC,
2 mmConcetrator IonPac AG11-HC,Column: 4 mm
Figure 7 Effect of ICE eluent flow rate on IC separation.
Eluent: 20 mM Sodium hydroxidestep to 200 mM Sodiumhydroxide
Flow Rate: 0.38 mL/minSample Volume: 200 µLDetection: Suppressed conductivity,
ASRS-ULTRA,AutoSuppressionexternal water mode
Peaks: 1. Unidentified2. Unidentified3. Phosphate
14381

Technical Note 44 9
RESULTS AND DISCUSSIONA representative blank is shown in Figure 8. It was
found that after concentrated phosphoric acid had been inthe sample loop pathway, several runs of deionized waterwere required to completely rinse away the high concentra-tion of phosphate matrix ions. A blank was establishedafter seven replicate runs yielded reproducible results.These levels, quantified based on a calibration curve forthese ions in deionized water, are below the expectedconcentrations for high-purity grade concentrated phos-phoric acid. The anion values, of this deionized waterblank, were subtracted from the levels found in theconcentrated phosphoric acid samples. A small amount ofphosphate was detected in the blank, as carryover fromprevious injections. This will not significantly impactsample analysis.
A chromatogram for the analysis of 85% (w/w)phosphoric acid is shown in Figure 9. The large phosphatematrix (peak 5) is well separated from the anions ofinterest. Chloride determination was hampered by a dipbefore the peak. A feature in the PeakNet chromatographysoftware called “void treatment” was utilized to reliablyquantitate this peak. A detail of the chloride peak is shownin Figure 10. The peak that starts at 29 minutes is a resultof the step to the higher eluent concentration. Any residualphosphate left in the column is eluted with this high eluentconcentration.
To verify proper quantification of analytes in thephosphoric acid matrix, increasing concentrations ofchloride, nitrate, and sulfate were added into 85% phos-phoric acid. Spikes of 30, 100, and 300 µg/L of chloride;100, 300, and 1000 µg/L of nitrate; and 300, 1000, and3000 µg/L of sulfate yielded coefficients of determination(r2) values greater than 0.99.
Based on this calibration curve, a spike of 50 µg/Lchloride, 2000 µg/L sulfate, and 100 µg/L nitrate yieldedrecoveries between 84 and 111%. These values are withinthe SEMI (Semiconductor Equipment and MaterialsInternational) recommended guidelines of 75–125%recovery at 50% of the specified maximum limit ofimpurity. Table 4 summarizes the spike/recovery data.
To determine method precision, a sample of a high-purity grade 85% phosphoric acid was analyzed by thismethod. For n=7, a relative standard deviation (RSD) ofless than 6% was obtained for 34 µg/L chloride and 730 µg/Lsulfate. Nitrate levels were determined to have an averageconcentration of 16 µg/L with an RSD of 21%. At theselow nitrate concentrations, partial coelutions of otheranalytes with nitrate cause a higher variability in the nitratepeak integration.
20
µS
0
0 10 3020 40Minutes
1 2
3
4
5
Figure 8 Representative blank.
Figure 9 Determination of trace anions in high purity 85%phosphoric acid.
20
µS
0
0 10 3020 40Minutes
1
5
4
3
2
200 mM Sodiumhydroxide clean up
Ion Exclusion (ICE) IonPac ICE-AS6Pretreatment Column:ICE Eluent: Deionized waterICE Flow Rate: 0.50 mL/minSample Volume: 200 µLColumn: IonPac AG11-HC, AS11-HC,
2 mmIC Eluent: 20 mM Sodium hydroxideIC Flow Rate: 0.38 mL/minDetection: Suppressed conductivity, ASRS,
AutoSuppression external water mode
Peaks: 1. Chloride 36 µg/L (ppb)2. Unidentified -3. Sulfate 7504. Nitrate 155. Phosphate -
13918
Ion ExclusionColumn: IonPac ICE-AS6Trap Column: IonPac AG10, 4 mmEluent: Deionized waterFlow Rate: 0.50 mL/minIon ChromatographyAnalytical Column: IonPac AS11-HC, 2 mmGuard Column: IonPac AG11-HC, 2 mmConcetratorColumn: IonPac AG11-HC, 4 mmEluent: 20 mM Sodium hydroxide
step to 200 mMSodium hydroxide
Flow Rate: 0.38 mL/minSample Volume: 200 µL
14382
Detection: Suppressed conductivity,ASRS-ULTRA, AutoSuppressionexternal water mode
Peaks: 1. Chloride 1.6 µg/L2. Unidentified -3. Sulfate 1554. Nitrate 3.55. Phosphate -

10 The Determination of Trace Anions in Concentrated Phosphoric Acid
Method detection limits (MDLs) were calculatedusing the standard deviation of seven replicate injectionsmultiplied by the Student’s t-value for the 99.5% confi-dence level. MDLs for chloride, sulfate, and nitrate are inthe low µg/L (ppb) range. The MDLs for this method aresubstantially below the maximum limit of impurityguidelines for phosphoric acid6 established by SEMI forthe purest grade of phosphoric acid, as shown in Table 5.
PRECAUTIONSExercise caution when handling concentrated phos-
phoric acid. Consult the Material Safety Data Sheet(MSDS) for more specific details about protective equip-ment, reactivity, and health effects. Use only the highestquality deionized water for the preparation of standardsand eluents. Any ionic contamination present in thedeionized water will adversely affect results. Tefloncontainers are recommended for holding the concentratedacid samples for delivery to the sample loop. Containersshould be soaked for at least 24 hours with 17.8 MΩ-cmdeionized water prior to use. It is good practice to dedicateall containers for trace analysis and keep them filled withdeionized water when not in use.
Method success depends on maintaining a consistentflow rate of deionized water from the RP-1. Verify that theflow rate is 0.50 ± 0.02 mL/min. If the deionized watercontainer feeding the RP-1 pump is not pressurized to at least34.5 KPa (5 psi), the pump may be prone to losing prime.
Do not leave concentrated phosphoric acid in thesample loop and sample inlet lines for more than 6 hours.The PEEK tubing can degrade after extended contact timewith the concentrated acidic sample.
4
µS
0
Minutes
6.05.04.03.4
1
Ion ExclusionColumn: IonPac ICE-AS6Trap Column: IonPac AG10, 4 mmEluent: Deionized waterFlow Rate: 0.50 mL/minIon ChromatographyAnalytical Column: IonPac AS11-HC,
2 mmGuard Column: IonPac AG11-HC,
2 mmConcetratorColumn: IonPac AG11-HC,
4 mm
Figure 10 Detail of chloride peak.
14383
Eluent: 20 mM Sodium hydroxidestep to 200 mMSodium hydroxide
Flow Rate: 0.38 mL/minSample Volume: 200 µLDetection: Suppressed conductivity,
ASRS-ULTRA,AutoSuppressionexternal water mode
Peaks: 1. Chloride 6.0 µg/L
Anion Method Detection Limits SEMI C7.11-93(µg/L) Specification (µg/L)
Chloride 0.15 1000Sulfate 31 8000Nitrate 2.5 200
Table 5 Method detection limits and SEMI specifica-tions for trace anions in high purity phosphoric acid
Method Detection Limit = (SD) x (ts)99.5% where (ts) is for a single-sided Student's t-testdistribution for n = 7.
Anion Phosphoric Spike (µg/L) Found-Blank Recovery (%)Acid Blank (µg/L ± SD)(µg/L ± SD)*
Chloride 34 ± 2.1 50 51 ± 2.1 102Sulfate 730 ± 40 2000 2220 ± 44 111Nitrate 16 ± 3.4 100 84 ± 4.3 84
Table 4 Spike recovery of trace anions in 85%phosphoric acid
* corrected for system blankFor n = 7

Technical Note 44 11
REFERENCES1. Watanabe, K. Presented at the International Ion
Chromatography Symposium, Dallas, TX, October1995; Poster 66.
2. Wu, M.; Chen, J. Micro. 15(10), 1997, 74.3. Bader, M. J. Chem Educ. 57, 1980, 730.4. Weiss, J. Ion Chromatography, 2nd ed., VCH,
Weinheim, Germany, 1995, 209–210.5. “Troubleshooting Guide for HPLC Injection Prob-
lems.” Rheodyne: Cotati, CA, 1992.6. SEMI International Standards: Semiconductor
Equipment and Materials International, MountainView, CA, Chemical/Reagents Volume, 1997.
LIST OF SUPPLIERSFisher Scientific, 711 Forbes Ave., Pittsburgh, PA
15219-4785, USA. Tel: 1-800-766-7000VWR Scientific, P.O. Box 7900, San Francisco, CA
94120, USA. Tel: 1-800-932-5000

Printed on recycled and recyclable paper with soy-based inks.
IonPac, AutoSuppression, ASRS, and Anion Self-RegeneratingSuppressor are registered trademarks of Dionex Corporation.
LPN 1084-01 3M 06/02© 2002 Dionex Corporation
Dionex Corporation Dionex Corporation Dionex U.S. Regional Offices Dionex International Subsidiaries1228 Titan Way Salt Lake City Technical Center Sunnyvale, CA (408) 737-8522 Austria (01) 616 51 25 Belgium (32) 3-353 42 94 Canada (905) 844-9650 China (852) 2428 3282 Denmark (45) 36 36 90 90P.O. Box 3603 1515 West 2200 South, Suite A Westmont, IL (630) 789-3660 France 01 39 30 01 10 Germany 06126-991-0 Italy (06) 66 51 50 52 Japan (06) 6885-1213 The Netherlands (0161) 43 43 03Sunnyvale, CA Salt Lake City, UT Houston, TX (281) 847-5652 Switzerland (062) 205 99 66 United Kingdom (01276) 69172294088-3603 84119-1484 Atlanta, GA (770) 432-8100 * Designed, developed, and manufactured under an NSAI registered ISO 9001 Quality System.(408) 737-0700 (801) 972-9292 Marlton, NJ (856) 596-06009