tnf-alpha inhibitors for ankylosing spondylitis and axial
TRANSCRIPT

TNF-alpha inhibitors for ankylosing spondylitis and axial spondyloarthritis
without radiographic evidence of ankylosing spondylitis (including a review of technology appraisal 143 and technology appraisal 233)
Assessment Report Commercial in Confidence stripped version for consultation
Produced by: CRD/CHE Technology Assessment Group (Centre for Reviews
and Dissemination/Centre for Health Economics), University of York
STRICTLY CONFIDENTIAL

CONFIDENTIAL UNTIL PUBLISHED
Assessment Group’s Report
TNF-alpha inhibitors for ankylosing spondylitis and axial
spondyloarthritis without radiographic evidence of ankylosing
spondylitis (including a review of technology appraisal 143 and
technology appraisal 233)
Produced by CRD/CHE Technology Assessment Group (Centre for Reviews and
Dissemination/Centre for Health Economics), University of York
Authors Mark Corbett, Research Fellow, CRD
Marta Soares, Senior Research Fellow, CHE
Gurleen Jhuti, Research Fellow, CHE
Stephen Rice, Research Fellow, CRD
Eldon Spackman, Research Fellow, CHE
Elefthirios Sideris, Research Fellow, CHE
Thirimon Moe-Byrne, Research Fellow, CRD
Dave Fox, Information Specialist, CRD
Helena Marzo-Ortega, Consultant Rheumatologist and Honorary
Clinical Associate Professor, Leeds Teaching Hospitals NHS Trust and
University of Leeds
Lesley Kay, Consultant Rheumatologist, The Newcastle upon Tyne
Hospitals NHS Foundation Trust
Nerys Woolacott, Senior Research Fellow, CRD
Stephen Palmer, Professor of Health Economics, CHE
Correspondence to Nerys Woolacott, CRD, University of York, York YO10 5DD
Date completed 12/12/2014
Source of funding
This report was commissioned by the NIHR HTA Programme as project number 13/46/01.

15/12/2014 2
Declared competing interests of the authors
LJK has received sponsorship to attend meetings by AbbVie and MSD in 2014. HMO has received
grants, sponsorship and/or honoraria from Abbvie, Janssen, MSD, Pfizer and UCB. All other authors
have no personal or pecuniary conflicts of interest.
Acknowledgements
We acknowledge Nicky Welton, Reader in Evidence Synthesis, School of Social and Community
Medicine, University of Bristol, for the guidance provided in the development of the synthesis model.
Rider on responsibility for report
The views expressed in this report are those of the authors and not necessarily those of the NIHR
HTA Programme. Any errors are the responsibility of the authors.
This report should be referenced as follows:
Corbett M, Soares M, Jhuti G, Rice S, Spackman E, Sideris E, Moe-Byrne T, Fox D, Marzo-Ortega
H, Kay L, Woolacott N, Palmer S. TNF-alpha inhibitors for ankylosing spondylitis and axial
spondyloarthritis without radiographic evidence of ankylosing spondylitis (including a review of
technology appraisal 143 and technology appraisal 233. CRD/CHE Technology Assessment Group
(Centre for Reviews and Dissemination/Centre for Health Economics), University of York, 2014
Contributions of authors
Mark Corbett contributed to the protocol, study selection, data extraction, validity assessment,
synthesis of the included studies, interpretation of the results and the writing of the report.
Marta Soares developed the extended synthesis model and undertook the evidence synthesis for the
purposes of the economic model. She also contributed to the development of the economic model and
the writing of the report.
Gurleen Jhuti contributed to the protocol, the development of the economic model, the review of
economic analyses, the interpretation of the results and the writing of the report.
Stephen Rice contributed to data extraction, validity assessment, undertook synthesis of the included
studies for the clinical effectiveness section, contributed to the interpretation of the results and the
writing of the report.
Eldon Spackman contributed to the development of the economic model, performed the economic
analyses and contributed to the interpretation of the results.
Eleftherios Sideris contributed to the review of economic evaluations, the development of the
economic model and the writing of the report.

15/12/2014 3
Thirimon Moe-Byrne to the protocol, study selection, data extraction, and validity assessment, of the
included studies.
Dave Fox contributed to the protocol development, developed the search strategies, conducted a range
of searches to locate studies, and wrote the sections of the report relating to the searches.
Helena Marzo-Ortega provided expert clinical advice, contributed to the protocol, interpretation of the
results and commented on drafts of the report.
Lesley Kay provided expert clinical advice, contributed to the protocol, interpretation of the results
and commented on drafts of the report.
Stephen Palmer had overall responsibility for the cost-effectiveness sections. He contributed to the
protocol development and to all aspects of the cost-effectiveness work including the writing of the
report.
Nerys Woolacott contributed to the protocol, study selection, data extraction, validity assessment,
synthesis of the included studies, interpretation of the results and the writing of the report, and took
overall responsibility for the clinical effectiveness section.
Note on the text
All commercial-in-confidence (CIC) data have been highlighted in blue and underlined, all academic-
in-confidence (AIC) data are highlighted in yellow and underlined

15/12/2014 4
Table of Contents
List of abbreviations 15
Glossary 18
1 Scientific Summary 23
1.1 Background 23
1.2 Objectives 23
1.3 Methods 23
1.4 Results 24
1.5 Discussion 27
1.6 Conclusions 28
2 Background 29
2.1 Description of health problem 29
2.2 Current service provision 33
2.3 Description of technology under assessment 34
3 Definition of decision problem 34
3.1 Decision problem in terms of PICOS and other key issues 34
3.2 Previous NICE appraisals 34
3.3 Overall aims and objectives of assessment 35
4 Assessment of Clinical Effectiveness 35
4.1 Methods for reviewing effectiveness 35
4.1.1 Inclusion criteria 35
4.1.2 Searches 37
4.1.3 Data extraction 37
4.1.4 Critical appraisal 38
4.1.5 Methods of data synthesis 38
4.2 Clinical Effectiveness Results 40
4.2.1 Quantity and quality of research available 40
4.2.2 Clinical effectiveness results – efficacy results from RCTs 54
4.2.2.2 Individual anti-TNFs compared with placebo 56
4.2.2.3 Individual anti-TNFs compared with each other 62
4.2.2.4 Anti-TNFs as a class compared with placebo 63
4.2.2.5 Outcomes not included in the meta-analyses 65
4.2.2.6 ‘Placebo’ response in AS and nr-axSpA 66
4.2.2.7 Summary of some key issues arising from the FDA assessments of the ABILITY-1 and
Rapid-axSpA trials 68
15/12/2014 5
4.2.3 Long-term efficacy results from open-label extensions of RCTs 72
4.2.4 Findings from anti-TNF patient registry studies 76
4.2.4.1 Effect of anti-TNFs on radiographic progression 76
4.2.4.2 Drug survival and anti-TNF switching 79
4.2.5 Clinical effectiveness results - Adverse events 87
4.2.6 Review of natural history of AS and nr-axSpA 93
4.3 Clinical Effectiveness Summary and Conclusions 101
5 Assessment of existing cost-effectiveness evidence 105
5.1 Systematic review of existing cost-effectiveness evidence 105
5.1.1 Methods 105
5.1.2 Results of review of existing cost-effectiveness evidence 105
5.1.3 Assessment of published cost-effectiveness studies 106
5.1.4 Summary and critique of published cost-effectiveness studies 120
5.2 Summary of manufacturers’ de-novo submissions 128
5.2.1 Overview of AbbVie (adalimumab) model 128
5.2.2 Overview of UCB (certolizumab) model 132
5.2.3 Overview of Pfizer (etanercept) model 139
5.2.4 Overview of MSD (golimumab, infliximab) model 146
5.2.5 Summary and critique of de-novo cost-effectiveness submissions 150
6 Independent economic assessment: Extended synthesis 161
6.1 AS population 162
6.1.1 Brief description of the data 162
6.1.2 General aspects of implementation and software 163
6.1.3 Exploring assumptions for the relative effectiveness of individual anti-TNF treatments
(modelling approach A) 164
6.1.4 Extending the modelling approach to jointly relate outcomes (modelling approach B) 168
6.1.4.1 Joint synthesis of BASDAI outcomes 168
6.1.5 Extending the modelling framework to synthesise change in BASFI scores (modelling
approach C) 170
6.2 nr-axSpA population 172
6.2.1 Brief description of the data 172
6.2.2 Description of approaches to the synthesis 173
6.2.3 Results of the synthesis 173
6.2.4 Interpretation/discussion 174
6.3 BASDAI and BASFI scores conditional on BASDAI response 174
6.4 Discussion/conclusion 179
7 Independent economic assessment: York model 180
7.1 Overview 180

15/12/2014 6
7.2 Contribution of the York model 181
7.3 Comparators 182
7.4 Model Structure 182
7.5 Model input parameters 185
7.5.1 Baseline patient characteristics 190
7.5.2 Response, change in BASDAI/BASFI and conditional baselines 190
7.5.3 Longer term BASFI progression 190
7.5.4 Longer term discontinuation 193
7.5.5 Health-related quality of life 195
7.5.6 Resource use and costs 199
7.5.6.1 Drug acquisition costs 199
7.5.6.2 Drug administration costs 200
7.5.6.3 Initiation and monitoring costs 201
7.5.6.4 Summary of drug acquisition, administration and monitoring costs 202
7.5.6.5 Long-term disease management costs 204
7.5.7 Adverse events 204
7.5.8 Mortality 205
7.6 Analytic methods 205
7.6.1 Sensitivity analyses 205
7.6.2 Model validation 207
7.7 Results of the independent economic assessment 208
7.7.1 Base case results – AS population 208
7.7.2 Base case results – nr-axSpA population 209
7.7.3 Sensitivity analyses results – AS population 210
7.7.4 Sensitivity analyses results – nr-axSpA population 212
7.8 Discussion and comparison with manufacturer models 213
8 Assessment of factors relevant to the NHS and other parties 218
9 Discussion 219
9.2 Strengths and limitations of the assessment 221
9.3 Uncertainties 222
10 Conclusions 223
10.1 Implications for service provision 223
10.2 Suggested research priorities 224
11 Appendices 224
11.1 Appendix 1 Search strategies for clinical and economic reviews 225
11.2 Appendix 2 Synthesis methods for clinical efficacy network meta-analyses 231
11.3 Appendix 3 Risk of bias data 233

15/12/2014 7
11.4 Appendix 4 Trial results 250
11.5 Appendix 5 Relative effects of anti-TNFs 259
11.6 Appendix 6 BASDAI and BASFI conditional on response data 268
11.7 Appendix 7 Long-term efficacy data 272
11.8 Appendix 8 Adverse events 281
11.9 Appendix 9: Extended synthesis models 289
11.9.1 Modelling approach A 290
11.9.2 Modelling approach B 295
11.9.3 Modelling approach C 300
11.10 Appendix 10 Synthesis of evidence on the nr-axSpA population 303
11.11 Appendix 11 BASDAI and BASFI scores conditional on BASDAI response 305
11.12 Appendix 12: Quality assessment of studies included in the cost effectiveness review* 309
11.13 Appendix 13 Utility review 310
11.14 Appendix 14: Comparison of parameter inputs across manufacturer models 324
11.15 Appendix 15: Full ICER tables for scenarios 339
References 354

15/12/2014 8
Table of Tables
Table 1 Disease assessment tools.......................................................................................................... 31
Table 2 General trial characteristics ...................................................................................................... 43
Table 3 Baseline characteristics of trial populations............................................................................. 46
Table 4 Risk of bias assessment results ................................................................................................ 51
Table 5: The AS population model DIC statistics ................................................................................ 55
Table 6: The nr-axSpA population model DIC statistics ...................................................................... 55
Table 7 Results versus placebo for AS population – response outcomes at between 10 and 16 weeks 57
Table 8 Results versus placebo for nr-axSpA population – response outcomes at 10-16 weeks .......... 59
Table 9 Results versus placebo for AS population – continuous outcomes at 10-16 weeks ................ 61
Table 10 Results versus placebo for nr-axSpA population – continuous outcomes at 10-16 weeks .... 62
Table 11: The difference in change from baseline for BASDAI and BASFI assuming all TNFs have
the same effect and assuming infliximab may be different ................................................... 65
Table 12 Comparison of placebo response rates in trials reporting ASAS 20 results together with
ASAS 40 or BASDAI 50 results ........................................................................................... 67
Table 13 Baseline characteristics of trials analysed by the FDA .......................................................... 71
Table 14 FDA analyses - percentage differences from placebo, by method of diagnosis .................... 71
Table 15 Treatment effect over time (AS only) (results calculated using NRI) ................................... 73
Table 16 Treatment effect over time (nr-axSpA only) (results calculated using NRI) ......................... 74
Table 17 Observed or completer analysis results .................................................................................. 74
Table 18 Effect of anti-TNFs on radiographic progression .................................................................. 77
Table 19 Summary of long-term results for mSASSS change .............................................................. 78
Table 20 Drug survival results from analysis of DANBIO registry117
.................................................. 80
Table 21 Efficacy results from analysis of DANBIO registry117
.......................................................... 81
Table 22 Registry studies reporting data on drug survival and anti-TNF switching ............................ 82
Table 23 Cochrane summary of findings Table for biologics as a class (adapted from Singh et al
(2011)) ................................................................................................................................... 88
Table 24 Cochrane summary of findings Table for individual anti-TNFs (adapted from Singh et al
(2011)) ................................................................................................................................... 89
Table 25 Prevalence ranges of serious adverse events from non-randomised studies and RCTs
(reproduced from Rodgers et al.129
) ....................................................................................... 91
Table 26 Studies with adverse event data at around 2 years (or later) .................................................. 92
Table 27 Natural history of axSpA - relevant outcomes and impact of anti-TNFs .............................. 96
Table 28 - Lifetime cost per QALY estimates reported by Kobelt et al (2007) (NHS and PSS
perspective).......................................................................................................................... 108
Table 29 - BASDAI, BASFI and EQ-5D measurements at weeks 12 and 24 .................................... 109
Table 30 - 25 year cost per QALY estimates reported by Ara et al. (2007) (NHS and PSS perspective)
............................................................................................................................................. 110

15/12/2014 9
Table 31 - 30-year cost per QALY estimates reported by Botteman et al (2007) (NHS and PSS
perspective).......................................................................................................................... 112
Table 32 - Manufacturer cost-effectiveness results – 20 year horizon ............................................... 118
Table 33 - ERG exploratory cost-effectiveness results – lifetime horizon ......................................... 119
Table 34 - ERG exploratory cost-effectiveness results –correction for BASFI error (from TA233) . 119
Table 35 - ERG exploratory cost-effectiveness results –correction for BASFI error and common
BASFI progression after 2 years (from TA233) .................................................................. 120
Table 36 - TNF -alpha inhibitors compared to conventional care for AS - AbbVie (base-case) ........ 130
Table 37 - Fully incremental comparison of anti-TNFs for AS – Assessment Group analysis based on
AbbVie (base-case) ............................................................................................................. 131
Table 38 – Anti-TNFs compared to conventional care for nr-axSpA – AbbVie (base-case) ............. 131
Table 39 - Fully incremental comparison of anti-TNFs for nr-axSpA – Assessment Group analysis
based on AbbVie (base-case) .............................................................................................. 131
Table 40 - Base case model inputs: ASAS20 response at Week 24 (AS subpopulation, CZP pooled
dosing§) ............................................................................................................................... 133
Table 41 - Base case model inputs: ASAS20 response at Week 12 (nr-axSpA subpopulation, CZP
pooled dosing§) ................................................................................................................... 133
Table 42 - Base case model inputs: Change from baseline in BASFI score at Week 24 (AS
subpopulation, CZP pooled dosing§) .................................................................................. 134
Table 43 - Base case model inputs: Change from baseline in BASDAI score at Week 24 (AS
subpopulation, CZP pooled dosing§) .................................................................................. 134
Table 44 - Base case model inputs: Change from baseline in BASFI score at Week 12 (nr-axSpA
subpopulation, CZP pooled dosing§) .................................................................................. 134
Table 45 - Base case model inputs: Change from baseline in BASDAI score at Week 12 (nr-axSpA
subpopulation, CZP pooled dosing§) .................................................................................. 135
Table 46 - TNF -alpha inhibitors compared to conventional care for AS - UCB (base-case) ............ 137
Table 47 - Fully incremental comparison of anti-TNFs for AS – Assessment Group analysis based on
UCB (base-case) .................................................................................................................. 138
Table 48 - TNF -alpha inhibitors compared to conventional care for nr-axSpA - UCB (base-case) .. 138
Table 49 - Fully incremental comparison of anti-TNFs for nr-axSpA – Assessment Group analysis
based on UCB (base-case) ................................................................................................... 139
Table 50 - TNF -alpha inhibitors compared to conventional care for AS – Pfizer (base-case) .......... 145
Table 51 - Fully incremental comparison of anti-TNFs for AS – Assessment Group analysis based on
Pfizer (base-case) ................................................................................................................. 145
Table 52 - Anti-TNFs compared to conventional care for nr-axSpA - Pfizer (base-case) .................. 145
Table 53 - Fully incremental comparison of for nr-axSpA – Assessment Group analysis based on
Pfizer (base-case) ................................................................................................................. 146
Table 54 - Incremental results of etanercept vs adalimumab in nr-axSpA (using MAIC data) - Pfizer
............................................................................................................................................. 146
Table 55 – ORs and probability of BASDAI50 response to anti-TNFs and conventional therapy
(MSD) .................................................................................................................................. 147
Table 56 - Short-term regression equations used by MSD for BASDAI/BASFI (0-24 weeks) – all
patients ................................................................................................................................. 147

15/12/2014 10
Table 57 - Long-term regression equations used by MSD for BASDAI/BASFI (24-108 weeks) –
responders only .................................................................................................................... 147
Table 58 Anti-TNFs compared to conventional care for AS – MSD (base-case) ............................... 149
Table 59 - Fully incremental comparison of anti-TNFs for AS – Assessment Group analysis based on
Pfizer (base-case) ................................................................................................................. 149
Table 60 - Comparison of manufacturer ICER estimates vs conventional care (AS population) ....... 150
Table 61 - Comparison of manufacturer ICER estimates vs conventional care (nr-axSpA population)
............................................................................................................................................. 151
Table 62 - Model structure and key structural assumptions - AS population ..................................... 151
Table 63 - Model structure and key structural assumptions – nr-axSpA population .......................... 152
Table 64 - BASDAI score difference for treatment responders vs conventional care - AS Population
............................................................................................................................................. 155
Table 65 - BASFI score difference for responders vs conventional care - AS Population ................. 156
Table 66 - BASDAI score difference for responders vs conventional care - nr-axSpA Population ... 157
Table 67 - BASFI score difference for responders vs conventional care - nr-axSpA Population ...... 158
Table 68: Evidence on BASDAI and BASFI related outcomes for the AS population ...................... 163
Table 69: assumptions over the relative effectiveness of anti-TNF treatments – results .................... 166
Table 70: Shrunken estimates of treatment effect from model A5. .................................................... 167
Table 71: Modelling approach B: results ............................................................................................ 169
Table 72: Shrunken estimates of treatment effect from model B. ...................................................... 170
Table 73: Modelling approach C: results ............................................................................................ 171
Table 74: Shrunken estimates of treatment effect from model C. ...................................................... 172
Table 75: Evidence on BASDAI and BASFI related outcomes for the nr-axSpA population ........... 172
Table 76: nr-axSpA population: results .............................................................................................. 174
Table 77: Conditional scores predicted for the AS population using the synthesis model ................. 176
Table 78: Conditional scores observed in trials in AS ........................................................................ 177
Table 79: Conditional scores predicted for the nr-axSpA population using results and assumptions of
the synthesis model .............................................................................................................. 178
Table 80: Conditional scores observed in trials in nr-axSpA ............................................................. 178
Table 81 - Comparators evaluated in the different indications ........................................................... 182
Table 82 - List of parameter estimates used in the York model – AS population .............................. 186
Table 83: List of parameter estimates used in the York model – nr-axSpA population ..................... 188
Table 84 - Comparison of alternative EQ-5D utility regression models (AS) .................................... 196
Table 85- Comparison of alternative EQ-5D utility regression models (nr-axSpA) .......................... 196
Table 86 - Drug acquisition costs ....................................................................................................... 199
Table 87 Anti-TNFs licensed dosage in AS and nr-axSpA ................................................................ 200
Table 88 - Drug administration costs .................................................................................................. 200
Table 89 - Initiation and monitoring resource use and costs– AS population .................................... 202
Table 90 - Initiation and monitoring resource use and costs– nr-axSpA population .......................... 202

15/12/2014 11
Table 91 - Summary of drug acquisition, administration and monitoring costs used in economic model
– AS population ................................................................................................................... 203
Table 92 - Summary of drug acquisition, administration and monitoring costs used in economic model
– nr-axSpA population ........................................................................................................ 203
Table 93 - Disease-related costs.......................................................................................................... 204
Table 94 - Costs of serious infection (from Pfizer submission) .......................................................... 205
Table 95 - Base-case cost-effectiveness results - AS (rebound equal to gain) ................................... 208
Table 96 - Base-case cost-effectiveness results (rebound to conventional care) ................................ 208
Table 97 - Base-case cost-effectiveness results – nr-axSpA (rebound equal to gain) ........................ 209
Table 98 - Base-case cost-effectiveness results – nr-axSpA (rebound to conventional care) ............. 210
Table 99 - Summary of cost-effectiveness scenarios – AS population ............................................... 210
Table 100 - Summary of ICERs across scenarios (rebound equal to gain) – AS population ............. 211
Table 101 - Summary of ICERs across scenarios (rebound to conventional care) – AS population .. 211
Table 102 - Summary of cost-effectiveness scenarios – nr-axSpA population .................................. 212
Table 103 - Summary of ICERs across scenarios (rebound equal to gain) – nr-axSpA population ... 212
Table 104 - Summary of ICERs across scenarios (rebound to conventional care) – nr-axSpA
population ............................................................................................................................ 213
Table 105 - Comparison of cost-effectiveness results from York model vs manufacturers (AS
population) ........................................................................................................................... 215
Table 106 - Comparison of cost-effectiveness results from York model vs manufacturers (nr-axSpA
population) ........................................................................................................................... 215
Table 107 - Nr-axSpA – Additional validation scenario (rebound equal to gain and responders/non-
responders do not differ in terms of baseline BASDAI/BASFI scores) .............................. 217
Table 108: The class and independent BASDAI change from baseline of the anti-TNFs vs
placebo assuming 0.3 and 0.7 within-study correlation ................................................. 232
Table 109 Full risk of bias results ....................................................................................................... 233
Table 110 Prognostic indicators of important baseline imbalance used in risk of bias assessment .... 248
Table 111 Continuous outcomes - final values results........................................................................ 250
Table 112 Continuous outcomes - change from baseline results ........................................................ 253
Table 113: Relative effects RR BASDAI50 AS ................................................................................. 259
Table 114: Relative effects OR BASDAI50 AS ................................................................................. 259
Table 115: Relative effects RR ASAS20 AS ...................................................................................... 260
Table 116: Relative effects OR ASAS20 AS ...................................................................................... 260
Table 117: Relative effects RR ASAS40 AS ...................................................................................... 260
Table 118: Relative effects OR ASAS40 AS ...................................................................................... 261
Table 119: Relative effects RR ASAS50 AS ...................................................................................... 261
Table 120: Relative effects OR ASAS50 AS ...................................................................................... 261
Table 121: Relative effects Mean difference BASDAI change from baseline AS ............................. 262
Table 122: Relative effects Mean difference BASFI change from baseline AS ................................. 262

15/12/2014 12
Table 123: Relative effects Mean difference BASMI change from baseline AS ............................... 262
Table 124: Relative effects Mean difference SF-36 PCS change from baseline AS .......................... 263
Table 125: Relative effects Mean difference MASES change from baseline AS ............................... 263
Table 126: Relative effects Mean difference SF-36 MCS change from baseline AS ......................... 263
Table 127: Relative effects RR BASDAI 50 nr-axSpA ...................................................................... 264
Table 128: Relative effects OR BASDAI50 nr-axSpA....................................................................... 264
Table 129: Relative effects RR ASAS 20 nr-axSpA .......................................................................... 265
Table 130: Relative effects OR ASAS 20 nr-axSpA .......................................................................... 265
Table 131: Relative effects RR ASAS 40 nr-axSpA .......................................................................... 265
Table 132: Relative effects OR ASAS 40 nr-axSpA .......................................................................... 266
Table 133: Relative effects Mean difference BASDAI change from baseline nr-axSpA ................... 266
Table 134: Relative effects Mean difference BASFI change from baseline nr-axSpA ...................... 266
Table 135: Relative effects Mean difference BASMI change from baseline nr-axSpA ..................... 267
Table 136: Relative effects Mean difference SF-36 PCS change from baseline nr-axSpA ................ 267
Table 137: Relative effects Mean difference SF-36MCS change from baseline nr-axSpA ............... 267
Table 138 Baseline BASDAI according to conditional on response at week 12 (or nearest time point)
............................................................................................................................................. 268
Table 139 Baseline BASFI according to conditional on response at week 12 (or nearest time point)269
Table 140 data from open label extensions of included RCTs ........................................................... 272
Table 141 Adverse events in RCT placebo phases ............................................................................. 281
Table 142: Evidence on BASDAI and BASFI related outcomes for the AS population .................... 290
Table 143. Modelling approach A: Data ............................................................................................. 290
Table 144: Modelling approach A – results ........................................................................................ 294
Table 145: Shrunken estimates of treatment effect from model A5. .................................................. 294
Table 146. Data used in modelling approach B and C ........................................................................ 295
Table 147: Modelling approach B: results .......................................................................................... 299
Table 148: Shrunken estimates of treatment effect from model B. .................................................... 300
Table 149: Modelling approach C: results .......................................................................................... 302
Table 150: Shrunken estimates of treatment effect from model C. .................................................... 303
Table 151: Evidence on BASDAI and BASFI related outcomes for the nr-axSpA population ......... 303
Table 152. Data on the nr-axSpA population ..................................................................................... 304
Table 153: nr population: results ........................................................................................................ 304
Table 154: Conditional scores predicted for the AS population using the synthesis model ............... 307
Table 155: Conditional scores predicted for the nr-axSpA population using results and assumptions of
the synthesis model .............................................................................................................. 307
Table 156 - Summary of utility studies that meet the NICE reference case ....................................... 313
Table 157 - Summary of main model inputs in manufacturer models - AS population ..................... 324
Table 158 - Summary of main model inputs in manufacturer models - nr-axSpA population ........... 326

15/12/2014 13
Table 159 - Cost inputs in manufacturer submissions (AS & nr-axSpA population) ......................... 333
Table 160 - Withdrawal inputs in manufacturer submissions (AS & nr-axSpA population) ............. 335
Table 161 - Adverse events inputs in manufacturer submissions – AS population ............................ 337
Table 162 - Adverse events inputs in manufacturer submissions – nr-axSpA population.................. 339
Table 163 - Summary of cost-effectiveness scenarios – AS population ............................................. 340
Table 164 - AS – Scenario 1 (rebound equal to gain) ......................................................................... 340
Table 165 - AS – Scenario 2 (rebound equal to gain) ......................................................................... 341
Table 166 - AS – Scenario 3 (rebound equal to gain) ......................................................................... 341
Table 167 - AS – Scenario 4 (rebound equal to gain) ......................................................................... 341
Table 168 - AS – Scenario 5 (rebound equal to gain) ......................................................................... 342
Table 169 - AS – Scenario 1 (rebound to conventional care) ............................................................. 343
Table 170 - AS – Scenario 2 (rebound to conventional care) ............................................................. 343
Table 171 - AS – Scenario 3 (rebound to conventional care) ............................................................. 344
Table 172 - AS – Scenario 4 (rebound to conventional care) ............................................................. 344
Table 173 - AS – Scenario 5 (rebound to conventional care) ............................................................. 344
Table 174 - Summary of cost-effectiveness scenarios – nr-axSpA population .................................. 345
Table 175 - Nr-axSpA – Scenario 1 (rebound equal to gain) ............................................................. 346
Table 176 - Nr-axSpA – Scenario 2 (rebound equal to gain) ............................................................. 346
Table 177 - Nr-axSpA – Scenario 3 (rebound equal to gain) ............................................................. 347
Table 178 - Nr-axSpA – Scenario 4 (rebound equal to gain) ............................................................. 347
Table 179 - Nr-axSpA – Scenario 5 (rebound equal to gain) ............................................................. 348
Table 180 - Nr-axSpA – Scenario 6 (rebound equal to gain) ............................................................. 348
Table 181 - Nr-axSpA – Scenario 1 (rebound to conventional care) .................................................. 349
Table 182 - Nr-axSpA – Scenario 2 (rebound to conventional care) .................................................. 349
Table 183 - Nr-axSpA – Scenario 3 (rebound to conventional care) .................................................. 350
Table 184 - Nr-axSpA – Scenario 4 (rebound to conventional care) .................................................. 350
Table 185 - Nr-axSpA – Scenario 5 (rebound to conventional care) .................................................. 351
Table 186 - Nr-axSpA – Scenario 6 (rebound to conventional care) .................................................. 351
Table 187 - AS – rebound equal to gain ............................................................................................. 352
Table 188 - AS –rebound to conventional care ................................................................................... 352
Table 189 - Nr-axSpA – rebound equal to gain .................................................................................. 353
Table 190 - Nr-axSpA – rebound to conventional care ...................................................................... 353

15/12/2014 14
Table of Figures
Figure 1 Flowchart showing the number of studies identified and included ........................................ 41
Figure 2 - Illustration of the scenario of rebound equal to gain .......................................................... 123
Figure 3 - Illustration of the scenario of rebound to conventional care .............................................. 124
Figure 4 - Observed mean BASDAI and BASFI scores for adalimumab ASAS20 responders in the
licensed population from ATLAS (AS) ............................................................................... 128
Figure 5 - Observed mean BASDAI and BASFI scores for adalimumab ASAS40 responders in the
licensed population from ABILITY-1 (nr-axSpA) .............................................................. 129
Figure 6 – Pfizer DES model schematic ............................................................................................. 141
Figure 7 - Relationships between EQ-5D, BASDAI and BASFI from study 1031 (nr-axSpA
population) ........................................................................................................................... 143
Figure 8 - Relationships between EQ-5D, BASDAI and BASFI from study 314-EU (AS population)
............................................................................................................................................. 144
Figure 9 - Comparison of cohort BASDAI/BASFI scores for AS population from AbbVie model
(adalimumab) ....................................................................................................................... 154
Figure 10 - Comparison of cohort BASDAI/BASFI scores for AS population from UCB model
(certolizumab)...................................................................................................................... 154
Figure 11 - Comparison of cohort BASDAI/BASFI scores for AS population from MSD model
(golimumab/infliximab) ...................................................................................................... 155
Figure 12 - Comparison of cohort BASDAI/BASFI scores for nr-axSpA population from AbbVie
model (adalimumab) ............................................................................................................ 156
Figure 13 - Comparison of cohort BASDAI/BASFI scores for nr-axSpA population from UCB model
(certolizumab)...................................................................................................................... 157
Figure 14: Scatter plot of BASDAI and BASFI change scores observed in the trials (AS). .............. 171
Figure 15- A simplified schematic of the York model structure......................................................... 183
Figure 16- Comparison of withdrawal rates – AS population ............................................................ 194
Figure 17 - Comparison of withdrawal rates – nr-axSpA population ................................................. 195
Figure 18 - Illustration of predicted EQ-5D values using different mapping algorithms - constant
BASDAI and varying BASFI (AS) ..................................................................................... 197
Figure 19 - Illustration of predicted EQ-5D values using different mapping algorithms - constant
BASFI and varying BASDAI (AS) ..................................................................................... 197
Figure 20 - Illustration of predicted EQ-5D values using different mapping algorithms - constant
BASDAI and varying BASFI (nr-axSpA) ........................................................................... 198
Figure 21 - Illustration of predicted EQ-5D values using different mapping algorithms - constant
BASFI and varying BASDAI (nr-axSpA) ........................................................................... 198
Figure 22 Comparison of main manufacturer cost regressions – assuming constant BASDAI.......... 329
Figure 23 Comparison of main manufacturer cost regressions – assuming constant BASFI ............. 330
Figure 24 Comparison of AbbVie cost regressions – assuming constant BASDAI ........................... 331
Figure 25 Comparison of AbbVie cost regressions – assuming constant BASFI ............................... 332

15/12/2014 15
List of abbreviations
ADA adalimumab
AE adverse event
AS ankylosing spondylitis
ASAS Assessment in Ankylosing Spondylitis
ATP Adalimumab Target Population
ASQoL Ankylosing Spondylitis Quality of Life
axSpA Axial spondyloarthritis
BASDAI Bath Ankylosing Spondylitis Disease Activity Index
BASFI Bath Ankylosing Spondylitis Functional Index
BASMI Bath Ankylosing Spondylitis Metrology Index
BASRI Bath Ankylosing Spondylitis Radiology Index
BNF British National Formulary
BSR British Society for Rheumatology
BSRBR British Society for Rheumatology Biologics Register
CEA cost-effectiveness analysis
CrI Credible interval
CIC commercial in confidence
CMA cost-minimisation analysis
CPI consumer price index
CRD Centre for Reviews and Dissemination
CUA cost–utility analysis
CZP certolizumab pegol

15/12/2014 16
DCART disease-controlling antirheumatic treatment
DIC deviance information criterion
DMARD disease-modifying antirheumatic drug
EQ-5D EuroQol 5 Dimensions
ESR erythrocyte sedimentation rate
FBC full blood count
GDA Global Disease Activity
HCQ hydroxychloroquine
HLA human leucocyte antigen
HUI health utility index
HRQoL health related quality of life
ICER incremental cost-effectiveness ratio
IPD individual patient data
IQR interquartile range
ISPOR International Society forPharmacoeconomics and Outcomes Research
ITT intention-to-treat
LFT liver function test
LMA longitudinal meta-analysis
LRiG Liverpool Reviews and Implementation Group
MASES Maastricht Ankylosing Spondylitis Enthesitis Score
MFI Multidimensional Fatigue Inventory
mSASSS modified Stoke Ankylosing Spondylitis Spinal Score
MTX methotrexate

15/12/2014 17
NA not applicable
NICE National Institute for Health and Clinical Excellence
NNH Number needed to harm
NR not reported
nr-axSpA Non-radiographic axial spondyloarthritis
NSAID non-steroidal anti-inflammatory drug
NYHA New York Heart Association
OLS ordinary least squares
OMERACT outcome measures in rheumatology
OR odds ratio
PBO placebo
p.a. per annum
PPP purchasing power parity
PSA probabilistic sensitivity analysis
QALY quality-adjusted life-year
QoL quality of life
RA rheumatoid arthritis
RCT randomised controlled trial
RR relative risk
SA sensitivity analysis
SAE Serious adverse event
SD standard deviation
SEM standard error of the mean

15/12/2014 18
SF-36 MCS Short Form 36 mental component summary
SF-36 PCS Short Form 36 physical component summary
SIJ Sacroiliac joint
SMR standardised mortality ratio
SSZ sulfasalazine
TB tuberculosis
TNF tumour necrosis factor
U&E urea and electrolytes
VAS visual analogue scale
WMD weighted mean difference
Glossary
Adverse effect
An abnormal or harmful effect caused by and attributable to exposure to a chemical (e.g. a drug),
which is indicated by some result such as death, a physical symptom or visible illness. An effect may
be classed as adverse if it causes functional or anatomical damage, causes irreversible change in the
homeostasis of the organism, or increases the susceptibility of the organism to other chemical or
biological stress.
Ankylosing spondylitis
A rheumatic disease that affects the spine and may lead to some degree of stiffness in the back. As the
inflammation goes and healing takes place, bone grows out from both sides of the vertebrae and may
join the two together; this stiffening is called ankylosis. If definite changes to spinal and/or pelvic
joints are present on plain X-rays.
Articular
Of or relating to the joints.
Axial spondyloarthritis
The term axial spondyloarthritis refers to a form of arthritis in which the predominant symptom is
back pain due to inflammation of spinal and/or pelvic joints. If definite changes on plain X-rays are

15/12/2014 19
present, the disease is classified as ankylosing spondylitis, but if they are absent it is classified as non-
radiographic axial spondyloarthritis. Further tests may indicate that in some patients non-radiographic
axial spondyloarthritis is very likely to be ankylosing spondylitis, only at an earlier stage of disease.
Between-study variance
Between-study variance is a measure of statistical heterogeneity that depends on the scale of the
outcome measured. It represents the variation in reported study effects over and above the variation
expected given the within-study variation.
Biologic therapies (biological)
Medical preparations derived from living organisms. Includes anti-TNF drugs and other new drugs
which target pathologically active T cells.
Biosimilar
An imitation biological medical product (such as an anti-TNF) usually marketed by a different
manufacturer to the original biological product, once a patent has expired. The biosimilar should be
similar to the original licensed product in terms of safety and efficacy.
Corticosteroid
A synthetic hormone similar to that produced naturally by the adrenal glands that is available in pill,
topical, and injectable forms.
Cost-benefit analysis
An economic analysis that converts the effects or consequences of interventions into the same
monetary terms as the costs and compares them using a measure of net benefit or a cost-benefit ratio
Cost-effectiveness analysis
An economic analysis that expresses the effects or consequences of interventions on a single
dimension. This would normally be expressed in ‘natural’ units (e.g. cases cured, life-years gained,
additional strokes prevented). The difference between interventions in terms of costs and effects is
typically expressed as an incremental cost-effectiveness ratio (e.g. the incremental cost per life-year
gained).
Cost-utility analysis
The same as a cost-effectiveness analysis but the effects or consequences of interventions are
expressed in generic units of health gain, usually quality-adjusted life years (QALYs).
Credible Interval

15/12/2014 20
In Bayesian statistics, a credible interval is a posterior probability interval estimation which
incorporates problem-specific contextual information from the prior distribution. Credible intervals
are used for the purposes similar to those of confidence intervals in frequentist statistics.
C-reactive protein (CRP)
Concentrations of this protein in the blood can be measured as a test of inflammation or disease
activity, for example in AS and nr-axSpA.
Disease-modifying anti-rheumatic drugs (DMARDs)
DMARDs are drugs capable of modifying the progression of rheumatic disease. The term is, however,
applied to what are now considered to be traditional disease modifying drugs, in particular
sulphasalazine, methotrexate and ciclosporin, as well as azathioprine, cyclophosphamide,
antimalarials, penicillamine and gold. The newer agent leflunomide may be included as a DMARD.
The biologics such as etanercept and infliximab are not generally referred to as DMARDS.
Erythrocyte sedimentation rate (ESR)
One of the tests designed to measure the degree of inflammation.
Fixed-effect model
A statistical model that stipulates that the units under analysis (e.g. people in a trial or study in a meta-
analysis) are the ones of interest, and thus constitute the entire population of units. Only within-study
variation is taken to influence the uncertainty of results (as reflected in the confidence interval) of a
meta-analysis using a fixed effect model.
Heterogeneity
In systematic reviews heterogeneity refers to variability or differences between studies in the
estimates of effects. A distinction is sometimes made between "statistical heterogeneity" (differences
in the reported effects), "methodological heterogeneity" (differences in study design) and "clinical
heterogeneity" (differences between studies in key characteristics of the participants, interventions or
outcome measures).
I-squared (I2)
I-squared (I2) is a measure of "statistical heterogeneity" (differences in the reported effects). It varies
between 0 and 1, where 0 indicates that the differences in reported effects are entirely consistent with
the within-study uncertainty, and 1 indicates that the differences in reported effects are entirely
explained by study characteristics that vary across studies.
Intention-to-treat

15/12/2014 21
An intention-to-treat analysis is one in which all the participants in a trial are analysed according to
the intervention to which they were allocated, whether they received it or not.
Monoclonal antibody
An antibody produced in a laboratory from a single clone that recognizes only one antigen.
Non-steroidal anti-inflammatory drugs (NSAIDs)
Consists of a large range of drugs of the aspirin family, prescribed for different kinds of arthritis
which reduce inflammation and control pain, swelling and stiffness.
Non-radiographic axial spondyloarthritis
Axial spondyloarthritis where definite changes to spinal and/or pelvic joints on plain X-rays are not
present. Further tests may indicate that in some patients non-radiographic axial spondyloarthritis is
very likely to be ankylosing spondylitis, only at an earlier stage of disease.
Open-label study
A type of study in which both participants and researchers know which treatment is being
administered.
Placebo
An inactive substance or procedure administered to a patient, usually to compare its effects with those
of a real drug or other intervention, but sometimes for the psychological benefit to the patient through
a belief that s/he is receiving treatment.
Quality Adjusted Life Year (QALY)
An index of health gain where survival duration is weighted or adjusted by the patient’s quality of life
during the survival period. QALYs have the advantage of incorporating changes in both quantity
(mortality) and quality (morbidity) of life.
Quality of Life
A concept incorporating all the factors that might impact on an individual’s life, including factors
such as the absence of disease or infirmity as well as other factors which might affect their physical,
mental and social well-being.
Random effects model
A statistical model sometimes used in meta-analysis in which both within-study sampling error
(variance) and between-studies variation are included in the assessment of the uncertainty (confidence
interval) of the results of a meta-analysis.
Randomised controlled trial (RCT) (Synonym: randomised clinical trial)

15/12/2014 22
An experiment in which investigators randomly allocate eligible people into intervention groups to
receive or not to receive one or more interventions that are being compared.
Relative Risk (RR) (synonym: risk ratio)
The ratio of risk in the intervention group to the risk in the control group. The risk (proportion,
probability or rate) is the ratio of people with an event in a group to the total in the group. A relative
risk of one indicates no difference between comparison groups. For undesirable outcomes an RR that
is less than one indicates that the intervention was effective in reducing the risk of that outcome.
Sensitivity analysis
An analysis used to determine how sensitive the results of a study or systematic review are to changes
in how it was done. Sensitivity analyses are used to assess how robust the results are to uncertain
decisions or assumptions about the data and the methods that were used.
Tumor necrosis factor (TNF)
One of the cytokines, or messengers, known to be involved in the process of systemic inflammation.
Weighted mean difference (in meta-analysis)
A method of meta-analysis used to combine measures on continuous scales, where the mean, standard
deviation and sample size in each group are known. The weight given to each study is determined by
the precision of its estimate of effect and, is equal to the inverse of the variance. This method assumes
that all of the trials have measured the outcome on the same scale.

15/12/2014 23
1 Scientific Summary
1.1 Background
Spondyloarthritis (SpA) encompasses a heterogeneous group of inflammatory rheumatologic diseases.
SpA can be categorised as having predominantly axial or peripheral involvement. In people with axial
SpA (axSpA) the predominant symptoms are back pain and stiffness, developed before age 45. For
axSpA patients to be classified as having ankylosing spondylitis (AS) imaging evidence of joint
damage using X-rays is required. Patients with non-radiographic axSpA (nr-axSpA) may, or may not,
have signs of sacroiliac joint inflammation on an MRI scan. The use of MRI allows for earlier
detection of axSpA, since joint damage may not become evident on X-rays for many years. The
prognosis for axSpA is poor, although there is some evidence that deterioration plateaus in well-
established AS. Progression of the disease is difficult to predict. Conventional therapy for axSpA is
limited to non-steroidal anti-inflammatory drugs (NSAIDs) and patient education and home or group
exercises.
Tumour necrosis factor-alpha (TNF-α) inhibitors, also referred to as anti-TNFs, are typically used
when the disease has not responded adequately to conventional therapy. Current NICE guidance
recommends treatment with adalimumab, etanercept and golimumab in adults with active (severe) AS
only if certain criteria are fulfilled, but it does not recommend infliximab for AS.1, 2
Anti-TNFs for
patients with nr-axSpA have not previously been appraised by NICE.
1.2 Objectives
To determine the clinical effectiveness, safety, and cost-effectiveness within the NHS of adalimumab,
certolizumab pegol, etanercept, golimumab, and infliximab, within their respective licensed
indications, for the treatment of severe active AS, or severe nr-axSpA (but with objective signs of
inflammation).
1.3 Methods
For the systematic review of clinical efficacy RCTs were eligible, including any open-label
extensions. Adverse events data were sought from existing reviews of anti-TNFs used in any disease,
and from other appropriately large studies. For studies of natural history, long-term effectiveness,
adherence, and sequential use, published analyses based on large and long-term data sets (registry
data) were eligible. Eligible studies were of adults with either severe active AS or severe nr-axSpA
but with objective signs of inflammation (such as elevated C-reactive protein levels or a positive MRI
scan). The treatments of interest were adalimumab, certolizumab pegol, etanercept, golimumab,
infliximab or any of their biosimilars. The relevant comparators were conventional management
strategies (either with or without placebo) and alternative anti-TNFs. Key outcomes included multiple

15/12/2014 24
domain response criteria (such as ASAS 40) and measures of disease activity (BASDAI) and function
(BASFI).
Fifteen databases were searched for relevant studies in July 2014. Clinical effectiveness data from
RCTs were synthesised using Bayesian network meta-analysis methods. Sensitivity analyses were
performed where trials at risk of bias were excluded. Results from other studies were summarised
narratively.
A systematic review of cost-effectiveness studies was undertaken to assess the relevance of existing
data from the perspective of the NHS. Searches were undertaken in the NHS Economic Evaluation
Database (NHS EED), Medline and EMBASE. Only full economic evaluations that compared two or
more options and considered both costs and consequences (including cost-effectiveness, cost-utility
and cost-benefit analyses) were included. The differences in the approaches and assumptions used
across the studies were examined in order to explain any discrepancies in the findings and to identify
key areas of uncertainty. A separate review of the manufacturer submissions was also undertaken and
the findings compared with those found in the review of previously published studies.
The findings from the clinical and cost-effectiveness reviews were used to inform the development of
a de-novo decision model to assess the cost-effectiveness of the alternative anti-TNFs in accordance
with their licences for the separate indications. We developed a generalised framework for evidence
synthesis that pools evidence on the change in BASDAI by considering both those studies that report
this measure directly and also those that report the proportion of patients achieving a BASDAI 50
response (a ≥50% improvement in BASDAI score). We expressed BASDAI 50 as a function of the
absolute change in BASDAI and we used this relationship in the extended synthesis. We also aimed to
simultaneously synthesise information on BASFI (function) score, a measure that is used together
with the BASDAI score to determine the long-term QALY and cost burden of the disease in the
economic model. The decision model was developed in accordance with the NICE reference case.
The model has a lifetime horizon (60 years) and considers costs from the perspective of the National
Health Services and Personal Social Services. Health effects were expressed in terms of Quality-
Adjusted Life Years (QALYs).
1.4 Results
Clinical efficacy from randomised controlled trials
After screening 2,284 titles and abstracts, 198 papers were assessed for inclusion and 28 eligible
RCTs were identified, with 24 being suitable for data synthesis. All but two trials were placebo
controlled (mostly up to 12 weeks). All but seven of the trials were extended into open-label active
treatment-only phases. Most RCTs were judged to have a low risk of bias overall.

15/12/2014 25
For the AS population the 10-16 week data showed consistent effects across the different anti-TNFs
(when compared with placebo) for ASAS 20 the pooled relative risks (RR) ranging from 1.80
(certolizumab pegol) to 2.45 (infliximab); for ASAS 40 data the RRs ranged from 2.53 (certolizumab
pegol) to 3.42 (adalimumab) and for BASDAI 50 the RRs ranged from 3.16 (adalimumab) to 4.86
(infliximab). Adalimumab, certolizumab pegol, etanercept and infliximab produced statistically
significant and clinically important reductions in disease activity with BASDAI reductions ranging
from 1.46 units (certolizumab pegol) to 2.28 units (infliximab), and function with BASFI reductions
ranging from 1.1 units (certolizumab pegol) to 2.16 units (infliximab).
When analysed as a class anti-TNFs were statistically significantly more likely than placebo to result
in patients with AS achieving an ASAS 20 response (RR 2.21), an ASAS 40 response (RR 3.06), and
a BASDAI 50 response (RR 3.37).They also produced statistically significant improvements
(calculated using mean difference in change from baseline) in: disease activity (BASDAI mean
difference: -1.66 units) and function (BASFI mean difference: -1.38 units). There was little evidence
of statistical heterogeneity for the key outcomes (ASAS outcomes, BASFI, BASDAI and BASDAI
50) but substantial heterogeneity was seen for other outcomes. Results of the sensitivity analyses
performed for the AS studies were very similar to the main analyses.
For the nr-axSpA population five RCTs were included. When anti-TNFs were considered as a class,
statistically significant improvements were found for ASAS 20 (RR 1.65); ASAS 40 (RR 2.74);
BASDAI 50 (RR 2.31); BASDAI (mean difference -1.32 units); and BASFI (mean difference -0.99
units). For the disease activity, function, and responder outcomes, these common class efficacy
estimates were consistently slightly smaller for nr-axSpA than for AS, most noticeably for BASFI and
BASDAI 50. Statistical heterogeneity (where such estimates could be calculated) was apparent in the
nr-axSpA analyses.
Long term efficacy
For AS the results showed that across all the anti-TNFs after approximately two years of treatment,
around half of patients were still achieving a good level of response to therapy. Available data showed
that at five years around 50% of patients were still achieving a good treatment response. However, the
long-term studies produced less reliable data than the RCTs. Fewer studies were available of nr-
axSpA patients, although the results were broadly similar to those seen in AS patients.
Evidence for an effect of anti-TNFs on radiographic disease progression was limited: the relatively
short-term follow-up available to date and the insensitivity of x-rays as an imaging tool precluded the
drawing of firm conclusions regarding the role of anti-TNFs in preventing or delaying the progression
of AS; there is some data to suggest an identifiable benefit from around four years, but results from
ongoing long-term studies should help to clarify this issue.

15/12/2014 26
Registry data demonstrate that around 60% of patients with AS treated with a first anti-TNF will still
be on treatment at 2 years. Sequential treatment with anti-TNFs can be worthwhile but the drug
survival, response rates and benefits are reduced with 2nd
and 3rd
anti-TNFs, with the proportion of
BASDAI 50 responders falling approximately 10% with each subsequent anti-TNF and the median
BASDAI and BASFIs achieved increasing (worsening).
Adverse effects
Data from large systematic reviews, which included patients with a wide range of diseases, suggest
that, in the short-term, anti-TNFs as a group are associated with significantly higher rates of serious
infections, TB reactivation, non-melanoma skin cancer, total adverse events, and withdrawals due to
AEs, when compared with control treatments. Specifically, infliximab is associated with significantly
higher rates of total adverse events and withdrawals due to adverse events and that certolizumab pegol
is associated with significantly higher rates of serious infections and serious adverse events. The
available open-label data on adverse effects were limited by the small sample sizes and non-
randomised study designs.
Cost-effectiveness reported in existing published studies and manufacturer submissions
The combined searches retrieved 210 citations. A total of six UK studies reporting on the cost-
effectiveness of anti-TNFs for the treatment of AS were identified. No studies were identified for nr-
axSpA. There appear marked differences between the results of the previously published industry-
funded assessments in AS and the results reported in a previous independent assessment. Although all
models reviewed used changes in BASDAI and/or BASFI to quantitatively model the short and
longer-term costs and quality of life effects , there appeared significant variation in the assumptions
employed. We identified important conceptual issues with all existing models relating to the
subsequent projection of BASDAI and BASFI scores over a longer time-horizon.
Manufacturers submitted de novo analyses for both AS (AbbVie, UCB, Pfizer, MSD) and nr-axSpA
(AbbVie, UCB, Pfizer) populations. Despite the different model structures and assumptions applied
across the various manufacturer submissions, the ICERs reported for the anti-TNFs vs conventional
care appeared consistent in AS. Across the separate base-case analyses, the incremental cost-
effectiveness ratios (ICERs) ranged from £16,391 to £44,448 for the alternative anti-TNFs compared
to conventional care alone. Infliximab was routinely reported to have the highest ICER. When
infliximab was excluded from consideration, the ICERs ranged from £16,391 to £21,972 for the other
anti-TNFs.
The differences in structural and parameter assumptions appear more evident in the cost-effectiveness
results for the nr-axSpA population. The ICERs for adalimumab, certolizumab and etanercept ranged
from between £12,866 and £50,692 per QALY. Importantly, when the results in the separate

15/12/2014 27
populations were compared, no consistent relationship appeared to emerge across the manufacturer
submissions regarding the cost-effectiveness on anti-TNFs in AS compared to the nr-axSpA
population. Also, many of the same conceptual concerns identified from the review of published cost-
effectiveness studies were also still evident.
An independent model was developed to address the conceptual concerns and areas of remaining
uncertainty. Although it shared several of the assumptions and parameter estimates from the
manufacturer models, it has a different conceptual structure (linking BASFI progression to evidence
from radiographic assessments) and applies a more generalised framework for the synthesis of clinical
effectiveness data.. The extended synthesis approach showed the effectiveness of the different anti-
TNFs to be similar. Consequently, the treatment effects for the anti-TNFs were assumed to come from
a ‘common’ distribution i.e. a ‘class effect’. We developed a simulation model that allowed
prediction of the conditional change scores for responders/non-responders to BASDAI50 at 12 weeks
and to explore differences in the baseline BASDAI/BASFI scores according to response status.
Base-case cost-effectiveness results were presented for two alternative ‘rebound’ assumptions. In the
rebound equal to gain scenario, the ICER of the alternative anti-TNFs varied between £19,240
(certolizumab with the proposed PAS) to £40,467 per additional QALY (infliximab) in AS patients.
In the rebound to conventional care scenario, the ICER of the alternative anti-TNFs varied between
£33,762 (certolizumab with the proposed PAS) to £66,529 per additional QALY (infliximab) in AS
patients.
In the rebound equal to gain scenario, the ICER of the alternative anti-TNFs for nr-axSpA patients
varied between £28,247 (certolizumab with the proposed PAS) to £29,784 per additional QALY
(etanercept) in AS patients. In the rebound to conventional care scenario, the ICER of the alternative
anti-TNFs for nr-axSpA patients varied between £32,528 (certolizumab with the proposed PAS) to
£34,232 (etanercept) per additional QALY.
1.5 Discussion
The key strengths of the systematic review are the rigorous methods used, and the extensive breadth
of the types of study included. The York model confers several advantages over current cost-
effectiveness studies by linking changes in function to a more explicit clinical/biological process and
facilitating a more formal consideration of the potential impact of anti-TNFs on function, via the
specific effects these drugs have on the different processes which independently relate to this
parameter.
The meta-analysis results derived from a substantial and generally high quality evidence-base
demonstrated that anti-TNFs produce clinically important benefits to AS patients in terms of

15/12/2014 28
improved function and reduced disease activity. Smaller benefits were seen across outcomes in
patients with nr-axSpA, which was a more heterogeneous population. Less reliable data were
available on long-term efficacy, though it appears that around half of patients still achieve a good
level of response after around two years of treatment.
Although there are a number of important differences in approaches both amongst the different
manufacturer models and compared to the York model, the comparison of ICERs based on the York
rebound equal to gain scenario appear broadly consistent with those reported by the manufacturers in
both populations.
1.6 Conclusions
In both AS and nr-axSpA populations anti-TNFs produce clinically important benefits to patients
in terms of improving function and reducing disease activity. The efficacy estimates were
consistently slightly smaller for nr-axSpA than for AS.
Statistical (and clinical) heterogeneity was more apparent in the nr-axSpA analyses than in the
AS analyses; both the reliability of the nr-axSpA meta-analysis results and their true relevance to
patients seen in clinical practice are questionable.
In AS anti-TNFs can be assumed to have a class effect, with the treatments being equally
effective.
Effectiveness appears to be maintained over time in about 50% of patients at 2 years.
Evidence for an effect of anti-TNFs delaying disease progression was limited; results from
ongoing long-term studies should help to clarify this issue.
Sequential treatment with anti-TNFs can be worthwhile but the drug survival, response rates and
benefits are reduced with 2nd
and 3rd
anti-TNFs.
The de novo model, which had addressed many of the issues of earlier evaluations, generated
ICERs ranging from £19,240 to £66,529 depending upon anti-TNF and modelling assumptions.
Suggested research priorities
Randomised trials are needed to identifying the nr-axSpA population who will benefit the most from
anti-TNFs. Long-term studies are needed to clarify the effect of anti-TNFs on the progression of
structural damage in AS, and to help clarify the characteristics of nr-axSpA patients who go on to
develop AS. Studies are also needed to better inform the efficacy estimates relating to sequential use
of anti-TNFs
PROSPERO Registration number: CRD42014010182
Word count: 2441

15/12/2014 29
2 Background
2.1 Description of health problem
Spondyloarthritis (SpA) encompasses a heterogeneous group of inflammatory rheumatologic diseases
including ankylosing spondylitis (AS), reactive arthritis, psoriatic arthritis, inflammatory bowel
disease-related arthritis and undifferentiated SpA.3 SpA can be categorised as having predominantly
axial (sacroiliac joints or spine) or peripheral involvement. In people with axial SpA (axSpA), the
predominant symptom is back pain (due to inflammation of the sacroiliac joints, the spine, or both)
but there may also be extra-articular and peripheral joint manifestations.
In practice, and in clinical trials, AS is commonly diagnosed using the modified NY criteria (Box 1);
sometimes in practice radiographs may not be performed routinely (because of the radiation doses
involved) or MRI may be preferred as a diagnostic tool. The recently developed Assessment of
SpondyloArthritis International Society (ASAS) classification criteria encompass a broad range of
patients with axSpA, including patients with AS and patients with non-radiographic axSpA (nr-
axSpA).4 All axSpA patients will have developed chronic back pain (≥ 3 months) before age 45.
Classifications can be made using the imaging or clinical arms of the criteria. The imaging arm
requires evidence of joint damage (erosions or fusion) due to sacroiliitis, either using X-rays (when
the disease is classified as AS) or MRI (when the disease is classified as non-radiographic axSpA (nr-
axSpA));5 additionally at least one of the following SpA features is also required: inflammatory back
pain, arthritis, enthesitis (heel), uveitis, dactylitis, psoriasis, Crohn’s/colitis, good response to
NSAIDs, family history of SpA, HLA-B27 genetic marker, and elevated CRP. People with axSpA
often have the genetic marker human leukocyte antigen (HLA)-B27. To be classified as having axSpA
via the clinical arm of the criteria patients have to be HLA-B27 positive and also have at least three of
the aforementioned SpA features.
Box 1. Modified New York criteria for ankylosing spondylitis (1984)*
Clinical criteria:
– Low back pain and stiffness for more than 3 months that
improves with exercise, but is not relieved by rest.
– Limitation of motion of the lumbar spine in the sagittal and
frontal planes.
– Limitation of chest expansion relative to normal values
correlated for age and sex.
Radiological criterion:
– Sacroiliitis grade >2 bilaterally or grade 3–4
unilaterally.
Definite AS if the radiological criterion is associated
with at least one clinical criterion
*6
The use of MRI allows for earlier detection of axSpA, since joint damage may not become evident on
X-rays for many years. Patients with nr-axSpA may, or may not, have signs of sacroiliac joint
inflammation on an MRI scan. There may be other objective signs of inflammation such as an
abnormally raised erythrocyte sedimentation rate (ESR) or C-Reactive protein (CRP) level, though

15/12/2014 30
these are less sensitive and specific for AS. An MRI diagnosis may therefore provide the opportunity
for treatment to reduce the possibility of long-term structural damage (and associated burden of
symptoms).7 However, there is some concern that the diagnostic criteria for nr-axSpA may be too
liberal and may include patients who do not have axSpA and will never progress to AS, particularly
with respect to patients who are diagnosed without evidence of imaging (MRI) changes.8-10
The
differences between AS and nr-axSpA are explored further in Section 4.
Prognosis
AxSpA is a painful, progressive form of inflammatory arthritis. It mainly affects the spine but can
also affect other joints, tendons and ligaments. Other areas such as the eyes and bowel can also
sometimes be involved in non-radiographic and radiographic (AS) forms of axSpA.11
The pain and
stiffness of axSpA adversely affects optimal daily functioning. These symptoms are due to a
combination of reversible components of the disease such as inflammation and flares, and irreversible
components such as syndesmophytes and vertebral bridging (bony deposition).12
Most patients with
AS develop the first symptoms at 25-45 years of age.13
Progression of the disease is variable, and
difficult to predict.14
There is often a delay of many years between patients first noticing symptoms,
and receiving a diagnosis of axSpA. Many people with axSpA have AS, with evidence of bony
deposition as well as inflammation. In later-stage AS joints and bones may fuse together, a process
that can occur over a long period of time and cause restricted movement. The functional impairment
due to inflammation and/or bony deposition can have a profound effect on health and quality of life
and lead to withdrawal from active employment, with resultant adverse financial consequences; the
burden of disease is greater in more socially-deprived patients15
The prognosis is poor although there
is some evidence that deterioration plateaus in well-established AS.16
Paradoxically early disease (nr-
axSpA) may be less readily diagnosed and patients offered fewer treatment options even though it can
be as, or even more, debilitating that established AS.17
Ankylosing spondylitis is associated with an increased risk of death: it is estimated that patients have
a standardised mortality ratio (SMR) of 1.5 or greater. The increased risk appears to be greater in
men, with one study reporting a statistically significant increase in SMR of 1.63 in men but no
significant increase in women (SMR 1.38) with AS.18
This study found that, after correcting for age,
gender, disease duration and pre-existing cardiovascular disease, independent predictors of increased
mortality were: elevated CRP, diagnostic delay, not using NSAIDs, and work disability. According to
British Society for Rheumatology (BSR) guidelines, the excess mortality is mainly accounted for by
cardiac valvular disease, amyloidosis and fractures.1 Non-radiographic axSpA affects approximately
equal numbers of men and women, but men are more likely to develop AS.19
Epidemiology

15/12/2014 31
Currently, only limited epidemiological data are available for axSpA defined according to ASAS
criteria. For AS, the prevalence is thought to be around 0.25% in European populations.20
It is around
three times more common in men than in women.21
A recent study published in the US reported an
estimated AS prevalence of 0.52-0.55%, and the prevalence of axSpA as approximately 1.0-1.4%.22
The proportion of nr-axSpA among patients with axSpA is estimated to be between 20-80%.23
Each
year in the UK, an estimated 2% of patients in a general practice will present with back pain, and up
to 5% of these will show features of AS.24
Measurement of disease
There are a number of components and measures of disease activity in axSpA:25
a patient’s health
related quality of life is determined by both by physical functioning and by disease activity. In turn,
physical function is determined by spinal mobility and disease activity, and spinal mobility is
determined by structural damage and inflammation of the spine.25
In nr-axSpA a patient may have
significant inflammation but no detectable structural damage, in AS a patient may have both
significant inflammation and structural damage, and in late AS there may be less inflammation but
extensive structural damage.
The main tools used for the assessment of various components of the disease are listed in Table 1.
Table 1 Disease assessment tools
Assessment measures
Tool Disease
component
Description
BASDAI - Bath
Ankylosing
Spondylitis disease
activity Index
Disease
activity
Consists of a 1 through 10 scale (one being no problem and 10 being the worst
problem) which is used to answer 6 questions pertaining to the 5 major symptoms
of AS:
Fatigue
Spinal pain
Joint pain / swelling
Areas of localized tenderness (also called enthesitis, or inflammation of tendons and
ligaments)
Morning stiffness duration
Morning stiffness severity
BASFI
Bath Ankylosing
Spondylitis
Functional Index
(BASFI)
Functional
ability
Patient assesses difficulty on a ten point scale (1 is easy and 10 is impossible) for
each of 10 items:
Putting on your socks or tights without help or aids (e.g. sock aid
Bending from the waist to pick up a pen from the floor without aid.
Reaching up to a high shelf without help or aids (e.g. helping hand).
Getting up from an armless chair without your hands or any other help.
Getting up off the floor without help from lying on your back.
Standing unsupported for 10 minutes without discomfort.
Climbing 12-15 steps without using a handrail or walking aid.
Looking over your shoulder without turning your body.
Doing physically demanding activities (e.g. physiotherapy exercises, gardening or
sports).
Doing a full day’s activities whether it be at home or at work.

15/12/2014 32
BASMI - Bath
Ankylosing
Spondylitis
Metrology index
Disease
activity
Spinal
mobility
Clinician assessment of: cervical rotation, tragus to wall distance, lumbar side
flexion, modified Schober’s, intermalleolar distance
ASDAS Disease
activity
Calculated from BASDAI questions on spinal pain, peripheral arthritis, and duration
of morning stiffness, patients global assessment of disease activity, and CRP (or
ESR if CRP not available)
mSASSS Structural
damage
In the mSASSS the anterior vertebral corners of the cervical (lower border of C2 to
upper border of T1) and lumbar (lower border of T12 to upper border of S1)
segments (a total of 24 VCs) are scored at a lateral view, for the presence of erosion
and/or sclerosis and/or squaring (1 point), syndesmophyte (2 points) and bridging
syndesmophyte (3 points). The total score ranges from 0 to 72. The mSASSS has
shown better reliability and sensitivity to change than other radiographic scoring
methods.26
MRI assessments
Measures of response
BASDAI 50 Response
criterion
>50% improvement in BASDAI
ASAS 20 Response
criterion
>20% improvement and >1 unit absolute improvement (range 1-10) in 3 of 4
domains: BASFI, Spinal pain, Patient GDA and inflammation (BASDAI Q5 and 6),
with no worsening of >20% improvement and >1 unit absolute in the 4th domain.
ASAS 40 Response
criterion
>40% improvement and >2 units absolute improvement (range 1-10) in 3 of 4
domains: BASFI, Spinal pain, Patient GDA and inflammation (BASDAI Q5 and 6),
with no worsening at all in the 4th domain.
ASAS partial
remission
Response
criterion
A value of >2 units absolute improvement (range 1-10) in each of 4 domains:
BASFI, Spinal pain, Patient GDA and inflammation (BASDAI Q5and 6).
ASAS 5/6 Response
criterion
Improvement in 5 out of 6 domains (using pre-defined % improvements) without
deterioration in the 6th domain:
Pain, Patient global assessment, function, inflammation, spinal mobility, CRP
ASDAS major
improvement
Response
criterion
>2 units improvements in ASDAS
Placebo response
The term ‘placebo effect’ can be used to describe different types of ‘effect’ but it generally
encompasses one or more of three different meanings. Firstly, there is the temporal (before-after)
change after placebo medication, in which the effects of a placebo intervention cannot be
distinguished from the natural course of the disease, or regression to the mean. Secondly, there is the
causal effect of placebo intervention associated with the treatment ritual, and finally the effect of all
the psychological processes involved in the interaction between doctor and patient27
For the placebo-
controlled trials in AS and nr-axSpA these non-pharmacological components can be assumed to act
equally in the anti-TNF and placebo arms. Results from the placebo arms measure the non-
pharmacological effects and the difference between the anti-TNF and placebo arms measures the
pharmacological effect. All three components of the placebo effect could be important to consider
when evaluating trials in this assessment, although once the trial treatment periods have ended it is
likely that the effect of the natural course of the disease becomes the most important factor of any

15/12/2014 33
‘placebo’ effect. Estimated cost-effectiveness ratios and associated policy decisions may be sensitive
to assumptions regarding the mechanism underlying placebo responses.28
The natural course of disease activity in AS is known to vary over time with exacerbations, or flares,
being common. In a study of flares in patients with AS, clinically relevant changes in BASDAI (but
not in function) were noted during minor/localised flares (which occurred in 59% of patients in any
given week). Although major/generalised flares were less common (reported in 12% of patients in any
given week) they were associated with clinically relevant changes in both disease activity and
function.29
Pain is a key component of BASDAI and the ASAS responder outcomes; a Cochrane
systematic review of placebos for all clinical conditions found that placebo interventions can
influence patient-reported outcomes, especially pain (and nausea).30
The authors also concluded that it
was difficult to distinguish patient-reported effects of placebo from biased reporting, and that the
effect on pain varied from negligible to clinically important, even among trials with low risk of bias.
2.2 Current service provision
Management of disease
Short- and long-term treatment goals for axSpA include minimising pain and stiffness, maintaining
function and posture, arresting disease progression and maintaining quality of life and ability to work.
Current conventional therapy for axSpA includes acute anti-inflammatory treatment with non-
steroidal anti-inflammatory drugs (NSAIDs) and physiotherapy and exercise.
Conventional therapy for AS is limited to NSAIDs (despite very limited supporting clinical trial
evidence)31
and recommendations regarding appropriate physical activity. Other statements in the
ASAS/EULAR recommendations for the management of AS include: analgesics such as paracetamol
and opioid-like drugs may be considered for residual pain. Glucocorticoid injections into the direct
site of inflammation (but not systemic) may be of benefit. The use of disease-modifying anti-
rheumatic drugs (DMARDs, such as methotrexate and sulfasalazine) has been all but abandoned after
evidence of lack of benefit. The cornerstone of non-pharmacological treatment of patients with AS is
patient education and regular exercise; home exercises are effective. Physical therapy with supervised
exercises, land or water based, individually or in a group, should be preferred as these are more
effective than home exercises. Patient associations and self-help groups may be useful. A Cochrane
review of 11 trials concluded that the current best available evidence suggests that physiotherapy is
beneficial for people with AS, but that it is still not clear which treatment protocol, duration and
intensity, should be recommended in the management of AS.32
Physiotherapy is universally
recommended 33
but variable in practice.
Biologic drugs are the only treatment shown to be efficacious in the treatment of symptoms and signs
of disease activity in axSpA and AS. Current NICE and BSR guidance recommends treatment with

15/12/2014 34
the anti-TNFs adalimumab, etanercept and golimumab in adults with active (severe) AS only if
certain criteria are fulfilled, but it does not recommend infliximab for AS.1, 2
2.3 Description of technology under assessment
Tumour necrosis factor-alpha (TNF-alpha) inhibitors (adalimumab, certolizumab pegol, etanercept,
golimumab and infliximab), also referred to as anti-TNFs, are typically used when the disease has not
responded adequately to conventional therapy. They target the activation of tumour necrosis factor-
alpha (TNF-alpha) and its subsequent activation of downstream inflammatory processes, and as such
have the potential to offer symptom control as well as altering disease progression. Adalimumab,
certolizumab pegol, golimumab and infliximab are monoclonal antibodies, whereas etanercept is a
recombinant human TNF receptor fusion protein.
Adalimumab, etanercept, golimumab and infliximab are licensed in the UK for the treatment of adults
with severe active AS that has responded inadequately to conventional therapy. Certolizumab pegol is
licensed for the treatment of adults with severe active AS whose disease has responded inadequately
to, or who are intolerant of, NSAIDs.
Adalimumab, etanercept and certolizumab pegol are also licensed for the treatment of adults with
severe nr-axSpA with objective signs of inflammation (including elevated C-reactive protein (CRP)
and/or positive MRI), whose disease has responded inadequately to, or who are intolerant of NSAIDs.
Golimumab and infliximab do not currently have a UK marketing authorisation for nr-axSpA. Current
NICE guidance recommends treatment with adalimumab, etanercept or golimumab in adults with
active (severe) AS only if certain criteria are fulfilled (including a stipulation that patients must have
tried at least two different NSAIDs, which have failed to control symptoms), but it does not
recommend infliximab for AS.1, 2
Anti-TNFs for patients with nr-axSpA have not previously been
appraised by NICE.
3 Definition of decision problem
3.1 Decision problem in terms of PICOS and other key issues
The decision problem relates to the optimal use of adalimumab, certolizumab pegol, etanercept,
golimumab, and infliximab, within their respective licensed indications, for the treatment of
severe/active ankylosing spondylitis, or severe axial spondyloarthritis without radiographic evidence
of ankylosing spondylitis (but with objective signs of inflammation).
3.2 Previous NICE appraisals
In the previous NICE Technology Appraisal TA143, adalimumab, etanercept and infliximab were
evaluated for AS, while in TA233 golimumab was evaluated for AS. A number of key areas of

15/12/2014 35
uncertainty and potential limitations of the evidence base were identified from these appraisals. These
include:
1. A lack of direct head-to-head trial evidence evaluating the relative efficacy and safety of the
TNF-alpha inhibitors;
2. A lack of evidence on the efficacy and safety of the sequential use of TNF-alpha inhibitors;
3. The long-term effectiveness of TNF-alpha inhibitors in controlling disease activity;
4. The rate of disease progression in responders and non-responders to treatment, and those on
placebo;
5. The proportion of patients who may experience a significant improvement in their condition
without TNF-alpha inhibitor treatment;
6. The rate of treatment withdrawal on TNF-alpha inhibitors and the degree to which a patient’s
condition might be expected to rebound if therapy is withdrawn;
7. The adverse effects associated with the long-term use of TNF-alpha inhibitors;
8. The impact of TNF-alpha inhibitors on the progression of structural damage in the spine and
functional disability associated with ankylosis;
9. The time horizon appropriate for considering the cost-effectiveness of TNF-alpha inhibitors;
10. A lack of registry data of patients receiving TNF-alpha inhibitors for severe active AS.
This assessment would consider each of these areas of uncertainty and identify the relevant evidence
available to inform the limitations of the previous appraisals.
3.3 Overall aims and objectives of assessment
The aim of the study is to determine the clinical effectiveness, safety, and cost-effectiveness within
the NHS of adalimumab, certolizumab pegol, etanercept, golimumab, and infliximab, within their
respective licensed indications, for the treatment of severe active ankylosing spondylitis, or severe
axial spondyloarthritis without radiographic evidence of ankylosing spondylitis (but with objective
signs of inflammation). If evidence allows, the clinical- and cost-effectiveness of sequential use of
these treatments will also be evaluated.
4 Assessment of Clinical Effectiveness
4.1 Methods for reviewing effectiveness
4.1.1 Inclusion criteria
Two reviewers independently screened all titles and abstracts. Full manuscripts of any titles/abstracts
that were relevant were obtained where possible and the relevance of each study assessed by two
reviewers according to the criteria below. Any discrepancies were resolved by consensus and, when
necessary, a third reviewer was consulted. Studies available only as abstracts were included.

15/12/2014 36
Study design
For the review of clinical efficacy RCTs were eligible, including any open-label extensions of RCTs.
Adverse events data were sought from existing reviews and other appropriately large studies. For
studies of natural history, long-term effectiveness, adherence, and sequential use, published analyses
based on large and long-term data sets (including studies of registry data) were eligible.
Interventions
Adalimumab, certolizumab pegol, etanercept, golimumab, infliximab or any of their biosimilars were
eligible.
Comparators
Relevant comparators were conventional management strategies (either with or without placebo) and
also the different TNF-alpha inhibitors listed above (i.e. head-to-head trials).
Participants
Studies of adults with either severe active ankylosing spondylitis or severe axial spondyloarthritis
without radiographic evidence of ankylosing spondylitis but with objective signs of inflammation
(such as elevated C-reactive protein levels or a positive MRI scan) were eligible. Patients with
predominantly peripheral spondyloarthritis were excluded. Data relating to serious adverse effects
associated with anti-TNF agents used in other indications were also considered.
Outcomes
Studies reporting the following outcomes were eligible:
Multiple domain response criteria: (e.g. ASAS 20, ASAS 40, ASAS 5/6 and ASAS partial
remission)
Disease activity (e.g. BASDAI)
Functional capacity (e.g. BASFI)
Disease progression (e.g. mSASSS)
Pain (e.g. VAS scores)
Peripheral symptoms (including enthesitis, peripheral arthritis and dactylitis)
Symptoms of extra-articular manifestations (including anterior uveitis, inflammatory bowel
disease and psoriasis)
Health-related quality of life (e.g. EQ-5D)
Rates of treatment discontinuation and withdrawal
Adverse events
For adverse events the evaluation specifically focussed on known possible adverse events of anti-
TNFs, such as reactivation of latent tuberculosis, malignancies, non-melanoma skin cancer, severe

15/12/2014 37
infections, congestive heart failure, and injection site reactions. Withdrawals due to adverse events,
and events categorised as serious adverse events were also evaluated.
4.1.2 Searches
The following databases were searched for relevant clinical and cost-effectiveness research:
MEDLINE
EMBASE
CINAHL Plus
Science Citation Index
ClinicalTrials.gov
Cochrane Central Register of Controlled Trials
Cochrane Database of Systematic Reviews
Database of Abstracts of Reviews of Effects
International Prospective Register of Systematic Reviews (PROSPERO)
Health Technology Assessment Database
Conference Proceedings Citation Index - Science
National Guidelines Clearinghouse
NHS Evidence
NHS Clinical Knowledge Summaries
NHS Economic Evaluation Database
The terms for search strategies were identified through discussion within the research team, by
scanning the background literature and browsing the Medline Medical Subject Headings (MeSH). No
date or language limits were applied. As several databases were searched, some degree of duplication
resulted. To manage this issue, the titles and abstracts of bibliographic records were imported into
Endnote bibliographic management software to remove duplicate records. The full search strategies
used in each database are listed in Appendix 1.
4.1.3 Data extraction
Data relating to study design, outcome results and quality were extracted by one reviewer using a
standardised data extraction form and independently checked for accuracy by a second reviewer.
Disagreements were resolved through consensus, and when necessary, a third reviewer was consulted.
Data from studies with multiple publications were extracted and reported as a single study. Data were
also extracted from the manufacturer submissions when they were not available from other sources.
Clinicaltrials.gov records and relevant FDA or EMA reports were also used to extract any missing
data. Where data could only be estimated from graphs, the estimates used in the previous assessment
report34
were used when available. In light of the multi-domain outcomes which incorporated pain

15/12/2014 38
scores (the ASAS and BASDAI outcomes), it was decided that pain scores on their own would not be
extracted.
4.1.4 Critical appraisal
The quality of RCTs was assessed using the Cochrane risk of bias tool,35
with additional assessments
made for baseline imbalance of important prognostic indicators.36
The relevant prognostic and
treatment response indicators were identified from both published research and clinical advice. The
risk of bias assessments were performed by one reviewer, and independently checked by a second.
Disagreements were resolved through consensus, and when necessary, a third reviewer was consulted.
Open-label extension studies were evaluated based on the imputation methods and patient withdrawal
criteria used.
4.1.5 Methods of data synthesis
This section describes the data set construction and meta-analyses conducted for the different
outcomes individually. Section 6 provides detailed evidence synthesis methods that incorporate
different outcomes within one analysis, and presents clinical outcome estimates appropriate for the
economic model.
Results of the data extraction in terms of study characteristics and quality assessment are presented in
Tables and summarised narratively. Results of open-label studies, drug survival and switching studies,
and natural history studies were also summarised narratively. Since several of the RCTs were
placebo-controlled up to 24 weeks, only time points beyond 24 weeks were evaluated in the open-
label studies. Adverse event data from the RCTs were pooled when enough data was identified,
otherwise the adverse event data and the other studies relating specifically to adverse events were
summarised narratively.
Clinical effectiveness data were synthesised using Bayesian meta-analysis methods. The main
analysis was of outcomes reported from 10 to 16 weeks. A sensitivity analysis was done of outcomes
reported from 24 to 30 weeks.
Dosage and pooling of trial arms
The doses included in the analyses were:
adalimumab: 40mg every other week,
certolizumab pegol: 200mg every 2 weeks, 400mg every 4 weeks
etanercept: 25mg twice weekly, 50mg weekly
golimumab: 50mg every month
infliximab: 5mg/kg at 0,2,6 + weeks

15/12/2014 39
Golimumab of 100mg every 4 weeks was excluded when it was not used according to its licence.
Data from active treatment arms were pooled in trials which studied different doses. This occurred for
certolizumab pegol 200mg every 2 weeks and 400mg every 4 weeks; and etanercept 25mg twice
weekly and 50mg weekly.
Data imputation and assumptions
Medians were treated as means. Although the median may not be exactly the same as the mean, the
median was considered to give sufficiently accurate information. Standard deviations were estimated
from inter-quartile ranges, the method of which is described in Appendix 2. Where no standard
deviation was reported, the highest standard deviation from the other trials was used as a conservative
estimate.
In the meta-analyses, ‘change from baseline’ outcomes were used in the analysis for continuous
outcomes. Where these were not reported, but adequate baseline and final value outcomes were
reported, the change from baseline and its standard deviation were derived from the baseline and final
values and their standard deviations. The detailed methods are described in Appendix 2.
The imputation of change from baseline or final values required a within-trial correlation estimate,
and trials that reported the standard deviations of baseline, change from baseline and final values were
used to estimate the within-trial correlation. For BASDAI the within-study correlation varied from
0.33 to 0.67 across four trials. Given the small samples of some trials the within-study correlation can
vary significantly from trial to trial. For the base case analysis, a correlation estimate of 0.3 was used
and an estimate of 0.7 was tested in sensitivity analysis. For the calculation of final values, the lowest
possible correlation was used when 0.3 or 0.7 were not feasible solutions (see Appendix 2).
Change from baseline was imputed for three trials for BASDAI, five trials for BASFI, one trial for
BASMI, two trials for SF-36pcs, and one trial for SF-36mcs. For each of these outcomes, one of the
imputations was for a trial with a non-radiographic population.
Binary event outcomes
Odds ratios were derived for binary event outcomes. Relative risks were also derived from the odds
ratios using the placebo absolute risks estimated from all the trials measuring the relevant outcome
within weeks 10 to 16. The relative risk estimates are therefore based on the population distribution of
the trials across the interventions. As the placebo absolute risk was based on more trials than those
informing the odds ratios for some outcomes, the 95% credible interval estimates of the relative risk
were narrower than the credible interval estimates of the odds ratio. The placebo absolute risk was
estimated using both fixed- and random-effect models within WinBUGS. Since the random- effect
model for the placebo absolute risk was a better fit than the fixed effect model according to the DIC

15/12/2014 40
statistic, the placebo absolute risks from the random effect models were used. For the ASAS
outcomes, fewer trials reported the greater response outcomes, so a prior distribution was used for the
between-study standard deviation based on the closest ASAS outcome (see Appendix 2).
Analyses
Analyses were conducted in WinBUGS. See Section 6 for more details on the models. For each
outcome, multiple-treatment meta-analyses were conducted assuming that the treatments had
independent effects (related to models A1 (fixed effect) and A2 (random effects) in Section 6). They
were also run assuming that they had a common class effect (related to models A3 (fixed effect) and
A4 (random effects) in Section 6), and the DIC statistic was used to determine the model that best
fitted the data. The random effect models with independent treatment effects were assumed to have a
common between-study variance across the comparisons in the network.
The sensitivity of random effect models to the between-study standard deviation priors was tested. I2
statistics for heterogeneity were calculated for random effect models that were insensitive to change
in the prior distribution for the between-study standard deviation. Results for random effect models
when the results were not sensitive to prior distributions.
4.2 Clinical Effectiveness Results
4.2.1 Quantity and quality of research available
The electronic database searches identified 2,284 references. After screening titles and abstracts, full
copies of 198 papers were assessed for inclusion in the review. Three trials of axSpA populations
were excluded because results were not available separately for the ankylosing spondylitis and nr-
axSpA populations.37-39
One study of adalimumab appeared likely to be eligible, but was excluded as
it was only available as a ClinicalTrials.gov record, without any results or further study details.40
One
excluded study was an ongoing trial of golimumab (called GO-AHEAD).41
Twenty-eight eligible RCTs were identified, with 24 being suitable for data synthesis. Three
etanercept trials were not suitable for data synthesis because the study durations were only six
weeks,42-44
and one infliximab trial was unsuitable because a (currently) unlicensed dose (3mg/kg) had
been studied.45
The Barkham 2009 trial of infliximab in nr-axSpA patients (see Table 2) was included
in the clinical efficacy section because, even though infliximab is not currently licensed for patients
with nr-axSpA, the dose used in this trial was the same as that licensed for AS. Furthermore, there
was no reason to think it could not be considered in the same class as the other anti-TNFs when
treating a nr-axSpA population. The results of the trial therefore had the potential to be useful to help
inform the relative efficacy of anti-TNFs for nr-axSpA.

15/12/2014 41
Of the seventeen RCTs in which participants were studied beyond the randomised phase (i.e. in open-
label studies) 71 additional full publications or conference abstracts were identified. Figure 1
illustrates the flow of studies through the review process.
Figure 1 Flowchart showing the number of studies identified and included

15/12/2014 42
Study characteristics
Table 2 lists the 24 eligible RCTs (and all the RCT-related references) which were eligible for
inclusion in the network meta-analysis. Six trials compared adalimumab versus placebo, one
compared certolizumab pegol versus placebo, seven compared etanercept versus placebo, three
compared golimumab versus placebo, five compared infliximab versus placebo, one compared
etanercept with infliximab and one compared infliximab with an infliximab biosimilar (Inflectra).
Most placebo-controlled phases lasted for 12 weeks. All but seven of the trials were extended into
open-label (unblinded) phases, with 11 studies having a total duration of at least a year.
Of the trials suitable for analysis, most were conducted in Europe and/or North America; four were
conducted in China. Four studies recruited a nr-axSpA population, 19 an ankylosing spondylitis
population and one recruited both populations.46
Table 3 details the baseline characteristics of the
populations studied. In the nr-axSpA studies around half the participants were male, whereas in the
AS studies around three-quarters were male. All trials recruited participants with active disease: half
the trials specified that participants had to have failed one or more NSAID, and a BASDAI score of
≥4 was used as an entry requirement in most, with the exception of six early trials where a BASDAI
criterion was not stated. 47-51
Notwithstanding these entry criteria, the recruited participants mostly still
took an NSAID (between around 80-90% of participants, though reported in only 12 trials) and had
quite high mean (or median) BASDAI scores: most were between 5.5 and 6.5 (the range across all
trial arms was 5.3 to 7). BASFI scores varied more widely, ranging between 3.2 and 6.7. Variation in
CRP levels was also apparent, with lower values in the nr-axSpA trials being evident. Trials which
reported both mean and median CRP showed skewed distributions, with means being higher than
medians.46, 52, 53
The upper limits of normal used for defining elevated CRP in the nr-axSpA trials
were either unclear52
or varied, being 3mg/l,54
6mg/l55
or 7.9mg/l.46
One nr-axSpA study recruited only
MRI-positive patients.56
In the remaining nr-axSpA trials the proportion of MRI-positive patients
ranged from 51%52
to 81%.54

15/12/2014 43
Table 2 General trial characteristics
Study Interventions Anti-TNF dose Country/
Continent
Population Duration of
placebo-
controlled
phase
(weeks)
Total duration of
study, including
any open-label
extension phase
Haibel 200855, 57, 58 Adalimumab
Placebo
40mg every other
week
Germany
nr-axSpA with inflammation
Inadequate response /intolerance to NSAIDs
12 1 year
Hu 201259 Adalimumab
Placebo
40 mg every other
week
China
Ankylosing spondylitis
Inadequate response /intolerance to NSAIDs
12 24 weeks
Huang 201460 Adalimumab
Placebo
40 mg every other week
China
Ankylosing spondylitis
Inadequate response /intolerance to NSAIDs
12 24 weeks
Lambert 200761 Adalimumab
Placebo
40 mg every other
week
Canada
Ankylosing spondylitis
Inadequate response to an NSAID or DMARD
12 1 year
ABILITY-1 201352, 62 Adalimumab
Placebo
40mg every other
week
Australia,
Europe, North America
nr-axSpA with inflammation
Inadequate response/ contraindication to
NSAIDs
12 3 years
ATLAS 200663-65 Adalimumab
Placebo
40 mg every other
week
USA, Europe
Ankylosing spondylitis
Inadequate response to an NSAID or
DMARD
12 5 years
RAPID-axSpA 201446, 66-
71
Certolizumab
pegol
Placebo
200mg every 2
weeks, or
400mg every 4 weeks
Europe, North
America, Latin America
Ankylosing spondylitis
nr-axSpA with inflammation
Inadequate response /intolerance to NSAIDs
12 96 weeks
Barkham 201072 Etanercept
Placebo
25mg twice
weekly
UK
Ankylosing spondylitis 12 12 weeks
Davis 200347, 73 Etanercept
Placebo
25mg twice
weekly
North America,
Europe
Ankylosing spondylitis 24 168 weeks

15/12/2014 44
Study Interventions Anti-TNF dose Country/
Continent
Population Duration of
placebo-
controlled
phase
(weeks)
Total duration of
study, including
any open-label
extension phase
Dougados 201174, 75 Etanercept
Placebo
50mg weekly Europe
Ankylosing spondylitis
Inadequate response to NSAIDs
12 24 weeks
Dougados 201454, 76, 77 Etanercept
Placebo
50mg weekly Europe, Asia,
South America
nr-axSpA
Inadequate response to NSAIDs
12 48 weeks
Gorman 200249, 78-80 Etanercept
Placebo
25mg twice
weekly
USA
Ankylosing spondylitis 16 40 weeks
Calin 200448, 81, 82 Etanercept
Placebo
25 mg twice
weekly
Europe
Ankylosing spondylitis 12 5 years
Van der Heijde 200651, 83 Etanercept
Placebo
25 mg twice
weekly, or 50mg weekly
Europe
Ankylosing spondylitis 12 12 weeks
Giardina 201084, 85 Etanercept
Infliximab
50mg weekly;
5mg/kg (at week
0,2,6 and every 6
weeks)
Italy
Ankylosing spondylitis
Inadequate response to NSAIDs
N/A 12 weeks
GO-RAISE 200886-90 Golimumab
Placebo
50mg or 100mg
every 4 weeks
North America,
Europe, Asia
Ankylosing spondylitis 16 4 years
Bao 201453, 91 Golimumab
Placebo
50mg every 4
weeks
China
Ankylosing spondylitis 14 1 year
Tam 201492 Golimumab
Placebo
50mg every 4
weeks
China (Hong
Kong)
Ankylosing spondylitis
Inadequate response to NSAIDs
24 1 year
Barkham 2009 56, 93 Infliximab
Placebo
5 mg/kg (at 0, 2, 6, and 12 weeks)
UK
nr-axSpA with inflammation 16 16 weeks
Braun 200294, 95 Infliximab
Placebo
5mg/kg (at weeks 0,2,6)
Germany
Ankylosing spondylitis 12 8 years

15/12/2014 45
Study Interventions Anti-TNF dose Country/
Continent
Population Duration of
placebo-
controlled
phase
(weeks)
Total duration of
study, including
any open-label
extension phase
Marzo-Ortega 200550 Infliximab+m
ethotrexate
Placebo+metotrexate
5mg/kg (at weeks
0,2,6,14,22)
UK
Ankylosing spondylitis 30 30 weeks
Van den Bosch 200296 Infliximab
Placebo
5mg/kg (at weeks
0,2,6)
Belgium
Ankylosing spondylitis 12 12 weeks
ASSERT97-104 Infliximab
Placebo
5mg/kg (at weeks
0,2,6,12,18)
North America,
Europe
Ankylosing spondylitis
Inadequate response /intolerance to NSAIDs
24 2 years
PLANETAS 2013105, 106 Inflectra (CT-
P13)
Infliximab
5mg/kg
5mg/kg
Europe, Asia, Latin America
Ankylosing spondylitis
N/A 2 years (using
randomised
interventions up to 54 weeks)

15/12/2014 46
Table 3 Baseline characteristics of trial populations
Trial Patient
Group
Trial
arm
n %
Male
Mean or
median
age (SD)
% on
an
NSAID
Mean or
median symptom
duration
(years)
Mean
(SD) [SE]
or median
(IQR) BASDAI
Mean
(SD) or
median
(IQR) BASFI
Mean
(SD) or
median
(IQR) BASMI
Mean or
median
CRP
mg/L, (SD)
%
HLA
-B27 +ve
Mean (SD)
or median (IQR)
SF-36 MCS
Mean (SD)
or median (IQR)
SF-36 PCS
Mean
(SD)or
median ASQoL
Haibel
200855
nr-axSpA ADA 22 41 38 NR 7 6.5 (1.2) 5.4 (2) 1.3 (1.2) 6.2 (5.8) 59 41.3 (12.5) 28.8 (7.6) 10.8 (3.7)
nr-axSpA PLA 24 50 37 NR 8 6.2 (1.3) 4.9 (1.6) 1.3 (1.6) 7.8 (7.0) 75 43.6 (11.1) 30.7 (6) 9.5 (3)
Hu
201259
AS ADA 26 92 28.2 (6.9) NR 7.4 5.9 (1.4) 3.7 (2.1) - 24.6 96 - - -
AS PLA 20 100 27.4 (7.2) NR 7.6 6.2 (1.1) 3.9 (2) - 32.1 95 - - -
Huang
201460
AS ADA 229 81 30.1 (8.7) 80 8.1 6.0 (1.4) 4.3 (2.3) 3.4 (1.4) 22.4 (24) 96 36.2 (10.7) 33.8 (7) -
AS PLA 115 83 29.6 (7.5) 78 7.7 6.2 (1.4) 4.4 (2.3) 3.4 (1.5) 23 (30) 95 35 (10.6) 32.2 (6.7) -
Lambert
200761
AS ADA 38 76 41.9 (11.1) NR 14.5 6.2 (1.7) 5.3 (2) - 18 87 - - -
AS PLA 44 82 40 (10.9) NR 12.1 6.5 (1.6) 5.6 (2.2) - 23 82 - - -
ABILITY
-1 201352*
nr-axSpA ADA ** ** 64 ** **** ********
*
********
*
**** *******
***
** * *********
*
*
nr-axSpA PLA ** ** *********
**
** **** ********
*
********
*
**** *******
***
** * *********
*
*
ATLAS
2006 63
AS ADA 208 76 41.7 (11.7) 80 11.3 6.3 (1.7) 5.2 (2.2) 3.8 (2.2) 18 78 43.4 (12) 32.9 (8) 10.2 (4)
AS PLA 107 74 43.4 (11.3) 79 10 6.3 (1.7) 5.6 (2.2) 4.2 (2.1) 22 79 44.4 (12) 31.8 (8) 10.6 (4)
RAPID-
axSpA
201446
AS CER
200mg
65 72 41 (10.8) 91 8.8 6.5 (1.7) 5.6 (2.3) 4.2 (1.6) 14 82 - - -
AS CER
400mg
56 73 41.9 (11.5) 91 8.8 6.2 (1.3) 5.7 (2.3) 4.3 (1.8) 12.9 79 - - -
AS PLA 57 72 41.6 (12.8) 90 10.2 6.4 (1.9) 6.0 (2) 4.7 (1.6) 16.6 84 - - -
RAPID-
axSpA 2014)46
nr-axSpA CER
200mg
46 44 36.6 (13) 83 4.8 6.5 (1.4) 4.8 (2.2) 3.1 (1.4) 10 74 - - -
nr-axSpA CER
400mg
51 53 37.5 (10.8) 86 7.3 6.6 (1.6) 5.1 (2.4) 3.3 (1.5) 12.1 73 - - -

15/12/2014 47
Trial Patient
Group
Trial
arm
n %
Male
Mean or
median
age (SD)
% on
an
NSAID
Mean or
median symptom
duration
(years)
Mean
(SD) [SE]
or median
(IQR) BASDAI
Mean
(SD) or
median
(IQR) BASFI
Mean
(SD) or
median
(IQR) BASMI
Mean or
median
CRP
mg/L, (SD)
%
HLA
-B27 +ve
Mean (SD)
or median (IQR)
SF-36 MCS
Mean (SD)
or median (IQR)
SF-36 PCS
Mean
(SD)or
median ASQoL
nr-axSpA PLA 50 48 38 (11.8) 82 4.5 6.4 (1.5) 4.9 (2.2) 3.1 (1.6) 13.5 78 - - -
Barkham
201072
AS ETA 20 75 40.8 (9.7) NR 11 6.1 (1.7) 5.6 (2.0) - NR - - -
AS PLA 20 85 39.4 (10.1) NR 20 5.5 (1.7) 5.3 (1.8) - NR - - -
Davis
200347
AS ETA 138 76 42.1 91 10.1 5.8 [0.15] 5.2 - 19 84 - - -
AS PLA 139 76 41.9 92 10.5 6.0 [0.14] 5.6 - 20 84 - - -
Dougados 201174
AS ETA 39 95 46 (11) NR 19 6.4 (1.2) 6.3 (2.0) 5.7 (1.4) 25 (31) 79 - - -
AS PLA 43 91 48 (10) NR 23 5.8 (1.5) 5.7 (1.9) 5.8 (1.3) 17 (19) 86 - - -
Dougados
201454**
nr-axSpA ETA 106 64 31.9 (7.8) *** 2.4 ********
*
********
*
1.4 (1.3) 6.8 67 - *********
*
*******
**
nr-axSpA PLA 109 57 32 (7.8) ** 2.5 ********
*
********
*
1.2 (1.3) 6.4 76 - *********
*
*******
**
Gorman
200249
AS ETA 20 65 ******* 80 **** - 4.5 (2.1) - 20 95 - - -
AS PLA 20 90 ******* 95 **** - 3.2 (2.5) - 15 90 - - -
Calin 200448
AS ETA 45 80 45.3 (9.5) 89 15.0 6.1 6.0 - 154 NR - - -
AS PLA 39 77 40.7 (11.4) 85 9.7 5.9 5.7 - 97 NR - - -
Van der
Heijde 200651
AS ETA
25mg
150 76 39.8 (10.7) 85 10.0 5.9(1.7) 5.8 (2.0) - 19.8
(20.8)
NR - - -
AS ETA
50mg
155 70 41.5 (11) 80 9.0 6.2 (1.7) 6.1 (2.0) - 21.7
(24.6)
NR - - -
AS PLA 51 78 40.1 (10.9) 78 8.5 6.1 (1.4) 6.0 (1.9) - 22 (22.9) NR - - -
Giardina
201084
AS ETA 25 80 32.6 (6.8) NR 15.7 6.6 (1.1) 6.5 (1.1) 3.9 (1.7) 22.9 96 - - -
AS INF 25 76 31.9 (9.2) NR 15.4 6.5 (1.2) 6.1 (0.9) 3.7 (1.6) 25 92 - - -
GO- AS GOL 138 74 38 90 11 6.6 (5.6, 5 (3.2, 3 (2, 4) 11 82 46.5 29.7 (22.5, -

15/12/2014 48
Trial Patient
Group
Trial
arm
n %
Male
Mean or
median
age (SD)
% on
an
NSAID
Mean or
median symptom
duration
(years)
Mean
(SD) [SE]
or median
(IQR) BASDAI
Mean
(SD) or
median
(IQR) BASFI
Mean
(SD) or
median
(IQR) BASMI
Mean or
median
CRP
mg/L, (SD)
%
HLA
-B27 +ve
Mean (SD)
or median (IQR)
SF-36 MCS
Mean (SD)
or median (IQR)
SF-36 PCS
Mean
(SD)or
median ASQoL
RAISE 200886
50mg 7.6) 6.7) (36.8,54.1) 35.3)
AS GOL
100mg
140 70 38 88 9.5 7 (6.0,
7.9)
5.4 (3.4,
7.3)
3 (2, 5) 9 84 43.1
(33.5,53.5)
29.8 (25.2,
35.5)
-
AS PLA 78 71 41 92 16.0 6.6 (5.7,
7.7)
4.9 (3.5,
6.8)
4 (2, 5) 11.5 85 46.2
(37.1,54.8)
28.3 (23.8,
34.1)
-
Bao
201453
AS GOL 108 83 30.5 (10.3) 67 6.8 6.6 (1.3) 5 (2.4) 4 (1.9) 20.6 - 36.5 (10.5) 33.2 (7.8) -
AS PLA 105 83 30.6 (8.6) 72 7.5 6.5 (1.5) 5 (2.4) 3.8 (1.6) 18.6 - 36.2 (11.5) 33.9 (7.7) -
Tam
201492
AS GOL 20 90 35.6 (9.9) 85 8.0 6.2 (1.0) 4.6 (1.9) 5.0
(4.0,7.0)
23.9
(18.6)
- - - -
AS PLA 21 90 34.2 (10) 100 11.0 6.2 (1.5) 4.1 (2.3) 3 (2.0,
5.5)
19.9
(14.0)
- - - -
Barkham
200956
nr-axSpA INF 20 75 29.5 90 13.4 5.9 4.4 - 5 100 - - 10
nr-axSpA PLA 20 75 28.2 90 17.2 5.8 4.1 - 11.5 100 - - 11
Braun
200294
AS INF 34 68 40.6 (8) NR 16.4 6.5 (1.2) 5.4 (1.8) 3.7 (2.0) 24 91 51.5 (22.6) 46.5 (22.6) -
AS PLA 35 63 39 (9.1) NR 14.9 6.3 (1.4) 5.1 (2.2) 3.7 (2.2) 18 88 65.4 (18.4) 47.6 (23.4) -
Marzo-
Ortega 200550
AS INF 28 82 41 89 8 6.5 (1.9) 6.7 - 30.5 96 - - 14
AS PLA 14 79 39 86 10 6.6 (2.1) 6 - 30 86 - - 13.5
Van den
Bosch 200296
AS INF 9 78 44.3 NR 10 5.9 4.7 5 41.0 89 - - -
AS PLA 12 83 46.4 NR 17 5.3 5.9 4 25.7 75 - - -
ASSERT
200597
AS INF 201 78 40 NR 7.7 6.6
(5.2,7.1)
5.7
(4.5,7.1)
- 15 87 47.6 (37.6,
54.9)
28.8 (23.8,
33.7)
-
AS PLA 78 87 41 NR 13.2 6.5
(5.3,7.6)
6
(4.1,7.2)
- 17 89 45 (33.7,
55.5)
30.1 (24.9,
36.2)
-
Park AS INFC 125 79 38 NR 6.7 (1.4) 6.2 (1.9) 4 (2.1) 11 - - - -

15/12/2014 49
Trial Patient
Group
Trial
arm
n %
Male
Mean or
median
age (SD)
% on
an
NSAID
Mean or
median symptom
duration
(years)
Mean
(SD) [SE]
or median
(IQR) BASDAI
Mean
(SD) or
median
(IQR) BASFI
Mean
(SD) or
median
(IQR) BASMI
Mean or
median
CRP
mg/L, (SD)
%
HLA
-B27 +ve
Mean (SD)
or median (IQR)
SF-36 MCS
Mean (SD)
or median (IQR)
SF-36 PCS
Mean
(SD)or
median ASQoL
2013105 AS INF 125 82 38 NR 6.6 (1.6) 6.2 (2.2) 4.1 (2.1) 14 - - - -
* Licensed population ** Includes a small proportion (12%) of unlicensed patients

15/12/2014 50
Risk of bias
Results of the risk of bias judgements are presented in Table 4. Further details, including judgement
reasons, and the prognostic indicators of important baseline imbalance, are available in Appendix 3.
Most trials were judged to have a low risk of bias overall; where possible bias was detected there was
little indication to suggest that this varied across the different ant-TNF trials.
Over half the trials did not report adequate details about methods of randomisation and allocation
concealment, though in the majority of those trials (8 out of 14) an assessment could be made of
whether groups were balanced in all five of the important prognostic indicators of treatment response.
Using both randomisation method details and a baseline assessment to judge the risk of selection bias,
15 trials were judged as having a low risk of selection bias, five trials were judged as having an
unclear risk,51, 55, 72, 91, 107
and four a high risk;48, 49, 56, 96
in one of these four trials the risk was deemed
likely to be due to a chance effect.49
The risk of performance bias arising from lack of blinding of participants and personnel was low in 20
trials, unclear in three trials46, 59, 61
and high in the one head-to-head trial, where blinding would have
been difficult to achieve due to the different modes and timings of delivery (weekly injection for
etanercept versus six-weekly infusion for infliximab).84
All except one of the trials were at low risk of
detection bias, since they were all adequately placebo-controlled (except the head-to-head trial), with
nearly all the key outcomes being self-reported by patients (a noTable exception being BASMI). The
blinded patients were the outcome assessors, and the effect of any unblinded study personnel on
patient questionnaire responses was likely to be minimal at most. The proportion of patients
withdrawing or dropping-out of trials was generally low; most trials received low risk judgements for
attrition bias. In two of the trials with unclear risk judgements, there were nevertheless reasons to
suspect the possibility of important bias (see Appendix 3). 59, 72
Of the studies with missing data which
also reported details on the populations and imputations used in analyses ‘last observation carried
forward’ (LOCF) was used; this was done using a modified ITT approach in just over half the trials
(in which patients had to have received at least one dose of treatment), and an ITT approach in the
remaining trials (see Appendix 3). There was no evidence of reporting bias in any of the trials with all
being judged as low risk, except for one trial with an unclear risk of bias.59

15/12/2014 51
Table 4 Risk of bias assessment results
Trial
Bias domain
1 Sequence
generation
2 Allocation
concealment
3 Important
baseline
imbalance
Selection bias based
on 1, 2, and 3.
4 Blinding of
participants and
personnel
5 Blinding of
outcome
assessment
6 Incomplete
outcome data
7 Selective
reporting
Risk of bias judgement
Adalimumab versus placebo
Haibel 200855 Unclear Unclear Unclear Unclear Low Low Low Low
Hu 201259 Unclear Unclear Low Low Unclear Low Unclear Unclear
Huang 201460 Low Low Low Low Low Low Low Low
Lambert 200761 Unclear Unclear Low Low Unclear Low Low Low
ABILITY-1 201352 Low Low Low Low Low Low Low Low
ATLAS 200663 Unclear Unclear Low Low Low Low Low Low
Certolizumab pegol versus placebo
RAPID-axSpA 201446 Low Low Low Low Unclear Low Low Low
Etanercept versus placebo
Barkham 201072 Unclear Unclear Unclear Unclear Low Low Unclear Low
Davis 200347 Unclear Unclear Low Low Low Low Low Low
Dougados 201174 Unclear Unclear Low Low Low Low Low Low
Dougados 201454 Low Low Low Low Low Low Low Low

15/12/2014 52
Trial
Bias domain
1 Sequence
generation
2 Allocation
concealment
3 Important
baseline
imbalance
Selection bias based
on 1, 2, and 3.
4 Blinding of
participants and
personnel
5 Blinding of
outcome
assessment
6 Incomplete
outcome data
7 Selective
reporting
Risk of bias judgement
Gorman 200249 Low Low High* High* Low Low Low Low
Calin 200448 Unclear Unclear High High Low Low Low Low
Van der Heijde 200651 Unclear Unclear Unclear Unclear Low Low Low Low
Etanercept versus Infliximab
Giardina 201084 High High Low Low High High Low Low
Golimumab versus placebo
GO-RAISE 200886 Low Low Low Low Low Low Low Low
Bao 201453 Unclear Unclear Unclear Unclear Low Low Unclear Low
Tam 201492 Low Unclear Unclear Unclear Low Low Low Low
Infliximab versus placebo
Barkham 2009 56 Unclear Unclear High High Low Low Low Low
Braun 200294 Low Low Low Low Low Low Low Low
Marzo-Ortega 200550 Low Low Unclear Low Low Low Unclear Low
Van den Bosch 200296 Unclear Unclear High High Low Low Low Low
ASSERT97 Unclear Unclear Low Low Low Low Low Low

15/12/2014 53
Trial
Bias domain
1 Sequence
generation
2 Allocation
concealment
3 Important
baseline
imbalance
Selection bias based
on 1, 2, and 3.
4 Blinding of
participants and
personnel
5 Blinding of
outcome
assessment
6 Incomplete
outcome data
7 Selective
reporting
Risk of bias judgement
Infliximab versus biosimilar infliximab (Inflectra)
PLANETAS 2013105 Low Low Unclear Low Low Low Low Low
* Judged likely to be due to chance

15/12/2014 54
4.2.2 Clinical effectiveness results – efficacy results from RCTs
Individual results for all 24 trials are presented in Appendix 4.
Exclusions from the meta-analyses
Of the trials with results at between 10 and 16 weeks, one small head-to-head trial (n=50) comparing
etanercept with infliximab was excluded, since it was redundant in a class effect model (in addition
blinding was not feasible in this trial).84
One trial105
was excluded because it compared infliximab and
inflectra, and therefore did not include any of the relevant comparators needed for meta-analysis. The
maximum number of studies included for any one outcome was 16.
Exclusions from the sensitivity analyses
Five studies were excluded in the sensitivity analyses due to risk of bias judgements.48, 49, 59, 72, 96
Further details can be found in Appendix 3. A sensitivity analysis of the nr-axSpA trials was not
performed since the only trial judged to have a high risk of bias had only 40 patients;56
any effect
arising from the removal of such a small study would have been likely to have been minimal.
The best model
Models were run where it was assumed that:
there were different independent treatment effects, or
there was just one treatment class effect
In addition, fixed-effect and random-effects models were run where there were sufficient data. These
models relate to models A1, A2, A3 and A4 in Section 6. For the non-radiographic population, there
were very few studies and therefore only fixed-effect analyses were conducted.
The DIC and I2 results for each outcome (other than injection site reactions) are shown for the AS
population in Table 5 and for the nr-axSpA population in Table 6. The lower the DIC for a given
outcome, the better the model fit. I2 varies between 0% and 100%, with 0% representing no
heterogeneity in the results and 100% indicating that all of the variation in the results can be explained
by heterogeneity. The greater the value of I2, the more likely it is that a random-effects model would
be a better fit. But this is not always the case as if there are few studies then there will be significant
uncertainty around the between-study variance and therefore the I2 also. Random-effect model results
and I2 results are not presented for some outcomes due to sensitivity to prior distributions in the
model.

15/12/2014 55
Table 5: The AS population model DIC statistics
DIC I2
Independent- effects Class-effect
Outcome Fixed Effect Random Effects Fixed Effect Random Effects
Related
model in
Section 6 A1 A2 A3 A4
BASDAI50 16.82 - 10.86 12.71 21%
BASDAI 16.76 18.22 13.53 15.12 21%
BASFI 18.96 20.87 14.79 16.80 10%
ASAS20 10.68 17.05 9.98 8.73 16%
ASAS40 10.36 14.07 8.50 10.29 27%
ASAS50 8.38 - 6.68 8.11 52%
ASAS70 2.92 - - - -
BASMI -0.87 - 0.12 -3.01 77%
SF36 PCS 19.64 - 20.20 17.71 76%
MASES 5.99 - 4.17 - -
SF36 MCS 19.20 - 16.67 18.26 47%
Table 6: The nr-axSpA population model DIC statistics
DIC I2
Independent- effects Class-effect
Outcome Fixed Effect Random Effects Fixed Effect Random Effects
Related
model in
Section 6 A1 A2 A3 A4
BASDAI50 6.74 - 4.85 - -
BASDAI 10.80 - 11.07 11.51 69%
BASFI 11.45 - 13.74 10.70 83%
ASAS20 6.72 - 5.23 - -
ASAS40 11.17 - 7.96 9.30 49%
ASAS50 - - - - -
ASAS70 - - - - -
BASMI 1.80 - 4.74 2.42 89%
SF36 PCS 16.67 - 20.18 - -
MASES - - - - -
SF36 MCS 14.61 - 14.08 - -
Overall, assuming a class effect for the treatments produced a better-fitting model than assuming
independent treatment effects. In addition, a fixed-effect analysis was more often than not appropriate.
The mean and median effects of the two analyses were also similar. Hence, the fixed-effect results are
reported in this section: these represent a common class-effect.

15/12/2014 56
For AS the common class effect model was found to be a much better fit than the independent
treatment effect model . As described in Section 6 the exchangeable class effect model, not explored
here, also fitted the data well, though not so well as the common class effect model. It should be noted
here that the common class effect model may possibly underestimate the uncertainty around the
treatment effect estimate. As explained in Section 6, if the differences between treatments is due to
systematic differences in study design between treatments, then an exchangeable class effect model
may be appropriate. However, if in fact there is a true difference between treatments, such as between
infliximab and the other TNF-inhibitors then an exchangeable class effect model may overestimate
the uncertainty around the effect estimates. Since the common class effect model had a lower DIC
than the exchangeable class effect model, this is the model evaluated in this section. The economic
model explores the assumption that treatment effect differences are in fact due to systematic
differences in study design between treatments.
Since there was very little difference between the results where change from baseline was imputed
assuming a within-study correlation of 0.3 or 0.7, only the results assuming a within-study correlation
of 0.3 are reported here. Comparison of the results assuming different within-study correlations are
presented in the appendix for BASDAI change from baseline.
4.2.2.2 Individual anti-TNFs compared with placebo
Binary responder outcomes at between 10 and 16 weeks
The results of the analyses of the responder outcomes at 10-16 weeks for patients with AS are
presented in Table 7.

15/12/2014 57
Table 7 Results versus placebo for AS population – response outcomes at between 10 and 16 weeks
Number of trials (number of patients)
Relative risk (95% CrI)
Odds ratio (95% CrI)
ASAS 20 ASAS 40 ASAS 50 BASDAI 50
Adalimumab
Main analysis
3 (741) 2 (659) 1 (82) 2 (659)
2.28 (1.98 to 2.62)
4.52 (3.23 to 6.33)
3.42 (2.57 to 4.55)
5.67 (3.56 to 8.97)
2.75 (1.11 to 5.45)
3.58 (1.12 to 11.17)
3.16 (2.40 to 4.16)
4.68 (3.14 to 7.03)
Sensitivity analysis
3 (741) 2 (659) As above 2 (659)
2.27 (1.97 to 2.62)
4.52 (3.23 to 6.33)
3.34 (2.53 to 4.40)
5.67 (3.56 to 8.97)
3.11 (2.37 to 4.09)
4.68 (3.14 to 7.03)
Certolizumab
pegol
Main analysis
1 (178) 1 (178) - 1 (178)
1.80 (1.24 to 2.39)
2.61 (1.37 to 5.01)
2.53 (1.47 to 3.98)
3.38 (1.59 to 7.15)
- 3.60 (2.02 to 5.74)
5.97 (2.39 to 15.03)
Sensitivity analysis
1 (178) 1 (178) - 1 (178)
1.80 (1.24 to 2.39)
2.61 (1.37 to 5.01)
2.49 (1.46 to 3.87)
3.38 (1.59 to 7.15)
- 3.53 (2.00 to 5.58)
5.97 (2.39 to 15.03)
Etanercept
Main analysis
5 (839) 3 (478) 2 (359) 3 (478)
2.23 (1.93 to 2.55)
4.23 (3.05 to 5.88)
2.75 (1.88 to 3.88)
3.86 (2.21 to 6.72)
3.43 (2.40 to 4.90)
5.04 (2.98 to 8.51)
3.17 (2.20 to 4.49)
4.74 (2.71 to 8.28)
Sensitivity analysis
3 (715) 2 (436) As above 2 (436)
2.17 (1.84 to 2.53)
3.98 (2.78 to 5.73)
2.65 (1.80 to 3.72)
3.72 (2.11 to 6.53)
3.03 (2.08 to 4.31)
4.50 (2.52 to 8.01)
Golimumab
Main analysis
2 (429) 2 (429) - 2 (429)
2.14 (1.75 to 2.53)
3.82 (2.47 to 5.86)
3.11 (2.24 to 4.26)
4.77 (2.85 to 7.98)
- 3.57 (2.51 to 5.00)
5.85 (3.31 to 10.28)
Sensitivity analysis
2 (429) 2 (429) - 2 (429)
2.13 (1.74 to 2.53)
3.82 (2.47 to 5.86)
3.05 (2.21 to 4.13)
4.77 (2.85 to 7.98)
- 3.50 (2.48 to 4.88)
5.85 (3.31 to 10.28)
Infliximab
Main analysis
2 (111) - 1 (69) 1 (69)
2.45 (1.73 to 3.06)
5.54 (2.41 to 12.71)
- 5.59 (2.44 to 9.81)
14.71 (3.07 to 72.69)
4.86 (2.41 to 7.82)
12.07 (3.09 to 46.37)
Sensitivity analysis
2 (111) - As above 1 (69)
2.44 (1.72 to 3.06)
5.54 (2.41 to 12.71)
- 4.72 (2.38 to 7.54)
12.07 (3.09 to 46.37)
Anti-TNFs as
a class
Main analysis
13 (2298) 8 (1744) 4 (510) 9 (1813)
2.21 (2.01 to 2.43)
4.12 (3.40 to 4.99)
3.06 (2.52 to 3.76)
4.61 (3.51 to 6.05)
3.51 (2.55 to 4.86)
5.23 (3.31 to 8.27)
3.37 (2.75 to 4.16)
5.22 (4.00 to 6.79)
Sensitivity analysis
11 (2174) 7 (1702) As above 8 (1771)
2.18 (1.97 to 2.42)
4.04 (3.32 to 4.92) 2.99 (2.47 to 3.66)
4.57 (3.48 to 6.02) 3.29 (2.68 to 4.07)
5.16 (3.94 to 6.72)

15/12/2014 58
ASAS improvement criteria: ASAS 20, ASAS 40, ASAS 50 and ASAS 70
For the AS population ASAS 20 data were available for all five anti-TNFs, although the number of
participants studied varied considerably, ranging from 839 patients in five etanercept trials, to 111
patients in two infliximab trials. A consistent effect was evident across the treatments with the pooled
relative risks ranging from 1.80 (certolizumab pegol) to 2.45 (infliximab). ASAS 40 data were
available for four anti-TNFs (no data were available for infliximab); the amount of data available
ranged from 178 patients in one certolizumab trial, to 659 patients in 2 adalimumab trials. Again a
consistent effect was found, with relative risks ranging from 2.53 (certolizumab pegol) to 3.42
(adalimumab); all the relative risks were greater than the corresponding ASAS 20 estimates. For
ASAS 50 there were two trials of etanercept (totalling 359 participants) and small single trials in
adalimumab (n=82) and infliximab (n=69). A wider range of relative risks and credible intervals
resulted, ranging from 2.75 (adalimumab) to 5.59 (infliximab) which may be a consequence of the
smaller numbers of patients studied. Only two trials, both of etanercept (n=359), reported actual
numbers of ASAS70 responders. Pooling of these data showed that patients taking etanercept were
more than three times more likely to be ASAS 70 responders compared with patients taking placebo
(RR 3.59, 95% CrI 2.18 to 5.87).
For the nr-axSpA population, each of the relative risks for certolizumab pegol and etanercept were
based on single, quite large trials; the estimate for adalimumab was based on a similar number of
patients (to etanercept and certolizumab) across two trials, whereas infliximab was represented by a
single small trial (n=40). ASAS 20 results were similar across treatments but for ASAS 40
heterogeneity of effect appeared evident; the smallest estimate was for etanercept and the largest
estimate was seen in the small infliximab trial (Table 8). However, this inflixiamb trial was the only
nr-axSpA trial judged to be at high risk of bias. Only one trial (RAPID-axSpA) reported ASAS 50 or
ASAS 70 results. For ASAS 50 the relative risk was 4.23 (95% CrI 1.84 to 9.72; OR 5.96 (95% CrI
2.40 to 14.80)). For ASAS 70 the relative risk was 4.58 (95% CrI 1.37 to 15.40; OR 5.42, 95% CrI
1.54 to 19.11).
BASDAI 50
For the AS population BASDAI 50 data were available for all five anti-TNFs; the number of
participants studied varied widely, ranging from 69 patients in one infliximab trial to 659 patients in
two adalimumab trials. Although a consistent beneficial effect was evident across treatments, some
heterogeneity of effect could be seen with the relative risks ranging from 3.16 (adalimumab) to 4.86
(infliximab).
For the nr-axSpA population the relative risks were lower than for the AS population being 2.52 (95%
CrI 1.65 to 3.83, 2 trials) for adalimumab, 2.80 (95% CrI 1.71 to 4.47, 1 trial) for certolizumab, and
1.92 (95% CrI 1.27 to 2.82, 1 trial) for etanercept (Table 8).

15/12/2014 59
Results of the AS sensitivity analyses were very similar to the main analyses (Table 7).
Table 8 Results versus placebo for nr-axSpA population – response outcomes at 10-16 weeks
Number of trials (number of patients)
Relative risk (95% CrI)
Odds ratio (95% CrI)
ASAS 20 ASAS 40 BASDAI 50
Adalimumab
2 (188) 2 (188) 2 (188) 1.92 (1.47 to 2.56)
3.71 (2.02 to 6.75)
3.14 (1.99 to 4.68)
5.04 (2.44 to 10.32)
2.52 (1.65 to 3.83)
3.97 (1.97 to 7.86)
Certolizumab
pegol
1 (147) 1 (147) 1 (147) 1.59 (1.10 to 2.21)
2.32 (1.15 to 4.67)
3.04 (1.74 to 4.81)
4.75 (2.01 to 11.17)
2.80 (1.71 to 4.47)
4.92 (2.09 to 11.58)
Etanercept
1 (215) 1 (215) 1 (215)
1.46 (1.08 to 1.94)
1.94 (1.13 to 3.37)
2.07 (1.26 to 3.20)
2.55 (1.32 to 4.92)
1.92 (1.27 to 2.82)
2.45 (1.37 to 4.43)
Infliximab
- 1 (40) -
- 3.63 (1.41 to 6.44)
6.85 (1.52 to 31.03)
-
Anti-TNFs as
a class
4 (550) 5 (590) 4 (550)
1.65 (1.37 to 2.04)
2.52 (1.78 to 3.59)
2.74 (2.08 to 3.62)
3.92 (2.61 to 5.91)
2.31 (1.76 to 3.10)
3.33 (2.24 to 4.96)
Continuous outcomes at between 10 and 16 weeks
The results of the analyses of the continuous efficacy outcomes for patients with AS are presented in
Table 9.
For the AS population, when compared with placebo, adalimumab (n=705), certolizumab pegol
(n=178), etanercept (n=483) and infliximab (n=132) produced statistically significant reductions in
disease activity, when assessed using BASDAI. The magnitude of the reductions in change from
baseline BASDAI score ranged from 1.46 units (certolizumab pegol) to 2.28 units (infliximab). None
of the three golimumab trials reported BASDAI as a continuous outcome. The amount of data
available for BASFI in patients with AS ranged from 132 patients in three infliximab trials, to 523
patients in five etanercept trials. When compared with placebo, all five anti-TNFs produced
statistically significant improvements in function. The magnitude of the reductions in change from
baseline BASFI score ranged from 1.1 units (certolizumab pegol) to 2.16 units (infliximab). When
compared with placebo, statistically significant improvements in BASMI scores were found for AS
patients taking adalimumab (mean difference in change from baseline: -0.37, 95% CrI -0.50 to -0.23)
and etanercept (mean difference in change from baseline: -0.37, 95% CrI -0.65 to -0.09), but not for
certolizumab pegol (mean difference in change from baseline: -0.26, 95% CrI -0.55 to 0.03) and
golimumab (mean difference in change from baseline: -0.11, 95% CrI -0.26 to 0.04). Results for SF-
36 MCD, SF-36 PCS and ethesitis (MASES) are presented in Table 9.
For the nr-axSpA population, a heterogeneity of effect on BASDAI and BASFI appears evident from
the relative risks of the individual anti-TNFs. The smallest estimates were for etanercept and the

15/12/2014 60
largest estimates were seen in the small infliximab trial, although this trial was the only nr-axSpA trial
judged to be at high risk of bias (Table 10).
Results of the AS sensitivity analyses were very similar to the main analyses (Table 9).
When the mean baseline BASDAI and BASFI are presented by treatment response at week 12 (or 14
for golimumab) for three of the five anti-TNFs (see Appendix 6), it can be seen that in patients with
AS and patients with nr-axSpA, on average baseline BASDAI does not differ greatly between
responders and non-responders either to placebo or to active anti-TNF therapy. In patients with AS or
nr-axSpA from the trials of adalimumab (ATLAS and M10-791) and golimumab (GO-RAISE) on
average baseline BASFI was higher in non-responders compared with responders. However, this was
not seen in the etanercept trials.

15/12/2014 61
Table 9 Results versus placebo for AS population – continuous outcomes at 10-16 weeks
Number of trials (number of patients)
Mean difference in change from baseline (95% CrI)
BASDAI BASFI BASMI SF-36 PCS SF-36 MCS MASES
Adalimumab
Main analysis 3 (705) 2 (390) 2 (659) 2 (659) 2 (659) 2 (659)
-1.55 (-1.88 to -1.22) -1.25 (-1.63 to -0.87) -0.37 (-0.50 to -0.23) 3.53 (2.37 to 4.68) 1.41 (-0.19 to 3.02) -0.50 (-0.89 to -0.11)
Sensitivity analysis 2 (659) 1 (344) Same as above Same as above Same as above Same as above
-1.55 (-1.89 to -1.21) -1.28 (-1.68 to -0.88)
Certolizumab
pegol
Main analysis 1 (178) 1 (178) 1 (178) 1 (178) 1 (178) -
-1.46 (-2.17 to -0.74) -1.10 (-1.83 to -0.37) -0.26 (-0.55 to 0.03) 5.64 (3.64 to 7.66) 1.25 (-2.08 to 4.61) -
Sensitivity analysis Same as above Same as above Same as above Same as above Same as above -
-
Etanercept
Main analysis 4 (483) 5 (523) 1 (82) - - -
-1.75 (-2.14 to -1.37) -1.43 (-1.82 to -1.04) -0.37 (-0.65 to -0.09) - - -
Sensitivity analysis 2 (359) 2 (359) Same as above - - -
-1.72 (-2.16 to -1.29) -1.29 (-1.76 to -0.84) - - -
Golimumab
Main analysis - 2 (429) 2 (429) 2 (429) 2 (429) 1 (216)
- -1.45 (-1.84 to -1.05) -0.11 (-0.26 to 0.04) 5.06 (3.71 to 6.40) 2.75 (1.08 to 4.40) -0.70 (-1.53 to 0.11)
Sensitivity analysis - Same as above Same as above Same as above Same as above Same as above -
Infliximab
Main analysis 3 (132) 3 (132) - - - -
-2.28 (-3.18 to -1.38) -2.16 (-3.18 to -1.12) - - - -
Sensitivity analysis 2 (111) 2 (111) - - - -
-2.18 (-3.14 to -1.21) -1.94 (-3.07 to -0.80) - - - -
Anti-TNFs as
a class
Main analysis 11 (1498) 13 (1652) 6 (1348) 5 (1266) 5 (1266) 3 (875)
-1.66 (-1.88 to -1.43) -1.38 (-1.59 to -1.18) -0.27 (-0.36 to -0.18) 4.40 (3.60 to 5.21) 1.93 (0.12 to 3.72) -0.54 (-0.89 to -0.19)
Sensitivity analysis 7 (1305) 8 (1419) Same as above Same as above Same as above Same as above
-1.63 (-1.88 to -1.39) -1.34 (-1.57 to -1.12)

15/12/2014 62
Table 10 Results versus placebo for nr-axSpA population – continuous outcomes at 10-16 weeks
Number of trials (number of patients)
Mean difference in change from baseline (95% CrI)
BASDAI BASFI BASMI SF-36 PCS SF-36
MCS
Adalimumab 2 (188) 2 (188) 2 (188) 2 (188) 2 (188)
-1.23 (-1.83 to -0.62) -0.90 (-1.44 to -0.36) -0.02 (-0.24 to 0.20) 4.98 (2.74 to 7.20) 1.13 (-1.86 to 4.13)
Certolizumab
pegol
1 (147) 1 (147) 1 (147) 1 (147) 1 (147) -1.85 (-2.83 to -0.88) -1.90 (-2.87 to -0.94) -0.55 (-0.89 to -0.20) 6.99 (4.23 to 9.76) 4.01 (0.44 to 7.53)
Etanercept 1 (215) 1 (215) - - -
-0.70 (-1.54 to 0.12) -0.60 (-1.16 to -0.06) - - -
Infliximab 1 (40) 1 (40) 1 (40) 1 (40) -
-2.67 (-4.21 to -1.13) -2.24 (-3.67 to -0.80) 0.00 (-0.44 to 0.44) 2.10 (-0.21 to 4.37)
Anti-TNFs as
a class
5 (590) 5 (590) 4 (375) 4 (375) 3 (335)
-1.32 (-1.74 to -0.90) -0.99 (-1.34 to -0.64) -0.15 (-0.32 to 0.02) 4.41 (3.04 to 5.81) 2.33 (0.07 to 4.62)
4.2.2.3 Individual anti-TNFs compared with each other
For efficacy outcomes, all of the comparisons that could be made between different anti-TNFs at 10-
16 weeks resulted in no statistically significant differences between treatments. For the full results see
Appendix 5.
One small trial, which could not be included in the meta-analysis (see section 4.2.2), compared
infliximab with etanercept in a two year unblinded randomised study of 50 AS patients.84
At 12 weeks
there were statistically significant differences between groups in terms of BASDAI (3.5 versus 5.6,
p<0.005) and BASFI (3.5 versus 5, p<0.005), favouring treatment with infliximab. By week 48, the
BASDAI and BASFI scores were almost identical across the treatment groups (data were only
presented graphically). Also at 12 weeks, 19 of 25 infliximab patients were ASAS 20 responders,
versus 15 of 25 etanercept patients (not a statistically significant difference). This study concluded
that infliximab produces a more rapid clinical improvement, but, at the end of the study, treatment
with both etanercept and infliximab was effective and safe. The results of this trial may explain why,
at 10-16 weeks, the meta-analysis results for infliximab were a little better than those of the other anti-
TNFs.
Another trial which could not be included in the meta-analysis compared infliximab with an
infliximab biosimilar called Inflectra in 250 AS patients.105
The ASAS 40 response rates at week 14
were 42% for inflectra and 46% for infliximab (OR 0.85, 95% CI 0.51 to 1.42) and at week 30 they
were 52% for inflectra and 47% for infliximab (OR 1.19, 95% CI 0.70 to 2.00). At week 14 BASDAI
median change from baseline scores were identical (-2.7) and at week 30 they differed slightly (-3.1
Inflectra vs -2.5 infliximab). For BASFI the median change from baseline scores were -2.2 Inflectra

15/12/2014 63
versus -2.4 infliximab at week 14, and -2.6 Inflectra versus -2.2 infliximab at week 30. The study
concluded that Inflectra had a comparable efficacy and safety profile to that of infliximab.
4.2.2.4 Anti-TNFs as a class compared with placebo
Within this section the class effect, calculated as a common effect across all the TNF-inhibitors under
consideration, assumes a single treatment effect for all the TNF-inhibitors. It is calculated as the
pooled treatment effect using a fixed effect model. The common class effect model may possibly
underestimate the uncertainty around the treatment effect estimate. As explained in chapter 6, if the
differences between treatments is due to systematic differences in study design between treatments
then an exchangeable class effect model may be appropriate. However, if in fact there is a true
difference between treatments, such as between infliximab and the other TNF-inhibitors then an
exchangeable class effect model may overestimate the uncertainty around the mean class effect
estimates. Since the common class effect model had a lower DIC than the exchangeable class effect
model, this is the model evaluated in this chapter. The economic model in chapter 7 explores the
assumption that treatment effect differences are in fact due to differences in study design between
treatments.
Binary responder outcomes at between 10 and 16 weeks
ASAS improvement criteria: ASAS 20, ASAS 40, ASAS 50 and ASAS 70
When compared with placebo, anti-TNFs as a common class were more than twice as likely to result
in patients with AS achieving an ASAS 20 response (RR 2.21, 95% CrI 2.01 to 2.43, 13 trials, Table
7). Anti-TNFs were also around three times as likely to result in patients achieving an ASAS 40
response (RR 3.06, 95% CrI 2.52 to 3.76, 8 trials) and three and a half times as likely to result in
patients achieving an ASAS 50 response (RR 3.51, 95% CrI 2.55 to 4.86, 4 trials). Only two trials,
both of etanercept, reported data suitable for the ASAS 70 analysis; the results are presented in section
4.2.2.2 below. There was little evidence of heterogeneity for ASAS 20 (I2=16%) and ASAS 40
I2=27%), but heterogeneity was evident for ASAS 50 (I
2=52%). For ASAS 50 three of the four trials
were small (i.e. fewer than 100 participants), which may partly explain the heterogeneity estimate.
For the nr-axSpA population anti-TNFs as a common class were statistically significantly more
effective than placebo, although the relative risks being lower than for the AS population. For ASAS
20 the relative risk was 1.65 (95% CrI 1.37 to 2.04, 4 trials) and for ASAS 40 the relative risk was
2.74 (95% CrI 2.08 to 3.62, 5 trials). Only one trial presented ASAS 50 and ASAS 70 results (see
section 4.2.2). A heterogeneity estimate could only be calculated for ASAS 40 (I2=49%).

15/12/2014 64
BASDAI 50
Anti-TNFs as a common class resulted in patients with AS being more than three times more likely to
achieve a BASDAI 50 response when compared with patients taking placebo (RR 3.37, 95% CrI 2.75
to 4.16, 9 trials). There was little evidence of heterogeneity (I2=21%).
For the nr-axSpA population anti-TNFs as a common class were also statistically significantly more
effective than placebo in terms of achieving a BASDAI 50, although the relative risk being lower than
for the AS population (RR 2.31, 95% CrI 1.76 to 3.10, 4 trials). Results of the AS sensitivity analyses
were very similar to the main analyses (Table 4).
Binary responder outcomes at between 24 and 30 weeks
Four AS trials reported outcomes at between 24 and 30 weeks (see Table 2). Anti-TNFs as a common
class were statistically significantly more effective than placebo at 24-30 weeks; for ASAS 20 the
relative risk was 1.69 (95% CrI 1.30 to 2.14, 4 trials). No studies reported BASDAI 50 or ASAS 70
results, and only single studies reported on ASAS 40 (RR 4.01, 95% CrI 2.13 to 7.55),97
and ASAS 50
(RR 4.17, 95% CrI 2.45 to 7.12).47
Continuous outcomes at between 10 and 16 weeks
When considered together as a group compared with placebo (Table 9), treatment with an anti-TNF in
patients with AS produced statistically significant improvements (calculated using mean difference in
change from baseline) in: disease activity (BASDAI mean difference: -1.66 units, 95% CrI -1.88 to -
1.43, 11 trials); function (BASFI mean difference: -1.38 units, 95% CrI -1.59 to -1.18, 13 trials);
spinal mobility (BASMI mean difference: -0.27 units, 95% CrI -0.36 to -0.18); physical health (SF-36
PCS mean difference: 4.40, 95% CrI 3.60 to 5.21, 5 trials); mental health (SF-36 MCS mean
difference: 1.96, 95% CrI 0.87 to 3.05, 5 trials); and enthesitis (MASES mean difference: -0.54, 95%
CrI -0.89 to -0.19, 3 trials). There was little evidence of heterogeneity for BASDAI (I2=21%) and
BASFI (I2=10%), but evidence of substantial heterogeneity for BASMI (I
2=77%), SF-36 PCS
(I2=76%) SF-36 MCS (I
2=47%) and MASES (I
2=91%).
In the nr-axSpA population the mean differences achieved with anti-TNFs (Table 10) were also
statistically significant, although slightly lower than for the AS population. For BASDAI the mean
difference was -1.32 units (95% CrI -1.74 to -0.90, I2=69%) and for BASFI the mean difference was -
0.99 units (95% CrI -1.34 to -0.64, I2=83%) but there was evidence of substantial heterogeneity. The
results for SF-36 MCS and SF-36 PCS were similar to those for AS (Table 10).
Results of the AS sensitivity analyses were very similar to the main analyses (Table 9). Because the
results of the independent treatment effects showed a trend that infliximab had a greater, although not
statistically significant, effect on the change in BASDAI and BASFI from baseline, an additional

15/12/2014 65
sensitivity analysis was conducted where infliximab was assumed to be different to the rest of the ant-
TNFs. The results are presented in Table 11. The low weight of evidence available for infliximab
ensures that the class effect for the other anti-TNFs does not change greatly. Although it is possible
that infliximab has a greater effect than the other anti-TNFs at least at 12 weeks, there is no strong
evidence from these analyses to suggest that it does.
Table 11: The difference in change from baseline for BASDAI and BASFI assuming all TNFs have the
same effect and assuming infliximab may be different
BASDAI BASFI
Mean 95% CrI Mean 95% CrI
All TNFs -1.66 (-1.88 to -1.43) -1.38 (-1.59 to -1.18)
TNFs other than infliximab -1.62 (-1.85 to -1.38) -1.35 (-1.56 to -1.14)
Infliximab -2.28 (-3.18 to -1.38) -2.15 (-3.18 to -1.11)
Continuous outcomes at between 24 and 30 weeks
Four AS trials reported outcomes at between 24 and 30 weeks (see Table 2). The mean differences in
change from baseline were -1.98 units (95% CrI -2.27 to -1.68, 4 trials) for BASDAI, -0.87 units
(95% CrI -1.11 to -0.62, 3 trials)47, 50, 97
for BASFI, and -1.00 units (95% CrI -1.19 to -0.81, 2
studies)92, 97
for BASMI. One study reported SF-36 outcomes, with differences of 9.40 (95% CrI 7.88
to 10.92) for SF-36-PCS and 0.70 (95% CrI -1.36 to 2.76) for SF-36-MCS.97
4.2.2.5 Outcomes not included in the meta-analyses
Very little data was available on peripheral symptoms (other than enthesitis – see MASES results
above) or symptoms of extra-articular manifestations. One trial reported five cases of inflammatory
bowel disease flare up to the 24 week time point; three occurred in patients on etanercept, and 2 in
patients on placebo.47
Another study reported that there were no cases of inflammatory bowel disease
at 12 weeks.51
Incidence of uveitis was also reported in one trial; up to the 24 week time point there
were three cases in the etanercept arm and 8 cases in the placebo arm.47
**********************************************************************************
**********************************************************************************
*****************************************************************************. A
study of adalimumab reported no statistically significant difference in EQ-5D between groups at 12
weeks (0.78 for adalimumab versus 0.72 for placebo, p=0.32).55
For ASQoL – a quality of life instrument specific to ankylosing spondylitis - ATLAS was the only
trial which reported results together with SDs or SEs; significant improvements were found favouring
treatment with adalimumab at week 12 (mean change from baseline -3.2 (SD 0.3) for adalimumab
versus -1 (SD 0.4) for placebo).64
Similar statistically significant results were reported in an etanercept

15/12/2014 66
trial at 12 weeks (mean change from baseline -3.3 for etanercept versus -0.1 for placebo, p=0.02)72
and in an infliximab trial at 16 weeks (mean change from baseline -6.2 for infliximab versus -1 for
placebo, p=0.007).56
Another small study of infliximab did not find a significant difference between
groups at 30 weeks (p=0.14).50
4.2.2.6 ‘Placebo’ response in AS and nr-axSpA
To inform insight into the extent of any ‘placebo’ effects (outlined in section 2.1), Table 12 compares
the placebo response rates in trials which reported ASAS 20 results and at least one of ASAS 40 or
BASDAI 50 results. These data highlight the relatively high rates of ASAS 20 response (median 31%,
range 21% to 40%) when compared with ASAS 40 response (median 15%, range 10% to 23%) and
BASDAI 50 response (median 16%, range 5% to 24%).
However, the extent of the ‘placebo’ response on the ASAS 20 results might result in an
underestimation of anti-TNF efficacy, notably when ASAS 20 is the only ASAS improvement
outcome reported in a trial. An increase in the likelihood of being a responder (i.e. the relative risks
when compared with placebo) when moving up the ASAS thresholds seems apparent from the results
in section 4.2.2.1. This might be explained by considering the subset of patients who achieve an
ASAS 20 response largely due to regression to the mean (i.e. due to natural variation in repeated data
measurements, such as patients transitioning from flare at randomisation to no flare at 12 weeks). For
those patients who experience regression to the mean after taking an anti-TNF, the true benefit of
treatment may be hidden in the ASAS 20 outcome for some patients, and the proportion of ASAS 20
responders might therefore differ only moderately between the anti-TNF and placebo groups. As the
bar for response is raised - from ASAS 20 through to ASAS 70 - this difference in the proportion of
responders between active treatment and placebo groups is likely to increase as an effect due to
regression to the mean becomes less likely. The diluting effect of a placebo response on the relative
risks therefore diminishes as the ASAS thresholds increase (and more informative estimates of
treatment benefit can be seen). Regardless of the reason, these results highlight the limited
applicability of ASAS 20 as a clinically informative outcome measure. ASAS 20 was nevertheless
was the most commonly reported responder outcome across the trials.

15/12/2014 67
Table 12 Comparison of placebo response rates in trials reporting ASAS 20 results together with ASAS 40 or BASDAI 50 results
Number of responders % of responders Difference in response (%)
Population
and study
Placebo
compared
with
Time
point
(weeks)
Number of
patients on
placebo
ASAS
20
ASAS
40
BASDAI
50
ASAS
20
ASAS
40
BASDAI
50
ASAS 20 vs
ASAS 40
ASAS 20
vs BASDAI 50
ASAS 40 vs
BASDAI 50
nr-axSpA 55
Adalimumab 12 24 6 3 5 25% 13% 21% 13% 4% -8%
AS 60 Adalimumab 12 115 35 11 19 30% 10% 17% 21% 14% -7%
nr-axSpA 52
Adalimumab 12 73 23 10 10 32% 14% 14% 18% 18% 0%
AS63 Adalimumab 12 107 22 14 17 21% 13% 16% 7% 5% -3%
AS46 Certolizumab 12 57 21 11 6 37% 19% 11% 18% 26% 9%
nr-axSpA 46
Certolizumab 12 50 20 8 8 40% 16% 16% 24% 24% 0%
AS74 Etanercept 12 43 14 10 10 33% 23% 23% 9% 9% 0%
nr-axSpA 54
Etanercept 12 109 39 17 26 36% 16% 24% 20% 12% -8%
AS51 Etanercept 12 51 19 11 10 37% 22% 20% 16% 18% 2%
AS86 Golimumab 14 78 17 12 12 22% 15% 15% 6% 6% 0%
AS53 Golimumab 14 105 26 10 5 25% 10% 5% 15% 20% 5%
AS94 Infliximab 12 35 10 3 29% - 9% - 20% -

15/12/2014 68
Summary of the RCT clinical efficacy results
For both the AS and nr-axSpA populations the results of the meta-analyses demonstrated that anti-
TNFs produce statistically significant and clinically relevant benefits to patients in terms of improving
function and reducing disease activity. The common class effect model used may have underestimated
the uncertainty in the effect estimates. Although there is a possibility that infliximab is more effective
than other TNF inhibitors at least at 12 weeks, there is no strong evidence to support this. For the
disease activity, function, and responder outcomes, the class efficacy estimates were consistently
slightly smaller for nr-axSpA than for AS, most noticeably for BASFI and BASDAI 50.
The included RCTs were generally subject to low risks of bias and no important variation in baseline
characteristics was evident, with the exception of CRP levels; in the nr-axSpA trial populations CRP
levels were much lower than in the AS populations. Although heterogeneity of CRP levels was
evident across both the AS trials and the nr-axSpA trials, in almost all the AS trials the CRP levels
were higher than the 14mg/l threshold identifed as being a key predictor of treatment response (in AS,
higher CRP levels are associated with an increased likelihood of BASDAI 50 response).108
In the nr-
axSpA trials only the RAPID-axSpA population came close to this cut-off. These lower CRP levels
may therefore have had an impact on the efficacy estimates for the nr-axSpA population.
Statistical heterogeneity was more apparent in the nr-axSpA analyses than in the AS analyses. This
may be due to both clinical heterogeneity in the nr-axSpA trials (such as variation in CRP thresholds,
or the proportion of MRI positive patients), and the fact that fewer studies were available for analysis.
In light of the statistical heterogeneity across the nr-axSpA trials, both the reliability of the nr-axSpA
pooled estimates and their true relevance to patients seen in clinical practice are questionable.
The clinical relevance of the efficacy of anti-TNFs can be evaluated in part by considering the
literature on minimum clinically important differences (MCID) or improvements (MCII). In a study
of 125 AS patients, Pavy et al109
reported a MCID of 1 unit (or a 20% relative change) for BASDAI
and 0.7 units (17.5% relative change) for BASFI. All the effect estimates from this review for both
BASDAI and BASFI were considerably higher than these MCIDs. The small effect on spinal mobility
(a group effect reduction of around 0.3 BASMI units) appears unlikely to be clinically important.
4.2.2.7 Summary of some key issues arising from the FDA assessments of the ABILITY-1 and
Rapid-axSpA trials
The FDA Arthritis Advisory Committee met in July 2013 to discuss licence applications for
adalimumab for patients with active nr-axSpA (with objective signs of inflammation) and
certolizumab pegol for patients with active axial spondyloarthritis, including patients with ankylosing
spondylitis. An important issue which arose in both trials was the differences in diagnoses arising

15/12/2014 69
from x-ray images evaluated centrally, when compared with images being evaluated locally. The
implications for efficacy were explored via further analyses.
Rapid-axSpA trial (certolizumab pegol)
This trial aimed to recruit both AS and nr-axSpA patients.46
The nr-axSpA patients had to have a
positive MRI or an elevated CRP; the definition used for CRP elevation was 7.9mg/L.
Comparison of AS and nr-axSpA population characteristics
In AS males predominated (72%), whereas in nr-axSpA the male to female ratio was roughly equal.
The AS population had a mean age of 41.5 years, which was around four years older than the nr-
axSpA population. Baseline BASFI, BASMI and CRP levels suggested more functional and mobility
impairment and more inflammation in the AS group when compared with the nr-axSpA group.
However, baseline back pain severity and BASDAI scores were similar between the AS and nr-axSpA
subgroups (Table 13).
Methods used to evaluate x-ray images
In the trial, many patients had their disease re-classified when x-ray images were evaluated centrally,
rather than being evaluated locally. Two readers were involved in the central evaluation of the x-ray
images, they were blinded to both the assigned subgroup and the treatment group; a third reader was
used in cases of disagreement. 21% of locally-classified AS patients were re-classified as nr-axSpA
by central readers and 51% of locally-classified nr-axSpA patients were re-classified as AS by the
central readers. Based on the central assessments 184 patients had AS and 98 patients had nr-axSpA.
Central reads could not be made for 43 patients as x-rays were not available (37 AS patients and 6 nr-
axSpA patients).
ABILITY-1 trial (adalimumab)
This trial intended to recruit only nr-axSpA patients, although this included patients (n=43) who had
nr-axSpA but neither a positive MRI nor an elevated CRP.52
The population with these 43 patients
excluded is referred to as the ‘adalimumab target population’ (ATP). As in the Rapid-axSpA trial,
central re-reading of x-rays was performed (in addition to local evaluation) although this was only
done for per-protocol patients, who also reached week 104 (n=102 (out of 185) patients). Thirty-eight
of the 102 were identified as having AS rather than nr-axSpA. The FDA statistician analysed the
results in these 38 patients and compared them to those for patients with centrally confirmed
nrAxSpA. The FDA document reported results for the sub-populations based on local or central
diagnosis, including ATP analyses.
Comparison of AS and nr-axSpA results and impact of reclassification in the trials

15/12/2014 70
For certolizumab pegol the FDA statistical review stated that “efficacy findings were consistent in
both AS and nr-axSpA subpopulations regardless of the discrepancy in pelvic x-ray readings at local
or central lab for modified New York criteria” (Table 14).
For ABILITY-1 a notably higher proportion of patients in the AS subgroup responded to adalimumab
(ASAS 40) when compared with placebo than of patients with confirmed nr-axSpA. This suggests
that the treatment benefit in the whole trial population may be driven by benefit in AS patients rather
than in nr-axSpA patients, skewing the results for the ATP (Table 14). It should be noted though that
this may be an atypical AS population – the trial had intended to recruit only nr-axSpA patients.
Due to the fact that only a select group of patients could be subject to central confirmation of their nr-
axSpA status, the FDA statistician explored assumptions around the proportion of true nr-axSpA
patients in the whole trial population. Given that the treatment difference in the non-centrally-read
patients was 23%:
Assuming that all non-centrally read patients were true negatives and therefore including them in
the analysis with the centrally read negatives, the treatment difference for the centrally-read and
non-centrally read negatives was 15%.
Assuming that a fraction (i.e., 63%) of non-centrally read patients were true negatives and
including only this fraction of non-centrally read patients with the centrally read negatives, the
treatment difference was 14%.
The FDA document stated that, “Because there was a differential treatment effect between the
centrally-read positive and centrally-read negative, it is safe to assume that the difference of 23% is an
overestimate of the treatment effect because this includes both positive and negative x-ray groups. If
there is a fraction of patients who are negative in the non-centrally-read group, treatment difference
among this negative group would be smaller. Therefore, the treatment difference for negative x-rays
(i.e., centrally-read and non-centrally-read) should be at most 15%. Based on the data provided, the
estimate of the treatment effect in ASAS40 response for nr-axSpA should be no bigger than 15%.”
Overall, the results suggest reduced efficacy of anti-TNFs in the centrally diagnosed nr-axSpA
population when compared with the locally diagnosed population. Nevertheless, there was noticeable
variation across the two trials. In Rapid-axSpA (certolizumab) the difference between the central and
local populations appears small (and is not evident for 400mg versus placebo results). Conversely, in
ABILITY-1 (adalimumab) the locally diagnosed population had notably more responders than the
centrally diagnosed population, though the treatment group sample sizes were small.

15/12/2014 71
Table 13 Baseline characteristics of trials analysed by the FDA
Trial &
Population
Characteristic
Age (mean) % Male Duration of
symptoms,
years (mean)
Weight, kg
(mean)
% HLA-B27
positive
% on
NSAIDs
CRP % MRI
positive
BASDAI
(mean)
BASFI
(mean)
ABILITY-1 nr-
axSpA (n=142)
38 46 Median, 8 mean
11
80 80 81 median ~4,
mean 9
51 6 4.7
Rapid-axSpA
nr-axSpA (n=147)
37 48 median 5.5,
mean 8.6
82 75 84 median 11.9
mean 16
54 6.5 4.9
Rapid-axSpA, AS
(n=178)
42 73 median 9.1,
Mean 11.9
82 82 91 median 14.3,
mean 21.3
N/A 6.4 5.7
Table 14 FDA analyses - percentage differences from placebo, by method of diagnosis
Outcomes
at week 12
ABILITY-1
ATP population
Rapid-axSpA
Local lab
nr-axSpA
ADA n=69,
PBO n=73
Central lab nr-
axSpA
ADA n=25,
PBO n=20
Local lab nr-axSpA
CZP 200mg n=46, CZP 400mg
n=51, PBO n=50
Central lab nr-axSpA
CZP 200mg n=39, CZP 400mg
n=35, PBO n=39
Local lab AS
CZP 200mg n=65, CZP 400mg
n=56, PBO n=57
Central lab AS
CZP 200mg n=74, CZP 400mg
n=71, PBO n=67
Adalimumab 40mg CZP 200mg CZP 400mg CZP 200mg CZP 400mg CZP 200mg CZP 400mg CZP 200mg CZP 400mg
ASAS 20
95% CI
28%
12 to 44
15%
-14 to 44
19%
1 to 38
23%
4 to 42
23%
2 to 44
23%
1 to 44
20%
3 to 37
27%
10 to 45
17%
1 to 33
23%
7 to 39
ASAS 40
95% CI
27%
13 to 41
11%
-16 to 38
32%
14 to 49
31%
14 to 48
18%
0 to 36
27%
8 to 47
21%
5 to 36
31%
14 to 47
28%
13 to 43
33%
17 to 48
BASDAI50
95% CI
25%
11 to 39
19%
-8 to 46
- - - - - - - -

15/12/2014 72
4.2.3 Long-term efficacy results from open-label extensions of RCTs
Of the 24 included RCTs, 17 reported data from an open-label extension phase. Results for all studies
are presented in Appendix 7. Considerable effort has been put into patient follow-up in anti-TNF trials
with the results that data up to 5 years is available (there are data up to 8 years for infliximab but that
included an involuntary treatment break and is not discussed further). The longest follow-up durations
in patients with AS by anti-TNF are: adalimumab 260 weeks, etanercept 264 weeks, infliximab 156
weeks, golimumab 268 weeks ; and certolizumab pegol 96 weeks. However, the data were reported
across numerous publications and in various formats. Results were reported as observed, as completer
analyses, using imputation (and rarely LOCF) for non-responders and LOCF for missing continuous
data, but these related to differing populations (at varying time points): all patients randomised, all
patients who took active drug at any point in the study, or just during the open-label phase. The
follow-up protocols were not clearly reported, with stopping rules unclear, but it appears that not all
patients who did not achieve a response at ASAS 20, 40 or BASDAI 50 discontinued therapy.
Therefore the results may not reflect clinical practice should response be required for treatment
continuation.

Technology Assessment Report for NICE
TNF-alpha inhibitors for ankylosing spondylitis and nr-axSpA
15/12/2014 73
Table 15 Treatment effect over time (AS only) (results calculated using NRI)
Outcome Trial 52 weeks 104 weeks 156 weeks 5 years
(approx. 264
weeks)
Adalimumab
ASAS 20 ATLAS 193/311 (62%)c 135/311 (43%)c 111/311 (36%)c
ASAS 40 ATLAS 138/311 (44%)c 109/311 (35%)c 88/311 (28%)c
BASDAI 50 ATLAS 167/311 (54%)c 122/311 (39%)c 96/311 (31%)c
Certolizumab
ASAS 20 RAPID-axSpA
(AS)
(48 weeks)
89/121 (74%)a
(96 weeks)
************
ASAS 40 RAPID-axSpA
(AS)
(48 weeks)
70/121 (58%)a
(96 weeks)
61/121 (50%)a
BASDAI 50
Etanercept
ASAS 20 Calin 2004 (108 weeks)
52/81 (64%)d
ASAS 40 Calin 2004 (108 weeks)
44/81 (54%)d
40/81 (49%)d
BASDAI 50 Calin 2004 (108 weeks)
42/81 (52%)d
39/81 (48%)d
Golimumab
ASAS 20 GO-RAISE 235/356 (66%) a (160 weeks)
246/356(69%)a
235/356 (66%)a
ASAS 40 GO-RAISE 203/356 (57%)a (160 weeks)
208/356 (58%)a
203/356 (57%)a
BASDAI 50 GO-RAISE 199/356 (58%)a 199/356 (58%)a
Infliximab
ASAS 20 Park 2013 (78 weeks)
125/174 (72%)de
(102 weeks)
127/174 (73%)de
ASAS 40 (78 weeks)
93/174 (53%)de
(102 weeks)
101/174 (58%)de
ASAS 40 ASSERT 2005 (102 weeks) 33/78 (42%)af
BASDAI 50 Braun 2002 (54 weeks)
33/69 (48%)a
(102 weeks)
30/69 (43%)a
aNRI imputed result calculated using number of patients randomised as denominator; bNRI imputed result calculated using number of
patients at week 12 as denominator; cNRI imputed result calculated using number of patients who had received at least one dose of active as
denominator; dNRI imputed result calculated using number of patients who had received active during open-label phase as denominator;
eInflectra and infliximab combined; fOnly the subset of patients who took the 5mg dose of infliximab (remaining patients took 5 or 7.5 mg)
Table 15 presents the results based on non-responder imputation (NRI) analyses for the main studies
where these results could be extracted. For AS the results show that across all the anti-TNFs after
approximately two years of treatment, around half of patients are still achieving a good level of
response to therapy. The results for golimumab look particularly strong with around 60% of all
randomised patients achieving ASAS 40 and BASDAI 50 after 5 years. However, this is probably not
reflective of clinical practice as many of the normal weight patients took the 100 mg dose of

Technology Assessment Report for NICE
TNF-alpha inhibitors for ankylosing spondylitis and nr-axSpA
15/12/2014 74
golimumab rather than the 50 mg dose: the licence only permits the use of 100 mg dose in patients
with a body weight of more than 100 kg who do not achieve an adequate clinical response after 3 or 4
doses. The equivalent results for adalimumab and etanercept are around 30% and 50%, though it is
unknown if the difference may be due to differences in follow-up protocols than true treatment
difference.
Table 16 Treatment effect over time (nr-axSpA only) (results calculated using NRI)
Outcome Trial 52 weeks 104 weeks 156 weeks 5 years
(approx. 264 weeks)
Adalimumab
ASAS 20 ABILITY-1 83/142 (58%)b
ASAS 40 Haibel 2008 23/46 (50%) a
ASAS 40 ABILITY-1 (68 weeks)
77/142 (54%)b
67/142 (47%)b
BASDAI 50 Haibel 2008 24/46 (52%)
BASDAI 50 ABILITY-1 (68 weeks)
74/142(52%)b
70/142 (49%)b
Certolizumab
ASAS 20 RAPID-
axSpA
(AS)
(48 weeks)
68/97 (70%)a
(96 weeks)
***********
ASAS 40 RAPID-
axSpA
(AS)
(48 weeks)
56/97 (58%)a
(96 weeks)
49/97 (51%)a
BASDAI 50
Etanercept
ASAS 20 Dougados
2014
(48 weeks)
**************
ASAS 40 (48 weeks)
108/205 (53%)a
BASDAI 50 (48 weeks)
**************
aNRI imputed result calculated using number of patients randomised as denominator; bNRI imputed result calculated using number of
patients at week 12 as denominator
The long-term follow-up for nr-axSpA patients (Table 16) shows continued high proportions of
responders. At one year around half of patients are achieving an ASAS 40 or BASDAI 50 level
response and with certolizumab this is maintained at two years and with adalimumab at 3 years.
When the long-term data are presented as observed or as completer analyses the long-term results are
similarly good: withdrawal rates are not high and a high proportion of those who remain on treatment
continue to achieve a good response, see the example data available from one trial of adalimumab and
one of certolizumab pegol(Table 17).
Table 17 Observed or completer analysis results

Technology Assessment Report for NICE
TNF-alpha inhibitors for ankylosing spondylitis and nr-axSpA
15/12/2014 75
Trial, anti-TNF, population Time
point
Type of
analysis
ASAS 20
ASAS 40
BASDAI 50
ATLAS 2006 Adalimumab
(AS)
52 weeks Observed 193/276 (70%) 138/276 (50%) 167/276 (61%)
104 weeks Observed 135/173 (78%) 109/173 (63%) 122/173 (71%)
5 years Completer 111/125 (89%) 88/125 (70%) 96/124 (77%)
RAPID-axSpA Certolizumab
pegol – all
(AS)
96 weeks Observed *********** ***********
RAPID-axSpA Certolizumab
pegol – all
(nr-axSpA)
96 weeks Observed *********** ***********
At long-term follow-up mean final values or mean change from baseline for BASDAI, BASFI and
BASMI, where reported, were generally maintained at clinically meaningful levels.
For adalimumab, data from the large ATLAS trial showed that mean changes from baseline at 1, 2
and 3 years remain stable and clinically meaningful at around -3.7 for BASDAI and at around -2.9 for
BASFI. Similarly, the mean final value for BASMI remains at a level indicative of clinically
significant treatment benefit (3.1 to 3.7). At 5 years the mean final values are BASDAI 1.8, BASFI
2.1, and BASMI 3.7. Clearly these results only relate to those patients who have remained on
adalimumab in the long-term (40% of those who started adalimumab). They do however demonstrate
continued benefit in a significant proportion of patients.
For certolizumab results for these outcomes are only available up to one year (48 weeks). At this time
point the mean BASDAI and BASFI are indicative of clinically significant treatment benefit (both
around 3 units).
The long-term data from Calin et al 2004 for etanercept, with 81 patients at 2 years and 59 (73%)
remaining at 5 years also report mean BASDAI and BASFI scores of around 3.
From GO-RAISE at 2 years for those who took golimumab throughout the trial and follow-up
(n=138), median BASDAI was around 3 and median BASFI was around 2. These values are from a
LOCF analysis of all patients randomised to golimumab 50 mg.
For infliximab the Braun 2002 study and follow-up found from 1 to 3 years a stable mean BASDAI of
around 2.6, a stable mean BASFI of around 3 and a stable mean BASMI of around 2.7.
Overall the reported data (though not particularly robust) do indicate that significant proportions of
patients continue to derive real benefit from continued use of anti-TNFs. There is nothing to indicate
any difference between them.

Technology Assessment Report for NICE
TNF-alpha inhibitors for ankylosing spondylitis and nr-axSpA
15/12/2014 76
Almost no data were available regarding radiographic progression of bony disease in patients with
AS. Furthermore it should be noted that radiographic changes and progression of these take many
years to appear and x-rays are an insensitive tool by which to evaluate the progression of AS.
Therefore evidence, particularly that from relatively short term studies has to be interpreted with
caution. The limited evidence includes mSASSS change from baseline, reported for golimumab from
the GO-RAISE study at 4 years (208 weeks): 1.3 (SD 4.1) based on the 111of 138 patients
randomised to 50 mg. As results from untreated cohorts suggest a progression rate of 2 units/2years, a
rate of 1.3 (or even 2) over 4 years seems beneficial. For further discussion of this issue see Section
4.2.4.1. MASES was reported only for adalimumab from ATLAS: in patients remaining on therapy at
2 years the mean change from baseline was 2.2 (n=217).
For nr-axSpA patients long-term data for the continuous outcomes was limited to one year’s follow-
up. For adalimumab data were available from only one small study (Haibel 2008 n=46): BASDAI
change from baseline: 2.8 (95% CI 2.1, 3.6); BASFI change from baseline: 2 (95% CI 1.4, 2.6);
BASMI change from baseline: -0.4 (95% CI -0.7 to -0.04); and MASES change from baseline of 0.9
(95% CI -0.02 to 1.9). Also, of 26 patients with MRIs at baseline and 52 weeks follow-up, showed no
change in sclerosis or in erosions. For etanercept data were available on 205 patients randomised to
etanercept or placebo and then on long-term etanercept (Dougados 2014):
**********************************************************************************
*************************** For certolizumab LOCF analysis at 48 weeks (n=97) gave a
BASDAI final value of around 3, and a BASFI of around 2.5. Overall the one year results in nr-
axSpA patients are similar to each other and also reflect those seen in AS patients. Again the short
term nature of this follow-up relative to the 8 to 10 years over which radiographic changes develop
must be borne in mind.
4.2.4 Findings from anti-TNF patient registry studies
4.2.4.1 Effect of anti-TNFs on radiographic progression
A total of seven studies were identified that provided some comparative results on the effect of anti-
TNFs on radiographic progression (Table 18).

Technology Assessment Report for NICE
TNF-alpha inhibitors for ankylosing spondylitis and nr-axSpA
15/12/2014 77
Table 18 Effect of anti-TNFs on radiographic progression
Van der Heijde, D. et al. Arthritis Res
Ther. 2009; 11:R127.110
Study used 2 year data from active treatment arms of two adalimumab
trials (total n=397) and compared them with OASIS cohort (186 with
radiographs at 2 years). NB
primary analysis set = 307 adalimumab (minimum of 1.5
years exposure to drug) and 169
anti-TNF naïve (OASIS).
There were significant differences between adalimumab and OASIS patients at baseline for BASDAI, BASFI and other measures.
Increase in mSASSS was very similar in the two groups: adalimumab 0.8 (SD 2.6), OASIS 0.9 (SD 3.3). When only patients who would have
qualified for the adalimumab trials were included in the OASIS cohort
(n=77) the results were not changed.
Note in the light of the van der Heide results above, it would have been good
to test effect of baseline BASDAI (mean 6.2 in adalimumab cohort, 3.4 in
OASIS) as without treatment progression in adalimumab cohort would have been expected to be higher than in OASIS one, so there might have been
some effect of adalimumab.
Van der Heijde D, et
al Arth. Rheum
2008; 58: 3063-7098
Study compared 2 year data from
infliximab trial (ASSERT) (n=201)
with that from OASIS (n=192).
OASIS patients not treated with any anti-TNF.
There were significant differences between infliximab and OASIS patients at
baseline for BASDAI, BASFI and other measures (higher disease activity
and worse function in trial patients).
Mean increase in mSASSS was very similar in the two groups: infliximab 0.9 (SD 2.6), OASIS 1.0 (SD 3.2). When only patients who would have
qualified for the infliximab trials were included in the OASIS cohort (n=70)
the results changed very little (mean mSASSS increase 1.2 (SD 3.9).
Van der Heijde D, et al Arth. Rheum
2008; 58: 1324-31111
Study compared 2 year data from etanercept trial (Davis et al)
(n=257) with that from OASIS
(n=175). OASIS patients not treated with any anti-TNF.
There were significant differences between infliximab and OASIS patients at baseline for BASDAI, BASFI and other measures higher disease activity and
worse function in trial patients).
Increase in MSASSS was very similar in the two groups: etanercept 0.91 (SD 2.5), OASIS 0.95 (SD 3.2). When only patients who would qualified for
the etanercept trials were included in the OASIS cohort (n=76) the results
changed very little (mean mSASSS increase 1.3 (SD 3.6).
Braun J. et al. Ann
Rheum Dis 2014;
73:1107-13112
Long-term data on golimumab (2
and 4 year radiographic data) (n=
233).
No comparison with OASIS made
Mean Increase in MSASSS to 2 years was 0.9 (SD 2.7) (50 mg ) and 0.9 (SD
3.9) (100 mg).
Mean Increase in MSASSS to 4 years was 1.3 (SD 4.1) (50 mg ) and 2.0 (SD 5.6) (100 mg).
Note 2 year results are very similar to those with other anti-TNFs and
OASIS. i.e. no benefit of golimumab evident.
Haroon N et al, Arth Rheum
2013;65:2645-54113
Cohort study (n= 334 patients with at least two spinal radiographs at 2
year intervals (patients with total spinal fusion at baseline excluded).
Logistic regression analysis tested
for baseline mSASSS, ESR,BASDAI,Smoking, male vs
female, age at onset, disease
duration, HLA-B27, anti-TNF use,
and NSAID index. Further analysis
tested factors that could influence
exposure to anti-TNFs using propensity matching.
201/334 patients had received anti-TNFs for a mean of 2.5 years (SD 2.6).
No radiographic abnormality of the spine was seen at baseline in 144
patients (43%) and 102 patients (30.5%) showed no progression (>1 mSASSS unit/year).
Mulitvariate regression found baseline mSASSS (OR 1.06, 95% CI 1.04-
1.08), ESR, and smoking significantly increased and anti-TNF use significantly increased odds of radiographic progression (OR 0.47, 95% CI
0.24-0.94).
Further analysis using the 142 that could be included post-propensity matching confirmed these findings except for ESR: baseline mSASSS (OR
1.05, 95% CI 1.02-1.08), anti-TNF (OR 0.30, 95% CI 0.11-0.78).
Note the association with anti-TNF use is explained by the more severe patients with radiographic changes at baseline being treated with anti-TNFs.
Barialiakos X. eta l. Ann Rheum Dis
2014; 73: 710-5114
Comparison of long-term (8 years) treatment with infliximab with
historical cohort (n= 22 infliximab, n=34 Herne cohort).
Progression as assessed by mSASSS increased equally in infliximab treated patients and in the Herne cohort from baseline to 2, 4 and 6 years but then
whilst progression increased only slightly in the infliximab group between 6 and 8 years it increased greatly in the Herne cohort so that at 8 years there
was a difference in infliximab’s favour of 4.5 mSASSS units (p=0.047).
Result was adjusted for baseline mSASSS. Other factors (age, symptom duration, BASDAI, BASFI) not significant confounders.
Barialiakos 2007115
4 year radiographic progression in
AS patients treated with
infliximab. Crude comparison
made with OASIS cohort results at
4 years
n = 33
Mean (SD) at baseline
mSASSS 11.6 (15.3)
BASDAI 6.6 (1.4)

Technology Assessment Report for NICE
TNF-alpha inhibitors for ankylosing spondylitis and nr-axSpA
15/12/2014 78
BASFI 3.5 (1.9)
Progression assessed by mSASSS. Mean change over 4 years was 1.6 (SD 2.6) mSASSS units.
Published results for OASIS are 4.4 units in 4 years
Four studies reported on disease progression over 2 years of follow-up in terms of mSASSS in
patients taking adalimumab, 110
infliximab,98
etanercept,111
and golimumab.112
All four open-label,
uncontrolled follow-up studies found that mSASSS increased by a mean of around 0.9 over two years.
Three of these studies compared their rates with those from the OASIS cohort (of patients not taking
an anti-TNF) and found no difference (mean rate over 2 years for OASIS 0.9 units, Table 19). As
stated in the previous section radiographic changes and progression of these take many years to
appear and therefore the evidence from these relatively short term studies has to be interpreted with
caution.
Table 19 Summary of long-term results for mSASSS change
Anti-TNF Increase in mSASSS over 2 years (mean
(SD)(n) – patients on an anti-TNF
Increase in mSASSS over 2 years (mean
(SD)) – patients from OASIS Cohort (n)
Adalimumab110 0.8 (SD 2.6)(397) 0.9 (SD 3.3) (186)
Etanercept111 0.91 (SD 2.45)(257) 0.95 (SD 3.2) (175)
Infliximab98 0.9 (SD 2.6) (201) 1.0 (SD 3.2) (192)
Golimumab112 0.9 (SD 2.7) (50 mg ) (111)
0.9 (SD 3.9) (100 mg)(122)
-
-
Comparison of the rates calculated from the OASIS cohort in these studies, with those from the
studies by Ramiro highlight a discrepancy: the latter reported rates of 2 mSASSS units every 2 years,
rather than the 0.9 units /two years used here to compare with individual anti-TNFs.
Two very small studies of infliximab reported some inhibiting effect on radiographic progression.114,
115 The first
114 compared findings in 22 infliximab patients with 34 from the HERNE cohort, over 2, 4,
6 and 8 years. Progression as assessed by mSASSS increased equally in infliximab treated patients
and in the untreated HERNE cohort from baseline to 2, 4 and 6 years but then whilst progression
increased only slightly in the infliximab group between 6 and 8 years it increased greatly in the Herne
cohort so that at 8 years there was a difference in infliximab’s favour of 4.5 mSASSS units. The result
was adjusted for baseline mSASSS (other factors – age, symptom duration, BASDAI, BASFI etc.,
were not statistically significant confounders). The other study of 33 patients found the mean
progression over 4 years was 1.6 (SD 2.6) mSASSS units, lower than the 4.4 units seen in the
untreated OASIS cohort at 4 years.115
Another study examined a cohort of 334 patients with at least two spinal radiographs at 2 year
intervals (patients with total spinal fusion at baseline were excluded).113
In this study 201/334 patients

Technology Assessment Report for NICE
TNF-alpha inhibitors for ankylosing spondylitis and nr-axSpA
15/12/2014 79
had received anti-TNFs for a mean of 2.5 years (SD 2.6) and no radiographic abnormality of the spine
was seen at baseline in 144 patients (43%). At follow-up 102 patients (30.5%) showed no progression
(>1 mSASSS unit/year). Mulitvariate regression found baseline mSASSS (OR 1.06, 95% CI 1.04-
1.08), ESR, and smoking, significantly increased the odds of radiographic progression, but anti-TNF
use was significantly associated with a > 50% reduction in the (adjusted) odds of progression (0.47,
95% CI 0.24-0.94). Further analysis that tested factors that could influence exposure to anti-TNFs
using propensity matching confirmed the association with mSASSS and found a stronger association
with anti-TNF use (OR 0.30, 95% CI 0.11-0.78).
In conclusion there is evidence of disease progression over time, though the disease course is highly
variable. Best estimates of yearly disease progression rates without anti-TNF therapy are around 1.0
mSASSS units and 0.035 to 0.07 BASFI units. Whether there is any impact of anti-TNF treatment is
unclear: a beneficial effect cannot be assumed, nor, given the short term nature of the follow-up and
the insensitivity of x-rays as a tool for the evaluation of disease progression in AS, can one be
discounted.
4.2.4.2 Drug survival and anti-TNF switching
The endnote library generated by the searches for RCTs of all the anti-TNFs were separately screened
to identify patient registry studies of any or all of the anti-TNFs. This was possible because the search
strategy for RCTs was very sensitive and will have identified any clinical study including any of the
named anti-TNFs.
A total of 25 potentially relevant studies were screened fully and 12 publications that reported some
data on drug survival or the efficacy of anti-TNFs after switching were identified (see Table 22 for
summary details of each). Across the 12 studies, the source of data were either retrospective cohort
studies or prospective registers (though analysis plans may have been retrospective), from a range of
countries: USA (two studies), Canada (one study), Europe (9 studies). No data from a UK-based
cohort were available. Most of the cohorts and registries included experience with the three oldest
anti-TNFs: infliximab, etanercept and adalimumab. One study (of the RHAPSODY cohort) included
results from 326 patients treated with adalimumab as 2nd
anti-TNF after infliximab or etanercept.
Small numbers of patients provided data on golimumab (3 studies) and even smaller numbers on
certolizumab (2 studies). The population in 10 of the 12 studies was AS, although the diagnostic
criteria used to specify AS were rarely given. One study provided results specifically for nr-axSpA,
and one study provided results for axial SpA (nr-axSpA or AS).
Drug survival on 1st anti-TNF for all anti-TNFs was around 70- 80% at one year, around 65 - 75% at 2
years, around 70% at 3 years and 55% at 5 years. Little difference between the three older anti-TNFs

Technology Assessment Report for NICE
TNF-alpha inhibitors for ankylosing spondylitis and nr-axSpA
15/12/2014 80
was identified, although one analysis using Cox proportional hazard estimates found statistically
lower rates of discontinuation with etanercept and adalimumab compared with infliximab.116
The median drug survival in AS patients across all anti-TNFs reported varied (Table 20). Based on the
largest registry (DANBIO)117
the median drug survival for a first anti-TNF was 3.1 years (95% CI 2.6,
3.7) (n=1436), with 58% of patients remaining on treatment at 2 years. Median drug survival for a
second anti-TNF was 1.6 years (95% CI 1.0-2.2) (n=432), with 47% of patients remaining on
treatment at 2 years, and for a 3rd
, 1.8 years (95% CI 0.9-2.7) (n=137) (49% on treatment at 2 years).
The efficacy of 2nd
or 3rd
anti-TNFs after switching in AS patients was reported in only a small
number of studies. One analysis based on the NOR-DMARD registry118
showed how the response rate
and BASDAI and BASFI achieved at 3 months in patients who remain on their first therapy is (not
surprisingly) better than in patients who switch. Median BASDAI and BASFI achieved with a second
anti-TNF were not as low (not as good) as was achieved with a first anti-TNF in non-switchers. An
analysis of the DANBIO registry indicated that response (BASDAI 50) at 6 months reduced with
subsequent anti-TNFs , as did the median improvement in BASDAI and BASFI achieved (Table
21).117
These results are supported by the RHAPSODY study that found higher response rates with
adalimumab in anti-TNF naïve patients (BASDAI 50 - 63%; ASAS40 – 59%)(n=924) than in anti-
TNF exposed (BASDAI 50 – 41%; ASAS40 – 38%) (n=326).119
The registries and cohort studies provided no data on the efficacy of anti-TNFs as 2nd
or 3rd
, after
switching in nr-axSpA patients.
Table 20 Drug survival results from analysis of DANBIO registry117
Anti-TNF Median (95% CI) drug survival (% on treatment after 2yrs) for sequential anti-TNFs:
1st (n=1436) 3.1 (2.6, 3.7) (58%)
2nd (n=432) 1.6 (1.0-2.2)) (47%)
3rd (n=137) 1.8 (0.9-2.7) (49%)

Technology Assessment Report for NICE
TNF-alpha inhibitors for ankylosing spondylitis and nr-axSpA
15/12/2014 81
Table 21 Efficacy results from analysis of DANBIO registry117
Anti-TNF % BASDAI50/20mm
responders at 6
months (at 3 NR):
Median (IQR)
BASDAI at 0
months for
sequential anti-
TNFs
Median (IQR)
BASDAI at 3
months for
sequential anti-
TNFs:
Median (IQR)
BASFI at 0
months for
sequential anti-
TNFs:
Median (IQR)
BASFI at 3 months
for sequential anti-
TNFs:
1st (n=1436) 54% 5.9 (4.5-7.1) 2.8 (1.1-4.8) 5.0 (3.4-6.7) 2.8 (1.1-4.8)
2nd (n=432) 37% 5.6 (3.8-7.3) (3.6 (1.9-6.4) 5.2 (3.5-7.0) 3.6 (1.7-6.0)
3rd (n=137) 30% 6.4 (4.8-7.9) (5.1 (3.6-6.7) 6.4 (4.2-7.9) 5.1 (3.0-7.3)
In summary, sequential treatment with anti-TNFs can be worthwhile in patients with AS but the
response rates and benefits are reduced with 2nd
and 3rd
anti-TNFs, with the proportion of BASDAI 50
responders falling approximately 10% with each subsequent anti-TNF and the median BASDAI and
BASFIs achieved increasing (worsening). The lower efficacy of a 2nd
anti-TNF relative to a first is
reflected in lower median drug survival and proportion of patients remaining on therapy at 2 years.
Interestingly, despite a further reduction in response and efficacy with a 3rd
anti-TNF, drug survival
does not fall, suggesting that at this stage in their treatment history patients may continue with a less
than optimally effective anti-TNF given any better alternative..

15/12/2014 82
Table 22 Registry studies reporting data on drug survival and anti-TNF switching
Citation
Study/registry and
Method
N
(duration
)
Population Anti-TNFs
included
Drug survival and efficacy on switching
Bonafede
2012 120
Market Scan USA
(administrative
claims data) 2005-
2009 Retrospective
308 (360
days)
AS Etanercept
Adalimumab
Infliximab
Drug survival
N (%) stopped treatment and did not switch / switched.
Etanercept (n= 149) 42 (28%)/12 (8%)
Adalimumab (n= 103) 36 (35%)/11 (11%)
Infliximab (n= 46) 14 (30%)/6 (13%)
Efficacy on switching - NR
Choquette
2012121
(abstract
only)
Rhumadata
(Canada)register
119 (5
yrs)
AS, previous
NSAIDs and
BASDAI >4
Etanercept
Adalimumab
Infliximab
Drug survival
N who remained on same anti-TNF was 80% at 1 yr; 70% at 2 yrs; and 55% at 5yrs (no
difference between anti-TNFs).
Efficacy on switching - NR
Gulfe
2014122
SSATG registry
Prospective, Sweden
112 (2
years)
Nr-axSpA not
AS
Demographic
summary
available
Etanercept
Adalimumab
Infliximab
Golimumab
Certolizumab
Drug survival
Kaplan Meier estimates drug survival was 76% at 1 yr and 65% at 2 yrs.
Efficacy on switching - NR
Nell-
Duxneuner
2012123
Austrian Drug
reimbursement data
retrosp
694 (2
yrs)
AS Etanercept
Adalimumab
Infliximab
Drug survival
Starting in 2007 I yr drug survival was: Etanercept 0.83 (1 yr); 0.58 (2 yr)
Adalimumab 0.70 (1 yr); 0.55 (2 yr)
Infliximab 0.71 (1 yr); 0.54 (2 yr)
Efficacy on switching - NR
Yeaw
2014124
Retrosp use of
LifeLink Health Plan
Claims database
2004-2010. USA
632 AS patients
who had
discontinued
an anti-TNF
Etanercept
Adalimumab
Infliximab
Drug survival
% who restart within 360 days after stopping:
Etanercept 59% (n=376)
Adalimumab 45% (n=134)
Infliximab 39% (n=122)
% switch to another anti-TNF or biologic

Technology Assessment Report for NICE
TNF-alpha inhibitors for ankylosing spondylitis and nr-axSpA
15/12/2014 83
Citation
Study/registry and
Method
N
(duration
)
Population Anti-TNFs
included
Drug survival and efficacy on switching
Etanercept 17% (n=376)
Adalimumab 13% (n=134)
Infliximab 24% (n=122)
% switch to non-biologic
Etanercept 5% (n=376)
Adalimumab 8% (n=134)
Infliximab 6% (n=122)
% switch to no new treatment
Etanercept 18% (n=376)
Adalimumab 34% (n=134)
Infliximab 30% (n=122)
Efficacy on switching - NR
Scire et al
2013116
MonitorNet database
(Italian Soc.
Rhuematol) to 2012.
Multiple imputation
used for missing data
498 AS Etanercept
Adalimumab
Infliximab
Drug survival
Unadjusted K-M estimates of drug survival at
1 yr – 0.87 (95% CI 0.83-0.89)
2 yrs – 0.72 (95% CI 0.67-0.77)
3 years 0.69 (95% CI 0.63-0.74)
Adjusted HR discontinuation rate (median follow-up 17 months) 0.59(95% CI 0.46, 0.75)
(adjusted for age, gender, no. comorbidities,disease duration, number of previoud
DMARDs, concurrent DMARDS, baseline BASDAI and BASFI)
Efficacy on switching - NR
Zufferey
2014125
Single centre in
Switzerland (CHUV)
2011-12
Retrospective
112, of
whom 77
were AS.
Follow-up
at 12 and
24 mths
SpA (AxSpA
and AS)
Etanercept
Adalimumab
Infliximab
Golimumab
Drug survival
Median drug survival across all anti-TNFs 12 mths (IR 7-19) for AxSpA and 8 mths (IR 6-
13) for AS.
Drug survival for AS: 1 yr 49%, 2 yrs 36%.
No difference between anti_TNFs.
Efficacy on switching - NR

Technology Assessment Report for NICE
TNF-alpha inhibitors for ankylosing spondylitis and nr-axSpA
15/12/2014 84
Citation
Study/registry and
Method
N
(duration
)
Population Anti-TNFs
included
Drug survival and efficacy on switching
Pavelka
2009126
Czech National
registry ATTRA
310 (1
year)
AS (note
mean
BASDAI 6.4
at baseline)
Etanercept
Adalimumab
Infliximab
Drug survival at 1 year was 84%; at 2 yrs 76%; and at 3 yrs 72%.
Efficacy on switching - NR
Lie 2010118 NOR-DMARD
Register (from 2000
to March 2009),
Norway
514 AS Etanercept
Adalimumab
Infliximab
Drug survival
77 patients switched from first anti-TNF; 437 did not.
In the 77 switchers median drug survival on first anti-TNF was 266 days *range 1-1392)
on the first anti-TNF and the 2nd anti-TNF was started a median of 77 days (Range 0-1608
after the first was stopped). Finding may just be a consequence of the stopping rules in
Denmark (patients given around 6 months to achieve a response)
% on treatment after 1 and 2 years:
1st anti-TNF: 76% and 65%
2nd anti-TNF: 67% and 60%
Efficacy on switching
Non-Switchers
Response to 1st anti-TNF at 3 months (n=362):
BASDAI 50 – 105/362
ASAS 20 – 106/202
ASAS 40 – 76/202
Median (IQR) BASFI 2.3 (0.7-4.0)
Median (IQR) BASDAI 2.6 (1.3-4.4)
Switchers
Response to 1st anti-TNF at 3 months:
BASDAI 50 – 6/63
ASAS 20 – 11/23
ASAS 40 – 7/23
Median (IQR) BASFI 4.7 (1.5-6.0) (n=63)
Median (IQR) BASDAI 4.8 (3.3-7.01) (n=63)

Technology Assessment Report for NICE
TNF-alpha inhibitors for ankylosing spondylitis and nr-axSpA
15/12/2014 85
Citation
Study/registry and
Method
N
(duration
)
Population Anti-TNFs
included
Drug survival and efficacy on switching
Response to 2nd anti-TNF at 3 months:
BASDAI 50 – 13/62
ASAS 20 – 18/45
ASAS 40 – 14/45
Median (IQR) BASFI 3.3 (1.6-5.7) (n=62)
Median (IQR) BASDAI 4.1 (1.9-6.1) (n=62)
Data also available by reason for withdrawal LOE or AE – see publication’s web files
Glintborg
2010108
DANIBO Registry
Denmark
842 (8
years)
AS Etanercept
Adalimumab
Infliximab
Drug survival
Median drug survival was 4.3 years (unadjusted 1 and 2 years retention rates 74% and
63%) – similar across 3 anti-TNFs – only male gender, low baseline VAS fatigue and high
CRP (>14mg/l) associated with better drug survival
Efficacy on switching - NR
Glintborg
2012117
DANBIO Registry
Denmark
1436 (432
switchers)
AS (Switchers
only – had
received at
least2 anti-
TNFs during
follow-up)
Etanercept 22%
Adalimumab
38% Infliximab
36%
Golimumab 3%
(certilizumab
and other
biologics less
than 1%
between them)
and only to 1st
treatment
course)
Median (95% CI) years of drug survival (n) (% on treatment after 2yrs) for sequential anti-
TNFs:
1st anti-TNF3.1 (2.6, 3.7) (n=1436)(58%)
2nd anti-TNF1.6 (1.0-2.2) (n=432)(47%)
3rd anti-TNF1.8 (0.9-2.7) (n=137) (49%)
Efficacy on switching
Median (IQR) BASDAI at 3 months for sequential anti-TNFs:
1st (n=1436) 2.8 (1.1-4.8)
2nd (n=432)3.6 (1.9-6.4)
3rd (n=137) 5.1 (3.6-6.7)
Median (IQR) BASFI at 3 months for sequential anti-TNFs:
1st (n=1436) 2.8 (1.1-4.8)
2nd (n=432) 3.6 (1.7-6.0)
3rd (n=137) 5.1 (3.0-7.3)
% BASDAI50/20mm responders at 6 months (at 3 NR):

Technology Assessment Report for NICE
TNF-alpha inhibitors for ankylosing spondylitis and nr-axSpA
15/12/2014 86
Citation
Study/registry and
Method
N
(duration
)
Population Anti-TNFs
included
Drug survival and efficacy on switching
1st 54%
2nd 37%
3rd 30%
Rudwaleit
2009119
/RHAPSODY –
European cohort
Prospective
uncontrolled cohort
of pts treated with
adalimumab
1250 (12
week
response
data only)
AS Adalimumab Drug survival – NR
Efficacy on switching
12 week response rates:
Anti-TNF naïve (n=924)
BASDAI 50 - 63%
ASAS40 – 59%
Anti-TNF exposed (etanercept and/or infliximab, n=326)
BASDAI 50 – 41%
ASAS40 – 38%
Logistic regression with backward elimination found younger age, higher CRP, HLA-
B27+ and anti-TNF naivity all predictive of better response (Table 1 in paper).

15/12/2014 87
4.2.5 Clinical effectiveness results - Adverse events
Randomised trials
We focussed on the following outcomes, known to have possible associations with anti-TNF
treatment: serious infections, TB (including TB reactivation), injection/infusion site reactions,
congestive heart failure, cancer, non-melanoma skin cancer, serious adverse events, and withdrawals
due to serious adverse events. For the randomised phases of the trials included in the review, the
reporting of adverse event data was generally limited. For three of the 24 trials no information on
adverse events was available.59, 61, 74
Several trials provided adverse event data only at time points
after which placebo patients may have switched to receive an anti-TNF (so true placebo comparisons
were not available).
Analysable data on injection/infusion site reactions were available for ten trials, although these studies
were only of etanercept or infliximab. The data for certolizumab, golimumab, and adalimumab trials
were either not reported, or were only provided at time points after which placebo patients could
‘escape’ to receive an anti-TNF; these data would not allow for an accurate comparison with placebo.
Results for injection/infusion site reactions analyses from this review for etanercept and infliximab
showed a statistically significant increase in reactions associated with etanercept (RR 2.69, 95% CrI
1.82 to 3.89) when compared with placebo but no significant difference between infliximab and
placebo. When compared with each other, the risk of an injection/infusion site reaction was
statistically significantly higher with etanercept than with infliximab (RR 2.27, 95% CrI 1.01 to 5.37).
Incidence of serious infections was reported in only eight trials, though such events were rare (9 cases
in total). Of the eight trials which reported incidence of tuberculosis, only 4 cases were identified;
three cases were reported in the longest study, the 54 week trial which compared infliximab with an
inliximab biosimilar (Inflectra).105
Four trials reported on congestive heart failure (no cases reported),
six trials reported on cancer (one case) and three trials reported on non-melanoma skin cancer (2
cases, one in each group of the ABILITY-1 trial). In most trials few SAEs were reported; group rates
ranged from 0 to around 9%. Similarly, most trials had few withdrawals due to adverse events; rates
ranged from 0 to around 12%. Full results are reported in Appendix 8.
Large systematic reviews
Overall, the number and size of trials, and the short duration of their placebo-controlled phases, were
too limited to provide enough data for meaningful analyses of adverse events. This common problem
- of having too little data to evaluate adverse events - underpinned the rationale for a Cochrane review
(and network meta-analysis) of adverse events of nine biologics in adults with any disease, except
HIV/AIDS.127
In order to provide a better understanding of toxicity, data were pooled across diseases
by assuming a similar rate of adverse events (across diseases). For the present assessment, estimates
of adverse event rates have therefore been derived from the Cochrane review, which included 160

Technology Assessment Report for NICE
TNF-alpha inhibitors for ankylosing spondylitis and nr-axSpA
15/12/2014 88
RCTs (n=48,676) and 46 open-label extension studies (n=11,954). The median durations were 6
months for RCTs, and 13 months for open-label extension studies. The biologics included were
abatacept, adalimumab, anakinra, certolizumab pegol, etanercept, golimumab, infliximab, rituzimab
and tocilizumab. The anti-TNFs included in the present assessment were studied in 115 (72%) of the
RCTs and 40 (87%) of the open-label studies included in the Cochrane review. Most studies assessed
etanercept or infliximab, in cancer or rheumatoid arthritis patients; 10 RCTs were of ankylosing
spondylitis (fewer than in this assessment, since in the Cochrane review databases were searched up
until January 2010). The biologics were evaluated both as a group, and as individual interventions.
The results from the RCTs (what the review classified as ‘major’ outcomes) are in Tables 23 and 24.
Biologics as a group were associated with statistically significantly higher rates of total AEs,
withdrawals due to AEs, serious infections, and TB reactivation when compared with control
treatments. When the individual anti-TNFs were analysed separately, compared with control
treatments only infliximab and certolizumab were statistically significantly associated with adverse
events: infliximab with higher rates of total adverse events (NNH 13, 95% CrI 8 to 505) and
withdrawals due to adverse events (NNH 10, 95% CrI 5 to 30), and certolizumab pegol with higher
rates of serious infections (NNH 12, 95% CrI 4 to 79) and serious adverse events (NNH 18, 95% CrI
9 to 162) (Table 24).
Table 23 Cochrane summary of findings Table for biologics as a class (adapted from Singh et al (2011))
Adverse event Risk with
comparator, per 1000
patients unless
otherwise stated
Risk with intervention,
per 1000 patients,
unless otherwise stated
(95% CrI)
Odds ratio (95%
CrI)
Number of
participants (studies)
SAEs 118 127 (115 to 142) 1.09 (0.97 to 1.24) 21,152 (76)
Total AEs 724 770 (741 to 797) 1.28 (1.09 to 1.50) 14,959 (48)
Withdrawal due to AEs
98 137 (115 to 168) 1.47 (1.20 to 1.86) 22,636 (83)
Serious infections 26 35 (27 to 46) 1.37 (1.04 to 1.82) 21,853 (70)
TB reactivation 4 per 10,000 20 per 10,000 4.68 (1.18 to 18.6) 30,671 (71)
Lymphoma 9 per 10,000 1 0.53 (0.17 to 1.66) 21,260 (52)
Congestive heart
failure
8 6 (1 to 21) 0.69 (0.18 to 2.69) 8,847 (24)

Technology Assessment Report for NICE
TNF-alpha inhibitors for ankylosing spondylitis and nr-axSpA
15/12/2014 89
Table 24 Cochrane summary of findings Table for individual anti-TNFs (adapted from Singh et al (2011))
Anti-TNF Risk with
comparator, per
1000 patients
unless otherwise
stated
Risk with intervention, per
1000 patients, unless
otherwise stated (95% CrI)
Odds ratio (95% CrI) Number of
participants (studies)
SAEs
Adalimumab 118 114 (90 to 145) 0.96 (0.74 to 1.27) 4662 (15)
Certolizumab 118 174 (124 to 237) 1.57 (1.06 to 2.32) 2421 (6)
Etanercept 118 142 (111 to 184) 1.24 (0.93 to 1.69) 3931 (21)
Golimumab 118 123 (82 to 184) 1.05 (0.67 to 1.69) 1564 (8)
Infliximab 118 133 (102 to 174) 1.15 (0.85 to 1.57) 3403 (14)
Total AEs
Adalimumab 724 730 (637 to 802) 1.03 (0.67 to 1.54) 3266 (10)
Certolizumab 724 754 (651 to 837) 1.17 (0.71 to 1.95) 1829 (5)
Etanercept 724 784 (677 to 866) 1.38 (0.80 to 2.46) 1600 (7)
Golimumab 724 765 (672 to 839) 1.24 (0.78 to 1.98) 1187 (6)
Infliximab 724 803 (726 to 860 1.55 (1.01 to 2.35) 2330 (9)
Withdrawal due to AEs
Adalimumab 98 128 (81 to 194) 1.35 (0.82 to 2.22) 5268 (18)
Certolizumab 98 125 (70 to 226 1.32 (0.69 to 2.69) 2421 (6)
Etanercept 98 124 (82 to 191) 1.30 (0.82 to 2.17) 5189 (25)
Golimumab 98 127 (64 to 241) 1.34 (0.63 to 2.92) 1549 (7)
Infliximab 98 203 (132 to 310) 2.34 (1.40 to 4.14) 2973 (15)
Serious infections
Adalimumab 26 32 (17 to 60) 1.23 (0.65 to 2.40) 4847 (15)
Certolizumab 26 113 (39 to 330) 4.75 (1.52 to 18.45) 1683 (4)
Etanercept 26 33 (19 to 61) 1.29 (0.72 to 2.45) 4630 (19)
Golimumab 26 29 (12 to 65) 1.11 (0.45 to 2.59) 1334 (6)
Infliximab 26 36 (20 to 65) 1.41 (0.75 to 2.62) 2652 (13)
TB reactivation
All 9
biologics
4 per 10,000 20 per 10,000 4.68 (1.18 to 18.60) 30,671 (71)
Lymphoma
All 9
biologics
9 per 10,000 1 0.53 (0.17 to 1.66) 21,260 (52)
Congestive heart failure
All 9
biologics
8 6 (1 to 21) 0.69 (0.18 to 2.69) 8847 (24)

Technology Assessment Report for NICE
TNF-alpha inhibitors for ankylosing spondylitis and nr-axSpA
15/12/2014 90
For total adverse events the Cochrane review team judged the strength of evidence to be high; for
serious adverse events, withdrawals due to adverse events, and serious infections the strength of
evidence was judged to be moderate; for TB reactivation, lymphoma, and congestive heart failure the
strength of evidence was judged to be low. For TB reactivation, lymphoma, and congestive heart
failure the network meta-analysis statistical models did not converge (due to low numbers of events)
so estimates for individual anti-TNFs were not available. Outcomes which were classed in the review
as ‘minor’ were not analysed by the review authors due to low numbers of events and the complexity
of the analyses for the major outcomes. The minor outcomes included cardiac adverse events, infusion
and injection site reactions, allergic reactions, neurologic outcomes, deaths, all cancers, serious lung
infections or pneumonia, fungal infections, and opportunistic infections. For the purposes of the
present s assessment further large studies on cancer risk were therefore sought. An individual patient
data meta-analysis of 22,904 adults (from 74 RCTs) which assessed the cancer risk of taking
adalimumab, etanercept, or infliximab in the short-term (median duration <6 months) was
identified.128
Although funded by manufacturers, this study was requested by the EMA and was
planned and conducted by independent researchers working with an independent academic steering
committee. For all three anti-TNFs as a group, there was no increase in risk of cancers excluding non-
melanoma skin cancer (RR 0.99, 95% CI 0.61 to 1.68), but there was a doubling in the risk of non-
melanoma skin cancer associated with taking an anti-TNF (RR 2.02, 95% CI 1.11 to 3.95). Evaluation
of drug-specific effects was hampered by statistical precision, and by differences in baseline cancer
risk and reporting detail across trials.128
Another review of adverse effects of etanercept, adalimumab and infliximab was based on systematic
searches for systematic reviews of the safety of biologic agents .129
Six reviews that were sufficiently
rigorous to meet the Database of Abstracts of Reviews of Effects (DARE) inclusion criteria were
included in the overview. This review also included large RCTs and non-randomised studies (≥500
patients) and was focused on serious potential adverse events, such as serious infections, reactivation
of latent TB, and cancer.129
Table 25, which summarises the rates of serious adverse events among the
included non-randomised studies and large RCTs, indicates that the rates of serious adverse events
cover a broadly similar range across the three different biologic agents. However, all estimates were
derived from a highly heterogeneous group of studies in terms of participants (e.g. inflammatory
condition, disease severity), study design (e.g. length of follow-up) and treatment regimens (e.g. dose
and frequency). Consequently, reliable estimates of the relative rate of serious adverse events for each
drug could not be made.

15/12/2014 91
Table 25 Prevalence ranges of serious adverse events from non-randomised studies and RCTs
(reproduced from Rodgers et al.129
)
Drug Serious infections
(%)
Cancer (%) TB (%) Mortality (%) Withdrawals due to AE (%)
Etanercept 0.6–13.2 1–5.7 0–1.4 0–3.1 0–13.6
Infliximab 0.8–13.8 0.16–5.1 0.06–4.6 0.06–2.0 6.4–12.8
Adalimumab 0.4–5.1 0.1–1.1 0–0.4 0.5–0.9 5.8–10.7
Withdrawal rates due to adverse events were typically <10% for all drugs, with the highest reported
single estimate being 13.6% for one etanercept study. This suggested that the majority of patients can
tolerate biologic treatment in the medium term, although again the estimates were derived from a
highly heterogeneous group of studies, therefore the possibility of poorer tolerability in specific
patient groups was not ruled out.
Open-label extensions of randomised trials
Of the longer-term follow up studies included in our present review we evaluated those reporting
adverse events after six months (since the Cochrane review covered events occurring up to six
months); 13 trial cohorts had studies which reported data after 6 months. Both the type of adverse
events assessed, and the periods over which they were assessed, varied across studies. Table 26
compares results for studies with at least around 2 years of follow up. The ATLAS and GO-RAISE
trials both had extension study publications at the 2 year and 5 year time points.130-133
Both cohorts
were analysed using modified intention-to-treat (mITT) data, in which patients had to have received at
least one dose of treatment. This amounted to 99% of the randomised patients in both studies
(311/315 in ATLAS, and 353/356 in GO-RAISE). Davis reported results for the 257 patients who
enrolled in a 168-week open-label study following week 24 of the randomised phase; 277 patients had
taken part in the earlier randomised study. All 257 patients in the open-label study had received at
least one dose of etanercept.134, 135
The Calin trial randomised 84 patients, with 81 patients enrolling in
the open-label extension study. Results were presented separately for the 12 week to 2 year, and the 2
to 5 year time points.136, 137
RAPID-axSpA data at 96 weeks were reported in the manufacturer
submission. These data related to the mITT population: 315 (97%) of the 325 originally randomised
patients.
The 2 year study of the ASSERT (infliximab) cohort allowed dose escalation whereby, from week 36,
patients with BASDAI scores of ≥3 could increase their dose to 7.5mg/kg, which is a currently
unlicensed dose. Results for the 5mg/kg group (74 patients) between weeks 24 and 102 have therefore
been presented in Table 26. The Braun cohort was followed up for eight years, but it was a small
study which reported only SAEs and withdrawals due to SAEs.

15/12/2014 92
Table 26 Studies with adverse event data at around 2 years (or later)
Event
outcome
Number of events (%)
Number per 100 person years (PY)
Adalimumab Golimumab Etanercept Certolizumab Infliximab
ATLAS
n=311
GO-RAISE
n=353
Davis
n=257
Calin
n=81 n=59
RAPID-
axSpA n=315
ASSERT**
n=74
2 years 5 years 2 years 5 years 24 to 192
weeks*
12 to 108
weeks*
2 to 5 years
96 weeks 24 to 102
weeks
SAEs
48 (15%)
10.5/100 PY
140 (45%)
11.7/100 PY
40 (11%)
72 (20%)
33 (13%)
8/100 PY
19 (23%)
21/100 PY
******
*********
15 (20%)
Withdrawals
due to AEs
24 (8%)
4.5/100 PY
- 19 (5%)
32 (9%)
2.13/100 PY
14 (5%)
15 (19%) 7 (12%) ******
*********
Serious
infections
6 (2%)
1.1/ 100 PY
17 (5%)
1.4/100 PY
11 (3%)
21 (6%)
2.1/100 PY
6 (2%)
2/100 PY
5 (6%) 3 (5%)
3/100 PY
******
*********
3 (4%)
Cancer
4 (1%)
0.7/100 PY
3 (1%)
0.2/100 PY
2 (0.6%)
3 (0.8%)
0.21/100 PY
- 4 (5%) 3 (5%) * 1 (1%)
NMSC 0.4/100 PY
- - - - - -
Congestive
heart failure
0 2 (0.6%)
0.2/100 PY
- - - - -
Injection
site
reactions
42 (14%)
17.6/100 PY
- 38 (11%)
43 (12%)
57 (22%)
30 (37%) 7 (12%) ******
*********
9 (12%)
TB 0 0 - - - 0 0 ******
* Weeks from randomisation ** 5mg/kg group NMSC Non melanoma skin cancer

15/12/2014 93
Table 26 illustrates that rates of SAEs, cancer, and serious infections were similar across all four anti-
TNFs when using incidence per 100 patient years as estimates. At five years SAEs appeared more
prevalent with adalimumab (45%) when compared with golimumab (20%), although it is possible this
difference is due to the way the data were reported – it was unclear whether the ATLAS data related
to the total number of SAEs, or to the number of patients experiencing an SAE. At 2 years, the
incidence of injection site reactions was higher in patients taking etanercept than in patients taking
adalimumab, golimumab or certolizumab pegol. Withdrawal rates due to AEs were broadly similar
across treatments. The reporting of TB and congestive heart failure was limited.
Summary of adverse event data
Data from large systematic reviews, which included patients with a wide range of diseases, suggest
that, in the short-term, anti-TNFs as a group are associated with significantly higher rates of serious
infections, TB reactivation, non-melanoma skin cancer, total adverse events, and withdrawals due to
AEs, when compared with control treatments. Specifically, infliximab is associated with significantly
higher rates of total adverse events and withdrawals due to adverse events, and certolizumab pegol is
associated with significantly higher rates of serious infections and serious adverse events. Analyses
from the present review showed etanercept to be statistically significantly more likely to result in an
injection/infusion site reaction when compared with infliximab, although analysable data on such
reactions were not reported for the three other anti-TNFs. Evaluations of longer-term data are more
scarce though suggest similar safety profiles across anti-TNFs. Data from the open-label studies
included in this review also do not suggest that there are important differences between treatments,
other than a higher incidence of injection site reactions following treatment with etanercept. These
open-label data are however limited by the small sample sizes and non-randomised study designs.
4.2.6 Review of natural history of AS and nr-axSpA
In order to get some understanding of what happens to patients who, although eligible for anti-TNF
therapy for their AS or nr-axSpA, do not receive it, we conducted a rapid review of relevant literature.
This was not a systematic review but one that started with the library of papers found by the main
searches for RCTs of the anti-TNFs and then followed relevant citations to papers on AS and axSpA
in patients not receiving an anti-TNF. Potentially relevant papers were those that reported on the
pattern of disease - AS or nr-axSpA or axSpA - without treatment with anti-TNFs over time. This
process identified a number of relevant registries: OASIS, SIRAS, DESIR, Esperanza,
REGISPONSER, GESPIC, and SMART and additional searches of Medline were conducted using
these specific registry names. All relevant studies identified through this process are presented in
Table 27.
The studies collectively explore the associations between the various components of axSpA: disease
activity, structural damage and spinal mobility. The exploration of the ASSERT trial baseline data25,

Technology Assessment Report for NICE
TNF-alpha inhibitors for ankylosing spondylitis and nr-axSpA
15/12/2014 94
138 reveals that health-related quality of life as determined by SF-36 physical and mental components,
is determined by BASFI and BASDAI; BASFI is determined by BASDAI, mSASSS and BASMI
(spinal mobility); and BASMI is independently determined both by irreversible (mSASSS) and
reversible spinal damage (MRI): the former in late disease, the latter in early disease.
The studies identified that from a clinical practice and patients’ point of view disease progression in
terms of BASFI, a measure of the patient’s functional ability, is very important. A number of studies
on the disease progression of AS have been based on the European OASIS cohort (a consecutive
cohort, started in 1996, though there were no further specific eligibility criteria); the total cohort
numbers 217 patients. One of these, a study by Landewe et al.,12
demonstrated that physical function
impairment (BASFI) is independently affected by both disease activity (BASDAI) and bony
progression – usually assessed using mSASSS despite this being a measure of bony growth in the
spine only (and not in the sacroiliac joints). Other studies by Ramiro139, 140
have demonstrated that
radiographic progression, increases on average by around 2 mSASSS units every 2 years.139, 140
However, this progression is highly variable; the average patient with inactive disease (ASDAS 0)
would progress by 5 mSASSS units over 12 years compared with a patient with ‘very active disease’
(ASDAS 4) who would have 19 units of progression.139
Also, of 68 patients who were followed for 12
years, 18% had no progression on mSASSS.140
The variability is also demonstrated by the results
based on a different cohort: a single German clinic (n=146).14
Baseline characteristics were similar to
those in the OASIS cohort (Table 27). Mean follow-up was 3.8 (SD 1.7) years and mean mSASSS
change was 1.3 (SD 2.5) units /year with a range of 0-22.8 mSASSS units. Thirty four (23%) patients
showed no progression.
There is evidence that BASDAI is relatively constant over time. A an analysis of data from a UK
registry – SIRAS, demonstrated that patients stratified into high or low disease activity (BASDAI)
remain in their separate groups over many years (12).141
Data on the long-term pattern of patient
function (BASFI) in patients not being treated with anti-TNFs is more scarce. A cohort study, from a
single centre in England, provided data on 69 patients followed over 10 years (two data points: at
baseline (1998) and 10 year (2008)).16
The assessment of BASDAI confirmed that it remains
relatively constant (mean at baseline 4.1 (SD 2.5) and after 10 years 4.4 (SD 2.7) (p=0.36). Patient
function was assessed using RLQD rather than BASFI, but provided evidence of deteriorating
function over time: mean RLDQ at baseline was 10.4 (SD 8.3), and after 10 years was 13.6 (SD 10.9)
(p=0.002). Analysis of longitudinal data from the SMART (Bath, UK) data set (n=223) found that
BASFI increased over time by 0.035 units/symptom year.142
In patients with baseline BASDAI of ≥4
(those that would be treated with anti-TNFs and 68% of the total cohort) the rate of BASFI increase
was 0.039 units/symptom year. Estimates of the rate of change in BASFI over time were also reported
in a cost-effectiveness modelling study.143
The data were from patients who were captured in two

Technology Assessment Report for NICE
TNF-alpha inhibitors for ankylosing spondylitis and nr-axSpA
15/12/2014 95
surveys at two time points 1992/1994 and November 2002 approximately 8 years apart (n=1100). The
estimate of annual BASFI progression was 0.07 points, but when only patients with BASDAI >4 were
included in the analysis, BASFI progression was estimated as 0.054. It was reported that data from a
cohort of 493 patients who had been followed up for more than 3 years generated similar findings; the
number was not actually reported for the whole survey, but was 0.059 for the BASDAI >4 subgroup.
Natural history data from patients with nr-axSpA is even more scarce than that for AS patients, with
no long-term data identified. A comparison of AS and nr-axSpA patients from a cohort of 100
consecutive patients (Herne clinic, Germany) (Axial SpA n=100, nr-axSpA n=44, AS n=56) found
that slightly higher proportions of AS patients met pre-specified cut-offs of disease severity than did
nr-axSpA patients, but the differences were statistically significant only for ASDAS, CRP level,
mSASSS and the number of inflamed lesions; the proportion of males was also statistically
significantly different.144
The results are given in Table 27. The difference for BASFI was very close
to statistical significance.
A larger cross sectional study of the GESPIC cohort (n=462 patients with axial spondyloarthritis (AS
or nr-axSpA)) also found differences between AS and nr-axSpA patients.19
When AS (< 5 year) and
nr-axSpA were compared there were statistically significant differences in Physicians Global
Assessment, BASFI (3.1 in AS vs 2.5 in nr-axSpA), BASMI (1.9 in AS vs 1.1 in nr-axSpA), spinal
mobility and lateral spinal flexion, CRP and ESR and all radiographic measures (mSASSS 4.9 in AS
vs 1.4 in nr-axSpA). mSASSS was statistically significant worse in males vs females, and between
CRP >6 vs <6, though it is unclear whether this is a meaningful cut off for CRP.
In two longitudinal studies of progression in nr-axSpA,145, 146
also using the GESPIC cohort,
progression in terms of sacroiliitis and in terms of radiographic progression in the spine (mSASSS),
was slightly more rapid in AS than in nr-axSpA but not statistically significantly so. Raised CRP at
baseline was a predictor of both measures of progression in AS but only for sacroiliitis in nr-axSpA.
The presence of syndesmophytes was predictive of higher progression rates as assessed by mSASSS
in both AS and in nr-axSpA. Of the 95 patients with nr-axSpA, 11 (11.6%) fulfilled the modified New
York criteria for AS after two years of follow up. A review of the burden of illness in nr-axSpA147
cited this (11.6%) progression rate along with a 10% rate over two years and a 24% rate over 10
years. However, the 10 year rate was derived from a broader, more heterogeneous population than the
GESPIC cohort: patients had undifferentiated spondyloarthropathies, with over half not having
inflammatory low back pain.148, 149
The GESPIC study recruited only patients with axial
spondyloarthritis (AS or nr-axSpA).

Technology Assessment Report for NICE
TNF-alpha inhibitors for ankylosing spondylitis and nr-axSpA
15/12/2014 96
Studies of disease progression in nr-axSpA focus on aspects of the disease that can be assessed
through imaging techniques: radiographs or MRI scans. This may appear reasonable given the
subjective, patient questionnaire basis of the BASFI score.
Finally there is evidence that as well as being progressive, the course of AS includes flares. A study
based on the population of a trial comparing probiotic and placebo treatment in AS, found that the
overall flare rate was 71.4 per 100 person weeks (pw); the major flare rate was 12/100pw and the
minor flare rate 59.4 /100pw.29
BASDAI and BASFI varied with type of flare: mean BASDAI scores
were 5.5 (major flare), 3.1 (minor flare) and 2 – 2.5 (flare free); mean BASFI scores were 5.5 (major
flare), 3.1 (minor flare) and 2.5 – 3.5 (flare free). A pilot study used the SMART cohort (Bath, UK) to
investigate the pattern of disease and impact of disease flares.150
Of the 114 patients, 96% patients
reported experiencing flares. Flare duration varied by patient: days (40%); weeks (30%); and months
(30%). Fifty percent of patients reported flares on a background of symptoms, whilst 26% reported
gradually developing and resolving flares, after which symptoms were worse than before the start of
the flare. These patterns were associated with higher BASFI scores. Around 20% reported flares with
no symptoms between. A small proportion (7%) reported gradually developing and resolving flare
with periods of no symptoms.
In summary, the available studies indicate that in AS and nr-axSpA disease activity (BASDAI) is
fairly stable over time and does not generally progress, though it can be at a high (severe) level early
in the disease. Patients function (as assessed by BASFI) does deteriorate over time, though the course
is not constant or predictable. BASFI is determined by both disease activity and bone neo-formation;
progression of BASFI over time is driven by progression of bony disease as assessed by imaging
scores such as mSASSS, or the presence of syndesmophytes. Best estimates of yearly disease
progression rates without anti-TNF therapy are around 1.0 mSASSS units and 0.035 to 0.07 BASFI
units. Information on the natural history of nr-axSpA is relatively sparse. Whilst disease progression
appears to be faster in AS, patients with nr-axSpA can have severe disease activity and hence poor
function.
Table 27 Natural history of axSpA - relevant outcomes and impact of anti-TNFs
Study Description Population characteristics Summary of findings. What it tells us
Landewe 2009 12
Examined the relationship
between disease activity, radiographic damage and
physical function in AS.
Based on (European)
OASIS cohort – baseline
and 2 year data.
N=217 consecutive (from
BASFI mean 3.4 (SD 2.6),
41% >4.
mSASSS median 5, 69% > 0
NB does mSASSS less than 0
mean nr-axSpA?
None of the patients in the
cohort had used anti-TNFs.
Subgroup (n=188) Baseline BASDAI<6
Univariate correlation between baseline mSASSS and
BASFI = 0.45 (Spearman Corr Coef), but this was modified by baseline BASDAI :
BASDAI 0-2 (n=68) = 0.68;
BASDAI >2-4 (N=60) = 0.58;
BASDAI >4-6 n=60 = 0.43;
BASDAI >6-8 (n=22) = 0.40;
BADDAI >8-10 (n=7) = -0.20.
Suggests a ceiling effect of BASFI – because of the high

Technology Assessment Report for NICE
TNF-alpha inhibitors for ankylosing spondylitis and nr-axSpA
15/12/2014 97
1996) patients with AS
(no specific criteria.
BASDAI mean 3.4 (SD
2,1), 38% >4.
level of correlation between BASDAI and BASFI, a
correlation between MSASSS and BASFI cannot be demonstrated at the highest level of BASDAI.
Multivariate relationship between BASDAI and mSASSS with BASFI using baseline and 2 year data
(but not longitudinal?) (n=188, baseline BASDAI<6
only). Regression coefficients found that both BASDAI and mSASSS are statistically significant (p<0.001)
explanatory variables for BASFI (0.73 and 0.057 units
respectively)
Ramiro 2014139 Analysed long-term relationship between
disease activity (ASDAS, BASDAI) and
radiographic damage
(mSASSS) in AS. Used OASIS cohort over 12
years
Subgroup used (n=184) who had at least 2 sets of x-rays.
Baseline characteristics of
this subgroup:
BASDAI mean 3.4 (SD 2.0)
mSASSS mean 10.8 (SD 15.2), 81% >0
None of the patients had used anti-TNFs.
On average patients had a progression of 1.9 mSASSS units/2 years. This varied with baseline ASDAS:
ASDAS <1.3 progress=0.7 mSASSS units/2 years;
ASDAS >3.5 progress=3.1 mSASSS units/2 years.
The relationship with BASDAI was similar:
Baseline BASDAI<4: 1.5 mSASSS units/2 years
BASDAI ≥4: 2.7 mSASSS units/2 years; BASDAI >6:
2.0 mSASSS units/2 years
The analysis found that the average patient with inactive
disease (ASDAS 1.0) would progress by 5 MSASSS units over 12 years compared with a patient with ‘very
active disease’ (ASDAS 4) would have 19 units of
progression.
Ramiro 2013140
Earlier analysis of OASIS cohort 12 year data to
describe the evolution of
radiographic abnormalities in AS patients.
Subgroup used (n=186) who had at least 2 sets of xrays).
Baseline characteristics of
this subgroup:
BASDAI mean 3.4 (SD 2.0)
mSASSS mean 11.6 (SD
16.2)
None of the patients had used
anti-TNFs.
Long-term radiographic progression in AS highly variable at the patient level, but is more severe in men
who are HLA-B27 positive.
Over whole follow-up 24% of patients (and 18% of the
68 patients who were followed for 12 years) had no
progression on mSASSS.
Duration of disease is not relevant. At the group level
progress is linear – 2 mSASSS units/2 years.
Baraliakos
200914
Natural course of
radiographic progression
in AS.
Retrospective cohort,
single clinic (Herne, Germany), 1993-2005
Mean follow-up 3.8 (SD
1.7) years
N= 146 anti-TNF naïve
patients.
Baseline mean (SD):
mSASSS 20.5 (14,4)
BASDAI 4.4 (1.9) (range 0.5-
7.3)
BASFI 3.8 (2.6) (range 1.0-
8.4)
Mean mSASSS change was 1.3 (SD 2.5) units /year NB
range was 0-22.8 mSASSS units.
34 (23%) patients showed no progression.
Dean, L et al. 2014
Poster at BSR
meeting
Scotland and Ireland Registry for ankylosing
Spondylitis (SIRAS)
Cohort.
Study of BASDAI over
time.
BASDAI at diagnosis data available for only 240
patients (out of the 1210
patient cohort).
Baseline BASDAI (at
diagnosis) 4.9 (SD 2.3). High
disease group BASDAI = 6.3 (1.4) and low disease activity
group BASDAI 2.5 (1.3)
Baseline BASDAI remained fairly stable over time – across the whole cohort and in the high and low disease
activity groups. The subgroup treated with anti-TNFs
had higher mean BASDAI (5.7, SD 2.0)) than non-biologicpatients (4.2, SD 2.5) and this remained so until
around a year after treatment with anti-TNFs began,
when mean BASDAI fell to the level of the non-biologic patients.
Healey, E.L. et Cohort study, single At study entry patients were Only RLDQ changed significantly over time. Mean

Technology Assessment Report for NICE
TNF-alpha inhibitors for ankylosing spondylitis and nr-axSpA
15/12/2014 98
al. Clin
Rheumatol. 2013; 33:67-
7216
centre, England. Followed
patients over 10 years (n=69 who provided
assessments at baseline
(1998) and 10 years (2008)).
Assessments using RLDQ,
BASDAI, AsQoL and EQ-5D (and others)
84% male, mean age 49
years, Disease duration 15.5. years, symptom duration 21.4
years. 1.5% on an anti-TNF at
10 years.
(SD) for assessment 1 (1998) and 2 (2008) for:
RLDQ: 10.4 (8.3); 13.6 (10.9) p=0.002;
BASDAI: 4.1 (2.5); 4.4 (2.7) p=0.36
AsQoL 6.4 (6.3); 7.5 (6.4) p=0.15
EQ-5D 0.64 (0.28); 0.61 (0.30) p=0.45
However as RLQD (0-48) is a measure of function
(comparable with BASFI) it does indicate progression
with time even in these AS patients whose disease at study entry was already well established
Stone M. A.
Ann Rheum Dis 2007; 66 (suppl
II): 410142
Analysis of longitudinal
data from SMART (Bath, UK) data set. (n=224)
Regression analysis of
BASDAI on symptom duration and BASFi
adjusted for BASDAI >4
at baseline. Duration of follow-up was unclear.
68% had a baseline BASDAI
>4
Mean symptom duration was
28.8 years.
Only 20% experienced a significant change in BASDAI
over time (13% a decrease; 7% an increase).
BASFI increases over time by 0.035 units/symptom
year. In patients with baseline BASDAI of >4 - those that would be treated with anti-TNFs - the increase over
time is 0.039 units/symptom year.
Machado
2010138
Baseline data from
ASSERT.
analysis of relation
between MsASSS and
MRI inflammation and BASMI
N=214 AS patients (mNY
criteria)
Baseline median (IQR)
BASMI 4.6 (3.6, 5.8)
BASDAI 6.5 (5.3, 7.0)
CRP (mg/dl) 1.5 (0.7, 2.9)
mSASSS 13.8 (4.5, 29.1)
Concluded that spinal mobility (BASMI) independently
determined both by irreversible (mSASSS) and reversible spinal damage (MRI): the former in late
disease, the latter in early disease.
Machado 201125 Baseline data from
ASSERT.
analysis of relation
between SF-36 and BASFI
and BASDAI, ASDAS, CRP level, MsASSS, MRI
inflammation and BASMI.
N=214 AS patients (mNY
criteria)
Regression coeffiicients for associations reported in the
publication. Briefly, SF-36 is determined by BASFI and BASDAI; and BASFI is determined by BASDAI,
mSASSS and BASMI.
Kobelt 2004; 43:1158-1166143
Modelling study of infliximab but refers to
large UK observational
data set and generates an estimate for BASFI over
time.
Survey in 2002 (n=1413)
Value generated from
patients who were
captured in two surveys at two time points 1992/1994
and November 2002
approximately 8 years apart (n= 1100) .
Data from a cohort of 493 patients who had been
followed up for more than
3 years were used as a check for the result based
on the survey.
From the whole survey (n=1413) mean BASDAI = 4.2 (2.3) and mean BASFI 4.4 (SD 2.8). The population was
broader than that eligible for anti-TNFs, with 47%
having a BASDAI < 4. It appears (but is unclear) that this is the BASDAI at the later time (2002) point not the
earlier (1992/4)
Estimate of annual BASFI progression was 0.07 points.
NB progression was faster (0.1 points) in patients with
BASFI <4 at baseline, but was stable (0?) in patients with BASFI above 7. (ceiling effect of BASFI?).
When only patients with BASDAI >4 included BASFI progression was estimated as 0.054.
Data from the cohort study generated similar findings – number not actually reported for whole survey. BASFI
progression was 0.059 for patients with a BASDAI >4.
nr-axSpA
Kiltz U. eta l. Arth Care Res
2012; 64:1415-
Comparison of characteristics of patients
with AS and nr-axSpA.
Consecutive, diagnosed with axial SpA. None of the
Differences were statistically significant for ASDAS, CRP level, mSASSS and number of inflamed lesions.

Technology Assessment Report for NICE
TNF-alpha inhibitors for ankylosing spondylitis and nr-axSpA
15/12/2014 99
22144
Cohort of 100 patients
seen in 2010 inHerne clinic, Germany.
Analysis tested if the proportion of patients
reaching pre-specified cut-
off criteria (markers of disease severity) differed
between AS and nr-
axSpA.
patients had used anti-TNFs.
Axial SpA N=100:
nr-axSpA N=44,
AS N=56
Median BASDAI 4.3 (AS);
3.6 (nr-axSpA) (p=0.2)
Median BASFI 2.9 (AS); 1.5 (nr-axSpA)(p=0.05)
Median CRP 8.0 (AS); 3.8
(nr-axSpA)(p<0.001)
Median mSASSS 3.0 (AS);
1.1 (nr-axSpA)(p<0.007)
Proportion of males also significantly different.
Results: % nr-axSpA; % AS (p value)
%male: 31.8%;76.8% (<0.001)
BASDAI >4: 43%; 53.5% (0.1)
BASFI > 3: 34.1%; 46.4% (0.08)
ASDAS> 2: 54.5%; 78.6% (0.01)
CRP >5 mg/l: 29.5%; 69.1% (<0.001)
mSASSS > 3: 27.3%; 51.9% (0.01)
Number of inflamed lesions per pt > 3: 9.1%; 46.4%
(0.01)
Rudwaleit M. et
al. Arth Rheum 2009; 60:717-
72719
Cross sectional study of
GESPIC cohort n=462 patients with axSpA.
Divided into AS (n=236)
and nr-axSpA (with ≤5 years of symptoms)
(n=226).
Baseline mean (SD) –
BASDAI 4.0 (2.1) (AS); 3.9 (2.0) (nrAxSpA)
BASDAI >4 48.7% (AS);
47.7% (nrAxSpA)
BASFI 3.1 (2.5) (AS); 2.5
(2.1) (nrAxSpA)
NB mean BASFI the same for
patients with AS more than or
no more than 5 years
When AS patients were divided into those with more
than 5 years symptoms and those no more than 5 years, there were no differences in characteristics at baseline.
When AS (≤ 5 years) and nr-axSpA were compared there were statistically significant differences (worse for
AS) in Physicians Global assessment, Natural History
Table id the Table of the disease modification (or not0 studies of anti-TNFsn spinal mobility and lateral spinal
flexion, CRP and ESR and all radiographic measures
(mSASSS 4.9 in AS vs 1.4 in nr). mSASSS significantly worse in males vs females and CRP>6 vs <6 . Note
these AS patients are very short duration patients – they
must have progressed to AS rapidly. Also nr patients are only a short time from start of symptoms, and may not
reflect those who remain nr for many.
Poddubnyy D et al. Ann Rheum
Dis 2011;70:
1369-74145
Study of radiographic progression of sacroiliitis
in AS and nr-axSpA.
Radiographic evidence of sacroiliitis is a criterion in
the modified NY criteria
for AS so useful to see this analysis of progression
rather than just mSASSS
German cohort (GESPIC) n= 210 (115 AS; 95 nr), 2 years
follow-up. (baseline BASDAI
4 units and BASFI 3 units across AS and nr.)
Overall cohort had short
symptom duration – 4.2 years (5.2 AS, 3.2 nr).
Only 3.5% had had treatment
with anti-TNFs (1.1% nr; 3.5% AS).
After 2 years follow-up, 11 of the 95 nr-axSpA patients (11.6% 95% CI 6.6% to 19.6%) fulfilled the modified
NY criteria for AS. Also after 2 years approximately
10.5% of patients in the nr cohort had progressed by at least one mNY criteria grade, compared with 8.7% of
patients in the AS group (difference not ss).
Predictors of sacroiliitis progression – raised CRP for
both AS and nrAxSpA. Male sex and HLA-B27+
predicted lower progression in nr, but higher progression in AS.
Poddubnyy D
eta l. Arth Rheum
2012:64:1388-
98146
GESPIC cohort
Radiographs of spine and SIJ at baseline and 2
years.
Baseline
All patients (n=210) 2.4% of patients treated with anti-
TNFs; BASDAI 4, BASFI 3.
AS (n=115); 3.5% of patients treated with anti-TNFs;
BASDAI 4, BASFI 3.
nrAxSpA=95. (nrAxSpA) 1.1% of patients treated with
anti-TNFs; BASDAI 4,
BASFI 3.
Regresssion analysis found syndemophytes at baseline,
elevated ESR and CRP and smoking were significantly associated with spinal progression (> mSASS/2 years) in
AS but only syndemophytes at baseline in axSpA.
In AS patients mSASSS increased significantly from 5.86 (SD 10.30) to 6.81 (SD 11.71) – mean difference
0.95 (SD 2.78).
In nr-axSpA patients mSASSS increased significantly from 2.30 (SD 4.24) to 2.76 (SD 5.26) – mean
difference 0.46 (SD 1.63).
The difference between mean progression in AS and nr-axSpA patients was not statistically significant, nor was
the difference between those with symptom duration of
< 5 years and > 5 years.
% progressed by >2 mSASSS units /2 years: All axSpA
14.3%; AS 20.0% (95% CI 13.7-28.2%); nr-axSpA
7.4% ((%% CI 3.6-14.4%)
There was no difference in mSASSS change scores
between patients not progressing to AS (0.49 units)

Technology Assessment Report for NICE
TNF-alpha inhibitors for ankylosing spondylitis and nr-axSpA
15/12/2014 100
versus those who progressed to AS (0.27 units), p=0.53.
Flares
Cooksey R. et al,
Rheumatology
2010; 49: 929-3229
Cohort derived from full population of a trial
comparing probiotic and
placebo treatment in AS.
followed up for 1216
person weeks and
recorded localised/minor flares and
generalised/major flares, plus BASDAI, BASFI and
pain VAS.
N=134 AS patients.
Baseline mean BASDAI 3.7
(SD 2.1); mean BASFI 3.6
(SD 2.8)
Mean duration of symptoms
21 years (SD 13) (range 0-
58).
Overall flare rate was 71.4 per 100 person weeks (pw); major flare rate of 12/100pw and 59.4 minor
flares/100pw.
Mean BASDAI scores were 5.5 (major flare), 3.1 (minor flare) and 2 – 2.5 (flare free)
Mean BASFI scores were 5.5 (major flare), 3.1 (minor
flare) and 2.5 – 3.5 (flare free).
Note these means not from whole population but only
patients who experienced major flares plus flare free periods (n=27) and minor flares plus flare free periods
(n=77).
Stone M.A. et
al. Rheumatol 2008;47: 1213-
18150
A pilot study to
investigate pattern of disease and impact of
disease flares. It used the
SMART cohort (Bath, UK)
Patients asked about 4 patterns of disease (see
results)
AS patients, though
diagnostic criteria not stated.
n=114 (though not n=114 for
all %).
Mean BASDAI 4.2, BASFI
4.0
96% patients reported experiencing flares. Duration
varied by patient: days (40%); weeks (30%); and months (30%). 83% reported experiencing symptoms between
flares.
Percentage of patients for the 4 patterns of disease:
a) relapsing/remitting (flares with no symptoms
between): around 20%;
b) flares on a background of symptoms: around 50%;
c) gradually developing and resolving flare with periods
of no symptoms: 7%;
d) gradually developing and resolving flare after which symptoms worse than before start of flare: 26%.
a) and d) associated with higher BASFI.

Technology Assessment Report for NICE
TNF-alpha inhibitors for ankylosing spondylitis and nr-axSpA
15/12/2014 101
4.3 Clinical Effectiveness Summary and Conclusions
Summary of RCT results
The quality of the trial evidence was generally high; most studies were unlikely to have produced
results which were biased. For both the AS and nr-axSpA populations the results of the meta-analyses
demonstrated that anti-TNFs produce statistically significant and clinically relevant benefits to
patients in terms of improving function and reducing disease activity. The common class effect model
used may have underestimated the uncertainty in the effect estimates. Although there is a possibility
that infliximab is more effective than other TNF inhibitors at least at 12 weeks, there is no strong
evidence to support this. For the disease activity, function, and responder outcomes, the class efficacy
estimates were consistently slightly smaller for nr-axSpA than for AS, most noticeably for BASFI and
BASDAI 50. Statistical heterogeneity was more apparent in the nr-axSpA analyses than in the AS
analyses. This may be due to both clinical heterogeneity in the nr-axSpA trials (such as variation in
CRP levels, or the proportion of MRI positive patients), and the fact that fewer studies were available
for analysis. In light of the statistical heterogeneity across the nr-axSpA trials, both the reliability of
the nr-axSpA pooled estimates and their true relevance to patients seen in clinical practice is
questionable.
FDA re-analyses of two key nr-axSpA trials further emphasised the heterogeneity in the nr-axSpA
population. Results for an adalimumab trial in nr-axSpA patients suggested reduced efficacy in a
centrally diagnosed nr-axSpA population when compared with a locally diagnosed population and
that the treatment benefit in the whole trial population may have been driven by benefit in patients
who actually had AS, not nr-axSpA. Conversely, in a certolizumab pegol trial which recruited both
populations, the efficacy findings were consistent across the AS and nr-axSpA subpopulations,
regardless of the discrepancy in local or central pelvic x-ray readings.
Long-term efficacy
The longest follow-up durations in patients with AS by anti-TNF were: adalimumab 5 years,
etanercept 5 years, infliximab 3 years, golimumab around 5 years; and certolizumab pegol nearly 2
years. The results showed that across all the anti-TNFs after approximately two years of treatment,
around half of patients still achieved a good level of response to therapy. At five years around 60% of
golimumab patients, 50% of etanercept patients and 30% of adalimumab patients still achieved a good
treatment response. However, the long-term studies were not as well-reported as the RCTs, and their
results were derived from less reliable data; it is therefore unknown if these are true treatment
differences or due to differences in follow-up protocols, and/or imputation and analysis methods.
The long-term follow-up for nr-axSpA patients showed a continued high proportion of responders. At
one year around half of patients on adalimumab, etanercept or certolizumab still achieved an ASAS

Technology Assessment Report for NICE
TNF-alpha inhibitors for ankylosing spondylitis and nr-axSpA
15/12/2014 102
40 or BASDAI 50 level response. With certolizumab this is maintained at two years and with
adalimumab at 3 years.
When the long-term data are presented as observed or as completer analyses the long-term results are
similarly good: withdrawal rates are not high and those patients who remain on treatment continue to
achieve a good response.
For all anti-TNFs, at long-term follow-up mean final values or mean change from baseline for
BASDAI, BASFI and BASMI, where reported were generally maintained at levels indicative of
clinically significant treatment benefit for those patients with AS and those with nr-axSpA.
Four studies reported on radiographic disease progression over 2 years of follow-up in terms of
mSASSS in patients taking adalimumab, infliximab, etanercept, and golimumab. All four open-label,
uncontrolled follow-up studies found that mSASSS increased by a mean of around 0.9 over two years.
Three of these studies compared their rates with those from the OASIS cohort (of patients not taking
an anti-TNF) and found no difference. In conclusion there is no real evidence for the impact of anti-
TNF treatment on radiographic disease progression: a beneficial effect cannot be assumed, nor, given
the short term nature of the follow-up and the insensitivity of x-rays as a tool for the evaluation of
disease progression in AS, can one be discounted. There are some data to suggest an identifiable
benefit from around four years, but results from ongoing long-term studies should help to clarify this
issue.
Registry data demonstrate that around 60% of patients with AS treated with a first anti-TNF will still
be taking their therapy at 2 years, with median drug survival of 3.1 years (based on Danish registry
n=1436). Sequential treatment with anti-TNFs can be worthwhile but the drug survival, response rates
and benefits are reduced with 2nd
and 3rd
anti-TNFs, with the proportion of BASDAI 50 responders
falling approximately 10% with each subsequent anti-TNF and the median BASDAI and BASFIs
achieved increasing (worsening). The lower efficacy of a 2nd
anti-TNF relative to a first is reflected in
lower median drug survival and proportion of patients remaining on therapy at 2years. Interestingly,
despite a further reduction in response and efficacy with a 3rd
anti-TNF, drug survival does not fall
further, suggesting that patients may be allowed to, and be prepared to continue with a less than
optimally effective anti-TNF at this stage in their treatment history.
Adverse effects
Data from large systematic reviews, which included patients with a wide range of diseases, suggest
that, in the short-term, anti-TNFs as a group are associated with significantly higher rates of serious
infections, TB reactivation, non-melanoma skin cancer, total adverse events, and withdrawals due to
AEs, when compared with control treatments. Specifically, infliximab is associated with significantly

Technology Assessment Report for NICE
TNF-alpha inhibitors for ankylosing spondylitis and nr-axSpA
15/12/2014 103
higher rates of total adverse events and withdrawals due to adverse events and that certolizumab pegol
is associated with significantly higher rates of serious infections and serious adverse events. Analyses
from the present review showed etanercept to be statistically significantly more likely to result in an
injection/infusion site reaction when compared with infliximab, although analysable data on such
reactions were not reported for the three other anti-TNFs. Evaluations of longer-term data are more
scarce though suggest similar safety profiles across anti-TNFs. Data from the open-label studies
included in this review also do not suggest that there are important differences between treatments,
other than a higher the incidence of injection site reactions following treatment with etanercept. These
open-label data are however limited by the small sample sizes and non-randomised study designs.
Natural history
The available studies indicate that in AS and nr-AxSpa disease activity (BASDAI) is fairly stable over
time and does not generally progress, though it can be at a high (severe) level early in the disease.
Patient function (as assessed by BASFI) does deteriorate over time, though the course is not constant
or predictable. BASFI is determined by both disease activity and bony disease; progression of BASFI
over time is driven by progression of bony disease as assessed by imaging scores such as mSASSS, or
the presence of syndesmophytes. Best estimates of yearly disease progression rates without anti-TNF
therapy are around 1.0 mSASSS units and 0.035 to 0.07 BASFI units. Information on the natural
history of nr-axSpA is relatively sparse. Whilst disease progression appears to be faster in AS,
patients with nr-axSpA can have severe disease activity and hence poor function.
Overall conclusions
For both the AS and nr-axSpA populations the results of the meta-analyses demonstrated that
anti-TNFs produce statistically significant and clinically important benefits to patients in terms of
improving function and reducing disease activity. The efficacy estimates were consistently
slightly smaller for nr-axSpA than for AS.
In AS, although there is a little variation in treatment effects and it is possible that infliximab may
be more effective than other anti-TNFs at 12 weeks, the evidence for this is not strong, and it is
plausible that anti-TNFs may have a common class effect, with the treatments being equally
effective.
Statistical heterogeneity was more apparent in the nr-axSpA analyses than in the AS analyses.
This may be due to both clinical heterogeneity in the nr-axSpA trials and the fact that fewer
studies were available for analysis. In light of this heterogeneity, both the reliability of the nr-
axSpA pooled estimates and their true relevance to patients seen in clinical practice is
questionable.
Effectiveness maintained over time; about 50% of patients maintained a benefit at two and five
years.

Technology Assessment Report for NICE
TNF-alpha inhibitors for ankylosing spondylitis and nr-axSpA
15/12/2014 104
Evidence for an effect of anti-TNFs on radiographic disease progression was limited: the
relatively short-term follow-up available to date and the insensitivity of x-rays as an imaging tool
precluded the drawing of firm conclusions regarding the role of anti-TNFs in preventing or
delaying the progression of AS; there are some data to suggest an identifiable benefit from
around four years, but results from ongoing long-term studies should help to clarify this issue.
Sequential treatment with anti-TNFs can be worthwhile in patients with AS but the drug survival,
response rates and benefits are reduced with second and third anti-TNFs.

15/12/2014 105
5 Assessment of existing cost-effectiveness evidence
5.1 Systematic review of existing cost-effectiveness evidence
The following sections provide an overview of existing cost-effectiveness evidence and an assessment
of the relevance of the data from the perspective of the UK NHS. The differences in the approaches
and assumptions used across the studies are examined in order to explain any discrepancies in the
findings and to identify key areas of remaining uncertainty. The findings from the review provide the
basis for the development of a new decision-analytic model reported in Section 7 ‘Assessment of cost-
effectiveness: York Economic Assessment’.
5.1.1 Methods
An initial systematic search was undertaken in the NHS Economic Evaluation Database (NHS EED)
using a combination of technology names and disease terms. Further searches were undertaken in
MEDLINE and EMBASE for modelling and utility studies using disease terms only (as known
references were not identified from the initial search in NHS EED). Only full economic evaluations
that compare two or more options and consider both costs and consequences (including cost-
effectiveness, cost-utility and cost-benefit analyses) were included in the review of existing economic
literature. No language and date limits were initially applied, although eligibility of studies was
subsequently restricted to those reporting results which were specific to the UK. Full details of the
search strategies used are reported in Appendix 1.
In addition, as part of the current MTA process, each manufacturer submitted de-novo evidence on the
cost-effectiveness of the anti-TNFs in line with their respective indications for the treatment of AS
and nr-axSpA. These submissions are reviewed and the findings compared with those found in the
review of previously published studies.
5.1.2 Results of review of existing cost-effectiveness evidence
The combined searches retrieved 210 citations. A total of six UK studies reporting on the cost-
effectiveness of anti-TNFs for the treatment of AS were identified. No previously published studies
were identified for patients with nr-axSpA.
Four of these studies were industry funded assessments of the following anti-TNFs: infliximab
(Kobelt 2004143
& Kobelt 2007151
– both funded via an unrestricted grant by Schering Plough),
etanercept (Ara 2007152
– funded by Wyeth pharmaceutical P.C.) and adalimumab (Botteman 2007153
– funded by Abbott Laboratories). The three studies published in 2007 are largely based on the
economic analyses originally submitted by the manufacturers to NICE as part of the previous MTA
(TA143)1. Since the earlier publication by Kobelt has been superseded by the 2007 publication, only
the latter publication is further considered in this review. The remaining two UK studies were

Technology Assessment Report for NICE
TNF-alpha inhibitors for ankylosing spondylitis and nr-axSpA
15/12/2014 106
publications of the assessments and/or critiques undertaken by the independent Assessment
Group/Evidence Review Group for infliximab, etanercept and adalimumab for TA14334
and
golimumab for TA233.154
Therefore, a total of 5 studies met the inclusion criteria and are included in
this review.
The following sections provide a narrative discussion of each publication. A single critique section is
used to highlight the key issues and potential limitations of existing published cost-effectiveness
evidence. These issues are then re-visited with respect to the de-novo analyses submitted by the
manufacturers considering how these key issues and potential limitations have been addressed in the 2
separate indications. The final section highlights the remaining issues and uncertainties and provides
the basis for informing the development of a separate independent analysis of the cost-effectiveness of
anti-TNFs for AS and nr-axSpA relevant to informing decisions for the NHS.
5.1.3 Assessment of published cost-effectiveness studies
Kobelt et al (2007)151
: Comparison of the cost-effectiveness of infliximab in the treatment of
ankylosing spondylitis in the United Kingdom based on two different clinical trials.
Kobelt et al, (2007) estimated the cost-effectiveness of infliximab for the treatment of AS compared
to standard care over a lifetime horizon (60 years). Results were presented from both societal and
NHS/PSS perspectives, although only the latter are reported here in line with the current NICE
reference case. Short-term effectiveness data were derived from two separate clinical trials (Braun et
al and ASSERT)94, 97, 155
to inform the proportion and magnitude of initial response to treatment
expressed in terms of BASDAI 50 (or a BASDAI<=4) response (12-24 weeks) and changes in
BASDAI and BASFI scores. These were combined with longer term observational evidence on
disease progression (BASFI only) and other external sources on costs and utilities to estimate cost-
effectiveness. Results were reported separately based on each trial. Costs and benefits were
discounted at 3.5% and presented at 2005 prices.
Methods
The cost-effectiveness model was based on a short-term decision tree representing the double-blind
periods of the trials (12 -24 weeks) and a longer term Markov model to estimate subsequent
progression. The Markov model comprised 3 states: ‘Off treatment’, ‘On treatment’ and ‘Dead’. Only
patients responding to treatment as defined by the following criteria (BASDAI<=4 [scale 0-10] or a
>=50% improvement in BASDAI) remain on treatment at the end of the double blind periods.
Differential BASDAI and BASFI scores (scale 0-10) were derived from Braun (‘Off treatment’
BASDAI = 6.3 and BASFI = 5.4; ‘On treatment’ [responders] BASDAI = 1.8 and BASFI = 2.0) and
ASSERT (‘Off treatment’ BASDAI = 6.4 and BASFI = 5.8; ‘On treatment’ [responders] BASDAI =
1.4 and BASFI = 1.9). Disease progression was expressed in terms of changes in BASFI and was

Technology Assessment Report for NICE
TNF-alpha inhibitors for ankylosing spondylitis and nr-axSpA
15/12/2014 107
estimated from two surveys conducted 10 years apart (n=1,110).143
The mean absolute annual change
in BASFI applied was +0.07 (scale 0-10) and this was used to characterise the natural history of
progression for patients with AS without infliximab. Three main scenarios were presented reflecting
different assumptions concerning the impact of infliximab on disease progression: 1) No progression
while on treatment; 2) 50% of natural history (0.035/yr) and 3) Same as natural history (0.07/yr).
15% of patients were assumed to discontinue from infliximab annually based on data specific to
responders from the open-label extension period in the Braun trial. Interestingly, the authors noted
that the persistence rate was lower in responders compared with the entire sample in the Braun trial
and its extension (approximately 10% withdrawal rate per annum). The BASDAI and BASFI scores
for patients who withdrew from infliximab were assumed to return to the mean score of the non-
treated group. Mortality was modelled from general population life tables applying a standardised
mortality rate (SMR) of 1. Hence, no additional mortality was assumed to be related to AS and no
direct or indirect benefits for mortality were assumed for infliximab.
Disease costs and HRQoL were derived from a cross-sectional retrospective survey conducted at the
University of Bath, with the sample covering the full range of BASDAI and BASFI (1-10). The
annual cost of infliximab was based on 5mg/kg body weight (weeks 0, 2, 6 and then every 6 weeks).
An initial cost was assigned to all patients starting treatment (£79.25) and an outpatient cost was
applied to each infusion.
Results
From an NHS perspective, the cost per QALY gained ranged from £28,332 and £26,751 (no
progression while on treatment) to £49,417 and £46,167 (no effect of treatment on progression). The
model was also sensitive to the time horizon and the withdrawal rate. Using a 10-year horizon resulted
in ICER’s between 63-66% higher than the base-case lifetime horizon (60 years) and a withdrawal
rate of 5% resulted in ICERs 22-33% higher than the base-case (15%).

Technology Assessment Report for NICE
TNF-alpha inhibitors for ankylosing spondylitis and nr-axSpA
15/12/2014 108
Table 28 - Lifetime cost per QALY estimates reported by Kobelt et al (2007) (NHS and PSS perspective)
Scenario Incremental cost QALY gain ICER (£/QALY)
No progression on treatment
– BRAUN
36,378 1.28 28,332
50% progression on
treatment – BRAUN
35,756 1.01 35,332
Same progression on
treatment – BRAUN
39,336 0.80 49,417
No progression on treatment
– ASSERT
33,920 1.27 26,751
50% progression on
treatment – ASSERT
34,408 1.01 34,067
Same progression on
treatment – ASSERT
39,242 0.86 46,167
Ara et al (2007)152
:The cost-effectiveness of etanercept in patients with severe ankylosing
spondylitis in the UK
Ara et al, (2007) estimated the cost-effectiveness of etanercept for the treatment of severe AS in the
UK in accordance with BSR guidelines from an NHS/PSS perspective over a 25-year time horizon.
Effectiveness data were derived from individual patient data from a large multicentre European RCT
to inform the proportion and magnitude of initial response to treatment and associated changes in
BASDAI and BASFI scores. These were combined with longer term observational evidence on
disease progression (BASFI) and other external sources on costs and utilities to estimate cost-
effectiveness. Costs and benefits were discounted at 3.5%. The price year was not formally stated.
Methods
An individual patient model was used to estimate short-term and longer term costs and outcomes.
Patients in the model were assumed to have tried and failed at least 2 consecutive NSAIDs and have a
BASDAI measurement >= 40 (scale 0-100). Response was defined as a >=50% reduction in BASDAI
(or all fall of >= 20 units) and a reduction of the spinal VAS by >= 2 units. Response rates at 12 and
24 weeks were derived from 2 RCTs (67% and 55% for etanercept and 24% and 16% for comparator
arm at each respective time point). Individual patient data at 12 and 24 weeks were used to estimate
the magnitude of change in BASDAI and BASFI for responders and non-responders. The mean
BASDI and BASI scores at week 12 and 24 for responders and non-responders are reported in Table
29 together with observed utility at week 12 and the predicted utility values mapped from BASDAI
and BASFI at week 24.

Technology Assessment Report for NICE
TNF-alpha inhibitors for ankylosing spondylitis and nr-axSpA
15/12/2014 109
Table 29 - BASDAI, BASFI and EQ-5D measurements at weeks 12 and 24
Week 12 Week 24
BASDAI BASFI EQ-5D£ BASDAI BASFI EQ-5D^
Treatment
non-responder
53.02 54.86 0.48 56.87 56.87 0.46
Treatment
responder
19.52 25.39 0.79 18.32 21.41 0.80
Comparator non-responder
55.60 57.55 0.46 47.67 47.78 0.42
Comparator
responder
22.97 29.88 0.74 25.11 20.92 0.79
£ = observed values, ^ = predicted values using a mapping algorithm
For patients who continued responding to treatment it was assumed that BASDAI and BASFI
measures remained constant at the levels observed at week 24. For patients who withdrew after week
24, it was assumed patients would immediately revert back to their baseline values of BASDAI and
BASFI. After 24 weeks in the model it was also assumed that patients with AS, not receiving anti-
TNFs (conventional care and etanercept non-responders), would experience a worsening BASFI. A
mean absolute change in BASFI of 0.7 (scale 0-100) was assumed based on a cross-sectional study of
over 1000 UK patients.143
QALYs were estimated using a relationship derived from BASDAI, BASFI and EQ-5D from a single
European RCT (utility = 0.9235-0.004*BASFI-0.004*BASDAI). Disease costs were derived from a
separate costing study of 147 patients attending the Staffordshire Rheumatology Centre in Stoke.156
A
relationship between BASDAI and BASFI measurements and costs was used to estimate the disease
costs and impact of etanercept (annual costs = 5.862+0.006 *BASDAI+0.016*BASFI). An annual
cost of £9,372 was included to reflect the acquisition and monitoring costs associated with etanercept.
An initial cost of £71 was also applied to the first 3 month period for etanercept, although no further
details were provided by the authors concerning what this cost represented. The costs and/or HRQoL
associated with adverse events were not included.
The authors assumed that 10% of patients withdraw from etanercept every year. These data were
derived from external sources and no explanation was provided concerning whether these data
specifically applied to the post-24 week period or not and/or whether they were derived from
responders to treatment or not. Mortality was modelled from general population life tables applying a
standardised mortality rate (SMR) of 1.50. No direct or indirect benefits for mortality were assumed
for etanercept.
Separate scenarios were presented to explore alternative assumptions related to disease progression,
long term annual withdrawal and the model time horizon.

Technology Assessment Report for NICE
TNF-alpha inhibitors for ankylosing spondylitis and nr-axSpA
15/12/2014 110
Results
The main results are summarised in Table 30. From an NHS perspective, the base-case cost per
QALY gained was £22,704 for etanercept over a 25-year horizon. In contrast to the study by Kobelt
et al (2007), the impact of alternative progression assumptions appeared to have limited impact on the
ICER, with alternative scenario results ranging from between £23,625 (50% progression on treatment)
and £25,679 per QALY (same progression on treatment). The ICERs for alternative annual
withdrawal rates ranged from £15,103 (5% withdrawal rate) to £29,428 per QALY (15% withdrawal
rate). The ICERs for alternative time horizons ranged between £27,594 (2-years) and £22,704 (25
years).
Table 30 - 25 year cost per QALY estimates reported by Ara et al. (2007) (NHS and PSS perspective)
Scenario Incremental cost QALY gain ICER (£/QALY)
Base-case 35,978 1.59 22,704
No progression for any
patient
36,825 1.43 25,679
50% progression on
treatment (0.035 BASFI)
36,032 1.56 23,155
Same progression on
treatment (0.07 BASFI)
36,088 1.53 23,625
Annual withdrawal rate =
5%
33,976 2.25 15,103
Annual withdrawal rate =
15%
36,968 1.26 29,428
Botteman et al (2007)153
:Cost-effectiveness of adalimumab for the treatment of ankylosing
spondylitis in the United Kingdom
Botteman et al (2007) evaluated the cost-effectiveness of adalimumab versus conventional therapy in
patients with active AS from an NHS perspective over a 30-year time horizon. Effectiveness data
were derived from pooled data from two Phase III studies in patients with an inadequate response to
>=1 NSAID. Micro-simulation methods were subsequently applied to these studies to simulate
treatment decisions in accordance with BSR guidelines and associated outcomes. These were
combined with author assumptions on disease progression (BASFI only), utility and cost data from
the clinical trials and other external sources to estimate cost-effectiveness. Costs and benefits were
discounted at 3.5% using a 2004 price year.
Methods
Micro-simulation methods were applied to patients (n=397) recruited into two adalimumab RCTs:
ATLAS and M03-606. In the adalimumab clinical trials, patients were kept on active treatment even

Technology Assessment Report for NICE
TNF-alpha inhibitors for ankylosing spondylitis and nr-axSpA
15/12/2014 111
when response had not been achieved. Consequently, simulation methods were applied to the patients
in the clinical trial to mimic treatment decisions which more closely reflected treatment guidelines
and the requirements of the economic model. In accordance with BSR guidelines, a response in the
model was defined as a reduction of BASDAI of 50% or a decrease of >=2cm (scale 0-10)
accompanied by a reduction of spinal pain VAS of >=2cm. Assessment of initial response was
assumed to take place 8 weeks after treatment initiation. If the response criteria were not met at 8
weeks, a second response assessment was assumed at 12 weeks. Failure to achieve response on both
occasions was assumed to lead to withdrawal of adalimumab therapy. Therapeutic responses were
then assumed to be reviewed every 3 months until the end of the simulation (Year 30). Failure to
maintain the original response led to repeat assessments after 6-12 weeks in the first 48 weeks. Failure
to maintain response on both occasions led to withdrawal of adalimumab. After week 48, the
simulation model defined inadequate response on the basis of BASDAI scores only. In the RCTs,
patients were allowed to switch to open-label adalimumab at week 24, for these patients; last
observation carried forward at time of switch for BASDAI, BASFI and VAS values were used in the
model.
BASDAI, BASFI and spinal pain scores were based on directly observed trial scores (until week 48)
and additional assumptions about disease progression (after week 48). BASDAI, BASFI and spinal
pain scores were adjusted at each time point by a fixed value equal to the average difference between
adalimumab and conventional care patients observed at baseline. BASDAI scores after week 48 were
assumed to remain constant at these levels for patients continuing to respond to adalimumab and
conventional care patients. BASFI was assumed, for conventional care patients, to worsen after week
48 by 0.05 units (scale 0-10) annually. The estimate applied to the increase in BASFI appears to be
based on the authors’ own assumption but is argued to be consistent with previous cost-
effectiveness/epidemiological studies. In contrast, BASFI scores were assumed to remain stable for
adalimumab while patients remained on therapy, which was argued to be consistent with the
assumptions applied in previous published cost-effectiveness studies. It was assumed that patients
who discontinued would revert back to the BASFI scores of conventional care patients within 12
weeks (i.e. any benefits in BASFI were not maintained over a longer period). This was argued by the
authors to be a conservative assumption.
Utilities were derived from the Health Utilities Index 3 (HUI-3) from data at baseline and 24 weeks
from both adalimumab trials. A subsequent regression was estimated to predict utilities based on
BASDAI, BASFI, gender and race (utility = 0.948857-0.041528*BASDAI-
0.034481*BASFI+0.047080*Gender[1=male, 0=female]-0.063801*Race[1=white, 0=other]).

Technology Assessment Report for NICE
TNF-alpha inhibitors for ankylosing spondylitis and nr-axSpA
15/12/2014 112
Estimates of disease costs were based on 2-year data from 208 patients in the Outcomes in
Ankylosing Spondylitis International Study (OASIS) study, conducted in The Netherlands, Belgium
and France.157
An ordinary least squares (OLS) regression was estimated using only BASDAI (and
only BASFI in a sensitivity analysis). The regression utilised in the base-case was £708.45 +
£750*BASDAI. Hence each increase in BASDAI of 1 unit (scale 0-10) was assumed to be associated
with an increase in costs of £750.
Additional acquisition costs were applied to adalimumab (£357.50 per injection). No additional
administration costs were incorporated as patients were assumed to self-administer their injections.
All patients, regardless of treatment, were assumed to require at least 2 rheumatologist visits per year.
Routine safety monitoring costs were based on national guidance and included the cost of nursing and
physician time. The cost of a routine tuberculosis (TB) screening test via chest X-ray was assumed
before initiation of therapy and 6 months after and TB skin testing before initiation of therapy. The
cost of adverse events was based on data collected from the 2 clinical trials. A cost of £5100 was
applied to an active tuberculosis case.
An annual rate of withdrawal of 10% was applied based on an assumption by the authors. The
estimate was argued to be consistent with estimates reported in previously published cost-
effectiveness analyses.
Results
The main results are summarised in Table 31. From an NHS perspective, the base-case cost per
QALY gained was £23,097 for adalimumab over a 30-year horizon. Similar to the study by Ara et al
(2007), the impact of alternative progression assumptions appeared to have limited impact on the
ICER, with alternative scenario results ranging from between £23,802 (no BASFI progression on any
treatment) and £23,812 per QALY (same BASFI progression on treatment). However, in contrast to
Ara et al (2007), the ICERs appeared more sensitive to the alternative time horizons with estimates
ranging between £47,083 (48 weeks), £26,332 (5-years) and £23,097 (30 years).
Table 31 - 30-year cost per QALY estimates reported by Botteman et al (2007) (NHS and PSS
perspective)
Scenario Incremental cost QALY gain ICER (£/QALY)
Base-case 23,857 1.03 23,097
No progression for any
patient
NR NR 23,802
Same progression on
treatment (0.05 BASFI)
NR NR 23,812

Technology Assessment Report for NICE
TNF-alpha inhibitors for ankylosing spondylitis and nr-axSpA
15/12/2014 113
McLeod et al (2007)34
: Adalimumab, etanercept and infliximab for the treatment of ankylosing
spondylitis: a systematic review and economic evaluation
Mcleod et al (2007) evaluated the clinical and cost-effectiveness of adalimumab, etanercept and
infliximab compared with conventional treatment for AS. The publication is based on the independent
assessment undertaken by Liverpool Reviews and Implementation Group (LRiG) for NICE TA143.
The cost effectiveness of these interventions over the short term (1 year) and over alternative time
horizons of up to 20 years was reported.
Methods
The authors assumed that all three interventions were of equal clinical effectiveness and analysed the
anti-TNFs as a class versus placebo. Short-term effectiveness over 1-year was modelled using
individual patient data from two RCTs (including an open-label extension from week 24) for
adalimumab from 397 patients (246 adalimumab, 151 placebo). 315 of these 397 patients were
deemed to meet the BSR guidelines and were included within the Abbott economic model. There is a
lack of transparency regarding the values utilised due to the commercial nature of the data used.
However, the estimates for response rates were reported to be similar to those reported by LRIG in a
separate pooled analysis at weeks 12 and 24; 59% and 49.2% respectively for the TNF alpha
inhibitors (vs 22.5% and 14% respectively for placebo). No information is reported on the magnitude
of changes assumed. From week 30 onwards it was assumed that spontaneous recovery without
treatment (for placebo patients) would occur at a rate of 17.1%, as estimated by LRiG from the
patient-level analysis of the two adalimumab RCTs. This assumption was explored in a separate
sensitivity analyses.
The Assessment Group model assumed that patients withdraw from TNF-alpha inhibitor treatment at
a rate of 15% per year, which was considered to represent the ‘central value’ of the studies that were
identified reporting longer term discontinuation rates. This estimate is also the same as the annual rate
reported in the open-label extension study for infliximab (Braun trial) also reported in the review
undertaken by LRiG. Rates of 7% and 24% were also explored in separate sensitivity analyses,
representing the range of values reported across the studies considered. The annual withdrawal rate
(after the first 12 months as observed rates are used in the first 12 months) was applied to the
difference in response rate between the two arms of the evaluation, rather than the absolute number of
responders. This was to account for a potential anomaly that could arise through the assumption of a
constant level (17.1%) of spontaneous recovery without treatment.
The Assessment Group model took into account the cost of drug acquisition, administration,
monitoring and adverse events. No administration costs were assumed for etanercept and
adalimumab as it was assumed that both would be self-administered at home without supervision. The

Technology Assessment Report for NICE
TNF-alpha inhibitors for ankylosing spondylitis and nr-axSpA
15/12/2014 114
authors assumed an additional cost of £267 to administer infliximab infusions based on NHS
reference costs estimates for the regular attender cost for chemotherapy with musculoskeletal primary
diagnosis. Quarterly monitoring and testing was assumed for all patients receiving long-term
treatment with TNF-alpha inhibitor s. However, 2 of these assessments were assumed to take place at
the patient’s routine follow up outpatient visit, so only the additional costs of tests for monitoring
(£25) were applied to these assessments. The remaining 2 assessments were assumed to be undertaken
at a GP’s surgery and an additional cost of £25 was assumed for nurse/GP time in addition to the costs
of tests for monitoring (£25). Adverse events costs were based on estimates reported by one
manufacturer (Abbott) of £95.29 in the first year of treatment and £47.65 per patient-year thereafter.
Disease-related costs to the NHS were estimated by fitting an exponential cost model to the weighted
aggregate data from the OASIS study; a 2-year prospective study of 208 AS patients from four centres
in France, Belgium and The Netherlands (n=208).157
The exponential model estimated NHS cost =
£1585.30 *exp(0.1832*BASFI). The OASIS data were considered by the authors to provide a more
reliable source than other published studies from Stoke and Bath, being prospective in design and
over a longer period. BASFI was used by the authors as the major predictor of costs because it was
considered to better reflect long-term disease progression compared to BASDAI.
Health-related quality of life was estimated using the utility model provided by Schering-Plough
developed from the Bath Survey dataset on the grounds that it used a comparatively larger sample of
UK ankylosing spondylitis patients (n=1144), and also because it incorporated age and gender
variables; utility = 0.8772129-0.0384087*BASDAI-0.0322519*BASFI-
0.0278913*Male+0.0016809*Age.
The Assessment Group adopted a long-term increase in BASFI scores of 0.07 units per year for the
conventional treatment comparator arm of the model. This progression rate is applied for all periods
after week 20 in the model. In the base-case analysis, the same value was used in the intervention arm
adjusted pro rata to the proportion remaining of the maximal excess response seen at 12 weeks. In
effect, this assumes that patients withdrawn from anti-TNFs are assumed to return to the same
trajectory as non-responders, such that there is no ensuring benefit associated with being an initial
responder.
Results
Over a 1-year time horizon, base-case ICERs for adalimumab and etanercept versus conventional care
were essentially the same (approximately £57,000 per QALY). In contrast, the ICER for infliximab
was over £120,000 per QALY. With respect to modelling beyond 12 months, the results for
adalimumab were considered as representative of etanercept, and only the former were provided. In
contrast with other published models, the ICERs increased steadily from year 2 onwards. At a 20-year

Technology Assessment Report for NICE
TNF-alpha inhibitors for ankylosing spondylitis and nr-axSpA
15/12/2014 115
horizon the ICERs for adalimumab/etanercept increased to £98,910 per QALY and to £175,000 per
QALY for infliximab.
Additional NICE Decision Support Unit analyses
Given the discrepancy between the results reported by McLeod et al (2007)34
and the manufacturer
submissions (largely reflected in the 3 industry funded publications previously discussed in this
section)151-153
also submitted as part of TA1431, additional work was undertaken by NICE’s Decision
Support Unit (DSU) to reconcile the different models and to explore whether differences were due to
different parameter inputs or alternative structural assumptions.
A common set of parameter values were applied by the DSU to the 3 manufacturer models and the
LRiG model. The purpose of this was to attempt to identify whether differences between the results of
the models persisted once this common set of values were used. The specific parameter values which
were implemented were:
1. No improvement in BASFI or BASDAI for patients not on anti-TNFs
2. BASFI progression prevented whilst on anti-TNFs
3. BASFI progresses at 0.07 per annum when patients are not on anti-TNFs
4. Annual withdrawal rate of 7% from anti-TNFs
5. Baseline BASDAI/BASFI averages 6.5/5.6
6. Utility model as in the Schering Plough submission
7. Assessment group parameters for cost parameters (drug costs only)
8. 20 year time horizon
These parameter values were reported to have been the values agreed at a separate NICE committee
meeting and consequently the rationale for these values and assumptions is not formally stated by the
NICE DSU.
The results of the DSU analysis found that the manufacturer models all gave relatively consistent
results for each of the drugs. For Schering Plough, the ICERs over 20 years for
etanercept/adalimumab were £27k or £24k and for infliximab were £58k and £50k. Two figures were
presented because Schering Plough presented two different versions of the model which reflected two
different trials. The Wyeth model gave results of £20k for etanercept and £39k for infliximab. Abbott
gave results of £17k for adalimumab and £43k for infliximab (over a 30 year time horizon). These
ICERs were markedly different from those reported by the independent assessment group. Using a
similar set of parameters the results for etanercept/adalimumab using the LRiG model were £42k and
for infliximab £82k.

Technology Assessment Report for NICE
TNF-alpha inhibitors for ankylosing spondylitis and nr-axSpA
15/12/2014 116
Further work by the DSU revealed that the differences appeared largely driven by 2 key assumptions
which differed between the LRiG and industry models relating to:
1. the modelling of a ‘placebo’ effect
2. the longer term functions fitted to BASDAI and BASFI for responders to anti-TNFs
The LRiG model applied a 17.1% rate of spontaneous recovery without treatment from week 30
onwards (i.e. akin to assuming a long-term ‘placebo’ response for conventional care) in contrast to the
manufacturers who either assumed there would be no response with conventional care or that any
response would be transient and dissipate quickly after the 12-week period. .
The LRiG model also applied a quadratic function to the BASDAI and BASFI scores of responders
over a longer time horizon, compared to the linear functions used by the manufacturers. The use of a
quadratic function assumes that that the difference compared to conventional care was decreasing
(initially) with time. That is, over time, the differences in BASDAI/BASFI would slowly reduce in
responders and eventually be the same as for conventional care. However, the logical problem of
applying a quadratic function is clear. While the scores are reducing for a period, at longer time
periods the function starts to increase again. The issues were addressed by LRIG by using various
assumptions and logical constraints (i.e. BASDAI/BASFI score not allowed to be higher than
conventional care).
To further reconcile the models, the DSU incorporated a series of alternative structural assumptions
within the LRiG model. These assumptions included removing the 17.1% rate of spontaneous
improvement applied to conventional care and assuming constant BASDAI/BASFI scores after 1-year
for responders. Applying these assumptions resulted in an ICER for etanercept/adalimumab of
£30,100 per QALY (estimates for infliximab not reported) which were considered to be more
consistent with the manufacturer results.
Importantly the DSU highlighted that, although these analyses helped to reconcile the different model
results, any progression in terms of BASDAI or BASFI over time while on treatment would cause the
ICER to increase beyond £30,100. Similarly, the DSU concluded that the exclusion of the 17.1%
spontaneous recovery, without a comparable adjustment made to the intervention group was
favourable towards the cost-effectiveness of TNF alpha-inhibitors and any adjustment for this issue
would similarly lead to a higher ICER.
Armstrong et al (2013)154
: Golimumab for the treatment of ankylosing spondylitis: A NICE
Single Technology Appraisal.

Technology Assessment Report for NICE
TNF-alpha inhibitors for ankylosing spondylitis and nr-axSpA
15/12/2014 117
Armstrong et al (2013) summarises the report undertaken by the Evidence Review Group (ERG) on
the clinical and cost-effectiveness of golimumab for AS for a NICE STA (TA233)2. The ERG
provided a critique of the manufacturer submission (Merck Sharpe & Dohme) and undertook
additional exploratory analyses. The manufacturer’s model applied a 20 year time horizon in the base
case and a separate lifetime analysis (60.1 years) was presented in a separate sensitivity analysis. The
discount rate applied was 3.5% for utilities and costs and costs are considered from an NHS and PSS
perspective.
Methods
The manufacturer submission for golimumab was based on a single trial versus placebo (GO-RAISE).
A total of 7 additional placebo controlled trials were included of other anti-TNFs; 5 RCTs for
etanercept and 2 for adalimumab. In the absence of head-to-head studies directly comparing the
relative effectiveness of the alternative anti-TNFs, the manufacturer undertook a Bayesian random-
effects MTC including BASDAI 50 response, discontinuations and serious AEs. All treatments were
reported by the manufacturer to be statistically significantly more effective than placebo in terms of
BASDAI 50 response. No statistically significant differences were reported between each of the
alternative anti-TNFs in terms of discontinuations and serious AEs. When the alternative anti-TNFs
were compared with each other, no significant differences between golimumab, adalimumab and
etanercept were identified for BASDAI 50. A higher risk of discontinuation was reported for
golimumab vs etanercept (relative risk 4.30; 95% credible interval 1.01-18.50), although golimumab
was associated with significant improvements in BASDAI vs etanercept (mean difference -0.88, 95%
credible interval -1.58 to -0.14) and BASMI vs adalimumab (mean difference 0.52, 95% credible
interval 0.23-0.80).
The manufacturer cost-effectiveness model was based on a short-term decision tree (12 weeks) and a
longer term Markov model. The short-term tree was used to characterise response to each TNF-alpha
inhibitor treatment based on the MTC results for BASDAI 50. After the short-term tree, patients
entered a separate Markov model with a cycle length of 12 weeks and time horizon of 20 years. If
patients were already receiving a TNF-alpha inhibitor, they either stayed on therapy (‘on TNF
inhibitor’ state) or discontinued therapy because of lack of efficacy or adverse effects (‘not on TNF-
inhibitor’ state). It was assumed that discontinuations occurred at a rate of 15% per year in line with
NICE TA143. To model the lower disease activity just after discontinuation of TNF-alpha inhibitor
therapy, two 12-week tunnel states (‘just discontinued’ and ‘discontinued’) were also incorporated
into the model. Patients who are in the health state ‘on TNF-alpha inhibitor’ are assumed to have at
least a 50% improvement in BASDAI (BASDAI 50) during the first 12 weeks of treatment and do not
discontinue. Treatment is discontinued in patients whose condition does not respond to treatment and

Technology Assessment Report for NICE
TNF-alpha inhibitors for ankylosing spondylitis and nr-axSpA
15/12/2014 118
they are switched to conventional therapy. Patients in the conventional care arm enter the Markov
model in the ‘not on TNF-alpha inhibitor’ state. Patients could die at any point in the model.
Disease progression was incorporated in the model using BASDAI and BASFI scores. Data from the
GO-RAISE trial and the open-label extension period were used to develop predictive equations of
mean change from baseline in BASDAI and BASFI scores over time. Two separate equations were
developed based on the 24 week data for all patients and post-24 week data from GO-RAISE for
responders only. These equations were used for all anti-TNFs and the manufacturer assumed that the
scores followed the GO-RAISE data for 2 years before they either levelled off (BASDAI) or started to
deteriorate (BASFI at 50% of the rate of conventional care, equivalent to an increase of 0.035 [scale
0-10] units per year).
Although the equations are critical to the model structure and parameter estimates, these are not
reported in the paper by Armstrong et al (2013). A separate examination of the full ERG report2
revealed that these were reported as commercial-in-confidence (CIC) by the manufacturer and hence
it is not possible to report the assumptions made in relation to the magnitude of change in BASDAI
and BASFI over the initial 24 week period and subsequent post 24 week period for the anti-TNFs
(responders, non-responders) and conventional care. BASFI scores for conventional care were
reported to deteriorate according to the GO‐RAISE trial (short term equations were available only)
after which they were assumed to deteriorate at a rate of 0.07 units per year. The assumptions related
to the impact of discontinuation of anti-TNFs are not formally stated in the paper by Armstrong et al
(2013). However, the structure of the model implies that patients will revert back to the subsequent
trajectories of conventional care for both BASDAI and BASFI after 2 cycles (24 weeks).
Utilities were derived from the previous NICE technology appraisal (TA 143) and incorporated age,
sex, BASFI and BASDAI. Costs included in the model comprised drug acquisition, short-term (12
week) costs, longer term disease costs and adverse events. Longer term disease costs were based on
BASFI scores from the GO-RAISE trial using the same regression equation used for NICE
technology appraisal guidance 143. Mortality was included in the model and was considered to be a
constant across the comparator treatments at a relative risk of 1.47.
Results
The main base-case results from the manufacturer are summarised in Table 32. From an NHS
perspective, the base-case cost per QALY gained was £26,597 for golimumab compared to
conventional care over a 20-year horizon. Both etanercept and adalimumab were reported to be
extendedly dominated by golimumab.
Table 32 - Manufacturer cost-effectiveness results – 20 year horizon

Technology Assessment Report for NICE
TNF-alpha inhibitors for ankylosing spondylitis and nr-axSpA
15/12/2014 119
Technology Costs (£) QALYs Incremental
Costs
Incremental
QALYs
ICER (£)
Conventional care 88,667 6.6581 - - -
Adalimumab 93,601 6.8426 4,934 0.1845 NA (Extendedly
Dominated)
Etanercept 93,782 6.8504 5,115 0.1923 NA (Extendedly
Dominated)
Golimumab 93,786 6.8506 5,119 0.1925 26,597
The ERG undertook a limited validation of the model and reported various errors which were
corrected. However, they concluded that questions remained concerning the integrity of the
manufacturer model. The ERG subsequently presented results based on an exploratory re-analysis of
the manufacturer submission, using results from a separate MTC analysis and employing a lifetime
horizon. The results of the ERG re-analysis are reported in in Table 33. The results of this re-analysis
resulted in golimumab being extendedly dominated by the other two anti-TNFs.
Table 33 - ERG exploratory cost-effectiveness results – lifetime horizon
Technology Costs (£) QALYs Incremental
Costs
Incremental
QALYs
ICER (£)
Conventional care 95,227 7.8762 - - -
Golimumab 99,361 8.0296 4,134 0.1534 NA (Extendedly
Dominated)
Adalimumab 108295 8.3683 8,934 0.3387 NA (Extendedly
Dominated)
Etanercept 108,347 8.3712 52 0.0029 26,505
There is no discussion by Armstrong et al (2013) of the appropriateness of the assumptions applied to
BASFI progression, despite this being a critical structural assumption. However, a separate sensitivity
analysis was presented in the full ERG report which uses the same rate of disease progression for
BASFI (0.07 units per year) for all patients after 2 years. As part of this analysis, the ERG corrected
errors identified in the way the BASFI regression equations were incorporated by the manufacturer.
Table 34 reports the ERG results based only on correcting the error identified and Table 35 reports the
results of also applying a common rate of disease progression for all patients after 2 years as well as
correcting for the error. Golimumab was reported to be extendedly dominated by the other two anti-
TNFs in both scenarios. It is also worth noting that the ICER for etanercept vs conventional care
exceeded £30,000 per QALY in both scenarios.
Table 34 - ERG exploratory cost-effectiveness results –correction for BASFI error (from TA233)

Technology Assessment Report for NICE
TNF-alpha inhibitors for ankylosing spondylitis and nr-axSpA
15/12/2014 120
Technology Costs (£) QALYs Incremental
Costs
Incremental
QALYs
ICER (£)
Conventional care 77,505 6.7336 - - -
Golimumab 81,849 6.8746 4,334 0.1410 NA (Extendedly
Dominated)
Adalimumab 91,340 7.1703 9,491 0.2937 NA (Extendedly
Dominated)
Etanercept 91,408 7.1734 68 0.0031 31,612
Table 35 - ERG exploratory cost-effectiveness results –correction for BASFI error and common BASFI
progression after 2 years (from TA233)
Technology Costs (£) QALYs Incremental
Costs
Incremental
QALYs
ICER (£)
Conventional care 74,980 6.8267 - - -
Golimumab 79,330 6.9675 4,350 0.1408 NA (Extendedly
Dominated)
Adalimumab 88,994 7.2567 9,664 0.2892 NA (Extendedly
Dominated)
Etanercept 89,055 7.2600 61 0.0033 32,483
5.1.4 Summary and critique of published cost-effectiveness studies
No previously published studies were identified which assessed the cost-effectiveness of anti-TNFs
for nr-axSpA. Consequently, the de-novo submissions provided by the manufacturers provide the only
existing evidence which can be considered to inform decisions for the NHS. Of the previously
published UK cost-effectiveness study identified, there appear marked differences between the results
of the industry funded assessments and the results from the independent assessment by LRiG.
Importantly, the results of the independent critique and exploratory re-analysis by the ERG for TA
233 also appear potentially less favourable than the industry funded published assessments. Although
the DSU review of models submitted as part of TA143 has reconciled many of the key differences and
highlighted the key assumptions, a number of key uncertainties remain. The remainder of this section
provides an overview of the issues and uncertainties identified based on existing published studies and
the DSU reports. This summary provides an important basis for considering the extent to which the
de-novo submissions provided by the manufacturers for this appraisal have adequately addressed
these.
All existing models are based on similar 2 part structures:
Initial-response period (short term model used to determine initial response rate);

Technology Assessment Report for NICE
TNF-alpha inhibitors for ankylosing spondylitis and nr-axSpA
15/12/2014 121
post-response period (longer term model used to characterise natural history of
disease (i.e. without anti-TNFs) and impact of anti-TNFs (while on therapy and when
therapy is stopped)
All models employ changes in BASDAI and/or BASFI to quantitatively model the short and longer-
term costs and quality of life implications (using QALYs) of the use of anti-TNFs s vs conventional
care alone.
Although there are differences between the modelling of the initial response period, existing models
are broadly comparable being based on an assessment around 12-weeks (and potentially at 24-weeks
as well) using a particular variant of existing BSR guidelines. Patients receiving anti-TNFs who meet
the response criteria at the 12/24 week assessment are continued on anti-TNFs. Anti-TNFs are
withdrawn in non-responders at the 12/24 week assessment point and patients subsequently receive
conventional care alone.
However, there are marked differences between existing studies in relation to the modelling of the
post-response period and the assumptions employed. This period is often separated into different time
intervals allowing different assumptions to be made regarding the effect of anti-TNFs (i.e. initially
improving with time in responders but then later ‘levelling off’ or even deteriorating over a longer
term time horizon relative to conventional care). An important difference between existing models is
the timing of this ‘levelling off’ period and assumptions employed over a longer time horizon. The
differences in approaches and the timing of this ‘flattening off’ period are also closely linked to the
data used. That is, whether the changes in BASDAI/BASFI used in the model are restricted to the 12-
24 week data from RCT evidence reported during the double-blind phase (Kobelt et al [2007], Ara et
al [2007]) or also incorporate longer-term data from the open-label extensions. Studies which use
change in BASDAI/BASFI data directly in the model, from the double-blind phase, appear to employ
shorter ‘levelling off’ periods compared to studies using data from the open-label extension phase
(Botteman [2007], McLeod [2007], Armstrong [2007]).
Those studies incorporating an open-label extension typically assume continuing changes in
BASDAI/BASFI for responders to anti-TNFs versus non-responders/conventional care beyond the
initial 12/24 week period. Importantly, none of the studies using open-label extension data appear to
provide any discussion of the potential for selection bias (e.g. related to the initial consent for patients
to participate and/or agree to switch treatments as well as ongoing selection issues concerning
retention over a longer period) and how these should be considered and/or adjusted for in the
economic model. However, the implication of this is important since the assumption being made by
several models appears to incorporate an assumption of an increasing effect of anti-TNFs in
responders over time (i.e. in terms of continuing improvements in BASDAI/BASFI), which does not

Technology Assessment Report for NICE
TNF-alpha inhibitors for ankylosing spondylitis and nr-axSpA
15/12/2014 122
appear to be adequately justified or related to any underlying clinical/pharmacological mechanism. In
the absence of the counter-factual (i.e. comparable data in patients who did not participate or were
subsequently withdrawn from the open-label study) it is unclear whether the apparent increasing
effect is simply a function of the selection issue or is a real effect of the anti-TNFs. Importantly, those
studies which only use data from the double-blind periods of RCTs often cite the open-label data as
providing supportive evidence regarding the maintenance of the effects observed at 12/24 weeks but
not use it to support an assumption of an increasing effect over time.
The longer-term impact on costs and utilities beyond the initial response period are subsequently
quantified by estimating separate BASDAI/BASFI ‘trajectories’ for different patient categories. The 3
main categories are:
1. Conventional care
2. Non-responder to anti-TNFs at 12/24 week assessment
3. Initial responder to anti-TNFs at 12/24 week assessment
The ‘trajectory’ for patients who are responders to anti-TNFs at the initial 12/24 week assessment are
further separated into; (i) the period up to the point that anti-TNFs are subsequently withdrawn (i.e.
due to loss of efficacy, AEs) and the period post TNF-alpha inhibitor withdrawal.
After the ‘levelling off’ period for BASDAI, the majority of existing studies assume BASDAI is
constant over the longer term. That is, the BASDAI of responders to anti-TNFs is assumed to be
lower than the equivalent BASDAI value (lower disease activity) applied to conventional care/non-
responders and a constant difference is assumed to be retained until patients discontinue. At the point
of discontinuation of anti-TNFs, patients subsequently revert back to the same value assumed for
conventional care/placebo and non-responders to anti-TNFs at 12/24 weeks. Hence, any improvement
in BASDAI is assumed to dissipate immediately or within a short-period (3-6 months) after
discontinuation of anti-TNFs.
All existing studies model BASFI as a linearly increasing function over the longer term for non-
responders/conventional care. That is, a constant rate of change is subsequently applied which is used
to characterise the impact of disease progression on functional ability – typically a worsening of 0.07
(0-10 scale) units per annum. Again, the same assumptions applied to BASDAI for non-responders to
anti-TNFs are applied to BASFI. That is, beyond 12/24 weeks, non-responders are assumed to follow
an identical BASFI ‘trajectory’ as conventional care/placebo patients. By contrast, patients who
respond to anti-TNFs are typically assumed not to ‘progress’ further in terms of functional disability,
or progress at a lower rate than conventional care patients, whilst continuing to receive anti-TNFs.
Hence the difference in individual mean BASFI scores increases over time in existing economic
models between patients who continue to receive anti-TNFs and non-responders/conventional care.

Technology Assessment Report for NICE
TNF-alpha inhibitors for ankylosing spondylitis and nr-axSpA
15/12/2014 123
The only study which employs a markedly different approach to the modelling of BASDAI and
BASFI for responders is the study undertaken by the previous independent assessment group (LRiG)
for TA 143. Instead, LRiG applied a quadratic function to the BASDAI and BASFI scores of
responders. This approach assumed that the difference compared to conventional care was decreasing
(initially) with time. That is, over time, the differences in BASDAI/BASFI would slowly reduce in
responders and eventually be the same as for conventional care. While the logical problems of
applying a quadratic function over a longer period were recognised by the authors (i.e. function begins
to increase after a particular period) and was addressed using a series of logical restrictions (i.e.
BASDAI/BASFI score constrained to be the same or better than conventional care), the clinical ‘face’
validity of this approach also appears questionable in the context of longer term projections which are
required for appropriate assessments of cost-effectiveness.
Another key difference between existing studies relates to the assumptions made concerning the
subsequent trajectory of BASFI for patients who withdraw from active treatment. Given that BASFI
is linearly increasing with time for conventional care, the assumption of the subsequent BASFI
trajectory is potentially an important driver of cost-effectiveness. This is often referred to as
‘rebound’. Typically two scenarios are used:
1. Rebound equal to gain. When patients fail therapy (after initially responding), their BASFI
deteriorates by the same amount by which it improves when they responded to therapy.
2. Rebound back to natural history/conventional care. When patients fail therapy (after
initially responding), their BASFI deteriorates to the level and subsequent trajectory it
would have been had they not initially responded to therapy.
In the absence of evidence on the magnitude of any rebound, these alternative scenarios represent the
‘best-case’ and ‘worst-case’ scenarios possible. In other words, the reality regarding rebound is likely
to be somewhere between these two scenarios which should, therefore, be seen as the limits.
The implications of the different rebound scenarios are clearly illustrated in Figures 2 and 3. Studies
which are based on assumptions of rebound equal to gain incorporate an ongoing benefit of anti-TNFs
in patients in whom therapy is subsequently withdrawn after an initial response. Hence, such an
assumption is more optimistic than assuming no continuing benefit at the point treatment is
withdrawn.
Figure 2 - Illustration of the scenario of rebound equal to gain

Technology Assessment Report for NICE
TNF-alpha inhibitors for ankylosing spondylitis and nr-axSpA
15/12/2014 124
Figure 3 - Illustration of the scenario of rebound to conventional care
Although the impact of discontinuation in patients who initially respond is clearly an important issue,
the assumptions underpinning the subsequent trajectories of patients who are non-responders at 12/24
weeks to anti-TNFs are rarely explicitly justified. The most common assumption applied is that non-
responders during the initial period follow the same subsequent trajectory for BASDAI/BASFI as
conventional care/placebo patients beyond the 12/24 week assessment point. However, the
appropriateness of this assumption does not appear to have been discussed in existing studied.
Essentially, for this assumption to hold, the initial response to anti-TNFs has to be independent of
baseline patient characteristics, such that response to treatment is effectively a random process.

Technology Assessment Report for NICE
TNF-alpha inhibitors for ankylosing spondylitis and nr-axSpA
15/12/2014 125
However, if response is not independent of patient characteristics, the implication is that
responders/non-responders to TNFs-alpha inhibitors may be systematically different from each other.
This has implications for the appropriateness of current assumptions being applied to non-responders
at 12/24 weeks and subsequent responders who later withdraw. For example, all other things being
equal, if patients with more severe disease (high BASDAI/high BASFI) were more likely not to
respond, then assuming that the non-responders at 12/24 weeks follow the same trajectory as the
‘average’ conventional care/placebo patient is likely to be optimistic towards the anti-TNFs (and vice-
versa for if less severe patients are more likely to respond). Hence, rather than following the trajectory
of an ‘average’ placebo/conventional care patient, a non-responder may actually follow a different
trajectory i.e. that of an equivalent more/less severe conventional care patient. Inevitably, the impact
of different patient characteristics is likely to be more complex than the simplistic scenarios presented
above.
As previously noted, all models employ changes in BASDAI and/or BASFI to quantitatively model
the short and longer-term costs and quality of life implications (using QALYs) of the use of anti-
TNFs s vs conventional care. The justification for using these measures appears largely driven by the
existence of external sources of costs and health utility estimates which can be directly linked to these
measures and not to others (e.g. BASMI, ASDAS, mSASSS etc). Hence, current models appear more
of a function of the data which is available to link to costs and utilities rather than being based on a
clear underlying biological or clinical process. This raises more general conceptual concerns
regarding existing models and also regarding the generalisability of findings in an AS population to
the separate nr-axSpA population.
The use of BASDAI/BASFI per se is perhaps not the most significant issue, since in the absence of
alternative mapping functions to costs and/or utilities it’s unclear how to estimate longer term costs
and QALYs without ultimately linking to these measures. However, it is concerning that the majority
of existing studies do not appear to link the data and assumptions applied to these measures to any
coherent clinical underpinning regarding differences between population characteristics and the effect
of anti-TNFs. Consequently, ‘progression’ over time is currently modelled entirely via changes in
BASFI, since BASDAI is assumed to remain constant. However, no attempt is made to justify why
BASFI increases, the rate at which it increases and how this rate might differ across different groups
as well as the impact that anti-TNFs might have (i.e. any effect on BASFI which may be independent
of the effect on BASDAI).
Modelling ‘progression’ implicitly (i.e. employing natural history estimates of the rate of change of
BASFI from external studies) rather than explicitly (i.e. attempting to explain how BASFI evolves
over time in relation to inflammatory and other processes and how these may differ within

Technology Assessment Report for NICE
TNF-alpha inhibitors for ankylosing spondylitis and nr-axSpA
15/12/2014 126
populations and across the AS and nr-axSpA groups) has led to a series of implicit/evidence free
assumptions. These include:
No change in BASFI while receiving anti-TNFs (i.e. assuming implicitly that these
act as disease modifiers and that while patients respond and continue to receive them,
further deterioration in functional progression is completely prevented).
Lower BASFI changes while receiving anti-TNFs (i.e. assuming that anti-TNFs do
not completely halt further deterioration in functional progression but that the rate of
progression is reduced relative to progression on conventional care).
Similar natural history rates of change in BASFI across different subgroups and
populations (i.e. assuming that rate of change in BASFI is independent of time and/or
patient characteristics).
Similar conceptual concerns were also highlighted by the NICE DSU in their work to support TA143,
noting that in inflammatory arthritis a clearer conceptual relationship is assumed between disease
activity, radiographic progression and physical functioning. Such that changes in physical functioning
can be more clearly related to different processes and evidence for the anti-TNFs on each separate
process. In highlighting these issues the DSU cited emerging longer-term data reported for anti-TNFs
based on measures of radiographic progression (mSASSS) in AS. Although this evidence was not
formally included in their analyses, the evidence was cited to indicate that an assumption of no further
progression while on anti-TNFs for AS was potentially optimistic based on emerging longer-term
radiographic progression data.
Importantly, the only UK study published since the NICE DSU review did subsequently employ a less
favourable assumption concerning the impact of anti-TNFs on functional progression (BASFI). The
assumption employed by the manufacturer for golimumab assumed that the longer term rate of change
in BASFI for responders who continued on treatment would be 50% of that assumed for conventional
care/non-responders. Although this assumption is a significant departure from the base-case
assumptions applied within previous industry funded studies, no justification appeared to be identified
by Armstrong et al (2013) in the review of the manufacturer submission to support this.
In summary, there appear significant differences between the cost-effectiveness results reported in
existing UK published studies. Many of these differences appear largely due to differences in data
sources (i.e. double-blind period vs open-label extensions), subsequent assumptions and estimates
related to the magnitude and duration of the differences in BASDAI and BASFI measurements
between responders and non-responders in the short to medium term (i.e. the ‘levelling off’ period)
and then longer term in relation to assumptions concerning BASFI progression and issues around
‘placebo’ effect and the withdrawal of anti-TNFs. Some of the main differences between existing

Technology Assessment Report for NICE
TNF-alpha inhibitors for ankylosing spondylitis and nr-axSpA
15/12/2014 127
studies have been highlighted in a separate review by the NICE DSU. However, while this review is
helpful in identifying the impact of parameter and structural assumptions, it does not provide a basis
for informing which assumptions appear most justified based on existing data and clinical
understanding of the progression of AS and the impact of anti-TNFs. It is also concerning that many
of the existing studies are based on CIC data and hence lack transparency regarding specific inputs
and assumptions.
To date only two UK studies have attempted to assess the cost-effectiveness of the alternative anti-
TNFs. One of these studies, McLeod et al (2007), assumed that the alternative treatments were
identical in terms of clinical effectiveness and hence only considered differences in the acquisition,
administration and monitoring cost. The justification provided by the authors was based on the lack of
statistically significant differences across key outcome measures based on indirect comparisons. The
other study, Armstrong et al (2013), assumed differences in the clinical effectiveness of the alternative
anti-TNFs based on a separate MTC. However, differences between the anti-TNFs appeared sensitive
to the studies included and the specific outcomes considered. Hence, different conclusions could be
drawn concerning the most ‘efficient’ intervention depending on the analysis considered. However,
the magnitude of differences in clinical effect and QALYs remained small and the clinical and
economic value of this might appear questionable.
There are conceptual concerns surrounding all existing models relating to the subsequent projection of
BASDAI and BASFI over a longer time-horizon which are required in order to generate more
appropriate lifetime estimates of costs and QALYs required for cost-effectiveness assessments. The
speculative nature of these projections was highlighted as a significant concern by the previous
independent assessment group (LRiG) and hence their longer-term results were presented as
exploratory scenarios. However, it appears that all existing models are largely based on implicit
approaches and assumptions and lack a clearer conceptual basis which might help to more
appropriately inform parameter estimates and structural assumptions and facilitate a more evidence
based assessment of the potential longer term impact of anti-TNFs.
The following sections present a summary of the de-novo submissions provided by the manufacturers
for the separate AS and nr-axSpA indications. Brief overviews of the manufacturers’ submissions for
AS and nr-axSpA are provided alongside a summary of the base-case cost-effectiveness results. This
is followed by a more in-depth comparison of key parameter and structural assumptions across the
manufacturers and the separate indications. The issues and concerns regarding existing published
studies are used as the basis for a more critical assessment of these submissions; investigating the
extent to which these concerns have been adequately addressed and highlighting key uncertainties
which still remain.

Technology Assessment Report for NICE
TNF-alpha inhibitors for ankylosing spondylitis and nr-axSpA
15/12/2014 128
Note: Although fully incremental results were routinely presented by each manufacturer, there were
differences between manufacturers in terms of how the results were presented and also whether the
correct calculations based on dominance and extended dominance were included. Consequently the
fully incremental ICER tables reported are based on our own calculations to ensure accuracy and
consistency between the various manufacturer results tables.
5.2 Summary of manufacturers’ de-novo submissions
Manufacturers submitted de-novo analyses for both AS (AbbVie, UCB, Pfizer, MSD) and nr-axSpA
(AbbVie, UCB, Pfizer) populations.
5.2.1 Overview of AbbVie (adalimumab) model
The economic model presented by AbbVie compared the cost-effectiveness of adalimumab vs.
conventional therapy and other licensed anti-TNFs for nr-axSpA and AS. Separate state-transition
models were developed for the two indications separately based on the ASAS guidelines for the use of
anti-TNFs. All patients were assumed to take conventional therapy/background therapy (e.g.
NSAIDs) during the modelled horizon and also receive one of the licensed anti-TNFs or placebo
(conventional therapy only). Specifically, patients were assumed to stay on therapy as long as they
had an adequate therapeutic response (i.e., ASAS40 for nr-axSpA and ASAS20 for AS) and patients
were assumed to discontinue therapy when insufficient response occurred. Discontinuations due to
adverse events (AEs) or reasons other than therapeutic failures were also included.
The model consists of a short-term component (first 12 weeks) and a longer term component to
estimate lifetime costs-effectiveness (40 years). In common with previously published models, the
model was based on the estimation of BASDAI and BASFI scores over time. The model used the
available long-term open-label extension data of trials of adalimumab (up to 156 weeks in ABILITY-
1 for nr-axSpA and 260 weeks in ATLAS for AS – see Figures 4 and 5) as well as including
assumptions beyond these study durations to inform the life-time cost-effectiveness results. To avoid
extrapolating life-time improvement by applying a functional form to the BASDAI/BASFI data, the
manufacturer applied the mean observed BASDAI and BASFI scores until the last available data
point and carried forward the last observed values to the end of horizon.
Figure 4 - Observed mean BASDAI and BASFI scores for adalimumab ASAS20 responders in the
licensed population from ATLAS (AS)

Technology Assessment Report for NICE
TNF-alpha inhibitors for ankylosing spondylitis and nr-axSpA
15/12/2014 129
Figure 5 - Observed mean BASDAI and BASFI scores for adalimumab ASAS40 responders in the
licensed population from ABILITY-1 (nr-axSpA)
Response rates and other select treatment efficacy endpoints were based on a separate systematic
review and network meta-analysis. In the base-case, ASAS40 for nr-axSpA and ASAS20 for AS were
used to define clinical response at week 12, based on the primary outcome measures from the clinical
trials of adalimumab. In the base-case analysis, placebo responders at week 12 were assumed to lose
response and return to baseline disease severity. Patients who subsequently withdrew from TNF-alpha
treatment at any time point were also assumed to return to baseline disease severity (rebound equal to
gain). Longer term discontinuation was assumed to be time-dependent and was based on a log-normal
parametric distribution from the separate open-label RCTs adjusting for subsequent loss of response.
In the base case model, the BASFI score for all patients not on TNF-alpha inhibitor treatment
increases in a linear fashion by 0.084 (scale 0-10) per year in patients with nr-axSpA, in line with the
0
0.2
0.4
0.6
0.8
1
1.2
1.4
1.6
1.8
2
12 24 52 76 104 128 156 180 208 220 232 244 260
Weeks from baseline
ADA Responders (ATLAS )
BASDAI Mean BASFI Mean
LOCF
0
0.2
0.4
0.6
0.8
1
1.2
1.4
1.6
1.8
12 16 20 24 28 36 44 52 60 68 80 92 104 116 128 140
Weeks from baseline
ADA Responders (ABILITY-1)
BASDAI Mean BASFI Mean
LOCF

Technology Assessment Report for NICE
TNF-alpha inhibitors for ankylosing spondylitis and nr-axSpA
15/12/2014 130
evidence from the ABILITY-1 trial, where each additional year of baseline symptom duration was
reported to be associated with a significant (+0.084, p=0.0005) increase in baseline BASFI score,
adjusting for the age of onset (age at first reported axial SpA symptom) to control for the age effect on
functional damage. An estimate of +0.056 was applied to patients with AS based on applying a
similar approach to the ATLAS trial, adjusting for age at disease diagnosis. Hence, a higher BASFI
progression was applied to patients not on anti-TNFs in the nr-axSpA population compared to the AS
population.
BASDAI and BASFI scores were used jointly to estimate quality of life associated with AS, using the
relationship observed between the utility scores (measured in HUI3) and the BASDAI and BASFI
scores in ATLAS trial. Observed EQ-5D scores were mapped to BASDAI and BASFI for the
relationship in the base case for nr-axSpA from ABILITY-1.
The relationship between BASDAI and costs, derived from a re-analysis of the OASIS data, was
applied in the base-case. Costs of drug, administration, initiation and monitoring, and adverse events
were also included. Discounting was applied at 3.5% for both costs and outcomes. . Standardised
mortality ratios of 1 and 1.5 were assumed for nr-axSpA and AS, respectively. Uncertainty
surrounding results was addressed using probabilistic sensitivity analyses (PSA).
Base-case results from AbbVie (adalimumab) model
The main base-case ICER results from the manufacturer are summarised in Table 36 for the AS
population. From an NHS perspective, the base-case cost per QALY gained versus conventional care
ranged from £16,391 per QALY (adalimumab) and £44,448 per QALY (infliximab).
Table 36 - TNF -alpha inhibitors compared to conventional care for AS - AbbVie (base-case)
Total costs (£) Total QALYs Incremental
costs (£)
Incremental
QALYs
ICER (£)
Conventional care 112,762 8.62 - - -
Adalimumab 139,860 10.28 27,098 1.65 16,391
Certolizumab 133,273 9.82 20,511 1.20 17,067
Etanercept 139,574 10.21 26,812 1.59 16,897
Golimumab 138,385 10.17 25,624 1.55 16,535
Infliximab 197,100 10.52 84,339 1.90 44,448
Table 37 reports the results based on the fully incremental analysis. In the manufacturer base-case
analysis, certolizumab and etanercept were ruled out by extended dominance. The ICER of
adalimumab was £16,391 per QALY compared to conventional care. The ICER of the next more

Technology Assessment Report for NICE
TNF-alpha inhibitors for ankylosing spondylitis and nr-axSpA
15/12/2014 131
costly (and non-dominated) TNF-alpha inhibitor was £238,500 per QALY for the comparison
between infliximab and adalimumab.
Table 37 - Fully incremental comparison of anti-TNFs for AS – Assessment Group analysis based on
AbbVie (base-case)
Total costs (£) Total QALYs Incremental
costs (£)
Incremental
QALYs
ICER (£)
Conventional care 112,762 8.62 - - -
Certolizumab 133,273 9.82 - -
Extendedly
dominated
Golimumab 138,385 10.17 - -
Extendedly
dominated
Etanercept 139,574 10.21 - -
Extendedly
dominated
Adalimumab 139,860 10.28 27,098 1.66 16,391
Infliximab 197,100 10.52 57,240 0.24 238,500
The main base-case ICER results from the manufacturer and fully incremental analysis are
summarised in Tables 38 and 39 for the nr-axSpA population. The ICERs versus conventional care
ranged from £12,866 (certolizumab) to £13,288 per QALY (adalimumab). In the fully incremental
comparison, adalimumab was extendedly dominated and hence the ICER for certolizumab vs
conventional care is the only ICER reported (£12,866).
Table 38 – Anti-TNFs compared to conventional care for nr-axSpA – AbbVie (base-case)
Total costs (£) Total QALYs Incremental
costs (£)
Incremental
QALYs
ICER (£)
Conventional care 126,075 8.88 - - -
Adalimumab 142,218 10.10 16,143 1.22 13,228
Certolizumab 142,608 10.16 16,532 1.28 12,866
Etanercept Not assessed Not assessed Not assessed Not assessed Not assessed
Table 39 - Fully incremental comparison of anti-TNFs for nr-axSpA – Assessment Group analysis based
on AbbVie (base-case)
Total costs (£) Total QALYs Incremental
costs (£)
Incremental
QALYs
ICER (£)
Conventional care 126,075 8.88 - - -
Adalimumab 142,218 10.10 - - Extendedly
dominated
Certolizumab 142,608 10.16 390 0.06 12,866
Etanercept Not assessed Not assessed Not assessed Not assessed Not assessed
The manufacturer reported more favourable ICERs vs conventional care in the nr-axSpA population
compared to the AS population. This appears largely driven by 2 inputs: (1) the lower

Technology Assessment Report for NICE
TNF-alpha inhibitors for ankylosing spondylitis and nr-axSpA
15/12/2014 132
BASDAI/BASFI scores assumed for responders based on ABILITY-1 (compared to ATLAS) and (2)
the higher annual BASFI progression rate assumed for non-responders/conventional care in the nr-
axSpA population (0.084 vs 0.056).
5.2.2 Overview of UCB (certolizumab) model
The economic model presented by UCB compared the cost-effectiveness of certolizumab vs.
conventional therapy and other licensed anti-TNFs for nr-axSpA and AS. Separate Markov cohort
models were developed for the two indications separately based on the subpopulations of the RAPID-
axSpA trial. Separate analyses were argued to be necessary given that the comparators differed for
each subpopulation. Analyses performed for the AS subpopulation consisted of all patients with AS
from the RAPID-axSpA study, including those who were anti-TNF therapy-experienced or naïve. The
nr-axSpA subpopulation consisted of anti-TNF therapy-naïve patients only, as there were no anti-TNF
therapy-experienced patients in this subpopulation.
The analyses used a lifetime time horizon in the base case. An alternative time horizon of 20 years
was tested in a scenario analysis. An NHS & PSS perspective was used and an annual discount rate of
3.5% was applied to costs and outcomes. All costs are reported at 2013 values.
The model consists of a short-term component and a longer term component to estimate lifetime
costs-effectiveness. The duration of the short-term component varied between the models used for the
AS and the nr-axSpA subpopulations based on the response endpoint assumed. Response was
assessed at 24 weeks in the AS subpopulation which was argued by the manufacturer to be in
accordance with clinical practice as indicated key British opinion leaders. For the nr-axSpA
subpopulation, response assessment was assumed at 12 weeks since comparator data were only
available at that time point. In their base-case, the manufacturer used ASAS20 to determine response
in line with the primary outcome measure in the RAPID-axSpA. However, it should be noted that
ASAS 20 response at week 12 was the primary outcome in the RAPID-axSpa trial. Hence, while the
measure of response used is in accordance with the primary outcome of the RAPID-axSpA trial, the
differential timing of this applied across the separate populations clearly deviates from this. This has
potential issues since at week 16, patients were allowed an ‘early escape’ from placebo and hence
results at week 24 used for the AS subpopulation are no longer based on the original randomised
population.
ASAS 20 response rates for certolizumab and relative treatment effects for the other anti-TNFs were
derived based on a separate systematic review and MTC. The base-case model inputs applied in the
manufacturer submission are replicated (and associated footnotes) in Tables 40 and 41 below.

Technology Assessment Report for NICE
TNF-alpha inhibitors for ankylosing spondylitis and nr-axSpA
15/12/2014 133
Table 40 - Base case model inputs: ASAS20 response at Week 24 (AS subpopulation, CZP pooled
dosing§)
Treatment ASAS20 Response (%) SE RR† CI Source
CZP ****** ***** - - MTC
Adalimumab† - - **** ************ MTC
Etanercept† - - **** ************ MTC
Golimumab† - - **** ************ MTC
Infliximab† - - **** ************ MTC
ASAS: Assessment in SpondyloArthritis international Society (criteria); CC: Conventional care; CI: Confidence interval; CZP: Certolizumab pegol; MTC: Mixed treatment comparison; RR: Relative risk; SE: Standard error * proportion responding § Based upon pooled CZP 200 mg Q2W and 400 mg Q4W arms from RAPID-axSpA †CZP versus comparator
Table 41 - Base case model inputs: ASAS20 response at Week 12 (nr-axSpA subpopulation, CZP pooled
dosing§)
Treatment† ASAS20 Response (%) SE RR† CI Source
CZP ****** **** - - MTC
Adalimumab† - - **** ************ MTC
Etanercept† - - **** ************ MTC
ASAS: Assessment in SpondyloArthritis international Society (criteria); CC: Conventional care; CI: Confidence interval; CZP: Certolizumab pegol; MTC: Mixed treatment comparison; RR: Relative risk; SE: Standard error * proportion responding § Based upon pooled CZP 200 mg Q2W and 400 mg Q4W arms from RAPID-axSpA †CZP versus comparator
The MTC was also used to determine change in baseline BASFI and BASDAI scores. The base-case
inputs for change from baseline in BASFI and BASDAI at Week 24 for the AS subpopulation
reported by the manufacturer are replicated in Tables 42 and 43. The manufacturer noted that the
mean change from baseline reported in the tables is that observed per trial arm, which includes both
the ASAS20 responders and non-responders in each arm. In order to determine the change in BASFI
and BASDAI for responders alone, the manufacturer used the equation below:
Mean change in BASFI = (change in BASFI amongst ASAS20 responders * proportion
ASAS20 responders) + (change in BASFI amongst ASAS20 non-responders * proportion
ASAS20 non-responders)
This approach assumed that the change in BASFI (and BASDAI) amongst ASAS20 non-responders is
equal to that of the conventional care (CC) arm. Thus, the equation is used to algebraically solve for
change in BASFI (and BASDAI) amongst ASAS20 responders. The manufacture stated that “As an
example for the AS subpopulation base case, the change in BASFI amongst ASAS20 responders for
CZP is: **************************************. Thus, in this example, the actual change
from baseline in AS responders to CZP is *****. The same approach was used for change from
baseline for BASDAI. This approach, where the change from baseline for BASDAI and BASFI is

Technology Assessment Report for NICE
TNF-alpha inhibitors for ankylosing spondylitis and nr-axSpA
15/12/2014 134
calculated amongst responders only, is consistent with previous evaluations pharmaco-economic
evaluations conducted for AS.” (p69-70, manufacturer submission)
Table 42 - Base case model inputs: Change from baseline in BASFI score at Week 24 (AS subpopulation,
CZP pooled dosing§)
Treatment Change from Baseline in BASFI Score at Week
24: Initial Response Assessment Period
Source
Mean SD
CZP ***** **** MTC
Adalimumab ***** **** MTC
Etanercept ***** **** MTC
Golimumab* ***** **** MTC*
Infliximab ***** **** MTC
Conventional care** *** *** Assumed zero in base case**
BASFI: Bath Ankylosing Spondylitis Functional Index; CZP: Certolizumab pegol; MTC: Mixed treatment comparison; SD: Standard deviation § Based upon pooled CZP 200 mg Q2W and 400 mg Q4W arms from RAPID-axSpA * GOL assumed same values as ADA, given that specific input values for BASFI at 24 weeks were not available from MTC. ** Conventional care assumed to produce no change in BASFI score initially in the base case. As noted in main text, it is reasonable to assume patients receiving CC do not achieve a change from baseline (worsening or improvement) in BASDAI or BASFI as evidence from RAPID-axSpA, ATLAS and ABILITY-1 demonstrate that in the PBO arms of these studies where patients were essentially maintained on CC, patients did not achieve MCID for BASDAI or BASFI.
46, 52, 63 Furthermore,
Dougados and colleagues describe CC regimens as “palliative at best, providing no alteration of the disease process”. This assumption is consistent with previous manufacturers’ submissions to NICE in AS. However, a mean change in BASFI of *************** estimated from the MTC was used in the sensitivity analysis.
Table 43 - Base case model inputs: Change from baseline in BASDAI score at Week 24 (AS
subpopulation, CZP pooled dosing§)
Treatment Change from Baseline in BASDAI Score at Week
24: Initial Response Assessment Period
Source
Mean SD
CZP ***** **** MTC
Adalimumab ***** **** MTC
Etanercept ***** **** MTC
Golimumab ***** **** MTC
Infliximab ***** **** MTC
Conventional care* *** *** Assumed zero in base case*
BASDAI: Bath Ankylosing Spondylitis Disease Activity Index; CZP: Certolizumab pegol; MTC: Mixed treatment comparison; SD: Standard deviation § Based upon pooled CZP 200 mg Q2W and 400 mg Q4W arms from RAPID-axSpA * Conventional care assumed to produce no change in BASDAI score initially in the base case. As noted in main text, it is reasonable to assume patients receiving CC do not achieve a change from baseline (worsening or improvement) in BASDAI or BASFI as evidence from RAPID-axSpA, ATLAS and ABILITY-1 demonstrate that in the PBO arms of these studies where patients were essentially maintained on CC, patients did not achieve MCID for BASDAI or BASFI. Furthermore, Dougados and colleagues describe CC regimens as “palliative at best, providing no alteration of the disease process”. This assumption is consistent with previous manufacturers’ submissions to NICE in AS.
2 However, a mean change in BASDAI of
*************** estimated from the MTC was used in the sensitivity analysis.
The manufacturer base case inputs for change from baseline in BASFI and BASDAI at Week 12 for
the nr-axSpA subpopulation are replicated in Tables 44 and 45 – all footnotes supplied by the
manufacturers are reported in their entirety for further clarification, although supporting references
have been removed here.
Table 44 - Base case model inputs: Change from baseline in BASFI score at Week 12 (nr-axSpA
subpopulation, CZP pooled dosing§)

Technology Assessment Report for NICE
TNF-alpha inhibitors for ankylosing spondylitis and nr-axSpA
15/12/2014 135
Treatment Change from Baseline in BASFI Score at Week
12:Initial Response Assessment Period
Source
Mean SD
CZP ***** **** MTC
Adalimumab ***** **** MTC
Etanercept ***** **** MTC
Conventional care* *** **** Assumed zero in base case*
BASFI: Bath Ankylosing Spondylitis Functional Index; CZP: Certolizumab pegol; MTC: Mixed treatment comparison; SD: Standard deviation § Based upon pooled CZP 200 mg Q2W and 400 mg Q4W arms from RAPID-axSpA
* Conventional care assumed to produce no change in BASFI score initially in the base case. As noted in main text, it is reasonable to assume patients receiving CC do not achieve a change from baseline (worsening or improvement) in BASDAI or BASFI as evidence from RAPID-axSpA, ATLAS and ABILITY-1 demonstrate that in the PBO arms of these studies where patients were essentially maintained on CC, patients did not achieve MCID for BASDAI or BASFI. Furthermore, Dougados and colleagues describe CC regimens as “palliative at best, providing no alteration of the disease process” This assumption is consistent with previous manufacturers’ submissions to NICE in AS. However, a mean change in BASFI of *************** estimated from the MTC was used in the sensitivity analysis.
Table 45 - Base case model inputs: Change from baseline in BASDAI score at Week 12 (nr-axSpA
subpopulation, CZP pooled dosing§)
Treatment Change from Baseline in BASDAI Score at Week
12: Initial Response Assessment Period
Source
Mean SD
CZP ***** **** MTC
Adalimumab ***** **** MTC
Etanercept ***** **** MTC
Conventional care* *** *** Assumed zero in base case*
BASDAI: Bath Ankylosing Spondylitis Disease Activity Index; CZP: Certolizumab pegol; MTC: Mixed treatment comparison; SD: Standard deviation § Based upon pooled CZP 200 mg Q2W and 400 mg Q4W arms from RAPID-axSpA
* Conventional care assumed to produce no change in BASDAI score initially in the base case. As noted in main text, it is reasonable to assume patients receiving CC do not achieve a change from baseline (worsening or improvement) in BASDAI or BASFI as evidence from RAPID-axSpA, ATLAS and ABILITY-1 demonstrate that in the PBO arms of these studies where patients were essentially maintained on CC, patients did not achieve MCID for BASDAI or BASFI. Furthermore, Dougados and colleagues describe CC regimens as “palliative at best, providing no alteration of the disease process”. This assumption is consistent with previous manufacturers’ submissions to NICE in AS. However, a mean change in BASDAI of *************** estimated from the MTC was used in the sensitivity analysis.
The manufacturer submission assumed no change in BASDAI and BASFI for conventional care
during the response period. The manufacturer justified this assumption with reference to evidence
from RAPID-axSpA, ATLAS and ABILITY-1 studies, although no specific data were reported to
support this. In addition, we requested additional data from the manufacturer on change scores
conditional on response for certolizumab and placebo from the RAPID-axSpA trial but this was not
provided. Hence, it is not possible to adequately assess the appropriateness of the method of
adjustment used by the manufacturer to estimate change scores or the assumption applied to
conventional care. However, it might be reasonable to assume that the actual conditional scores from
RAPID-axSpa are unlikely to be higher than those reported here for certolizumab, since the
manufacturer would presumably have responded to the request for the additional data if this had been
the case.
These change scores are assumed to be maintained for BASDAI as long as a patient continues to
receive an anti-TNF. For AS patients on conventional care, an additional annual increase of 0.07

Technology Assessment Report for NICE
TNF-alpha inhibitors for ankylosing spondylitis and nr-axSpA
15/12/2014 136
points (scale 0-10) in BASFI is assumed and justified by the manufacturer according to the
assumptions deemed reasonable by a previous NICE committee. Hence, while the change scores are
assumed constant, the absolute difference between patients receiving anti-TNFs and conventional care
is increasing over time given the underlying progression assumed for BASFI for patients receiving
conventional care. The assumption of no progression in BASFI for patients receiving anti-TNFs is not
explicitly discussed within the manufacturer’s submission, nor are separate results provided for
alternative assumptions.
The same annual rate (0.07) in BASFI progression for conventional care is also applied to the nr-
axSpA subpopulation. In addition, it is assumed that some nr-axSpA patients may progress to AS
during their course of treatment. The manufacturer’s model adopts an estimate for disease
progression for the nr-axSpA subpopulation based on a German cohort of axSpA patients, the German
Spondyloarthritis Inception Cohort (GESPIC). In this cohort, the rates and predictors of radiographic
spinal progression over two years were estimated based on mSASSS. 7.4% of the 95 nr-axSpA
patients were reported to show spinal radiographic progression, which was defined as a worsening of
mSASSS by ≥2 units over two years. As this 7.4% progression represents a proportion it was
converted to a rate for use in the economic model, assuming an exponential distribution through the
following formula:
1-0.074 = exp(-rate*2 years); rate = 0.0384 or 3.84 per 100 pt-year
The manufacturer’s submission is not explicit about how this additional aspect of progression
subsequently alters the BASDAI/BASFI trajectories within the nr-axSpA model. However,
examination of the electronic model submitted by the manufacturer reveals that once patients are
assumed to show spinal radiographic progression, they effectively become AS patients by picking up
the same absolute values of BASDAI and BASFI (on and off treatment) applied in their AS
subpopulation model. The justification for this approach and the values subsequently assigned are not
formally discussed by the manufacturer and the validity of the approach appears questionable (i.e.
given other differences e.g. disease duration, severity of radiographic disease etc, that may differ
between the two populations even after radiographic progression has occurred in the nr-axSpA
subpopulation)..
Patients who subsequently withdrew from TNF-alpha treatment at any time point were assumed to
revert back to the same trajectory as conventional care over a 6-month period (i.e. rebound back to
conventional care/natural history). A constant annual rate of discontinuation of 7% was assumed for
all Anti-TNFs over the longer-term period in both the AS and nr-axSpA populations. The estimate of
7% applied to the AS subpopulation was justified by citing the rate apparently assumed by the NICE
committee for TA143 and the lack of long-term evidence more generally. This estimate was referred

Technology Assessment Report for NICE
TNF-alpha inhibitors for ankylosing spondylitis and nr-axSpA
15/12/2014 137
to earlier in the review section of our report when the additional analyses undertaken by the NICE
DSU were considered. Identical assumptions for discontinuation rates were assumed for the nr-axSpA
subpopulations, although no justification was provided by the manufacturer.
BASDAI and BASFI scores were used jointly to estimate quality of life in both subpopulations based
on EQ-5D data collected in the RAPID-axSpA study. Data from subjects having EQ-5D, BASDAI
and BASFI scores available at baseline, Week 12 and Week 24 were used to estimate a relationship
between utility and BASDAI and BASFI. Utilities were subsequently converted using a logistic
transformation with the justification based on possible floor and ceiling effects since they are bounded
by 0 and 1. Without access to the original data to it is not possible to determine the impact of this
transformation, although it should be noted that EQ-5D is not bounded by 0 (i.e. negative values are
possible). The manufacturer used a repeated-measures logistic regression to model the relationship
between utility and BASDAI, and BASFI scores.
The relationship between BASFI and costs, derived from the OASIS study and used by the previous
independent assessment group in TA143, was applied in the base-case. Costs of drug, administration,
initiation and monitoring were included. The costs and or HRQoL of adverse events were not
included. Discounting was applied at 3.5% for both costs and outcomes. Uncertainty surrounding
outcomes was addressed using PSA.
Base-case results from UCB (certolizumab) model
The main base-case ICER results from the manufacturer are summarised in Table 46 for the AS
population, together will a fully-incremental comparison of ICERs (Table 47). The ICERs vs
conventional care ranged from £16,647 per QALY (certolizumab) and £42,671 per QALY
(infliximab). In the fully incremental analysis, certolizumab dominated (i.e. less costly and more
expensive) all other TNF-alpha treatments apart from infliximab. However, it should be noted that the
costs of certolizumab are based on a PAS which has been proposed but is not yet formally agreed with
the Department of Health and NICE. Results without the PAS were not reported by the manufacturer.
UCB will make Cimzia available free of charge to all NHS patients for the first three months of
therapy, at which point clinical response should be clear. Only after this three month stage will the
NHS be charged for continuing to use this therapy.
The ICER of certolizumab was £16,647 per QALY vs conventional care and the ICER for infliximab
was £113,871 (vs certolizumab).
Table 46 - TNF -alpha inhibitors compared to conventional care for AS - UCB (base-case)
Total costs (£) Total QALYs Incremental
costs (£)
Incremental
QALYs
ICER (£)
Conventional care ******* **** * * -

Technology Assessment Report for NICE
TNF-alpha inhibitors for ankylosing spondylitis and nr-axSpA
15/12/2014 138
Adalimumab ******* **** ****** **** 19,932
Certolizumab ******* **** ****** **** 16,647
Etanercept ******* **** ****** **** 19,272
Golimumab ******* **** ****** **** 19,049
Infliximab ******* ***** ****** **** 42,671
Table 47 - Fully incremental comparison of anti-TNFs for AS – Assessment Group analysis based on UCB
(base-case)
Total costs (£) Total QALYs Incremental
costs (£)
Incremental
QALYs
ICER (£)
Conventional care ******* **** * * -
Certolizumab ******* **** ****** **** 16,647
Golimumab ******* **** * * Dominated
Adalimumab ******* **** * * Dominated
Etanercept ******* **** * * Dominated
Infliximab ******* ***** ****** *** 113,871
The main base-case ICER results from the manufacturer are summarised in Table 48 for the nr-axSpA
population, together will a fully-incremental comparison of ICERs (Table 49). In contrast to the
results for AS, there was a more marked difference between the ICERs of the alternative anti-TNFs
and conventional care. The ICERs vs conventional care ranged from £15,615 (certolizumab) to
£50,692 per QALY (etanercept). The higher differential ICERs appears to be largely due to the more
heterogeneous trials included in the MTC for the nr-axSpA populations and a higher differential effect
assumed for certolizumab vis-à-vis the other alternative anti-TNFs compared with the AS population.
Importantly, other manufacturers (Pfizer) argue that the results for certolizumab in this population
maybe confounded by population characteristics which could invalidate the indirect comparison of
certolizumab versus the other comparator treatments in the current nr-axSpA MTC. In the fully
incremental analysis, certolizumab dominated adalimumab and etanercept.
Table 48 - TNF -alpha inhibitors compared to conventional care for nr-axSpA - UCB (base-case)
Total costs (£) Total QALYs Incremental
costs (£)
Incremental
QALYs
ICER (£)
Conventional care ******* **** * * -
Adalimumab ******* ***** ****** **** 30,370
Certolizumab ******* ***** ****** **** 15,615
Etanercept ******* **** ****** **** 50,692

Technology Assessment Report for NICE
TNF-alpha inhibitors for ankylosing spondylitis and nr-axSpA
15/12/2014 139
Table 49 - Fully incremental comparison of anti-TNFs for nr-axSpA – Assessment Group analysis based
on UCB (base-case)
Total costs (£) Total QALYs Incremental
costs (£)
Incremental
QALYs
ICER (£)
Conventional care ******* **** * * -
Certolizumab ******* ***** ****** **** 15,615
Etanercept ******* **** * * Dominated
Adalimumab ******* ***** * * Dominated
5.2.3 Overview of Pfizer (etanercept) model
The economic model submitted by Pfizer compared the cost-effectiveness of etanercept vs.
conventional therapy and other licensed anti-TNFs for AS, nr-axSpA and a combined population
(axSpA). The results for the combined population are not summarised in this review but are reported
separately in the manufacturer submission. The model is based on a lifetime time-horizon and costs
and benefits are discounted at an annual rate of 3.5%. The reference year for costs was reported to be
2014.
The model was based on a patient-level simulation model based on a discrete event simulation (DES).
The analysis was conducted from an NHS/PSS perspective. Data to populate the model were derived
from key clinical trials for etanercept and results of a clinical systematic review, MTC and in a
separate analysis presented for the nr-axSpA population, a match adjusted indirect comparison
(MAIC). The model structure was reported to be developed in accordance with current OMERACT
(Outcome Measures in Rheumatology) guidance and was constructed around BASDAI and BASFI in
line with other published studies.
The AS population was defined based on current NICE guidance in TA143 and TA233. The nr-
axSpA population was defined based on the scope issued by NICE and was defined by the
manufacturer as people with severe axial spondyloarthritis without radiographic evidence of
ankylosing spondylitis but with objective signs of inflammation, whose disease has responded
inadequately to, or who are intolerant to, NSAIDs.
An important aspect of the submission for the nr-axSpA population was an attempt to adjust analyses
for differences in the baseline patient characteristics between the trials included. The manufacturer
reported that:
“The clinical systematic review identified that the baseline characteristics of nr-axSpA patients within
the randomised controlled trials of certolizumab pegol and adalimumab were heterogeneous, and
potentially differed in characteristics that could act as treatment effect modifiers. Furthermore, the
populations of these trials also included sizable proportions of AS patients who were originally

Technology Assessment Report for NICE
TNF-alpha inhibitors for ankylosing spondylitis and nr-axSpA
15/12/2014 140
classified as nr-axSpA on the basis of a difference between centralised and localised readings of x-
rays
To address the differences in the proportions of AS patents in the trials due to reclassification upon
central assessment, analyses were conducted using match adjusted indirect comparison (MAIC) and
simulated treatment comparison (STC) techniques that incorporated AS patients from the etanercept
314-EU trial. These analyses are referred to collectively as “analyses adjusting for differences in
study baseline characteristics”. A comparison of the results from the MAIC and STC approaches
show that while the results of the two analyses are similar, when considering comparisons between
etanercept and both adalimumab and certolizumab, the MAIC analysis provides a lower overall
comparative estimate of the benefit of etanercept, and is therefore considered overall to be the more
conservative of the two approaches. To maintain consistency in the analysis utilised in the economic
section, the MAIC was used throughout as the adjusted comparative efficacy measure between
etanercept versus adalimumab and etanercept versus certolizumab. For the analysis comparing
etanercept against certolizumab pegol, it was possible to address the issue of patient reclassification
and differences in baseline characteristics by utilising the RAPID-axSpA trial results that were also
available at the level of AxSpA patients, an approach not possible in the comparison of etanercept
versus adalimumab. We note that although not explicitly detailed within the scope, the AxSpA
population encompasses both nr-axSpA and AS patients, thus making it a relevant comparison to the
decision problem outlined in the scope.” (p226-227, manufacturer submission)
The manufacturer argued that the use of DES conferred potential advantages in relation to modelling
non-linearity due to heterogeneous patient characteristics and in relation to modelling time
dependency. The latter was also argued as an advantage to considering the impact of sequential
therapy which was argued to be complex within a more conventional Markov type structure. Pfizer’s
model was the only model which explicitly explored issues of treatment sequences. However, in the
base-case the use of second-line TNF-alpha inhibitor treatment was restricted to those patients who
withdrew due to adverse events and assumed equal efficacy to 1st line usage. The schematic of the
model provided by the manufacturer is replicated in Figure 6:

Technology Assessment Report for NICE
TNF-alpha inhibitors for ankylosing spondylitis and nr-axSpA
15/12/2014 141
Figure 6 – Pfizer DES model schematic
Etanercept RCT data were used to predict an initial 12-week response (in terms of reduction in
BASDAI and BASFI) for etanercept for both nr-axSpA and AS populations. Separate multivariate
regressions were used to account for correlation between BASDAI and BASFI. A range of variables
were initially included in the regression models based on potential predictors of response identified
from their review of economic studies. The statistical significance and direction of effect were
evaluated before final models were specified. The 12-week models of BASDAI and BASFI for the nr-
axSpA had R-squared values of *****************, respectively. For the AS population, the
equivalent R-squared values were *****************. The regressions were used to estimate mean
change in BASDAI and BASFI which through the patient level simulation were used to assign
patients into BASDAI50 responder/non-responder categories and to assess the associated magnitude
of change at 12 weeks for these categories.
Relative effects from the MTC (or MAIC in the analyses adjusting for differences in study baseline
characteristics), in terms of mean differences in BASDAI and BASFI, were applied in order to predict
equivalent response and change scores for the other anti-TNFs agents and conventional care at 12
weeks

Technology Assessment Report for NICE
TNF-alpha inhibitors for ankylosing spondylitis and nr-axSpA
15/12/2014 142
From week 12, the BASFI scores for conventional care were assumed to increase at a rate of 0.7 units
per annum (0-100 scale). The modelling of change in BASDAI and BASFI at Week 48 for responders
to etanercept was conducted using the same approach used for the Week 12 treatment response.
However, change in BASDAI and BASFI from baseline at Week 12 were included as additional
covariates within the resulting models in order to ensure that an individual’s response at Week 48 was
dependent on their response at Week 12. The 48-week models of BASDAI and BASFI for the nr-
axSpA had R-squared values of *****************, respectively. For the AS population, the
equivalent R-squared values were *****************. In the absence of relative effect estimates at
Week 48 for other therapies, it was assumed that patients who remained on TNF-alpha inhibitor
treatment beyond week 12 (i.e. responders) would converge at the BASDAI and BASFI levels
predicted for etanercept by week 48. Constant BASDAI and BASFI scores for TNF-alpha inhibitor
responders were assumed at the level observed at Week 48 for subsequent periods.
Treatment discontinuation was modelled by fitting separate parametric survival curves to long-term
open-label study data from etanercept for the AS and nr-axSpA populations. In order to predict
treatment cessation in the population likely to continue treatment after 12 weeks, parametric curves
were fitted only to subjects who achieved a BASDAI 50 response at Week 12. Only subjects who
were randomised to etanercept at baseline were retained within these survival analyses and subjects
who began etanercept during open-label phases of studies were excluded. The distributions that
provided the best fit were exponential (********************) and log-normal
(**********************), based on the minimisation of the AIC and the BIC. The exponential
model was chosen based, in part, on the goodness of fit but also because the use of hazard ratios
which were applied to estimate the effect of other anti-TNFs on the rate of discontinuation, required
the use of a proportional hazard survival model (to avoid making further assumptions when applying
the hazard ratio to the log-normal [accelerated failure time] model).
The same risk of discontinuation was applied to all individuals in the model. The models of
discontinuation translate into annual probabilities of discontinuation for etanercept, for patients who
achieve a BASDAI 50 response, of 5% and 11% for nr-axSpA and AS populations, respectively.
Based on data from the DANBIO registry, it was assumed that other anti-TNFs have an increased risk
of discontinuation compared with etanercept; a hazard ratio of 1.3 is applied for infliximab and 1.12
for adalimumab. In the absence of evidence for golimumab and certolizumab, it was assumed that the
relative effect is the same as for adalimumab on the basis that these have common molecular structure
and belong to monoclonal antibodies.
After discontinuation of the first treatment, an alternative TNF-alpha inhibitor was modelled as
second-line treatment for patients who discontinued due to adverse events (****% for AS and ****%

Technology Assessment Report for NICE
TNF-alpha inhibitors for ankylosing spondylitis and nr-axSpA
15/12/2014 143
for nr-axSpA). The same efficacy as applied for first-line treatments was assumed for second-line
treatments for patients switching due to adverse events. For patients who discontinued due to loss of
efficacy, no further TNF-alpha treatment was modelled. These assumptions were considered by the
manufacturer to be consistent with current NICE guidance. For the base case model, it was assumed
that following discontinuation from anti-TNFs, patients would rebound back to their baseline
BASDAI and BASFI scores and that the rebound takes 6 months based on the approach used within
the TA233 submission to NICE.
In the absence of previously published studies reporting the relationship between BASDAI/BASFI
and EQ-5D utility scores in the nr-axSpA population, a de-novo relationship was estimated from study
1031; variables included age, gender, baseline BASDAI and BASFI. OLS regression models were
used, with standard errors clustered around each subject to account for repeated observations. For
consistency a similar relationship was estimated for the AS population using study 314-EU.
Alternative linear and non-linear relationships were evaluated and final model selection based on AIC
statistics. In the nr-axSpA population, the final model included squared terms for BASDAI and
BASFI and an interaction between BASDAI and BASFI, while in the AS population, the covariates
for the interaction term, age and male were not included. Scenario analyses considered using
alternative model specifications for mapping. The manufacturer reported that according to visual
inspection, the estimated models were very similar between populations and reported a high degree of
similarity between the results of the de-novo estimated models and those published previously.
Figures 7 and 8 replicate the relationships reported by the manufacturer between EQ-5D, BASDAI
and BASFI in the nr-axSpA and AS populations, respectively. Additional figures were also presented
by the manufacturer for predicted versus observed EQ-5D in each of the populations. The
manufacturer concluded that the models over-predicted EQ-5D at low observed EQ-5D and under-
predicted at higher observed EQ-5D values. The manufacturer argued that this was a common feature
of mapping algorithms and argued that the approach would be conservative towards the use of anti-
TNFs.
Figure 7 - Relationships between EQ-5D, BASDAI and BASFI from study 1031 (nr-axSpA population)

Technology Assessment Report for NICE
TNF-alpha inhibitors for ankylosing spondylitis and nr-axSpA
15/12/2014 144
Figure 8 - Relationships between EQ-5D, BASDAI and BASFI from study 314-EU (AS population)
The manufacturer included the acquisition, administration and pre-treatment monitoring costs of TNF
alpha-inhibitors. Subsequent monitoring costs were not included in order to avoid potential double
counting of the costs which were estimated as a function of BASDAI and BASFI. In the base-case
analysis the manufacturer used data from Rafia et al, 2012158
based on BASDAI scores only. A
categorical approach was applied to BASDAI scores based on the following annual costs:
BASDAI<40=£151.96; 40<=BASDAI<60=£311.08; BASDAI>=60= £1039.16. The manufacturer
justified the use of this source as it provides the most recent UK specific data reported and permitted
separation of particular cost items. The costs and HRQoL of adverse events (serious infections only)
were included in the base-case analysis (none observed in the nr-axSpA trial 1031, however, serious
infections were observed in the AS trial 314-EU). A separate sensitivity analysis included the costs of
serious infections.
An SMR of 1 for the nr-axSpA population and 1.5 for the AS population were applied to general
population life-tables.
Results of Pfizer (etanercept) model
The main base-case ICER results from the manufacturer are summarised in Table 50 for the AS
population, together will a fully-incremental comparison of ICERs (Table 51). The ICERs vs
conventional care ranged from £19, 586 per QALY (certolizumab) and £37,741 per QALY
(infliximab). In common with the UCB model, it should be noted that the costs of certolizumab
assumed within Pfizer’s model were also based on the PAS for certolizumab which has been proposed

Technology Assessment Report for NICE
TNF-alpha inhibitors for ankylosing spondylitis and nr-axSpA
15/12/2014 145
but is not yet formally agreed with the Department of Health and NICE. Hence the ICER for
certolizumab vs conventional care without the PAS will be higher than the estimates reported here.
Table 50 - TNF -alpha inhibitors compared to conventional care for AS – Pfizer (base-case)
Total costs (£) Total QALYs Incremental
costs (£)
Incremental
QALYs
ICER (£)
Conventional care 18,122 7.318 - - -
Adalimumab 57,535 9.203 39,413 1.885 20,909
Certolizumab 51,843 9.040 33,721 1.722 19,586
Etanercept 60,338 9.334 42,216 2.016 20,938
Golimumab 62,698 9.412 44,576 2.094 21,288
Infliximab 98,340 9.443 80,218 2.125 37,741
In the fully incremental analysis, adalimumab was extendedly dominated. Of the remaining non-
dominated treatments, the ICER of the next most costly intervention compared with the previous non-
dominated alternative was: £19,586 (certolizumab vs conventional care), £28,834 (etanercept vs
certolizumab), £30,376 (golimumab vs etanercept) and £1,131,181 (infliximab vs golimumab).
Table 51 - Fully incremental comparison of anti-TNFs for AS – Assessment Group analysis based on
Pfizer (base-case)
Total costs (£) Total QALYs Incremental
costs (£)
Incremental
QALYs
ICER (£)
Conventional care 18,122 7.318 - - -
Certolizumab 51,843 9.040 33,721 1.722 19,586
Adalimumab 57,535 9.203 - - Extendedly dominated
Etanercept 60,338 9.334 8,495 0..294 28,834
Golimumab 62,698 9.412 2,360 0.078 30,376
Infliximab 98,340 9.443 35,642 0.031 1,131,181
The main base-case ICER results from the manufacturer are summarised in Table 52 for the nr-axSpA
population, together will a fully-incremental comparison of ICERs (Table 53). The ICERs vs
conventional care ranged from £23,195 (etanercept) and £23,575 (certolizumab). In contrast to the
UCB analysis, the ICERs for the nr-axSpA population were marginally less favourable than the
results for the AS population. There was also less of a marked difference between the ICERs for each
of the anti-TNFs and conventional care compared to the UCB results, although a large difference was
evident relating to the magnitude of the incremental QALY estimates for certolizumab vis-à-vis the
other anti-TNFs. Table 54 reports the results of the fully incremental analysis. None of the anti-TNFs
were ruled out via dominance or extended dominance and the ICER of each comparison remained
below £30k per QALY for each successively more expensive and effective treatment.
Table 52 - Anti-TNFs compared to conventional care for nr-axSpA - Pfizer (base-case)

Technology Assessment Report for NICE
TNF-alpha inhibitors for ankylosing spondylitis and nr-axSpA
15/12/2014 146
Total costs (£) Total QALYs Incremental
costs (£)
Incremental
QALYs
ICER (£)
Conventional care 20,609 10.221 - - -
Adalimumab 62,667 12.030 42,058 1.809 23,242
Certolizumab 74,282 12.497 53,673 2.276 23,575
Etanercept 59,635 11.903 39,026 1.682 23,195
Table 53 - Fully incremental comparison of for nr-axSpA – Assessment Group analysis based on Pfizer
(base-case)
Total costs (£) Total QALYs Incremental
costs (£)
Incremental
QALYs
ICER (£)
Conventional care 20,609 10.221 - - -
Etanercept 59,635 11.903 39,026 1.683 23,195
Adalimumab 62,667 12.030 3,033 0.127 23,871
Certolizumab 74,282 12.497 11,615 0.467 24,864
To address the concerns noted by Pfizer relating to the heterogeneity across the different trials in the
nr-axSpA population, a separate matched indirect comparison was presented for etanercept vs
adalimumab. A separate comparison was also presented vs certolizumab for the combined axSpA
population in the manufacturer submission. Using the MAIC approach, the ICER for etanercept vs
adalimumab was £23,195 per QALY. Total cost and QALYs estimates were reversed in the MAIC
approach when compared to the base-case analysis (adalimumab generated greater QALYs at
increased cost), demonstrating the potential impact of trying to minimise observable sources of
possible confounding.
Table 54 - Incremental results of etanercept vs adalimumab in nr-axSpA (using MAIC data) - Pfizer
Total costs (£) Total QALYs Incremental
costs (£)
Incremental
QALYs
ICER (£)
Adalimumab 48,494 11.473 - - -
Etanercept 60,404 11.928 11,910 0.455 26,176
MAIC = matching adjusted indirect comparison
5.2.4 Overview of MSD (golimumab, infliximab) model
The economic models submitted by MSD compared the cost-effectiveness of golimumab and
infliximab vs. conventional therapy and other licensed anti-TNFs for AS. Although the manufacturer
made separate submissions for golimumab and infliximab, the model structures and data sources used
to inform the economic models are identical across the submissions. Hence, this review focuses on the
specific submission for golimumab but also considers key data sources and assumptions specific to
infliximab. The model base-case is based on a lifetime time-horizon (approximately 60 years) and
costs and benefits are discounted at an annual rate of 3.5%. An NHS & PSS perspective is used for
costs. The reference year for costs was reported to be 2012/13.

Technology Assessment Report for NICE
TNF-alpha inhibitors for ankylosing spondylitis and nr-axSpA
15/12/2014 147
The economic model submitted by the manufacturer for golimumab is based on the same model
structure submitted as part of NICE TA233 and summarised previously in the review section
(Armstrong et al, 2013)154
. Hence, a description of the structure of the model is not repeated in this
section. In summary, the manufacturer’s cost-effectiveness model was based on a short-term decision
tree (based on an assessment of BASDAI 50 response at 12 weeks in the base-case) and a longer term
Markov model.
The proportion of patients achieving BASDAI50 at week 12 (+/-2 weeks) for each TNF-alpha
inhibitor was obtained from a systematic review and MTC undertaken by the manufacturer. Their
results are summarised in Table 55.
Table 55 – ORs and probability of BASDAI50 response to anti-TNFs and conventional therapy (MSD)
Treatment BASDAI50
OR (95% CrI) Probability
Golimumab 5.54 (2.12-12.13) 0.49
Infliximab 22.44 (2.78-89.05) 0.79
Adalimumab 5.20 (2.14-10.62) 0.47
Etanercept 5.46 (2.03-11.74) 0.60
Certolizumab pegol 6.62 (1.66-17.59) 0.53
Conventional therapy - 0.15
OR = odds ratio, CrI = credible interval
Data from the GO-RAISE trial and the open-label extension period (up to week 108) were used to
develop predictive equations of mean change from baseline in BASDAI and BASFI scores over time.
2 separate equations were developed based on the 24 week data (0-24 weeks) for all patients and post-
24 week (week 24 to 108) data from GO-RAISE for patients who remained on treatment. The
variables applied in each equation are summarised below in Tables 56 and 57.
Table 56 - Short-term regression equations used by MSD for BASDAI/BASFI (0-24 weeks) – all patients
Variable Parameter Standard error
BASFI
Intercept 0.1008 0.557
Age -0.0284 0.009874
Baseline BASFI 0.1780 0.05429
Treatment 1.8096 0.2551
Male 0.04156 0.2767
Week^(-2) 5.226 0.2767
Treatment × week^(-2) -14.6396 2.2699
BASDAI
Intercept 0.4685 0.8126
Age -0.03399 0.0105
Baseline BASDAI 0.2212 0.08436
Treatment 2.0620 0.2742
Male 0.2652 0.2953
Week^(-2) -3.4664 2.1365
Treatment × week^(-2) -7.1029 2.6887
Table 57 - Long-term regression equations used by MSD for BASDAI/BASFI (24-108 weeks) –
responders only

Technology Assessment Report for NICE
TNF-alpha inhibitors for ankylosing spondylitis and nr-axSpA
15/12/2014 148
Variable Parameter Standard error
BASFI
Intercept 0.4933 0.7364
Age -0.03915 0.01321
Baseline BASFI 0.5706 0.07292
Male 0.6523 0.4001
Log (week) 0.09524 0.04938
BASDAI
Intercept 0.6277 1.0303
Age -0.03531 0.01367
Baseline BASDAI 0.5762 0.1055
Male 0.2196 0.4094
Log (week) 0.2196 0.06908
The treatment coefficient (and interaction term) in the short-term regression equation is used to
estimate separate BASDAI/BASFI scores for anti-TNFs and conventional care. Hence, up week to
week 24, the same estimate of BASDAI/BASFI appears to be applied to all-TNFs (i.e. regardless of
the differential response rates assumed). Beyond week 24, the same BASDAI/BASFI score is applied
to a responder to any of the TNFs, although a different response rate for each TNF-alpha inhibitor is
assumed based on the MTC. The BASDAI/BASFI regressions are applied to responders who continue
on TNF-alpha inhibitor therapy up to week 108 for BASDAI and up to week 108 for BASFI.
BASDAI and BASFI scores beyond week 108 for responders who continue to receive anti-TNFs
beyond this period in the model are assumed to remain constant (at the week 108 value). BASFI
scores beyond week 256 for responder who continue to receive anti-TNFs beyond this period in the
model are assumed to remain constant (at the week 108 value) but are also subject to an annual
progression rate of BASFI at this point which is set to half the rate of conventional care in the baseline
(0.035 units per annum – 0-10 scale). The justification for this is not explicitly made by the
manufacturer. For the base case model, BASFI scores for conventional care patients on conventional
therapy are assumed to progress at a rate of 0.07 units per year after week 24.
An annual discontinuation rate of 6.1% is applied for the entire time horizon after week 12 in the base
case analysis. This estimate is derived from data reported between weeks 24 to week 256 in the 50mg
arm of golimumab from the GO-RAISE extension period. The manufacturer does not formally state
whether this is specific to those patients who were identified to be responders at 12 weeks or not.
However, it appears to be based on all patients who continued to receive golimumab beyond 24 weeks
regardless of their response status. The same discontinuation rate is applied to all TNF-alpha inhibitor.
Following discontinuation from anti-TNFs, the BASFI and BASDAI scores are assumed to
deteriorate/rebound over a 24-week period back to their baseline BASFI and BASDAI score (i.e.
rebound equal to gain). Therefore, in common with other models which apply this rebound
assumption, patients are assumed to achieve a lifetime benefit from treatment with anti-TNFs for
BASFI.

Technology Assessment Report for NICE
TNF-alpha inhibitors for ankylosing spondylitis and nr-axSpA
15/12/2014 149
Utilities were derived from a NICE technology appraisal (TA 143) and incorporated age, sex, BASFI
and BASDAI. Costs included in the model comprised drug acquisition, short-term (12 week) costs,
longer term disease costs and adverse events. Longer term disease costs were based on BASFI scores
from the GO-RAISE trial using the same regression equation used for NICE TA143.
The proportion of males and females recruited in the GO-RAISE trial is used to estimate a weighted
average mortality risk by gender. The gender-specific SMR for AS from a study by Bakland et al
(2011)18
is applied to the mortality rates from the general population to calculate adjusted mortality
rates for AS patients in the model. The study by Bakland reported an SMR of 1.63 (95% CI: 1.29-
1.97) for males and 1.38 (95% CI: 0.48-2.28) females.
Results of MSD (golimumab, infliximab) model
The main base-case ICER results from the manufacturer are summarised in Table 58 for the AS
population, together will a fully-incremental comparison of ICERs (Table 59). The ICERs vs
conventional care ranged from £19,070 (golimumab) to £42,532 (infliximab). In the fully incremental
analysis, golimumab and certolizumab were the non-dominated anti-TNFs. The ICER for golimumab
vs conventional care was £19,070 and for certolizumab vs golimumab was £21,441 per QALY.
Table 58 Anti-TNFs compared to conventional care for AS – MSD (base-case)
Total costs (£) Total QALYs Incremental
costs (£)
Incremental
QALYs
ICER (£)
Conventional care 160,837 10.5529 - - -
Adalimumab 181,589 11.6296 20,752 1.0766 19,275
Certolizumab 183,017 11.6962 22,180 1.1432 19,401
Etanercept 183,540 11.5862 22,703 1.0332 21,972
Golimumab 181,427 11.6326 20,590 1.0797 19,070
Infliximab 208,856 11.6819 48,019 1.1290 42,532
Table 59 - Fully incremental comparison of anti-TNFs for AS – Assessment Group analysis based on
Pfizer (base-case)
Total costs (£) Total QALYs Incremental
costs (£)
Incremental
QALYs
ICER (£)
Conventional care 160,837 10.5529 - - -
Golimumab 181,427 11.6326 20,590 1.0797 19,070
Adalimumab 181,589 11.6296 - - Dominated
Certolizumab 183,017 11.6962 1590 0.0636 21,441
Etanercept 183,540 11.5862 - - Dominated
Infliximab 208,856 11.6819 - - Dominated

Technology Assessment Report for NICE
TNF-alpha inhibitors for ankylosing spondylitis and nr-axSpA
15/12/2014 150
5.2.5 Summary and critique of de-novo cost-effectiveness submissions
In general the manufacturer models appeared to be constructed to a high-standard and it is evident that
significant work had been undertaken by each to identify and utilise previously published studies and
to exploit existing individual patient data from their own RCTs and open-label extension periods to
generate estimates which were appropriate for the requirements of the model.
Despite the different model structures and assumptions applied across the various manufacturer
submissions, the ICERs reported for the anti-TNFs vs conventional care were remarkably consistent
in the AS population. Table 60 presents a summary of the ICER reported by each manufacturer for
each of the anti-TNFs vs conventional care. The figures reported in bold indicate which specific TNF-
alpha inhibitor has the lowest ICER vs conventional care in each of the manufacturer submissions. It
is perhaps expected that the majority of manufacturer’s reported the lowest ICER vs conventional care
for their own products. The only exception to this is Pfizer, whose model estimated the lowest ICER
vs conventional care for certolizumab in this population (etanercept was the next lowest). Although it
should be noted that Pfizer included the proposed PAS costs for certolizumab which was not
universally applied across the different manufacturer submissions. Hence, although differences
between the ICER vs conventional care were quite similar, the variation in approaches employed by
each manufacturer appears partially driven by maximising any potential comparative advantage
considered vis-à-vis other manufacturer products (i.e. in terms of assumptions made about similarities
and differences for response rates, magnitude of changes in BASDAI and BASFI and withdrawal
rates). However, it should be noted that no manufacturer makes a strong claim regarding differential
efficacy between the alternative anti-TNFs which is borne out in the relatively small differentials
reported between the different products in each of the submissions.
Table 60 - Comparison of manufacturer ICER estimates vs conventional care (AS population)
AbbVie
(Adalimumab)
UCB
(Certolizumab)
Pfizer
(Etanercept)
MSD
(Golimumab,
Infliximab)
ICER (£) ICER (£) ICER (£) ICER (£)
Conventional care - - - -
Adalimumab 16,391 19,932 20,909 19,275
Certolizumab 17,067 16,647 19,586 19,401
Etanercept 16,897 19,272 20,938 21,972
Golimumab 16,535 19,049 21,288 19,070
Infliximab 44,448 42,671 37,741 42,532
Table 61 presents a summary of the ICERs reported by each manufacturer for each of the anti-TNFs
vs conventional care for the nr-axSpA population. There appears much more heterogeneity across the

Technology Assessment Report for NICE
TNF-alpha inhibitors for ankylosing spondylitis and nr-axSpA
15/12/2014 151
manufacturer submissions compared to the AS population. Again, the figures reported in bold
indicate which specific TNF-alpha inhibitor has the lowest ICER vs conventional care in each of the
manufacturer submissions. There appears an almost two-fold difference in the ICERs reported across
the submissions for each of the anti-TNFs. Importantly, there also appears variation across the
populations with more favourable ICERs reported vs conventional care for the nr-axSpA population
vis-à-vis the estimates by AbbVie (both adalimumab and certolizumab) and UCB (certolizumab only).
Hence, the differences in structural and parameter assumptions appear more evident in the results for
the nr-axSpA population compared to results for the AS population.
Table 61 - Comparison of manufacturer ICER estimates vs conventional care (nr-axSpA population)
AbbVie
(Adalimumab)
UCB
(Certolizumab)
Pfizer
(Etanercept)
ICER (£) ICER (£) ICER (£)
Conventional care - - -
Adalimumab 13,228 30,370 23,242
Certolizumab 12,866 15,615 23,575
Etanercept Not Assessed 50,692 23,195
To assist in identifying possible reasons for the differences between populations, a summary of the
key structural assumptions used by each manufacturer are provided in Tables 62 and 63. A more
micro-level of comparison of specific parameter estimates is reported separately in Appendix 14.
Table 62 - Model structure and key structural assumptions - AS population
Parameter
MSD economic
model
(Infliximab,
Golimumab)
AbbVie economic
model
(Adalimumab)
UCB economic
model
(Certolizumab)
Pfizer economic
model (Etanercept)
Model type Decision tree
followed by
Markov model
Markov model Markov model Patient-level
simulation model
(discrete event
simulation [DES])
Time horizon Lifetime 40 years Lifetime Lifetime
Response criteria BASDAI50
response at week
12
ASAS20 response at
week 12
ASAS20 response at
week 24
BASDAI50 response
at week 12
Response criteria
justification
Efficacy outcome
in GO-RAISE
study;
recommended by
the ASAS
Working Group
(Keat 2005)159
Primary endpoint of
ATLAS study
ASAS20 is the
primary endpoint of
RAPID-axSpA study
Based on the current
NICE definition of
treatment response
(TA143)

Technology Assessment Report for NICE
TNF-alpha inhibitors for ankylosing spondylitis and nr-axSpA
15/12/2014 152
Progression assumption BASDAI
Anti-TNFs responders Constant after week
108
Constant after week
260
Constant after week
24
Constant after week
48
Anti-TNFs non-
responders
Constant Constant Constant Constant
Conventional care Constant after week
24
Constant Constant Constant after week
12
Progression assumption BASFI
Anti-TNFs responders Constant after week
108; 0.035 after
week 256
Constant after week
260
Constant after week
24
Constant after week
48
Anti-TNFs non-
responders
0.07 0.056 0.07 0.07
Conventional care 0.07 after week 24 0.056 0.07 0.07 after week 12
Rebound assumption Rebound to baseline Rebound to baseline Rebound to
conventional
therapy
Rebound to baseline
Rebound assumption
duration
Over a 6 month
period
Immediately
Over a 6 month
period
Over a 6 month
period
Placebo response 14.5% at week 12;
Loss or maintenance
of placebo response
not reported.
BASDAI and
BASFI return to
baseline at week 12
No placebo
response
BASDAI and
BASFI return to
baseline at 12 weeks
Table 63 - Model structure and key structural assumptions – nr-axSpA population
Parameter
AbbVie economic
model
(Adalimumab)
UCB economic
model
(Certolizumab)
Pfizer economic
model (Etanercept)
Model type Markov model Markov model Patient-level
simulation model
(discrete event
simulation [DES])
Time horizon 40 years Lifetime Lifetime
Response criteria ASAS40 response at
week 12
ASAS20 response at
week 12
BASDAI50 response
at week 12
Response criteria
justification
Primary endpoint of
ABILITY-1 study
Primary endpoint of
RAPID-axSpA study
Based on the current
NICE definition of
treatment response
(TA143)
Progression assumption BASDAI
Anti-TNFs responders Constant after week
140
Constant after week
12
Constant after week
48
Anti-TNFs non-
responders
Constant Constant Constant

Technology Assessment Report for NICE
TNF-alpha inhibitors for ankylosing spondylitis and nr-axSpA
15/12/2014 153
Conventional care Constant Constant Constant after week
12
Progression assumption BASFI
Anti-TNFs responders Constant after week
140
Constant after week
12
Constant after week
48
Anti-TNFs non-
responders
0.084 0.07 Constant/0.07
Conventional care 0.084 0.07 0.07 after week 12
Rebound assumption Rebound to baseline Rebound to
conventional therapy
Rebound to baseline
Rebound assumption
duration
Immediately
Over a 6 month
period
Over a 6 month
period
Placebo response BASDAI and
BASFI return to
baseline at week 12
No placebo response BASDAI and
BASFI return to
baseline at 12 weeks
In general it is difficult to identify the specific factors which can easily explain differences within and
between the 2 populations across the manufacturer submissions. In general, similar model structures
were applied by each manufacturer across the separate populations. However, it is evident that there
are important differences based on a number of key structural issues: (i) the response criteria and
timing applied; (ii) the magnitude of change scores and particularly the assumption concerning the
time at which these were assumed to ‘level off’ (generally longer in the AS populations due to the
longer open-label extension periods); (iii) the underlying rate of progression of BASFI with
conventional care and the impact of anti-TNFs on this rate and (iv) the rebound assumption and
timing of this.
Given the complex inter-relationship between these structural assumptions and subsequent parameter
estimates, it is difficult to identify single specific reasons for differences. However, the structural
differences clearly lead to marked differences in the BASDAI and BASFI scores estimated over time
by each manufacturer for each population. Figures 9 to 11 provide a graphical summary of the cohort
BASDAI and BASFI score, for the AS population, from three of the manufacturers. These highlight
the significant differences in subsequent parameter estimates applied at a cohort level. Equivalent
estimates are not presented for the Pfizer model due to the complexities of generating this data from
the DES model. BASDAI and BASFI scores are only presented here for the case made by each
manufacturer for their own product.

Technology Assessment Report for NICE
TNF-alpha inhibitors for ankylosing spondylitis and nr-axSpA
15/12/2014 154
Figure 9 - Comparison of cohort BASDAI/BASFI scores for AS population from AbbVie model
(adalimumab)
Figure 10 - Comparison of cohort BASDAI/BASFI scores for AS population from UCB model
(certolizumab)

Technology Assessment Report for NICE
TNF-alpha inhibitors for ankylosing spondylitis and nr-axSpA
15/12/2014 155
Figure 11 - Comparison of cohort BASDAI/BASFI scores for AS population from MSD model
(golimumab/infliximab)
Tables 64 and 65 summarise the mean difference in BASDAI and BASFI scores applied to responders
to anti-TNFs and those applied to conventional care at various time points in each model. The table
clearly highlights the range of different values applied across the separate manufacturers. This further
emphasises the variation in approaches, sources and assumptions.
Table 64 - BASDAI score difference for treatment responders vs conventional care - AS Population
Time Adalimumab vs
CC
Certolizumab vs
CC
Infliximab/Golimumab vs
CC
12 weeks -2.98 * -2.01
24 weeks -4.42 ***** -2.05
1 year -4.9 ***** -2.77
3 years -5.23 ***** -2.83
5 years -5.31 ***** -2.83
10 years -5.31 ***** -2.83
20 years -5.31 ***** -2.83
40 years -5.31 ***** -2.83

Technology Assessment Report for NICE
TNF-alpha inhibitors for ankylosing spondylitis and nr-axSpA
15/12/2014 156
Table 65 - BASFI score difference for responders vs conventional care - AS Population
Time Adalimumab vs
CC
Certolizumab
vs CC
Infliximab/Golimumab vs
CC
12
weeks -2.03 * -1.68
24
weeks -3.28 ***** -1.74
1 year -3.71 ***** -2.49
3 years -4.25 ***** -2.59
5 years -4.25 ***** -2.66
10 years -4.53 ***** -2.85
20 years -5.09 ***** -3.18
40 years -6.21 ***** -3.75
The equivalent figures and tables are reported below for the nr-axSpA population.
Figure 12 - Comparison of cohort BASDAI/BASFI scores for nr-axSpA population from AbbVie model
(adalimumab)

Technology Assessment Report for NICE
TNF-alpha inhibitors for ankylosing spondylitis and nr-axSpA
15/12/2014 157
Figure 13 - Comparison of cohort BASDAI/BASFI scores for nr-axSpA population from UCB model
(certolizumab)
Table 66 - BASDAI score difference for responders vs conventional care - nr-axSpA Population
* = certolizumab patients who remain nr-axSpA and do not transition to AS
Time Adalimumab vs
CC
Certolizumab* vs
CC
12 weeks -3.89
*****
24 weeks -5.54
*****
1 year -5.42
*****
3 years -5.99
*****
5 years -5.99
*****
10 years -5.99
*****
20 years -5.99
*****
40 years -5.99
*****

Technology Assessment Report for NICE
TNF-alpha inhibitors for ankylosing spondylitis and nr-axSpA
15/12/2014 158
Table 67 - BASFI score difference for responders vs conventional care - nr-axSpA Population
Time Adalimumab vs
CC
Certolizumab* vs
CC
12 wk -2.95
*****
24 wk -4.11
*****
1 year -4.12
*****
3 years -4.55
*****
5 years -4.72
*****
10 years -5.14
*****
20 years -5.98
*****
40 years -7.66
*****
* = certolizumab patients who remain nr-axSpA and do not transition to AS
The differences across manufacturers and between the populations are further illustrated by the
summary of key parameter inputs reported in Appendix 14. As well as reporting the main parameter
inputs, the appendix also explores differences in approaches at a parameter level for key inputs (e.g.
withdrawal, costs etc).
It is evident from these comparisons that there are significant differences across the manufacturers in
terms of key structural and parameter estimates. While it might appear reassuring that these
differences do not appear to lead to significant differences across the ICER estimates reported for the
AS population, the greater heterogeneity reported in the ICER estimates for the nr-axSpA is clearly an
issue. However, even within the AS population, any reassurance that one might have in relation to the
robustness and appropriateness that these estimates have for informing NHS practice needs to be
carefully considered in relation to the key conceptual issues and concerns highlighted in Section 5.1.4
described in relation to previously published cost-effectiveness studies. Despite significant work
undertaken by each manufacturer in support of existing and new indications for their products, it is
particularly concerning that many of the key conceptual issues and concerns appear not to have been
fully addressed. Indeed many of these issue seem not to have been addressed at all, such that many
models still seem reliant on the use of open-label extension data (and even more so with the extended
follow-up reported in the AS population) without any formal consideration of the potential issues with
selection that the use of these studies inevitably are subject to. Consequently, the benefits of anti-
TNFs are being projected over significant periods of time without any evidence on the counterfactual
(i.e. what happens to patients who don’t enter into the open-label extension periods? What happens to
patients who subsequently withdraw from anti-TNFs? And what would have happened to patients
over a longer-time horizon who didn’t receive anti-TNFs?).
It appears that much of the case being made concerning the cost-effectiveness of the anti-TNFs rests
on comparison of single arm studies (the subject of open-label data) and retrospective comparisons

Technology Assessment Report for NICE
TNF-alpha inhibitors for ankylosing spondylitis and nr-axSpA
15/12/2014 159
against historical cohorts (as the counterfactual, for patients not on treatment, is unknown). While
such a comparison may be necessitated by the short-term nature of the double-blind periods, the lack
of a more detailed consideration of the appropriateness of the comparisons being made in relation to
sources of natural history data (and subsequent assumptions made concerning the BASDAI/BASFI
trajectories of the different patient categories) is concerning and, hence, current ICER estimates
reported by the manufacturers must be considered to be both speculative and highly uncertain.
Many of these problems can be related to whether BASDAI and BASFI scores provide an appropriate
conceptual basis for modelling the chronic and progressive nature of AS and nr-axSpA. Hence,
current models appear largely driven by data availability (i.e. the extensive evidence which has been
generated and continues to be generated investigating the relationship between BASDAI/BASFI and
costs/utilities) rather than trying to develop a clearer underlying biological or clinical process which
may better characterise the disease and subsequent progression across the separate populations.
Until such time that sufficient data linking costs and utilities to other measures are reported, it seems
inevitable that models will continue to be driven largely by BASDAI and BASFI scores over time
together with assumptions concerning the longer-term effect of anti-TNFs. However, given the nature
of existing models and the reliance on uncontrolled longer-term follow-up of anti-TNFs and
comparison with historical ‘controls’ (particularly in relation to BASFI progression over time and the
assumptions being made concerning the potential disease modification properties of anti-TNFs in both
AS and nr-axSpA populations), it is surprising that greater efforts have not been made by the
manufacturers to try to more formally link to the increasing evidence base being generated in relation
to radiographic progression in the AS population.
It is also surprising that more thought has also not been given to characterising the potential difference
in BASFI progression across the separate populations and how generalisable assumptions maybe
between these. The result is that many of the key assumptions concerning whether the anti-TNFs are
primarily symptom control treatments or whether they are also potential disease modifiers remains
implicitly dealt with within existing submissions. The result is that several manufacturers employ
identical assumptions across populations with respect to BASFI progression and the effect of the anti-
TNFs. Interestingly, only one manufacturer appears to employ differential rates of BASFI progression
across the populations (AbbVie), although the same structural assumption concerning the effect of
anti-TNFs is still made. Interestingly, this manufacturer applies a higher rate of change in BASFI for
patients receiving conventional care in the nr-axSpA population vis-à-vis the AS population.
However, while such a difference is interesting, the basis of and implication for this differential is not
fully explained or justified by the manufacturer.

Technology Assessment Report for NICE
TNF-alpha inhibitors for ankylosing spondylitis and nr-axSpA
15/12/2014 160
The issue of intermittent and sequential use of anti-TNFs remain important clinical questions but the
existing models do not provide a robust basis for informing these decisions. The cost-effectiveness of
intermittent therapy vs continuous therapy was not formally considered in any model identified.
However, it could be argued that such a comparison might be deemed outside the scope of a NICE
appraisal. Although one manufacturer (Pfizer) explored the potential cost-effectiveness of sequential
therapy, much of this has been done via assumptions (e.g. assuming equal efficacy 2nd
line in patients
who discontinue 1st line due to an AE) or via adjustments applied to 1
st line efficacy estimates based
on ‘real-world’ evidence reported from large scale registries (which typically show anti-TNFs to be
clinically effective but with lower response rates than reported in naïve patients). Consequently,
existing attempts to model sequential therapy are largely based on applying adjustments to 1st line
efficacy data using observational evidence which are clearly subject to potential confounding. In large
part, the limitations of existing cost-effectiveness models for informing these clinical questions
appears less a function of the models themselves but rather that robust clinical data to date has not
been generated to inform unbiased estimates of relative efficacy of alternative strategies for using the
anti-TNFs.
The following sections report the development of a de-novo model to address some of the key issues
and uncertainties which have been identified in this review. Section 6 reports the results of an
extended synthesis which has been developed to provide a more generalizable framework for
synthesising clinical efficacy data ensuring that appropriate estimates are generated for the model
which make use of all relevant and available evidence. This is followed in Section 7 by a description
of the de-novo model (York model) which attempts to link this framework to a more coherent
conceptual model of the chronic and progressive nature of AS and nr-axSpA.

15/12/2014 161
6 Independent economic assessment: Extended synthesis
Existing evidence on the short term clinical effectiveness of anti-TNF drugs has been presented and
discussed in Section 4. The methods of evidence synthesis are extended in this section to more
directly address the decision problem and the parameter inputs required for the economic model.
There were two specific aims to these analyses. Firstly we aimed to more formally explore the
differences between individual anti-TNF treatments to inform the most appropriate assumption for the
economic model (i.e. equivalence or drug specific differences). Within Section 4 of this report, the
assumption of independent treatment effects was evaluated alongside the assumption of a common
(equal) treatment effect across anti-TNFs, for every outcome of interest. Whilst there is no evidence
that supports differences in the effectiveness of these drugs, assuming equal effectiveness means that
the trials are pooled as if the same drug had been trialled – this leads to an arguably overly precise
estimate of effect for the class of drugs. For this reason, we explore an additional scenario where
treatments are assumed to have a similar, but not equal, effectiveness. That is, there are differences
between the effectiveness of treatments that we may not be able to explain but that we should
consider.
The second aim was to generate appropriate effect size estimates and their associated uncertainty to
inform the main input parameters of the economic model by synthesising together evidence on
BASDAI and BASFI outcomes jointly. Initially, we considered the two related BASDAI outcomes
relevant to the decision model reported in the effectiveness evidence available – changes in BASDAI
scores over a certain period of time and a probability of response to BADSDAI50 (that is, a 50%
change in the BASDAI score in relation to baseline). BASDAI50 is important as patients are expected
to discontinue anti-TNFs if, at 12 weeks, they have not been able to achieve response to this criterion
(according to NICE guidance).1, 2
Changes in BASDAI scores observed at this same time point
determine the magnitude of initial response to treatment, and have often been used in economic
modelling as the basis for extrapolating treatment effects. Given these outcomes are both central to
informing effect parameters in the decision model, a synthesis model that considers the relation
between these two outcomes provides a more consistent and coherent basis for informing these
parameters.
We developed a synthesis model that pools evidence on the change in BASDAI by considering both
those studies that report this measure directly and also those that report the proportion of patients
achieving a BASDAI50 response. We expressed BASDAI50 as a function of the absolute change in
BASDAI and we use this relationship in the extended synthesis. We also aim to simultaneously
synthesise information on BASFI score, a measure that is used together with BASDAI score to
determine the long term QALY and cost burden of the disease in the economic model. Treatments
improving AS symptoms are expected to affect both disease activity and function, and thus we expect

Technology Assessment Report for NICE
TNF-alpha inhibitors for ankylosing spondylitis and nr-axSpA
15/12/2014 162
a reduction in both BASDAI and BASFI scores – this mean we expect changes to these two measures
to be correlated. Extending the synthesis modelling to consider BASFI scores not only allows all
relevant evidence to contribute to the synthesis, but also ensures that all measures are synthesised
together to reflect the expected correlations between the two outcomes. Uncertainty is also more
appropriately quantified than synthesising each outcome separately.
In the decision model, prognosis, costs and QALY are determined by absolute BASDAI and BASFI
scores. Given that treatment continuation is determined by response to BASDAI50 at 12 weeks, it is
important for the economic model to estimate the absolute change in BASDAI and BASFI separately
for responders and non-responders, i.e. the conditional scores. However, the published clinical
effectiveness evidence does not report the conditional scores. Consequently, we requested the
conditional data from the pivotal trials in both the AS and nr-axSpA indications from each
manufacturer. These data were subsequently provided by AbbVie, Pfizer, and MSD for their pivotal
trials but not UCB. Hence information on the conditional scores was only available for select trials
and not for all drugs. In view of the limited data available on the conditional scores, another important
extension of the synthesis approach was the evaluation of these. We used the results from the
extended synthesis model to evaluate the conditional scores by simulating BASDAI and BASFI
scores for two equivalent cohorts of patients the only difference being that one cohort was treated and
the other was not.
This section provides only a summary of these analyses; full details are in Appendices 9, 10 and 11.
We will describe first the approach for the synthesis of evidence on the AS population, followed by
the approaches and results for the nr-axSpA population.
6.1 AS population
6.1.1 Brief description of the data
Based on study population and follow-up (i.e. around 12-week in duration), 16 of the RCTs are
considered directly relevant to the decision problem for the AS population (studies 1 to 16 in Table
68). One of these studies did not report BASDAI or BASFI outcomes (study 3) and thus could not be
included in the analyses. The 15 remaining studies reported at least one outcome measure –
BASDAI50 and/or change from baseline on BASDAI and BASFI scores.

Technology Assessment Report for NICE
TNF-alpha inhibitors for ankylosing spondylitis and nr-axSpA
15/12/2014 163
Table 68: Evidence on BASDAI and BASFI related outcomes for the AS population
Trial name treat N treat N PLA BASDAI50 change BASDAI change BASFI
1 Hu (2012) 1 26 20
X X 2 Huang (2014) 1 229 115 X X X
3 Lambert (2007) 1 38 44
4 ATLAS (2006) 1 208 107 X X
5 RAPID-axSpA (2014) 2 121 57 X X X
6 Barkham (2010) 3 20 20 X X* X*
7 Davis (2003) 3 138 139
X X 8 Dougados (2011) 3 39 43 X X X
9 Gorman (2002) 3 20 20
X 10 Calin (2004) 3 45 39
X X
11 Van der Heijde (2006) 3 305 51 X
12 GO-RAISE (2008) 4 138 78 X
X 13 Bao (2012) 4 108 105 X
X
14 Braun (2002) 5 34 35 X X* X*
15 Marzo-Ortega (2005) 5 28 14
X X* 16 Van den Bosch (2002) 5 9 12
X* X*
* Do not report any measure of dispersion (such as standard deviations)
treat: 1 =ADA, 2=CER (CER200 and/or CER400), 3=ETA (ETA25 and/or ETA50), 4=GOL50 , 5=INF
Note that some studies only report one of the BASDAI measures. For example, the golimumab trials
(studies 12 and 13) only report BASDAI 50 and not the absolute change in this score.
6.1.2 General aspects of implementation and software
The synthesis was conducted from a Bayesian perspective, using WinBUGS (a Markov Chain Monte
Carlo simulation based software for Bayesian inference). For burn-in, we ran 100,000 simulations
and another 100,000 were used in inferences. Convergence was assessed by running two chains and
convergence was assumed if the Gelman Rubin statistic was equal to 1. Goodness of fit was assessed
using the Deviance Information Criterion (DIC), a criterion developed by Spiegelhalter et al (2002)
based on the trade-off between the fit of the data to the model and the complexity of the model.160
Fit
is measured using the deviance, and complexity is included using a measure of the ‘effective number
of parameters’ (i.e. posterior mean deviance minus deviance evaluated at the posterior mean of the
parameters). Models with smaller DIC are better supported by the data, that is, the lower the DIC the
better the data fits the model. In the presence of autocorrelation, the MCMC simulation for inference
was increased to 200,000 and a thin of 20 was applied (yielding a sample for inference of 10000 for
each chain).
The main synthesis models (approaches B and C described next) pooled differences between
treatment and control in change scores from baseline (BASDAI and BASFI). The treatment associated
with the lowest (most negative) mean change score is expected to be best. However, it is important to
quantify the uncertainty around the estimates and for this reason standard deviations were reported
alongside expected values. Where averaged odds ratios are presented, median values instead of means
were used as odds ratios tend to follow a skewed distribution.

Technology Assessment Report for NICE
TNF-alpha inhibitors for ankylosing spondylitis and nr-axSpA
15/12/2014 164
Relative effectiveness estimates for models assuming exchangeability across treatments are based on
the predictive distribution, representing the distribution of the data averaged over all possible
parameter values. This summary statistic best reflects the impact of uncertainty in the parameters of
the model and is here judged as a more appropriate basis to be used in the decision model.161
Where possible, meta-regression analyses were conducted to evaluate potential treatment effect
modifiers. Meta-regression is a tool aimed at examining the impact of variables on effect size using
regression-based techniques. In these explorations, the following baseline characteristics were
considered: BASDAI score, BASFI score, age, gender, duration of symptoms (years) and C-reactive
protein (CRP).
6.1.3 Exploring assumptions for the relative effectiveness of individual anti-TNF treatments
(modelling approach A)
In AS, pivotal trials for the licensed anti-TNFs do not perform head-to-head comparisons with other
agents, but compare the effect of treatments against standard care. These trials show anti-TNFs to be
effective in relation to standard care. In view of the available evidence, previous NICE guidance
(TA1431 and TA233
2) concluded that there was no compelling evidence on which it could reliably
distinguish between the anti-TNFs on the basis of clinical effectiveness when making
recommendations.
Our analysis, based on the most up to date evidence-base, aimed to evaluate anti-TNF drugs using
indirect comparisons across trials. Within this sub-section, alternative assumptions of equivalence in
the effectiveness of anti-TNF treatments will be more formally assessed. Note that at this stage each
outcome was synthesised independently.
Brief description of synthesis methods
In brief, the synthesis model directly aggregates relative treatment effects – i.e. log OR for
BASDAI50 response and the difference between treatment and placebo in change in BASDAI from
baseline (the dataset analysed is shown in Appendix 9). In common with the approach implemented in
Section 4, all outcomes are here assumed normally distributed. We implemented alternative models
that differ in the way treatment effects are considered; a summary of each is presented below.
Model A1 (treatments: independent, studies: FE) – This model considers treatments to be
independent, i.e. assumes the effects to differ between treatments. This is a fixed effect model in that
multiple studies evaluating the same treatment are considered to measure the same treatment effect.
Model A2 (treatments: independent, studies: RE) – This model differs from A1 in that a random
effect is assumed to describe the findings of multiple studies evaluating the same treatment.

Technology Assessment Report for NICE
TNF-alpha inhibitors for ankylosing spondylitis and nr-axSpA
15/12/2014 165
Model A3 (treatments: equal, studies: FE) – This model differs from A1 in that treatments are not
assumed to differ. The model thus evaluates a common relative effectiveness for all anti-TNFs.
Model A4 (treatments: equal, studies: RE) – This model differs from A3 in that a random effect is
assumed to describe the findings of multiple studies evaluating the same treatment.
Model A5 (treatments: exchangeable, studies: FE) – This model differs from A1 in that a random
effect is used to describe any differences between treatments (exchangeability is assumed). This
model thus assumes the treatments to have a similar, but not equal, effectiveness – there are
differences between the effectiveness of treatments that we may not be able to explain but that we
should consider.
There is some evidence that health outcomes may depend on patients’ characteristics such as age,
BASFI score, enthesitis, therapy, CRP and HLA-B27 genotype 162
. There is, however, no evidence on
which factors may modify the effects of treatment with anti-TNFs (note that Lord [2010]163
studied
predictors of BASDAI50 response in patients receiving anti-TNFs, but by not including a placebo arm
this study was not able to evaluate treatment effect modifiers). To our knowledge, previous meta-
analysis of studies in AS have not explored how the effect of treatment may depend on characteristics
of the patients or of their disease. Within this modelling approach we explored potential heterogeneity
in treatment effects using meta-regression (i.e. potential treatment effect modifiers). We did so by
extending the modelling approach in A1 to include treatment effect interactions with baseline
characteristics (centered on their means where relevant). We have explored the inclusion of
alternative covariates by evaluating the DIC associated with alternative models.
Results of modelling approach A
All models implemented synthesise results on each of the outcomes separately. The results of each
modelling approach are shown in Table 69.
Models A1 and A2 consider that anti-TNF have distinct relative effects. Applying the assumptions of
model A1, adalimumab is expected to be the least effective of the set of treatments analysed in terms
of BASDAI50 (the expected OR is 4.71), but in terms of the differences in change scores, it is
certolizumab that is expected to be the least effective, with differences of -1.45 and -1.10 in BASDAI
and BASFI scores respectively. It should be noted that studies on golimumab (studies 12 and 13 in
Table 68) do not report absolute changes in BASDAI scores, and thus using this modelling approach
we were unable to estimate a treatment effect for this outcome measure. Model A2 reports similar
results to model A1, but the standard error of the estimates is slightly higher, reflecting increased
uncertainty due to the use of the random effects to characterise between study results. The DIC is
lower in model A1 (52 vs 57), indicating that model A1 is preferable to A2.

Technology Assessment Report for NICE
TNF-alpha inhibitors for ankylosing spondylitis and nr-axSpA
15/12/2014 166
Table 69: assumptions over the relative effectiveness of anti-TNF treatments – results
A1. A2. A3. A4. A5.
Treat: indep
Studies: FE
Treat: indep
Studies: RE
Treat:
common
Studies: FE
Treat:
common
Studies: RE
Treat:
exchang
Studies: FE (median, SD) (median, SD) (median, SD) (median, SD) (median, SD)
Outcome 1: OR on
BASDAI50
Adalimumab 4.71 (1.00) 4.69 (6.11)
5.21 (0.72) 5.30 (0.98) 5.34 (9.79)
Certolizumab 6.02 (3.33) 6.04 (22.87)
Etanercept 4.73 (1.43) 4.72 (3.32)
Golimumab 5.86 (1.81) 6.10 (7.45)
Infliximab 11.9 (11.94) 12.10 (44.00)
Outcome 2: change in
BASDAI
(mean, SD) (mean, SD) (mean, SD) (mean, SD) (mean, SD)
Adalimumab -1.56 (0.16) -1.57 (0.27)
-1.66 (0.11) -1.67 (0.15)
Certolizumab -1.45 (0.37) -1.46 (0.51)
Etanercept -1.76 (0.20) -1.73 (0.28) -1.70 (0.87)
Golimumab NA NA
Infliximab -2.28 (0.46) -2.27 (-2.28)
Outcome 3: change in BASFI (mean, SD) (mean, SD) (mean, SD) (mean, SD) (mean, SD)
Adalimumab -1.22 (0.18) -1.18 (0.29)
-1.38 (0.11) -1.39 (0.13)
Certolizumab -1.10 (0.37) -1.11 (0.47)
Etanercept -1.48 (0.19) -1.50 (0.24) -1.41 (0.49)
Golimumab -1.45 (0.20) -1.44 (0.29)
Infliximab -2.16 (0.53) -2.17 (0.56)
DIC 52.4 57.0 39.1 44.3 43.6
outcome: 1 OR for BASDAI50, 2 difference between treatment and placebo on change in BASDAI from baseline, 3
difference between treatment and placebo on change in BASFI from baseline
Models A3 and A4 consider the treatments as equal in terms of their effectiveness in each of the 3
outcomes. This means drugs are assumed equally effective and results from trials are pooled together
as if these trials evaluated the same drug, which will return more precise estimates (i.e. less
uncertainty) and interpretations of this evidence may thus be overly confident. The DIC of these
models is substantially lower than that of model A1 and A2, indicating that the data supports the
assumption of equivalence, rather than one of independence. As with models A1 and A2, the random
effect assumption was also not deemed worthwhile.
Model A5 assumes the treatments to have a similar, but not equal, effectiveness – this model
introduces more flexibility than assuming treatment effects to be equal (model A3), but does not fully
assume treatments to differ as in model A1. It does imply that there are differences between the
effectiveness of treatments that we may not be able to explain but that we should consider. These may
be due to differences between the treatments themselves, or because of differences in the design of the
trials used to evaluate each treatment. Ignoring such difference could lead to misrepresenting
uncertainty, with over-precise results. Model A5 shows a slightly higher DIC than model A3, but this
difference is not significant (i.e. lower than 5 units) which means both models represent equally well
the existing data. Given the underlying assumptions, results differ to those of model A3 particularly in
relation to the measures of uncertainty. As expected, results from model A3 are more precise than the

Technology Assessment Report for NICE
TNF-alpha inhibitors for ankylosing spondylitis and nr-axSpA
15/12/2014 167
results of model A5. The results from model A5 in Table 69 relate to the predictive distribution which
reflects uncertainty in all model parameters; in this case, such uncertainty explicitly accounts for the
observed differences in the effects treatments.
Despite our preferred summary from model A5 in this evaluation being the common effect for the
‘class of drugs’ (Table 69), the assumption of treatment effects being drug specific may still retain
some plausibility. From model A5, drug specific estimates can be retrieved (Table 70). Within this
model drug specific inferences will borrow strength from the common class effect and estimates are
thus shrunken towards the mean of this class effect (that is, estimates are closer to the value reported
for the class in Table 2).
Table 70: Shrunken estimates of treatment effect from model A5.
Model A5
Shrunken estimates of
treatment effect for model A5
Outcome 1:
OR on
BASDAI50
Outcome 2:
change in
BASDAI
Outcome 3:
change in
BASFI (median, SD) (mean, SD) (mean, SD)
Adalimumab 5.05 (0.87) -1.60 (0.15) -1.31 (0.16)
Certolizumab 5.42 (1.71) -1.59 (0.26) -1.31 (0.23)
Etanercept 5.13 (1.08) -1.72 (0.17) -1.43 (0.15)
Golimumab 5.47 (1.25) -1.69 (0.84) -1.42 (0.16)
Infliximab 5.70 (3.30) -1.88 (0.34) -1.55 (0.33)
Explorations of heterogeneity suggested only gender to potentially modify the effect of anti-TNF
treatment, specifically for change in BASDAI as outcome; however, when gender is used together
with all covariates, such evidence on effect modification disappears.
Interpretation/discussion
The models implemented above show that there is no significant heterogeneity across trials evaluating
each treatment– i.e. the DIC of model A2 is higher than that of model A1, indicating the use of a
random effect across studies to be unnecessary.
The statistical analysis has also shown the effectiveness of the different treatments to be similar. This
is in line with the published evidence that, in AS, does not demonstrate one anti-TNF treatment to be
significantly more effective than another. Specifically, we implemented a model considering a
common effect for all anti-TNFs when compared to placebo (model A3). This model shows a better
fit than the one estimating a different effect for each anti-TNFs (model A1). However, unless we
believe this assumption to hold AND the trials to be homogeneous in design and in the populations
included, we believe adopting model A3 would misrepresent uncertainty in the estimates.

Technology Assessment Report for NICE
TNF-alpha inhibitors for ankylosing spondylitis and nr-axSpA
15/12/2014 168
For this reason, we evaluated an alternative model (model A5) that assumes treatments to have a
similar (but not equal) effect. In this model, the treatment effects for the anti-TNFs are assumed to
come from a ‘common’ distribution, assumed Normal with a common mean, i.e. a ‘class effect’. This
is an assumption of exchangeability across treatments within the class, which we also refer to as a
random-effect distribution. The DIC for this model is not significantly different to that of model A3,
and allows a more appropriate description of the uncertainty over the effects of anti-TNFs. However,
it should be noted that this model is not explicit about the source of the differences in the effects of
treatments.
The evidence available does not appear to suggest obvious treatment effect modifiers. However,
because only aggregate data were available, the results may be prone to ecological fallacy – where
statistical associations between variables present or absent at the group-level may not be reflective of
associations at the individual level.164
6.1.4 Extending the modelling approach to jointly relate outcomes (modelling approach B)
In the previous section the two outcomes based on BASDAI scores were synthesised separately;
however, BASDAI50 is the probability of having a reduction in BASDAI score of 50%, and thus it
should be possible to relate the proportion of BASDAI50 responders to the change in absolute
BASDAI scores from baseline observed in each study. Such structural constraints should be
incorporated into the synthesis, where possible, by expressing it algebraically.164
Within this section,
we use this structural relation within the synthesis, allowing change scores from baseline to be
informed not only from direct data on this quantity but also from data on BASDAI50 (subsection
1.4.1). We then extend the modelling framework further to consider BASFI outcomes (subsection
1.4.2).
6.1.4.1 Joint synthesis of BASDAI outcomes
The model implemented here pools the change in BASDAI score from baseline to evaluate the
difference between treatment and placebo, using evidence reported in trials directly on the change
scores for each arm and also data on BASDAI50.
The following description briefly explains the approach used to model these data.
Brief description of synthesis methods
Data on the mean change in BASDAI score from baseline, alongside the standard error for this
measure, were assumed normally distributed (likelihood). The mean of this distribution was the
treatment effect, defined as the sum of the change score for the placebo arm plus the difference in
change score for the treatments. Some studies also reported the number of responders to BASDAI 50
(a 50% reduction in BASDAI score), out of the total individuals in the study. The likelihood for the

Technology Assessment Report for NICE
TNF-alpha inhibitors for ankylosing spondylitis and nr-axSpA
15/12/2014 169
BASDAI50 data was expressed as a binomial distribution. The probability parameter of this
distribution was then related to the change score as follows. The BASDAI score at baseline and the
change score were assumed correlated using a bivariate normal distribution. To define the bivariate
distribution a number of quantities were needed. Firstly, the mean score at baseline; this was reported
in the data and was thus assumed known. Secondly, the variability on BASDAI score at baseline was
assumed equal to that of the change score. This was also reported in the data and was thus assumed
known. Finally, the unknown correlation between baseline and change score was estimated within the
model by assuming this quantity was independent of study. The correlation parameter was estimated
separately for placebo and anti-TNF treatment. Under these assumptions, the probability parameter
from BASDAI50 data was expressed algebraically as a function of the change score. For treatment
effects, our preferred approach was to assume a common class effect (i.e. exchangeable effects across
treatments, analogous assumption to model A5 above). See Appendix 9 for a fuller description of the
methods used in analyses.
Results of modelling approach B
The summary results regarding relative treatment effects from this modelling approach are reported in
Table 71 for model B. The treatment effect reported here represents difference between treatment and
placebo on BASDAI score changes from baseline.
Table 71: Modelling approach B: results
estimated assumed* Predicted
Difference in
change score
from baseline
Probability of
having a
BASDAI50
response, placebo
Probability of
having a
BASDAI50
response, anti-
TNF
OR for
BASDAI50
response, anti-
TNF vs. placebo
(mean, SD) (mean, SD) (mean, SD) (median, SD)
Anti-TNFs -1.91 (0.48) 0.10 (--) 0.40 (0.08) 5.94 (4.06)
* This figure is based on a BASDAI baseline score of 6.11 (sd=1.56) and a placebo change score of -0.61 (sd=1.44), which
represent the average across trials (weighted by number of patients)
With model B, we were now able to consider the evidence from trials only reporting information on
BASDAI50 to estimate the change in BASDAI score – an example being evidence on golimumab.
The class effect of anti-TNFs is evaluated to be slightly higher -1.91 (0.48) in comparison to model
A5 [reporting a class effect on the change score of -1.70 (SD=0.87)], reflecting the inclusion of
BASDAI50 evidence. By using the indirect evidence on BASDAI50, model B returns more precise
estimates of the pooled change score than model A5 (standard error of 0.48 in B compared to 0.87 in
A5). This modelling approach, despite pooling absolute change scores, can be used to evaluate
BASDAI50 response for a specific baseline BASDAI score and change score in the placebo arm. We
assumed a baseline BASDAI score of 6.11 (SD=1.56) and a change score for placebo of 0.61
(SD=1.44), which represent the average across trials (weighted by number of patients). According to
these, the assumed probability of having a BASDAI50 response to placebo is evaluated at 0.10. Based

Technology Assessment Report for NICE
TNF-alpha inhibitors for ankylosing spondylitis and nr-axSpA
15/12/2014 170
on the change score evaluated in the synthesis model, the probability of having a BASDAI50 response
when on anti-TNFs is evaluated at 0.40 (SD= 0.08), which results in an OR for BASDAI 50 response
of 5.94 (SD=4.06).
Drug specific (shrunken) estimates from model B are shown in Table 72.
Table 72: Shrunken estimates of treatment effect from model B.
Shrunken estimates of
treatment effect for model B
change in
BASDAI (mean, SD)
Adalimumab -1.77 (0.25)
Certolizumab -2.01 (0.37)
Etanercept -1.88 (0.18)
Golimumab -1.92 (0.30)
Infliximab -2.02 (0.32)
Interpretation/discussion
The current modelling approach, by synthesising together evidence on both BASDAI outcomes, is a
theoretically coherent approach to the synthesis. Moreover, it allows using the whole of the evidence
on this outcome. Also, given these outcomes are to be both used is the decision model, the combined
synthesis model will generate consistent estimates by considering their structural relation explicitly.
The results of modelling approach B show that using information on BASDAI50 alongside direct
evidence on change scores from baseline results in slightly higher estimates of effectiveness when
compared to approach A. There are two possible explanations for this. One is that higher treatment
effects are observed in the trials only reporting BASDAI50 compared to the remaining studies. The
few studies that only report BASDAI50 are studies 11, 12 and 13: these report ORs for BASDAI of,
respectively, 5.9, 4.4 and 10.42. The second possible explanation relates to the assumptions used
when defining the relation between the outcomes in the model. While we expected the model to use
the BASDAI50 evidence in such a way that would exactly predict the value of change score observed
in the sample, we cannot guarantee this is the case as our analysis is based on assumptions over the
distribution of BASDAI scores across patients. Given we did not have access to individual patient
data when developing this relationship, and thus the validity of the assumptions of analysis cannot be
established. The differences observed are, however, not significant and any misspecification of the
model can be thus deemed irrelevant.
6.1.5 Extending the modelling framework to synthesise change in BASFI scores (modelling
approach C)
The models implemented here extend those in subsection 1.4.1 by adding the syntheses of changes in
BASFI score. This is of particular relevance to the economic modelling since BASFI scores are used

Technology Assessment Report for NICE
TNF-alpha inhibitors for ankylosing spondylitis and nr-axSpA
15/12/2014 171
together with BASDAI scores. Given we expect that, within each trial, changes to BASDAI scores to
be related to changes in BASFI scores, this section will model the trial evidence to reflect this
correlation. Figure 14 plots the BASDAI change scores against the BASFI change scores observed in
the trials, showing support for the existence of correlation.
Figure 14: Scatter plot of BASDAI and BASFI change scores observed in the trials (AS).
Brief description of synthesis methods
The data on mean change in BASFI score reported in some of the studies was assumed normally
distributed. The mean of this distribution was the treatment effect, defined as the sum of the change
score for the placebo arm plus the difference in change score for the treatments (analogous to
BASDAI). Treatment effects on BASFI were considered correlated to those on BASDAI across trials.
The variation in treatment effects for both BASDAI and BASFI and the correlation parameter
between these were estimated from the data. As in the previous subsection, we assumed again
exchangeability across the effects of the different treatments (analogous to models ‘5’ in modelling
approach A).
Results of modelling approach C
The results on differences between treatment and placebo on change score form baseline are reported
in Table 73, both for BASDAI and BASFI scores.
Table 73: Modelling approach C: results
estimated assumed* predicted
Difference in
change score
from baseline
Probability of
having a
BASDAI50
response, placebo
Probability of
having a
BASDAI50
response, anti-
TNF
OR for
BASDAI50
response, anti-
TNF vs. placebo
(mean, SD) (mean, SD) (mean, SD) (median, SD)
Effect of anti- -1.95 (0.30) 0.10 (--) 0.41 (0.05) 6.30 (1.56)

Technology Assessment Report for NICE
TNF-alpha inhibitors for ankylosing spondylitis and nr-axSpA
15/12/2014 172
TNFs on BASDAI
Effect of anti-
TNFs on BASFI -1.40 (0.28) -- -- --
* Based on a BASDAI baseline score of 6.11 (sd=1.56) and a placebo change score of -0.61 (sd=1.44), which represent the
average across trials (weighted by number of patients)
Based on the change score evaluated in the synthesis model, the probability of having a BASDAI50
response when on anti-TNFs is evaluated at 0.41 (SD= 0.05), which returns an OR for BASDAI50
response of 6.3 (SD=1.56). Note that estimates on BASDAI treatment effects are more precise than in
modelling approach B, reflecting the support to inferences from the data on BASFI – the correlation
between outcomes observed in the data and allowed in the synthesis model allows inferences in
BASDAI to borrow strength from those on BASFI.
Table 74: Shrunken estimates of treatment effect from model C.
Shrunken estimates of
treatment effect for model C
change in
BASDAI
change in
BASFI (mean, SD) (mean, SD)
Adalimumab -1.89 (0.22) -1.34 (0.17)
Certoluzimab -2.02 (0.28) -1.36 (0.21)
Etanercept -1.94 (0.18) -1.43 (0.16)
Golimumab -1.98 (0.25) -1.42 (0.17)
Infliximab -2.03 (0.27) -1.49 (0.25)
Interpretation/discussion
We hypothesised that treatments improving AS symptoms are expected to affect both disease activity
and function, and thus we expected changes to these two measures to be correlated. We have thus
extended the synthesis model to consider BASFI scores. This not only allows all relevant evidence to
contribute to the synthesis, but also ensures that all measures are synthesised together to reflect the
expected correlations between the two outcomes.
The results obtained with this modelling approach for BASDAI outcomes are similar to those of
modelling approach B, the difference being that estimates are now more precise due to the borrowing
of strength between outcomes.
6.2 nr-axSpA population
This section examines the evidence on the effectiveness of anti-TNFs on the nr-axSpA population.
6.2.1 Brief description of the data
On the nr-axSpA population, 5 RCTs were considered directly relevant to the decision problem
(studies 17 to 21 in Table 75). All studies reported BASDAI and BASFI outcomes and one study did
not report BASDAI 50 (study 21).
Table 75: Evidence on BASDAI and BASFI related outcomes for the nr-axSpA population
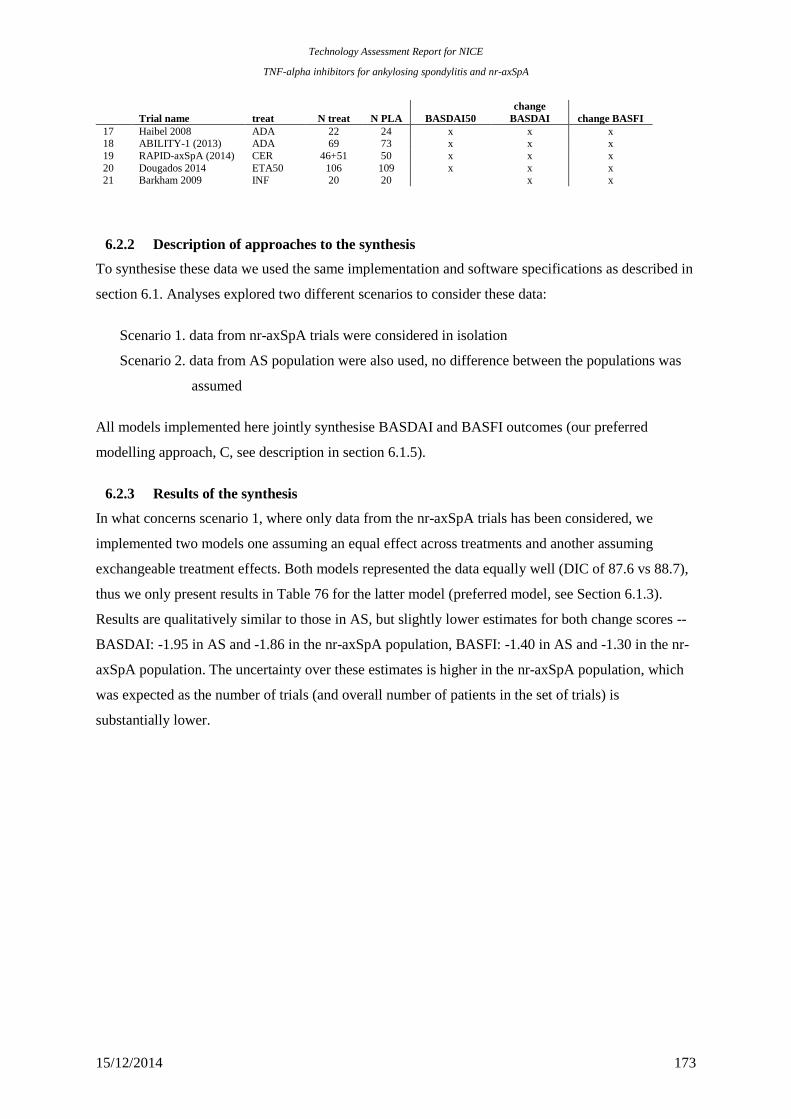
Technology Assessment Report for NICE
TNF-alpha inhibitors for ankylosing spondylitis and nr-axSpA
15/12/2014 173
Trial name treat N treat N PLA BASDAI50
change
BASDAI change BASFI
17 Haibel 2008 ADA 22 24 x x x 18 ABILITY-1 (2013) ADA 69 73 x x x
19 RAPID-axSpA (2014) CER 46+51 50 x x x
20 Dougados 2014 ETA50 106 109 x x x 21 Barkham 2009 INF 20 20
x x
6.2.2 Description of approaches to the synthesis
To synthesise these data we used the same implementation and software specifications as described in
section 6.1. Analyses explored two different scenarios to consider these data:
Scenario 1. data from nr-axSpA trials were considered in isolation
Scenario 2. data from AS population were also used, no difference between the populations was
assumed
All models implemented here jointly synthesise BASDAI and BASFI outcomes (our preferred
modelling approach, C, see description in section 6.1.5).
6.2.3 Results of the synthesis
In what concerns scenario 1, where only data from the nr-axSpA trials has been considered, we
implemented two models one assuming an equal effect across treatments and another assuming
exchangeable treatment effects. Both models represented the data equally well (DIC of 87.6 vs 88.7),
thus we only present results in Table 76 for the latter model (preferred model, see Section 6.1.3).
Results are qualitatively similar to those in AS, but slightly lower estimates for both change scores --
BASDAI: -1.95 in AS and -1.86 in the nr-axSpA population, BASFI: -1.40 in AS and -1.30 in the nr-
axSpA population. The uncertainty over these estimates is higher in the nr-axSpA population, which
was expected as the number of trials (and overall number of patients in the set of trials) is
substantially lower.

Technology Assessment Report for NICE
TNF-alpha inhibitors for ankylosing spondylitis and nr-axSpA
15/12/2014 174
Table 76: nr-axSpA population: results
estimated assumed* predicted
Difference in
change score
from baseline
Probability of
having a
BASDAI50
response, placebo
Probability of
having a
BASDAI50
response, anti-
TNF
OR for
BASDAI50
response, anti-
TNF vs. placebo
(mean, SD) (mean, SD) (mean, SD) (median, SD)
Scenario 1. data from nr-axSpA trials
Effect of anti-
TNFs on BASDAI -1.86 (0.79) 0.20 (--) 0.53 (0.13) 4.39 (6.59)
Effect of anti-
TNFs on BASFI -1.30 (0.84) -- -- --
Scenario 2. data from AS and nr-axSpA trials, no difference between the populations
Effect of anti-
TNFs on BASDAI -1.97 (0.32) 0.20 (--) 0.55 (0.06) 4.94 (1.48)
Effect of anti-
TNFs on BASFI -1.37 (0.3) -- -- --
* Based on a BASDAI baseline score of ************** and a placebo change score of **************), which represent
the results seen in the certolizumab trial (RAPID-axSpA)
When the data from the nr-axSpA trials were considered together with data on AS (scenario 2),
inferences were more precise. Because treatment effects in AS trials are not significantly different to
those observed in the nr-axSpA population, pooled treatment effect estimates do not differ
significantly from those reported in AS.
6.2.4 Interpretation/discussion
The evidence base of the effect of anti-TNFs in the nr-axSpA population consists of 5 trials that
observed 4 treatments and conventional care in a total of 590 patients. The effect measures pooled
across the five trials were not significantly different from the outcomes expected in the AS
population. Thus, it may be reasonable to consider the evidence in nr-axSpA and AS together for
inferences over treatment effects.
6.3 BASDAI and BASFI scores conditional on BASDAI response
We previously highlighted that NICE guidance determines that BASDAI50 at 12 weeks defines
treatment continuation with anti-TNFs in clinical practice. Given much of the evidence on prognosis,
costs and utility scores links to the absolute values of BASDAI and BASFI scores, it is important to
consider absolute changes in BASDAI and BASFI separately for responders and non-responders, i.e.
the conditional scores. However, the published clinical effectiveness evidence does not report the
conditional scores. In this section we use the results from the extended synthesis model to evaluate the
conditional scores by simulating BASDAI and BASFI scores for two equivalent cohorts of patients
one treated with an anti-TNF and the other with conventional therapy.

Technology Assessment Report for NICE
TNF-alpha inhibitors for ankylosing spondylitis and nr-axSpA
15/12/2014 175
Brief description of methods
From the inferences obtained using the synthesis model above it is possible to derive the conditional
change score in responders and non-responders using simulation. Whereas the synthesis focusses on
the pooling of mean estimates of change scores and proportion of responders to BASDAI50, to derive
conditional mean scores there is the need to consider the distributions at the individual patient level.
Hence, conditional scores could not directly be derived from the synthesis, but through a simulation
procedure based on the assumptions and results of the synthesis model. The simulation procedure is
described in detail in Appendix 11. Briefly, we used a simulation sample size of 10000 patients.
Given results depend on the baseline distributions of BASDAI and BASFI and on the change scores
from baseline for placebo, we used the averages across trials (weighted by the number of patients in
each trial) in AS. Baseline BASDAI scores were thus assumed normally distributed with mean 6.11
and standard deviation of 1.56; change from baseline for placebo was simulated from a normal
distribution with mean -0.61 and standard deviation of 1.44. For BASFI, the baseline was assumed to
have a mean of 5.27 and a standard deviation of 1.79 and change from baseline for placebo a mean of
-0.19 and a standard deviation of 0.22. The correlation between baseline BASFI and BASDAI scores
was valued at ***. This value was based on the sample correlation on BASDAI and BASFI at
baseline from etanercept studies (the individual patient data were available in the Excel file for the
etanercept submission; the Spearman correlation coefficient was *** in study 314 in AS and **** in
study 1031 in nr-axSpA).
Results for AS
The conditional change scores derived from the synthesis model (and underlying assumptions) are
reported in Table 77. While it is natural to consider that conditional change in BASDAI scores differ
between respondents and non-respondents, differences in the baseline of respondents and non-
respondents may be less intuitive. These are, however, natural. If we consider two patients that
obtained the same change score in BASDAI from anti-TNF treatment, say -2 units, but one started
with a baseline of 4 and another with a baseline of 5, the first would be considered a responder and the
second would not. For this reason, respondents are expected to have a lower BASDAI than non-
responders. Results of the prediction of conditional scores using the synthesis model are presented in
Table 77.
Results show, as expected, that the change in BASDAI score for respondents in more negative than
the mean change score (-3.86 for the 42% predicted anti-TNF responders vs. -2.63 for all anti-TNF
users; in the control arm, responders were predicted to have a change score of -2.70 vs. -0.66 for all
participants). Non-respondents were still expected to have a negative change score in both arms
revealing some level of symptom control, but this was lower than the mean (1.73 vs. -2.63 for anti-
TNF users and -0.45 vs. -0.66 in control arm). The baseline BASDAI and BASFI were predicted to be

Technology Assessment Report for NICE
TNF-alpha inhibitors for ankylosing spondylitis and nr-axSpA
15/12/2014 176
lower for respondents than non-respondents (for example, the BASDAI baseline for responders to
treatment was 4.76 in respondents when the group baseline was 6.08).
Table 77: Conditional scores predicted for the AS population using the synthesis model
BASDAI BASFI
control Treat control treat
Scenario 1
% responders to BASDAI50 0.10 0.42
Change in score
Responders -2.70 -3.86 -1.41 -3.02
Non-responders -0.45 -1.73 -0.17 -0.63
All -0.66 -2.63 -0.29 -1.64
Baseline
Responders 3.83 4.76 3.42 4.17
Non-responders 6.31 7.03 5.43 6.02
All 6.08 6.08 5.24 5.24
We requested the conditional data from the pivotal trials in AS from each manufacturer. These data
were subsequently provided by several but not all manufacturers (AbbVie, Pfizer, and MSD).
Conditional scores observed in the trials are summarised in Table 78. The results show that there are
some differences between the conditional results predicted using the synthesis and the ones observed
in trials. Differences are especially relevant for the conditional baseline scores – while the synthesis
model predicts, for example, that treated patients that respond have a baseline BASDAI of 4.76 and
those that do not respond a baseline of 7.03, the trials show much smaller differences. Despite
incorporating all evidence available at the aggregate level, the predictive ability of the conditional
baseline score from the synthesis could only be improved if we had access to the IPD as this
methodology is strongly dependent on assumptions over the distribution of scores across patients.

Technology Assessment Report for NICE
TNF-alpha inhibitors for ankylosing spondylitis and nr-axSpA
15/12/2014 177
Table 78: Conditional scores observed in trials in AS
BASDAI BASFI
control Treat control treat
ATLAS trial (adalimumab, study=4)
% responders to BASDAI50 0.16 0.46
Change in score
Conditional on response -4.5 -4.64 -2.74 -2.92
Conditional on non-response -0.2 -0.82 -0.17 -0.72
total -0.90 -2.58 -0.59 -1.73
Baseline
Conditional on response 6.31 6.14 4.50 4.53
Conditional on non-response 6.37 6.35 5.91 5.78
total 6.36 6.25 5.68 5.21
GO-RAISE (golimumab, study =12)
control Treat control treat
% responders to BASDAI50 0.15 0.46
Change in score
Conditional on response -4.25 -4.74 -1.80 -3.03
Conditional on non-response -0.18 -1.22 0.38 -0.53
total -0.81 -2.84 0.05 -1.68
Baseline
Conditional on response 6.52 6.25 3.56 4.45
Conditional on non-response 6.63 6.69 5.39 5.48
total 6.61 6.49 5.11 5.01
314-EU (etanercept, study=11)*
control Treat control treat
% responders to BASDAI50 **** ****
Change in score *
Conditional on response ***** ***** ***** *****
Conditional on non-response ***** ***** ***** *****
total ***** ***** ***** *****
Baseline * *
Conditional on response **** **** **** ****
Conditional on non-response **** **** **** ****
total **** **** **** ***
* Pooled results for etanercept arms (ETN 25 mg twice weekly and ETN 50 mg once weekly).
For adalimumab and etanercept’s trials = week 12 responders, for golimumab = week 14 responders (week 12 data for week
14 responders is available but not reported in the table)
Results for nr-axSpA
The conditional results were also predicted for the nr-axSpA population using both scenarios
implemented of the synthesis model.

15/12/2014 178
Table 79: Conditional scores predicted for the nr-axSpA population using results and assumptions of the
synthesis model
BASDAI BASFI
control Treat control treat
Scenario 1
% responders to BASDAI50 **** ****
Change in score * *
Responders ***** ***** ***** *****
Non-responders ***** ***** ***** ****
All ***** ***** ***** *****
Baseline * *
Responders **** **** **** ****
Non-responders **** **** **** ****
All **** **** **** ****
Scenario 2
% responders to BASDAI50 **** ****
Change in score * *
Responders ***** ***** ***** *****
Non-responders ***** ***** ***** ****
All ***** ***** ***** *****
Baseline * *
Responders **** **** **** ****
Non-responders **** **** **** ****
All **** **** **** ****
* Based on a BASDAI baseline score of *************** a placebo change in BASDAI score of **************), a
BASFI baseline score of ***********) and a placebo change in BASFI score of *************), which represent the
results seen in the certolizumab trial (RAPID-axSpA) .
For this population, conditional data were provided by only two manufacturers (Pfizer, and AbbVie).
Conditional scores observed are summarised in Table 79.
Table 80: Conditional scores observed in trials in nr-axSpA
BASDAI BASFI
control Treat control treat
ABILITY-1 trial (adalimumab, study=18)
% responders to BASDAI50 0.14 0.40
Change in score
Conditional on response -3.9 -4.79 -2.78 -2.75
Conditional on non-response -0.69 -0.55 -0.40 -0.32
total -1.16 -2.23 -0.75 -1.29
Baseline
Conditional on response 5.64 6.21 4.37 3.60
Conditional on non-response 6.46 6.53 4.91 4.97
total 6.34 6.40 4.83 4.43
EU 1031(etanercept, study=20)
control Treat control treat
% responders to BASDAI50 **** ****
Change in score
Conditional on response ***** ***** ***** *****
Conditional on non-response ***** ***** ***** *****
total ***** ***** ***** *****
Baseline * *
Conditional on response **** **** **** ****
Conditional on non-response **** **** **** ****
total **** **** **** ****
Etanercept and adalimumab = week 12 responders, Pfizer only reported results for ETN 50 mg

Technology Assessment Report for NICE
TNF-alpha inhibitors for ankylosing spondylitis and nr-axSpA
15/12/2014 179
Prediction results are consistent with those in AS, and the differences between the conditional results
predicted using the synthesis and the ones observed in trials are also present in this analysis.
Interpretation/discussion
Conditional scores predicted using synthesis model C differ from those seen in the trials. Differences
are probably due to distributional assumptions over the baseline and change scores. Only with access
to the individual patient data such predictions could be improved. Note that the synthesis model itself
does not rely as heavily on such assumptions, and thus any concerns should not be transposed to the
results obtained in sections 6.1 and 6.2.
6.4 Discussion/conclusion
The analyses developed in this section focussed on extending the synthesis evidence on the short-term
clinical effectiveness of anti-TNF drugs in Section 4 that considered individually multiple outcomes
of interest reported in the trials, namely: the mean change in BASDAI scores at 12 weeks, the
proportion of BASDAI50 responders (that is, those that had, at 12 weeks, a change in the baseline
BASDAI score of 50% or more), and the mean change in BASFI scores at 12 weeks.
Initially, within such a univariate framework, we further explored assumptions over the relative
effectiveness of anti-TNFs. We evaluated the possibility of the evidence suggesting treatment effects
to be independent, equal or similar effects (treatment effects were assumed to come from a ‘common’
distribution, i.e. a ‘class effect’). Independence was ruled out through statistical checks of goodness of
fit - this is in line with the published evidence that, in AS, does not demonstrate one anti-TNF
treatment to be significantly more effective than another. The data were as well represented by the
other two models. However, unless we believe the equality assumption to hold AND the trials to be
homogeneous in design and in the populations included, assuming equality in treatment effects will
provide over-precise estimates. For this reason, our preferred assumption was that of similarity,
however, it should be noted that this model is not explicit about the source of the differences in the
effects of treatments. Whereas heterogeneity may be a plausible explanation, further research needs to
examine data at the individual patient level to avoid the potential for ecological bias.
We also extended the synthesis in a way that allowed multiple outcomes to be jointly modelled. We
did so by i) structurally relating the BASDAI based outcomes, allowing for trials reporting
BASDAI50 to inform BASDAI change scores, and ii) by concomitantly synthesising BASFI
outcomes, allowing correlation between outcomes and the borrowing of strength between results to
BASDAI and BASFI. For these reasons, the synthesis model developed here more directly addresses

Technology Assessment Report for NICE
TNF-alpha inhibitors for ankylosing spondylitis and nr-axSpA
15/12/2014 180
the decision problem. It also generates appropriate effect size estimates and their associated
uncertainty to inform the main input parameters of the economic model.
In the decision model, treatment continuation is determined by response to BASDAI50 at 12 weeks.
Given prognosis, costs and QALY are determined by absolute BASDAI and BASFI scores it is
important to evaluate the absolute change in BASDAI and BASFI separately for responders and non-
responders, i.e. the conditional scores. We used the results from the extended synthesis model to
develop a simulation model that allowed prediction of the conditional scores. The results obtained
differ from those seen in three pivotal trials (data provided by the manufacturers upon request),
probably because of distributional assumptions over the baseline and change scores. Only with access
to the individual patient data such predictions could be improved.
7 Independent economic assessment: York model
7.1 Overview
Section 5 indicates that there are significant conceptual concerns and uncertainties arising from
previously published studies and the submissions made by manufacturers. For this reason, it has been
necessary to develop a de-novo model (hereafter referred to as the ‘York model’). Although it shares
some of the assumptions and parameter estimates from the manufacturer models, it has a different
conceptual structure and applies a more generalised framework for the synthesis of data from the
double-blind periods of existing RCTs, combined with a more explicit approach to modelling the
progressive nature of AS and nr-axSpA and the potential impact of the anti-TNFs.
The aim of the York model is to assess the cost-effectiveness of adalimumab, certolizumab,
etanercept, golimumab, and infliximab, in accordance with their respective licences, for the treatment
of AS and nr-axSpA. The model uses short-term trial data, based on the extended evidence synthesis,
to model the response of patients to TNF-alpha inhibitor therapy at 12 weeks based on BASDAI 50
measured in the trials. In contrast to the models submitted by the manufacturers, the York model is
based on an assumption of similar (but not identical) effects for the alternative biologics based on the
results of the extended synthesis reported in Section 6.
In common with all existing cost-effectiveness studies, measures of disease activity (BASDAI) and
functioning (BASFI) are used to characterise the chronic, progressive nature of AS and nr-axSpA and
the effect of anti-TNFs. However, the York model uses an alternative conceptual model applied to
estimate longer term BASFI scores. The effect of response to TNF-alpha therapy is modelled in terms
of the short and longer term impact on BASDAI and BASFI scores.

Technology Assessment Report for NICE
TNF-alpha inhibitors for ankylosing spondylitis and nr-axSpA
15/12/2014 181
NHS and PSS costs are based on the cost of the TNF-alpha therapies (acquisition, administration and
monitoring) and disease costs linked to BASFI scores. HRQoL, in terms of utility, is based on both
BASDAI and BASFI scores. Health effects are subsequently expressed in terms of QALYs. Both
costs and QALYs are discounted at 3.5% per annum. Costs are presented based on current prices.
The model is developed in accordance with the NICE reference case. The model has a lifetime
horizon (60 years) and considers costs from the perspective of the National Health Services and
Personal Social Services.
7.2 Contribution of the York model
Although the York model shares some of the assumptions and parameters from existing studies and
manufacturer submissions, it also provides a number of significant developments to existing cost-
effectiveness analyses. Firstly, the short-term clinical effectiveness inputs are based on an evidence
synthesis approach which is based on all available trial data for each biological therapy and which
jointly synthesises ‘related’ parameters ensuring uncertainty is more appropriately characterised.
Secondly, the evidence synthesis approach is more explicitly linked to the decision problem and the
requirements of the economic model. That is, the model requires estimates of response and the impact
on BASDAI/BASFI conditional upon this. Since the conditional response scores are not
conventionally reported in existing publications, existing models have largely been based on selective
approaches (i.e. using conditional scores from single studies or assumptions) or appear to have
ignored the conditional scores entirely and instead utilise estimates from longer term follow-up and/or
open-label sources (i.e. implicitly assuming that patients who continue to participate in longer-term
follow up and open label sources are more likely to be responders than patients who do not). Neither
approach appears satisfactory in terms of meeting the requirements of the economic model and
ensuring that all relevant evidence is considered. The evidence synthesis approach which underpins
the York model is based on a joint synthesis of related parameters which makes fuller use of existing
evidence and which can more appropriately estimate the input parameters which are required to
populate existing models and better characterise the uncertainty surrounding these.
Another important development of the York model is the approach to modelling longer term BASFI
changes over time to characterise the progressive nature of AS and nr-axSpA. In previous sections we
highlighted our concerns over how this has been previously modelled and the implicit assumptions
underlying the effect of anti-TNFs (i.e. potential disease modification properties resulting in halting
further ‘progression’, or reducing the rate of progression, while patients respond and continue to
receive anti-TNFs). Within the York model, we attempt to model the impact of different processes on
BASFI over time, relating the changes more explicitly to the existing clinical effectiveness data for
anti-TNFs on these different processes. Specifically we consider the independent effects on BASFI

Technology Assessment Report for NICE
TNF-alpha inhibitors for ankylosing spondylitis and nr-axSpA
15/12/2014 182
due to disease activity (BASDAI) and the extent and progression of radiographic disease (as measured
by the Modified Stoke Ankylosing Spondylitis Spinal Score [mSASSS]) for AS. For the nr-axSpA
population, we assume a similar underlying clinical process relating to BASFI.
This approach confers several advantages over current approaches by linking changes in BASFI to a
more explicit clinical/biological process and facilitating a more formal consideration of the potential
impact of anti-TNFs on BASFI, via the specific effects these drugs have on the different processes
which independently relate to this parameter. This approach allows consideration of the impact on
BASFI that might be achieved via symptomatic improvements (i.e. in terms of reductions in disease
activity) and those which might be conferred by disease modification properties (i.e. the effect on the
likelihood and/or rate of further radiographic progression). The latter aspect is particularly important
given the increasing amount of published evidence reported on the potential impact of anti-TNFs on
radiographic progression which has not been formally considered or incorporated within existing cost-
effectiveness studies.
7.3 Comparators
Table 81 summarises the comparators included in each of the populations, in line with the relevant
existing (or likely to be granted by the time of the NICE appraisal) marketing authorisations for each
manufacturer.
Table 81 - Comparators evaluated in the different indications
Comparator Manufacturer AS nr-axSpA
Conventional Care - Yes Yes
Adalimumab AbbVie Yes Yes
Certolizumab UCB Yes Yes
Etanercept Pfizer Yes Yes
Golimumab MSD Yes No
Infliximab MSD Yes No
7.4 Model Structure
The York model is a cohort model and takes the form of a modified decision tree for AS and nr-
axSpA. A simplified version of the structure is shown in Figure 15. A similar structure has been
previously been used to evaluate the cost-effectiveness of anti-TNFs in psoriatic arthritis.165

Technology Assessment Report for NICE
TNF-alpha inhibitors for ankylosing spondylitis and nr-axSpA
15/12/2014 183
Figure 15- A simplified schematic of the York model structure
For the alternative TNF-alpha inihibitors, initial response is determined on the basis of a short-term
BASDAI 50 response (12 weeks). For those who respond, there is then an on-going risk of
withdrawal of treatment at any time point in the model. Initial or later treatment failures are assumed
to move on to conventional care. The use of BASDAI 50 is consistent with existing BSR guidelines
and previous NICE appraisals for AS.1, 2, 159
Ensuring consistency in the response measure between
the various appraisals provides a more comparable basis for exploring any subsequent differences in
results. In addition, using BASDAI 50 as a response measure for the economic model maximises the
evidence base used to inform the various clinical effectiveness parameters required and, as outlined in
Section 6, utilises the same clinical constructs to inform response and subsequent BASDAI changes.
Those patients who receive anti-TNFs will experience an initial improvement which is based on
results of the evidence synthesis (average of mean change in BASDAI and BASFI estimated for
responders and non-responders). From week 12, patients who continue to receive anti-TNFs are
assigned the conditional mean change in BASDAI and BASFI estimated from the evidence synthesis
which is assumed to remain constant for the treatment duration period. In addition to this initial
improvement in BASDAI and BASFI, patients continuing on anti-TNFs treatment are also assumed to
experience a slower progression rate in BASFI as long as they are responding (see section 7.5.3).

Technology Assessment Report for NICE
TNF-alpha inhibitors for ankylosing spondylitis and nr-axSpA
15/12/2014 184
Patients who fail on TNF-alpha inhibitor therapy after the initial (12-week) period will experience
some form of rebound in terms of BASDAI/BASFI, but trial data are too short-term to be able to
characterise this accurately. The model, therefore, considers two rebound scenarios:
1. Rebound equal to gain (BASDAI and BASFI). When patients fail therapy (after initially
responding), their BASDAI and BASFI deteriorates by the same amount by which it
improves when they responded to therapy.
2. Rebund back to natural history/conventional care (BASFI only). When patients fail therapy
(after initially responding), their BASFI deteriorates to the level and subsequent trajectory it
would have been had they not initially responded to therapy. Since BASDAI is not assumed
to progress over time on conventional care, the same assumptions are applied to BASDAI in
both scenarios.
Given the absence of evidence on rebound, both scenarios (rebound equal to gain and rebound back to
natural history) are presented as the ‘best-case’ and ‘worst-case’ scenarios possible. In other words,
the reality regarding rebound is likely to be somewhere between these two scenarios which should,
therefore, be seen as the limits.
Importantly, the York model explores the impact of assuming different baseline BASDAI and BASFI
scores for responders and non-responders. Hence, in contrast to existing models, the York model
assumes that response is unlikely to be independent of baseline patient characteristics and hence the
baseline characteristics of responders/non-responders to anti-TNFs may be systematically different
from each other. Importantly, the results from the extended synthesis model estimated higher baseline
BASDAI and BASFI scores for non-responders vis-à-vis responders and a similar relationship was
also reported by those manufacturers who provided conditional response data requested by the
Assessment Group. Consequently, assuming that non-responders revert back to the ‘average’ of the
baseline BASDAI/BASFI scores of all patients randomised to receive TNF-alpha inhibitor treatment,
or the ‘average’ of patients receiving conventional care is likely to be overly optimistic towards the
subsequent cost-effectiveness of anti-TNFs. The model thus employs different baselines for
responders and non-responders (at 12 weeks) and at the point of discontinutation patients are assumed
to revert to their respective baseline BASDAI and BASFI scores (i.e. at 12-weeks, non-responders
revert back to the non-responder baseline and after 12-weeks patients who subsequently discontinue
from their TNF-alpha therapy revert back to their responder baseline). The impact of using these data
is explored as part of the sensitivity analysis.
Patients are at risk of all-cause mortality at every time point in the model, but no differential mortality
risk between the therapies being evaluated. Aside from the cost of the TNF-alpha therapies
themselves (i.e. acquisition, administration, monitoring and AEs), all other costs of AS and nr-axSpA

Technology Assessment Report for NICE
TNF-alpha inhibitors for ankylosing spondylitis and nr-axSpA
15/12/2014 185
are assumed to vary according to BASFI score. Costs are presented based on current prices. HRQoL
(in terms of utility) is implemented as a function of BASDAI and BASFI scores.
7.5 Model input parameters
The parameter estimates used in the York model, together with their sources, are detailed in Tables 82
and 83.

Technology Assessment Report for NICE
TNF-alpha inhibitors for ankylosing spondylitis and nr-axSpA
15/12/2014 186
Table 82 - List of parameter estimates used in the York model – AS population
Parameter Mean value Standard
error Distribution Source
Annual discount rate costs / QALYs 3.5% - Fixed
Time horizon (years) 60 - Fixed
Cycle length (years) 0.25 - Fixed
Baseline patient characteristics
Average age 40 - Fixed Assumption
Proportion male % 0.7 - Fixed Assumption
Average Weight (kg) 73 - Fixed Assumption
Average Baseline BASDAI 6.12 N/A Derived from responder
& non-responder baseline
Evidence synthesis
(Section 6) Average Baseline BASFI 5.28 N/A
Baseline BASDAI CC Responders 4.01 N/A From evidence synthesis
Evidence synthesis
(Section 6)
Baseline BASDAI CC Non-responders 6.33 N/A From evidence synthesis
Baseline BASFI CC Responders 3.52 N/A From evidence synthesis
Baseline BASFI CC Non-responders 5.46 N/A From evidence synthesis
Baseline BASDAI anti-TNF Responders 4.80 N/A From evidence synthesis
Baseline BASDAI anti-TNF Non-
responders 7.08
N/A From evidence synthesis
Baseline BASFI anti-TNF Responders 4.20 N/A From evidence synthesis
Baseline BASFI anti-TNF Non-responders 6.07 N/A From evidence synthesis
Response (12 week BASDAI 50)
anti-TNF 42.0% N/A From evidence synthesis Evidence synthesis
(Section 6) Conventional therapy 9.1% N/A From evidence synthesis
Treatment Effect
Initial BASDAI Change| Tx response -
anti-TNF -3.86
N/A From evidence synthesis
Evidence synthesis
(Section 6)
Initial BASDAI Change| Tx response - CC -2.89 N/A From evidence synthesis
Initial BASDAI Change| Tx no response -
anti-TNF -1.64
N/A From evidence synthesis
Initial BASDAI Change| Tx no response -
CC -0.36
N/A From evidence synthesis
Initial BASFI Change| Tx response - anti-
TNF -3.08
N/A From evidence synthesis
Initial BASFI Change| Tx response - CC -1.72 N/A From evidence synthesis
Initial BASFI Change| Tx no response -
anti-TNF -0.44
N/A From evidence synthesis
Initial BASFI Change| Tx no response - CC -0.04 N/A From evidence synthesis
Long-term annual BASFI Progression
BASFI annual progression anti-TNF 0.034 - Derived from
probabilistic inputs below.
BASFI annual progression CC 0.082
-
Annual rate of MSASSS change for
MSASSS≥10 1.44 0.133
Normal Ramiro et al (2013) 140
BASFI change with 1 unit change in
MSASSS 0.057 0.0049
Normal Landewe et al
(2009) 12
Treatment effect on progression (RR) 0.42 0.122 Normal Haroon et al (2013) 113
Time to treatment effect (years) 4 - Haroon et al (2013) 113, Baraliakos et al

Technology Assessment Report for NICE
TNF-alpha inhibitors for ankylosing spondylitis and nr-axSpA
15/12/2014 187
Parameter Mean value Standard
error Distribution Source
(2014) 114
Long-term annual BASDAI Progression
BASDAI annual progression anti-TNF 0 N/A
BASDAI annual progression CC 0 N/A
Annual withdrawal probability
Constant rate of annual withdrawal 0.11 ***** Lognormal; from
exponential model
(coefficient: ******, SE:
*****)
Pfizer submission
Mortality
SMR Women 1.38 0.163 Normal Bakland (2011)
SMR Men 1.63 0.163 Normal Bakland (2011)
Quality of life
Intercept ***** Uncertainty
from
reported
variance-
covariance matrix
Multivariate normal
Pfizer submission
BASDAI coefficient ***** Multivariate normal
BASFI coefficient ****** Multivariate normal
BASDAI^2 coefficient ****** Multivariate normal
BASFI^2 coefficient ***** Multivariate normal
Initial 12-week Period Costs [Drug + Initiation + Administration]
Adalimumab 2422 - Fixed
As discussed in
section 7.5.6
Certolizumab Pegol 3884 - Fixed
Etanercept 2454 - Fixed
Golimumab 2415 - Fixed
Infliximab 6878 - Fixed
Certolizumab Pegol PAS 309 - Fixed
Subsequent 12 week Costs [Drug + Monitoring + Administration]
Adalimumab 2171 - Fixed
As discussed in
section 7.5.6
Certolizumab Pegol 2203 - Fixed
Etanercept 2203 - Fixed
Golimumab 2164 - Fixed
Infliximab 3435 - Fixed
Certolizumab Pegol PAS 2203 - Fixed
Disease related costs – annual
Intercept 1284 0.165 Lognormal OASIS data,
AbbVie submission BASFI coefficient 0.213 0.038 Normal
Adverse event costs (£ per patient)
Year 1 18.2 - Fixed
Excess rates for
anti-TNFs from
Cochrane review127,
Costs from NHS Reference costs166
Subsequent years 0 - Fixed
Abbreviations: CC: Conventional Care; Tx: treatment

Technology Assessment Report for NICE
TNF-alpha inhibitors for ankylosing spondylitis and nr-axSpA
15/12/2014 188
Table 83: List of parameter estimates used in the York model – nr-axSpA population
Parameter Mean value Standard
error Distribution Source
Annual discount rate costs / QALYs 3.5% - Fixed
Time horizon (years) 60 - Fixed
Cycle length (years) 0.25 - Fixed
Baseline patient characteristics
Average age 40 - Fixed Assumption
Proportion male % 0.5 - Fixed Assumption
Average Weight (kg) 73 - Fixed Assumption
Average Baseline BASDAI 6.42 N/A Derived from responder
& non-responder
baseline
Evidence synthesis (Section
6) Average Baseline BASFI 4.92
N/A
Baseline BASDAI CC Responders
4.54
N/A From evidence
synthesis
Evidence synthesis (Section
6)
Baseline BASDAI CC Non-responders
6.86
N/A From evidence
synthesis
Baseline BASFI CC Responders
2.95
N/A From evidence
synthesis
Baseline BASFI CC Non-responders
5.38
N/A From evidence
synthesis
Baseline BASDAI anti-TNF
Responders 5.45
N/A From evidence
synthesis
Baseline BASDAI anti-TNF Non-
responders 7.51
N/A From evidence
synthesis
Baseline BASFI anti-TNF Responders
3.92
N/A From evidence
synthesis
Baseline BASFI anti-TNF Non-
responders 6.04
N/A From evidence
synthesis
Response (12 week BASDAI 50)
anti-TNF
52.9%
N/A From evidence
synthesis Evidence synthesis (Section
6) Conventional therapy
18.9%
N/A From evidence
synthesis
Treatment Effect
Initial BASDAI Change| Tx response -
anti-TNF -4.31
N/A From evidence
synthesis
Evidence synthesis (Section
6)
Initial BASDAI Change| Tx response -
CC -3.34
N/A From evidence
synthesis
Initial BASDAI Change| Tx no
response - anti-TNF -2.28
N/A From evidence
synthesis
Initial BASDAI Change| Tx no
response - CC -1.06
N/A From evidence
synthesis
Initial BASFI Change| Tx response -
anti-TNF -3.24
N/A From evidence
synthesis
Initial BASFI Change| Tx response -
CC -1.88
N/A From evidence
synthesis
Initial BASFI Change| Tx no response -
anti-TNF 0.08
N/A From evidence
synthesis
Initial BASFI Change| Tx no response -
CC -0.05
N/A From evidence
synthesis
Long-term annual BASFI Progression

Technology Assessment Report for NICE
TNF-alpha inhibitors for ankylosing spondylitis and nr-axSpA
15/12/2014 189
Parameter Mean value Standard
error Distribution Source
BASFI annual progression anti-TNF 0.017 Derived from
probabilistic inputs below.
BASFI annual progression CC 0.039
Annual rate of MSASSS change for
MSASSS<10 0.69 0.031
Normal Ramiro et al (2013) 140
BASFI change with 1 unit change in
MSASSS 0.057 0.0049
Normal Landewe et al (2009) 12
Treatment effect on progression (RR) 0.42 0.122 Normal Haroon et al (2013) 113
Time to treatment effect (years) 4 - Haroon et al (2013) 113,
Baraliakos et al (2014) 114
Long-term annual BASDAI Progression
BASDAI annual progression anti-TNF 0 N/A
BASDAI annual progression CC 0 N/A
Annual withdrawal probability
Constant rate of annual withdrawal 0.06 ***** Lognormal; from
exponential model
(coefficient: ******,
SE: *****)
Pfizer submission
Mortality
SMR Women 1.38 0.163 Normal Bakland (2011)
SMR Men 1.63 0.163 Normal Bakland (2011)
Quality of life
Intercept *****
Uncertainty
from
reported
variance-
covariance matrix
Multivariate normal
Pfizer submission
BASDAI coefficient ****** Multivariate normal
BASFI coefficient ****** Multivariate normal
Male coefficient ***** Multivariate normal
Age coefficient ****** Multivariate normal
BASDAI^2 coefficient ****** Multivariate normal
BASFI^2 coefficient ***** Multivariate normal
BASFI * BASDAI coefficient ****** Multivariate normal
Initial 12-week Period Costs [Drug + Initiation + Administration]
Adalimumab 2573 - Fixed
As discussed in section
7.5.6
Certolizumab Pegol 4035 - Fixed
Etanercept 2606 - Fixed
Golimumab 2566 - Fixed
Infliximab 7213 - Fixed
Certolizumab Pegol PAS 460 - Fixed
Subsequent 12 week Costs [Drug + Monitoring + Administration]
Adalimumab 2177 - Fixed
As discussed in section
7.5.6
Certolizumab Pegol 2210 - Fixed
Etanercept 2210 - Fixed
Golimumab 2170 - Fixed
Infliximab 3441 - Fixed
Certolizumab Pegol PAS 2210 - Fixed
Disease related costs – annual
Intercept 1284 0.165 Lognormal OASIS data, AbbVie
submission BASFI coefficient 0.213 0.038 Normal

Technology Assessment Report for NICE
TNF-alpha inhibitors for ankylosing spondylitis and nr-axSpA
15/12/2014 190
Parameter Mean value Standard
error Distribution Source
Adverse event costs (£ per patient)
Year 1 18.2 - Fixed
Excess rates for anti-TNFs
from Cochrane review 127,
Costs from NHS Reference costs
Subsequent years 0 - Fixed
Abbreviations: CC: Conventional Care; Tx: treatment
7.5.1 Baseline patient characteristics
Baseline characteristics applied to the AS and nr-axSpA populations are summarised in Tables 82 and
83, respectively.
7.5.2 Response, change in BASDAI/BASFI and conditional baselines
BASDAI50 response, conditional change scores for BASDAI and BASFI at 12 weeks and the
separate conditional baselines estimated for BASDAI and BASFI (responders vs. non-responders)
were derived directly from the results of the extended synthesis model reported in Section 6. In the
base-case, it was assumed that the percentage of BASDAI50 responders, change in BASDAI/BASFI
and conditional baselines were the same for all anti-TNFs. The outputs (CODA) from the simulations
were incorporated directly into the model to maintain correlation and to avoid any additional
distributional assumptions.
7.5.3 Longer term BASFI progression
As previously highlighted in the overview section, the York model attempts to address some of the
conceptual concerns outlined in Section 5 surrounding the assumptions applied within existing models
in relation to modelling BASFI progression over time. Specifically we assume that BASFI is a
function of separate processes which are independently related to disease severity/activity (BASDAI)
and to the extent and subsequent progression of radiographic disease (mSASSS). The rationale for this
is that the association between BASDAI and BASFI is already accounted for in the separate mean
change scores applied to both BASDAI and BASFI for responders vs. non-responders/conventional
care patients. Differences in BASDAI are assumed to remain constant over the longer-term horizon
(an assumption which is common across all models). Hence, any additional changes which might
affect BASFI need to be more explicitly related to a separate clinical process (or processes). Based on
the studies included in the reviews reported in Section 4 for natural history (Section 4.2.6) and the
effect on anti-TNFs on radiographic progression (Section 4.2.4.1), we modelled longer term changes
in BASFI (for conventional care and anti-TNFs) as a function of mSASSS scores.
The approach applied in the AS population is based on the following studies and assumptions:

Technology Assessment Report for NICE
TNF-alpha inhibitors for ankylosing spondylitis and nr-axSpA
15/12/2014 191
1. The multivariate relationship reported in Landewe et al (2009)12
, based on longitudinal
assessments of BASFI, BASDAI and mSASSS, was used to estimate the independent effect
of a 1 unit change in mSASSS on BASFI scores (mean= 0.057, SE = 0.0049).
2. Data from a 12-year prospective follow-up of the OASIS study was used to estimate the
annual rate of change in mSASSS. Although at the individual level, progression of mSASSS
is highly variable, the study by Ramiro et al (2013) demonstrated that at a group level (i.e.
akin to the cohort approach applied in the York model) changes in mSASSS were stable,
progressing at an annual rate of 0.98 mSASSS units per year.140
Combining the estimates
reported across the studies implies a change in BASFI of 0.056 units per annum (0-10 scale).
However, since the population included in the study by Ramiro et al (2013) included patients
who would not be eligible to receive anti-TNFs, we used data in the subgroup of patients with
baseline mSASSS>=10. The annual rate of mSASSS progression in this subgroup was 1.44
(95% CI 1.18-1.70) units per year with an implied annual BASFI change of 0.082 units per
year. This compares with an annual change of BASFI of between 0.056 to 0.07 assumed
across the manufacturer submissions. The specific subgroup (mSASSS>=10) was chosen to
reflect that AS patients eligible to receive anti-TNFs are likely to be more similar to this
subgroup than the entire cohort reported by Ramiro et al (2013). This also provided a basis
for differentiating between the AS and nr-axSpA populations which is discussed in the
following section.
3. Given the uncertainties noted in Section 4.2.4.1 surrounding the effect of anti-TNFs on
radiographic progression, we explored alternative scenarios in the decision-model. In the
base-case we assumed that the effect was related to the duration of therapy which has been
reported in recent studies by Haroon et al (2013)113
and Baraliakos et al (2014)114
. Both
studies consistently reported evidence that the difference in mSASSS between patients who
received anti-TNFs and historical controls only became different in patients who had received
treatment for approximately 4-years or more. In the absence of any relative effect measure
reported by Baraliakos et al (20014), we used results reported by Haroon et al (2013)
applying a zero-inflated binomial model with a relative rate of mSASSS change of 0.42 (95%
CI 0.18-0.98). Hence, in the model, no effect on mSASSS was assumed until year 4 of the
model and then only applied to patients who continued to receive therapy beyond this period.
4. Given the inherent uncertainties regarding the effect of anti-TNFs on radiographic
progression we explored alternative scenarios based on: (i) an assumption of no impact on
radiographic progression and; (ii) an immediate effect – applying the estimate of 0.42 from
the outset.
For the nr-axSpA population, we assume a similar underlying clinical process relating to BASFI but
model separate BASFI processes for patients depending upon the probability of developing

Technology Assessment Report for NICE
TNF-alpha inhibitors for ankylosing spondylitis and nr-axSpA
15/12/2014 192
radiographic disease over time and thereafter modelling the extent and progression of radiographic
disease via mSASSS changes. Hence, our intention in the nr-axSpA model was to employ a constant
BASFI score (on and off-treatment) until a patient develops radiographic progression. At the time
point of ‘progression’ an increasing BASFI would be assumed using a similar approach applied to the
AS population. However, programming the additional transition to allow separate BASFI progression
estimates based on the time of progression (and time since progression for patients who had
previously progressed) proved more complex than anticipated. Consequently, a more simplified
assumption was made such that all patients were assumed to incur progression in BASFI albeit at a
lower rate relative to the AS population.
The approach we intended to apply in the nr-axSpA population was based on the following studies
and assumptions:
1. Poddubnyy et al (2012) is used to estimate the probability of nr-axSpA patients progressing to
radiographic disease based on the outcome ‘% progressed by >=2 mSASSS over 2 years’
(7.4%) reported.146
These estimates are converted into a rate to estimate the cycle specific
probability.
2. Following progression, the mSASSS scores of patients are subsequently assumed to increase
at a rate of 0.69 (95% CI 0.63 to 0.75) units per year, based on the subgroup of patients with
baseline mSASSS<10 reported by Ramiro et al (2013).140
BASFI is assumed to remain
constant for patients who do not progress in each cycle of the model.
3. The same results reported by Haroon et al (2013)113
, applying a zero-inflated binomial model
with a relative rate of mSASSS change of 0.42 (95% CI 0.18-0.98), were applied to the
mSASSS scores for patients who progressed to estimate the treatment effect of anti-TNFs.
Hence, in common with the AS model, no effect on mSASSS was assumed until year 4 and
then only applied to patients who continued to receive therapy beyond this period.
4. Given the inherent uncertainties regarding the effect of anti-TNFs on radiographic
progression we explored alternative scenarios based on: (i) an assumption of no impact on
radiographic progression and; (ii) an immediate effect – applying the estimate of 0.42 from
the outset. We also considered an exploratory scenario where we assumed no radiographic
progression for nr-axSpA for patients receiving anti-TNFs, to investigate the untested
hypothesis that early intervention in patients, prior to established radiographic disease, might
halt subsequent progression.
Given the additional programming challenges that could not be overcome within the remaining time
and funding constraints, the mSASSS scores of all nr-axSpA patients were assumed to increase at the
rate of 0.69 units per year. Hence, the subsequent results reported for the nr-axSpA population are
potentially optimistic since not all patients will develop radiographic progression. However, the use of

Technology Assessment Report for NICE
TNF-alpha inhibitors for ankylosing spondylitis and nr-axSpA
15/12/2014 193
mSASSS in this context inevitably represents an uncertain proxy process for BASFI changes. Further,
it should also be noted that the BASFI trajectory of nr-axSpA patients has been reported in
publications to be similar to early AS patients.167
Consequently, applying the change in mSASSS
reported in the subgroup of patients with baseline mSASSS<10 reported by Ramiro et al (2013) may
not be an unreasonable proxy for the purposes of predicting future changes in BASFI over longer
periods.140
7.5.4 Longer term discontinuation
Patients who achieve a response at 12-weeks are subsequently assumed to remain on that treatment
until the treatment is discontinued (i.e. due to loss of efficacy or adverse events). Hence, the evidence
required to inform the decision model is the post-12 week withdrawal data for responders. The
rationales for this are: (i) that discontinuation for lack of efficacy is higher during the first 3 months,
and this has already been accounted for in the model using the probability of no BASDAI 50 response
during the initial treatment period; and (ii) discontinuation rates in responders may differ from
withdrawal rates in studies which potentially include both responders and non-responders. Although
Section 4.2.4.2 identified 12 studies reporting on longer-term drug survival from registries, none of
these appear to directly inform the model requirements (i.e. either including the initial 3-month period
and/or not being specific to responders).
The most relevant estimates appeared to be those presented in previous and current submissions by
the manufacturers. Three alternative approaches and sources were identified which appeared to meet
the requirements of the economic model. These included:
1) A constant annual probability of 15% applied in the study by Kobelt et al (2007)151
based on
data from infliximab responders (BASDAI 50) reported as part of the 2nd
-year of the open-
label extension period of the Braun trial (n=18).
2) Separate time-dependent estimates of the probability for AS and nr-axSpA reported in the
AbbVie submission. These estimates were based on a parametric function (log-normal
distribution) estimated from responders (ASAS20 for AS and ASAS40 for nr-axSpA at week
12) from the open-label extensions of ATLAS (up to 260 weeks; n= not stated)) and
ABILITY-1 (up to 156 weeks; n=28).
3) A constant annual estimate (approximately 5% for nr-axSpA and 11% for AS) reported in the
Pfizer submission. These estimates were based on a parametric function (exponential
distribution) estimated from responders (BASDAI 50 at week 12) from the open-label
extensions of studies 311-EU, 312-EU and 907-EU (up to approx. 250 weeks for 311-EU; n=
not stated) for the AS population and study 1031 (up to approximately 110 weeks; n=46) for
the nr-axSpA population.

Technology Assessment Report for NICE
TNF-alpha inhibitors for ankylosing spondylitis and nr-axSpA
15/12/2014 194
Figure 16 provides a comparison of the different estimates in terms of the subsequent drug survival
over a longer-time horizon for AS.
Figure 16- Comparison of withdrawal rates – AS population
Figure 17 provides a comparison of the different estimates in terms of the subsequent drug survival
over a longer-time horizon for nr-axSpA.

Technology Assessment Report for NICE
TNF-alpha inhibitors for ankylosing spondylitis and nr-axSpA
15/12/2014 195
Figure 17 - Comparison of withdrawal rates – nr-axSpA population
The base-case of the York model is based on the estimates reported in the submission by Pfizer for
both populations. The justification for this is that: (i) the estimates relate to the response endpoint used
in the York model (BASDAI 50); (ii) full details were reported by Pfizer concerning the alternative
parametric models and associated goodness of fit statistics and the exponential model appeared the
most appropriate function; (iii) the continued use of a time-dependent function with long-tails such as
the lognormal distribution results in a significant proportion of patients who would still be assumed to
be on TNF-alpha therapy even after 40 years. Although it is not possible to completely rule out this
possibility, the approach by Pfizer was deemed to be a more appropriate basis for informing the York
model based on a series of considerations.
7.5.5 Health-related quality of life
The current manufacturer submissions are based on alternative mapping algorithms to link BASDAI
and BASFI scores to a generic utility measure. The approach used by AbbVie in their base-case was
based on separate mapping algorithms for the AS and nr-axSpA populations using data from the
ATLAS and ABILITY-1 trials, respectively. For the nr-axSpA population, BASDAI and BASFI were
mapped to EQ-5D, whereas, the algorithm for the AS population mapped to HUI3; reflecting the use
of different generic utility measures used in the two trials. The approach employed by Pfizer in their
base-case was similarly based on separate algorithms for each population estimated using data from
the 1031 study (nr-axSpA) and the 314-EU study (AS) both mapped to EQ-5D. Both regressions were
based on the relationship between BASDAI, BASFI and EQ-5D. The approach employed by UCB in

Technology Assessment Report for NICE
TNF-alpha inhibitors for ankylosing spondylitis and nr-axSpA
15/12/2014 196
their base-case was based on the same, single mapping algorithm from the RAPID-axSpa trial that
included both patient populations. MSD adopted the algorithm reported in McLeod et al (2007)34
.
We undertook a separate search for other published utility algorithms and only identified the
algorithm reported in Ara et al (2007)152
which was based on the cost-effectiveness analysis submitted
by Pfizer to NICE for TA143. Full details of the search and associated review of utility studies are
reported in Appendices 1 and 13, respectively. A summary of the alternative algorithms based on EQ-
5D is provided in Tables 84 and 85.
Table 84 - Comparison of alternative EQ-5D utility regression models (AS)
Ara 2007 MSD UCB Pfizer
BASDAI/BASFI scale 0-10 0-10 0-10 0-100
Regression model Linear Linear Logistic Non-linear
Intercept 0.92300000 0.877213 ******** **********
BASFI -0.04318800 -0.032252 ********* ***********
BASDAI -0.04019000 -0.038409 ********* **********
Male 0.00000000 -0.027891 ******** **********
Age 0.00000000 0.001681 ******** **********
BASFI2 0.00000000 0.000000 ******** **********
BASDAI2 0.00000000 0.000000 ******** ***********
BASFI * BASDAI 0.00000000 0.000000 ******** **********
Table 85- Comparison of alternative EQ-5D utility regression models (nr-axSpA)
nr-axSpA
UCB AbbVie Pfizer
BASDAI/BASFI scale 0-10 0-10 0-100
Regression model Logistic Linear Non-linear
Intercept ******* 0.9220000 *********
BASFI ******** -0.0411700 **********
BASDAI ******** -0.0392400 **********
Male ******* 0.0000000 *********
Age ******* 0.0000000 **********
BASFI2 ******* 0.0000000 *********
BASDAI2 ******* 0.0000000 **********
BASFI * BASDAI ******* 0.0000000 **********

Technology Assessment Report for NICE
TNF-alpha inhibitors for ankylosing spondylitis and nr-axSpA
15/12/2014 197
Figures 18 to 21 provide a comparison of the utility predictions for each algorithm in each population.
For each population, 2 separate figures are presented. Each figure is based on the impact of holding
either BASDAI or BASFI constant (at the mean value) and allowing the other measure to vary across
the entire range. The baseline characteristics (BASDAI, BASFI and age) were derived from a
weighted average of the baseline characteristics of the clinical trials for the AS population used in the
manufacturer’s economic models. For nr-axSpA, baseline characteristics (BASDAI, BASFI and age)
of the nr-axSpA sub-population from the RAPID-axSpa study were used. Gender was assumed to be
65% male in AS and 35% male in nr-axSpA.
Figure 18 - Illustration of predicted EQ-5D values using different mapping algorithms - constant
BASDAI and varying BASFI (AS)
Figure 19 - Illustration of predicted EQ-5D values using different mapping algorithms - constant BASFI
and varying BASDAI (AS)

Technology Assessment Report for NICE
TNF-alpha inhibitors for ankylosing spondylitis and nr-axSpA
15/12/2014 198
Figure 20 - Illustration of predicted EQ-5D values using different mapping algorithms - constant
BASDAI and varying BASFI (nr-axSpA)
**********************************
Figure 21 - Illustration of predicted EQ-5D values using different mapping algorithms - constant BASFI
and varying BASDAI (nr-axSpA)
********
It is evident that there is significant variation in the utility predictions arising from each separate
algorithm. In particular, the non-linear function estimated by Pfizer results in important differences

Technology Assessment Report for NICE
TNF-alpha inhibitors for ankylosing spondylitis and nr-axSpA
15/12/2014 199
across several of the figures at the extremes of the BASDAI/BASFI ranges. However, limited details
were provided in relation to goodness of fit and/or predictive performance for the majority of
algorithms. Hence, a formal assessment of the validity of the different approaches is problematic.
Only the submission by Pfizer reported additional detail on these aspects and hence was subsequently
used in the York model base-case (separate algorithms for the different populations). The non-linear
function for utilities was also considered to be more consistent with the non-linear approach applied to
costs.
A potential limitation of all the manufacturer analyses is that their algorithms are based on trial data.
These data may represent a more limited range of BASDAI and BASFI values and hence there maybe
issues associated with their subsequent predictive performance in the context of the longer-term
economic model. Although, from the data reported by Pfizer at least, it appeared as if the full range of
BASDAI and BASFI scores were represented in the sample used. However, a separate sensitivity
analysis was also undertaken based on the algorithm used by MSD. This algorithm is based on a re-
analysis of the Kobelt et al (2004)143
data from patients (n=1,144) who had BASDAI and BASFI
scores across the whole 0-10 scale and was previously used by Mcleod et al (2007)34
for the previous
MTA. Hence, this scenario also provides a more consistent basis for comparing the results from our
new analysis.
7.5.6 Resource use and costs
7.5.6.1 Drug acquisition costs
The unit costs of anti-TNFs were sourced from the British National Formulary. Doses were calculated
in accordance with their respective licences. Tables 86 and 87 summarise the drug acquisition costs
and the licensed dosage for AS and nr-axSpA patients
PAS details
Certolizumab PAS: UCB will make Cimzia available free of charge to all NHS patients for the first
three months of therapy, at which point clinical response should be clear. Only after this three month
stage will the NHS be charged for continuing to use this therapy. However, it should be noted that the
proposed PAS is not yet formally agreed with the Department of Health and NICE.
Golimumab PAS: the manufacturer provides the 100 mg dose of golimumab at the same cost as the 50
mg dose, agreed as part of the patient access scheme.
Table 86 - Drug acquisition costs
Drug Dose Cost (£) Source
Infliximab
(Remicade)
IV infusion - 100 mg vial 419.62 BNF168 – Nov 2014

Technology Assessment Report for NICE
TNF-alpha inhibitors for ankylosing spondylitis and nr-axSpA
15/12/2014 200
Golimumab
(Simponi)
Injection - 50-mg prefilled pen or
prefilled syringe
762.97 BNF – Nov 2014
100-mg prefilled pen 1525.94
Adalimumab
(Humira)
Injection - 40-mg prefilled
pen/prefilled syringe or 40 mg/0.8-mL vial
352.14 BNF – Nov 2014
Certolizumab
(Cimzia)
Injection - 200-mg prefilled
syringe
357.5 BNF – Nov 2014
Etanercept (Enbrel) Injection - powder for
reconstitution, 25-mg vial or 25-mg prefilled syringe
89.38 BNF – Nov 2014
Injection - 50-mg prefilled pen or
prefilled syringe
178.75 BNF – Nov 2014
Table 87 Anti-TNFs licensed dosage in AS and nr-axSpA
Drug Licensed dosage in AS and nr-axSpA
Infliximab (Remicade) - 5 mg/kg given as an intravenous infusion followed by additional 5 mg/kg
infusion doses at 2 and 6 weeks after the first infusion, then every 6 to 8
weeks.
- If a patient does not respond by 6 weeks (i.e. after 2 doses), no additional treatment with infliximab should be given.
Golimumab (Simponi) - 50 mg given once a month, on the same date each month
- For patients with a body weight of more than 100 kg who do not achieve
an adequate clinical response after 3 or 4 doses, increasing the dose of
golimumab to 100 mg once a month may be considered
Adalimumab (Humira) -Recommended dose for patients with ankylosing spondylitis and axial
spondyloarthritis without radiographic evidence of AS is 40 mg
adalimumab administered every other week as a single dose via subcutaneous injection
Certolizumab (Cimzia) - The recommended starting dose of Cimzia for adult patients is 400 mg
(given as 2 subcutaneous injections of 200 mg each) at weeks 0, 2 and 4.
- After the starting dose, the recommended maintenance dose of Cimzia for
adult patients with axial spondyloarthritis is 200 mg every 2 weeks or 400 mg every 4 weeks.
Etanercept (Enbrel) - The recommended dose is 25 mg Enbrel administered twice weekly, or 50
mg administered once weekly.
7.5.6.2 Drug administration costs
Administration costs for intravenous therapies were based on a regular chemotherapy cost (HRG code
SB15Z, Deliver subsequent elements of a chemotherapy cycle), similarly to NICE TA143.1 Therapies
administered subcutaneously were assumed to be self-administered following instruction. The cost of
instruction in the model was based on one hour of nurse time (PSSRU 2013).169
Drug administration
did not differ between the AS and nr-axSpA indications.
Table 88 - Drug administration costs

Technology Assessment Report for NICE
TNF-alpha inhibitors for ankylosing spondylitis and nr-axSpA
15/12/2014 201
Cost (£) Source
Subcutaneous
therapies £49
Cost of nurse training for self-administration
(PSSRU 2013)169
Intravenous
therapies £291
HRG code SB15Z - Deliver Subsequent
Elements of a Chemotherapy Cycle (NHS
Reference costs 2012-13)166
7.5.6.3 Initiation and monitoring costs
The initiation and monitoring costs for anti-TNF therapies were restricted to the additional costs
incurred compared to patients receiving conventional care alone as these drugs are used in addition to
current practice. The resource use assumptions for laboratory testing for anti-TNF initiation and
monitoring have been sourced from the York model for psoriatic arthritis (TA199)165
and conform to
guidelines from the British Society for Rheumatology (BSR)159
for the use of biologics.
Specifically, during the initial 12-week period AS patients on anti-TNF therapy are assumed to
undertake a series of tests at treatment initiation and at week 12 when assessing treatment response
(i.e. a Full Blood Count (FBC), Erythrocyte Sedimentation Rate (ESR), Liver Function Test (LFT),
Urea and Electrolytes (U&E)). Additional testing is conducted once during the initial period (i.e. chest
X-Ray, Tuberculosis (TB) Heaf test, antinuclear antibody (ANA) and a double-stranded DNA test).
AS patients on anti-TNF therapy are also assumed to visit a specialist twice during the initial 12-week
period (at treatment initiation and when assessing 12-week response) and 2 times per year thereafter
for monitoring. For quarterly monitoring, AS patients are assumed to receive a series of laboratory
tests once every three months (i.e. a Full Blood Count (FBC), Erythrocyte Sedimentation Rate (ESR),
Liver Function Test (LFT), Urea and Electrolytes (U&E)).
Nr-axSpa patients, in addition to the initiation and monitoring resource use assumed for AS patients
on anti-TNF therapy, are also assumed to get an MRI test and a CRP test at treatment initiation, as
well as an X-ray once per year after the initial period for monitoring, in order to assess radiographic
progression.
Cost estimates for laboratory testing have been sourced from the York model for psoriatic arthritis
(TA199) and have been inflated to 2012/13 prices, using the Hospital & Community Health Services
(HCHS) Pay & Prices Index.165, 169
The CRP test cost is derived from Henriksson 2010.170
Specialist
visits are costed at £100 (outpatient rheumatology follow-up attendance), using the NHS Reference
Costs 2012-13.166
A summary of the initiation and monitoring resource use assumptions for anti-TNF therapies and the
subsequent costs for the AS and nr-axSpA populations is reported in Tables 89 and 90.

Technology Assessment Report for NICE
TNF-alpha inhibitors for ankylosing spondylitis and nr-axSpA
15/12/2014 202
Table 89 - Initiation and monitoring resource use and costs– AS population
Resource use Cost
Item Initiation period
(12 weeks)
Quarterly
Monitoring
Initiation period
(12 weeks)
Quarterly
Monitoring
Full blood count (FBC) 2 1 £5.97 £2.98
Erythrocyte sedimentation rate (ESR) 2 1 £5.90 £2.95
Liver function test (LFT) 2 1 £1.50 £0.75
Urea and Electrolytes (U&E) 2 1 £2.77 £1.38
Chest X-ray 1 0 £26.19 £0.00
Tuberculosis (TB) Heaf test 1 0 £8.72 £0.00
Antinuclear antibody (ANA) 1 0 £4.65 £0.00
Double-stranded (ds) DNA test 1 0 £4.65 £0.00
Specialist visit 2 0.5 £200.00 £50.00
C reactive protein (CRP) test 0 0 £0.00 £0.00
Total - - £260 £58
Table 90 - Initiation and monitoring resource use and costs– nr-axSpA population
Resource use Cost
Item Initiation period
(12 weeks)
Quarterly
Monitoring
Initiation period
(12 weeks)
Quarterly
Monitoring
Full blood count (FBC) 2 1 £5.97 £2.98
Erythrocyte sedimentation rate (ESR) 2 1 £5.90 £2.95
Liver function test (LFT) 2 1 £1.50 £0.75
Urea and Electrolytes (U&E) 2 1 £2.77 £1.38
Chest X-ray 1 0.25 £26.19 £6.55
Tuberculosis (TB) Heaf test 1 0 £8.72 £0.00
Antinuclear antibody (ANA) 1 0 £4.65 £0.00
Double-stranded (ds) DNA test 1 0 £4.65 £0.00
Specialist visit 2 0.5 £200.00 £50.00
MRI cost 1 0 £144.45 £0.00
C reactive protein (CRP) test 1 0 £6.62 £0.00
Total - - £411 £65
7.5.6.4 Summary of drug acquisition, administration and monitoring costs
Tables 91 and 92 summarise the drug acquisition, administration and monitoring costs applied in the
economic model, for the initial 12-week period and on an annual basis thereafter.

Technology Assessment Report for NICE
TNF-alpha inhibitors for ankylosing spondylitis and nr-axSpA
15/12/2014 203
Table 91 - Summary of drug acquisition, administration and monitoring costs used in economic model – AS population
Initial period (3 months) Annual cost (after initial 3 months) Total costs
Treatment – Dosage Acquisition cost Administration
cost Monitoring costs Acquisition cost
Administration
cost Monitoring costs
Initial period (3
months)
Subsequent
annual costs
Adalimumab (40 mg eow) £2,112.8 £49.0 £260.4 £8,451.4 £0.0 £232.3 £2,422.2 £8,683.6
Certolizumab 200 mg/2wks £3,575.0 £49.0 £260.4 £8,580.0 £0.0 £232.3 £3,884.4 £8,812.3
Certolizumab 200 mg/2wks,
with PAS £0.0 £49.0 £260.4 £8,580.0 £0.0 £232.3 £309.4 £8,812.3
Etanercept 25 mg twice/week £2,145.1 £49.0 £260.4 £8,580.5 £0.0 £232.3 £2,454.5 £8,812.8
Etanercept 50 mg once/week £2,145.0 £49.0 £260.4 £8,580.0 £0.0 £232.3 £2,454.4 £8,812.3
Golimumab 50mg once
monthly, with PAS £2,105.6 £49.0 £260.4 £8,422.4 £0.0 £232.3 £2,415.0 £8,654.7
Infliximab 5mg/kg every 7
weeks, 4 vials £5,639.7 £978.8 £260.4 £11,509.6 £1,997.5 £232.3 £6,878.8 £13,739.3
Table 92 - Summary of drug acquisition, administration and monitoring costs used in economic model – nr-axSpA population
Initial period (3 months) Annual cost (after initial 3 months) Total costs
Treatment – Dosage Acquisition drug
cost
Administration
cost Monitoring costs
Acquisition drug
cost
Administration
cost Monitoring costs
Initial period (3
months)
Subsequent
annual costs
Adalimumab (40 mg eow) £2,112.8 £49.0 £411.4 £8,451.4 £0.0 £258.5 £2,573.3 £8,709.8
Certolizumab 200 mg/2wks £3,575.0 £49.0 £411.4 £8,580.0 £0.0 £258.5 £4,035.4 £8,838.5
Certolizumab 200 mg/2wks,
with PAS £0.0 £49.0 £411.4 £8,580.0 £0.0 £258.5 £460.4 £8,838.5
Etanercept 25 mg twice/week £2,145.1 £49.0 £411.4 £8,580.5 £0.0 £258.5 £2,605.5 £8,838.9
Etanercept 50 mg once/week £2,145.0 £49.0 £411.4 £8,580.0 £0.0 £258.5 £2,605.4 £8,838.5
Golimumab 50mg once
monthly, with PAS £2,105.6 £49.0 £411.4 £8,422.4 £0.0 £258.5 £2,566.0 £8,680.9
Infliximab 5mg/kg every 7
weeks, 4 vials £5,796.08 £1,005.9 £411.4 £11,509.6 £1,997.5 £258.5 £7,213.4 £13,765.5

Technology Assessment Report for NICE
TNF-alpha inhibitors for ankylosing spondylitis and nr-axSpA
15/12/2014 204
7.5.6.5 Long-term disease management costs
Patients who remain on anti-TNF treatment incur disease management costs. Previously published
economic evaluations employed observational cohort studies to estimate disease management costs
and modelled these according to BASDAI and/or BASFI. (for example, NICE TA143). Also, as
discussed in Section 5, the majority of the manufacturer submissions within this appraisal (and the
LRiG model in TA 143) have analysed healthcare resource use data from the Outcomes in Ankylosing
Spondylitis International Study (OASIS)157
to estimate disease management costs. The submission by
Pfizer estimated disease-related costs using data from Rafia et al (2012)158
arguing that it is a more
recent study and provides a UK specific cost estimate. However, the comparative analysis of the
different long-term cost models in Appendix 14 showed that the Rafia model provided considerably
lower cost estimates; the reasons for this discrepancy are not clear.
In NICE TA143 the committee judged that the OASIS data were the most reliable source, being a
two-year prospective study of 208 AS patients from four centres in France, Belgium and the
Netherlands, and collecting clinical assessments and economic data including BASDAI and BASFI
every 2 or 6 months. The NICE committee also decided that only BASFI should be employed as the
major predictor of costs as it reflects long-term disease progression, whilst BASDAI appears to
fluctuate but not increase over time.
The base case of the York model uses the exponential BASFI regression model from the AbbVie
submission, which is a re-analysis of the OASIS resource utilisation data using up-to-date published
tariffs (NHS Reference costs 2012-13166
, PSSRU 2013169
).
Table 93 - Disease-related costs
Cost (£) Source
Base-case £1284.186 * EXP(0.213 × BASFI) AbbVie submission; re-
analysis of OASIS157 data
7.5.7 Adverse events
Only serious infections and TB reactivation were included in the economic model. Anti-TNF excess
rates versus conventional care for serious infections and TB reactivation for were sourced from the
Cochrane review of adverse events127
which has been discussed in Section 4.2.5. The cost of a serious
infection was sourced from the Pfizer submission and was assumed to be £1,457 based on a weighted
average of relevant HRG costs from NHS Reference costs 2012-2013166
(Table 94). The cost of
tuberculosis was estimated to be £3,204.5 per episode and was based on a weighted average of the
relevant HRG codes with different levels of severity (codes DZ14C, DZ14D, DZ14E) from NHS
Reference costs 2012-2013.

Technology Assessment Report for NICE
TNF-alpha inhibitors for ankylosing spondylitis and nr-axSpA
15/12/2014 205
Table 94 - Costs of serious infection (from Pfizer submission)
Currency
Code
Currency Description Activity National Average Unit Cost
WA03C Septicaemia, with CC Score 0-1 44956 £1,792
DZ23G Bronchopneumonia with CC Score 0-4 5231 £1,252
LA04M Kidney or Urinary Tract Infections, with Interventions, with
CC Score 0-2
2587 £2,289
PA16B Major Infections with CC Score 0 7859 £1,573
DZ22J Unspecified Acute Lower Respiratory Infection with CC
Score 0-1
21109 £657
DZ21U Chronic Obstructive Pulmonary Disease or Bronchitis,
without NIV, without Intubation, with CC Score 0-3
52421 £1,453
Weighted average cost £1,457
Abbreviations: CC, complications; NIV, Non-invasive ventilation.
Source: NHS reference costs schedule 2012-13166
7.5.8 Mortality
Gender-specific SMRs are applied to the mortality rates from the general population to calculate
separate adjusted mortality rates for AS and nr-axSpA populations in the model (Bakland [2011])18
.
7.6 Analytic methods
The expected costs and QALYs of the alternative anti-TNFs are estimated and cost-effectiveness
assessed based on the incremental cost per additional QALY gained. Since an assumption is made
concerning the similarity in terms of clinical effect between the alternative anti-TNFs, the differences
between each of the treatments are driven entirely by their respective acquisition, administration and
monitoring costs. Under this assumption, inevitably the lowest cost TNF-alpha inhibitor would clearly
dominate (i.e. lower cost and equal effect) in a fully incremental comparison of cost-effectiveness.
Consequently, each TNF-alpha inhibitor is compared separately versus conventional care alone. This
provides a more consistent basis for assessing the impact that the different drug costs have across each
separate scenario.
Probabilistic sensitivity analysis (PSA) is used to assess the implications of parameter uncertainty (the
imprecision with which input parameters are estimated). The mean costs and QALY reported in the
tables are derived from the PSA analysis and the probabilities that each TNF-alpha inhibitor is more
cost-effective than conventional care alone are reported at thresholds of £20,000 and £30,000 per
QALY.
7.6.1 Sensitivity analyses
A number of separate scenarios are presented to assess the implications of key parameter assumptions
and sources of structural uncertainty in the model. These include:

Technology Assessment Report for NICE
TNF-alpha inhibitors for ankylosing spondylitis and nr-axSpA
15/12/2014 206
Scenario 1: No response to conventional care assumed at 12 weeks.
The base-case model incorporates the probability of response to conventional care at 12 weeks and
assigns separate baselines to responders and non-responders. Although the changes in
BASDAI/BASFI estimated at 12-weeks for conventional care are assumed to disappear in the
following 12-week cycle, the separate baselines estimated for responders and non-responders are
retained for the remainder of the model horizon. Given uncertainties surrounding the nature of the
‘placebo’ response assumed to apply to conventional care and whether this would be evident in actual
clinical practice, a separate scenario was modelled which assumed that no patients receiving
conventional care would achieve a BASDAI50 response. This scenario was based on a separate
simulation using the extended synthesis model where the magnitude of ‘placebo’ effect was assumed
to be 0. Hence, employing this scenario, the impact of the ‘placebo’ effect is effectively netted out of
the model for both conventional care and the anti-TNFs. Hence, while the difference in response rates
and BASDAI/BASFI scores for responders to anti-TNFs remains similar to the base-case model, the
absolute response rate for anti-TNFs and the absolute BASDAI/BASFI scores are lower when the
adjustment is applied. Also, since no response is assumed for conventional care, a single baseline
BASDAI and BASFI score is applied to conventional care patients.
Scenario 2: Different baselines assumed for responders and non-responders.
In the base-case analysis, the extended synthesis model is used to estimate both changes in BASDAI
and BASFI conditional upon BASDAI50 response as well as different baseline BASDAI/BASFI
scores for responder and non-responders. It was noted in Section 6 that there appeared a disparity in
the magnitude of the difference in the conditional baseline scores estimated from the extended
synthesis model compared to the differences reported by those manufacturers who provided additional
data on request. Specifically, the difference between responders and non-responders appeared higher
in our extended synthesis compared to the direct data reported by manufacturers. To explore the
potential impact of this difference on the cost-effectiveness results, a separate scenario was
undertaken wherein the difference in the conditional baselines was based on a pooled estimate of the
differences across the trials provided by manufacturers rather than those estimated by the extended
synthesis model.
In addition to exploring the impact of assuming different baselines, this scenario also included a
pooled estimate of the change in BASDAI/BASFI scores for responders and non-responders reported
by manufacturers. Hence, in this scenario, the extended synthesis model is only used to predict the
response to BASDAI50; the differences in the conditional baselines and change scores being derived
from pooled estimates from the data reported by manufacturers.
Scenario 3: No effect of anti-TNFs on BASFI progression.

Technology Assessment Report for NICE
TNF-alpha inhibitors for ankylosing spondylitis and nr-axSpA
15/12/2014 207
In the base-case model, a treatment effect is applied from year 4 of the model on the rate of further
BASFI progression for patients who continue to receive TNF-alpha inhibitors beyond this time point.
Given the uncertainty reported in Section 4 surrounding existing evidence for anti-TNFs in relation to
disease modification, a separate scenario was explored which assumed that the rate of BASFI
progression would be the same for patients receiving anti-TNFs and conventional care alone.
Scenario 4: Treatment effect of anti-TNFs applied from start of model (BASFI progression).
A separate scenario was also undertaken assuming that the treatment effect on further BASFI
progression would be incurred from the start of the model, as opposed to year 4. This scenario
assumes that any disease modification would be achieved immediately compared to the delayed effect
assumed in the base-case.
Scenario 5: Utilities – linear BASDAI/BASFI model.
The base-case analysis in both the AS and nr-axSpA populations are based on the non-linear mapping
algorithms reported in the submission by Pfizer. A separate scenario was run in both populations
using an alternative linear model which has been applied in previous NICE appraisals (referred to as
the ‘MSD’ algorithm in Section 7.5.5). This scenario was incorporated to explore the impact of using
a linear model and to provide results which are more consistent with the utility approach applied in
previous NICE appraisals (TA143, 233).
Scenario 6 (nr-axSpA only): Trials in nr-axSpA and AS populations combined.
The base-case analysis for the nr-axSpA population is based on the extended synthesis model using
only the trials reporting in this population. A separate scenario was undertaken based on the results
from the extended synthesis model which combined the AS and nr-axSpA trials.
7.6.2 Model validation
The conceptualisation of the model and related structural assumptions were informed by the review of
existing models and discussions with two clinical advisors. The face validity of the model structure,
data sources and key assumptions was addressed using inputs based on systematic reviews, targeted
searching and clinical input. Verification of the model and the associated inputs was undertaken using
a staged process. One researcher developed the initial model structure and the preliminary coding.
This was then checked and extended for the final model by a second researcher. Both researchers
were subsequently involved in the subsequent quality assurance process entailing detailed cross-
checks of input data against their respective sources and undertook extensive logical checks and
scenarios to assess the performance of the model. Two other researchers were involved in further
checks of key aspects including the integration of the results from the extended synthesis within the
Excel model. A 5th researcher was involved in all stages with preparing and checking parameter

Technology Assessment Report for NICE
TNF-alpha inhibitors for ankylosing spondylitis and nr-axSpA
15/12/2014 208
inputs for the model. Cross-validation was assessed by comparing the results with existing models and
identifying differences and their causes.
7.7 Results of the independent economic assessment
7.7.1 Base case results – AS population
The base-case results for the AS population, for the alternative rebound assumptions, are reported in
Tables 95 and 96.
Table 95 - Base-case cost-effectiveness results - AS (rebound equal to gain)
Strategy Total
QALYs
Incremental
QALYs
Total costs
(£)
Incremental
costs (£)
ICER (£) Probability
of CE
£20K
Probability
of CE
£30K
Conventional
Therapy 7.245 - 110,821 - - - -
Certolizumab
PAS 8.163 0.918 128,485 17,665 19,240 0.550 0.895
Golimumab 8.163 0.918 130,173 19,352 21,079 0.427 0.841
Adalimumab 8.163 0.918 130,257 19,436 21,170 0.423 0.839
Etanercept 8.163 0.918 130,630 19,810 21,577 0.402 0.826
Certolizumab 8.163 0.918 132,059 21,238 23,133 0.299 0.761
Infliximab 8.163 0.918 148,073 37,252 40,576 0.001 0.089
Probability of CE £20/30K = probability that the TNF-alpha inhibitor, when compared to conventional care, is a cost-
effective option at the stated threshold
In the rebound equal to gain scenario, the ICER of the alternative anti-TNFs varied between £19,240
(certolizumab with the proposed PAS) to £40,576 per additional QALY (infliximab). Infliximab had
the highest ICER (£40,576 per QALY) and the lowest probability of being cost-effective at a £20,000
and £30,000 per QALY threshold (0.001 and 0.089, respectively). Excluding infliximab, the ICERs
of the other anti-TNFs were similar, ranging from £19,240 (certolizumab with the proposed PAS) to
£23,133 (certolizumab without the proposed PAS).
As previously highlighted, the difference in the ICERs between the individual anti-TNFs is driven
entirely by the different acquisition and administration costs associated with each. Excluding
infliximab, the probability that each TNF-alpha inhibitor was more cost-effective than conventional
care alone ranged between 0.299 and 0.550 at a £20,000 per QALY threshold and 0.761 to 0.895 at a
£30,000 threshold. There was less variation in these probabilities when the proposed PAS for
certolizumab was included, ranging from 0.402 to 0.550 at a £20,000 per QALY threshold and from
0.826 to 0.895 at a £30,000 threshold.
Table 96 - Base-case cost-effectiveness results (rebound to conventional care)

Technology Assessment Report for NICE
TNF-alpha inhibitors for ankylosing spondylitis and nr-axSpA
15/12/2014 209
Strategy Total
QALYs
Incremental
QALYs
Total costs
(£)
Incremental
costs (£)
ICER (£) Probability
of CE
£20K
Probability
of CE
£30K
Conventional
Therapy 7.265 - 109,933 - - - -
Certolizumab
PAS 7.867 0.603 130,277 20,344 33,762 0.035 0.399
Golimumab 7.867 0.603 131,960 22,027 36,554 0.019 0.299
Adalimumab 7.867 0.603 132,045 22,111 36,695 0.017 0.293
Etanercept 7.867 0.603 132,423 22,489 37,322 0.017 0.275
Certolizumab 7.867 0.603 133,851 23,918 39,693 0.011 0.203
Infliximab 7.867 0.603 150,022 40,088 66,529 0.000 0.001
Probability of CE £20/30K = probability that the TNF-alpha inhibitor, when compared to conventional care, is a cost-
effective option at the stated threshold
In the rebound to conventional care scenario, the ICER of the alternative anti-TNFs varied between
£33,762 (certolizumab with the proposed PAS) to £66,529 per additional QALY (infliximab).
Infliximab had the highest ICER (£66,529 per QALY) and the lowest probability of being cost-
effective at a £20,000 and £30,000 per QALY threshold (0.000 and 0.001, respectively). Excluding
infliximab, the ICERs of the other anti-TNFs varied between £33,762 (certolizumab with the
proposed PAS) to £39,693 (certolizumab without the proposed PAS) and the probability that each
TNF-alpha inhibitor was more cost-effective than conventional care alone ranged between 0.011 and
0.035at a £20,000 per QALY threshold and 0.203 to 0.399 at a £30,000 threshold. There was less
variation in these probabilities when the proposed PAS for certolizumab was included, ranging from
0.017 to 0.035 at a £20,000 per QALY threshold and from 0.275 to 0.399 at a £30,000 threshold.
7.7.2 Base case results – nr-axSpA population
The base-case results for the nr-axSpA population, for the alternative rebound assumptions, are
reported in Tables 97 and 98.
Table 97 - Base-case cost-effectiveness results – nr-axSpA (rebound equal to gain)
Total
QALYs
Incremental
QALYs
Total costs
(£)
Incremental
costs (£)
ICER (£) Probability
of CE
£20K
Probability
of CE
£30K
Conventional
Therapy 9.956 - 89,493 - - - -
Certolizumab
PAS 11.351 1.395 128,911 39,418 28,247 0.139 0.591
Adalimumab 11.351 1.395 130,316 40,823 29,253 0.106 0.545
Etanercept 11.351 1.395 131,057 41,563 29,784 0.093 0.529
Certolizumab 11.351 1.395 132,484 42,991 30,807 0.066 0.482
Probability of CE £20/30K = probability that the TNF-alpha inhibitor, when compared to conventional care, is a cost-
effective option at the stated threshold
In the rebound equal to gain scenario, the ICER of the alternative anti-TNFs varied between £28,247
(certolizumab with the proposed PAS) to £30,807 per additional QALY (certolizumab without the

Technology Assessment Report for NICE
TNF-alpha inhibitors for ankylosing spondylitis and nr-axSpA
15/12/2014 210
proposed PAS). The probability that each TNF-alpha inhibitor was more cost-effective than
conventional care alone ranged between 0.066 and 0.139 at a £20,000 per QALY threshold and 0.482
to 0.591 at a £30,000 threshold. Again, there was less variation in these probabilities when only the
proposed PAS for certolizumab was considered, ranging from 0.093 to 0.139 at a £20,000 per QALY
threshold and from 0.529 to 0.591 at a £30,000 threshold.
Table 98 - Base-case cost-effectiveness results – nr-axSpA (rebound to conventional care)
Total
QALYs
Incremental
QALYs
Total costs
(£)
Incremental
costs (£)
ICER (£) Probability
of CE
£20K
Probability
of CE
£30K
Conventional
Therapy 9.880 - 89,395 - - - -
Certolizumab
PAS 11.139 1.259 130,341 40,946 32,528 0.062 0.429
Adalimumab 11.139 1.259 131,740 42,346 33,639 0.045 0.387
Etanercept 11.139 1.259 132,486 43,091 34,232 0.039 0.369
Certolizumab 11.139 1.259 133,913 44,518 35,365 0.030 0.312
Probability of CE £20/30K = probability that the TNF-alpha inhibitor, when compared to conventional care, is a cost-
effective option at the stated threshold
In the rebound to conventional care scenario, the ICER of the alternative anti-TNFs varied between
£32,528 (certolizumab with the proposed PAS) to £35,365 per additional QALY (certolizumab
without the proposed PAS). The probability that each TNF-alpha inhibitor was more cost-effective
than conventional care alone varied between 0.030 and 0.062 at a £20,000 per QALY threshold and
0.312 to 0.429 at a £30,000 threshold. Again, there was less variation in these probabilities when only
the proposed PAS for certolizumab was included, ranging from 0.039 to 0.062 at a £20,000 per
QALY threshold and from 0.369 to 0.429 at a £30,000 threshold.
7.7.3 Sensitivity analyses results – AS population
Table 99 summarises the scenarios undertaken for the AS population.
Table 99 - Summary of cost-effectiveness scenarios – AS population
No. Parameter/structural Approach in scenario Approach in base-case
1 Conventional care (‘placebo’)
response
No response to conventional care
assumed at 12 weeks
Response to conventional care
included at 12 weeks
2. Different baselines assumed for
responders and non-responders
and change in BASDAI/BASFI
scores
Separate baselines based on
pooled estimates provided by
manufacturers. Changes in
BASDAI/BASFI conditioned on
response also based on pooled
estimates provided by manufacturers
Separate baselines and changes in
BASDAI/BASFI conditioned on
responses estimated via extended
synthesis model
3. BASFI Progression No effect of anti-TNFs on BASFI
progression
Treatment effect applied from
year 4 onwards
4. BASFI progression Treatment effect of anti-TNFs Treatment effect applied from

Technology Assessment Report for NICE
TNF-alpha inhibitors for ankylosing spondylitis and nr-axSpA
15/12/2014 211
applied from start of model year 4 onwards
5. Utilities Linear BASDAI/BASFI model
(based on Kobelt)
Non-linear BASDAI/BASFI
model (Pfizer submission)
Each of these scenarios was undertaken for the two alternative rebound assumptions. Tables 100 and
101 summarise the ICER estimates for each scenario. Full ICER tables for each scenario are reported
in Appendix 15.
Table 100 - Summary of ICERs across scenarios (rebound equal to gain) – AS population
Scenario
Strategy Base-case 1 2 3 4 5
Conventional
Therapy - - - -
Certolizumab
(PAS) 19,240 20,319 11,527 20,655 18,466 23,290
Golimumab 21,079 22,920 12,785 22,581 20,213 25,469
Adalimumab 21,170 23,013 12,851 22,677 20,301 25,579
Etanercept 21,577 23,425 13,143 23,106 20,695 26,073
Certolizumab 23,133 25,495 14,220 24,739 22,180 27,926
Infliximab 40,576 43,510 26,699 43,125 39,037 49,021
Table 101 - Summary of ICERs across scenarios (rebound to conventional care) – AS population
Scenario
Strategy Base-case 1 2 3 4 5
Conventional
Therapy - - - - -
Certolizumab
(PAS) 33,762 34,229 25,530 36,518 32,222 29,414
Golimumab 36,554 38,068 27,986 39,483 34,910 31,827
Adalimumab 36,695 38,207 28,107 39,634 35,045 31,950
Etanercept 37,322 38,824 28,652 40,306 35,647 32,499
Certolizumab 39,693 41,885 30,731 42,828 37,928 34,554
Infliximab 66,529 68,815 54,045 71,565 63,684 58,022
The ICER estimates appeared to remain relatively stable across the majority of scenarios compared to
the base-case ICER estimates. The exception to this appeared to be Scenario 2 which utilised data
submitted on request by several manufacturers which was used to inform the differences in the
conditional baselines and the change scores assumed for responders vs. non-responders. In summary,
when the manufacturer’s data were used the ICER estimates became more favourable towards the
anti-TNFs. The more favourable results are driven by smaller differences between responders and

Technology Assessment Report for NICE
TNF-alpha inhibitors for ankylosing spondylitis and nr-axSpA
15/12/2014 212
non-responders in terms of their conditional baselines and marginally higher differences in the
conditional change scores. Both differences result in improvements in the ICER estimates compared
to the base-case results derived from the extended synthesis model.
7.7.4 Sensitivity analyses results – nr-axSpA population
Table 102 summarises the scenarios undertaken for the nr-axSpA population.
Table 102 - Summary of cost-effectiveness scenarios – nr-axSpA population
No. Parameter/structural Approach in scenario Approach in base-case
1 Conventional care (‘placebo’)
response
No response to conventional care
assumed at 12 weeks
Response to conventional care
included at 12 weeks
2 Different baselines assumed for
responders and non-responders
and change in BASDAI/BASFI scores
Separate baselines based on
pooled estimates provided by
manufacturers. Changes in
BASDAI/BASFI conditioned on
response also based on pooled
estimates provided by manufacturers
Separate baselines and changes in
BASDAI/BASFI conditioned on
responses estimated via extended synthesis model
3. BASFI Progression No effect of anti-TNFs on BASFI progression
Treatment effect applied from year 4 onwards
4. BASFI progression Treatment effect of anti-TNFs
applied from start of model
Treatment effect applied from
year 4 onwards
5. Utilities Linear BASDAI/BASFI model
(based on Kobelt)
Non-linear BASDAI/BASFI
model (Pfizer submission)
6. Treatment effect of anti-TNFs Trials in nr-axSpA and AS
populations combined
Only trials in nr-axSpA included
Each of these scenarios was undertaken for the two alternative rebound assumptions. Tables 103 and
104 summarise the ICER estimates for each scenario. Full ICER tables for each scenario are reported
in Appendix 15.
Table 103 - Summary of ICERs across scenarios (rebound equal to gain) – nr-axSpA population
Scenario
Strategy Base-case 1 2 3 4 5 6
Conventional
Therapy - - - - - - -
Certolizumab
(PAS) 28,247 34,841 25,482 28,643 27,471 25,324 28,282
Adalimumab 29,988 37,884 27,302 29,670 28,466 29,228 29,512
Etanercept 29,253 38,507 27,821 30,208 28,988 29,753 30,041
Certolizumab 30,807 40,949 29,378 31,250 29,996 30,732 31,034

Technology Assessment Report for NICE
TNF-alpha inhibitors for ankylosing spondylitis and nr-axSpA
15/12/2014 213
Table 104 - Summary of ICERs across scenarios (rebound to conventional care) – nr-axSpA population
Scenario
Strategy Base-case 1 2 3 4 5 6
Conventional
Therapy - - - - - - -
Certolizumab
(PAS) 32,528 40,928 29,884 34,416 31,841 26,900 33,184
Adalimumab 33,639 44,365 31,942 35,615 32,940 27,850 34,270
Etanercept 34,232 45,078 32,528 36,241 33,523 28,343 34,866
Certolizumab 35,365 47,842 34,288 37,456 34,642 29,303 35,985
In common with the AS scenarios, the ICER estimates appeared to remain relatively stable across the
majority of scenarios compared to the base-case ICER estimates. However, the impact of applying
adjustments to the conditional baseline estimates and BASDAI/BASFI scores provided by the
manufacturers (Scenario 2) had less of an impact in the nr-axSpA population. The scenario which
showed the largest variation compared to the base-case analysis was Scenario 1. This scenario was
based on results from the extended synthesis which excluded any placebo effect and resulted in a
single baseline applied to all conventional care patients. The differences in the ICERs appear largely
as a result of the impact of ignoring the non-linear relationship between baseline BASDAI/BASFI
scores due to variation in the baseline of responders vs. non-responders in Scenario 1. Interestingly,
the impact of this approach appears more marked in the nr-axSpA population, compared to the AS
population, which is likely to be driven by several inter-related factors including the magnitude of
difference assumed between the conditional baseline scores and the absolute BASDAI and BASFI
scores which differ across the populations.
7.8 Discussion and comparison with manufacturer models
Based on an underlying assumption of similarity in the clinical effectiveness of each of the anti-TNFs,
the York model demonstrates that the cost-effectiveness results are dependent on several factors,
including: (i) the different acquisition and administration costs; (ii) the rebound assumption applied to
patients who discontinue therapy; (iii) the magnitude of the change in BASDAI/BASFI scores
assumed for responders vs. non-responders; (iv) the different baseline BASDAI/BASFI scores
assumed for responders vs non-responders and (v) the impact of anti-TNFs on the rate of longer term
BASFI progression.
Interestingly, the importance of specific factors also appears to vary across the separate indications.
For example, the impact of the alternative rebound assumptions appears more marked in the AS
population compared to the nr-axSpA population. This appears largely driven the smaller rate of
BASFI progression applied in the York model to the nr-axSpA population, such that the impact of

Technology Assessment Report for NICE
TNF-alpha inhibitors for ankylosing spondylitis and nr-axSpA
15/12/2014 214
alternative assumptions regarding possible rebound effects has a less significant impact within this
population. This difference also has an important bearing on the subsequent interpretation of the base-
case ICERs estimated by the York model in the separate populations. Our findings suggest that the
ICER estimates for anti-TNFs appear more favourable for the AS population, relative to those
estimated for the nr-axSpA population, based on the rebound equal to gain scenario. The more
favourable results in the AS population based on the rebound equal to gain scenario appears to be
driven by 2 main factors: (i) the smaller conditional change in BASDAI/BASFI scores estimated for
the nr-axSpA population and (ii) the lower rate of BASFI progression assumed for the nr-axSpA
population. However, this finding appears reversed in the rebound to conventional care scenario.
Interestingly, within this scenario, the lower conditional change in BASDAI/BASFI scores appears
offset by the less significant influence of BASFI progression in the nr-axSpA model. That is, the
impact on the ICERs of the 2 rebound assumptions is closely related to the underlying rate of BASFI
progression assumed and the contribution that this makes to the respective ICER estimates under the
separate scenarios. However, it should also be noted that, although the ICERs for the nr-axSpA
population appear more favourable in this scenario compared to those estimated for the AS
population, all of the ICER estimates exceeded £30,000 per QALY in the York base-case across both
populations.
Tables 105 and 106 compare the results of the York model with the base-case results reported by each
manufacturer for the alternative populations. In contrast to the manufacturer models which reported a
single base-case based on an assumption of either rebound equal to gain (AbbVie, Pfizer, MSD) or
rebound to conventional care (UCB), the York model presents both rebound scenarios in order to
represent the potential limits to the ICER; recognising that the reality lies somewhere between these
scenarios.

Technology Assessment Report for NICE
TNF-alpha inhibitors for ankylosing spondylitis and nr-axSpA
15/12/2014 215
Table 105 - Comparison of cost-effectiveness results from York model vs manufacturers (AS population)
AbbVie
UCB
Pfizer
MSD
York
(Rebound
equal to gain)
York
(Rebound to
conventional
care)
ICER (£) ICER (£) ICER (£) ICER (£) ICER (£) ICER (£)
Conventional
care
- - - - - -
Adalimumab 16,391 19,932 20,909 19,275 21,170 36,695
Certolizumab 17,067 16,647* 19,586* 19,401* 19,240* 33,762*
Etanercept 16,897 19,272 20,938 21,972 21,577 37,322
Golimumab 16,535 19,049 21,288 19,070 21,079 36,554
Infliximab 44,448 42,671 37,741 42,532 40,576 66,529
*PAS costs assumed for certolizumab
Table 106 - Comparison of cost-effectiveness results from York model vs manufacturers (nr-axSpA
population)
AbbVie
(Adalimumab)
UCB
(Certolizumab)
Pfizer
(Etanercept)
York
(Rebound equal
to gain)
York
(Rebound to
conventional
care)
ICER (£) ICER (£) ICER (£) ICER (£) ICER (£)
Conventional care - - - - -
Adalimumab 13,228 30,370 23,242 29,988 33,639
Certolizumab 12,866 15,615* 23,575* 28,247* 32,528*
Etanercept Not Assessed 50,692 23,195 29,253 34,232
*PAS costs assumed for certolizumab
Although there are a number of important differences in approaches both amongst the different
manufacturer models and compared to the York model, the comparison of ICERs based on the York
rebound equal to gain scenario appear broadly consistent in the AS population. This might appear
surprising given that the York model is based on 2 key assumptions that appear less favourable than
those used by manufacturers, specifically: (i) incorporating separate baseline BASDAI/BASFI scores
for responders and non-responders which assume that responders are likely to be less severe in terms
of their baseline BASDAI and BASFI scores than non-responders and (ii) only incorporating an effect
of anti-TNFs on disease progression for patients remaining on therapy for at least 4-years. However,
these appear counterbalanced by the higher rate of BASFI progression applied to AS patients (0.082
[0-10 scale] units per annum compared to estimates between 0.056 and 0.07 assumed by the
manufacturers). As we highlighted at the start of this section, it is our view that the York model has a
more coherent basis for modelling longer term BASFI progression.
Another important counterbalancing effect is the use of the conditional scores for responders and non-
responders obtained via the extended synthesis within the York model. This contrasts with the

Technology Assessment Report for NICE
TNF-alpha inhibitors for ankylosing spondylitis and nr-axSpA
15/12/2014 216
selective approaches (i.e. using conditional scores from single studies or assumptions) or use of longer
term follow-up and/or open-label sources (i.e. implicitly assuming that patients who continue to
participate in longer-term follow up and open label sources are more likely to be responders than
patients who do not). Consequently, the change scores assumed in the York model for BASDAI50
responders appear higher than those assumed by several of the manufacturers. The approach applied
within the York model is based on a more generalised framework for synthesis and hence utilises
more evidence than considered by the manufacturers. This approach directly informs the conditional
change scores which are fundamental to an appropriate assessment of the cost-effectiveness when a
response-based assessment is incorporated to determine eligibility for continued treatment.
In Section 5 it was noted that there appeared more variation in the ICER estimates reported across the
manufacturer submissions in the nr-axSpA population compared to those reported in the AS
population. Again, the ICER estimates reported by the York model in the nr-axSpA population do not
appear inconsistent with the range of ICERs reported across the separate manufacturers. However,
any attempt to formally cross-validate the results from the York model with those reported by the
manufacturers is difficult given the contrasting approaches and assumptions employed. Since the
York model utilises several of the key parameter inputs reported in the submission by Pfizer, a
comparison may be more usefully made by comparing the results between the York model and those
reported by Pfizer. In general the ICER estimates appear less favourable in the York model compared
to those reported by Pfizer. One possible explanation for these differences is that the York model
employs a lower rate of BASFI progression and only assumes that anti-TNFs affect this rate after at
least 4-years of treatment. However, our results have also shown that the impact of progression
appears less of a driver of cost-effectiveness in the nr-axSpA model. Another possible explanation is
the use of different baselines assumed for responders and non-responders assumed in the York model.
That is, the York model assumes that responders and typically less severe in terms of baseline
BASDAI/BASFI scores compared to non-responders. Consequently, an additional scenario was
undertaken using the York model to further assist in cross-validation. For this scenario, an assumption
was made that the responders and non-responders did not differ in terms of baseline BASDAI/BASFI
scores.
The results of the additional validation scenario are reported in Table 107. The ICERs in this scenario
appeared closer to those reported by Pfizer. Hence, this additional validation scenario is important in
helping to identify potential drivers of difference between the results of the York model and those
reported by the manufacturers. The scenario also demonstrates that the assumption made concerning
potential differences (and the magnitude of any difference) between the baseline BASDAI/BASFI
scores of responders and non-responders has an important impact on the cost-effectiveness results.
Hence, studies which are based on similar baselines are likely to be potentially overly optimistic in the

Technology Assessment Report for NICE
TNF-alpha inhibitors for ankylosing spondylitis and nr-axSpA
15/12/2014 217
subsequent ICER estimates reported for anti-TNFs. Equally, it might be argued that the results from
the York base-case model maybe conservative towards the anti-TNFs, since the magnitude of
differences in the baseline scores estimated from the extended synthesis model appeared higher than
those obtained on request from manufacturers (although the direction of the difference was
consistent). Hence, in a similar manner to which the different rebound assumptions represent the
potential limits on the ICER given uncertainties surrounding rebound, the differences in the ICERs
based on assuming no difference in baselines and the magnitude of differences employed in the York
base-case may also represent the limits of the ICER based on uncertainty surrounding the magnitude
of this difference. Given the potential importance of this assumption, Appendix 15 reports the full
ICER results for each population (and under each rebound assumption) assuming identical baselines
for responders and non-responders.
Table 107 - Nr-axSpA – Additional validation scenario (rebound equal to gain and responders/non-
responders do not differ in terms of baseline BASDAI/BASFI scores)
Total
QALYs
Incremental
QALYs
Total costs
(£)
Incremental
costs (£)
ICER (£) Probability
of CE
£20K
Probability
of CE
£30K
Conventional
Therapy 9.977 - 88,692 - - - -
Certolizumab
(PAS) 11.551 1.574 125,205 36,513 23,199 0.390 0.759
Adalimumab 11.551 1.574 126,606 37,914 24,089 0.341 0.733
Etanercept 11.551 1.574 127,350 38,658 24,562 0.319 0.720
Certolizumab 11.551 1.574 128,777 40,085 25,469 0.272 0.702
Probability of CE £20/30K = probability that the TNF-alpha inhibitor, when compared to conventional care, is a cost-
effective option at the stated threshold
Although the York model provides a number of significant developments to existing cost-
effectiveness analyses, there are still several potential limitations. Firstly, in common with all existing
models, subsequent linkages to costs and QALYs are related to BASDAI and BASFI, largely due to
the existence of data. Secondly, the cost-effectiveness estimates are based on uncertain projections of
BASDAI and BASFI over a longer time-horizon in order to generate more appropriate lifetime
estimates of costs and QALYs required for cost-effectiveness assessments. Although extensive efforts
have been made to identify a more appropriate basis for informing these longer term estimates
(particularly for BASFI), inevitably, significant uncertainty remains. Thirdly, it should be noted that
there are potential benefits which have not been formally captured and quantified within the current
model. Specifically any potential impact on productivity costs and any additional benefits that anti-
TNFs may confer for other co-morbidities (e.g. IBD, psoriasis etc). A final limitation is that it was not
possible to include the generic version of infliximab (Inflectra) within the analysis since a formal list
price was not available at the time of the assessment.

Technology Assessment Report for NICE
TNF-alpha inhibitors for ankylosing spondylitis and nr-axSpA
15/12/2014 218
In addition, the York model has not specifically addressed important clinical questions concerning the
issue of intermittent and sequential use of anti-TNFs. However, in the absence of robust clinical
evidence from RCTs, existing evidence is clearly subject to potential confounding. Consequently,
existing attempts to model sequential therapy within the current manufacturer submissions (Pfizer
only) are largely based on applying simple adjustments to 1st line efficacy but which are unlikely to
provide a robust basis for informing these decisions. Clearly, until such time that more robust data are
available, a rough rule of thumb could similarly be applied to the results presented from the York
model, such that the ICERs of a 2nd
line TNF-alpha inhibitor in a patient who had previously
responded but subsequently lost response, might be in the order of one-third higher than the results
presented here.
Finally, it is important to appreciate that the assessments of cost-effectiveness reported in the York
model are based on a normative approach. That is, they are based on the assumption that 12-week
continuation rules (and ongoing monitoring of response) would be fully adhered to in clinical practice.
Hence, they do not necessarily reflect the cost-effectiveness of how anti-TNFs are currently used in
the management of AS within the NHS or how they might be used, in the event of positive guidance
from the NICE in nr-axSpA. The findings of West Midland Rheumatology Audit from 2010 give
some grounds for potential concern.171
This regional audit was undertaken to assess compliance with
the NICE guidelines (TA143) in 17 rheumatology centres across the East and West Midlands. The
findings from this audit revealed that: (i) the proportion of patients being assessed at 12 weeks after
treatment initiation was sub-optimal; (ii) less than 20% of patients with an inadequate response at 12
weeks had their treatment discontinued and (iii) less than half of the patients received regular 12
weekly assessments. During the course of our assessment we contacted the BSRBR Ankylosing
Spondylitis Register to assess the feasibility of obtaining access to data which has been collected since
the register was set up in 2012. Although our request was positively received, it was clear during
ongoing discussions that the data and analyses requested could not be undertaken within the
timeframe of our assessment.
8 Assessment of factors relevant to the NHS and other parties
The results of this technology assessment have some implications for clinical practice. Existing NICE
guidance recommends adalimumab, certolizumab, etanercept, and golimumab for the treatment of AS
and therefore their use is already widespread in the NHS. However, in the light of the additional
evidence presented here the use of these agents in AS may increase further.
Furthermore the available clinical evidence indicates that adalimumab, certolizumab and etanercept
and are effective in patients with nr-axSpA, although there is some uncertainty regarding the
definition of the nr-axSpA patient population who would benefit most from these anti-TNFs. The

Technology Assessment Report for NICE
TNF-alpha inhibitors for ankylosing spondylitis and nr-axSpA
15/12/2014 219
effectiveness demonstrated in the nr-axSpA population suggests that early treatment of AS/nr-axSpA
patients is warranted. A key study on flares in AS suggested that the 12 week period required to
confirm sustained active spinal disease in AS patients commencing an anti-TNF may be too long. The
findings suggest that shorter time-periods might therefore be considered in future guidance, which
would minimise the delay in starting treatment and the discomfort experienced by patients.
The potential extra cost to the NHS of providing anti-TNFs for patients with nr-axSpA in addition to
AS patients is unclear since the prevalence of nr-axSpA in the UK is somewhat uncertain. The
potentially large volume of new patients to be assessed for eligibility for anti-TNF treatment could
add a large burden to existing services. NICE guidance recommending the use of adalimumab,
certolizumab and etanercept in nr-axSpA would further increase the impact of these agents on the
NHS budget.
9 Discussion
Statement of principal findings
The systematic review of clinical efficacy identified a substantial, and generally high quality
evidence-base on the efficacy and safety of anti-TNFs in patients with AS, either as individual
treatments or as a common class; there was limited evidence to suggest meaningful differences
between the therapies in terms of efficacy, other than infliximab providing more rapid improvements
during the first few months of treatment. The results of our meta-analyses demonstrated that anti-
TNFs (when compared with placebo) produce statistically significant and clinically important benefits
in patients with AS in terms of improving function and reducing disease activity over a three to six
month period (none of the trials maintained randomised treatment allocations across groups beyond
six months). Of the limited number of trials which reported quality of life outcomes, significant
improvements were found following anti-TNF therapy, but very little data were available on efficacy
relating to any peripheral symptoms (other than enthesitis) or other possible symptoms such as uveitis,
inflammatory bowel disease, and psoriasis.
Although far fewer trials have been performed in the nr-axSpA population, similar, though slightly
smaller, benefits were achieved. The smaller benefit was most noticeable for the function (BASFI)
and disease activity (BASDAI 50) outcomes. However, in the nr-axSpA trials, both clinical and
statistical heterogeneity were evident, bringing into question both the reliability of the nr-axSpA
meta-analysis results and their true relevance to patients seen in clinical practice. This heterogeneity
may have been compounded by the inclusion criteria applied in previous nr-axSpA trials. For
example, ABILITY-1 recruited patients who fulfilled the ASAS classification criteria and relied on
the expertise of the local clinicians and/or radiologists to read SIJ radiographs and MRI scans, as

Technology Assessment Report for NICE
TNF-alpha inhibitors for ankylosing spondylitis and nr-axSpA
15/12/2014 220
happens in real clinical practice. RAPID-axSpA selected its population carefully by requiring
objective evidence of disease activity at study entry either by a positive MRI showing signs of SIJ
inflammation according to the ASAS/OMERACT definition, or an elevated than normal CRP. The
difficulty of identifying which nr-axSpA patients should receive anti-TNFs remains.
Results from open-label trial extension studies suggested that across all the anti-TNFs around half of
patients still achieve a good level of response after around two years of treatment. The data also
suggest that at five years around 60% of golimumab patients, 50% of etanercept patients and 30% of
adalimumab patients still achieve a good treatment response. However, these longer-term studies were
not as well-reported as the RCTs, and their results were derived from less reliable data; it is therefore
unknown if these are true treatment differences, or whether they are due to differences in follow-up
protocols (e.g. stopping rules) and/or methods used to impute missing data.
Evidence for an effect of anti-TNFs on radiographic disease progression was limited: the relatively
short-term follow-up available to date and the insensitivity of x-rays as an imaging tool precluded the
drawing of firm conclusions regarding the role of anti-TNFs in preventing or delaying the progression
of AS; there is some data to suggest an identifiable benefit from around four years, but results from
ongoing long-term studies should help to clarify this issue.
The results from studies based on registry data demonstrated that sequential treatment with anti-TNFs
can be worthwhile in patients with AS. However, the drug survival, response rates, and benefits were
reduced with second and third anti-TNFs, with the proportion of BASDAI 50 responders falling
approximately 10% with each subsequent anti-TNF and the median BASDAIs and BASFIs achieved
increasing (worsening).
Data from large systematic reviews, which included patients with a wide range of diseases, suggest
that, in the short-term, anti-TNFs as a group are associated with significantly higher rates of serious
infections, TB reactivation, non-melanoma skin cancer, total adverse events, and withdrawals due to
adverse events, when compared with control treatments. Specifically, infliximab is associated with
significantly higher rates of total adverse events and withdrawals due to adverse events, and
certolizumab pegol is associated with significantly higher rates of serious infections and serious
adverse events. Evaluations of longer-term data are more scarce, and are limited by small sample sizes
and uncontrolled designs. They suggest similar safety profiles across anti-TNFs, other than a higher
incidence of injection site reactions following treatment with etanercept.
The systematic review of cost-effectiveness studies revealed significant conceptual issues and
uncertainties arising from previously published studies and the submissions made by manufacturers.
For this reason, a de-novo model (‘York model’) was developed. Although it shared some of the

Technology Assessment Report for NICE
TNF-alpha inhibitors for ankylosing spondylitis and nr-axSpA
15/12/2014 221
assumptions and parameter estimates from the manufacturer models, it was based on a different
conceptual structure and applies a more generalised framework for the synthesis of data from the
double-blind periods of existing RCTs, combined with a more explicit approach to modelling the
progressive nature of AS and nr-axSpA and the potential impact of the TNF-alpha inhibitors.
Based on an underlying assumption of similarity in the clinical effectiveness of each of the TNF-α
inhibitors, the York model demonstrates that the cost-effectiveness results are dependent on several
factors, including: (i) the different acquisition and administration costs; (ii) the rebound assumption
applied to patients who discontinue therapy; (iii) the magnitude of the change in BASDAI/BASFI
scores assumed for responders vs. non-responders; (iv) the different baseline BASDAI/BASFI scores
assumed for responders vs non-responders and (v) the impact of TNF-α inhibitors on the rate of
longer term BASFI progression.
Although there are a number of important differences in approaches both amongst the different
manufacturer models and compared to the York model, the comparison of ICERs based on the York
rebound equal to gain scenario appear broadly consistent with those reported by the manufacturers in
both populations.
9.2 Strengths and limitations of the assessment
Strengths
Through our comprehensive searches we sought to identify all relevant published and unpublished
trials, which minimised the possibility of publication or language biases affecting the review results.
A full evaluation of the risk of bias in each RCT was performed, which incorporated an additional
assessment of key baseline characteristics to allow firmer judgements to be made on the risk of
selection bias. The use of multiple-treatment meta-analyses allowed for greater precision in random
effect models, and the calculation of relative risks was based on the population risk across all the
trials. A key further strength of our review lies in the extensive breadth of other types of study we
included, such as: non-randomised trial extension studies; registry studies of patients taking anti-
TNFs; systematic reviews and other large studies of adverse effects of anti-TNFs; and a review of the
natural history of AS and nr-axSpA. Our review of adverse events incorporated a wealth of data from
RCTs in patients on anti-TNFs with diseases other than AS and nr-axSpA, although the results only
relate to short-term use. Our review was performed according to CRD guidance, so the potential for
reviewer errors and biases was minimised. Our review was reported according to the PRISMA
statement.
The York model confers several advantages over current cost-effectiveness studies by linking changes
in BASFI to a more explicit clinical/biological process and facilitating a more formal consideration of
the potential impact of TNF-alpha inhibitors on BASFI, via the specific effects these drugs have on

Technology Assessment Report for NICE
TNF-alpha inhibitors for ankylosing spondylitis and nr-axSpA
15/12/2014 222
the different processes which independently relate to this parameter. This approach allows
consideration of the impact on BASFI that might be achieved via symptomatic improvements (i.e. in
terms of reductions in disease activity) and those which might be conferred by disease modification
properties (i.e. the effect on the likelihood and/or rate of further radiographic progression). The latter
aspect is particularly important given the increasing amount of published evidence reported on the
potential impact of TNF-alpha inhibitors on radiographic progression which has not been formally
considered or incorporated within existing cost-effectiveness studies. In addition, the evidence
synthesis approach which underpins the York model is based on a joint synthesis of related
parameters which makes fuller use of existing evidence and which can more appropriately estimate
the input parameters and better characterise the uncertainty surrounding these.
Limitations
A key limitation of the systematic review was the variation in the reporting of outcomes across trials.
ASAS 20 was the most commonly reported responder outcome, but its value in determining efficacy
was somewhat limited by the relatively high rates of ‘placebo’ response associated with the 20%
threshold. Results for 40%, 50%, and 70% improvements (i.e. ASAS 40, ASAS 50 and ASAS 70)
were reported less frequently, despite the fact that trial investigators would have had the data available
to do so. Many trials did not report health-related quality of life outcomes and most trials were also
limited in their assessment (or reporting) of improvement in any peripheral symptoms or symptoms of
extra-articular manifestations. Although largely free of important biases, most RCTs had quite short
durations (generally around 3 months) and several were limited by their small sample sizes
(increasing the possibility of chance results for some outcomes).
Although we sought data beyond those available from RCTs, much of the data reported in studies
using other designs may have been affected by biases or confounding; furthermore, key method
details (e.g. imputation methods, or anti-TNF stopping rules) were often absent from publications.
Much less reliability and certainty could therefore be ascribed to the results obtained from these other
studies.
The York model did not directly address important clinical questions concerning the issue of
intermittent and sequential use of ant-TNFs due to the lack of robust clinical evidence from RCTs.
9.3 Uncertainties
The magnitude of treatment effect of anti-TNFs in patients with nr-axSpA remains uncertain due
to the heterogeneous nature of the trials performed to date.

Technology Assessment Report for NICE
TNF-alpha inhibitors for ankylosing spondylitis and nr-axSpA
15/12/2014 223
The limited design and reporting of the studies looking at the long-term use of anti-TNFs means
there is uncertainty as to whether there are differences in efficacy between the different anti-
TNFs in the long-term.
The evidence on the long-term risk of adverse events is uncertain due to small study sample sizes,
and the study designs used.
The long-term impact of anti-TNFs on other important outcomes in AS and nr-axSpA remain
uncertain, such as AS-related causes of death (cardiac valvular disease, amyloidosis and
fractures), and extra-articular symptoms such as uveitis, inflammatory bowel disease, and
psoriasis. Studies based on ongoing anti-TNF registries (e.g. BSRBR, which record such data)
should inform this.
With the patents of some anti-TNFs studied in this assessment due to expire shortly, biosimilars
are likely to become available in the next few years (Inflectra will become available early in
2015). As they are difficult to produce, the number of biosimilars which become available, and
their price, is uncertain.
10 Conclusions
Meta-analysis results derived from a substantial, and generally high quality evidence-base on the
efficacy of anti-TNFs in patients with AS (considered either as individual treatments or as a common
class) show statistically significant and clinically important benefits in terms of improved function
and reduced disease activity. Smaller benefits were seen across outcomes in patients with nr-axSpA,
being most noticeably smaller for the function and disease activity outcomes. Data from (less robust)
observational studies suggest that good levels of treatment response are maintain in around 50% of
patients after around two years of treatment. Evidence for an effect of anti-TNFs on radiographic
disease progression is limited, although results from ongoing studies should clarify whether or not
progression rates are reduced in the longer-term. The results from studies based on registry data
demonstrated that sequential treatment with anti-TNFs can be worthwhile in patients with AS,
although the drug survival, response rates, and benefits were reduced with second and third anti-
TNFs. Data from large systematic reviews, which included patients with a wide range of diseases,
suggested that, in the short-term, anti-TNFs as a group were associated with significantly higher rates
of serious infections, TB reactivation, non-melanoma skin cancer, total adverse events, and
withdrawals due to adverse events, when compared with control treatments. Longer-term data on
adverse effects were limited.
10.1 Implications for service provision
Technology Assessment Report for NICE
TNF-alpha inhibitors for ankylosing spondylitis and nr-axSpA
15/12/2014 224
From our review of natural history a key study on flares suggested that the 12 week period
required to confirm sustained active spinal disease in AS patients commencing an anti-TNF may
be too long. The findings suggest that shorter time-periods might therefore be considered in
future guidance, which would minimise the delay in starting treatment and the discomfort
experienced by patients.
10.2 Suggested research priorities
Randomised trials are needed to identifying the nr-axSpA population who will benefit the most
from TNF-inhibitors: trials using stratified randomisation and pre-planned analyses by stratified
group should inform this issue. Groups could be stratified according to their imaging status (i.e.
MRI positive or not) and their CRP level; both the cut-offs to be used for CRP elevation, and the
eligibility criteria used for CRP elevation, should be given careful consideration, given the
variation evident in previous trials. These studies should help to inform clearer guidance as to
what ASAS and the anti-TNF licenses mean when referring to ‘elevated CRP’ in patients with nr-
axSpA. In the previous nr-axSpA trials the placebo-controlled phases typically lasted around 3
months; a placebo-controlled follow up period of at least 6 months in future trials would therefore
be useful for studying persistence of response.
Long-term longitudinal studies are needed on the natural history of nr-axSpA to help clarify the
characteristics of patients who do (or do not) eventually develop AS. Similar to the RCT
recommendations, these studies should include analyses stratified by how patients were
diagnosed: a comparison of patients with imaging (MRI) evidence of nr-axSpA versus patients
who are diagnosed with only clinical criteria evidence, would be particularly useful, albeit
difficult to perform.
Large, long-term longitudinal, cohort studies are needed to clarify the effect of anti-TNFs on the
progression of structural damage in AS. In the absence of a gold standard imaging tool across the
spectrum from nr-axSpA to AS, sequential MRI and x-ray assessment should be used at pre-
defined endpoints to ascertain the true sensitivity and specificity of these tools in the diagnosis
and assessment of neo-formation and ankyloses characteristic of structural progression in the
spine and sacroiliac joints of these patients.
Studies are also needed to better inform the efficacy estimates relating to sequential use of anti-
TNFs. An ongoing study is looking at comparing the effect of intermittent versus standard use of
anti-TNFs in patients with stable (low active) disease.172
11 Appendices

Technology Assessment Report for NICE
TNF-alpha inhibitors for ankylosing spondylitis and nr-axSpA
15/12/2014 225
11.1 Appendix 1 Search strategies for clinical and economic reviews
MEDLINE & MEDLINE In-Process
Database: Ovid MEDLINE(R) In-Process & Other Non-Indexed Citations and Ovid MEDLINE(R) 1946 to Present
Searched 05/06/14 via OVID interface
Strategy;
1 spondylarthritis/ or spondylitis, ankylosing/ (12386)
2 ((ankyl$ or axial) adj2 spondyl$).ti,ab. (10322)
3 (ankyl$ adj2 (spine$ or spinal or vertebra$)).ti,ab. (402)
4 ((Bechtere$ or Bekhtere$ or "Marie Strumpell$" or "Marie Struempell$") adj2 (disease or syndrome)).ti,ab. (451)
5 1 or 2 or 3 or 4 (14886)
6 (adalimumab or humira or 331731-18-1).af. (3751)
7 (certolizumab or CDP870 or cimzia or 428863-50-7).af. (497)
8 (etanercept or enbrel or altebrel or 185243-69-0).af. (5540)
9 (golimumab or CNTO 148 or simponi or 476181-74-5).af. (328)
10 (infliximab or remicade or 170277-31-3 or inflectra or remsima or CT-P13).af. (9166)
11 6 or 7 or 8 or 9 or 10 (13950)
12 randomized controlled trial.pt. (375396)
13 controlled clinical trial.pt. (88473)
14 randomized.ab. (295232)
15 placebo.ab. (154473)
16 drug therapy.fs. (1704080)
17 randomly.ab. (213686)
18 trial.ab. (306623)
19 groups.ab. (1359351)
20 12 or 13 or 14 or 15 or 16 or 17 or 18 or 19 (3348700)
21 animals/ not (animals/ and humans/) (3855883)
22 20 not 21 (2872482)
23 5 and 11 and 22 (1008)
EMBASE
Database: Embase 1974 to 2014 Week 22
Searched 05/06/14 via OVID interface
Strategy;
1 exp spondylarthritis/ or exp ankylosing spondylitis/ (20531)
2 ((ankyl$ or axial) adj2 spondyl$).ti,ab. (14760)
3 (ankyl$ adj2 (spine$ or spinal or vertebra$)).ti,ab. (542)
4 ((Bechtere$ or Bekhtere$ or "Marie Strumpell$" or "Marie Struempell$") adj2 (disease or syndrome)).ti,ab. (551)
5 1 or 2 or 3 or 4 (22426)
6 (adalimumab or humira or 331731-18-1).af. (15439)
7 (certolizumab or CDP870 or cimzia or 428863-50-7).af. (3097)
8 (etanercept or enbrel or altebrel or 185243-69-0).af. (19368)

Technology Assessment Report for NICE
TNF-alpha inhibitors for ankylosing spondylitis and nr-axSpA
15/12/2014 226
9 (golimumab or CNTO 148 or simponi or 476181-74-5).af. (2124)
10 (infliximab or remicade or 170277-31-3 or inflectra or remsima or CT-P13).af. (29667)
11 6 or 7 or 8 or 9 or 10 (41065)
12 (random$ or factorial$ or crossover$ or cross over$ or cross-over$ or placebo$ or (doubl$ adj blind) or (singl$ adj
blind$) or assign$ or allocat$ or volunteer$).ti,ab,kw. (1351644)
13 crossover-procedure/ or double-blind procedure/ or randomized controlled trial/ or single-blind procedure/ (390984)
14 12 or 13 (1428385)
15 5 and 11 and 14 (603)
16 limit 15 to embase (581)
17 animals/ not (animals/ and humans/) (1188711)
18 16 not 17 (581)
CINAHL Plus
Database: CINAHL Plus
Searched 05/06/14 via EBSCO interface
Strategy;
S19 S6 AND S12 AND S18 (87)
S18 S13 OR S14 OR S15 OR s16 OR S17 (148,267)
S17 singl* N blind* or doubl* N blind* or singl* N mask* or doubl* N mask (285)
S16 (ZT "randomized controlled trial") (38,240)
S15 (allocate* or assign* or divid*) N5 (condition* or experiment* or treatment* or control* or group*) (26,737)
S14 crossover or "cross over" or "latin square" or placebo* (41,898)
S13 randomi* or random N allocate* or random N assign* or random N divid* or random N trial* or random N study
or random N studies (108,710)
S12 S7 OR S8 OR S9 OR S10 OR S11 (3,091)
S11 TX (infliximab or remicade or 170277-31-3 or inflectra or remsima or CT-P13) (1,792)
S10 TX (golimumab or CNTO 148 or simponi or 476181-74-5) (119)
S9 TX (etanercept or enbrel or altebrel or 185243-69-0) (1,298)
S8 TX (certolizumab or CDP870 or cimzia or 428863-50-7 (91)
S7 TX (adalimumab or humira or 331731-18-1) (647)
S6 S1 OR S2 OR S3 OR S4 OR S5 (2,566)
S5 TX ((Bechtere* or Bekhtere* or "Marie Strumpell*" or "Marie Struempell*") N2 (disease or syndrome)) (3)
S4 TX (ankyl* N2 (spine* or spinal or vertebra*)) (91)
S3 TX ((ankyl* or axial) N2 spondyl*) (2,277)
S2 MH spondylitis, ankylosing (1,803)
S1 MH spondylarthritis (500)
Science Citation Index
Searched 16/06/14 via Web of Science
Indexes=SCI-EXPANDED Timespan=1900-2014
Strategy;
# 13 1,001 #12 AND #11 AND #5

Technology Assessment Report for NICE
TNF-alpha inhibitors for ankylosing spondylitis and nr-axSpA
15/12/2014 227
# 12 2,435,907 TS= clinical trial* OR TS=research design OR TS=comparative stud* OR TS=evaluation stud* OR
TS=controlled trial* OR TS=follow-up stud* OR TS=prospective stud* OR TS=random* OR TS=placebo* OR TS=(single
blind*) OR TS=(double blind*)
# 11 20,446 #10 OR #9 OR #8 OR #7 OR #6
# 10 13,285 TOPIC: ((infliximab or remicade or 170277-31-3 or inflectra or remsima or CT-P13))
# 9 494 TOPIC: ((golimumab or CNTO 148 or simponi or 476181-74-5))
# 8 7,138 TOPIC: ((etanercept or enbrel or altebrel or 185243-69-0))
# 7 916 TOPIC: ((certolizumab or CDP870 or cimzia or 428863-50-7))
# 6 4,754 TOPIC: ((adalimumab or humira or 331731-18-1))
# 5 14,918 #4 OR #3 OR #2 OR #1
# 4 191 TOPIC: (((Bechtere* or Bekhtere* or "Marie Strumpell*" or "Marie Struempell*") NEAR/2 (disease or syndrome)))
# 3 644 TOPIC: ((ankyl* NEAR/2 (spine* or spinal or vertebra*)))
# 2 13,854 TOPIC: (((ankyl* or axial) NEAR/2 spondyl*))
# 1 2,394 TOPIC: (spondylarthritis OR spondyloarthritis)
NIH ClinicalTrials.gov Register
Searched 23/07/14 online at http://clinicaltrials.gov/ct2/search
Strategy;
((spondylarthritis OR spondyloarthritis OR spondylitis) AND (infliximab OR remicade OR inflectra OR remsima OR
golimumab OR simponi OR etanercept OR enbrel OR altebrel OR certolizumab OR cimzia OR adalimumab OR humira))
160 results
Cochrane Library (includes Cochrane Database of Systematic Reviews (CDSR), Database of Abstracts of Reviews of
Effects (DARE), Health Technology Assessment Database (HTA), Cochrane Central Register of Controlled Trials
(CENTRAL) and NHS Economic Evaluation Database (NHSEED)
Searched 05/06/14 online at http://onlinelibrary.wiley.com/o/cochrane/cochrane_search_fs.html
Strategy;
#1 MeSH descriptor: [Spondylitis, Ankylosing] explode all trees
#2 MeSH descriptor: [Spondylarthritis] explode all trees
#3 ((ankyl* or axial) near/2 spondyl*):ti,ab,kw (Word variations have been searched)
#4 (ankyl* near/2 (spine* or spinal or vertebra*)):ti,ab,kw (Word variations have been searched)
#5 ((Bechtere* or Bekhtere* or "Marie Strumpell*" or "Marie Struempell*") near/2 (disease or syndrome)):ti,ab,kw
#6 #1 or #2 or #3 or #4 or #5
#7 (adalimumab or humira or 331731-18-1):ti,ab,kw
#8 (certolizumab or CDP870 or cimzia or 428863-50-7):ti,ab,kw
#9 (etanercept or enbrel or altebrel or 185243-69-0):ti,ab,kw
#10 (golimumab or CNTO 148 or simponi or 476181-74-5):ti,ab,kw
#11 (infliximab or remicade or 170277-31-3 or inflectra or remsima or CT-P13):ti,ab,kw
#12 #7 or #8 or #9 or #10 or #11
#13 #6 and #12
284 total results comprised of 2 CDSR, 5 DARE, 21 HTA, 233 CENTRAL and 14 NHSEED.
Conference Proceedings Citation Index - Science
Searched 02/09/14 via Wiley Web of Science interface

Technology Assessment Report for NICE
TNF-alpha inhibitors for ankylosing spondylitis and nr-axSpA
15/12/2014 228
Indexes=CPCI-S Timespan=1900-2014
Strategy;
# 12 341 #11 AND #5
# 11 4,745 #10 OR #9 OR #8 OR #7 OR #6
# 10 2,537 TOPIC: ((infliximab or remicade or 170277-31-3 or inflectra or remsima or CT-P13))
# 9 141 TOPIC: ((golimumab or CNTO 148 or simponi or 476181-74-5))
# 8 1,221 TOPIC: ((etanercept or enbrel or altebrel or 185243-69-0))
# 7 291 TOPIC: ((certolizumab or CDP870 or cimzia or 428863-50-7))
# 6 1,140 TOPIC: ((adalimumab or humira or 331731-18-1))
# 5 2,117 #4 OR #3 OR #2 OR #1
# 4 4 TOPIC: (((Bechtere* or Bekhtere* or "Marie Strumpell*" or "Marie Struempell*") NEAR/2 (disease or syndrome)))
# 3 55 TOPIC: ((ankyl* NEAR/2 (spine* or spinal or vertebra*)))
# 2 1,906 TOPIC: (((ankyl* or axial) NEAR/2 spondyl*))
# 1 393 TS=(spondylarthritis OR spondyloarthritis)
International Prospective Register of Systematic Reviews (PROSPERO)
Searched 07/10/14 online at http://www.crd.york.ac.uk/prospero/search.asp
Strategy;
spondylitis [In All Fields]
OR
spondylarthritis [In All Fields]
OR
spondyloarthritis [In All Fields]
6 results.
National Guideline Clearinghouse
Searched 07/10/14 online at http://www.guideline.gov/
Strategy;
spondylitis OR spondylarthritis OR spondyloarthritis
15 results
NHS Evidence
Searched 27/10/14 online at https://www.evidence.nhs.uk/
Strategy;
((((ankyl* or axial) near/2 spondyl*) OR (ankyl* near/2 (spine* or spinal or vertebra*)) AND (adalimumab or humira or
certolizumab or CDP870 or cimzia or etanercept or enbrel or altebrel or golimumab or CNTO 148 or simponi or infliximab
or remicade or inflectra or remsima or CT-P13))
350 results
NHS Clinical Knowledge Summaries
Searched 27/10/14 online at http://cks.nice.org.uk/#?char=A
1 result for ankylosing spondylitis.

Technology Assessment Report for NICE
TNF-alpha inhibitors for ankylosing spondylitis and nr-axSpA
15/12/2014 229
Searches for economic review
NHS Economic Evaluation Database (NHSEED)
Searched 05/06/14 online at http://onlinelibrary.wiley.com/o/cochrane/cochrane_search_fs.html
Strategy;
#1 MeSH descriptor: [Spondylitis, Ankylosing] explode all trees
#2 MeSH descriptor: [Spondylarthritis] explode all trees
#3 ((ankyl* or axial) near/2 spondyl*):ti,ab,kw (Word variations have been searched)
#4 (ankyl* near/2 (spine* or spinal or vertebra*)):ti,ab,kw (Word variations have been searched)
#5 ((Bechtere* or Bekhtere* or "Marie Strumpell*" or "Marie Struempell*") near/2 (disease or syndrome)):ti,ab,kw
#6 #1 or #2 or #3 or #4 or #5
#7 (adalimumab or humira or 331731-18-1):ti,ab,kw
#8 (certolizumab or CDP870 or cimzia or 428863-50-7):ti,ab,kw
#9 (etanercept or enbrel or altebrel or 185243-69-0):ti,ab,kw
#10 (golimumab or CNTO 148 or simponi or 476181-74-5):ti,ab,kw
#11 (infliximab or remicade or 170277-31-3 or inflectra or remsima or CT-P13):ti,ab,kw
#12 #7 or #8 or #9 or #10 or #11
#13 #6 and #12
14 results
Searches for EQ5D;
MEDLINE
Database: Ovid MEDLINE(R) In-Process & Other Non-Indexed Citations and Ovid MEDLINE(R) <1946 to Present>
Searched 16/06/14 via OVID interface
Strategy;
1 spondylarthritis/ or spondylitis, ankylosing/ (12394)
2 ((ankyl$ or axial) adj2 spondyl$).ti,ab. (10334)
3 (ankyl$ adj2 (spine$ or spinal or vertebra$)).ti,ab. (402)
4 ((Bechtere$ or Bekhtere$ or "Marie Strumpell$" or "Marie Struempell$") adj2 (disease or syndrome)).ti,ab. (451)
5 1 or 2 or 3 or 4 (14899)
6 (5d or 5-d or 5 dimension or eq-5d or eq5d or eq 5d).ti,ab. (13976)
7 5 and 6 (27)
EMBASE
Database: Embase <1974 to 2014 June 13>
Searched 16/06/14 via OVID interface
Strategy;
1 exp spondylarthritis/ or exp ankylosing spondylitis/ (20653)
2 ((ankyl$ or axial) adj2 spondyl$).ti,ab. (14855)
3 (ankyl$ adj2 (spine$ or spinal or vertebra$)).ti,ab. (545)
4 ((Bechtere$ or Bekhtere$ or "Marie Strumpell$" or "Marie Struempell$") adj2 (disease or syndrome)).ti,ab. (552)
5 1 or 2 or 3 or 4 (22550)
6 (5d or 5-d or 5 dimension or eq-5d or eq5d or eq 5d).ti,ab. (17019)

Technology Assessment Report for NICE
TNF-alpha inhibitors for ankylosing spondylitis and nr-axSpA
15/12/2014 230
7 5 and 6 (60)
8 limit 7 to embase (55)
Searches for economic models;
MEDLINE
Database: Ovid MEDLINE(R) In-Process & Other Non-Indexed Citations and Ovid MEDLINE(R) <1946 to Present>
Searched 25/07/14 via OVID interface
Strategy;
1 spondylarthritis/ or spondylitis, ankylosing/ (12505)
2 ((ankyl$ or axial) adj2 spondyl$).ti,ab. (10436)
3 (ankyl$ adj2 (spine$ or spinal or vertebra$)).ti,ab. (407)
4 ((Bechtere$ or Bekhtere$ or "Marie Strumpell$" or "Marie Struempell$") adj2 (disease or syndrome)).ti,ab. (455)
5 1 or 2 or 3 or 4 (15038)
6 exp models, economic/ (10268)
7 ((economic$ or cost$ or pric$ or value or statistic$) and model$).ti,ab. (245686)
8 6 or 7 (250668)
9 5 and 8 (107)
EMBASE
Database: Embase <1974 to 2014 July 24>
Searched 25/07/14 via OVID interface
Strategy;
1 exp spondylarthritis/ or exp ankylosing spondylitis/ (20858)
2 ((ankyl$ or axial) adj2 spondyl$).ti,ab. (14996)
3 (ankyl$ adj2 (spine$ or spinal or vertebra$)).ti,ab. (553)
4 ((Bechtere$ or Bekhtere$ or "Marie Strumpell$" or "Marie Struempell$") adj2 (disease or syndrome)).ti,ab. (553)
5 1 or 2 or 3 or 4 (22760)
6 statistical model/ (102203)
7 ((economic$ or cost$ or pric$ or value or statistic$) adj2 model$).ti,ab. (24642)
8 6 or 7 (119366)
9 5 and 8 (63)
10 limit 9 to embase (55)

15/12/2014 231
11.2 Appendix 2 Synthesis methods for clinical efficacy network meta-analyses
Estimating standard deviations from inter-quartile ranges
Where 𝑄1 is the lower quartile, 𝑄3 is the upper quartile, and 𝜎 is the standard deviation then the standard deviation was
estimated as
𝜎 =(𝑄3 + 𝑄1)
2 × 0.67
Calculating change from baseline outcomes and standard deviations
Given baseline and final values and their standard deviations, the change from baseline values and standard deviations can
be calculated if the within-study correlation between baseline and final values is known. Similarly, the final values can be
computed.
The within-study correlation 𝜌 between baseline and final values can be calculated as follows as stated in the Cochrane
Handbook, where
𝜌 =𝑆𝐷𝑏𝑎𝑠𝑒𝑙𝑖𝑛𝑒
2 + 𝑆𝐷𝑓𝑖𝑛𝑎𝑙2 − 𝑆𝐷𝑐ℎ𝑎𝑛𝑔𝑒
2
2 × 𝑆𝐷𝑓𝑖𝑛𝑎𝑙 × 𝑆𝐷𝑏𝑎𝑠𝑒𝑙𝑖𝑛𝑒
The standard deviation of the change from baseline can be found by rearranging the above equation. The standard deviation
of the final value can be found by rearranging the above equation which produces a quadratic. As a range of correlation
estimates were obtained from the studies available, we tested 0.3 and 0.7 correlation estimates in our analyses. In calculating
the standard deviation of final values, this sometimes resulted in complex roots. In these cases, the lowest correlation
estimate that allowed a real root was used in the calculation.
Prior distribution for the between-study standard deviation for the placebo absolute risk
In running fixed effect and random effect models to estimate the placebo absolute risk, the random effect models had better
fit. For ASAS 70 response, there were insufficient trials to run a random effects model, so a prior distribution for the
between-study standard deviation was specified. This was derived from the between-study standard deviation from the
ASAS40 analysis. The prior distribution was specified as a log-normal distribution and the log-normal distribution
parameters 𝜇 and 𝜎2 were derived from the following equations.
𝑀𝑒𝑎𝑛 = 𝑒𝜇+𝜎2
2⁄
𝑀𝑒𝑑𝑖𝑎𝑛 = 𝑒𝜇
I-squared
As noted in Higgins et al.173, the I-squared 𝐼2 was calculated as
𝐼2 =𝜏2
𝜏2 + 𝑠2

Technology Assessment Report for NICE
TNF-alpha inhibitors for ankylosing spondylitis and nr-axSpA
15/12/2014 232
where 𝜏2 is the between-study variance estimated in the multiple-treatment meta-analysis,
𝑠2 =∑𝑤𝑖(𝑘 − 1)
(∑𝑤𝑖)2 − ∑𝑤𝑖
2
which was calculated in Excel, and 𝑤𝑖 is the precision of study i.
Correlation
Table 108 presents the results for BASDAI change from baseline assuming a class effect and independent treatment effects,
and assuming 0.3 and 0.7 within-study correlation. It is clear that the different correlation assumptions make no difference in
this case. This is perhaps because the studies affected by the correlation assumption were small studies.
Table 108: The class and independent BASDAI change from baseline of the anti-TNFs vs placebo assuming 0.3 and 0.7
within-study correlation
0.3 correlation 0.7 correlation
Mean 95% CrI Mean 95% CrI
Class -1.66 (-1.89 to -1.43) -1.66 (-1.88 to -1.43)
ADA -1.55 (-1.88 to -1.23) -1.56 (-1.88 to -1.24)
CER -1.46 (-2.16 to -0.74) -1.46 (-2.16 to -0.74)
ETA -1.76 (-2.15 to -1.37) -1.76 (-2.15 to -1.37)
INF -2.28 (-3.18 to -1.38) -2.28 (-3.18 to -1.38)

15/12/2014 233
11.3 Appendix 3 Risk of bias data
Table 109 Full risk of bias results
Trial Sequence
generation
Allocation
concealment
Important
baseline
imbalance
Blinding of
participants
and
researchers
Blinding
of
outcome
assessme
nt
Incomplete
outcome data
Selective
reporting
Exclude in
sensitivity
analysis?
Haibel 200855 Unclear Unclear Unclear Low Low Low Low N
imbalance for
HLA-B27+ and
MRI+
No of withdrawals
and Dropouts: 0
Imputation used for
continuous
outcomes: NA
All main
relevant
outcomes
reported
Hu 201259 Unclear Unclear Low Unclear Low Unclear Unclear Y

Technology Assessment Report for NICE
TNF-alpha inhibitors for ankylosing spondylitis and nr-axSpA
15/12/2014 234
There is no
description of the
randomisation
procedure and no
explanation for
the imbalance in
number of
patients in
treatment arms 26
vs 20
No details
reported
Main
prognostic
indicators
similar across
trial arms at
baseline
No details
reported
No of withdrawals
and Dropouts: Not
reported
Imputation used for
continuous
outcomes: NR
No reporting of
adverse effects
Huang 201460 Low Low Low Low Low Low Low N
centralised
computer based
system
centralised
computer
based system
Groups
comparable for
all important
factors
Matching
placebo and all
study
personnel and
patients stated
to be blinded
No of withdrawals
and Dropouts: 12
Imputation used for
continuous
outcomes: LOCF
All main
outcomes
reported
Lambert 200761 Unclear Unclear Low unclear Low Low low N
No imbalances
in possible
prognostic
Stated to be
double blind
No of withdrawals
and Dropouts:) 0 at
week 12; 2 from
BASDAI not
reported at

Technology Assessment Report for NICE
TNF-alpha inhibitors for ankylosing spondylitis and nr-axSpA
15/12/2014 235
factors placebo arm at week
52
Imputation used for
continuous
outcomes: No
imputation for
missing SPARCC
score
follow-up
ABILITY-1
201352
Low Low Low Low Low Low Low N
Centralised
randomisation
with interactive
voice response
system
Matching
placebo
No of withdrawals
and Dropouts: 6
Imputation used for
continuous
outcomes: LOCF
imputed values
ATLAS 200663 Unclear Unclear Low Low Low Low Low N

Technology Assessment Report for NICE
TNF-alpha inhibitors for ankylosing spondylitis and nr-axSpA
15/12/2014 236
balanced across
treatment arms
Matching
placebo
No of withdrawals
and Dropouts: 4
from placebo, 4
from active by week
12, 6 from placebo
and 13 from active
by week 24 (NB wk
24 still RCT though
none rsponders
permitted early
escape after week
12)
Imputation used for
continuous
outcomes: LOCF
Primary and all
main outcomes
reported
N
RAPID-axSpA
(Landewe
2014)46
Low Low Low Unclear Low Low Low N

Technology Assessment Report for NICE
TNF-alpha inhibitors for ankylosing spondylitis and nr-axSpA
15/12/2014 237
Central
randomisation
Central
randomisation
Small
difference in
baseline CRP
and HLA-B27
positive,
making placebo
group slightly
increased risk
(but unclear
possible
impact)
Administration
of treatment
was by
unblinded
trained
personnel.
Their role in
assessment is
unclear and so
the impact of
their
unblinded
status is
unclear
No of withdrawals
and Dropouts:
Unclear at 12
weeks, but at 24
weeks: PLA 10,
200mg 6, 400 mg 9.
Imputation used for
continuous
outcomes: LOCF
Hierarchical
analysis plan
adhered to.
Barkham 201072 Unclear Unclear Unclear Low Low Unclear Low Y
No of withdrawals
and dropouts:
Unclear, although it
appears to be 9 for
etanercept and 8 for
placebo (the number
for which ASAS40
data were
available).

Technology Assessment Report for NICE
TNF-alpha inhibitors for ankylosing spondylitis and nr-axSpA
15/12/2014 238
Imputation used for
continuous
outcomes: ITT
LOCF
Davis 200347 Unclear Unclear Low Low Low Low Low N
No of withdrawals
and Dropouts: 12
weeks: ETA 6 pts,
PLA 5 pts. 24 wks:
ETA 12 pts, PLA 19
pts
Imputation used for
continuous
outcomes: LOCF
using ETA n=138,
PLA n=139
Dougados
201174
Unclear Unclear Low Low Low Low Low N

Technology Assessment Report for NICE
TNF-alpha inhibitors for ankylosing spondylitis and nr-axSpA
15/12/2014 239
No of withdrawals
and Dropouts: ETA
1, PLA 4
Imputation used for
continuous
outcomes: mITT (at
least one dose) with
LOCF
Dougados
201454
Low Low Low Low Low Low Low N
No of withdrawals
and Dropouts: 6
ETA, 3 PLA. In
addition to this, 5
patients in each
group were
excluded from
analyses due to
misdiagnosis
Imputation used for

Technology Assessment Report for NICE
TNF-alpha inhibitors for ankylosing spondylitis and nr-axSpA
15/12/2014 240
continuous
outcomes: LOCF in
mITT population:
106 ETA, 109 PLA
Gorman 200249 Low Low High (chance
imbalance)
Low Low Low Low Y
BASFI No of withdrawals
and Dropouts:3
Imputation used for
continuous
outcomes: Not
totally clear, but
appears to be proper
ITT with LOCF
Calin 200448 Unclear Unclear High Low Low Low Low Y
Important
difference in
CRP,
No of withdrawals
and Dropouts: 2

Technology Assessment Report for NICE
TNF-alpha inhibitors for ankylosing spondylitis and nr-axSpA
15/12/2014 241
borderline
important
difference in
age
etanercept pts
Imputation used for
continuous
outcomes: LOCF
for mITT
population (placebo
n=39, ETA n=45)
Van der Heijde
200651
Unclear Unclear Unclear Low Low Low Low N
No data for
HLA-B27
No of withdrawals
and Dropouts: 14 in
50mg group, 14 in
25mg group, 7 in
placebo group. In
addition to this, 5
patients did not
receive one dose of
treatment (no
further details).
Imputation used for
continuous
outcomes: mITT

Technology Assessment Report for NICE
TNF-alpha inhibitors for ankylosing spondylitis and nr-axSpA
15/12/2014 242
population analysed
(had at least one
dose) using the
155,150,51 group
sizes and LOCF was
used to impute
missing data
Giardina 201084 High High Low High High Low Low Y
No of withdrawals
and Dropouts:0
Imputation used for
continuous
outcomes: None
needed
GO-RAISE
200886
Low Low Low Low Low Low Low N

Technology Assessment Report for NICE
TNF-alpha inhibitors for ankylosing spondylitis and nr-axSpA
15/12/2014 243
Random
assignment using
voice response
system
Random
assignment
using voice
response
system
No important
imbalance in
key prognostic
variables
Matching
placebo used
No of withdrawals
and Dropouts:17 to
week 24 (2 PLA, 9
50mg, 6 100mg).
Not clear how many
at week 14 (primary
time point)
Imputation used for
continuous
outcomes: LOCF
(ITT population)
Primary
endpoint and all
other main
outcomes(BAS
DAI, BASFI,
BASMI, SF-36)
reported
Bao 201291 Unclear Unclear Unclear Low Low Unclear Low N
No HLA-B27
data
No of withdrawals
and Dropouts: not
reported for wk 14
Imputation used for
continuous
outcomes: Not
reported
Primary
outcome and
other main
outcomes
reported.

Technology Assessment Report for NICE
TNF-alpha inhibitors for ankylosing spondylitis and nr-axSpA
15/12/2014 244
Tam 2013107 Unclear Unclear Unclear Unclear Low Unclear Unclear N
Abstract only.
Very small study
(Chinese)
Abstract only.
Very small
study
(Chinese)
Abstract only.
Very small
study (Chinese)
Abstract only.
Very small
study
(Chinese)
No of withdrawals
and Dropouts: not
reported
Imputation used for
continuous
outcomes: not
reported
Abstract only.
Very small
study (Chinese)
Barkham 200956 Unclear Unclear High Low Low Low Low Y
median CRP
11.5 vs 5.
Likely due to
chance as
higher CRP in
placebo group
(and higher
CRP associated
with better
responses)
No of withdrawals
and Dropouts: 1 in
the placebo group
(at 12 weeks)
Imputation used for
continuous
outcomes: not
reported, but ITT
population analysed

Technology Assessment Report for NICE
TNF-alpha inhibitors for ankylosing spondylitis and nr-axSpA
15/12/2014 245
Braun 200294 Low Low Low Low Low Low Low N
No of withdrawals
and Dropouts: 0
Imputation used for
continuous
outcomes: none
required
Marzo-Ortega
(2005)50
Low Low Unclear Low Low Unclear Low N
The only issue
is with age and
the difference
of 2 years could
be due to
rounding
No of withdrawals
and Dropouts: 5/14
for placebo, 2/28 for
Infliximab
Imputation used for
continuous
outcomes: ITT with
LOCF

Technology Assessment Report for NICE
TNF-alpha inhibitors for ankylosing spondylitis and nr-axSpA
15/12/2014 246
Van den Borsch
(2002)96
Unclear Unclear High Low Low Low Low Y
BASFI>1 point No of withdrawals
and Dropouts: 0
Imputation used for
continuous
outcomes: NA
ASSERT97 Unclear Unclear Low Low Low Low Low N
No of withdrawals
and Dropouts: 8 (4
in each group)
Imputation used for
continuous
outcomes: Not
reported, but ITT
population
analysed. LOCF
was used for

Technology Assessment Report for NICE
TNF-alpha inhibitors for ankylosing spondylitis and nr-axSpA
15/12/2014 247
ASAS20.
PLANETAS
(2013)105
Low Low Unclear Low Low Low Low N
HLA-B27 was
not reported
No of withdrawals
and Dropouts:21
(12 vs 9)
Imputation used for
continuous
outcomes: Not
reported, though
ITT population was
analysed

15/12/2014 248
Table 110 Prognostic indicators of important baseline imbalance used in risk of bias assessment
Possible
prognostic
indicator
Study details
Implications for baseline imbalance across
groups within a trial (and variation in efficacy across trials)
Glintborg 2010 (DANBIO
registry)108
n=842
6 month time point
Adalimumab, etanercept, infliximab
Vastesaeger 2011 (ASSERT & GO-RAISE
trial data)*
n=635, 3 month time point
Infliximab, golimumab
Lord et al 2009 (BSRBR
registry)163
n=261, 6 month time point
Adalimumab, etanercept, infliximab
Results of association
HLA-B27
status
No data moderate association No data HLA-B27 positive patients have a better
outcome
Use 20% group difference as an important imbalance?
CRP ≤14mg/l vs >14mg/l (OR
0.45, p<0.001)
≤6 mg/l vs >6 mg/l to 20 mg/l: moderate
≤6 mg/l vs >20 mg/l : moderate to strong
‘Raised inflammatory
markers’ an important
predictor, but result only
available for CRP or ESR
(not CRP alone)
Higher CRP levels are associated with a
better outcome
Use Glintborg and Vastesaeger cut-offs
(providing there’s at least a 2mg/l difference between groups)
Age OR 0.98 per year, p=0.03 <40yrs vs >40yrs : weak to moderate No significant association Younger age associated with a better
outcome
Use Vastesaeger cut-off providing at least a 2 year difference between groups

Technology Assessment Report for NICE
TNF-alpha inhibitors for ankylosing spondylitis and nr-axSpA
15/12/2014 249
BASFI score OR 0.87 per cm increase,
p=0.008
<6.5 vs > 6.5 Moderate to strong Per unit increase
OR 0.78 (95%CI 0.64 to
0.99)
Lower BASFI scores associated with a
better outcome
Use a 1 point difference as an indication of important imbalance?
and
Use <6.5 vs >6.5 providing there’s at least a
0.5 point difference between groups.
BASDAI Not analysed No significant association Per unit increase
OR 1.30 (95%CI 1.04 to 1.62)
Higher BASDAI scores associated with a
better outcome
Use a 1 point difference as an indication of important imbalance?
Disease
duration
No significant association No significant association No significant association Do not assess
Gender No significant association No significant association No significant association Do not assess

15/12/2014 250
11.4 Appendix 4 Trial results
Table 111 Continuous outcomes - final values results
Trial Population Treatment arm Dose Timepoint (weeks)
Patients Mean final values (SD, SE or IQR)‡
BASDAI BASFI BASMI MASES SF36pcs SF36mcs
Haibel 2008
nr Adalimumab 40mg every 2 wks 12 22 3.8 (2.5) 3 (2.4) 1.3 (1.4) 2.5 (3.5) 38.8 (11.8) 44.6 (12.7)
nr placebo - 12 24 5 (2.4) 4.1 (2.6) 1.7 (1.5) 2.8 (3.4) 34.9 (9.6) 43.9 (11.8)
Hu 2012 AS Adalimumab 40mg every 2 wks 12 NR 2.3 (1.8) 1.8 (1.6) - - - -
AS Placebo - 12 NR 4.2 (2.6) 2.9 (1.9) - - - -
Huang 2014
AS Adalimumab 40mg every 2 wks 12 229 - - - - - -
AS Placebo - 12 115 - - - - - -
Lambert 2007
AS Adalimumab 40mg every 2 wks 12 38 - - - - - -
AS Placebo - 12 44 - - - - - -
ABILITY-1
(2013)∏
nr Adalimumab 40mg every 2 wks 12 69 - - - - - -
nr Placebo - 12 73 - - - - - -
ATLAS (2006)
AS Adalimumab 40mg every 2 wks 12 208 - -1.414 - - - -
AS Placebo - 12 107 - - - - - -
RAPID-axSpA (2014) AS
AS Certolizumab pegol 200mg every 2 wks 12 65 - - - - - -
AS Certolizumab pegol 400mg every 4 wks 12 56 - - - - - -
AS Placebo - 12 57 - - - - - -
RAPID-axSpA (2014) NR
nr Certolizumab pegol 200mg 12 46 - - - - - -
nr Certolizumab pegol 400mg 12 51 - - - - - -
nr Placebo - 12 50 - - - - - -
Barkham 2010
AS Etanercept 25mg twice weekly 12 20 - - - - - -
AS Placebo - 12 20 - - - - - -

Technology Assessment Report for NICE
TNF-alpha inhibitors for ankylosing spondylitis and nr-axSpA
15/12/2014 251
Davis 2003
AS Etanercept 25mg twice weekly 12 138 - - - - - -
AS Placebo - 12 139 - - - - - -
AS Etanercept 25mg twice weekly 24 138 3.45 [0.21] 3.6 [0.22] - - - -
AS Placebo - 24 139 5.51 [0.2] 5.47 [0.22] - - - -
Dougados 2011
AS Etanercept 50mg weekly 12 39 3.7 (2.6) 4.1 (2.9) 5.1 (1.7) - - -
AS Placebo - 12 43 4.5 (1.9) 4.8 (2.1) 5.6 (1.3) - - -
Dougados 2014
AS Etanercept 50mg weekly 12 106 - - - - 43.7 (8.9) -
AS Placebo - 12 109 - - - - 41 (7.8) -
nr Etanercept 50mg weekly 12 94 - - - - - -
nr Placebo - 12 95 - - - - - -
Gorman 2002
AS Etanercept 25mg twice a week 16 20 - 2.2 (2.1) - - - -
AS Placebo - 16 20 - 3.1 (3) - - - -
Calin 2004 AS Etanercept 25 mg twice weekly 12 45 3.38 3.96 - - - -
AS Placebo - 12 39 5.01 5.39 - - - -
Van der Heijde 2006
AS Etanercept 25mg twice weekly 12 150 - - - - - -
AS Etanercept 50mg weekly 12 155 - - - - - -
AS Placebo - 12 51 - - - - - -
Giardina 2010
AS Etanercept 50mg weekly 12 25 - 5 - - - -
AS Infliximab 5mg/kg at wk 0,2,6+ 12 25 - 3.5 - - - -
GO-RAISE 2008
AS Golimumab 50mg(2 every 4 wks) 14 138 - - - - - -
AS Golimumab 100mg(2 every 4 wks) 14 140 - - - - - -
AS placebo - 14 78 - - - - - -
Bao 2012 AS Golimumab 50mg Q4 weeks 14 - - - - - -
AS Placebo - 14 - - - - - -
Tam 2014 AS Golimumab 50mg monthly 26 NR - - - - - -

Technology Assessment Report for NICE
TNF-alpha inhibitors for ankylosing spondylitis and nr-axSpA
15/12/2014 252
AS Placebo - 26 NR - - - - - -
Barkham 2009
nr Infliximab 5 mg/kg(0, 2, 6+ wks) 16 20 - - - - - -
nr Placebo - 16 20 - - - - - -
Braun 2002
AS Infliximab 5mg/kg(wks 0,2,6) 12 34 3.3 - - - - -
AS Placebo - 12 35 5.7 - - - - -
Marzo-Ortega (2005)
AS Infliximab+meth. 5mg/kg* 10 28 3.34 (2.56) 4.96 - - - -
AS Placebo+meth.*** ** 10 14 5.19 (2.52) 6.1 - - - -
AS Infliximab+meth. 5mg/kg* 30 28 4.6 (2.85) 5.04 - - - -
AS Placebo+meth. ** 30 14 5.74 (2.34) 5.68 - - - -
Van den Bosch (2002)
AS Infliximab 5mg/kg(wks 0,2,6) 12 9 2.66 2.74 4 - - -
AS Placebo - 12 12 5.01 7.19 4 - - -
ASSERT (2005)
AS Infliximab 5mg/kg(wks 0,2,6+) 24 201 - - - - - -
AS Placebo - 24 78 - - - - - -
Park 2013 AS Inflectra (CT-P13) 5mg/kg 14 125 - - - - - -
AS Infliximab 5mg/kg 14 125 - - - - - -
AS Inflectra (CT-P13) 5mg/kg 30 125 - - - - - -
AS Infliximab 5mg/kg 30 125 - - - - - -
AS Inflectra (CT-P13) 5mg/kg 54 125 - - - - - -
AS Infliximab 5mg/kg 54 125 - - - - - -
*5mg/kg (infusion at weeks 0,2,6,14,22)+methotrexate oral 7.5mg with folic acid (5mg twice a week which increased to 10mg a week)
**methotrexate oral 7.5mg with folic acid (5mg twice a week which increased to 10mg a week)
***meth.: methotrexate
‡: (#)=(sd); [#]=[se]; (#,#)=(IQR)
∏: licensed population

Technology Assessment Report for NICE
TNF-alpha inhibitors for ankylosing spondylitis and nr-axSpA
15/12/2014 253
Table 112 Continuous outcomes - change from baseline results
Trial Population
Treatment arm
Dose Time point (weeks)
Patients Mean change from baseline (SD, SE or IQR)‡
BASDAI BASFI BASMI MASES SF36pcs SF36mcs
Haibel 2008
nr Adalimumab 40mg every 2 wks 12 22 - - - - - -
nr placebo - 12 24 - - - - - -
Hu 2012 AS Adalimumab 40mg every 2 wks 12 NR - - - - - -
AS Placebo - 12 NR - - - - - -
Huang 2014
AS Adalimumab 40mg every 2 wks 12 229 -2.8 (1.9) -1.75 (2.02) -0.5 (0.6) -1.2 (2.1) 6.6 (6.4) 5.1 (9.9)
AS Placebo - 12 115 -1.4 (1.9) -0.47 (1.64) -0.2 (0.7) -0.8 (1.7) 4 (6.3) 2.8 (9.4)
Lambert 2007
AS Adalimumab 40mg every 2 wks 12 38 - - - - - -
AS Placebo - 12 44 - - - - - -
ABILITY-1
(2013)∏
nr Adalimumab 40mg every 2 wks 12 69 -2.2 (2.5) -1.28 (2.02) -0.2 (0.73) -0.7 (2.78) 6.9 (9.32) 1.4 (8.63)
nr Placebo - 12 73 -1.1 (1.96) -0.63 (1.79) -0.2 (0.64) -1 (2.71) 2.3 (6.81) 0.7 (11.38)
ATLAS (2006)
AS Adalimumab 40mg every 2 wks 12 208 -2.6 [0.2] - -0.5 [0.1] -2.7 [0.4] 6.9 [0.6] 2.7 [0.7]
AS Placebo - 12 107 -0.8 [0.2] - 0.1 [0.1] -1.3 [0.5] 1.6 [0.8] 2.4 [1]
RAPID-axSpA (2014) AS
AS Certolizumab 200mg every 2 wks 12 65 -2.5 [0.3] -1.7 [0.3] -0.6 [0.1] - 8.73 (7.63) 2.42 (9.08)
AS Certolizumab 400mg every 4 wks 12 56 -2.4 [0.3] -1.7 [0.3] -0.3 [0.2] - 7.6 (7.65) 2.22 (10.44)
AS Placebo - 12 57 -1 [0.3] -0.6 [0.3] -0.2 [0.1] - 2.56 (5.67) 1.07 (10.92)
RAPID-axSpA (2014) NR
nr Certolizumab 200mg 12 46 -3.3 [0.4] -2.3 [0.4] -0.6 [0.2] - 9.56 (9.46) 4.59 (9.7)
nr Certolizumab 400mg 12 51 -3.4 [0.4] -2.3 [0.4] -0.5 [0.2] - 8.72 (8.84) 6.12 (10.94)
nr Placebo - 12 50 -1.5 [0.4] -0.4 [0.4] 0 [0.1] - 2.13 (7.47) 1.39 (10.24)
Barkham 2010
AS Etanercept 25mg twice weekly 12 20 -1.97 -1.35 - - - -
AS Placebo - 12 20 -0.1 0.21 - - - -
Davis AS Etanercept 25mg twice weekly 12 138 -2.36 [0.19] -1.67 [0.2] - - - -

Technology Assessment Report for NICE
TNF-alpha inhibitors for ankylosing spondylitis and nr-axSpA
15/12/2014 254
2003 AS Placebo - 12 139 -0.45 [0.18] -0.33 [0.21] - - - -
AS Etanercept 25mg twice weekly 24 138 - - - - - -
AS Placebo - 24 139 - - - - - -
Dougados 2011
AS Etanercept 50mg weekly 12 39 -2.6 (2) -2.2 (1.8) -0.57 (0.65) - - -
AS Placebo - 12 43 -1.4 (2) -1 (1.8) -0.2 (0.65) - - -
Dougados 2014
AS Etanercept 50mg weekly 12 106 -2 [0.3] -1.4 [0.2] -0.3 [0.2] - - -
AS Placebo - 12 109 -1.3 [0.3] -0.8 [0.2] -0.3 [0.1] - - -
nr Etanercept 50mg weekly 12 94 - - - - - -
nr Placebo - 12 95 - - - - - -
Gorman 2002
AS Etanercept 25mg twice a week 16 20 - - - - - -
AS Placebo - 16 20 - - - - - -
Calin 2004 AS Etanercept 25 mg twice weekly 12 45 -2.72 [0.34] -2.06 [0.33] - - - -
AS Placebo - 12 39 -0.85 [0.35] -0.33 [0.31] - - - -
Van der Heijde 2006
AS Etanercept 25mg twice weekly 12 150 - - - - - -
AS Etanercept 50mg weekly 12 155 - - - - - -
AS Placebo - 12 51 - - - - - -
Giardina 2010
AS Etanercept 50mg weekly 12 25 - - - - - -
AS Infliximab 5mg/kg at wk 0,2,6+ 12 25 - - - - - -
GO-RAISE 2008
AS Golimumab 50mg(2 every 4 wks) 14 138 - -1.4 (-3.1,-0.1) 0 (-1,0) -0.5 (2.6) 7.3 (1.5,15.3) 1.5 (-2.2,7.8)
AS Golimumab 100mg(2 every 4 wks) 14 140 - -1.5 (-3.0,-0.1) 0 (-1,0) -1.3 (3.11) 8.4 (2.3,14.1) 3.7 (-3.2,12.1)
AS placebo - 14 78 - 0.1 (-1.1,1.1) 0 (-1,0) -0.2 (2.99) 2.4 (-1.4,7.8) 0.1 (-4.3,5.3)
Bao 2012 AS Golimumab 50mg Q4 weeks 14 - -1.26 (2.57) -0.42 (0.91) - 6.25 (7.95) 3.86 (8.92)
AS Placebo - 14 - 0.11 (2.1) -0.19 (0.72) - 1.59 (6.12) 0.82 (9.44)
Tam 2014 AS Golimumab 50mg monthly 26 NR -1.82 (1.64) -0.13 (0.25)† -1 (-2,0) - - -
AS Placebo - 26 NR -0.66 (1.24) 0.17 (0.72)† 0 (-1,0) - - -

Technology Assessment Report for NICE
TNF-alpha inhibitors for ankylosing spondylitis and nr-axSpA
15/12/2014 255
Barkham 2009
nr Infliximab 5 mg/kg(0, 2, 6+ wks) 16 20 -3.41 (2.53) -2.7 (2.36) - - - -
nr Placebo - 16 20 -0.75 (2.42) -0.47 (2.25) - - - -
Braun 2002
AS Infliximab 5mg/kg(wks 0,2,6) 12 34 -3.2 -2.1 - - - -
AS Placebo - 12 35 -0.6 -0.1 - - - -
Marzo-Ortega (2005)
AS Inflix+meth. 5mg/kg* 10 28 -3.11 (2.23) - - - - -
AS Pla+meth.*** ** 10 14 -1.38 (2.11) - - - - -
AS Inflix+meth. 5mg/kg* 30 28 -1.85 (2.84) - - - - -
AS Pla+meth. ** 30 14 -0.84 (1.8) - - - - -
Van den Bosch (2002)
AS Infliximab 5mg/kg(wks 0,2,6) 12 9 - - - - - -
AS Placebo - 12 12 - - - - - -
ASSERT (2005) AS Infliximab 5mg/kg(wks 0,2,6+) 24 201 -2.9 (-4.9,-0.9) -1.7 (-3.6,-0.6) -1 (-1,0) -
10.2 (3.9,17.1) 2.7 (-2.9,8.8)
AS Placebo - 24 78 -0.4 (-1.4,0.7) 0 (-1,1) 0 (-1,0) - 0.8 (-1.9,6) 2 (-2.6,7.5)
Park 2013 AS Inflectra 5mg/kg 14 125 -2.91 (2.17) -2.51 (2.14) -0.7 (1.2) - - -
AS Infliximab 5mg/kg 14 125 -2.77 (2.08) -2.47 (2.18) -0.7 (1.4) - - -
AS Inflectra 5mg/kg 30 125 -3.04 (2.23) -2.6 (2.19) -1 (1.4) - 7.6 6.5
AS Infliximab 5mg/kg 30 125 -2.71 (2.24) -2.54 (2.17) -0.9 (1.4) - 8.5 5.2
AS Inflectra 5mg/kg 54 125 - - - - - -
AS Infliximab 5mg/kg 54 125 - - - - - -
*5mg/kg (infusion at weeks 0,2,6,14,22)+methotrexate oral 7.5mg with folic acid (5mg twice a week which increased to 10mg a week)
**methotrexate oral 7.5mg with folic acid (5mg twice a week which increased to 10mg a week)
***Pla+meth.: placebo and methotrexate
†: these values are uncertain due to poor reporting
‡: (#)=(sd); [#]=[se]; (#,#)=(IQR)
∏: licensed population

Technology Assessment Report for NICE
TNF-alpha inhibitors for ankylosing spondylitis and nr-axSpA
15/12/2014 256
Binary response outcomes results
Trial Population Treatment arm Dose Time point (weeks)
Patients Number (%) of responders
ASAS 20 ASAS 40 ASAS 50 ASAS 70 BASDAI 50
Haibel 2008 nr Adalimumab 40mg every 2 wks 12 22 15 (68) 12 (55) - - 11 (50)
nr placebo - 12 24 6 (25) 3 (13) - - 5 (21)
Hu 2012 AS Adalimumab 40mg every 2 wks 12 26 - - - - -
AS Placebo - 12 20 - - - - -
Huang 2014 AS Adalimumab 40mg every 2 wks 12 229 154 (67) 102 (45) - - 114 (50)
AS Placebo - 12 115 35 (30) 11 (10) - - 19 (17)
Lambert 2007 AS Adalimumab 40mg every 2 wks 12 38 18 (47) - 12 (32) - -
AS Placebo - 12 44 12 (27) - 5 (11) - -
ABILITY-1
(2013)∏
nr Adalimumab 40mg every 2 wks 12 69 41 (59) 28 (41) 24 (35) 13 (19) 27 (39)
nr Placebo - 12 73 23 (32) 10 (14) 6 (8) 3 (4) 10 (14)
ATLAS (2006) AS Adalimumab 40mg every 2 wks 12 208 121 (58) 83 (40) - - 94 (45)
AS Placebo - 12 107 22 (21) 14 (13) - - 17 (16)
RAPID-axSpA (2014) AS
AS Certolizumab pegol 200mg every 2 wks 12 65 37 (57) 26 (40) - - 27 (42)
AS Certolizumab pegol 400mg every 4 wks 12 56 36 (64) 28 (50) - - 23 (41)
AS Placebo - 12 57 21 (37) 11 (19) - - 6 (11)
RAPID-axSpA (2014) NR
nr Certolizumab pegol 200mg 12 46 27 (59) 22 (48) - - 23 (50)
nr Certolizumab pegol 400mg 12 51 32 (63) 24 (47) - - 24 (47)
nr Placebo - 12 50 20 (40) 8 (16) - - 8 (16)
Barkham 2010 AS Etanercept 25mg twice weekly 12 20 - 4 (20) - - 7 (35)

Technology Assessment Report for NICE
TNF-alpha inhibitors for ankylosing spondylitis and nr-axSpA
15/12/2014 257
AS Placebo - 12 20 - 0 (0) - - 1 (5)
Davis 2003 AS Etanercept 25mg twice weekly 12 138 82 (59) - 62 (45) 40 (29) -
AS Placebo - 12 139 39 (28) - 18 (13) 10 (7) -
AS Etanercept 25mg twice weekly 24 138 78 (57) - 58 (42) - -
AS Placebo - 24 139 31 (22) - 14 (10) - -
Dougados 2011 AS Etanercept 50mg weekly 12 39 25 (64) 17 (44) 15 (38) 10 (26) 18 (46)
AS Placebo - 12 43 14 (33) 10 (23) 6 (14) 4 (9) 10 (23)
Dougados 2014 AS Etanercept 50mg weekly 12 106 55 (52) 34 (32) - - 46 (43)
AS Placebo - 12 109 39 (36) 17 (16) - - 26 (24)
nr Etanercept 50mg weekly 12 94 - 33 (35) - - -
nr Placebo - 12 95 - 16 (17) - - -
Gorman 2002 AS Etanercept 25mg twice a week 16 20 16 (80) - - - -
AS Placebo - 16 20 6 (30) - - - -
Calin 2004 AS Etanercept 25 mg twice weekly 12 45 26 (58) - - - -
AS Placebo - 12 39 9 (23) - - - -
Van der Heijde 2006
AS Etanercept 25mg twice weekly 12 150 107 (71) 80 (53) - - 87 (58)
AS Etanercept 50mg weekly 12 155 115 (74) 90 (58) - - 93 (60)
AS Placebo - 12 51 19 (37) 11 (22) - - 10 (20)
Giardina 2010 AS Etanercept 50mg weekly 12 25 15 (60) 11 (44) - - -
AS Infliximab 5mg/kg at wk 0,2,6+ 12 25 19 (76) 14 (56) - - -
GO-RAISE 2008 AS Golimumab 50mg(2 every 4 wks) 14 138 82 (59) 62 (45) - - 61 (44)
AS Golimumab 100mg(2 every 4 wks) 14 140 84 (60) 69 (49) - - 56 (40)
AS placebo - 14 78 17 (22) 12 (15) - - 12 (15)
Bao 2012 AS Golimumab 50mg Q4 weeks 14 108 53 (49) 38 (35) - - 37 (34)
AS Placebo - 14 105 26 (25) 10 (10) - - 5 (5)

Technology Assessment Report for NICE
TNF-alpha inhibitors for ankylosing spondylitis and nr-axSpA
15/12/2014 258
Tam 2014 AS Golimumab 50mg monthly 26 20 11 (55) - - - -
AS Placebo - 26 21 3 (14) - - - -
Barkham 2009 nr Infliximab 5 mg/kg(0, 2, 6+ wks) 16 20 - 11 (55) - - -
nr Placebo - 16 20 - 3 (15) - - -
Braun 2002 AS Infliximab 5mg/kg(wks 0,2,6) 12 34 23 (68) - 16 (47) - 18 (53)
AS Placebo - 12 35 10 (29) - 2 (6) - 3 (9)
Marzo-Ortega (2005)
AS Infliximab+meth. 5mg/kg* 10 28 20 (71) - - - -
AS Placebo+meth.*** ** 10 14 4 (29) - - - -
AS Infliximab+meth. 5mg/kg* 30 28 14 (50) - - - -
AS Placebo+meth. ** 30 14 3 (21) - - - -
Van den Bosch (2002)
AS Infliximab 5mg/kg(wks 0,2,6) 12 9 - - - - -
AS Placebo - 12 12 - - - - -
ASSERT (2005) AS Infliximab 5mg/kg(wks 0,2,6+) 24 201 123 (61) 93 (46) - - -
AS Placebo - 24 78 15 (19) 9 (12) - - -
Park 2013 AS Inflectra (CT-P13) 5mg/kg 14 125 72 (58) 48 (38) - - -
AS Infliximab 5mg/kg 14 125 79 (63) 56 (45) - - -
AS Inflectra (CT-P13) 5mg/kg 30 125 79 (63) 58 (46) - - -
AS Infliximab 5mg/kg 30 125 84 (67) 55 (44) - - -
AS Inflectra (CT-P13) 5mg/kg 54 125 71 (57) 51 (41) - - -
AS Infliximab 5mg/kg 54 125 75 (60) 46 (37) - - -
*5mg/kg (infusion at weeks 0,2,6,14,22)+methotrexate oral 7.5mg with folic acid (5mg twice a week which increased to 10mg a week)
**methotrexate oral 7.5mg with folic acid (5mg twice a week which increased to 10mg a week)
***meth.: methotrexate
∏: licensed population

Technology Assessment Report for NICE
TNF-alpha inhibitors for ankylosing spondylitis and nr-axSpA
15/12/2014 259
11.5 Appendix 5 Relative effects of anti-TNFs
AS population
In the following tables, the intervention is stated in the top row and the comparator is in the left-hand column, which is reverse to normal.
Table 113: Relative effects RR BASDAI50 AS
ADA CER ETA GOL INF
Md 95% CrI Md 95% CrI Md 95% CrI Md 95% CrI Md 95% CrI
ADA - - 1.15 (0.61 to 1.86) 1.01 (0.65 to 1.50) 1.13 (0.75 to 1.66) 1.55 (0.74 to 2.50)
CER 0.87 (0.54 to 1.63) - - 0.88 (0.50 to 1.70) 0.99 (0.58 to 1.89) 1.34 (0.61 to 2.74)
ETA 0.99 (0.67 to 1.53) 1.14 (0.59 to 1.98) - - 1.12 (0.71 to 1.78) 1.53 (0.72 to 2.66)
GOL 0.88 (0.60 to 1.33) 1.01 (0.53 to 1.74) 0.89 (0.56 to 1.40) - - 1.37 (0.65 to 2.30)
INF 0.65 (0.40 to 1.35) 0.74 (0.37 to 1.65) 0.65 (0.38 to 1.38) 0.73 (0.43 to 1.54) - -
Table 114: Relative effects OR BASDAI50 AS
ADA CER ETA GOL INF
Md 95% CrI Md 95% CrI Md 95% CrI Md 95% CrI Md 95% CrI
ADA - - 1.28 (0.47 to 3.48) 1.01 (0.51 to 2.02) 1.25 (0.62 to 2.48) 2.58 (0.62 to 10.60)
CER 0.78 (0.29 to 2.14) - - 0.79 (0.27 to 2.32) 0.98 (0.33 to 2.89) 2.02 (0.39 to 10.33)
ETA 0.99 (0.50 to 1.97) 1.26 (0.43 to 3.71) - - 1.23 (0.56 to 2.73) 2.55 (0.58 to 11.01)
GOL 0.80 (0.40 to 1.61) 1.02 (0.35 to 3.03) 0.81 (0.37 to 1.80) - - 2.06 (0.47 to 8.91)
INF 0.39 (0.09 to 1.62) 0.50 (0.10 to 2.56) 0.39 (0.09 to 1.72) 0.49 (0.11 to 2.12) - -

Technology Assessment Report for NICE
TNF-alpha inhibitors for ankylosing spondylitis and nr-axSpA
15/12/2014 260
Table 115: Relative effects RR ASAS20 AS
ADA CER ETA GOL INF
Md 95% CrI Md 95% CrI Md 95% CrI Md 95% CrI Md 95% CrI
ADA - - 0.79 (0.53 to 1.07) 0.98 (0.82 to 1.17) 0.94 (0.75 to 1.15) 1.07 (0.75 to 1.38)
CER 1.27 (0.93 to 1.88) - - 1.24 (0.91 to 1.83) 1.19 (0.85 to 1.77) 1.35 (0.88 to 2.09)
ETA 1.03 (0.86 to 1.22) 0.81 (0.55 to 1.10) - - 0.96 (0.76 to 1.18) 1.10 (0.77 to 1.41)
GOL 1.07 (0.87 to 1.34) 0.84 (0.56 to 1.18) 1.04 (0.85 to 1.31) - - 1.14 (0.79 to 1.53)
INF 0.93 (0.73 to 1.34) 0.74 (0.48 to 1.14) 0.91 (0.71 to 1.31) 0.87 (0.66 to 1.27) - -
Table 116: Relative effects OR ASAS20 AS
ADA CER ETA GOL INF
Md 95% CrI Md 95% CrI Md 95% CrI Md 95% CrI Md 95% CrI
ADA - - 0.57 (0.28 to 1.20) 0.94 (0.58 to 1.50) 0.85 (0.49 to 1.46) 1.23 (0.50 to 3.01)
CER 1.74 (0.84 to 3.57) - - 1.62 (0.78 to 3.35) 1.47 (0.67 to 3.16) 2.13 (0.74 to 6.13)
ETA 1.07 (0.67 to 1.71) 0.62 (0.30 to 1.28) - - 0.90 (0.52 to 1.55) 1.31 (0.54 to 3.20)
GOL 1.18 (0.69 to 2.05) 0.68 (0.32 to 1.49) 1.11 (0.65 to 1.91) - - 1.46 (0.57 to 3.70)
INF 0.82 (0.33 to 1.99) 0.47 (0.16 to 1.36) 0.76 (0.31 to 1.86) 0.69 (0.27 to 1.75) - -
Table 117: Relative effects RR ASAS40 AS
ADA CER ETA GOL
Md 95% CrI Md 95% CrI Md 95% CrI Md 95% CrI
ADA - - 0.74 (0.41 to 1.22) 0.80 (0.51 to 1.20) 0.91 (0.61 to 1.32)
CER 1.35 (0.82 to 2.45) - - 1.09 (0.61 to 2.04) 1.23 (0.72 to 2.26)

Technology Assessment Report for NICE
TNF-alpha inhibitors for ankylosing spondylitis and nr-axSpA
15/12/2014 261
ETA 1.24 (0.83 to 1.95) 0.92 (0.49 to 1.63) - - 1.13 (0.72 to 1.81)
GOL 1.10 (0.76 to 1.64) 0.81 (0.44 to 1.38) 0.88 (0.55 to 1.38) - -
Table 118: Relative effects OR ASAS40 AS
ADA CER ETA GOL
Md 95% CrI Md 95% CrI Md 95% CrI Md 95% CrI
ADA - - 0.59 (0.25 to 1.45) 0.68 (0.33 to 1.40) 0.84 (0.42 to 1.67)
CER 1.68 (0.69 to 4.04) - - 1.14 (0.45 to 2.90) 1.42 (0.57 to 3.50)
ETA 1.47 (0.71 to 3.02) 0.87 (0.35 to 2.24) - - 1.23 (0.58 to 2.63)
GOL 1.19 (0.60 to 2.38) 0.71 (0.29 to 1.75) 0.81 (0.38 to 1.72) - -
Table 119: Relative effects RR ASAS50 AS
ADA ETA INF
Md 95% CrI Md 95% CrI Md 95% CrI
ADA - - 1.24 (0.60 to 3.31) 2.00 (0.73 to 5.87)
ETA 0.81 (0.30 to 1.66) - - 1.63 (0.68 to 2.95)
INF 0.50 (0.17 to 1.36) 0.61 (0.34 to 1.46) - -
Table 120: Relative effects OR ASAS50 AS
ADA ETA INF
Md 95% CrI Md 95% CrI Md 95% CrI
ADA - - 1.40 (0.40 to 5.05) 4.11 (0.59 to 29.29)

Technology Assessment Report for NICE
TNF-alpha inhibitors for ankylosing spondylitis and nr-axSpA
15/12/2014 262
ETA 0.71 (0.20 to 2.49) - - 2.92 (0.55 to 15.51)
INF 0.24 (0.03 to 1.71) 0.34 (0.06 to 1.81) - -
Table 121: Relative effects Mean difference BASDAI change from baseline AS
ADA CER ETA INF
Mean 95% CrI Mean 95% CrI Mean 95% CrI Mean 95% CrI
ADA - - 0.10 (-0.68 to 0.88) -0.20 (-0.71 to 0.30) -0.73 (-1.69 to 0.24)
CER -0.10 (-0.88 to 0.68) - - -0.30 (-1.12 to 0.52) -0.82 (-1.98 to 0.33)
ETA 0.20 (-0.30 to 0.71) 0.30 (-0.52 to 1.12) - - -0.53 (-1.50 to 0.47)
INF 0.73 (-0.24 to 1.69) 0.82 (-0.33 to 1.98) 0.53 (-0.47 to 1.50) - -
Table 122: Relative effects Mean difference BASFI change from baseline AS
ADA CER ETA GOL INF
Mean 95% CrI Mean 95% CrI Mean 95% CrI Mean 95% CrI Mean 95% CrI
ADA - - 0.15 (-0.67 to 0.97) -0.18 (-0.73 to 0.36) -0.20 (-0.75 to 0.35) -0.91 (-2.00 to 0.20)
CER -0.15 (-0.97 to 0.67) - - -0.33 (-1.16 to 0.49) -0.35 (-1.17 to 0.47) -1.05 (-2.31 to 0.22)
ETA 0.18 (-0.36 to 0.73) 0.33 (-0.49 to 1.16) - - -0.02 (-0.57 to 0.55) -0.72 (-1.83 to 0.39)
GOL 0.20 (-0.35 to 0.75) 0.35 (-0.47 to 1.17) 0.02 (-0.55 to 0.57) - - -0.71 (-1.82 to 0.42)
INF 0.91 (-0.20 to 2.00) 1.05 (-0.22 to 2.31) 0.72 (-0.39 to 1.83) 0.71 (-0.42 to 1.82) - -
Table 123: Relative effects Mean difference BASMI change from baseline AS
ADA CER ETA GOL

Technology Assessment Report for NICE
TNF-alpha inhibitors for ankylosing spondylitis and nr-axSpA
15/12/2014 263
Mean 95% CrI Mean 95% CrI Mean 95% CrI Mean 95% CrI
ADA - - 0.11 (-0.21 to 0.42) 0.00 (-0.32 to 0.31) 0.26 (0.06 to 0.46)
CER -0.11 (-0.42 to 0.21) - - -0.11 (-0.51 to 0.30) 0.15 (-0.17 to 0.48)
ETA 0.00 (-0.31 to 0.32) 0.11 (-0.30 to 0.51) - - 0.26 (-0.06 to 0.58)
GOL -0.26 (-0.46 to -0.06) -0.15 (-0.48 to 0.17) -0.26 (-0.58 to 0.06) - -
Table 124: Relative effects Mean difference SF-36 PCS change from baseline AS
ADA CER GOL
Mean 95% CrI Mean 95% CrI Mean 95% CrI
ADA - - 2.11 (-0.20 to 4.44) 1.52 (-0.24 to 3.30)
CER -2.11 (-4.44 to 0.20) - - -0.59 (-2.99 to 1.85)
GOL -1.52 (-3.30 to 0.24) 0.59 (-1.85 to 3.00) - -
Table 125: Relative effects Mean difference MASES change from baseline AS
GOL
Mean 95% CrI
ADA -0.20 (-1.12 to 0.70)
Table 126: Relative effects Mean difference SF-36 MCS change from baseline AS
ADA CER GOL
Mean 95% CrI Mean 95% CrI Mean 95% CrI
ADA - - -0.15 (-3.83 to 1.33 (-0.97 to

Technology Assessment Report for NICE
TNF-alpha inhibitors for ankylosing spondylitis and nr-axSpA
15/12/2014 264
3.54) 3.63)
CER 0.15 (-3.53 to 3.83) - - 1.51
(-2.24 to 5.21)
GOL -1.33 (-3.63 to 0.98) -1.51
(-5.20 to 2.24) - -
Relative effects of anti-TNFs – nr-axSpA population
In the following tables, the intervention is stated in the top row and the comparator is in the left-hand column, which is reverse to normal.
Table 127: Relative effects RR BASDAI 50 nr-axSpA
ADA CER ETA
Md 95% CrI Md 95% CrI Md 95% CrI
ADA - - 1.11 (0.62 to 1.96) 0.76 (0.44 to 1.30)
CER 0.90 (0.51 to 1.61) - - 0.69 (0.38 to 1.22)
ETA 1.31 (0.77 to 2.28) 1.46 (0.82 to 2.62) - -
Table 128: Relative effects OR BASDAI50 nr-axSpA
ADA CER ETA
Md 95% CrI Md 95% CrI Md 95% CrI
ADA - - 1.24 (0.42 to 3.75) 0.62 (0.25 to 1.55)
CER 0.81 (0.27 to 2.40) - - 0.50 (0.18 to 1.40)
ETA 1.62 (0.65 to 3.99) 2.01 (0.72 to 5.68) - -

Technology Assessment Report for NICE
TNF-alpha inhibitors for ankylosing spondylitis and nr-axSpA
15/12/2014 265
Table 129: Relative effects RR ASAS 20 nr-axSpA
ADA CER ETA
Md 95% CrI Md 95% CrI Md 95% CrI
ADA - - 0.83 (0.54 to 1.20) 0.77 (0.52 to 1.08)
CER 1.20 (0.84 to 1.87) - - 0.92 (0.60 to 1.44)
ETA 1.31 (0.93 to 1.94) 1.09 (0.70 to 1.67) - -
Table 130: Relative effects OR ASAS 20 nr-axSpA
ADA CER ETA
Md 95% CrI Md 95% CrI Md 95% CrI
ADA - - 0.62 (0.25 to 1.59) 0.52 (0.23 to 1.19)
CER 1.60 (0.63 to 3.98) - - 0.83 (0.34 to 2.01)
ETA 1.92 (0.84 to 4.33) 1.20 (0.50 to 2.92) - -
Table 131: Relative effects RR ASAS 40 nr-axSpA
ADA CER ETA INF
Md 95% CrI Md 95% CrI Md 95% CrI Md 95% CrI
ADA - - 0.97 (0.51 to 1.78) 0.66 (0.35 to 1.21) 1.16 (0.42 to 2.29)
CER 1.04 (0.56 to 1.98) - - 0.68 (0.35 to 1.35) 1.20 (0.43 to 2.55)
ETA 1.51 (0.83 to 2.82) 1.46 (0.74 to 2.85) - - 1.74 (0.63 to 3.70)
INF 0.86 (0.44 to 2.37) 0.84 (0.39 to 2.33) 0.57 (0.27 to 1.58) - -

Technology Assessment Report for NICE
TNF-alpha inhibitors for ankylosing spondylitis and nr-axSpA
15/12/2014 266
Table 132: Relative effects OR ASAS 40 nr-axSpA
ADA CER ETA INF
Md 95% CrI Md 95% CrI Md 95% CrI Md 95% CrI
ADA - - 0.94 (0.31 to 2.90) 0.51 (0.19 to 1.35) 1.36 (0.26 to 7.22)
CER 1.07 (0.34 to 3.25) - - 0.54 (0.18 to 1.58) 1.45 (0.25 to 8.10)
ETA 1.98 (0.74 to 5.23) 1.86 (0.63 to 5.51) - - 2.68 (0.52 to 13.91)
INF 0.73 (0.14 to 3.91) 0.69 (0.12 to 3.93) 0.37 (0.07 to 1.91) - -
Table 133: Relative effects Mean difference BASDAI change from baseline nr-axSpA
ADA CER ETA INF
Mean 95% CrI Mean 95% CrI Mean 95% CrI Mean 95% CrI
ADA - - -0.63 (-1.77 to 0.52) 0.53 (-0.51 to 1.56) -1.43 (-3.08 to 0.22)
CER 0.63 (-0.52 to 1.77) - - 1.15 (-0.12 to 2.42) -0.81 (-2.62 to 1.00)
ETA -0.53 (-1.56 to 0.51) -1.15 (-2.42 to 0.12) - - -1.97 (-3.70 to -0.21)
INF 1.43 (-0.21 to 3.08) 0.81 (-1.00 to 2.62) 1.97 (0.21 to 3.70) - -
Table 134: Relative effects Mean difference BASFI change from baseline nr-axSpA
ADA CER ETA INF
Mean 95% CrI Mean 95% CrI Mean 95% CrI Mean 95% CrI
ADA - - -1.00 (-2.10 to 0.10) 0.30 (-0.48 to 1.08) -1.33 (-2.86 to 0.19)
CER 1.00 (-0.10 to 2.10) - - 1.30 (0.19 to 2.41) -0.33 (-2.05 to 1.38)

Technology Assessment Report for NICE
TNF-alpha inhibitors for ankylosing spondylitis and nr-axSpA
15/12/2014 267
ETA -0.30 (-1.08 to 0.48) -1.30 (-2.41 to -0.19) - - -1.63 (-3.15 to -0.09)
INF 1.33 (-0.19 to 2.86) 0.33 (-1.38 to 2.05) 1.63 (0.09 to 3.15) - -
Table 135: Relative effects Mean difference BASMI change from baseline nr-axSpA
ADA CER ETA
Mean 95% CrI Mean 95% CrI Mean 95% CrI
ADA - - -0.53 (-0.93 to -0.12) 0.02 (-0.47 to 0.51)
CER 0.53 (0.12 to 0.93) - - 0.55 (-0.02 to 1.10)
INF -0.02 (-0.51 to 0.47) -0.55 (-1.10 to 0.02) - -
Table 136: Relative effects Mean difference SF-36 PCS change from baseline nr-axSpA
ADA CER ETA
Mean 95% CrI Mean 95% CrI Mean 95% CrI
ADA - - 2 (-1.53 to 5.57) -2.88 (-6.11 to 0.31)
CER -2.00 (-5.57 to 1.53) - - -4.88 (-8.52 to -1.29)
INF 2.88 (-0.31 to 6.11) 4.88 (1.29 to 8.52) - -
Table 137: Relative effects Mean difference SF-36MCS change from baseline nr-axSpA
ADA CER
Mean 95% CrI Mean 95% CrI
ADA - - 2.87 (-1.78 to 7.49)
CER -2.87 (-7.49 to 1.78) - -

15/12/2014 268
11.6 Appendix 6 BASDAI and BASFI conditional on response data
Table 138 Baseline BASDAI according to conditional on response at week 12 (or nearest time point)
Anti-TNF
Population (trial)
Resp criterion Treatment Response n Mean SD
Adalimumab AS
(ATLAS)
ASAS20
ADA 40mg Non-responder 83 6.23 1.929
Responder 121 6.27 1.542
Placebo Non-responder 82 6.29 1.712
Responder 22 6.64 1.468
ASAS40 ADA 40mg Non-responder 119 6.21 1.802
Responder 85 6.32 1.568
Placebo Non-responder 89 6.37 1.714
Responder 15 6.34 1.362
BASDAI50
ADA 40mg Non-responder 119 6.21 1.802
Responder 85 6.32 1.568
Placebo Non-responder 89 6.37 1.714
Responder 15 6.34 1.362
Golimumab
AS(GO_RAISE)
ASAS20 GOL 50mg Non-responder 56 6.51 1.687
Responder 82 6.49 1.494
Placebo Non-responder 61 6.65 1.622
Responder 17 6.46 1.120
ASAS40 GOL 50mg Non-responder 76 6.54 1.680
Responder 62 6.45 1.433
Placebo Non-responder 66 6.65 1.579
Responder 12 6.41 1.194
BASDAI50 GOL 50mg Non-responder 72 6.69 1.523
Responder 61 6.25 1.638
Placebo Non-responder 66 6.63 1.581
Responder 12 6.51 1.194
Etanercept AS
(EU-314)
ASAS20 ETN 25mg twice weekly Non-responder 43 ***** ******
Responder 107 ***** ******
ETN 50mg once weekly Non-responder 40 ***** ******
Responder 115 ***** ******
Placebo Non-responder 32 ***** ******
Responder 19 ***** ******
ASAS40 ETN 25mg twice weekly Non-responder 70 ***** ******
Responder 80 ***** ******
ETN 50mg once weekly Non-responder 65 ***** ******
Responder 90 ***** ******
Placebo Non-responder 40 ***** ******
Responder 11 ***** ******
BASDAI50 ETN 25mg twice weekly Non-responder 63 ***** ******

Technology Assessment Report for NICE
TNF-alpha inhibitors for ankylosing spondylitis and nr-axSpA
15/12/2014 269
Responder 87 ***** ******
ETN 50mg once weekly Non-responder 62 ***** ******
Responder 93 ***** ******
Placebo Non-responder 41 ***** ******
Responder 10 ***** ******
Adalimumab
M10-791 (nr-
axSpA sub-
population with a
positive MRI
and/or elevated
CRP)
ASAS20 ADA 40mg Non-responder 27 6.31 1.66
Responder 41 6.46 1.49
Placebo Non-responder 46 6.49 1.37
Responder 23 6.05 1.77
ASAS40 ADA 40mg Non-responder 40 6.60 1.63
Responder 28 6.13 1.41
Placebo Non-responder 59 6.41 1.55
Responder 10 5.93 1.27
BASDAI 50 ADA 40mg Non-responder 41 6.53 1.69
Responder 27 6.21 1.31
Placebo Non-responder 59 6.46 1.52
Responder 10 5.64 1.34
Etanercept (1031
nr-axSpA))
ASAS20 ETN 50mg Non-responder *** **** *****
Responder *** **** *****
Placebo Non-responder *** **** *****
Responder *** **** *****
ASAS40 ETN 50mg Non-responder *** **** *****
Responder *** **** *****
Placebo Non-responder *** **** *****
Responder *** **** *****
BASDAI50 ETN 50mg Non-responder *** **** *****
Responder *** **** *****
Placebo Non-responder *** **** *****
Responder *** **** *****
Table 139 Baseline BASFI according to conditional on response at week 12 (or nearest time point)
Anti-TNF (trial) Resp criterion Treatment Response n Mean SD
Adalimumab AS
(ATLAS)
ASAS20
ADA 40mg Non-responder 83 53.03 23.881
Responder 121 51.38 20.843
Placebo Non-responder 82 57.96 23.089
Responder 22 52.27 16.661
ASAS40 ADA 40mg Non-responder 119 53.05 22.864
Responder 85 50.65 21.005
Placebo Non-responder 89 57.05 22.954
Responder 15 54.98 14.996
BASDAI50 ADA 40mg Non-responder 110 57.79 21.015

Technology Assessment Report for NICE
TNF-alpha inhibitors for ankylosing spondylitis and nr-axSpA
15/12/2014 270
Responder 94 45.34 21.514
Placebo Non-responder 87 59.06 21.989
Responder 17 44.98 17.979
Golimumab
AS(GO_RAISE)
ASAS20 GOL 50mg Non-responder 56 5.35 2.530
Responder 82 4.76 2.249
Placebo Non-responder 59 5.38 2.260
Responder 17 4.13 1.985
ASAS40 GOL 50mg Non-responder 76 5.33 2.488
Responder 62 4.60 2.184
Placebo Non-responder 64 5.33 2.247
Responder 12 3.88 1.932
BASDAI50 GOL 50mg Non-responder 72 5.48 2.412
Responder 61 4.45 2.288
Placebo Non-responder 64 5.39 2.179
Responder 12 3.56 2.070
Etanercept AS
(EU-314)
ASAS20 ETN 25mg twice weekly Non-responder 43 ***** ******
Responder 107 ***** ******
ETN 50mg once weekly Non-responder 40 ***** ******
Responder 115 ***** ******
Placebo Non-responder 32 ***** ******
Responder 19 ***** ******
ASAS40 ETN 25mg twice weekly Non-responder 70 ***** ******
Responder 80 ***** ******
ETN 50mg once weekly Non-responder 65 ***** ******
Responder 90 ***** ******
Placebo Non-responder 40 ***** ******
Responder 11 ***** ******
BASDAI50 ETN 25mg twice weekly Non-responder 63 ***** ******
Responder 87 ***** ******
ETN 50mg once weekly Non-responder 62 ***** ******
Responder 93 ***** ******
Placebo Non-responder 41 ***** ******
Responder 10 ***** ******
Adalimumab nr-
axSpA
M10-791 (sub-
population with a
positive MRI
and/or elevated
CRP)
ASAS20
ADA 40mg Non-responder 27 45.17 22.07
Responder 40 43.05 19.31
Placebo Non-responder 47 48.07 22.99
Responder 23 47.91 23.75
ASAS40
ADA 40mg Non-responder 40 47.61 22.60
Responder 27 39.09 15.41
Placebo Non-responder 60 48.26 23.46
Responder 10 46.54 21.67

Technology Assessment Report for NICE
TNF-alpha inhibitors for ankylosing spondylitis and nr-axSpA
15/12/2014 271
BASDAI 50 ADA 40mg Non-responder 40 49.71 20.05
Responder 27 35.97 18.12
Placebo Non-responder 59 49.06 23.25
Responder 10 43.66 23.07
Etanercept (1031
nr-axSpA))
ASAS20 ETN 50mg Non-responder *** **** *****
Responder *** **** *****
Placebo Non-responder *** **** *****
Responder *** **** *****
ASAS40 ETN 50mg Non-responder *** **** *****
Responder *** **** *****
Placebo Non-responder *** **** *****
Responder *** **** *****
BASDAI50 ETN 50mg Non-responder *** **** *****
Responder *** **** *****
Placebo Non-responder *** **** *****
Responder *** **** *****
Summary
The mean baseline BASDAI and BASFI are presented by treatment response at week 12 (or 14 for
golimumab) for 3 of the five anti-TNFs. This reveals that in patients with AS and patients with nr-
axSpA, on average baseline BASDAI does not differ greatly between responders and non-responders
either to placebo or to active anti-TNF therapy. In patients with AS or nr-axSpA from the trials of
adalimumab (ATLAS and M10-791) and golimumab (GO-RAISE) on average baseline BASFI was
higher in non-responders compared with responders. However, this was not seen in the etanercept
trials.

15/12/2014 272
11.7 Appendix 7 Long-term efficacy data
Table 140 data from open label extensions of included RCTs
Results
Study characteristics No (%) of responders Other outcomes
Trial cohort and
references of
open-label studies
Population Treatment & dose Time point No of
patients
Imputation
methods &
withdrawal criteria
ASAS
20
ASAS
40
BASD
AI 50
Other results ASAS 50, ASAS 70, BASDAI, BASFI,
BASMI, mSASSS, MASES, SF-36 MCS, SF-36 PCS, EQ-5D
Haibel 200855, 57,
58, 174-177
nr-axSpA
with
inflammation
Adalimumab
40mg every other week.
Non-responders at
the end of the
double-blind trial
(week 12) and after
open-label therapy
for at least 12
weeks were eligible
for dose escalation to 40 mg/week.
52 weeks 46 ITT
Patients who
withdrew from
the study were
counted as non-
responders for
categorical data.
LOCF was used
for continuous variables.
23/46
(50%)
24/46
(52%)
BASDAI change from baseline: 2.8 (95% CI 2.1, 3.6)
BASFI change from baseline: 2 (95% CI 1.4, 2.6)
BASMI change from baseline: -0.4 (95% CI -0.7 to -0.04)
EQ5D change from baseline: 0.22 (95 % CI 0.13, 0.31)
SF-36 MCS change from baseline: 4.9 (95% CI 1.6, 8.1)
SF-36 PCS change from baseline: 10.3 (95% CI 6.9, 13.8)
ASQoL change from baseline: 5.3 (95% CI 3.8, 6.7)
MASES change from baseline: 0.9 (95% CI -0.02 to 1.9)
26 patients with MRIs at baseline and 52 weeks showed no
change in sclerosis or in erosions
ABILITY-1
201352, 178-183
nr-axSpA
with
inflammation
Adalimumab
PLA/AD
52 weeks 61 SF-36 PCS change from baseline: 10.0 (SD 9.91)
Adalimumab
AD/AD
52 weeks 55 SF-36 PCS change from baseline: 11.0 (SD 9.93)
Adalimumab
40mg every other week
68 weeks 111 ( Pts
MRI+ or
CRP+)
Observed
(n=142 at week 12)
77/11
1(69%
)
74/11
1(67%
)
Adalimumab 40mg
every other week
104 weeks 102
Adalimumab 40mg
every other week
156 weeks 97 ( Pts
MRI+ or CRP+)
Observed
(n=142 at week
12)
83/97
(86%)
67/97
(69%)
70/97(
72%)
ASAS 50 responders: 58
ASAS 70 responders: 47

Technology Assessment Report for NICE
TNF-alpha inhibitors for ankylosing spondylitis and nr-axSpA
15/12/2014 273
Results
Study characteristics No (%) of responders Other outcomes
Trial cohort and
references of
open-label studies
Population Treatment & dose Time point No of
patients
Imputation
methods &
withdrawal criteria
ASAS
20
ASAS
40
BASD
AI 50
Other results ASAS 50, ASAS 70, BASDAI, BASFI,
BASMI, mSASSS, MASES, SF-36 MCS, SF-36 PCS, EQ-5D
ATLAS 200663,
130, 131, 184-190
Ankylosing
spondylitis
Adalimumab
40 mg every other
week
52 weeks 311 had at
least one dose
Observed 193/
276
(70%)
138/
276
(50%)
167/
276
(61%)
BASDAI change from baseline: -3.5 (SD 2.55) n=274
BASFI change from baseline: -2.6 (SD 2.04) n=274
BASMI final value: 3.2 (SD 2.2) n=273
SF-36 MCS change from baseline: 5.6 (SD 10.35) n=265
SF-36 PCS change from baseline: 10.19 (SD 9.5) n=265
ASQoL change from baseline: -4.8 (SD 4.41) n=274
MASES final value: 2.4 (SD 4.6) n=279
Adalimumab
40 mg every other week
76 weeks Observed BASDAI change from baseline: -3.8 (SD 2.33) n=270
BASFI change from baseline: -2.8 (SD 2.1) n=270
SF-36 MCS change from baseline: 5.1 (SD 11.06) n=263
SF-36 PCS change from baseline: 10.8 (SD 9.88) n=263
ASQoL change from baseline: -5 (SD 4.32) n=270
Adalimumab
40 mg every other week
104 weeks 173 Observed 135/
173 (78%)
109/
173 (63%)
122/
173 (71%)
BASDAI change from baseline: -3.9 (SD 2.44) n=262
BASFI change from baseline: -2.9 (SD 2.14) n=261
BASMI final value: 3.1 (SD 2.2) n=173
SF-36 MCS change from baseline: 5.7 (SD 10.96) n=255
SF-36 PCS change from baseline: 11 (SD 9.88) n=255
ASQoL change from baseline: -5.4 (SD 4.28) n=263
MASES change from baseline: 2.2 (SD 4.4) n=217
Adalimumab
40 mg every other week
128 weeks Observed BASDAI change from baseline: -3.9 (SD 2.39) n=242
BASFI change from baseline: -2.9 (SD 2.17) n=242
SF-36 MCS change from baseline: 4.1 (SD 10.84) n=229
SF-36 PCS change from baseline: 11.3 (SD 9.68) n=229
ASQoL change from baseline: -5.3 (SD 4.35) n=242
Adalimumab
40 mg every other
156 weeks Observed BASDAI change from baseline: -3.9 (SD 3.39) n=236
BASFI change from baseline: -3 (SD 2.1) n=236

Technology Assessment Report for NICE
TNF-alpha inhibitors for ankylosing spondylitis and nr-axSpA
15/12/2014 274
Results
Study characteristics No (%) of responders Other outcomes
Trial cohort and
references of
open-label studies
Population Treatment & dose Time point No of
patients
Imputation
methods &
withdrawal criteria
ASAS
20
ASAS
40
BASD
AI 50
Other results ASAS 50, ASAS 70, BASDAI, BASFI,
BASMI, mSASSS, MASES, SF-36 MCS, SF-36 PCS, EQ-5D
week BASMI final value: 3.7 (SD 1.8) n=233
SF-36 MCS change from baseline: 5.6 (SD 11.59) n=227
SF-36 PCS change from baseline: 11.6 (SD 9.65) n=227
ASQoL change from baseline: -5.4 (SD 4.36) n=236
Adalimumab
40 mg every other week
5 years 125(pts
randomised
to ADA and
completed 5
yrs)
Observed 111/
125 (89%)
88/
125 (70%)
96/
124 (77%)
BASDAI final value: 1.8 (SD 1.9) n=124
BASFI final value: 2.1 (SD 2.1) n=125
BASMI final value: 3.7 (SD 1.8) n=124
SF-36 PCS final value: 44.4 (SD 10) n=165
ASQoL final value: 4.8 (SD 4.8) n=169
RAPID-axSpA
201446, 191-193
Ankylosing
spondylitis
Certolizumab pegol
200 mg every 2 weeks
48 weeks 65 NRI+LOCF 47/65
(72%)
34/65
(52%)
BASDAI final value: 3.3
BASFI final value: 3
Certolizumab pegol
400 mg every 4 weeks
48 weeks 56 42/56
(75%)
36/56
(64%)
BASDAI final value: 3
BASFI final value: 3.2
Certolizumab pegol
- all
48 weeks 121 *****
********
*****
********
Certolizumab pegol
200mg every 2
weeks
96 weeks 65 Non-responder
imputation
**
Certolizumab pegol
400 mg every 4 weeks
96 weeks 56 Non-responder
imputation
**
Certolizumab pegol
– all
96 weeks 121 Non-responder
imputation
78/
121 (64%)
61/
121 (50%)

Technology Assessment Report for NICE
TNF-alpha inhibitors for ankylosing spondylitis and nr-axSpA
15/12/2014 275
Results
Study characteristics No (%) of responders Other outcomes
Trial cohort and
references of
open-label studies
Population Treatment & dose Time point No of
patients
Imputation
methods &
withdrawal criteria
ASAS
20
ASAS
40
BASD
AI 50
Other results ASAS 50, ASAS 70, BASDAI, BASFI,
BASMI, mSASSS, MASES, SF-36 MCS, SF-36 PCS, EQ-5D
Certolizumab pegol
- all
96 weeks 93 Observed case 78/93
(84%)
61/93
(66%)
nr-axSpA
with inflammation
Certolizumab pegol
200 mg every 2 weeks
48 weeks 46 Non-responder
imputation was
used for
categorical
measures and
LOCF for
quantitative
measures (48 week data)
32/46
(70%)
25/46
(54%)
BASDAI final value: 2.9
BASFI final value: 2.1
Certolizumab pegol
400 mg every 4 weeks
48 weeks 51 35/51
(69%)
30/51
(59%)
BASDAI final value: 3.3
BASFI final value: 2.8
Certolizumab pegol
- all
48 weeks 97 *****
******
*****
******
Certolizumab pegol
200mg every 2 weeks
96 weeks 46 Non-responder
imputation
**
Certolizumab pegol
400 mg every 4
weeks
96 weeks 51 Non-responder
imputation
**
Certolizumab pegol
- all
96 weeks 97 Non-responder
imputation
59/97
(61%)
49/97
(51%)
Certolizumab pegol
- all
96 weeks 74 Observed case 59/74
(80%)
49/74
(66%)
Davis 200347, 111,
134, 135, 194, 195
Ankylosing
spondylitis
Placebo then
etanercept
72 weeks 105 Observed case BASFI final value: 32.3 (SD 2.5)
Etanercept then
etanercept
96 weeks 95 Observed case 70/95
(74%)
ASAS 70 responders: 44
BASFI final value: 25.4 (SD 2.4)
Combined groups 96 weeks 257 mSASSS change from baseline: 0.91 (SD 2.45)

Technology Assessment Report for NICE
TNF-alpha inhibitors for ankylosing spondylitis and nr-axSpA
15/12/2014 276
Results
Study characteristics No (%) of responders Other outcomes
Trial cohort and
references of
open-label studies
Population Treatment & dose Time point No of
patients
Imputation
methods &
withdrawal criteria
ASAS
20
ASAS
40
BASD
AI 50
Other results ASAS 50, ASAS 70, BASDAI, BASFI,
BASMI, mSASSS, MASES, SF-36 MCS, SF-36 PCS, EQ-5D
Placebo then
etanercept
168 weeks 127 LOCF 77/
127
(61%)
64/
127
(50%)
Etanercept then
etanercept
192 weeks 124 LOCF 83/
124 (67%)
61/
124 (49%)
Dougados
201454, 196
nr-axSpA
mixed
Etanercept then
etanercept 50mg weekly
32 weeks 100 NRI **
Placebo then
etanercept 50mg weekly
32 weeks 105 NRI **
Etanercept then
etanercept 50mg
weekly
40 weeks 100 NRI **
Placebo then
etanercept 50mg weekly
40 weeks 105 NRI **
Etanercept plus
placebo groups
together 50mg weekly
48 weeks ***
(189 observed)
NRI +LOCF 147 108 128 ********************************************
*******************************************
Etanercept then
etanercept 50mg weekly
48 weeks 100 **
Placebo then
etanercept 50mg weekly
48 weeks 105 **

Technology Assessment Report for NICE
TNF-alpha inhibitors for ankylosing spondylitis and nr-axSpA
15/12/2014 277
Results
Study characteristics No (%) of responders Other outcomes
Trial cohort and
references of
open-label studies
Population Treatment & dose Time point No of
patients
Imputation
methods &
withdrawal criteria
ASAS
20
ASAS
40
BASD
AI 50
Other results ASAS 50, ASAS 70, BASDAI, BASFI,
BASMI, mSASSS, MASES, SF-36 MCS, SF-36 PCS, EQ-5D
Gorman 200249,
195, 197
Etanercept then
etanercept
28 weeks 19 NRI ** ********************************************
Placebo then
etanercept
28 weeks 19 NRI ** ********************************************
Etanercept then
etanercept
40 weeks 19 NRI ** *************************************************
******************
Placebo then
etanercept
40 weeks 19 NRI ** *************************************************
******************
Calin 200448, 136,
137
Ankylosing
spondylitis
Etanercept then
etanercept
60 weeks 42 LOCF BASDAI final value: 2.1
BASFI final value: 2.9
mSASSS change from baseline: 0.36 (95% CI -0.1 to 0.8) n=33
Placebo then
etanercept
60 weeks 39 LOCF BASDAI final value: 2.7
BASFI final value: 3.4
mSASSS change from baseline: -0.15 (95% CI -0.7 to 0.4) n=34
Combined group 108 weeks 81 LOCF ** 44/81
(54%)
** *********************************************
***********************
BASFI final value: 2.9
Etanercept then
etanercept
108 weeks 42 LOCF BASDAI final value: 2.3
BASFI final value: 3
Placebo then
etanercept
108 weeks 39 LOCF BASDAI final value: 2.9
BASFI final value: 3.5
Combined group 264 weeks 59 LOCF 40/59
(68%)
39/59
(66%)
*********************************************
BASDAI final value: 2.7
BASFI final value: 3.2

Technology Assessment Report for NICE
TNF-alpha inhibitors for ankylosing spondylitis and nr-axSpA
15/12/2014 278
Results
Study characteristics No (%) of responders Other outcomes
Trial cohort and
references of
open-label studies
Population Treatment & dose Time point No of
patients
Imputation
methods &
withdrawal criteria
ASAS
20
ASAS
40
BASD
AI 50
Other results ASAS 50, ASAS 70, BASDAI, BASFI,
BASMI, mSASSS, MASES, SF-36 MCS, SF-36 PCS, EQ-5D
Bao 201253, 91,
198, 199
Ankylosing
spondylitis
Golimumab 50 mg 52 weeks 108 ITT 76/
108
(70%)
53/
108
(49%)
62/
108 (57%)
GO-RAISE
200886, 112, 132, 133,
200-212
Ankylosing
spondylitis
Golimumab
placebo - 50 mg
104 weeks 78 ITT 30/78
(38%)
30/78
(38%)
BASDAI final value: median 6 (IQR 1.36 to 7.79)
BASFI final value: median 4.9 (IQR 0.98 to 7.07)
mSASSS change from baseline: 1.6 (SD 4.6) n=66
Golimumab 50 mg 104 weeks 138 ITT 83/
138 (60%)
77/
138 (56%)
BASDAI final value: median 2.7 (IQR 0.84 to 6.08)
BASFI final value: median 2.2 (IQR 0.52 to 5.80)
mSASSS change from baseline: 0.9 (SD 2.7) n=111
Golimumab 100
mg
104 weeks 140 ITT 100/
140 (71%)
76/
140 (54%)
BASDAI final value: median 2.7 (IQR 1.08 to 5.34)
BASFI final value: median 1.8 (IQR 0.49 to 4.79)
mSASSS change from baseline: 0.9 (SD 3.9) n=122
All patients
randomised (all
golimumab from wk 24)
104 weeks 356 NIR +LOCF 249/3
56 (70%)
213/3
56 (60%)
All patients
randomised (all
golimumab from wk 24)
160 weeks 356 NIR +LOCF 246/3
56
(69%)
208/3
56
(58%)
Golimumab
placebo – 50 mg
208 weeks 78 mSASSS change from baseline: 2.1 (SD 5.2) n=66
Golimumab 50 mg 208 weeks 138 mSASSS change from baseline: 1.3 (SD 4.1) n=111
Golimumab 100
mg
208 weeks 140 mSASSS change from baseline: 2 (SD 5.6) n=122
All patients 256 weeks 356 NIR +LOCF 235/3 203/3 199/3

Technology Assessment Report for NICE
TNF-alpha inhibitors for ankylosing spondylitis and nr-axSpA
15/12/2014 279
Results
Study characteristics No (%) of responders Other outcomes
Trial cohort and
references of
open-label studies
Population Treatment & dose Time point No of
patients
Imputation
methods &
withdrawal criteria
ASAS
20
ASAS
40
BASD
AI 50
Other results ASAS 50, ASAS 70, BASDAI, BASFI,
BASMI, mSASSS, MASES, SF-36 MCS, SF-36 PCS, EQ-5D
randomised (all
golimumab from wk 24)
56 (66%)
56 (57%)
56 (58%)
Tam 2013107 Ankylosing
spondylitis
Golimumab 50 mg
monthly
54 weeks 19 UC 18
Placebo/golimumab 54 weeks 17 UC 14
Placebo/placebo 54 weeks 3 UC 1
Park 2013105, 213 Ankylosing
spondylitis
Inflectra
(biosimilar to infliximab) 5mg/kg
78 weeks 88 ITT 61/88
(69%)
50/88
(57%)
Inflectra then
infliximab
(switched at week 54) 5 mg/kg
78 weeks 86 ITT 64/86
(74%)
43/86
(50%)
Inflectra
(biosimilar to
infliximab) 5 mg/kg
102 weeks 88 ITT 67/88 (76%)
53/88 (60%)
Inflectra then
infliximab
(switched at week 54) 5 mg/kg
102 weeks 86 ITT 60/86
(70%)
48/86
(56%)
Braun 200294, 155,
214-221
Ankylosing
spondylitis
Infliximab 5 mg/kg
(infusion at weeks 0, 2, 6)
54 weeks 34 NIR for binary
data
A completer
analysis was conducted.
47% mSASSS reported for 2 groups: patients with worsening of
BASFI >1 and those <1
Placebo/infliximab 54 weeks 35 51%
Aggregate 54 weeks 69 33/69 BASDAI final value: 2.5 (SD 1.7) n=52

Technology Assessment Report for NICE
TNF-alpha inhibitors for ankylosing spondylitis and nr-axSpA
15/12/2014 280
Results
Study characteristics No (%) of responders Other outcomes
Trial cohort and
references of
open-label studies
Population Treatment & dose Time point No of
patients
Imputation
methods &
withdrawal criteria
ASAS
20
ASAS
40
BASD
AI 50
Other results ASAS 50, ASAS 70, BASDAI, BASFI,
BASMI, mSASSS, MASES, SF-36 MCS, SF-36 PCS, EQ-5D
(48%) BASFI final value: 3.0 (SD 2.2) n=52
BASMI final value: 2.4 (SD 2.0) n=52
SF-36 MCS final value: 50.9 (SD 8.9) n=52
SF-36 PCS final value: 40.6 (SD 10.6) n=52
BASDAI final value: 2.4 (SD 1.6) n=46
BASFI final value: 3.1 (SD 2.2) n=46
BASMI final value: 2.4 (SD 1.9) n=46
SF-36 MCS final value: 51.5 (SD 8.6) n=46
SF-36 PCS final value: 40.2 (SD 10.8) n=46
Aggregate 102 weeks 69 NRI for binary
data. A
completer
analysis was conducted
30/69
(43%)
BASDAI final value: 2.6 (SD 2) n=52
BASFI final value: 3.0 (SD 2.2) n=52
BASMI final value: 2.7 (SD 2.1) n=52
SF-36 MCS final value: 50.2 (SD 9.5) n=52
SF-36 PCS final value: 40.9 (SD 11.1) n=52
BASDAI final value: 2.6 (SD 2) n=46
BASFI final value: 3.1 (SD 2.3) n=46
BASMI final value: 2.7 (SD 2.1) n=46
SF-36 MCS final value: 51.4 (SD 8.9) n=46
SF-36 PCS final value: 40.5 (SD 11.4) n=46
Aggregate 156 weeks 46 Completer
analysis. To
calculate means,
LOCF was used.
36/38
(95%)
28/38
(74%)
24/38
(63%)
28/46
BASDAI final value: 2.7 (SD 2) n=46?
BASFI final value: 3.1 (SD 2.5)
BASMI final value: 2.8 (SD 2.2)
SF-36 MCS final value: 48.8 (SD 10.4)

Technology Assessment Report for NICE
TNF-alpha inhibitors for ankylosing spondylitis and nr-axSpA
15/12/2014 281
Results
Study characteristics No (%) of responders Other outcomes
Trial cohort and
references of
open-label studies
Population Treatment & dose Time point No of
patients
Imputation
methods &
withdrawal criteria
ASAS
20
ASAS
40
BASD
AI 50
Other results ASAS 50, ASAS 70, BASDAI, BASFI,
BASMI, mSASSS, MASES, SF-36 MCS, SF-36 PCS, EQ-5D
(61%) SF-36 PCS final value: 41.6 (SD 11.7)
ASSERT 200597,
222-227
Ankylosing
spondylitis
Infliximab (on
placebo 0-24) 5 mg
Week 102 78
(remaining
study
patients may
have taken
high
(unlicenced
ose of infliximab)
Completer
analysis
28/61
(46%)
BASMI change from baseline: -1 (IQR -2.0 to 0.0)
SF-36 MCS change from baseline: 2.3 (IQR -3.6 to 11.9)
SF-36 PCS change from baseline: 8.3 (IQR 2.5 to 17.7) ITT LOCF 33/78
(42%)
One trial which was extended evaluated only spinal and sacroiliac joint inflammation (Lambert 2007) – results not shown.
11.8 Appendix 8 Adverse events
Table 141 Adverse events in RCT placebo phases
Trial name Populati
on
Treatment arm Dose Timepoi
nt
(weeks)
No of pts
randomi
sed
SAEs Serious
infections
TB (incl TB
reactivation)
Injection
site
reactions
Congestive
heart
failure
Malignancie
s
Non-
melanoma
skin
cancer
Withdraw
als due to
Adverse
events
Haibel 200855 nr-axSpA Adalimumab 40mg 12 22 0 0 0 0 0 0
nr-axSpA placebo 0 12 24 0 0 0 0 0 0

Technology Assessment Report for NICE
TNF-alpha inhibitors for ankylosing spondylitis and nr-axSpA
15/12/2014 282
Trial name Populati
on
Treatment arm Dose Timepoi
nt
(weeks)
No of pts
randomi
sed
SAEs Serious
infections
TB (incl TB
reactivation)
Injection
site
reactions
Congestive
heart
failure
Malignancie
s
Non-
melanoma
skin
cancer
Withdraw
als due to
Adverse
events
Hu 201259 AS Adalimumab 40 mg 12 26
AS Placebo 0 12 20
Huang 201460 AS Adalimumab 40 mg 12 229 1 1 0 0 0 0 4
AS Placebo 0 12 115 1 0 0 0 0 0 0
Lambert 200761 AS Adalimumab 40 mg 12 38
AS Placebo 0 12 44
ABILITY-1
(2013) (licensed
population)52
nr-axSpA Adalimumab 40mg 12 95 3 0 0 0 1
nr-axSpA Placebo 0 12 97 1 0 0 0 1
ATLAS (2006)63 AS Adalimumab 40 mg 12 208
AS Placebo 0 12 107

Technology Assessment Report for NICE
TNF-alpha inhibitors for ankylosing spondylitis and nr-axSpA
15/12/2014 283
Trial name Populati
on
Treatment arm Dose Timepoi
nt
(weeks)
No of pts
randomi
sed
SAEs Serious
infections
TB (incl TB
reactivation)
Injection
site
reactions
Congestive
heart
failure
Malignancie
s
Non-
melanoma
skin
cancer
Withdraw
als due to
Adverse
events
RAPID-axSpA
(2014)46
AS Certolizumab pegol 200mg 12 65 Data only for whole group
AS Certolizumab pegol 400mg 12 56
AS Placebo 0 12 57
nr-axSpA Certolizumab pegol 200mg 12 46
nr-axSpA Certolizumab pegol 400mg 12 51
nr-axSpA Placebo 0 12 50
Barkham 201072 AS Etanercept 25mg
twice
weekly
12 20 0 0
AS Placebo 0 12 20 0 0
Davis 200347 AS Etanercept 25mg 12 138

Technology Assessment Report for NICE
TNF-alpha inhibitors for ankylosing spondylitis and nr-axSpA
15/12/2014 284
Trial name Populati
on
Treatment arm Dose Timepoi
nt
(weeks)
No of pts
randomi
sed
SAEs Serious
infections
TB (incl TB
reactivation)
Injection
site
reactions
Congestive
heart
failure
Malignancie
s
Non-
melanoma
skin
cancer
Withdraw
als due to
Adverse
events
AS Placebo 0 12 139
AS Etanercept 25mg 24 138 0 0 41 7
AS Placebo 0 24 139 1 0 13 1
Dougados 201174 AS Etanercept 50mg 12 39
AS Placebo 0 12 43
Dougados 201454 nr-axSpA
mixed
Etanercept 50mg 12 106 2 3 1 1
nr-axSpA
mixed
Placebo 0 12 109 1 0 0 0
nr-axSpA Etanercept 50mg 12 94
nr-axSpA Placebo 0 12 95

Technology Assessment Report for NICE
TNF-alpha inhibitors for ankylosing spondylitis and nr-axSpA
15/12/2014 285
Trial name Populati
on
Treatment arm Dose Timepoi
nt
(weeks)
No of pts
randomi
sed
SAEs Serious
infections
TB (incl TB
reactivation)
Injection
site
reactions
Congestive
heart
failure
Malignancie
s
Non-
melanoma
skin
cancer
Withdraw
als due to
Adverse
events
Gorman 200249 AS Etanercept 25mg 16 20 0 5 0
AS Placebo 0 16 20 0 1 0
Calin 200448 AS Etanercept 25 mg 12 45 1 0 15 0
AS Placebo 0 12 39 0 0 6 0
Van der Heijde
200651
AS Etanercept 25mg 12 150 1 0 32 0 6
AS Etanercept 50mg 12 155 1 0 34 0 8
AS Placebo 0 12 51 0 0 6 0 0
Giardina 201084 AS Etanercept 50mg 104 25 1 0 5 0 0 0
AS Infliximab 5mg/kg 104 25 2 0 1 0 0 0
GO-RAISE
200886
AS Golimumab 50mg 16 138 5

Technology Assessment Report for NICE
TNF-alpha inhibitors for ankylosing spondylitis and nr-axSpA
15/12/2014 286
Trial name Populati
on
Treatment arm Dose Timepoi
nt
(weeks)
No of pts
randomi
sed
SAEs Serious
infections
TB (incl TB
reactivation)
Injection
site
reactions
Congestive
heart
failure
Malignancie
s
Non-
melanoma
skin
cancer
Withdraw
als due to
Adverse
events
AS Golimumab 100mg 16 140 7
AS placebo 0 16 78 4
Bao 201453 AS Golimumab 50mg 14 108
AS Placebo 0 14 105
Tam 2014107 AS Golimumab 50mg 24 20 0
AS Placebo 0 24 21 1
Barkham 200956 nr-axSpA Infliximab 5 mg/kg 16 20 0 1
nr-axSpA Placebo 0 16 20
Braun 200294 AS Infliximab 5mg/kg 12 34 3 1 0 4
AS Placebo 0 12 35 0 0 0

Technology Assessment Report for NICE
TNF-alpha inhibitors for ankylosing spondylitis and nr-axSpA
15/12/2014 287
Trial name Populati
on
Treatment arm Dose Timepoi
nt
(weeks)
No of pts
randomi
sed
SAEs Serious
infections
TB (incl TB
reactivation)
Injection
site
reactions
Congestive
heart
failure
Malignancie
s
Non-
melanoma
skin
cancer
Withdraw
als due to
Adverse
events
Marzo-Ortega
(2005)50
AS Infliximab+methotre
xate
5mg/kg 10 28
AS Placebo+metotrexate 0 10 14
AS Infliximab+methotre
xate
5mg/kg 30 28 0 1 0
AS Placebo+metotrexate 0 30 14 0 0 0
Van den Bosch
(2002)96
AS Infliximab 5mg/kg 12 9 Uncl
ear
Unclear
AS Placebo 0 12 12 Uncl
ear
Unclear
ASSERT
(2005)97
AS Infliximab 5mg/kg 24 202 7 2 0 22 0 2
AS Placebo 0 24 75 2 0 0 7 0 1
Park 2013105 AS Inflectra (CT-P13) 5mg/kg 14 125

Technology Assessment Report for NICE
TNF-alpha inhibitors for ankylosing spondylitis and nr-axSpA
15/12/2014 288
Trial name Populati
on
Treatment arm Dose Timepoi
nt
(weeks)
No of pts
randomi
sed
SAEs Serious
infections
TB (incl TB
reactivation)
Injection
site
reactions
Congestive
heart
failure
Malignancie
s
Non-
melanoma
skin
cancer
Withdraw
als due to
Adverse
events
AS Infliximab 5mg/kg 14 125
AS Inflectra (CT-P13) 5mg/kg 30 128 6 2 5 8
AS Infliximab 5mg/kg 30 122 8 1 6 5
AS Inflectra (CT-P13) 5mg/kg 54 125
AS Infliximab 5mg/kg 54 125
Blank fields indicate that data were not reported for that outcome

15/12/2014 289
11.9 Appendix 9: Extended synthesis models
In this Appendix we describe in more detail the data and modelling approaches implemented in
Section 6. Note that while this Appendix aims to provide a methodological description of methods, a
full description of findings and its interpretations are in Section 6.
General aspects of implementation and software
The synthesis was conducted from a Bayesian perspective, using WinBUGS (a Markov Chain Monte
Carlo simulation based software for Bayesian inference). For burn-in, we ran 100,000 simulations
and another 100,000 were used in inferences. Convergence was assessed by running two chains and
convergence was assumed if the Gelman-Rubin statistic was equal to 1. Goodness of fit was assessed
using the Deviance Information Criterion (DIC).160
Models with smaller DIC are better supported by
the data. In the presence of autocorrelation, the MCMC simulation for inference was increased to
200,000 and a thin of 20 was applied (yielding a sample for inference of 10000 for each chain).
The main synthesis models will pool differences between treatment and control in change scores from
baseline (BASDAI and BASFI). The treatment associated with the lowest (most negative) mean
change score is expected to be best. However, it is important to quantify the uncertainty around the
estimates and for this reason standard deviations will be reported alongside expected values. Where
odds ratios are presented, median values instead of means were used to summarise inferences.
Where possible, meta-regression analyses were conducted to evaluate potential treatment effect
modifiers. Meta-regression is a tool aimed at examining the impact of variables on effect size using
regression-based techniques. In these explorations, the following baseline characteristics were
considered: BASDAI score, BASFI score, age, gender, duration of symptoms (years) and C-reactive
protein (CRP).
Relative effectiveness estimates for models assuming exchangeability across treatments (A5) are
based on the predictive distribution, representing the distribution of the data averaged over all possible
parameter values. This summary statistic best reflects the impact of uncertainty in the parameters of
the model and is here judged as a more appropriate basis to be used in the decision model.161

Technology Assessment Report for NICE
TNF-alpha inhibitors for ankylosing spondylitis and nr-axSpA
15/12/2014 290
11.9.1 Modelling approach A
Brief description of the data
Based on study populations and follow-up (i.e. around 12-week in duration), 16 of the RCTs are
considered directly relevant to the decision problem for the AS population (studies 1 to 16 in Table
142). One of these studies did not report BASDAI or BASFI outcomes (study 3) and thus could not be
included in analyses. The 15 remaining studies reported at least one outcome measure – BASDAI50
and/or change from baseline on BASDAI and BASFI scores.
Table 142: Evidence on BASDAI and BASFI related outcomes for the AS population
Trial name treat N treat N PLA BASDAI50 change BASDAI change BASFI
1 Hu 2012 1 26 20
X X 2 Huang 2014 1 229 115 X X X
3 Lambert 2007 1 38 44
4 ATLAS (2006) 1 208 107 X X
5 RAPID-axSpA (2014) 2 121 57 X X X
6 Barkham 2010 3 20 20 X X* X*
7 Davis 2003 3 138 139
X X 8 Dougados 2011 3 39 43 X X X
9 Gorman 2002 3 20 20
X
10 Calin 2004 3 45 39
X X 11 Van der Heijde 2006 3 305 51 X
12 GO-RAISE 2008 4 138 78 X
X
13 Bao 2012 4 108 105 X
X 14 Braun 2002 5 34 35 X X* X*
15 Marzo-Ortega (2005) 5 28 14
X X*
16 Van den Bosch (2002) 5 9 12
X* X*
* Do not report any measure of dispersion (such as standard deviations)
treat: 1 =ADA, 2=CER (CER200 and/or CER400), 3=ETA (ETA25 and/or ETA50), 4=GOL50 , 5=INF
Note that some studies only report one of the BASDAI measures. For example, the golimumab trials
(studies 12 and 13) only report BASDAI 50 and not the absolute change in this score.
This modelling approach directly evaluates relative treatment effects – i.e. log OR for BASDAI50
response and the difference between treatment and placebo in change in BASDAI and BASFI from
baseline. The dataset analysed is shown in Table 143
Table 143. Modelling approach A: Data
Study, j Treat, t Outcome, o y se
1 1 1 -- --
2 1 1 1.61 0.28 3 1 1 -- --
4 1 1 1.47 0.30
5 2 1 1.79 0.42 6 3 1 2.30 1.13
7 3 1 -- --
8 3 1 1.04 0.48 9 3 1 -- --
10 3 1 -- --
11 3 1 1.78 0.37 12 4 1 1.47 0.36
13 4 1 2.34 0.50
14 5 1 2.45 0.69 15 5 1 -- --
16 5 1 -- --

Technology Assessment Report for NICE
TNF-alpha inhibitors for ankylosing spondylitis and nr-axSpA
15/12/2014 291
1 1 2 -1.60 0.67
2 1 2 -1.40 0.22
3 1 2 -- -- 4 1 2 -1.80 0.28
5 2 2 -1.45 0.36
6 3 2 -1.87 0.90* 7 3 2 -1.91 0.26
8 3 2 -1.20 0.44
9 3 2 -- -- 10 3 2 -1.87 0.49
11 3 2 -- -- 12 4 2 -- --
13 4 2 -- --
14 5 2 -2.60 0.69* 15 5 2 -1.73 0.70
16 5 2 -2.97 1.26*
1 1 3 -0.90 0.68
2 1 3 -1.28 0.20 3 1 3 -- --
4 1 3 -- --
5 2 3 -1.10 0.37 6 3 3 -1.56 0.93*
7 3 3 -1.34 0.29
8 3 3 -1.20 0.40 9 3 3 -2.20 0.92
10 3 3 -1.73 0.45
11 3 3 -- -- 12 4 3 -1.50 0.27
13 4 3 -1.37 0.32
14 5 3 -2.00 0.71* 15 5 3 -1.82 1.00*
16 5 3 -3.21 1.28*
outcome: 1 logOR for BASDAI50, 2 difference between treatment and placebo on change in BASDAI from baseline, 3
difference between treatment and placebo on change in BASFI from baseline
* No standard deviation was reported in the original studies, the highest standard deviation from the other trials was used as
a conservative estimate.
treat = treatment: 1 =ADA, 2=CER, 3=ETA, 4=GOL, 5=INF; BASDAI: results from individual studies on difference
between treatment and placebo in change from baseline in BASDAI scores; BASFI: results from individual studies on
difference between treatment and placebo in change from baseline in BASFI scores se: standard error associated with each
outcome
Description of synthesis methods for modelling approach A
Consider we have available information on J trials comparing an individual treatment, k (out of the
total number of treatments T) to placebo. Trials report one or more outcomes, o. Information on
outcome o for treatment k in a study j is represented by 𝑦𝑗𝑘𝑜 and is used alongside the standard error
for this measure, sejko2 . In common with the approach implemented in Section 4, all outcomes are here
assumed normally distributed, with mean θjko. We implemented alternative models that differ in the
way treatment effects are considered; a summary of each is presented below. Note that at this stage
each outcome was synthesised independently.

Technology Assessment Report for NICE
TNF-alpha inhibitors for ankylosing spondylitis and nr-axSpA
15/12/2014 292
Model A1 (treatments: independent, studies: FE) – This model considers the j treatments to be
independent, i.e. assumes the effects to differ between treatments, d[k, o]. This is a fixed effect model
in that multiple studies evaluating the same treatment are considered to measure the same treatment
effect.
The model used was:
Likelihood: yjko~ dnorm(θjko, sejko2 )
Model: θjko = d[k, o]
Priors: d[k, o]~N(0,0.001)
Model A2 (treatments: independent, studies: RE) – This model differs from A1 in that a random
effect is assumed to describe the findings of multiple studies evaluating the same treatment.
The model used was:
Likelihood: yjko~ dnorm(θjko, 𝑠𝑒𝑗𝑘𝑜2 )
Model: θjko~N(d[k, o], σ𝑜2)
Priors: d[𝑘, o]~N(0,0.001); σ𝑜2~𝑑𝑢𝑛𝑖𝑓(0,10)
The random effect is defined using a variance parameter for each outcome but common across
treatments, σ𝑜2.
Model A3 (treatments: equal, studies: FE) – This model differs from A1 in that treatments are not
assumed to differ. The model thus evaluates a common relative effectiveness for all anti-TNFs, d[o],
for each outcome.
The model used was:
Likelihood: yjko~ dnorm(θjko, 𝑠𝑒𝑗𝑘𝑜2 )
Model: θjko = d[o]
Priors: d[k, o]~N(0,0.001)

Technology Assessment Report for NICE
TNF-alpha inhibitors for ankylosing spondylitis and nr-axSpA
15/12/2014 293
Model A4 (treatments: equal, studies: RE) – This model differs from A3 in that a random effect is
assumed to describe the findings of multiple studies evaluating the same treatment.
The model used was:
Likelihood: yjko~ dnorm(θjko, 𝑠𝑒𝑗𝑘𝑜2 )
Model: θjko~N(d[o], σ𝑜2)
Priors: d[𝑜]~N(0,0.001); σ𝑜2~𝑑𝑢𝑛𝑖𝑓(0,10)
Model A5 (treatments: exchangeable, studies: FE) – This model differs from A1 in that a random
effect is used to describe any differences between treatments (exchangeability is assumed). This
model thus assumes the treatments to have a similar, but not equal, effectiveness – there are
differences between the effectiveness of treatments that we may not be able to explain but that we
should consider.
The model used was:
Likelihood: yjko~ dnorm(θjko, 𝑠𝑒𝑗𝑘𝑜2 )
Model: θjko = d[k, o]
d[k, o]~N(D[o], γ𝑜2)
Priors: D[o]~N(0,0.001); γ12~𝑑𝑢𝑛𝑖𝑓(0,2); γ2
2, γ32~𝑑𝑢𝑛𝑖𝑓(0,10)
The parameter γ𝑜2 is the variance parameter defining the random effect across treatment. The priors
differ for outcome 1 as this is a log odds while outcomes 2 and 3 are assumed continuous measures.
Within this modelling approach we explored potential heterogeneity in treatment effects using meta-
regression (i.e. potential treatment effect modifiers). We did so by extended the modelling approach in
A1 to include treatment effect interactions with baseline characteristics (centered on their means
where relevant). We have explored the inclusion of alternative covariates by evaluating the DIC
associated with alternative models.
Results of modelling approach A

Technology Assessment Report for NICE
TNF-alpha inhibitors for ankylosing spondylitis and nr-axSpA
15/12/2014 294
The results of each modelling approach are shown in below.
Table 144: Modelling approach A – results
A1. A2. A3. A4. A5.
Treat: indep
Studies: FE
Treat: indep
Studies: RE
Treat:
common
Studies: FE
Treat:
common
Studies: RE
Treat:
exchang
Studies: FE (median, SD) (median, SD) (median, SD) (median, SD) (median, SD)
Outcome 1: OR on
BASDAI50
Adalimumab 4.71 (1.00) 4.69 (6.11)
5.21 (0.72) 5.30 (0.98) 5.34 (9.79)*
Certolizumab 6.02 (3.33) 6.04 (22.87)
Etanercept 4.73 (1.43) 4.72 (3.32)
Golimumab 5.86 (1.81) 6.10 (7.45)
Infliximab 11.9 (11.94) 12.10 (44.00)
σ1 -- 0.31 (0.30) -- 0.15 (0.14) --
D1 -- -- -- -- 1.69 (0.23)
𝛾1 -- -- -- -- 0.27 (0.28)
Outcome 2: change in
BASDAI
(mean, SD) (mean, SD) (mean, SD) (mean, SD) (mean, SD)
Adalimumab -1.56 (0.16) -1.57 (0.27)
-1.66 (0.11) -1.67 (0.15)
Certolizumab -1.45 (0.37) -1.46 (0.51)
Etanercept -1.76 (0.20) -1.73 (0.28) -1.70 (0.87)*
Golimumab NA NA
Infliximab -2.28 (0.46) -2.27 (-2.28)
σ2 -- 0.25 (0.24) -- 0.25 (0.19) --
D2 -- -- -- -- -1.63 (0.57)
𝛾2 -- -- -- -- 0.43 (0.63)
Outcome 3: change in BASFI (mean, SD) (mean, SD) (mean, SD) (mean, SD) (mean, SD)
Adalimumab -1.22 (0.18) -1.18 (0.29)
-1.38 (0.11) -1.39 (0.13)
Certolizumab -1.10 (0.37) -1.11 (0.47)
Etanercept -1.48 (0.19) -1.50 (0.24) -1.41 (0.49)*
Golimumab -1.45 (0.20) -1.44 (0.29)
Infliximab -2.16 (0.53) -2.17 (0.56)
σ3 -- 0.22 (0.19) -- 0.14 (0.12) --
D3 -- -- -- -- -1.40 (0.22)
𝛾3 -- -- -- -- 0.28 (0.33)
DIC 52.4 57.0 39.1 44.3 43.6
outcome: 1 logOR for BASDAI50, 2 difference between treatment and placebo on change in BASDAI from baseline, 3
difference between treatment and placebo on change in BASFI from baseline; 𝛔𝐨 is the variance parameter for outcome o of
the random effect across studies; Do is the mean of the random effect for outcome o; 𝜸𝒐 is the variance parameter for
outcome o of the random effect across treatments.
* predictive distribution
From model A5, drug specific estimates can be retrieved (Table 145). Within this model drug specific
inferences will borrow strength from the common class effect and estimates are thus shrunken
towards the mean of this class effect (that is, estimates are closer to the value reported for the class in
Table 144).
Table 145: Shrunken estimates of treatment effect from model A5.

Technology Assessment Report for NICE
TNF-alpha inhibitors for ankylosing spondylitis and nr-axSpA
15/12/2014 295
Model A5
Shrunken estimates of
treatment effect for model A5
Outcome 1:
OR on
BASDAI50
Outcome 2:
change in
BASDAI
Outcome 3:
change in
BASFI (median, SD) (mean, SD) (mean, SD)
Adalimumab 5.05 (0.87) -1.60 (0.15) -1.31 (0.16)
Certolizumab 5.42 (1.71) -1.59 (0.26) -1.31 (0.23)
Etanercept 5.13 (1.08) -1.72 (0.17) -1.43 (0.15)
Golimumab 5.47 (1.25) -1.69 (0.84) -1.42 (0.16)
Infliximab 5.70 (3.30) -1.88 (0.34) -1.55 (0.33)
Explorations of heterogeneity suggested only gender to potentially modify the effect of anti-TNF
treatment, specifically for change in BASDAI as outcome; however, when gender is used together
with all covariates, such evidence on effect modification disappears (results not shown but available
on request).
11.9.2 Modelling approach B
In the previous section the two outcomes based on BASDAI scores were synthesised separately;
however, BASDAI50 is the probability of having a reduction in BASDAI score of 50%, and thus it
should be possible to relate the proportion of BASDAI50 responders to the change in absolute
BASDAI scores from baseline observed in each study. Within this section, we use this structural
relation within the synthesis, allowing change scores from baseline to be informed not only from
direct data on this quantity but also from data on BASDAI50.
Brief description of the data
The model implemented here pools the change in BASDAI score from baseline to evaluate the
difference between treatment and placebo, using evidence reported in trials directly on the change
scores for each arm and also data on BASDAI50. The data modelled within this approach are shown
in Table 146.
Table 146. Data used in modelling approach B and C
s[] t[] n[] r[] b[] sd[] y[] y.se[] y.f[] y.f.se[]
1 1 20 NA 6.2 1.1 -2 0.560 -1 0.34
1 2 26 NA 5.9 1.4 -3.6 0.377 -1.9 0.29
2 1 115 19 6.2 1.4 -1.4 0.177 -0.47 0.15 2 2 229 114 6 1.4 -2.8 0.126 -1.75 0.13
3 1 44 NA 6.5 1.6 NA NA NA NA
3 2 38 NA 6.2 1.7 NA NA NA NA 4 1 107 17 6.3 1.7 -0.8 0.2 NA NA
4 2 208 94 6.3 1.7 -2.6 0.2 NA NA
5 1 57 8 6.4 1.9 -1.0 0.3 -0.6 0.30 5 3 121 50 6.36 1.54 -2.45 0.206 -1.7 0.21
6 1 20 1 5.46 1.74 -0.1 0.632 0.21 0.71
6 4 20 7 6.05 1.71 -1.97 0.645 -1.35 0.56 7 1 139 NA 5.96 1.65 -0.45 0.18 -0.33 0.21
7 4 138 NA 5.81 1.76 -2.36 0.19 -1.67 0.20
8 1 43 10 5.8 1.5 -1.4 0.305 -1 0.27 8 4 39 18 6.4 1.2 -2.6 0.320 -2.2 0.29
9 1 20 NA NA NA NA NA -0.1 0.49

Technology Assessment Report for NICE
TNF-alpha inhibitors for ankylosing spondylitis and nr-axSpA
15/12/2014 296
9 4 20 NA NA NA NA NA -2.3 0.36
10 1 39 NA 5.86 2.05 -0.85 0.35 -0.33 0.31 10 4 45 NA 6.1 1.87 -2.72 0.34 -2.06 0.33
11 1 51 10 6.11 1.37 NA NA NA NA
11 4 305 180 6.09 1.69 NA NA NA NA 12 1 78 12 6.6 1.49 NA NA 0.1 0.19
12 5 138 61 6.6 1.49 NA NA -1.4 0.19
13 1 105 5 6.5 1.54 NA NA 0.11 0.20 13 5 108 37 6.6 1.31 NA NA -1.26 0.25
14 1 35 3 6.3 1.4 -0.6 0.478 -0.1 0.55
14 6 34 18 6.5 1.2 -3.2 0.495 -2.1 0.44 15 1 14 NA 6.57 2.05 -1.38 0.564 0.1 0.88
15 6 28 NA 6.45 1.87 -3.11 0.42 -1.72 0.49
16 1 12 NA 5.27 2.05 -0.26 0.816 1.3 0.95 16 6 9 NA 5.89 1.87 -3.23 0.961 -1.91 0.86
outcome: 1 logOR for BASDAI50, 2 difference between treatment and placebo on change in BASDAI from baseline, 3
difference between treatment and placebo on change in BASFI from baseline
s[] = study, t[] = treatment: 1=PLA, 2 =ADA, 3=CER, 4=ETA, 5=GOL, 6=INF; n[] = total number of patients, r[] = number
of patients showing a BASDAI50 response, y[]: vector of results from studies on change from baseline on BASDAI score;
y.se[]: standard error associated with each y ; y.f[]: vector of results from studies on change from baseline on BASFI score;
y.f.se[]: standard error associated with each y.f
Description of synthesis methods
Consider we have available information on J trials comparing an individual treatment, k (out of the
total number of treatments T) to placebo. Study j may report yjk, the mean change in BASDAI from
baseline, alongside the standard error for this measure, sejk. The likelihood for the data on change
score was assumed normally distributed and was expressed as:
yjk~N(θjk, sejk2 )
The mean of this distribution was the treatment effects, θjk, defined as the sum of the change score for
the placebo arm plus the difference in change score for the treatments:
θjk = μj + δjk.
Some studies also reported the number of responders to BASDAI 50 (a 50% reduction in BASDAI
score), rjk , out of the total number of individuals in the study, njk. The likelihood for the BASDAI50
data was binomially distributed and thus expressed as:
rjk~Bin(pjk, njk)
Consider the BASDAI score at baseline for study j and treatment k, Xjk, as normally distributed, with
a mean score at baseline of νjk and variability on BASDAI score at baseline represented by σjk2 :
Xjk~N(νjk, σjk2 ),

Technology Assessment Report for NICE
TNF-alpha inhibitors for ankylosing spondylitis and nr-axSpA
15/12/2014 297
The probability parameter of the binomial distribution can be expressed as a function of the baseline
and final BASDAI scores:
pjk = P [Yjk
Xjk< −0.5] = P[Yjk + Xjk/2 < 0]
This can help us establish an algebraic relation between pjk and the change score Yjk, for a given
baseline value, Xjk. This requires some assumptions over the distribution of scores, which are
described next.
Across individuals, the BASDAI scores at baseline and the change score are assumed correlated, and
are described using a bivariate normal distribution:
(𝑋1𝑗𝑘𝑌𝑗𝑘
)~𝑁((𝜈1𝑗𝑘θjk) , (
𝜎𝑗𝑘2 𝜌𝜎𝑗𝑘
2
𝜌𝜎𝑗𝑘2 𝜎𝑗𝑘
2 ))
For simplicity, the variability on BASDAI score at baseline, 𝜎𝑗𝑘2 , was assumed equal to that of the
change score. The correlation parameter is represented by ρ.
We would like to further explore the following relationship:
pjk = P[Yjk + Xjk/2 < 0]
To do so, first consider expressing Y by conditioning on the baseline value, Xjk = x (for simplicity we
will drop the jk subscript in the next few formulas):
Y|X ~N(θ + ρ(x − ν), (1 − ρ2)σ2)
So, we can standardize and relate this probability to a standard Normal distribution
p|X1=x = P(Yjk + x/2 < 0|X1=x) = Φ(−(x2 + θ + ρ(x − ν))
σ√(1 − ρ2))
To obtain the joint distribution, one needs to average over Xjk~N(νjk, σjk2 ), which means integrating
over this distribution with respect to x:
pjk = ∫ Φ(−(x2 + θ + ρ(x − ν))
σ√(1 − ρ2))𝑓𝑋(𝑥)𝑑𝑥
+∞
−∞

Technology Assessment Report for NICE
TNF-alpha inhibitors for ankylosing spondylitis and nr-axSpA
15/12/2014 298
Note that one can express the expectation over the cdf of a normal distribution as:
E[Φ(aX + b)] = Φ(b+aν
√1−a2σ2) when x~N(υ, σ2)
Here, a =−(1/2+ρ)
σ√(1−ρ2) and b =
−θ+ρν
σ√(1−ρ2). Therefore:
pjk = Φ
(
−θ+ ρν − (1/2 + ρ)ν
σ√(1 − ρ2)√1 −(1/2 − ρ)2
(1 − ρ2))
= Φ(−θ + ν/2
σ√5/4 + ρ)
The relations established above thus allow the probability parameter from BASDAI50 data to be
expressed algebraically as a function of the change score:
probit(pjk) =−θjk − νjk/2
σjk√5/4 + ρ
In computations, we used the mean score at baseline, νjk,, and the associated standard deviation, σjk,
as reported in the data (these were thus assumed known). The correlation between baseline and
change score was estimated within the model by assuming this quantity to be independent of study but
assumed to differ between placebo and anti-TNF treatments.
In what concerns the treatment effects, all trials in our evidence base compare against conventional
care: δjk = 𝑑𝑘 .Our preferred approach to model these was to assume a common class effect (i.e.
exchangeable effects across treatments, analogous assumption to model A5 above). This means:
𝑑𝑘 {
= 0 𝑖𝑓 𝑘 = 1
~𝑁(𝐷, 𝜎𝑟𝑒2 ) 𝑖𝑓 𝑘 ≠ 1
where k=1 is standard care.
The priors used to implement this model were:
D~N(0,0.001), μj~N(0,0.001), ρ𝑝𝑙𝑎~U(−1,1), ρ𝑎𝑛𝑡𝑖−𝑇𝑁𝐹~U(−1,1)
WinBUGS code for modelling approach B
model{

Technology Assessment Report for NICE
TNF-alpha inhibitors for ankylosing spondylitis and nr-axSpA
15/12/2014 299
for (i in 1:10) {
y[i] ~ dnorm(theta[i], y.prec[i]) #change in score
theta[i] <- mu[s[i]] + d[t[i]]
}
for (i in 11:18) {
r[i] ~ dbin(p[i], n[i])
aux[i] <- equals(t[i],1)+1
probit(p[i]) <- -(b[i]*0.5 + theta[i])/(pow(prec[i],-0.5)*pow(5/4+rho[aux[i]],0.5))
theta[i] <- mu[s[i]] + d[t[i]]
}
for (i in 19:28) {
r[i] ~ dbin(p[i], n[i])
y[i] ~ dnorm(theta[i], prec[i]) #change in score
aux[i] <- equals(t[i],1)+1
probit(p[i]) <- -(b[i]*0.5 + theta[i])/(pow(prec[i],-0.5)*pow(5/4+rho[aux[i]],0.5))
theta[i] <- mu[s[i]] + d[t[i]]
}
for (j in 1:14) {
mu[j] ~ dnorm(0,0.001)
}
d[1] <- 0
for (k in 2:6) {
d[k] ~ dnorm(re,intau)
}
re ~ dnorm(0, 0.01)
intau <- 1/tau
tau <- pow(sd,2)
sd ~ dunif(0,2)
re.pred ~ dnorm(re,intau)
rho[1] ~ dunif(-1,1)
rho[2] ~ dunif(-1,1)
}
Results of modelling approach B
The summary results regarding relative treatment effects from this modelling approach are reported in
Table 147 for model B.
Table 147: Modelling approach B: results
estimated assumed* Predicted
Difference in Probability of Probability of OR for

Technology Assessment Report for NICE
TNF-alpha inhibitors for ankylosing spondylitis and nr-axSpA
15/12/2014 300
change score
from baseline
having a
BASDAI50
response, placebo
having a
BASDAI50
response, anti-
TNF
BASDAI50
response, anti-
TNF vs. placebo
(mean, SD) (mean, SD) (mean, SD) (median, SD)
Anti-TNFs -1.91 (0.48)** 0.10 (--) 0.40 (0.08) 5.94 (4.06)
Other model summaries
D -1.91 (0.28) -- -- --
𝛾 0.30 (0.28) -- -- --
𝜌𝑝𝑙𝑎𝑐𝑒𝑏𝑜 0.26 (0.33) -- -- --
𝜌𝑎𝑛𝑡𝑖−𝑇𝑁𝐹 0.69 (0.26) -- -- --
DIC 146.3 -- -- --
* This figure is based on a BASDAI baseline score of 6.11 (sd=1.56) and a placebo change score of -0.61 (sd=1.44), which
represent the average across trials (weighted by number of patients), ** predictive distribution
Drug specific (shrunken) estimates from model B are shown in Table 148.
Table 148: Shrunken estimates of treatment effect from model B.
Shrunken estimates of
treatment effect for model B
change in
BASDAI (mean, SD)
Adalimumab -1.77 (0.25)
Certolizumab -2.01 (0.37)
Etanercept -1.88 (0.18)
Golimumab -1.92 (0.30)
Infliximab -2.02 (0.32)
11.9.3 Modelling approach C
The models implemented here extend those in the previous section by adding the syntheses of changes
in BASFI score. The data used is presented in Table 146.
Description of synthesis methods
Data on mean change in BASFI score reported in some of the studies available have been described as
normally distributed (the likelihood):
yjkBASFI~N(θjk
BASFI, (sejkBASFI)
2)
The treatment effects over BASFI θjkBASFI were then defined as:
θjkBASFI = μj
BASFI + δjkBASFI
Treatment effects on BASFI were assumed correlated to those on BASDAI across trials:

Technology Assessment Report for NICE
TNF-alpha inhibitors for ankylosing spondylitis and nr-axSpA
15/12/2014 301
(δjk
BASDAI
δjkBASFI
)~N((dk
BASDAI
dkBASFI
) , (τBASDAI2 ρmτBASDAI
2 τBASFI2
ρmτBASDAI2 τBASFI
2 τBASFI2 ))
𝑑𝑘𝑜 {
= 0 𝑖𝑓 𝑘 = 1
~𝑁(𝐷𝑜, 𝜎𝑟𝑒,𝑜2 ) 𝑖𝑓 𝑘 ≠ 1
, with o={BASDAI, BASFI} and k=1 is placebo.
The additional priors used to implement this model were:
D𝑜~N(0,0.001), 𝜎𝑟𝑒2 ~𝑈(0,2) ρ𝑚~U(−1,1)
The variation in treatment effects for both BASDAI and BASFI and the correlation parameter
between these were estimated from the data. As in model B, we assumed exchangeability across the
effects of the different treatments.
WinBUGS code for modelling approach C
model{
for (i in 1:10) {
y[i] ~ dnorm(theta[i,1], y.prec[i]) #change in score
y.f[i] ~ dnorm(theta[i,2], y.prec.f[i]) #change in score BASFI
}
for (i in 11:14) {
r[i] ~ dbin(p[i], n[i])
aux[i] <- equals(t[i],1)+1
probit(p[i]) <- -(b[i]*0.5 + theta[i,1])/(pow(prec[i],-0.5)*pow(5/4+rho[aux[i]],0.5))
y.f[i] ~ dnorm(theta[i,2], y.prec.f[i]) #change in score BASFI
}
for (i in 15:16) {
r[i] ~ dbin(p[i], n[i])
aux[i] <- equals(t[i],1)+1
probit(p[i]) <- -(b[i]*0.5 + theta[i,1])/(pow(prec[i],-0.5)*pow(5/4+rho[aux[i]],0.5))
}
for (i in 17:26) {
r[i] ~ dbin(p[i], n[i])
y[i] ~ dnorm(theta[i,1], prec[i]) #change in score
aux[i] <- equals(t[i],1)+1
probit(p[i]) <- -(b[i]*0.5 + theta[i,1])/(pow(prec[i],-0.5)*pow(5/4+rho[aux[i]],0.5))
y.f[i] ~ dnorm(theta[i,2], y.prec.f[i]) #change in score BASFI
}
for (i in 27:28) {
y.f[i] ~ dnorm(theta[i,2], y.prec.f[i]) #change in score BASFI
}
for (i in 29:30) {
r[i] ~ dbin(p[i], n[i])
y[i] ~ dnorm(theta[i,1], prec[i]) #change in score
aux[i] <- equals(t[i],1)+1
probit(p[i]) <- -(b[i]*0.5 + theta[i,1])/(pow(prec[i],-0.5)*pow(5/4+rho[aux[i]],0.5))

Technology Assessment Report for NICE
TNF-alpha inhibitors for ankylosing spondylitis and nr-axSpA
15/12/2014 302
}
for (i in 1:30) {
theta[i,1:2] ~ dmnorm(delta[i,1:2],B[1:2,1:2])
delta[i,1] <- mu1[s[i]] + d1[t[i]]
delta[i,2] <- mu2[s[i]] + d2[t[i]]
}
d1[1] <- 0
d2[1] <- 0
for (k in 2:6) {
d1[k] ~ dnorm(re1,intau)
d2[k] ~ dnorm(re2,intau)
}
B[1,1]<- 1/(pow(sd[1],2)*(1-pow(cor,2)))
B[2,2]<- 1/(pow(sd[2],2)*(1-pow(cor,2)))
B[1,2]<- -cor/(sd[1]*sd[2]*(1-pow(cor,2)))
B[2,1]<- B[1,2]
sd[1] ~ dunif(0,5)
sd[2] ~ dunif(0,5)
cor~dunif(0,1)
for (j in 1:15) {
mu1[j] ~ dnorm(0,0.01)I(-5,5)
mu2[j] ~ dnorm(0,0.01)I(-5,5)
}
re1 ~ dnorm(0, 0.01)I(-10,10)
re.pred1 ~ dnorm(re1,intau)
re2 ~ dnorm(0, 0.01)I(-10,10)
re.pred2 ~ dnorm(re2,intau)
intau <- 1/tau
tau <- pow(sd.re,2)
sd.re ~ dunif(0,2)
rho[1] ~ dunif(0,1)
rho[2] ~ dunif(0,1)
for (k in 2:6) {
d1.pred[k] ~ dnorm(re1,intau)
}
}
Results of modelling approach C
The results on differences between treatment and placebo on change score form baseline are reported
in Table 149, both for BASDAI and BASFI scores.
Table 149: Modelling approach C: results
estimated assumed* predicted
Difference in
change score
Probability of
having a
Probability of
having a
OR for
BASDAI50

Technology Assessment Report for NICE
TNF-alpha inhibitors for ankylosing spondylitis and nr-axSpA
15/12/2014 303
from baseline BASDAI50
response, placebo
BASDAI50
response, anti-
TNF
response, anti-
TNF vs. placebo
(mean, SD) (mean, SD) (mean, SD) (median, SD)
Effect of anti-
TNFs on BASDAI -1.95 (0.30) 0.10 (--) 0.41 (0.05) 6.30 (1.56)
Effect of anti-
TNFs on BASFI -1.40 (0.28) -- -- --
Other model summaries -- -- -- 𝐷𝐵𝐴𝑆𝐷𝐴𝐼 -1.99 (0.20) -- -- -- 𝐷𝐵𝐴𝑆𝐹𝐼 -1.40 (0.16)
𝛾𝐵𝐴𝑆𝐷𝐴𝐼 0.13 (0.10) -- -- -- 𝛾𝐵𝐴𝑆𝐷𝐴𝐼 0.11 (0.09) -- -- -- 𝜌𝑝𝑙𝑎𝑐𝑒𝑏𝑜 0.42 (0.26) -- -- -- 𝜌𝑎𝑛𝑡𝑖−𝑇𝑁𝐹 0.71 (0.23) -- -- --
ρ𝑚 0.51 (0.29) -- -- --
𝜎𝑟𝑒 0.16 (0.14) -- -- -- DIC 181.9 -- -- --
* Based on a BASDAI baseline score of 6.11 (sd=1.56) and a placebo change score of -0.61 (sd=1.44), which represent the
average across trials (weighted by number of patients)
Drug specific (shrunken) estimates from model C are shown in Table 14850.
Table 150: Shrunken estimates of treatment effect from model C.
Shrunken estimates of
treatment effect for model C
change in
BASDAI
change in
BASFI (mean, SD) (mean, SD)
Adalimumab -1.89 (0.22) -1.34 (0.17)
Certolizumab -2.02 (0.28) -1.36 (0.21)
Etanercept -1.94 (0.18) -1.43 (0.16)
Golimumab -1.98 (0.25) -1.42 (0.17)
Infliximab -2.03 (0.27) -1.49 (0.25)
11.10 Appendix 10 Synthesis of evidence on the nr-axSpA population
This section analyses the evidence on the effectiveness of anti-TNFs on the nr-axSpA population.
Brief description of the data
On the nr-axSpA population, 5 RCTs were considered directly relevant to the decision problem
(studies 17 to 21 in Table 14651). All studies reported BASFI outcomes and one study did not report
BASDAI 50 (study 21).
Table 151: Evidence on BASDAI and BASFI related outcomes for the nr-axSpA population
Trial name treat N treat N PLA BASDAI50
change
BASDAI change BASFI
17 Haibel 2008 ADA 22 24 x x x 18 ABILITY-1 (2013) ADA 69 73 x x x
19 RAPID-axSpA (2014) CER 46+51 50 x x x

Technology Assessment Report for NICE
TNF-alpha inhibitors for ankylosing spondylitis and nr-axSpA
15/12/2014 304
20 Dougados 2014 ETA50 106 109 x x x
21 Barkham 2009 INF 20 20
x x
The data on these five studies are shown in Table 152.
Table 152. Data on the nr-axSpA population
s[] t[] n[] r[] b[] sd[] y[] y.se[] y.f[] y.f.se[]
1 1 24 5 6.20 0.59 -1.20 7.79 -0.80 6.87
1 2 22 11 6.50 0.69 -2.70 6.30 -2.40 7.24
2 1 73 10 6.38 0.44 -1.10 19.00 -0.63 22.78 2 2 69 27 6.43 0.42 -2.20 11.04 -1.28 16.91
3 1 50 8 6.40 0.44 -1.50 6.25 -0.40 6.25
3 3 97 47 6.55 0.43 -3.35 11.64 -2.30 12.21 4 1 109 26 6.00 0.28 -1.30 11.11 -0.80 25.00
4 4 106 46 6.00 0.31 -2.00 11.11 -1.40 25.00
5 1 20 NA 5.76 0.28 -0.75 3.42 -0.47 3.95 5 5 20 NA 5.85 0.31 -3.41 3.12 -2.70 3.59
s[] = study, t[] = treatment: 1=PLA, 2 =ADA, 3=CER, 4=ETA, 5=INF; n[] = total number of patients, r[] = number of
patients showing a BASDAI50 response, y[]: vector of results from studies on change from baseline on BASDAI score;
y.se[]: standard error associated with each y ; y.f[]: vector of results from studies on change from baseline on BASFI score;
y.f.se[]: standard error associated with each y.f
Description of approaches to the synthesis
To synthesise these data we used the same implementation and software specifications as described in
Appendix 9. Analyses explored two different scenarios to consider these data:
Scenario 1. data from nr-axSpA trials were considered in isolation
Scenario 2. data from AS population were also used, no difference between the populations was
assumed.
All models implemented here jointly synthesise BASDAI and BASFI outcomes (our preferred
modelling approach, C).
Results of the synthesis
Results of the analysis are in
Table 153.

Technology Assessment Report for NICE
TNF-alpha inhibitors for ankylosing spondylitis and nr-axSpA
15/12/2014 305
Table 153: nr population: results
estimated assumed* predicted
Difference in
change score
from baseline
Probability of
having a
BASDAI50
response, placebo
Probability of
having a
BASDAI50
response, anti-
TNF
OR for
BASDAI50
response, anti-
TNF vs. placebo
(mean, SD) (mean, SD) (mean, SD) (median, SD)
Scenario 1. data from nr-axSpA trials
Effect of anti-
TNFs on BASDAI -1.86 (0.79) 0.20 (--) 0.53 (0.13) 4.39 (6.59)
Effect of anti-
TNFs on BASFI -1.30 (0.84) -- -- --
Other model summaries
𝐷𝐵𝐴𝑆𝐷𝐴𝐼 -1.86 (0.53) -- -- --
𝐷𝐵𝐴𝑆𝐹𝐼 -1.30 (0.65) -- -- --
𝛾𝐵𝐴𝑆𝐷𝐴𝐼 0.41 (0.43) -- -- --
𝛾𝐵𝐴𝑆𝐷𝐴𝐼 0.68 (0.53) -- -- --
𝜌𝑝𝑙𝑎𝑐𝑒𝑏𝑜 0.60 (0.27) -- -- --
𝜌𝑎𝑛𝑡𝑖−𝑇𝑁𝐹 0.57 (0.28) -- -- --
ρ𝑚 0.51 (0.29) -- -- --
𝜎𝑟𝑒 0.55 (0.29) -- -- --
DIC 88.6 -- -- --
Scenario 2. data from AS and nr-axSpA trials, no difference between the populations
Effect of anti-
TNFs on BASDAI -1.97 (0.32) 0.20 (--) 0.55 (0.06) 4.94 (1.48)
Effect of anti-
TNFs on BASFI -1.37 (0.3) -- -- --
Other model summaries
𝐷𝐵𝐴𝑆𝐷𝐴𝐼 -1.97 (0.20) -- -- --
𝐷𝐵𝐴𝑆𝐹𝐼 -1.37 (0.18) -- -- --
𝛾𝐵𝐴𝑆𝐷𝐴𝐼 0.12 (0.09) -- -- --
𝛾𝐵𝐴𝑆𝐷𝐴𝐼 0.18 (0.11) -- -- --
𝜌𝑝𝑙𝑎𝑐𝑒𝑏𝑜 0.50 (0.26) -- -- --
𝜌𝑎𝑛𝑡𝑖−𝑇𝑁𝐹 0.74 (0.22) -- -- --
ρ𝑚 0.54 (0.29) -- -- --
𝜎𝑟𝑒 0.19 (0.16) -- -- --
DIC 269.0 -- -- --
* Based on a BASDAI baseline score of ************** and a placebo change score of **************** which
represent the results seen in the certolizumab trial (RAPID-axSpA)
11.11 Appendix 11 BASDAI and BASFI scores conditional on BASDAI response
In this section we use the results from the extended synthesis model (Appendices 9 and 10) to
evaluate the conditional scores by simulating BASDAI and BASFI scores for two equivalent cohorts
of patients one treated with an anti-TNF and the other with conventional therapy.
Description of methods

Technology Assessment Report for NICE
TNF-alpha inhibitors for ankylosing spondylitis and nr-axSpA
15/12/2014 306
From the inferences obtained using the synthesis model above it is possible to derive the conditional
change score in responders and non-responders using simulation. Whereas the synthesis focusses on
the pooling of mean estimates of change scores and proportion of responders to BASDAI50, to derive
conditional mean scores there is the need to consider the distributions at the individual patient level.
Hence, conditional scores could not directly be derived from the synthesis, but through a simulation
procedure based on the assumptions and results of the synthesis model.
The steps undertaken within the simulation procedure were:
(1st) Simulate baseline BASDAI scores, xBASDAI∗ , from beliefs over its distribution, X~N(ν, σ)
(2nd) Simulate 𝑦𝑘=1∗ from beliefs over the mean (𝜇) of this quantity considering correlation with
x𝐵𝐴𝑆𝐷𝐴𝐼∗
𝑌𝑘=1|X=𝑥~𝑁(𝜇 + 𝜌(x − υ), (1 − 𝜌𝑝𝑙𝑎2)𝜎2)
(3rd) Simulate yk=2∗ (where k=2 represents treatment with anti-TNF) by considering
𝑌𝑘≠1|X=𝑥~𝑁(𝜇 + 𝑑 + 𝜌(x − υ), (1 − 𝜌𝑎𝑛𝑡𝑖−𝑇𝑁𝐹2)𝜎2)
(4th) Calculate final score for placebo and treatment separately, by summing x𝑓𝑖𝑛𝑎𝑙𝐵𝐴𝑆𝐷𝐴𝐼∗ =
ykBASDAI∗ + xBASDAI∗
(5th) Compute response variables for both groups as ykBASDAI∗ + x∗/2 < 0
Repeat steps 1 to 4 until the desired sample size is achieved, and calculate conditional scores based on
response variable and change in scores.
To evaluate BASFI conditional on BASDAI scores one needs to firstly consider we have available
information on the BASFI scores at baseline: XBASFI~N(νBASFI, (seBASFI)2), and also on correlation
with BASDAI scores, φ (at individual level). By considering 𝑥𝐵𝐴𝑆𝐷𝐴𝐼∗, one can:
(6th) Simulate from the distribution of the baseline BASFI score conditional on the baseline
BASDAI score being x∗:
xBASFI
|XBASDAI=x~N(νBASFI +
σBASFI
σBASDAIφ(xBASDAI∗ − νBASDAI), (1 − φ2)σBASFI
2 )
Note the correlation parameter φ, which represents the individual level correlation between
baseline BASFI and BASDAI scores.
(7th) Simulate the change from baseline on BASFI for placebo y𝑘=1BASFI* from belief over this
quantity, consider this to be correlated with the y𝑘=1∗ simulated for BASDAI (use correlation
parameter estimated within the synthesis)
𝑦𝑘=1BASFI
|𝑦𝑘=1𝐵𝐴𝑆𝐷𝐴𝐼=𝜇∗
~𝑁(𝜇BASFI +𝜎𝐵𝐴𝑆𝐹𝐼
𝜎𝐵𝐴𝑆𝐷𝐴𝐼ρ𝑚(𝜇
𝐵𝐴𝑆𝐷𝐴𝐼∗ − 𝜇𝐵𝐴𝑆𝐷𝐴𝐼), (1 − ρ𝑚2)𝜎𝐵𝐴𝑆𝐹𝐼
2 )

Technology Assessment Report for NICE
TNF-alpha inhibitors for ankylosing spondylitis and nr-axSpA
15/12/2014 307
(8th) Simulate the change from baseline for anti-TNF treatment
𝜃BASFI
|𝑦𝐵𝐴𝑆𝐷𝐴𝐼=𝜇∗~𝑁(𝜇BASFI + d +
𝜎𝐵𝐴𝑆𝐹𝐼
𝜎𝐵𝐴𝑆𝐷𝐴𝐼ρ𝑚(𝑥𝑓𝑖𝑛𝑎𝑙
𝐵𝐴𝑆𝐷𝐴𝐼∗ −𝑚𝑒𝑎𝑛. 𝑥𝑓𝑖𝑛𝑎𝑙𝐵𝐴𝑆𝐷𝐴𝐼∗), (1 − ρ𝑚
2)𝜎𝐵𝐴𝑆𝐹𝐼2 )
Note that d represents the mean of the predictive distribution from the synthesis model.
We used a simulation sample size of 10,000 patients. Given results depend on the baseline
distributions of BASDAI and BASFI and on the change scores from baseline for placebo, we used the
averages across trials (weighted by the number of patients in each trial) in AS. Baseline BASDAI
scores were thus assumed normally distributed with mean 6.11 and standard deviation of 1.56; change
from baseline for placebo was simulated from a normal distribution with mean -0.61 and standard
deviation of 1.44. For BASFI, the baseline was assumed to have a mean of 5.27 and a standard
deviation of 1.79 and change from baseline for placebo a mean of -0.19 and a standard deviation of
0.22. The correlation between baseline BASFI and BASDAI scores was valued at 0.7 (𝜑). Average
scores from the RAPID-axSpa trial for certolizumab were used for the nr-axSpA analysis.
Results
Results of the prediction of conditional scores using the synthesis model in the AS population are
presented in Table 154 and for the nr-axSpA population in Table 155.
Table 154: Conditional scores predicted for the AS population using the synthesis model
BASDAI BASFI
control Treat control treat
Scenario 1
% responders to BASDAI50 0.10 0.42
Change in score
Responders -2.70 -3.86 -1.41 -3.02
Non-responders -0.45 -1.73 -0.17 -0.63
All -0.66 -2.63 -0.29 -1.64
Baseline
Responders 3.83 4.76 3.42 4.17
Non-responders 6.31 7.03 5.43 6.02
All 6.08 6.08 5.24 5.24
Table 155: Conditional scores predicted for the nr-axSpA population using results and assumptions of the
synthesis model
BASDAI BASFI
control Treat control treat
Scenario 1
% responders to BASDAI50 **** ****
Change in score * *
Responders ***** ***** ***** *****
Non-responders ***** ***** ***** ****
All ***** ***** ***** *****

Technology Assessment Report for NICE
TNF-alpha inhibitors for ankylosing spondylitis and nr-axSpA
15/12/2014 308
Baseline * *
Responders **** **** **** ****
Non-responders **** **** **** ****
All **** **** **** ****
Scenario 2
% responders to BASDAI50 **** ****
Change in score * *
Responders ***** ***** ***** *****
Non-responders ***** ***** ***** ****
All ***** ***** ***** *****
Baseline * *
Responders **** **** **** ****
Non-responders **** **** **** ****
All **** **** **** ****
* Based on a BASDAI baseline score *****************, a placebo change in BASDAI score of **************** a
BASFI baseline score of ************ and a placebo change in BASFI score of *************** which represent the
results seen in the certolizumab trial (RAPID-axSpA) .

Technology Assessment Report for NICE
TNF-alpha inhibitors for ankylosing spondylitis and nr-axSpA
15/12/2014 309
11.12 Appendix 12: Quality assessment of studies included in the cost effectiveness review*
Checklist used - Drummond M et al. Methods for the economic evaluation of health care programmes. 3rd ed. Oxford. Oxford University Press. 2005)228
Ara
2007152
Botteman 2007153 Kobelt
2007151
McLeod
200734
Armstrong 2013154
1. Was a well-defined question posed in answerable form? Yes Yes Yes Yes Yes
2. Was a comprehensive description of the competing alternatives given (i.e. can
you tell who did what to whom, where, and how often)?
Yes Yes No Yes Yes
3. Was the effectiveness of the programme or services established? Yes (short-
medium term)
Yes (short-medium
term)
Yes (short term) Yes (short-
medium term)
Yes (short-medium
term)
4. Were all the important and relevant costs and consequences for each alternative
identified?
No Yes Yes Yes Yes (consequences)
Cannot tell (costs)
5. Were costs and consequences measured accurately in appropriate physical units
(e.g. hours of nursing time, number of physician visits, lost work-days, gained life
years)?
Cannot tell Cannot tell Cannot tell Yes Cannot tell
6. Were the cost and consequences valued credibly? Cannot tell Cannot tell Cannot tell Yes Cannot tell
7. Were costs and consequences adjusted for differential timing? Yes Yes Yes Yes Cannot tell
8. Was an incremental analysis of costs and consequences of alternatives
performed?
Yes Yes Yes Yes Yes
9. Was allowance made for uncertainty in the estimates of costs and consequences? Yes Yes Yes Yes Yes
10. Did the presentation and discussion of study results include all issues of
concern to users?
No No No Yes No
* = only stated publications were quality assessed and further materials (for example, Assessment Group reports from the NICE website) were not consulted

Technology Assessment Report for NICE
TNF-alpha inhibitors for ankylosing spondylitis and nr-axSpA
15/12/2014 310
11.13 Appendix 13 Utility review
In accordance with the NICE reference case, utility values should be based on the EuroQoL – EQ5D
instrument. Therefore a systematic review of utility studies was carried out to identify relevant
studies which (i) directly estimate EQ-5D utility values; and (ii) establish the relationship between
generic measures of utility (in particular, the EQ-5D) and measures of disease progression (including
mapping studies). The review of utility studies focusses on anti-TNFs for ankylosing spondylitis (AS)
and axial spondyloarthritis without radiographic evidence of ankylosing spondylitis (nr-axSpA).
Methods
Searches were undertaken in EMBASE and Ovid MEDLINE/Ovid MEDLINE(R) In-Process & Other
Non-Indexed Citations. A combination of disease terms and terms associated with the EQ-5D were
used. Upon initial review, it was evident that the results of the search did not identify the studies
found in the cost effectiveness review that also reported on the quality of life of AS patients (for
example, Ara et al (2007)152
). Therefore, a separate search in NHSEED, Medline and EMBASE for
published modelling studies was also subsequently undertaken. No language and date limits were
applied. Full details of the search strategy used are presented in Appendix 1.
Studies that reported utility values consistent with the NICE reference case were included in the
review. That is, studies reporting utilities for AS or nr-AxSpa patients generated using:
the EQ-5D
HRQoL or changes in HRQoL measured directly by patients
Changes in HRQoL should be valued using public preferences from a representative
sample of the UK population using a choice-based method (or this could be
reasonably assumed from the publication).
Where a mapping algorithm was reported, eligibility of studies was restricted to those that mapped
from BASDAI and/or BASFI to EQ-5D.
Results
Identified studies
The combined search retrieved 210 citations. After screening titles and abstracts, 28 citations were
retrieved for full review. The abstract by Pumford et al (2011)229
was excluded as the full publication
by Wade et al (2011)230
reported on the same study. The abstract by Lee et al (2011)231
was excluded
as a more recent full publication of the study (Lee et al [2014]232
) reported that a non-UK valuation set
was used. Joore et al (2010)233
was also excluded as primary data were reported in van Tubergen et al

Technology Assessment Report for NICE
TNF-alpha inhibitors for ankylosing spondylitis and nr-axSpA
15/12/2014 311
(2002)234
. A further 3 studies were excluded due to the manuscripts being in a language other than
English.
Kobelt and colleagues have reported costs/quality-of-life/cost effectiveness of AS patients in multiple
references (for example; Kobelt et al (2004)143
, Kobelt et al (2006)235
, Kobelt et al (2007)151
and
Kobelt et al (2008)236
). Kobelt et al (2004) and (2007) are relevant to a UK population and are
preferred to the other Kobelt publications that are relevant to non-UK populations. Of these, Kobelt et
al (2004) reports utility data collected and used in the analysis and is, therefore, included in this
review.
In total, 12 studies were deemed to meet the NICE reference case and are summarised in Table 156.
The main reasons for excluding studies at the title/abstract and at full review stage were; 1) utilities
were not reported [for example, Haywood et al (2010)237
], 2) valuation set not reported or a non-UK
valuation was used [for example, Kvamme et al (2010)238
], 3) utilities were reported for a mixed
population with different inflammatory arthropies or in a population not relevant to the decision
problem [for example, Osnes-Ringen et al (2011)239
].
Studies meeting the NICE reference case
The 12 studies meeting the reference case have been summarised in Table 156. The table includes a
primary study to Boonen et al (2007)240
, reported in Boonen et al (2002/2003)241, 242
. The study by
Boonen et al (2007) has been retained as it reports utility values for patients with a BASDAI ≥4.
AS population
All studies included in Table 156 are of AS patients. Five studies reported utility values (or mapping
algorithms) generated from data specifically collected from the UK population (Haywood et al
(2002)243
, Healey et al (2013)16
, Kobelt et al (2004)143
, McLeod et al (2007)34
, Wade et al (2011)230
).
Four studies included interventions specific to this appraisal, all of these studies were of etanercept
(Ara et al (2007)152
, Boonen et al (2008)194
, Braun et al (2007)83
, Wade et al (2011)230
). Utility values
reported ranged from values at baseline to 10 years follow-up.
NR population
Two citations were identified in the review that reported utilities for nr- axSpa patients (Dougados et
al (2013)77
and Lindstrom et al (2013)244
). However, these studies did not explicitly report which
population valuation sets were used and, therefore, were excluded from the review.
Mapping algorithms

Technology Assessment Report for NICE
TNF-alpha inhibitors for ankylosing spondylitis and nr-axSpA
15/12/2014 312
Of the 12 studies in Table 156, 2 report mapping algorithms between disease specific measures and
the EQ-5D (Ara et al (2007)152
and McLeod et al (2007)34
). Both have been reported as part of a cost-
effectiveness analysis and provide limited information on methodology employed (for example
covariates tested, correlation considerations and goodness of fit). McLeod et al (2007) reports on an
algorithm generated using data from UK AS patients.

12/12/2014 313
Table 156 - Summary of utility studies that meet the NICE reference case
Study Population characteristics Interventions Utility assessment methods Utilities reported
Mean (SD) [95% CI]
Reviewer comments
Ara et al (2007)152
The cost-effectiveness of
etanercept in patients with
severe ankylosing spondylitis in the UK.
(mapping algorithm to EQ-5D values also reported)
AS, diagnosed using mNY
criteria defined by a VAS for
mean morning stiffness ≥30,
and by
at least two of the following:
VAS for patient global assessment of
disease activity ≥30, average
of VAS for nocturnal and total pain ≥30 or BASFI
≥30, patients from 2 etanercept RCTs.
European RCT - 356 patients
randomised to receive
placebo (n=51), etanercept
25mg twice weekly (n=150)
and etanercept 50mg once
weekly (n=155) for 12
weeks. Data from the
etanercept arms were
combined as no significant
differences in outcomes were
found.
Mainly US RCT - 277
patients randomised to
receive placebo (n=139),
etanercept 25mg twice
weekly (n=138) for 24 weeks
plus a 3 year open-label extension.
Age: 41 (European RCT), 42
(US RCT)
Disease duration: 9.3 years
Placebo
Etanercept 25mg twice-
weekly
Etanercept 50mg once-
weekly
EQ-5D
Completed by patients
in 11 European
countries (including the
UK)
UK population
valuation set is assumed
to have been used as this
is a UK study
European RCT data were
used to derive an algorithm
between BASDAI/BASFI
and EQ-5D. Methods were not reported
European RCT week 12
(observed) for patient with a BASDAI ≥4:
Anti-TNF responder:
0.79 (NR)
Anti-TNF non-
responder: 0.48 (NR)
Placebo responder: 0.74
(NR)
Placebo non-responder:
0.46 (NR)
US RCT week 24 (predicted using algorithm):
Anti-TNF responder:
0.80 (NR)
Anti-TNF non-
responder: 0.46 (NR)
Placebo responder: 0.79
(NR)
Placebo non-responder:
0.42 (NR)
Algorithm%
(BASDAI/BASFI are on the 0-100 scale):
Utility = 0.923 (0.0170) -
0.004 (0.0007) x BASFI - 0.004 (0.0008) x BASDAI
R2=0.52
Observed values may be
generalisable to an AS
population who have been
treated with etanercept.
However, it is not clear how
generalisable the outputs are to a UK population.
Responders categorised using
BSR guidelines, i.e. BASDAI50.
Baseline values not reported
Generalisability of the
algorithm is unclear as
methods have not been reported.
UK population valuation set
is assumed to have been
used.

Technology Assessment Report for NICE
TNF-alpha inhibitors for ankylosing spondylitis and nr-axSpA
12/12/2014 314
Study Population characteristics Interventions Utility assessment methods Utilities reported
Mean (SD) [95% CI]
Reviewer comments
(European RCT), 10.3 years (US RCT)
BASDAI: 6.1 (European RCT), 5.9 (US RCT)
BASFI: 5.9 (European RCT),
5.4 (US RCT)
Boonen et al (2002)242 and
(2003)241
2002 – Work status and
productivity costs due to
ankylosing spondylitis:
comparison of three
European countries
2003 - Costs of ankylosing
spondylitis in three European
countries: the patient's perspective
AS patients diagnosed using
mNY criteria.
130 patients from The
Netherlands. Patients
were sampled from the
Dutch standard
diagnosis register of
rheumatic diseases
Age: 46
Disease duration since diagnosis: 12 years
BASDAI: 3.7
BASFI: 3.9
53 patients from France.
Consecutive in- and out-
patients at a hospital
rheumatology
department
Age: 38
Disease duration since
NA EQ-5D
Completed by patients
in Europe (not including
the UK)
It’s assumed that the
UK population
valuation set was used
as the authors reference
Dolan et al (1997)245
and Boonen et al (2003)
say the ‘York
weighting’ was used
Baseline:
Netherlands = 0.69 (0.16)
France = 0.63 (0.29)
Belgium = 0.67 (0.14)
Time averaged across 2 year follow-up period:
Netherlands = 0.68 (0.16)
France = 0.63 (0.23)
Belgium = 0.67 (0.14)
All patients = 0.67 (0.19)
Results may be generalisable
to an AS population,
however, generalisability to a UK population is unknown.
A high proportion of missing
data (84% were missing at
least one bimonthly questionnaire).
UK population valuation set
is assumed to have been used.

Technology Assessment Report for NICE
TNF-alpha inhibitors for ankylosing spondylitis and nr-axSpA
12/12/2014 315
Study Population characteristics Interventions Utility assessment methods Utilities reported
Mean (SD) [95% CI]
Reviewer comments
diagnosis: 9 years
BASDAI: 2.8
BASFI: 2.5
26 patients from
Belgium. Consecutive
outpatients at a hospital
rheumatology
department
Age: 42
Disease duration since diagnosis: 11 years
BASDAI: 3.1
BASFI: 2.6
Boonen et al (2007)240
How do the EQ-5D, SF-6D
and the well-being rating
scale compare in patients
with ankylosing spondylitis?
AS patients diagnosed using
mNY criteria.
134 patients from the
prevalence-based
OASIS cohort (Boonen
et al [2002/2003]241, 242.
120 patients from an
RCT comparing spa
treatment (80) with
usual care (40) (van
Tuburgen et al
[2002]234).
OASIS – NA
(prevalence cohort)
RCT – spa treatment (3
weeks) and usual care
EQ-5D
Completed by patients
in Europe (not including
the UK)
UK population
valuation set used
Outputs from the EQ-5D
rating scale and SF-6D are
also reported in this study but are not summarised here.
Combined datasets (n = 254)
= 0.64 (0.23)
BASDAI <4 (n = 125) = 0.73 (0.16)
BASDAI ≥4 (n=137) = 0.55 (0.26)
BASFI <4 (n = 121) = 0.74 (0.16)
BASFI ≥4 (n = 143) = 0.55 (0.25)
Results may be generalisable
to an AS population,
however, generalisability to a
UK population is unknown.
It is not clear if the utilities
reported are baseline values
(baseline and post
intervention at 4 weeks EQ-
5D results were included in
the RCT).
EQ-5D discriminates more
between lower and higher
BASDAI patients (and lower
and higher BASFI patients)

Technology Assessment Report for NICE
TNF-alpha inhibitors for ankylosing spondylitis and nr-axSpA
12/12/2014 316
Study Population characteristics Interventions Utility assessment methods Utilities reported
Mean (SD) [95% CI]
Reviewer comments
Both datasets were merged as
authors found that QoL
instruments provided similar
results in the two populations.
Age: 48
Disease duration since diagnosis: 13 years
BASDAI: 4.2
BASFI: 4.2
than the SF-6D. The authors
suggests there is a ceiling
effect between EQ-5D values
0.6 – 0.8 (these patients
showed a wide range of
values on the SF-6D and rating scale).
Boonen et al (2008)194
Rapid and sustained
improvement in health-
related quality of life and
utility for 72 weeks in
patients with ankylosing
spondylitis receiving etanercept
257 AS patients, diagnosed
using mNY criteria, who had
completed 24 weeks of
treatment in a previous RCT
(277 patients enrolled)
comparing etanercept with
placebo. Patients were
treated with etanercept in the open-label extension study.
Age: 41
Disease duration: 10.8 years
BASDAI: not reported
BASFI: not reported
Etanercept 25mg twice-
weekly
EQ-5D
Completed by patients
in 28 centres across
Europe and North
America
UK population
valuation set was used
Baseline (n=232):
Previously treated with
etanercept in the RCT
(n=128): 0.69 (0.2)
Previously treated with
placebo in the RCT
(n=129): 0.49 (0.3)
Figure 3(a) shows that
patients who were previously
on etanercept maintained
their baseline utility up to
week 72 (105 patients
completed 72 weeks of
treatment). Patients who
were previously on placebo
achieved a similar utility to
those patients previously on
etanercept by week 12 and
Results may be generalisable
to an AS population,
however, generalisability to a
UK population is unknown.
Negative utility values were
imputed as 0
Patients eligible for the open-
label study were those who
completed the initial RCT,
patients who discontinued
due to lack of efficacy but
completed follow-up
evaluations and patients who
discontinued due to adverse
events which subsequently
resolved.
Figure 3(a) refers to

Technology Assessment Report for NICE
TNF-alpha inhibitors for ankylosing spondylitis and nr-axSpA
12/12/2014 317
Study Population characteristics Interventions Utility assessment methods Utilities reported
Mean (SD) [95% CI]
Reviewer comments
maintained this to week 72
(115 patients completed 72
weeks of treatment).
‘combined’ EQ-5D scores –
it is not clear what ‘combine’
denotes.
Braun et al (2007)83
Improvement in patient-
reported outcomes for
patients with ankylosing
spondylitis treated with
etanercept 50 mg once-
weekly and 25 mg twice-
weekly
356 active AS patients
diagnosed using mNY
criteria defined by a VAS for
mean morning stiffness ≥30, and by
at least two of the following:
VAS for patient global assessment of
disease activity ≥30, average
of VAS for nocturnal and total pain ≥30 or BASFI
≥30.
Age: 40
Disease duration: 9 years
BASDAI: 6.1
BASFI: 6.0
Placebo
Etanercept 25mg twice-
weekly (12 weeks)
Etanercept 50mg once-
weekly (12 weeks)
EQ-5D
Completed by patients
in 11 European
countries (including the
UK)
It’s assumed that the
UK population
valuation set was used
as the authors reference
Dolan et al (1997)245
Mean increase between 0 to
12 weeks reported in figure 2 =
Placebo patient’s utility increase at 12 weeks: +0.13
Etanercept 25mg patient’s
utility increase at 12 weeks: +0.25
Etanercept 50mg patient’s
utility increase at 12 weeks:
+0.3
Results may be generalisable
to an AS population who
have been treated with
etanercept. However, it is not
clear how generalisable the
outputs are to a UK population.
Baseline values not reported
A rapid improvement in utilities seen within 2 weeks.
90% of patients completed 12 weeks of treatment
UK population valuation set
is assumed to have been used.
Gordeev et al (2010)246
Role of contextual factors in health-related quality of
life in ankylosing spondylitis
764 patients with AS,
diagnosed using mNY
criteria, in Canada and
Australia were sent a
questionnaire in the
post.
522 (68%) responded
and were included in the
NA EQ-5D
Completed by patients
in Canada and Australia
UK population
valuation set is used
Australian cohort (n=105): 0.68 (0.27)
Canadian cohort (n=417):
0.62 (0.29)
This study may be
generalisable to patients with
AS. However,
generalisability to a UK population is unknown.
Contextual factors explained

Technology Assessment Report for NICE
TNF-alpha inhibitors for ankylosing spondylitis and nr-axSpA
12/12/2014 318
Study Population characteristics Interventions Utility assessment methods Utilities reported
Mean (SD) [95% CI]
Reviewer comments
analysis
Age: 43 (Australian), 53 (Canadian)
Diagnosis duration: 13 years
(Australian), 19 years (Canadian)
BASDAI: 3.5 (Australian),
4.1 (Canadian)
BASFI: 3.3 (Australian), 3.9
(Canadian)
37% of the variance in EQ-5D.
Helplessness (measured
using the Rheumatoid
Attitudes Index Helplessness
Subscale), employment and
education were the most
important contextual factors.
Their role was independent
of the strong effect of BASDAI and BASFI.
Haywood et al (2002)243
Generic measures of health-
related quality of life in
ankylosing spondylitis:
reliability, validity and
responsiveness
A random sample of
451 patients with AS,
diagnosed using mNY
criteria, were sent a
postal questionnaire
349 (77%) patients
returned the
questionnaire at baseline
349 patients returned the
questionnaire at baseline
303 patients returned the
questionnaire at 2 weeks
289 patients returned the
questionnaire at 6
months
Age: 46
Symptom duration: 20 years
BASDAI: not reported
NA EQ-5D
Completed by patients
in the UK
It’s assumed that the
UK population
valuation set was used
as the authors reference
Kind et al (1998)247
Outputs from the EQ-5D
VAS and SF-12 are also
reported in this study but are not summarised here.
Reliability analysis using
data from patients whose
health remained the same at 2 weeks (n=321): 0.53 (0.35)
Longitudinal construct
validity analysis at 6 months:
AS
Patients whose AS
health was better
(n=57): improved by
0.30 (1.2)
Patients whose AS
health stayed the same
(n=120): -0.25 (1.5)
Patients whose AS
health was worse
(n=77): improved by -
0.09 (1.6)
This study may be
generalisable to UK patients with AS.
UK population valuation set
is assumed to have been
used.
BASDAI/BASFI values for
this cohort are not reported.

Technology Assessment Report for NICE
TNF-alpha inhibitors for ankylosing spondylitis and nr-axSpA
12/12/2014 319
Study Population characteristics Interventions Utility assessment methods Utilities reported
Mean (SD) [95% CI]
Reviewer comments
BASFI: not reported
General health
Patients whose general
health was better
(n=49): improved by
0.35 (1.3)
Patients whose AS
health stayed the same
(n=132): -0.21 (1.4)
Patients whose AS
health was worse
(n=67): -0.15 (1.7)
Healey et al (2013)16
Patients with well-
established ankylosing spondylitis show limited
deterioration in a ten-year prospective cohort study
269 patients with AS,
diagnosed using mNY
criteria, were invited to
participate at a
rheumatology centre
159 patients participated
at baseline
69 patients participated
at the 10 year
assessment
Age: 49
Disease duration: 16 years
BASDAI: 4.1
BASFI: not reported
NA EQ-5D
Completed by patients
in the UK
It’s assumed that the
UK population
valuation set was used
as this is a UK study
Outputs from the SF-12 are
also reported in this study but are not summarised here.
Baseline assessment in 1998
(n=159): 0.64 (0.28)
10 year follow-up assessment: 0.61 (0.30)
This study may be
generalisable to UK patients with AS.
Only 69 patients participated in both assessments.
A UK population valuation
set is assumed to have been
used.
Kobelt et al (2004)143
Clinical trial, hospital cohort
and survey data for AS
patients were utilised in this
NA EQ-5D
Completed by patients
Survey mean: 0.67 (0.21)
This study may be
generalisable to UK patients

Technology Assessment Report for NICE
TNF-alpha inhibitors for ankylosing spondylitis and nr-axSpA
12/12/2014 320
Study Population characteristics Interventions Utility assessment methods Utilities reported
Mean (SD) [95% CI]
Reviewer comments
The burden of ankylosing spondylitis and the
cost-effectiveness of treatment with
infliximab (Remicade®)
study.
Utilities were estimated from
a survey of 3000 patients.
1413 (57%) patients
responded and were included
in the analysis. Survey
responders had the following characteristics:
Age: 57
Disease duration: 30 years
BASDAI: 4.2
BASFI: 4.5
in the UK
It’s assumed that the
UK population
valuation set was used
as the study references
Dolan et al (1995)248
and was conducted in
the UK
BASDAI subgroups:
Patients with a BASDAI
<3 (mean BASFI=2.4):
0.8
Patients with a BASDAI
3-3.99 (mean
BASFI=3.7): 0.7
Patients with a BASDAI
4-4.99 (mean
BASFI=4.5): 0.64
Patients with a BASDAI
5-5.99 (mean
BASFI=5.4): 0.60
Patients with a BASDAI
6-6.99 (mean
BASFI=6.4): 0.51
Patients with a BASDAI
>7 (mean BASFI=7.8):
0.39
BASFI subgroups:
Patients with a BASFI
<3 (mean
BASDAI=2.5): 0.8
Patients with a BASFI
3-3.99 (mean
BASDAI=3.8): 0.71
Patients with a BASFI
4-4.99 (mean
BASDAI=4.2): 0.67
Patients with a BASFI
5-5.99 (mean
BASDAI=4.7): 0.57
with AS.
Patients from across the
spectrum of possible
BASDAI/BASFI values (0-
10) responded to the survey
Measures of uncertainty not
reported
UK population valuation set
is assumed to have been used.

Technology Assessment Report for NICE
TNF-alpha inhibitors for ankylosing spondylitis and nr-axSpA
12/12/2014 321
Study Population characteristics Interventions Utility assessment methods Utilities reported
Mean (SD) [95% CI]
Reviewer comments
Patients with a BASFI
6-6.99 (mean
BASDAI=5.5): 0.53
Patients with a BASFI
>7 (mean
BASDAI=8.4): 0.47
McLeod et al (2007)34
Adalimumab, etanercept and infliximab
for the treatment of
ankylosing
spondylitis: a systematic review and
economic evaluation
(mapping algorithm to EQ-
5D values reported)
Utilities were estimated from
a re-analysis of the Kobelt et
al (2004)143 survey data by
the manufacturer of infliximab (n = 1144)
Age: not reported
Disease duration: not reported
BASDAI: not reported
BASFI: not reported
NA EQ-5D
Completed by patients
in the UK
It’s assumed that the
UK population
valuation set was used
as the study references
Dolan et al (1995)248
and was conducted in
the UK
Methods for mapping
algorithm used by the
Assessment group not
reported.
Algorithm used in the
Assessment Group (LRiG) model:
Utility = 0.8772129 - 0.0384087
x BASDAI - 0.0322519 x
BASFI - 0.0278913 x Male + 0.0016809 x Age
Algorithms used in the
manufacturer submissions
are also reported but not reproduced here.
Generalisability of the
algorithm is unclear as
methods have not been reported.
Report states that the
manufacturer analysis is
based on 1144 patients from
Kobelt 2004. Utility values in
Kobelt 2004 were calculated
using data from 1413 patients.
UK AS patients from across
the spectrum of possible
BASDAI/BASFI values (0-
10) are likely to have been included in the analysis.
van Tubergen et al
(2002)234
Cost Effectiveness of
Combined Spa–Exercise
Therapy in Ankylosing
Spondylitis: A Randomized
120 AS patients, diagnosed using mNY criteria.
111 included in the analysis.
Age: 48
Disease duration: 11 years
Spa treatment (3 weeks)
Usual care EQ-5D
Completed by patients
in Europe (not including
the UK)
UK population
valuation set is assumed
to have been used as the
study references Dolan
Spa treatment in Austria (n=36):
Baseline (2 weeks
before treatment): 0.650
(0.22)
Change at 4 weeks: 0.02
(0.2)
Results may be generalisable
to an AS population,
however, generalisability to a UK population is unknown.
Patients were allowed to
continue taking their usual

Technology Assessment Report for NICE
TNF-alpha inhibitors for ankylosing spondylitis and nr-axSpA
12/12/2014 322
Study Population characteristics Interventions Utility assessment methods Utilities reported
Mean (SD) [95% CI]
Reviewer comments
Controlled Trial BASDAI: not reported
BASFI: 4.4
et al (1996)249.
Outputs from the SF-6D are
also reported in this study but are not summarised here.
Change at 16 weeks:
0.04 (0.21)
Change at 28 weeks: -
0.03 (0.23)
Change at 40 weeks: -
0.01 (0.27)
Spa treatment in The Netherlands (n=38):
Baseline (2 weeks
before treatment): 0.64
(0.22)
Change at 4 weeks: 0.1
(0.24)
Change at 16 weeks:
0.12 (0.24)
Change at 28 weeks: 0.1
(0.21)
Change at 40 weeks:
0.03 (0.23)
Usual care (n=37):
Baseline (2 weeks
before treatment): 0.72
(0.1)
Change at 4 weeks: -
0.06 (0.18)
Change at 16 weeks: -
0.04 (0.19)
Change at 28 weeks: -
0.08 (0.28)
Change at 40 weeks: -
medication throughout the
study period. Medication
could be changed if needed.
This may bias the results.
A UK population valuation
set is assumed to have been used.

Technology Assessment Report for NICE
TNF-alpha inhibitors for ankylosing spondylitis and nr-axSpA
12/12/2014 323
Study Population characteristics Interventions Utility assessment methods Utilities reported
Mean (SD) [95% CI]
Reviewer comments
0.03 (0.19)
Wade et al (2011)230
Baseline characteristics and patient reported
outcome data of patients
prescribed etanercept: web-
based and telephone evaluation
43 patients prescribed
etanercept for AS (diagnostic criteria not reported)
RA, PsA and psoriasis
patients were also included in the study.
Age: 49
Disease duration: not reported
BASDAI: not reported
BASFI: not reported
Etanercept EQ-5D
Completed by patients
in the UK
UK population
valuation set is assumed
to have been used as this
is a UK study
Baseline: 0.37 (0.37)
This study may be
generalisable to UK patients with AS.
23% of AS patients were
previously treated with a TNF alpha inhibitor.
UK population valuation set
is assumed to have been used.
Differences in characteristics
between telephone and web-
based responders were
observed for the entire sample (for all conditions).
AS = ankylosing spondylitis, LRiG =Liverpool Reviews and Implementation Group, mNY = modified New York criteria, NA = not applicable, OASIS = Outcome in Ankylosing
Spondylitis International Study, PsA = psoriatic arthritis, RA = rheumatoid arthritis, RCT = randomised controlled trial, SSTAG = South Swedish Arthritis Treatment Group, UK = United
Kingdom, * = median and, where included, the interquartile range, % = standard errors reported in brackets

12/12/2014 324
11.14 Appendix 14: Comparison of parameter inputs across manufacturer models
Tables 157 and 158 provide an overview of the main parameter inputs applied in each of the
manufacturer models for the AS and nr-axSpA populations.
Table 157 - Summary of main model inputs in manufacturer models - AS population
Parameter
MSD economic model
(Infliximab,
Golimumab)
AbbVie economic
model (Adalimumab)
UCB economic model
(Certolizumab)
Pfizer economic model
(Etanercept)
Time horizon Lifetime 40 years Lifetime Lifetime
Discount rate 3.5% 3.5% 3.5% 3.5%
Average age 39 42 41 41
Proportion male % 72 75 72 74
Average Weight 70 81.1 81.7 76.4
Baseline BASDAI 6.5 6.3 6.4 6.1
Baseline BASFI 5.0 5.3 5.7 5.9
Source of baseline
characteristics
GO-RAISE ATLAS RAPID-axSpA trial Study 314-EU
Mortality (SMR) Male: 1.63
Female: 1.38
1.5 1.5 1.5
Response criteria BASDAI50 response
at week 12
ASAS20 response at
week 12
ASAS20 response at
week 24
BASDAI50 response at
week 12
Proportion of
responders %
Infliximab: 79.3
Golimumab: 48.5
Adalimumab: 47.0
Certolizumab: 53.0
Etanercept: 48.2
Placebo: 14.5
Infliximab: 72.4
Golimumab: 59.3
Adalimumab: 63.2
Certolizumab: 46.2
Etanercept: 60.7
Placebo: 27.2
Infliximab: 65.7
Golimumab: 54.1
Adalimumab: 56.2
Certolizumab: 55.7
Etanercept: 56.4
Placebo: -
Infliximab: 68
Golimumab: 61
Adalimumab: 54
Certolizumab: 47
Etanercept: 54
Placebo: 22
Placebo response Loss or maintenance of
placebo response not
clearly reported.
BASDAI and BASFI
return to baseline at
week 12
No placebo response BASDAI and BASFI
return to baseline at 12
weeks
Annual long-term
rate of anti-TNFs
withdrawal
6.1% (GO-RAISE)
Common rate for all
anti-TNFs.
Time-dependent
discontinuation;
lognormal model fitted
to Adalimumab week
12 responder data
(ATLAS). Less than
15% projected to stay
on treatment at year 40
Common rate for all
anti-TNFs.
7% (NICE TA143)
Common rate for all
anti-TNFs.
Exponential model fitted
to Etanercept data;
model translates to 11%
annual discontinuation
for Etanercept.
Hazard ratios applied for
other anti-TNFs
(Glintborg 2010)108
Natural history:
annual rate of BASFI
progression
0.07 points (Kobelt
2004)143
0.056 points (ATLAS) 0.07 points (Kobelt
2004)143
0.07 points (Kobelt
2004)143
AEs included; annual
probability / rate
Serious AEs and ISRs
included. Convent.
care rates from GO‐RAISE study. ORs
from the NMA applied
for each anti-TNF.
Only infectious AEs
included; excess
proportion for
Adalimumab 29.7%
annually (ATLAS
trial). Same rate
applied to all anti-
TNFs.
No AEs included Serious infections for
Etanercept: 3.8%
annually. Relative effects
from a published NMA
(Singh 2011)127 applied
for other anti-TNFs
HRQoL algorithm 0.877121 - 0.03841 * 0.899-0.031 * 2.126-0.132*BASFI- 0.887 - 0.006030 *

Technology Assessment Report for NICE
TNF-alpha inhibitors for ankylosing spondylitis and nr-AxSpA
12/12/2014 325
Parameter
MSD economic model
(Infliximab,
Golimumab)
AbbVie economic
model (Adalimumab)
UCB economic model
(Certolizumab)
Pfizer economic model
(Etanercept)
(EQ-5D) BASDAI - 0.03225 *
BASFI - 0.02789 *
male + 0.00168 * age
(NICE TA143)
BASDAI-0.041 *
BASFI (HUI3, data
from ATLAS)
0.245*BASDAI
(RAPID-axSpA study)
BASFI + 0.001030 *
BASDAI + 0.000020 *
BASFI^2 – 0.0000064 *
BASDAI^2
(Study 314-EU)
Annual healthcare
resource use costs
1902.49*exp(0.1832*
BASFI) (NICE
TA143)
£1124.619 ×
EXP(0.264× BASDAI)
(OASIS)157
1909.33*exp(0.1832*
BASFI) (NICE
TA143)
BASDAI < 4: Annual
cost: £151.96; 4 ≤
BASDAI < 6: Annual
cost: £311.08; BASDAI
≥ 6: Annual cost:
£1039.16 (Rafia 2012)158

12/12/2014 326
Table 158 - Summary of main model inputs in manufacturer models - nr-axSpA population
Parameter AbbVie economic
model (Adalimumab)
UCB economic model
(Certolizumab)
Pfizer economic model
(Etanercept)
Time horizon 40 years Lifetime Lifetime
Discount rate 3.5% 3.5% 3.5%
Average age 38 37 32
Proportion male % 45 48 60
Average Weight NR 82 74
Baseline BASDAI 6.4 6.5 6.0
Baseline BASFI 4.6 4.9 4.0
Source of baseline
characteristics
ABILITY-1 RAPID-axSpA trial Study 1031
Mortality (SMR) 1.0 1.5 1.0
Response criteria ASAS40 response at
week 12
ASAS20 response at
week 12
BASDAI50 response at
week 12
Proportion of
responders %
Adalimumab: 55.9
Certolizumab: 58.8
Etanercept: NR
Placebo: 22.2
Adalimumab: 56.3
Certolizumab: 59.0
Etanercept: 47.1
Placebo: -
Adalimumab: 44
Certolizumab: 59
Etanercept: 38
Placebo: 27
Placebo response BASDAI and BASFI
return to baseline at
week 12
No placebo response BASDAI and BASFI
return to baseline at 12
weeks
Annual long-term
rate of anti-TNFs
withdrawal
Time-dependent
discontinuation;
lognormal model fitted
to Adalimumab week
12 responder data
(ABILITY-1). Less
than 10% projected to
stay on treatment at
year 40
Common rate for all
anti-TNFs.
7% (NICE TA143)
Common rate for all
anti-TNFs.
Exponential model fitted
to Etanercept week 12
responder data; model
translates to 5% annual
discontinuation for
Etanercept.
Hazard ratios applied for
other anti-TNFs
(Glintborg 2010)108
Progression rate from
nr-axSpA to AS
- 3.84% per year -
Natural history:
annual rate of BASFI
progression
0.084 points
(ABILITY-1)
0.07 points (Kobelt
2004)143
0.07 points (Kobelt
2004)143
AEs included; annual
probability / rate
Only TB AEs and non-
TB serious AEs
included; excess rate
for Adalimumab 7.3%
for non TB serious
AEs and 0.16% for TB
AEs annually
(ABILITY-1 trial).
Same rate applied to
all anti-TNFs.
No AEs included No AEs included
HRQoL algorithm 0.922-0.039*BASDAI-
0.041*BASFI
(ABILITY-1)
2.1262-
0.1323*BASFI-
0.2450*BASDAI
(RAPID-axSpA study)
0.919 - 0.00431 * BASFI
+ 0.000788 * BASDAI +
0.0000511 * BASFI^2 –
0.0000194 * BASDAI^2

Technology Assessment Report for NICE
TNF-alpha inhibitors for ankylosing spondylitis and nr-AxSpA
12/12/2014 327
Parameter AbbVie economic
model (Adalimumab)
UCB economic model
(Certolizumab)
Pfizer economic model
(Etanercept)
– 0.00102 * Age +
0.0478 * Male –
0.0000754 *
BASDAI*BASFI
(Study 1031)
Annual healthcare
resource use costs
£1124.62 ×
EXP(0.264× BASDAI)
(OASIS)157
1909.33*exp(0.1832*
BASFI) (NICE
TA143)
BASDAI < 4: Annual
cost: £151.96; 4 ≤
BASDAI < 6: Annual
cost: £311.08; BASDAI
≥ 6: Annual cost:
£1039.16 (Rafia 2012)158
Comparison of disease costs assumed for the AS and nr-axSpA populations
A variety of alternative regressions were applied across the submissions to estimate the annual disease
costs associated with BASDAI and BASFI scores. MSD and UCB used the same exponential
regression function estimated by LRiG as part of TA143 based on the OASIS study – uprated to
current prices.
Regression in NICE TA143 based on OASIS data and cost element uprated to current prices:
£1902.492*EXP(0.1832*BASFI)
AbbVie undertook their own re-analysis of the OASIS data set based on current prices. In their base-
case an exponential model based on BASDAI was assumed. However, results from separate linear
and exponential models were also presented.
Base-case regression used by AbbVie
Exp BASDAI: £1124.619 * EXP(0.264 × BASDAI)
Alternative regressions presented by AbbVie
Linear BASFI: £520.32102 +£804.64642 × BASFI
BASDAI: £118.47088 + £943.21394 × BASDAI
Exp BASFI: £1284.186 * EXP(0.213 × BASFI)
The submission by Pfizer was based on a recent UK study by Rafia et al (2012)158
. Rather than
employing a regression approach, the manufacturer used results based on a categorical analysis of the
annual costs for BASDAI: BASDAI<4 = £151.96, 4<=BASDAI<6 = £311.08; BASDAI>=6 =
£1039.16.

Technology Assessment Report for NICE
TNF-alpha inhibitors for ankylosing spondylitis and nr-AxSpA
12/12/2014 328
However, the paper by Rafia et al (2012) also specified a separate 2-part regression function which
was not included within the Pfizer submission but is used in the subsequent comparisons of
regressions to provide a more comparable approach to assessing the alternative costs sources used
across the manufacturer submissions and the predictions across a range of different BASDAI and
BASFI scores.
Two-part model in Rafia (2012):
1) Logistic regression model to derive probability of incurring costs:
2.71795 + 0.16716*BASFI + 0.37053*BASDAI - 0.02468* BASFI*BASDAI + 0.33778*Male -
0.04389*Age - 0.01373*Disease Duration
2) GLM to obtain 3-month costs:
6.79876 + 0.27548*BASFI + 0.13265*BASDAI - 0.01602* BASFI*BASDAI + 0.46458*Male -
0.01656*Age + 0.00381*Disease Duration
Figures 22 and 23 provide a comparison of the predictions from the alternative cost regressions using
the separate sources identified across the manufacturer models. The baseline characteristics
(BASDAI, BASFI, age and disease duration) are derived from a weighted average of the baseline
characteristics of the clinical trials for the AS population from the manufacturer submissions.
In Figure 22, BASDAI scores are held constant at the mean value and the impact of varying BASFI
across the range (0-10 scale) are reported. In Figure 2, BASFI scores are held constant at the mean
value and the impact of varying BASDAI across the range (0-10 scale) are reported.
Figures 24 and 25 compare the alternative regression functions reported in the submission by AbbVie
based on their re-analysis of the OASIS study.

12/12/2014 329
Figure 22 Comparison of main manufacturer cost regressions – assuming constant BASDAI
0
2000
4000
6000
8000
10000
12000
14000
0 1 2 3 4 5 6 7 8 9 10
An
nu
al c
ost
BASFI
Resource Use Regressions - Constant BASDAI
NICE TA143 - OASIS
AbbVie - OASIS Exp BASDAI
AbbVie - OASIS Exp BASFI
Pfizer - Rafia (2012)

Technology Assessment Report for NICE
TNF-alpha inhibitors for ankylosing spondylitis and nr-AxSpA
12/12/2014 330
Figure 23 Comparison of main manufacturer cost regressions – assuming constant BASFI
0
2000
4000
6000
8000
10000
12000
14000
16000
18000
0 1 2 3 4 5 6 7 8 9 10
An
nu
al c
ost
BASDAI
Resource Use Regressions - Constant BASFI
NICE TA143 - OASIS
AbbVie - OASIS Exp BASDAI
AbbVie - OASIS Exp BASFI
Pfizer - Rafia (2012)

Technology Assessment Report for NICE
TNF-alpha inhibitors for ankylosing spondylitis and nr-AxSpA
12/12/2014 331
Figure 24 Comparison of AbbVie cost regressions – assuming constant BASDAI
0
2000
4000
6000
8000
10000
12000
0 1 2 3 4 5 6 7 8 9 10
An
nu
al c
ost
BASFI
AbbVie Regressions - Constant BASDAI
AbbVie - OASIS Exp BASDAI
AbbVie - OASIS Linear BASDAI
AbbVie - OASIS Exp BASFI
AbbVie - OASIS Linear BASFI

Technology Assessment Report for NICE
TNF-alpha inhibitors for ankylosing spondylitis and nr-AxSpA
12/12/2014 332
Figure 25 Comparison of AbbVie cost regressions – assuming constant BASFI
0
2000
4000
6000
8000
10000
12000
14000
16000
18000
0 1 2 3 4 5 6 7 8 9 10
An
nu
al c
ost
BASDAI
AbbVie Regressions - Constant BASFI
AbbVie - OASIS Exp BASDAI
AbbVie - OASIS Linear BASDAI
AbbVie - OASIS Exp BASFI
AbbVie - OASIS Linear BASFI

Technology Assessment Report for NICE
TNF-alpha inhibitors for ankylosing spondylitis and nr-AxSpA
12/12/2014 333
Table 159 - Cost inputs in manufacturer submissions (AS & nr-axSpA population)
Parameter
MSD economic model
(Infliximab,
Golimumab)
AbbVie economic
model (Adalimumab)
UCB economic model
(Certolizumab)
Pfizer economic
model (Etanercept)
Administration costs Subcutaneous
therapies: no
administration cost.
Intravenous therapies:
cost of £109 per
administration (no reference provided)
Subcutaneous
therapies: no
administration cost.
Intravenous therapies:
cost of £99 per
administration (no reference provided)
Subcutaneous
therapies: £49 cost of
nurse training for self-
administration (PSSRU)169
Intravenous therapies:
cost of £398 per
administration (PSSRU).
Subcutaneous
therapies: £49 cost of
nurse training for self-
administration (PSSRU)169
Intravenous therapies:
cost of £302 per
administration (NICE TA143).
Doses and unit costs - Costs estimated in
line with licensed
doses.
- PAS included for
Certolizumab and
Golimumab.
- Infliximab dosage:
Average weight of
70kg assumed (4
vials), subsequent
administration every
7 weeks
- Costs estimated in
line with licensed
doses.
- PAS included for
Golimumab; not
included for
Certolizumab
- Infliximab dosage:
Average weight of
81.1kg assumed (5
vials), subsequent
administration every
6 weeks
- Costs estimated in
line with licensed
doses.
- PAS included for
Certolizumab and
Golimumab.
- Infliximab dosage:
Average weight of
81.7kg assumed
(4.88 vials),
subsequent
administration every
7 weeks
- Costs estimated in
line with licensed
doses.
- PAS included for
Certolizumab and
Golimumab
- Infliximab dosage:
Average weight of
76.4kg assumed (4
vials), subsequent
administration every
6 weeks
Monitoring costs Short term treatment
costs applied in first
cycle only for
conventional care and
anti-TNFs. Costs were
informed by KOL
interviews.
Anti-TNFs: £873.2
Conventional care:
£1,459.5
Initiation and quarterly
monitoring costs
included. Common for
all anti-TNFs
comparators (York Model TA199)165
Initiation: £470.09
Monitoring: £110.98 per cycle
No monitoring costs included
No monitoring costs
included in the base
case

Technology Assessment Report for NICE
TNF-alpha inhibitors for ankylosing spondylitis and nr-AxSpA
12/12/2014 334
Parameter
MSD economic model
(Infliximab,
Golimumab)
AbbVie economic
model (Adalimumab)
UCB economic model
(Certolizumab)
Pfizer economic
model (Etanercept)
Annual healthcare
resource use costs
1902.49*exp(0.1832*
BASFI) (NICE
TA143)
£1124.619 ×
EXP(0.264× BASDAI)
(OASIS)157
1909.33*exp(0.1832*
BASFI) (NICE
TA143)
BASDAI < 4: Annual
cost: £151.96;
BASDAI 4 ≤ BASDAI
< 6: Annual cost:
£311.08; BASDAI ≥ 6:
Annual cost: £1039.16 (Rafia 2012)158

Technology Assessment Report for NICE
TNF-alpha inhibitors for ankylosing spondylitis and nr-AxSpA
12/12/2014 335
Table 160 - Withdrawal inputs in manufacturer submissions (AS & nr-axSpA population)
Parameter
MSD economic model
(Infliximab,
Golimumab)
AbbVie economic
model (Adalimumab)
UCB economic model
(Certolizumab)
Pfizer economic
model (Etanercept)
Annual long-term
rate of anti-TNF
withdrawal– AS population
6.1% (GO-RAISE
study, data of patients
on treatment with
golimumab from week 24 to week 256)
Common rate for all anti-TNFs.
Time-dependent
discontinuation rate;
lognormal model fitted
to Adalimumab week
12 responder data up to week 260 (ATLAS).
Less than 15% of
week-12 responders
were projected to stay
on treatment at year 40 for AS
Common rate for all anti-TNFs.
7% (NICE TA143)
Common rate for all anti-TNFs.
Exponential model
fitted to Etanercept
data; model translates
to 11% annual
discontinuation for Etanercept.
Hazard ratios applied
for other anti-TNFs (Glintborg 2010)108
Annual
discontinuation:
Infliximab: 14.3%
Golimumab: 12.3% Adalimumab: 12.3%
Certolizumab: 12.3%
Annual long-term
rate of anti-TNF
withdrawal – nr-axSpA population
Not applicable. Time-dependent
discontinuation;
lognormal model fitted
to Adalimumab week
12 responder data up to
week 156 (ABILITY-1).
Less than 10% of
week-12 responders
were projected to stay on treatment at year 40
Common rate for all anti-TNFs.
7% (NICE TA143)
Common rate for all anti-TNFs.
Exponential model
fitted to Etanercept
week 12 responder
data; model translates
to 5% annual
discontinuation for Etanercept.
Hazard ratios applied
for other anti-TNFs
(Glintborg 2010)108
Annual
discontinuation:
Infliximab: 6.5%
Golimumab: 5.6% Adalimumab: 5.6%

Technology Assessment Report for NICE
TNF-alpha inhibitors for ankylosing spondylitis and nr-AxSpA
12/12/2014 336
Parameter
MSD economic model
(Infliximab,
Golimumab)
AbbVie economic
model (Adalimumab)
UCB economic model
(Certolizumab)
Pfizer economic
model (Etanercept)
Certolizumab: 5.6%

Technology Assessment Report for NICE
TNF-alpha inhibitors for ankylosing spondylitis and nr-AxSpA
12/12/2014 337
Table 161 - Adverse events inputs in manufacturer submissions – AS population
Parameter
MSD economic model
(Infliximab,
Golimumab)
AbbVie economic
model (Adalimumab)
UCB economic model
(Certolizumab)
Pfizer economic model
(Etanercept)
AEs included; annual
probability
Serious AEs and ISRs
included. Conventional
care rates from GO-
RAISE study at 24
weeks. OR of SAEs
and ISRs from the
NMA applied for each
anti-TNF.
Annual probability %
of SAEs:
Placebo: 7.6
Infliximab: 21.4
Golimumab: 5.4 Adalimumab: 6.8
Certolizumab: 13.4
Etanercept: 20.5
Annual probability % of ISRs:
Placebo: 19.7
Infliximab: 24.3
Golimumab: 51.0 Adalimumab: 38.5
Certolizumab: 38.5
Etanercept: 52.6
Only infectious AEs
included; excess
proportion for
Adalimumab was
29.7% annually (ATLAS trial)
Same rate applied to all anti-TNFs.
No AEs included Only serious infections
included. Annual
probability: 3.8% (Study
312)
Relative effects for other
anti-TNF agents were
applied in the model,
obtained from a
published NMA (Singh
2011)127.
Annual probability %:
Infliximab: 4.1
Golimumab: 3.3 Adalimumab: 3.6
Certolizumab: 13.9
Etanercept: 3.8
Unit cost of AE Cost per serious AE
episode (weighted average):
£214.26 anti-TNFs,
£397.32 for
conventional care
Cost per infectious AE
episode: £45 (one GP
visit assumed per infectious AE)
- Cost per serious
infection episode: £1,457
(weighted average) (NHS Reference costs)166

Technology Assessment Report for NICE
TNF-alpha inhibitors for ankylosing spondylitis and nr-AxSpA
12/12/2014 338
Parameter
MSD economic model
(Infliximab,
Golimumab)
AbbVie economic
model (Adalimumab)
UCB economic model
(Certolizumab)
Pfizer economic model
(Etanercept)
(GO-RAISE).
Cost of injection site
reaction £94.18 per
episode
Disutility of AE Only disutility
associated with SAEs
applied; utility
decrement of 0.01
applied for one cycle (NICE TA233)
No disutility applied - 0.156 for 28 days

Technology Assessment Report for NICE
TNF-alpha inhibitors for ankylosing spondylitis and nr-AxSpA
12/12/2014 339
Table 162 - Adverse events inputs in manufacturer submissions – nr-axSpA population
Parameter AbbVie economic
model (Adalimumab)
UCB economic model
(Certolizumab)
Pfizer economic model
(Etanercept)
AEs included; annual
probability
Only TB AEs and non-
TB serious AEs
included; excess
proportion for
Adalimumab 7.3% for
non TB serious AEs
and 0.16% for TB AEs
annually (ABILITY-1
trial).
Same rate applied to
all anti-TNFs.
No AEs included No AEs included
Unit cost of AE - non-TB serious AEs:
£4,216 per episode
(NHS Reference
costs)166
- TB AE: £6,559.76
per episode (Botteman 2007)153
- -
Disutility of AE No disutility applied - -
11.15 Appendix 15: Full ICER tables for scenarios

Technology Assessment Report for NICE
TNF-alpha inhibitors for ankylosing spondylitis and nr-AxSpA
12/12/2014 340
Table 163 - Summary of cost-effectiveness scenarios – AS population
No. Parameter/structural Approach in scenario Approach in base-case
1 Conventional care (‘placebo’)
response
No response to conventional care
assumed at 12 weeks
Response to conventional care
included at 12 weeks
2. Different baselines assumed for
responders and non-responders
and change in BASDAI/BASFI
scores
Separate baselines based on
pooled estimates provided by
manufacturers. Changes in
BASDAI/BASFI conditioned on
response also based on pooled
estimates provided by
manufacturers
Separate baselines and changes in
BASDAI/BASFI conditioned on
responses estimated via extended
synthesis model
3. BASFI Progression No effect of anti-TNFs on BASFI
progression
Treatment effect applied from
year 4 onwards
4. BASFI progression Treatment effect of anti-TNFs
applied from start of model
Treatment effect applied from
year 4 onwards
5. Utilities Linear BASDAI/BASFI model
(based on Kobelt)
Non-linear BASDAI/BASFI
model (Pfizer submission)
AS Scenario Results – Rebound equal to gain
Table 164 - AS – Scenario 1 (rebound equal to gain)
Total
QALYs
Incremental
QALYs
Total costs
(£)
Incremental
costs (£)
ICER (£) Probability
of CE
£20K
Probability
of CE
£30K
Conventional
Therapy 7.262 - 111,702 - - - -
Certolizumab
Pegol PAS 7.952 0.691 125,734 14,033 20,319 0.462 0.861
Golimumab 7.952 0.691 127,531 15,829 22,920 0.313 0.764
Adalimumab 7.952 0.691 127,594 15,893 23,013 0.308 0.761
Etanercept 7.952 0.691 127,879 16,178 23,425 0.292 0.741
Certolizumab
Pegol 7.952 0.691 129,308 17,607 25,495 0.188 0.651
Infliximab 7.952 0.691 141,750 30,048 43,510 0.000 0.063
Probability of CE £20/30K = probability that the TNF-alpha inhibitor, when compared to conventional care, is a cost-effective option at the stated threshold

Technology Assessment Report for NICE
TNF-alpha inhibitors for ankylosing spondylitis and nr-AxSpA
12/12/2014 341
Table 165 - AS – Scenario 2 (rebound equal to gain)
Total
QALYs
Incremental
QALYs
Total costs
(£)
Incremental
costs (£)
ICER (£) Probability
of CE
£20K
Probability
of CE
£30K
Conventional
Therapy 7.036 - 112,417 - - - -
Certolizumab
Pegol PAS 8.364 1.327 127,716 15,300 11,527 0.962 0.996
Golimumab 8.364 1.327 129,386 16,970 12,785 0.919 0.994
Adalimumab 8.364 1.327 129,473 17,057 12,851 0.918 0.994
Etanercept 8.364 1.327 129,862 17,445 13,143 0.903 0.994
Certolizumab
Pegol 8.364 1.327 131,290 18,873 14,220 0.844 0.989
Infliximab 8.364 1.327 147,853 35,437 26,699 0.095 0.668
Probability of CE £20/30K = probability that the TNF-alpha inhibitor, when compared to conventional care, is a cost-effective option at the stated threshold
Table 166 - AS – Scenario 3 (rebound equal to gain)
Total
QALYs
Incremental
QALYs
Total costs
(£)
Incremental
costs (£)
ICER (£) Probability
of CE
£20K
Probability
of CE
£30K
Conventional
Therapy 7.253 - 109,379 - - - -
Certolizumab
Pegol PAS 8.128 0.875 127,455 18,075 20,655 0.462 0.843
Golimumab 8.128 0.875 129,140 19,760 22,581 0.348 0.775
Adalimumab 8.128 0.875 129,224 19,845 22,677 0.341 0.771
Etanercept 8.128 0.875 129,600 20,220 23,106 0.319 0.760
Certolizumab
Pegol 8.128 0.875 131,028 21,649 24,739 0.234 0.698
Infliximab 8.128 0.875 147,118 37,739 43,125 0.001 0.063
Probability of CE £20/30K = probability that the TNF-alpha inhibitor, when compared to conventional care, is a cost-effective option at the stated threshold
Table 167 - AS – Scenario 4 (rebound equal to gain)
Total
QALYs
Incremental
QALYs
Total costs
(£)
Incremental
costs (£)
ICER (£) Probability
of CE
Probability
of CE

Technology Assessment Report for NICE
TNF-alpha inhibitors for ankylosing spondylitis and nr-AxSpA
12/12/2014 342
£20K £30K
Conventional
Therapy 7.239 - 111,036 - - - -
Certolizumab
Pegol PAS 8.201 0.962 128,804 17,767 18,466 0.589 0.929
Golimumab 8.201 0.962 130,485 19,448 20,213 0.462 0.878
Adalimumab 8.201 0.962 130,570 19,533 20,301 0.453 0.875
Etanercept 8.201 0.962 130,949 19,912 20,695 0.429 0.862
Certolizumab
Pegol 8.201 0.962 132,377 21,341 22,180 0.345 0.808
Infliximab 8.201 0.962 148,597 37,560 39,037 0.005 0.124
Probability of CE £20/30K = probability that the TNF-alpha inhibitor, when compared to conventional care, is a cost-effective option at the stated threshold
Table 168 - AS – Scenario 5 (rebound equal to gain)
Total
QALYs
Incremental
QALYs
Total costs
(£)
Incremental
costs (£)
ICER (£) Probability
of CE
£20K
Probability
of CE
£30K
Conventional
Therapy 10.272 - 111,187 - - - -
Certolizumab
Pegol PAS 11.043 0.771 129,139 17,953 23,290 0.217 0.891
Golimumab 11.043 0.771 130,819 19,632 25,469 0.099 0.755
Adalimumab 11.043 0.771 130,904 19,717 25,579 0.094 0.750
Etanercept 11.043 0.771 131,285 20,098 26,073 0.074 0.724
Certolizumab
Pegol 11.043 0.771 132,713 21,526 27,926 0.048 0.593
Infliximab 11.043 0.771 148,974 37,787 49,021 0.000 0.003
Probability of CE £20/30K = probability that the TNF-alpha inhibitor, when compared to conventional care, is a cost-effective option at the stated threshold

Technology Assessment Report for NICE
TNF-alpha inhibitors for ankylosing spondylitis and nr-AxSpA
12/12/2014 343
AS Scenario Results – Rebound to conventional care
Table 169 - AS – Scenario 1 (rebound to conventional care)
Total
QALYs
Incremental
QALYs
Total costs
(£)
Incremental
costs (£)
ICER (£) Probability
of CE
£20K
Probability
of CE
£30K
Conventional
Therapy
7.295 - 112,675 - - - -
Certolizumab
Pegol PAS
7.762 0.467 128,654 15,979 34,229 0.038 0.385
Golimumab 7.762 0.467 130,446 17,771 38,068 0.014 0.257
Adalimumab 7.762 0.467 130,511 17,836 38,207 0.013 0.256
Etanercept 7.762 0.467 130,799 18,124 38,824 0.010 0.245
Certolizumab
Pegol
7.762 0.467 132,228 19,553 41,885 0.004 0.161
Infliximab 7.762 0.467 144,800 32,125 68,815 0.000 0.000
Probability of CE £20/30K = probability that the TNF-alpha inhibitor, when compared to conventional care, is a cost-effective option at the stated threshold
Table 170 - AS – Scenario 2 (rebound to conventional care)
Total
QALYs
Incremental
QALYs
Total costs
(£)
Incremental
costs (£)
ICER (£) Probability
of CE
£20K
Probability
of CE
£30K
Conventional
Therapy
7.054 - 112,115 - - - -
Certolizumab
Pegol PAS
7.742 0.687 129,659 17,543 25,530 0.162 0.706
Golimumab 7.742 0.687 131,346 19,231 27,986 0.086 0.587
Adalimumab 7.742 0.687 131,430 19,315 28,107 0.082 0.586
Etanercept 7.742 0.687 131,804 19,689 28,652 0.068 0.556
Certolizumab
Pegol
7.742 0.687 133,232 21,117 30,731 0.042 0.450
Infliximab 7.742 0.687 149,253 37,138 54,045 0.000 0.004
Probability of CE £20/30K = probability that the TNF-alpha inhibitor, when compared to conventional care, is a cost-effective option at the stated threshold

Technology Assessment Report for NICE
TNF-alpha inhibitors for ankylosing spondylitis and nr-AxSpA
12/12/2014 344
Table 171 - AS – Scenario 3 (rebound to conventional care)
Total
QALYs
Incremental
QALYs
Total costs
(£)
Incremental
costs (£)
ICER (£) Probability
of CE
£20K
Probability
of CE
£30K
Conventional
Therapy 7.252 - 110,930 - - - -
Certolizumab
Pegol PAS 7.818 0.566 131,610 20,679 36,518 0.021 0.339
Golimumab 7.818 0.566 133,289 22,359 39,483 0.009 0.249
Adalimumab 7.818 0.566 133,374 22,444 39,634 0.008 0.245
Etanercept 7.818 0.566 133,755 22,824 40,306 0.006 0.230
Certolizumab
Pegol 7.818 0.566 135,183 24,253 42,828 0.003 0.166
Infliximab 7.818 0.566 151,457 40,526 71,565 0.000 0.000
Probability of CE £20/30K = probability that the TNF-alpha inhibitor, when compared to conventional care, is a cost-effective option at the stated threshold
Table 172 - AS – Scenario 4 (rebound to conventional care)
Total
QALYs
Incremental
QALYs
Total costs
(£)
Incremental
costs (£)
ICER (£) Probability
of CE
£20K
Probability
of CE
£30K
Conventional
Therapy 7.268 - 108,817 - - - -
Certolizumab
Pegol PAS 7.894 0.626 128,999 20,182 32,222 0.047 0.429
Golimumab 7.894 0.626 130,683 21,866 34,910 0.022 0.341
Adalimumab 7.894 0.626 130,767 21,951 35,045 0.020 0.339
Etanercept 7.894 0.626 131,144 22,327 35,647 0.016 0.310
Certolizumab
Pegol 7.894 0.626 132,573 23,756 37,928 0.008 0.234
Infliximab 7.894 0.626 148,706 39,889 63,684 0.000 0.000
Probability of CE £20/30K = probability that the TNF-alpha inhibitor, when compared to conventional care, is a cost-effective option at the stated threshold
Table 173 - AS – Scenario 5 (rebound to conventional care)

Technology Assessment Report for NICE
TNF-alpha inhibitors for ankylosing spondylitis and nr-AxSpA
12/12/2014 345
Total
QALYs
Incremental
QALYs
Total costs
(£)
Incremental
costs (£)
ICER (£) Probability
of CE
£20K
Probability
of CE
£30K
Conventional
Therapy 10.272 - 112,648 - - - -
Certolizumab
Pegol PAS 10.967 0.695 133,103 20,455 29,414 0.012 0.511
Golimumab 10.967 0.695 134,781 22,133 31,827 0.005 0.340
Adalimumab 10.967 0.695 134,866 22,218 31,950 0.005 0.333
Etanercept 10.967 0.695 135,248 22,600 32,499 0.004 0.300
Certolizumab
Pegol 10.967 0.695 136,677 24,028 34,554 0.002 0.165
Infliximab 10.967 0.695 152,997 40,349 58,022 0.000 0.000
Probability of CE £20/30K = probability that the TNF-alpha inhibitor, when compared to conventional care, is a cost-effective option at the stated threshold
Table 174 - Summary of cost-effectiveness scenarios – nr-axSpA population
No. Parameter/structural Approach in scenario Approach in base-case
1 Conventional care (‘placebo’)
response
No response to conventional care
assumed at 12 weeks
Response to conventional care
included at 12 weeks
2. Different baselines assumed for
responders and non-responders
and change in BASDAI/BASFI
scores
Separate baselines based on
pooled estimates provided by
manufacturers. Changes in
BASDAI/BASFI conditioned on
response also based on pooled
estimates provided by
manufacturers
Separate baselines and changes in
BASDAI/BASFI conditioned on
responses estimated via extended
synthesis model
3. BASFI Progression No effect of anti-TNFs on BASFI
progression
Treatment effect applied from
year 4 onwards
4. BASFI progression Treatment effect of anti-TNFs
applied from start of model
Treatment effect applied from
year 4 onwards
5. Utilities Linear BASDAI/BASFI model
(based on Kobelt)
Non-linear BASDAI/BASFI
model (Pfizer submission)
6. Treatment effect of anti-TNFs Trials in nr-axSpA and AS
populations combined
Only trials in nr-axSpA included

Technology Assessment Report for NICE
TNF-alpha inhibitors for ankylosing spondylitis and nr-AxSpA
12/12/2014 346
Nr-axSpA Scenario Results – Rebound equal to gain
Table 175 - Nr-axSpA – Scenario 1 (rebound equal to gain)
Total
QALYs
Incremental
QALYs
Total costs
(£)
Incremental
costs (£)
ICER (£) Probability
of CE
£20K
Probability
of CE
£30K
Conventional
Therapy 10.036 - 87,879 - - - -
Certolizumab
Pegol PAS 10.621 0.585 108,266 20,387 34,841 0.040 0.384
Adalimumab 10.621 0.585 110,046 22,167 37,884 0.015 0.248
Etanercept 10.621 0.585 110,411 22,532 38,507 0.013 0.235
Certolizumab
Pegol 10.621 0.585 111,839 23,960 40,949 0.008 0.167
Probability of CE £20/30K = probability that the TNF-alpha inhibitor, when compared to conventional care, is a cost-effective option at the stated threshold
Table 176 - Nr-axSpA – Scenario 2 (rebound equal to gain)
Total
QALYs
Incremental
QALYs
Total costs
(£)
Incremental
costs (£)
ICER (£) Probability
of CE
£20K
Probability
of CE
£30K
Conventional
Therapy 9.321 - 95,037 - - - -
Certolizumab
Pegol PAS 10.238 0.917 118,411 23,375 25,482 0.290 0.665
Adalimumab 10.238 0.917 120,081 25,044 27,302 0.219 0.622
Etanercept 10.238 0.917 120,556 25,520 27,821 0.200 0.603
Certolizumab
Pegol 10.238 0.917 121,985 26,948 29,378 0.160 0.555
Probability of CE £20/30K = probability that the TNF-alpha inhibitor, when compared to conventional care, is a cost-effective option at the stated threshold

Technology Assessment Report for NICE
TNF-alpha inhibitors for ankylosing spondylitis and nr-AxSpA
12/12/2014 347
Table 177 - Nr-axSpA – Scenario 3 (rebound equal to gain)
Total
QALYs
Incremental
QALYs
Total costs
(£)
Incremental
costs (£)
ICER (£) Probability
of CE
£20K
Probability
of CE
£30K
Conventional
Therapy 9.891 - 91,479 - - - -
Certolizumab
Pegol PAS 11.262 1.370 130,734 39,254 28,643 0.138 0.576
Adalimumab 11.262 1.370 132,141 40,662 29,670 0.102 0.528
Etanercept 11.262 1.370 132,879 41,399 30,208 0.093 0.505
Certolizumab
Pegol 11.262 1.370 134,306 42,827 31,250 0.076 0.460
Probability of CE £20/30K = probability that the TNF-alpha inhibitor, when compared to conventional care, is a cost-effective option at the stated threshold
Table 178 - Nr-axSpA – Scenario 4 (rebound equal to gain)
Total
QALYs
Incremental
QALYs
Total costs
(£)
Incremental
costs (£)
ICER (£) Probability
of CE
£20K
Probability
of CE
£30K
Conventional
Therapy 9.923 - 90,625 - - - -
Certolizumab
Pegol PAS 11.338 1.415 129,492 38,867 27,471 0.154 0.627
Adalimumab 11.338 1.415 130,899 40,274 28,466 0.127 0.574
Etanercept 11.338 1.415 131,637 41,012 28,988 0.116 0.549
Certolizumab
Pegol 11.338 1.415 133,064 42,440 29,996 0.087 0.501
Probability of CE £20/30K = probability that the TNF-alpha inhibitor, when compared to conventional care, is a cost-effective option at the stated threshold

Technology Assessment Report for NICE
TNF-alpha inhibitors for ankylosing spondylitis and nr-AxSpA
12/12/2014 348
Table 179 - Nr-axSpA – Scenario 5 (rebound equal to gain)
Total
QALYs
Incremental
QALYs
Total costs
(£)
Incremental
costs (£)
ICER (£) Probability
of CE
£20K
Probability
of CE
£30K
Conventional
Therapy 10.973 - 89,400 - - - -
Certolizumab
Pegol PAS 12.527 1.554 128,760 39,361 25,324 0.120 0.781
Adalimumab 12.527 1.554 130,165 40,765 26,227 0.086 0.725
Etanercept 12.527 1.554 130,905 41,506 26,704 0.071 0.692
Certolizumab
Pegol 12.527 1.554 132,333 42,933 27,622 0.053 0.629
Probability of CE £20/30K = probability that the TNF-alpha inhibitor, when compared to conventional care, is a cost-effective option at the stated threshold
Table 180 - Nr-axSpA – Scenario 6 (rebound equal to gain)
Total
QALYs
Incremental
QALYs
Total costs
(£)
Incremental
costs (£)
ICER (£) Probability
of CE
£20K
Probability
of CE
£30K
Conventional
Therapy 9.944 - 88,563 - - - -
Certolizumab
Pegol PAS 11.382 1.437 129,592 41,030 28,282 0.068 0.612
Adalimumab 11.382 1.437 130,978 42,415 29,228 0.040 0.570
Etanercept 11.382 1.437 131,737 43,175 29,753 0.032 0.546
Certolizumab
Pegol 11.382 1.437 133,165 44,602 30,732 0.020 0.483
Probability of CE £20/30K = probability that the TNF-alpha inhibitor, when compared to conventional care, is a cost-effective option at the stated threshold

Technology Assessment Report for NICE
TNF-alpha inhibitors for ankylosing spondylitis and nr-AxSpA
12/12/2014 349
Nr-axSpA Scenario Results – Rebound to conventional care
Table 181 - Nr-axSpA – Scenario 1 (rebound to conventional care)
Total
QALYs
Incremental
QALYs
Total costs
(£)
Incremental
costs (£)
ICER (£) Probability
of CE
£20K
Probability
of CE
£30K
Conventional
Therapy 10.007 - 88,711 - - - -
Certolizumab
Pegol PAS 10.524 0.517 109,867 21,156 40,928 0.018 0.236
Adalimumab 10.524 0.517 111,644 22,932 44,365 0.002 0.143
Etanercept 10.524 0.517 112,012 23,301 45,078 0.002 0.130
Certolizumab
Pegol 10.524 0.517 113,441 24,729 47,842 0.001 0.090
Probability of CE £20/30K = probability that the TNF-alpha inhibitor, when compared to conventional care, is a cost-effective option at the stated threshold
Table 182 - Nr-axSpA – Scenario 2 (rebound to conventional care)
Total
QALYs
Incremental
QALYs
Total costs
(£)
Incremental
costs (£)
ICER (£) Probability
of CE
£20K
Probability
of CE
£30K
Conventional
Therapy 9.277 - 95,300 - - - -
Certolizumab
Pegol PAS 10.088 0.811 119,550 24,249 29,884 0.168 0.506
Adalimumab 10.088 0.811 121,219 25,919 31,942 0.124 0.454
Etanercept 10.088 0.811 121,695 26,394 32,528 0.108 0.425
Certolizumab
Pegol 10.088 0.811 123,123 27,823 34,288 0.086 0.383
Probability of CE £20/30K = probability that the TNF-alpha inhibitor, when compared to conventional care, is a cost-effective option at the stated threshold

Technology Assessment Report for NICE
TNF-alpha inhibitors for ankylosing spondylitis and nr-AxSpA
12/12/2014 350
Table 183 - Nr-axSpA – Scenario 3 (rebound to conventional care)
Total
QALYs
Incremental
QALYs
Total costs
(£)
Incremental
costs (£)
ICER (£) Probability
of CE
£20K
Probability
of CE
£30K
Conventional
Therapy 9.891 - 91,602 - - - -
Certolizumab
Pegol PAS 11.066 1.175 132,047 40,445 34,416 0.052 0.396
Adalimumab 11.066 1.175 133,456 41,854 35,615 0.036 0.348
Etanercept 11.066 1.175 134,192 42,590 36,241 0.031 0.330
Certolizumab
Pegol 11.066 1.175 135,620 44,017 37,456 0.026 0.290
Probability of CE £20/30K = probability that the TNF-alpha inhibitor, when compared to conventional care, is a cost-effective option at the stated threshold
Table 184 - Nr-axSpA – Scenario 4 (rebound to conventional care)
Total
QALYs
Incremental
QALYs
Total costs
(£)
Incremental
costs (£)
ICER (£) Probability
of CE
£20K
Probability
of CE
£30K
Conventional
Therapy 9.948 - 90,402 - - - -
Certolizumab
Pegol PAS 11.223 1.275 131,015 40,613 31,841 0.063 0.456
Adalimumab 11.223 1.275 132,416 42,014 32,940 0.047 0.415
Etanercept 11.223 1.275 133,160 42,758 33,523 0.040 0.395
Certolizumab
Pegol 11.223 1.275 134,587 44,185 34,642 0.027 0.337
Probability of CE £20/30K = probability that the TNF-alpha inhibitor, when compared to conventional care, is a cost-effective option at the stated threshold

Technology Assessment Report for NICE
TNF-alpha inhibitors for ankylosing spondylitis and nr-AxSpA
12/12/2014 351
Table 185 - Nr-axSpA – Scenario 5 (rebound to conventional care)
Total
QALYs
Incremental
QALYs
Total costs
(£)
Incremental
costs (£)
ICER (£) Probability
of CE
£20K
Probability
of CE
£30K
Conventional
Therapy
10.975 - 90,413 - - - -
Certolizumab
Pegol PAS
12.462 1.487 130,404 39,991 26,900 0.069 0.678
Adalimumab 12.462 1.487 131,817 41,404 27,850 0.050 0.599
Etanercept 12.462 1.487 132,549 42,136 28,343 0.042 0.572
Certolizumab
Pegol
12.462 1.487 133,976 43,563 29,303 0.028 0.498
Probability of CE £20/30K = probability that the TNF-alpha inhibitor, when compared to conventional care, is a cost-effective option at the stated threshold
Table 186 - Nr-axSpA – Scenario 6 (rebound to conventional care)
Total
QALYs
Incremental
QALYs
Total costs
(£)
Incremental
costs (£)
ICER (£) Probability
of CE
£20K
Probability
of CE
£30K
Conventional
Therapy 9.953 - 89,196 - - - -
Certolizumab
Pegol PAS 11.228 1.275 131,515 42,319 33,184 0.013 0.398
Adalimumab 11.228 1.275 132,901 43,704 34,270 0.007 0.353
Etanercept 11.228 1.275 133,661 44,464 34,866 0.002 0.332
Certolizumab
Pegol 11.228 1.275 135,088 45,891 35,985 0.001 0.284
Additional validation scenarios assuming same baselines for responders and non-responders

Technology Assessment Report for NICE
TNF-alpha inhibitors for ankylosing spondylitis and nr-AxSpA
12/12/2014 352
Table 187 - AS – rebound equal to gain
Total
QALYs
Incremental
QALYs
Total costs
(£)
Incremental
costs (£)
ICER (£) Probability
of CE
£20K
Probability
of CE
£30K
Conventional
Therapy 7.262 - 111,636 - - - -
Certolizumab
Pegol PAS 8.317 1.054 126,238 14,601 13,851 0.803 0.975
Golimumab 8.317 1.054 127,917 16,281 15,444 0.732 0.958
Adalimumab 8.317 1.054 128,002 16,366 15,525 0.730 0.958
Etanercept 8.317 1.054 128,383 16,746 15,886 0.708 0.952
Certolizumab
Pegol 8.317 1.054 129,811 18,175 17,241 0.645 0.931
Infliximab 8.317 1.054 146,079 34,443 32,673 0.044 0.376
Probability of CE £20/30K = probability that the TNF-alpha inhibitor, when compared to conventional care, is a cost-effective option at the stated threshold
Table 188 - AS –rebound to conventional care
Total
QALYs
Incremental
QALYs
Total costs
(£)
Incremental
costs (£)
ICER (£) Probability
of CE
£20K
Probability
of CE
£30K
Conventional
Therapy 7.274 - 109,511 - - - -
Certolizumab
Pegol PAS 7.958 0.684 127,164 17,654 25,809 0.277 0.632
Golimumab 7.958 0.684 128,850 19,339 28,273 0.183 0.554
Adalimumab 7.958 0.684 128,934 19,423 28,396 0.178 0.550
Etanercept 7.958 0.684 129,309 19,799 28,945 0.165 0.534
Certolizumab
Pegol 7.958 0.684 130,738 21,227 31,034 0.107 0.473
Infliximab 7.958 0.684 146,808 37,298 54,528 0.000 0.010
Probability of CE £20/30K = probability that the TNF-alpha inhibitor, when compared to conventional care, is a cost-effective option at the stated threshold

Technology Assessment Report for NICE
TNF-alpha inhibitors for ankylosing spondylitis and nr-AxSpA
12/12/2014 353
Table 189 - Nr-axSpA – rebound equal to gain
Total
QALYs
Incremental
QALYs
Total costs
(£)
Incremental
costs (£)
ICER (£) Probability
of CE
£20K
Probability
of CE
£30K
Conventional
Therapy 9.977 - 88,692 - - - -
Certolizumab
Pegol PAS 11.551 1.574 125,205 36,513 23,199 0.390 0.759
Adalimumab 11.551 1.574 126,606 37,914 24,089 0.341 0.733
Etanercept 11.551 1.574 127,350 38,658 24,562 0.319 0.720
Certolizumab
Pegol 11.551 1.574 128,777 40,085 25,469 0.272 0.702
Probability of CE £20/30K = probability that the TNF-alpha inhibitor, when compared to conventional care, is a cost-effective option at the stated threshold
Table 190 - Nr-axSpA – rebound to conventional care
Total
QALYs
Incremental
QALYs
Total costs
(£)
Incremental
costs (£)
ICER (£) Probability
of CE
£20K
Probability
of CE
£30K
Conventional
Care
10.030 - 88,389 - - - -
Certolizumab
Pegol PAS
11.391 1.361 126,116 37,727 27,721 0.218 0.617
Adalimumab 11.391 1.361 127,525 39,136 28,756 0.176 0.586
Etanercept 11.391 1.361 128,261 39,872 29,297 0.160 0.574
Certolizumab
Pegol
11.391 1.361 129,689 41,299 30,345 0.133 0.537
Probability of CE £20/30K = probability that the TNF-alpha inhibitor, when compared to conventional care, is a cost-effective option at the stated threshold

12/12/2014 354
References
1. Technology Appraisal TA143: Ankylosing spondylitis - adalimumab, etanercept and infliximab.
London: National Institute for Health and Clinical Excellence (NICE); 2008. Available from:
http://www.nice.org.uk/TA143
2. Technology Appraisal TA233: Ankylosing spondylitis - golimumab. London: National Institute for
Health and Clinical Excellence (NICE); 2011. Available from: http://guidance.nice.org.uk/TA233
3. Lipton SA, Deodhar. The new ASAS classification criteria for axial and peripheral
spondyloarthritis. International Journal of Clinical Rheumatology 2012;7:675-82.
4. Sieper J, Rudwaleit M, Baraliakos X, Brandt J, Braun J, Burgos-Vargas R, et al. The Assessment of
SpondyloArthritis international Society (ASAS) handbook: a guide to assess spondyloarthritis. Ann
Rheum Dis 2009;68:1-44.
5. Rudwaleit M, van der Heijde D, Landewe R, Listing J, Akkoc N, Brandt J, et al. The development
of Assessment of SpondyloArthritis International Society classification criteria for axial
spondyloarthritis (part II): validation and final selection. Ann Rheum Dis 2009;68:777-83.
6. Vanderlinden S, Valkenburg HA, Cats A. Evaluation of diagnostic-criteria for ankylosing-
spondylitis - a proposal for modification of the New York criteria. Arthritis Rheum 1984;27:361-8.
7. Goh L, Samanta A. Update on biologic therapies in ankylosing spondylitis: a literature review.
International Journal of Rheumatic Diseases 2012;15:445-54.
8. Robinson PC, Wordsworth BP, Reveille JD, Brown MA. Viewpoint Axial spondyloarthritis: a new
disease entity, not necessarily early ankylosing spondylitis. Ann Rheum Dis 2013;72:162-4.
9. van Tubergen A, Weber U. Diagnosis and classification in spondyloarthritis: identifying a
chameleon. Nature Reviews Rheumatology 2012;8:253-61.
10. Deodhar A. Rheumatologists make progress defining spectrum of axial spondyloarthritis. The
Rheumatologist 2014;May.
11. National Ankylosing Spondylitis Society (NASS) website. National Ankylosing Spondylitis
Society; [cited 2014 Dec 11]. Available from: http://nass.co.uk/.
12. Landewe R, Dougados M, Mielants H, van der Tempel H, van der Heijde D. Physical function in
ankylosing spondylitis is independently determined by both disease activity and radiographic damage
of the spine. Ann Rheum Dis 2009;68:863-7.
13. Braun J, Sieper J. Ankylosing spondylitis. Lancet 2007;369:1379-90.
14. Baraliakos X, Listing J, von der Recke A, Braun J. The natural course of radiographic progression
in ankylosing spondylitis - evidence for major individual variations in a large proportion of patients. J
Rheumatol 2009;36:997-1002.
15. Healey EL, Haywood KL, Jordan KP, Garratt AM, Packham JC. Disease severity in ankylosing
spondylitis: Variation by region and local area deprivation. J Rheumatol 2010;37:633-8.
16. Healey EL, Haywood KL, Jordan KP, Garratt AM, Packham JC. Patients with well-established
ankylosing spondylitis show limited deterioration in a ten-year prospective cohort study. Clin
Rheumatol 2013;32:67-72.
17. Callhoff J, Sieper J, Weiss A, Zink A, Listing J. Efficacy of TNFalpha blockers in patients with
ankylosing spondylitis and non-radiographic axial spondyloarthritis: a meta-analysis. Ann Rheum Dis
2014.

Technology Assessment Report for NICE
TNF-alpha inhibitors for ankylosing spondylitis and nr-AxSpA
12/12/2014 355
18. Bakland G, Gran JT, Nossent JC. Increased mortality in ankylosing spondylitis is related to
disease activity. Ann Rheum Dis 2011;70:1921-5.
19. Rudwaleit M, Haibel H, Baraliakos X, Listing J, Marker-Hermann E, Zeidler H, et al. The early
disease stage in axial spondylarthritis results from the german spondyloarthritis inception cohort.
Arthritis Rheum 2009;60:717-27.
20. Reveille JD, Sims A-M, Danoy P, Evans DM, Leo P, Pointon JJ, et al. Genome-wide association
study of ankylosing spondylitis identifies non-MHC susceptibility loci. Nat Genet 2010;42:123-U47.
21. NHS Choices website: Ankylosing spondylitis NHS Choices; [cited 2014 29 April]. Available
from: http://www.nhs.uk/conditions/Ankylosing-spondylitis/Pages/Introduction.aspx.
22. Reveille JD, Weisman MH. The epidemiology of back pain, axial spondyloarthritis and HLA-B27
in the United States. Am J Med Sci 2013;345:431-6.
23. Sieper J, van der Heijde D. Review: Nonradiographic axial spondyloarthritis: New definition of an
old disease? Arthritis Rheum 2013;65:543-51.
24. NICE Clinical Knowledge Summaries website: Ankylosing spondylitis: Prevalence. NICE; [cited
2014 29 April]. Available from: http://cks.nice.org.uk/ankylosing-spondylitis#!backgroundsub:2.
25. Machado P, Landewe R, Braun J, Hermann KG, Baraliakos X, Baker D, et al. A stratified model
for health outcomes in ankylosing spondylitis. Ann Rheum Dis 2011;70:1758-64.
26. Wanders AJB, Landewe RBM, Spoorenberg A, Dougados M, van der Linden S, Mielants H, et al.
What is the most appropriate radiologic scoring method for ankylosing spondylitis? Arthritis Rheum
2004;50:2622-32.
27. Hróbjartsson A. What are the main methodological problems in the estimation of placebo effects?
J Clin Epidemiol 2002;55:430-5.
28. Hawkins N, Scott DA. Cost-effectiveness analysis: Discount the placebo at your peril. Med Decis
Making 2010;30:536-43.
29. Cooksey R, Brophy S, Gravenor MB, Brooks CJ, Burrows CL, Siebert S. Frequency and
characteristics of disease flares in ankylosing spondylitis. Rheumatology 2010;49:929-32.
30. Hróbjartsson A, Gøtzsche PC. Placebo interventions for all clinical conditions. Cochrane
Database of Systematic Reviews 2010;Issue 1. Art. No.: CD003974. DOI:
10.1002/14651858.CD003974.pub3.
31. Braun J, van den Berg R, Baraliakos X, Boehm H, Burgos-Vargas R, Collantes-Estevez E, et al.
2010 update of the ASAS/EULAR recommendations for the management of ankylosing spondylitis.
Ann Rheum Dis 2011;70:896-904.
32. Dagfinrud H, Hagen KB, Kvien TK. Physiotherapy interventions for ankylosing spondylitis.
Cochrane Database of Systematic Reviews 2008;Issue 1. Art. No.: CD002822. DOI:
10.1002/14651858.CD002822.pub3.
33. Looking ahead: best practice for the care of people with ankylosing spondylitis (AS). Richmond:
National Ankylosing Spondylitis Society (NASS); 2013. Available from:
http://nass.co.uk/download/515d4a83bbbfd
34. McLeod C, Bagust A, Boland A, Dagenais P, Dickson R, Dundar Y, et al. Adalimumab,
etanercept and infliximab for the treatment of ankylosing spondylitis: a systematic review and
economic evaluation. Health Technol Assess 2007;11:1-158, iii-iv.
35. Higgins JPT, Altman DG, Gotzsche PC, Jueni P, Moher D, Oxman AD, et al. The Cochrane
Collaboration's tool for assessing risk of bias in randomised trials. BMJ 2011;343.
36. Corbett MS, Higgins JPT, Woolacott NF. Assessing baseline imbalance in randomised trials:
implications for the Cochrane risk of bias tool. Research Synthesis Methods 2014;5:79-85.

Technology Assessment Report for NICE
TNF-alpha inhibitors for ankylosing spondylitis and nr-AxSpA
12/12/2014 356
37. Pedersen SJ, Sorensen IJ, Loft AG, Hindrup JS, Thamsborg G, Asmussen K, et al. Efficacy of
adalimumab in patients with axial spondyloarthritis: Results of an investigator-initiated 12-weeks
randomized double-blind placebo controlled trial with a 12 weeks open-label extension phase. In:
Annual European Congress of Rheumatology of the European League Against Rheumatism, EULAR
2013. Madrid; 2013. p. THU0366 p.289.
38. Sieper J, Lenaerts J, Wollenhaupt J, Rudwaleit M, Mazurov VI, Myasoutova L, et al. Efficacy and
safety of infliximab plus naproxen versus naproxen alone in patients with early, active axial
spondyloarthritis: results from the double-blind, placebo-controlled INFAST study, Part 1. Ann
Rheum Dis 2014;73:101-7.
39. A Study to Evaluate the NSAIDS Sparing Effect of Etanercept in Subjects With Axial
Spondyloarthritis. In. Available from: http://ClinicalTrials.gov/show/NCT01298531
40. Danish Multicenter Study of Adalimumab in Spondyloarthritis. In. Available from:
http://ClinicalTrials.gov/show/NCT00477893
41. Effect of Golimumab in Participants With Active Axial Spondyloarthritis (P07642 AM2). In.
Available from: http://ClinicalTrials.gov/show/NCT01453725
42. Brandt J, Khariouzov A, Listing J, Haibel H, Sorensen H, Grassnickel L, et al. Six-month results
of a double-blind, placebo-controlled trial of etanercept treatment in patients with active ankylosing
spondylitis. Arthritis Rheum 2003;48:1667-75.
43. Zhang J, Huang F, Chen SL, Gu JR, Li ZG, Wu DH, et al. A multicenter, double-blind, placebo-
controlled, randomized III clinical study of etanercept in the treatment of Chinese subjects with active
ankylosing spondylitis. International Journal of Rheumatic Diseases 2010;13:151.
44. Zhang J, Zhang YM, Zhang JL, Deng XH, Huang F. Efficacy of etanercept in patients with
ankylosing spondylitis: A double-blind, randomized, placebo controlled trial. [Chinese]. Chinese
Journal of New Drugs 2009;18:1846-9+81.
45. Inman RD, Maksymowych WP, Candle Study Group. A double-blind, placebo-controlled trial of
low dose infliximab in ankylosing spondylitis. J Rheumatol 2010;37:1203-10.
46. Landewe R, Braun J, Deodhar A, Dougados M, Maksymowych WP, Mease PJ, et al. Efficacy of
certolizumab pegol on signs and symptoms of axial spondyloarthritis including ankylosing
spondylitis: 24-week results of a double-blind randomised placebo-controlled Phase 3 study. Ann
Rheum Dis 2014;73:39-47.
47. Davis JC, Jr., Van Der Heijde D, Braun J, Dougados M, Cush J, Clegg DO, et al. Recombinant
human tumor necrosis factor receptor (etanercept) for treating ankylosing spondylitis: a randomized,
controlled trial. Arthritis Rheum 2003;48:3230-6.
48. Calin A, Dijkmans BA, Emery P, Hakala M, Kalden J, Leirisalo-Repo M, et al. Outcomes of a
multicentre randomised clinical trial of etanercept to treat ankylosing spondylitis. Ann Rheum Dis
2004;63:1594-600.
49. Gorman JD, Sack KE, Davis JC, Jr. Treatment of ankylosing spondylitis by inhibition of tumor
necrosis factor alpha. N Engl J Med 2002;346:1349-56.
50. Marzo-Ortega H, McGonagle D, Jarrett S, Haugeberg G, Hensor E, O'Connor P, et al. Infliximab
in combination with methotrexate in active ankylosing spondylitis: a clinical and imaging study. Ann
Rheum Dis 2005;64:1568-75.
51. van der Heijde D, Da Silva JC, Dougados M, Geher P, van der Horst-Bruinsma I, Juanola X, et al.
Etanercept 50 mg once weekly is as effective as 25 mg twice weekly in patients with ankylosing
spondylitis. Ann Rheum Dis 2006;65:1572-7.
52. Sieper J, Van Der Heijde D, Dougados M, Mease PJ, Brown LS, Pangan A. Efficacy and safety of
adalimumab in patients with non-radiographic axial spondyloarthritis results from a phase 3 study
[abstract]. Arthritis Rheum 2011;63 Suppl 10:2486A.

Technology Assessment Report for NICE
TNF-alpha inhibitors for ankylosing spondylitis and nr-AxSpA
12/12/2014 357
53. Bao C, Huang F, Khan MA, Fei K, Wu Z, Han C, et al. Safety and efficacy of golimumab in
Chinese patients with active ankylosing spondylitis: 1-year results of a multicentre, randomized,
double-blind, placebo-controlled phase III trial. Rheumatology (Oxford, England) 2014;53:1654-63.
54. Dougados M. Symptomatic efficacy of etanercept and its effects on objective signs of
inflammation in early nonradiographic axial spondyloarthritis: a multicenter, randomized, double-
blind, placebo-controlled trial. Arthritis and Rheumatology 2014;66:2091–102.
55. Haibel H, Rudwaleit M, Listing J, Heldmann F, Wong RL, Kupper H, et al. Efficacy of
adalimumab in the treatment of axial spondylarthritis without radiographically defined sacroiliitis:
results of a twelve-week randomized, double-blind, placebo-controlled trial followed by an open-label
extension up to week fifty-two. Arthritis Rheum 2008;58:1981-91.
56. Barkham N, Keen HI, Coates LC, O'Connor P, Hensor E, Fraser AD, et al. Clinical and imaging
efficacy of infliximab in HLA-B27-Positive patients with magnetic resonance imaging-determined
early sacroiliitis.[Erratum appears in Arthritis Rheum. 2010 Oct;62(10):3005]. Arthritis Rheum
2009;60:946-54.
57. Haibel H, Rudwaleit M, Heldmann F, Listing J, Wong R, Kupper H, et al. Adalimumab is
effective in patients with preradiographic axial spondyloarthritis: Results of a 12-week, randomized
controlled trial. Rheumatology 2007;46:I52.
58. Haibel H, Rudwaleit M, Heldmann F, Listing J, Wong R, Kupper H, et al. Efficacy of adalimumab
in the treatment of preradiographic axial spondyloarthritis: Results of a 12-week, randomized
controlled trial. Arthritis Rheum 2006;54:4044-5.
59. Hu Z, Xu M, Li Q, Lin Z, Liao Z, Cao S, et al. Adalimumab significantly reduces inflammation
and serum DKK-1 level but increases fatty deposition in lumbar spine in active ankylosing
spondylitis.[Erratum appears in Int J Rheum Dis. 2012 Dec;15(6):564]. International Journal of
Rheumatic Diseases 2012;15:358-65.
60. Huang F, Gu J, Zhu P, Bao C, Xu J, Xu H, et al. Efficacy and safety of adalimumab in Chinese
adults with active ankylosing spondylitis: results of a randomised, controlled trial. Ann Rheum Dis
2014;73:587-94.
61. Lambert RG, Salonen D, Rahman P, Inman RD, Wong RL, Einstein SG, et al. Adalimumab
significantly reduces both spinal and sacroiliac joint inflammation in patients with ankylosing
spondylitis: a multicenter, randomized, double-blind, placebo-controlled study. Arthritis Rheum
2007;56:4005-14.
62. Maksymowych WP, Mease PJ, Rao S, Pangan A, Brown LS, Arora V, et al. Effect of adalimumab
on function, health-related quality of life, work productivity, and daily activities in patients with non-
radiographic axial spondyloarthritis [abstract]. Arthritis Rheum 2011;63 Suppl 10:1312.
63. van der Heijde D, Kivitz A, Schiff MH, Sieper J, Dijkmans BA, Braun J, et al. Efficacy and safety
of adalimumab in patients with ankylosing spondylitis: results of a multicenter, randomized, double-
blind, placebo-controlled trial. Arthritis Rheum 2006;54:2136-46.
64. Davis JC, Jr., Revicki D, van der Heijde DM, Rentz AM, Wong RL, Kupper H, et al. Health-
related quality of life outcomes in patients with active ankylosing spondylitis treated with
adalimumab: results from a randomized controlled study. Arthritis Rheum 2007;57:1050-7.
65. Davis J, Kivitz A, Schiff M, Sieper J, Dijkmans B, Braun J, et al. Major clinical response and
partial remission in ankylosing spondylitis subjects treated with adalimumab: The ATLAS trial.
Arthritis Rheum 2005;52:S208-9.
66. van der Heijde D, Maksymowych WP, Landewe R, Stach C, Hoepken B, Fichtner A, et al. Effect
of certolizumab pegol on inflammation of spine and sacroiliac joints in patients with axial
spondyloarthritis: 12-week magnetic resonance imaging results of rapid-axSpA study. Ann Rheum Dis
2013;72:A515-6.

Technology Assessment Report for NICE
TNF-alpha inhibitors for ankylosing spondylitis and nr-AxSpA
12/12/2014 358
67. Sieper J, Kivitz A, Van Tubergen A, Deodhar A, Coteur G, Woltering F, et al. Rapid
improvements in patient-reported outcomes with certolizumab pegol in patients with axial
spondyloarthritis, including ankylosing spondylitis: 24-week results of rapid-axSpA study. Ann
Rheum Dis 2013;72 Supplement 3:A287.
68. Landewe R, Rudwaleit M, van der Heijde D, Dougados M, Maksymowych WP, Braun J, et al.
Effect of certolizumab pegol on signs and symptoms of axial spondyloarthritis, including ankylosing
spondylitis and non-radiographic axial spondyloarthritis: 24-week results of rapid-axSpA study. Ann
Rheum Dis 2013;72:OP0106 A86-A87.
69. Sieper J, Kivitz A, Van Tubergen A, Deodhar A, Coteur G, Woltering F, et al. Rapid
improvements in patient-reported outcomes with certolizumab pegol in patients with axial
spondyloarthritis, including ankylosing spondylitis and non-radiographic axial spondyloarthritis: 24-
week results of a phase 3 double blind randomized placebo-controlled study. Value Health
2013;16:A227.
70. Landewe RBM, Rudwaleit M, van der Heijde D, Dougados M, Maksymowych WP, Braun J, et al.
Effect of certolizumab pegol on signs and symptoms of ankylosing spondyltitis and non-radiographic
axial spondyloarthritis: 24 week results of a double blind randomized placebo-controlled phase 3 axial
spondyloarthritis study. Arthritis Rheum 2012;64:S336-7.
71. Sieper J, Kivitz AJ, Van Tubergen AM, Deodhar AA, Coteur G, Woltering F, et al. Rapid
improvements in patient reported outcomes with certolizumab pegol in patients with axial
spondyloarthritis, including ankylosing spondyltitis and non-radiographic axial spondyloarthritis: 24
week results of a phase 3 double blind randomized placebo-controlled study. Arthritis Rheum
2012;64:S243.
72. Barkham N, Coates LC, Keen H, Hensor E, Fraser A, Redmond A, et al. Double-blind placebo-
controlled trial of etanercept in the prevention of work disability in ankylosing spondylitis.[Erratum
appears in Ann Rheum Dis. 2011 Aug;70(8):1519]. Ann Rheum Dis 2010;69:1926-8.
73. Davis JC, van der Heijde D, Braun J, Dougados M, Cush JJ, Clegg DO, et al. Etanercept
(ENBREL (R)) improves signs and symptoms of ankylosing spondylitis: Results of a phase 3
multicenter clinical trial. Ann Rheum Dis 2003;62 Supplement 1:65.
74. Dougados M, Braun J, Szanto S, Combe B, Elbaz M, Geher P, et al. Efficacy of etanercept on
rheumatic signs and pulmonary function tests in advanced ankylosing spondylitis: results of a
randomised double-blind placebo-controlled study (SPINE).[Erratum appears in Ann Rheum Dis.
2011 Jul;70(7):1349]. Ann Rheum Dis 2011;70:799-804.
75. Dougados M, Braun J, Szanto S, Combe B, Elbaz M, Geher P, et al. Efficacy of etanercept on
rheumatic signs and pulmonary function tests in advanced ankylosing spondylitis. Results of a
randomized double blind placebo-controlled study (SPINE). Arthritis Rheum 2009;60:524.
76. Dougados M, van der Heijde D, Sieper J, Braun J, Maksymowych WP, Citera G, et al. Clinical
and imaging efficacy of etanercept in early non-radiographic axial spondyloarthritis: A 12-week,
randomized, double-blind, placebo-controlled trial. Ann Rheum Dis 2013;72:OP0108 A87-88.
77. Dougados M, Tsai WC, Saaibi DL, Bonin R, Bukowski J, Pedersen R, et al. Patient-reported
outcomes of etanercept in early non-radiographic axial spondyloarthritis: A 12-week, randomized,
double-blind, placebo-controlled trial. Arthritis Rheum 2013;65:S656-7.
78. Gorman JD, Sack KE, Davis JC. Efficacy of etanercept (Enbrel (R)) in the treatment of
ankylosing spondylitis: A randomized, placebo-controlled, double-blind study. Arthritis Rheum
2001;44:2947.
79. Gorman JD, Sack KE, Davis JC. A randomized, double-blind, placebo-controlled trial of (Enbrel
(R)) in the treatment of Ankylosing Spondylitis. Arthritis Rheum 2001;44:S90.
80. Gorman JD, Sack KE, Davis JC. Etanercept in the treatment of ankylosing spondylitis: A
randomized, double-blind, placebo-controlled study. Arthritis Rheum 2000;43:S403.

Technology Assessment Report for NICE
TNF-alpha inhibitors for ankylosing spondylitis and nr-AxSpA
12/12/2014 359
81. Calin A, Dijkmans B, Emery P, Hakala M, Kalden J, Leirisalo-Repo M, et al. Assessments of
disease activity and functionality by Enbrel-treated ankylosing spondylitis patients in a multicenter,
placebo-controlled trial. Arthritis Rheum 2003;48:S172.
82. Calin A, Dijkmans B, Emery P, Hakala M, Kalden J, Leirisalo-Repo M, et al. A multicentre,
placebo-controlled trial of enbrel in ankylosing spondylitis. Ann Rheum Dis 2003;62: OP0097 p.95.
83. Braun J, McHugh N, Singh A, Wajdula JS, Sato R. Improvement in patient-reported outcomes for
patients with ankylosing spondylitis treated with etanercept 50 mg once-weekly and 25 mg twice-
weekly. Rheumatology 2007;46:999-1004.
84. Giardina AR, Ferrante A, Ciccia F, Impastato R, Miceli MC, Principato A, et al. A 2-year
comparative open label randomized study of efficacy and safety of etanercept and infliximab in
patients with ankylosing spondylitis. Rheumatol Int 2010;30:1437-40.
85. Impastato R, Ciccia F, Ferrante A, Principato A, Giardina A, Cadelo M, et al. Infliximab and
etanercept are both effective and safe in patients with ankylosing spondylitis. A two-year randomised
study. Ann Rheum Dis 2007;66:399.
86. Inman RD, Davis JC, Jr., van der Heijde D, Diekman L, Sieper J, Kim SI, et al. Efficacy and
safety of golimumab in patients with ankylosing spondylitis: results of a randomized, double-blind,
placebo-controlled, phase III trial. Arthritis Rheum 2008;58:3402-12.
87. Braun J, Davis J, Van Der Heijde D, Deodhar A, Diekman L, Sieper J, et al. Golimumab, a new,
human, TNFA antibody, in ankylosing spondylitis: 24-week efficacy and safety results of the
gogolimumab, a new, human, a antibody, in ankylosing spondylitis: 24-week efficacy and safety
results of the go-raise study. Intern Med J 2009;39:A56.
88. Braun J, Davis J, Van Der Heijde D, Deodhar A, Diekman L, Sieper J, et al. Golimumab, a new,
human, TNFalpha antibody, in ankylosing spondylitis (AS): 24-week efficacy and safety results of the
go-raise study. Rheumatology 2009;48:i57.
89. Braun J, Davis JC, van der Heijde D, Diekman L, Sieper J, Kim SI, et al. Golimumab, a new,
human, TNF-alpha antibody administered subcutaneously every 4 weeks, in ankylosing spondylitis:
24-week efficacy and safety results of the randomized, placebo-controlled GO-RAISE study. Clin Exp
Rheumatol 2008;26:747.
90. Braun J, Davis JC, Van der Heijde D, Diekman L, Sieper J, Kim SI, et al. Golimumab, a new,
human, TNF-alpha antibody administered as a monthly subcutaneous injection in ankylosing
spondylitis (AS): 24-week efficacy and safety results of the randomized, placebocontrolled GO-
RAISE study. Arthritis Rheum 2007;56:4236-7.
91. Bao C, Huang F, Khan MA, Fei K, Wu Z, Hsia EC. Golimumab administered subcutaneously
every 4 weeks in chinese patients with active ankylosing spondylitis: Week 24 safety and efficacy
results from a randomized, placebo-controlled study. Arthritis Rheum 2012;64:S589.
92. Tam L-S, Shang Q, Kun EW, Lee K-L, Yip M-L, Li M, et al. The effects of golimumab on
subclinical atherosclerosis and arterial stiffness in ankylosing spondylitis—a randomized, placebo-
controlled pilot trial. Rheumatology 2014;53:1065-74.
93. Barkham N, Keen HI, Coates LC, O'Connor P, Hensor EMA, Fraser A, et al. A randomized
controlled trial of infliximab shows clinical and MRI efficacy in HLA B27 positive very early
ankylosing spondylitis. Clin Exp Rheumatol 2008;26:745.
94. Braun J, Brandt J, Listing J, Zink A, Alten R, Golder W, et al. Treatment of active ankylosing
spondylitis with infliximab: a randomised controlled multicentre trial. Lancet 2002;359:1187-93.
95. Brandt J, Listing I, Alten R, Krause A, Gromnica-Ihle E, Kellner H, et al. Quality of life
improvement in patients with severe ankylosing spondylitis upon treatment with the anti-TNF alpha
antibody infliximab in a placebo controlled multicenter trial. Arthritis Rheum 2001;44:S89.

Technology Assessment Report for NICE
TNF-alpha inhibitors for ankylosing spondylitis and nr-AxSpA
12/12/2014 360
96. Van Den Bosch F, Kruithof E, Baeten D, Herssens A, de Keyser F, Mielants H, et al. Randomized
double-blind comparison of chimeric monoclonal antibody to tumor necrosis factor alpha (infliximab)
versus placebo in active spondylarthropathy. Arthritis Rheum 2002;46:755-65.
97. van der Heijde D, Dijkmans B, Geusens P, Sieper J, DeWoody K, Williamson P, et al. Efficacy
and safety of infliximab in patients with ankylosing spondylitis: results of a randomized, placebo-
controlled trial (ASSERT). Arthritis Rheum 2005;52:582-91.
98. van der Heijde D, Landewe R, Baraliakos X, Houben H, van Tubergen A, Williamson P, et al.
Radiographic findings following two years of infliximab therapy in patients with ankylosing
spondylitis. Arthritis Rheum 2008;58:3063-70.
99. van der Heijde D, Han C, DeVlam K, Burmester G, van den Bosch F, Williamson P, et al.
Infliximab improves productivity and reduces workday loss in patients with ankylosing spondylitis:
results from a randomized, placebo-controlled trial. Arthritis Rheum 2006;55:569-74.
100. van der Heijde D, Landewe R, Hermann K, Han J, Williamson P, Braun J. The effect of
infliximab therapy on spinal inflammation assessed by magnetic resonance imaging in a randomized,
placebo-controlled trial of 279 patients with ankylosing spondylitis. Ann Rheum Dis 2005;64:317.
101. van der Heijde D, Han C, Bala M, Williamson P, Han J, Braun J. Infliximab improves fatigue
and pain in patients with ankylosing spondylitis: Results of a randomized, placebo-controlled trial
(ASSERT). Ann Rheum Dis 2005;64:318-9.
102. Braun J, Maksymowych WP, Dougados M, Steinfeld S, Dewoody K, Williamson P, et al.
Efficacy of infliximab in subgroups of patients with ankylosing spondylitis: Results from the
ankylosing spondylitis study for the evaluation of recombinant infliximab therapy (ASSERT). Ann
Rheum Dis 2004;63:402.
103. Braun J, Kellner H, Deodhar A, Inman R, Han C, DeWoody K, et al. Infliximab improves quality
of life in patients with ankylosing spondylitis: Results of a randomized, placebo-controlled trial
(ASSERT). Ann Rheum Dis 2004;63:402.
104. van der Heijde D, Dijkmans B, Geusens P, Sieper J, DeWoody K, Williamson R, et al. Efficacy
and safety of infliximab in patients with ankylosing spondylitis: Results of a 24-week randomized,
placebo-controlled trial (ASSERT). Ann Rheum Dis 2004;63:403.
105. Park W, Hrycaj P, Jeka S, Kovalenko V, Lysenko G, Miranda P, et al. A randomised, double-
blind, multicentre, parallel-group, prospective study comparing the pharmacokinetics, safety, and
efficacy of CT-P13 and innovator infliximab in patients with ankylosing spondylitis: the PLANETAS
study. Ann Rheum Dis 2013;72:1605-12.
106. Park W, Hrycaj P, Kovalenko V, Miranda P, Gutierrez-Urena S, Lee Y, et al. A randomized,
double-blind, phase 1 study demonstrates equivalence in pharmacokinetics, safety, and efficacy of
CT-P13 and infliximab in patients with ankylosing spondylitis. Annals of the Rheumatic Disease
2013;71.
107. Tam LS, Shang Q, Kun EW, Lee VK, Yip ML, Li M, et al. The effects of golimumab on the
progression of subclinical atherosclerosis and arterial stiffness in patients with ankylosing
spondylitis-a randomized, placebo-controlled trial. In: Annual European Congress of Rheumatology
of the European League Against Rheumatism, EULAR 2013. Madrid; 2013. p. 513.
108. Glintborg B, Ostergaard M, Krogh NS, Dreyer L, Kristensen HL, Hetland ML. Predictors of
treatment response and drug continuation in 842 patients with ankylosing spondylitis treated with
anti-tumour necrosis factor: results from 8 years' surveillance in the Danish nationwide DANBIO
registry. Ann Rheum Dis 2010;69:2002-8.
109. Pavy S, Brophy S, Calin A. Establishment of the minimum clinically important difference for the
bath ankylosing spondylitis indices: A prospective study. J Rheumatol 2005;32:80-5.

Technology Assessment Report for NICE
TNF-alpha inhibitors for ankylosing spondylitis and nr-AxSpA
12/12/2014 361
110. van der Heijde D, Salonen D, Weissman BN, Landewe R, Maksymowych WP, Kupper H, et al.
Assessment of radiographic progression in the spines of patients with ankylosing spondylitis treated
with adalimumab for up to 2 years. Arthritis Res Ther 2009;11:R127.
111. van der Heijde D, Landewe R, Einstein S, Ory P, Vosse D, Ni L, et al. Radiographic progression
of ankylosing spondylitis after up to two years of treatment with etanercept. Arthritis Rheum
2008;58:1324-31.
112. Braun J, Baraliakos X, Hermann KG, Deodhar A, van der Heijde D, Inman R, et al. The effect of
two golimumab doses on radiographic progression in ankylosing spondylitis: results through 4 years
of the GO-RAISE trial. Ann Rheum Dis 2014;73:1107-13.
113. Haroon N, Inman RD, Learch TJ, Weisman MH, Lee M, Rahbar MH, et al. The impact of tumor
necrosis factor alpha inhibitors on radiographic progression in ankylosing spondylitis. Arthritis
Rheum 2013;65:2645-54.
114. Baraliakos X, Haibel H, Listing J, Sieper J, Braun J. Continuous long-term anti-TNF therapy
does not lead to an increase in the rate of new bone formation over 8 years in patients with ankylosing
spondylitis. Ann Rheum Dis 2014;73:710-5.
115. Baraliakos X, Listing J, Brandt J, Haibel H, Rudwaleit M, Sieper J, et al. Radiographic
progression in patients with ankylosing spondylitis after 4 yrs of treatment with the anti-TNF-alpha
antibody infliximab. Rheumatology 2007;46:1450-3.
116. Scire CA, Caporali R, Sarzi-Puttini P, Frediani B, Di Franco M, Tincani A, et al. Drug survival
of the first course of anti-TNF agents in patients with rheumatoid arthritis and seronegative
spondyloarthritis: analysis from the MonitorNet database. Clin Exp Rheumatol 2013;31:857-63.
117. Glintborg B, Ostergaard M, Krogh NS, Tarp U, Manilo N, Loft AGR, et al. Clinical response,
drug survival and predictors thereof in 432 ankylosing spondylitis patients after switching tumour
necrosis factor alpha inhibitor therapy: results from the Danish nationwide DANBIO registry. Ann
Rheum Dis 2013;72:1149-55.
118. Lie E, van der Heijde D, Uhlig T, Mikkelsen K, Rodevand E, Koldingsnes W, et al.
Effectiveness of switching between TNF inhibitors in ankylosing spondylitis: data from the NOR-
DMARD register. Ann Rheum Dis 2011;70:157-63.
119. Rudwaleit M, Claudepierre P, Wordsworth P, Cortina EL, Sieper J, Kron M, et al. Effectiveness,
safety, and predictors of good clinical response in 1250 patients treated with adalimumab for active
ankylosing spondylitis. J Rheumatol 2009;36:801-8.
120. Bonafede M, Fox KM, Watson C, Princic N, Gandra SR. Treatment patterns in the first year after
initiating tumor necrosis factor blockers in real-world settings. Advances in Therapy 2012;29:664-74.
121. Choquette D, Sauvageau D, Raynauld JP. Retention rate of adalimumab, etanercept and
infliximab at 5 years in patients with ankylosing spondylitis: Report from the rhumadata computerized
database. Annals of the Rheumatic Disease 2013;71:AB0849 p.647.
122. Gulfe A, Kapetanovic ML, Kristensen E. Efficacy and drug survival of anti-tumour necrosis
factor-alpha therapies in patients with non-radiographic axial spondyloarthritis: an observational
cohort study from Southern Sweden. Scand J Rheumatol 2014;Posted online on August 22, 2014.
123. Nell-Duxneuner V, Schroeder Y, Reichardt B, Bucsics A. The use of TNF-inhibitors in
ankylosing spondylitis in Austria from 2007 to 2009 - a retrospective analysis. Int J Clin Pharmacol
Ther 2012;50:867-72.
124. Yeaw J, Watson C, Fox KM, Schabert VF, Goodman S, Gandra SR. Treatment patterns
following discontinuation of adalimumab, etanercept, and infliximab in a US managed care sample.
Advances in Therapy 2014;31:410-25.

Technology Assessment Report for NICE
TNF-alpha inhibitors for ankylosing spondylitis and nr-AxSpA
12/12/2014 362
125. Zufferey P, Ghosn J, Becce F, Ciurea A, Aubry-Rozier B, Finckh A, et al. Anti-tumor necrosis
factor drug survival in axial spondyloarthritis is independent of the classification criteria. Rheumatol
Int 2014;Published online 29 July.
126. Pavelka K, Forejtova S, Stolfa J, Chroust K, Buresova L, Mann H, et al. Anti-TNF therapy of
ankylosing spondylitis in clinical practice. Results from the Czech national registry ATTRA. Clin Exp
Rheumatol 2009;27:958-63.
127. Singh JA, Wells GA, Christensen R, Ghogomu TE, Maxwell L, MacDonald JK, et al. Adverse
effects of biologics: a network meta-analysis and Cochrane overview. Cochrane Database of
Systematic Reviews 2011;Issue 2. Art. No.: CD008794. DOI: 10.1002/14651858.CD008794.pub2.
128. Askling J, Fahrbach K, Nordstrom B, Ross S, Schmid CH, Symmons D. Cancer risk with tumor
necrosis factor alpha (TNF) inhibitors: meta-analysis of randomized controlled trials of adalimumab,
etanercept, and infliximab using patient level data. Pharmacoepidemiol Drug Saf 2011;20:119-30.
129. Rodgers M, Epstein D, Bojke L, Yang H, Craig D, Fonseca T, et al. Etanercept, infliximab and
adalimumab for the treatment of psoriatic arthritis: a systematic review and economic evaluation.
Health Technol Assess 2011;15:1-134.
130. van der Heijde D, Schiff MH, Sieper J, Kivitz AJ, Wong RL, Kupper H, et al. Adalimumab
effectiveness for the treatment of ankylosing spondylitis is maintained for up to 2 years: long-term
results from the ATLAS trial. Ann Rheum Dis 2009;68:922-9.
131. Sieper J, van der Heijde D, Dougados M, Brown LS, Lavie F, Pangan AL. Early response to
adalimumab predicts long-term remission through 5 years of treatment in patients with ankylosing
spondylitis. Ann Rheum Dis 2012;71:700-6.
132. Braun J, Deodhar A, Inman RD, van der Heijde D, Mack M, Xu S, et al. Golimumab
administered subcutaneously every 4 weeks in ankylosing spondylitis: 104-week results of the GO-
RAISE study. Ann Rheum Dis 2012;71:661-7.
133. Deodhar A, Braun J, Inman RD, van der Heijde D, Zhou Y, Xu S, et al. Golimumab
administered subcutaneously every 4 weeks in ankylosing spondylitis: 5-year results of the GO-
RAISE study. Ann Rheum Dis 2014;Published Online First: 11 Nov 2014
doi:10.1136/annrheumdis-2014-205862.
134. Davis JC, Jr., van der Heijde DM, Braun J, Dougados M, Clegg DO, Kivitz AJ, et al. Efficacy
and safety of up to 192 weeks of etanercept therapy in patients with ankylosing spondylitis. Ann
Rheum Dis 2008;67:346-52.
135. Davis JC, van der Heijde DM, Braun J, Dougados M, Cush J, Clegg D, et al. Sustained durability
and tolerability of etanercept in ankylosing spondylitis for 96 weeks. Ann Rheum Dis 2005;64:1557-
62.
136. Dijkmans B, Emery P, Hakala M, Leirisalo-Repo M, Mola EM, Paolozzi L, et al. Etanercept in
the longterm treatment of patients with ankylosing spondylitis.[Erratum appears in J Rheumatol. 2010
Oct;37(10):2198]. J Rheumatol 2009;36:1256-64.
137. Martin-Mola E, Sieper J, Leirisalo-Repo M, Dijkmans BA, Vlahos B, Pedersen R, et al.
Sustained efficacy and safety, including patient-reported outcomes, with etanercept treatment over 5
years in patients with ankylosing spondylitis. Clin Exp Rheumatol 2010;28:238-45.
138. Machado P, Landewe R, Braun J, Hermann KG, Baker D, van der Heijde D. Both structural
damage and inflammation of the spine contribute to impairment of spinal mobility in patients with
ankylosing spondylitis. Ann Rheum Dis 2010;69:1465-70.
139. Ramiro S, van der Heijde D, van Tubergen A, Stolwijk C, Dougados M, van den Bosch F, et al.
Higher disease activity leads to more structural damage in the spine in ankylosing spondylitis: 12-year
longitudinal data from the OASIS cohort. Ann Rheum Dis 2014;73:1455-61.

Technology Assessment Report for NICE
TNF-alpha inhibitors for ankylosing spondylitis and nr-AxSpA
12/12/2014 363
140. Ramiro S, Stolwijk C, van Tubergen A, van der Heijde D, Dougados M, van den Bosch F, et al.
Evolution of radiographic damage in ankylosing spondylitis over 12 years of follow-up. Ann Rheum
Dis 2013;72:665-6.
141. Dean LE, Macfarlane GJ, MacDonald AG. POSTER: The natural history of ankylosing
spondylitis – results from the Scotland and Ireland registry for ankylosing spondylitis (SIRAS). In:
British Society for Rheumatology Annual Scientific Meeting. Liverpool: University of Aberdeen;
2013.
142. Stone MA, Sengupta R, Gordon D, Pomeroy E, Mogg R, Keat A. Longitudinal analyses of
disease outcomes in ankylosing spondylitis yield insight into the natural history of AS. Ann Rheum
Dis 2007;66:410.
143. Kobelt G, Andlin-Sobocki P, Brophy S, Jonsson L, Calin A, Braun J. The burden of ankylosing
spondylitis and the cost-effectiveness of treatment with infliximab (Remicade (R)). Rheumatology
2004;43:1158-66.
144. Kiltz U, Baraliakos X, Karakostas P, Igelmann M, Kalthoff L, Klink C, et al. Do patients with
non-radiographic axial spondylarthritis differ from patients with ankylosing spondylitis? Arthritis
Care Res 2012;64:1415-22.
145. Poddubnyy D, Rudwaleit M, Haibel H, Listing J, Maerker-Hermann E, Zeidler H, et al. Rates
and predictors of radiographic sacroiliitis progression over 2 years in patients with axial
spondyloarthritis. Ann Rheum Dis 2011;70:1369-74.
146. Poddubnyy D, Haibel H, Listing J, Marker-Hermann E, Zeidler H, Braun J, et al. Baseline
radiographic damage, elevated acute-phase reactant levels, and cigarette smoking status predict spinal
radiographic progression in early axial spondylarthritis. Arthritis Rheum 2012;64:1388-98.
147. Boonen A, Sieper J, van der Heijde D, Dougados M, Bukowski JF, Valluri S, et al. The burden
of non-radiographic axial spondyloarthritis. Seminars in Arthritis & Rheumatism 2014;In Press,
Accepted Manuscript- available online 22 October 2014. Available from:
http://dx.doi.org/10.1016/j.semarthrit.2014.10.009
148. Sampaio-Barros PD, Bortoluzzo AB, Conde RA, Costallat LTL, Samara AM, Bertolo MB.
Undifferentiated spondyloarthritis: A longterm followup. J Rheumatol 2010;37:1195-9.
149. Sampaio-Barros PD, Bertolo MB, Kraemer MHS, Marques-Neto JF, Samara AM.
Undifferentiated spondyloarthropathies: A 2-year follow-up study. Clin Rheumatol 2001;20:201-6.
150. Stone MA, Pomeroy E, Keat A, Sengupta R, Hickey S, Dieppe P, et al. Assessment of the impact
of flares in ankylosing spondylitis disease activity using the Flare Illustration. Rheumatology
2008;47:1213-8.
151. Kobelt G, Sobocki P, Sieper J, Braun J. Comparison of the cost-effectiveness of infliximab in the
treatment of ankylosing spondylitis in the United Kingdom based on two different clinical trials. Int J
Technol Assess Health Care 2007;23:368-75.
152. Ara RM, Reynolds AV, Conway P. The cost-effectiveness of etanercept in patients with severe
ankylosing spondylitis in the UK. Rheumatology 2007;46:1338-44.
153. Botteman MF, Hay JW, Luo MP, Curry AS, Wong RL, Hout BA. Cost effectiveness of
adalimumab for the treatment of ankylosing spondylitis in the United Kingdom. Rheumatology
2007;46:1320-8.
154. Armstrong N, Joore M, van Asselt T, Misso K, Manning N, Tomini F, et al. Golimumab for the
treatment of ankylosing spondylitis: a NICE single technology appraisal. Pharmacoeconomics
2013;31:415-25.
155. Braun J, Brandt J, Listing J, Zink A, Alten R, Burmester G, et al. Two year maintenance of
efficacy and safety of infliximab in the treatment of ankylosing spondylitis. Ann Rheum Dis
2005;64:229-34.

Technology Assessment Report for NICE
TNF-alpha inhibitors for ankylosing spondylitis and nr-AxSpA
12/12/2014 364
156. Ara RM, Packham J, Haywood K. The direct healthcare resource costs associated with
Ankylosing Spondylitis patients attending a UK secondary care rheumatology unit. Ann Rheum Dis
2006;65:273.
157. Boonen A, van der Heijde D, Landewe R, Guillemin F, Rutten-van Molken M, Dougados M, et
al. Direct costs of ankylosing spondylitis and its determinants: an analysis among three European
countries. Ann Rheum Dis 2003;62:732-40.
158. Rafia R, Ara R, Packham J, Haywood K, Healey E. Healthcare costs and productivity losses
directly attributable to ankylosing spondylitis. Clin Exp Rheumatol 2012;30:246-53.
159. Keat A, Barkham N, Bhalla A, Gaffney K, Marzo-Ortega H, Paul S, et al. BSR guidelines for
prescribing TNF-alpha blockers in adults with ankylosing spondylitis. Report of a working party of
the British Society for Rheumatology. Rheumatology 2005;44:939-47.
160. Spiegelhalter DJ, Best NG, Carlin BR, van der Linde A. Bayesian measures of model complexity
and fit. Journal of the Royal Statistical Society Series B-Statistical Methodology 2002;64:583-616.
161. Welton N, Ades AE. Research decisions in the face of heterogeneity: What can a new study tell
us? Health Econ 2012;21:1196-200.
162. Vastesaeger N, van der Heijde D, Inman RD, Wang YX, Deodhar A, Hsu B, et al. Predicting the
outcome of ankylosing spondylitis therapy. Ann Rheum Dis 2011;70:973-81.
163. Lord PA, Farragher TM, Lunt M, Watson KD, Symmons DP, Hyrich KL, et al. Predictors of
response to anti-TNF therapy in ankylosing spondylitis: results from the British Society for
Rheumatology Biologics Register. Rheumatology 2010;49:563-70.
164. Dias S, Sutton AJ, Welton NJ, Ades AE. Evidence synthesis for decision making 3:
Heterogeneitysubgroups, meta-regression, bias, and bias-adjustment. Med Decis Making
2013;33:618-40.
165. Technology Appraisal TA199: Etanercept, infliximab and adalimumab for the treatment of
psoriatic arthritis. London: National Institute for Health and Clinical Excellence (NICE); 2010.
Available from: http://www.nice.org.uk/TA199
166. NHS reference costs. London: Department of Health. Available from:
https://www.gov.uk/government/collections/nhs-reference-costs
167. Poddubnyy D, Haibel H, Braun J, Rudwaleit M, Sieper J. Patients with non-radiographic axial
spondyloarthritis and ankylosing spondylitis demonstrate the same clinical disease course over two
years: Results from the GESPIC cohort. Ann Rheum Dis 2014;73 Supplement 2:EULAR 2014:
Scientific Abstracts - Poster Presentations. Spondyloarthritis - clinical aspects (other than treatment):
THU0071 p.201.
168. British National Formulary. Royal Pharmaceutical Society, BMJ Publishing Group Ltd.; [cited
2014 December 8]. Available from: http://www.bnf.org/bnf/index.htm.
169. Curtis L. Unit Costs of Health and Social Care. Canterbury: Personal Social Services Research
Unit (PSSRU). Available from: http://www.pssru.ac.uk/project-pages/unit-costs/
170. Henriksson M, Palmer S, Chen R, Damant J, Fitzpatrick NK, Abrams K, et al. Assessing the cost
effectiveness of using prognostic biomarkers with decision models: case study in prioritising patients
waiting for coronary artery surgery. BMJ 2010;340:b5606.
171. Rees F, Peffers G, Bell C, Obrenovic K, Sandhu R, Packham J, et al. Compliance with NICE
guidance on the use of anti-TNFalpha agents in ankylosing spondylitis: an east and west Midlands
regional audit. Clin. Med. 2012;12:324-7.
172. University Hospital Montpellier. Effect of spacing of anti-TNF drugs in ankylosing spondylitis
with low disease activity (SPACING). ClinicalTrials.gov; 2012. [cited 2014 Dec 11]. Available from:
http://ClinicalTrials.gov/show/NCT01610947.

Technology Assessment Report for NICE
TNF-alpha inhibitors for ankylosing spondylitis and nr-AxSpA
12/12/2014 365
173. Baseline risk as predictor of treatment benefiHiggins JPT, Thompson SG. Quantifying
heterogeneity in a meta-analysis. Stat Med 2002;21:1539-58.
174. Haibel H, Rios V, Hermann KG, Althoff C, Rudwaleit M, Kupper H, et al. No progression of
chronic sacroiliac changes in patients with active, non-radiographic axial spondyloarthritis treated
with adalimumab over 52 weeks. Arthritis Rheum 2009;60:1798.
175. Haibel H, Rudwaleit M, Amtenbrink A, Heldmann F, Listing J, Wong R, et al. Adalimumab is
effective in patients with preradiographic axial spondyloarthritis (PRSPA): Results of a 12-week,
randomised controlled trial with a 40-week open-label extension (OLE). Rheumatology 2008;47:II80-
II.
176. Haibel H, Rudwaleit M, Amtenbrink A, Heldmann F, Listing J, Kupper H, et al. Efficacy of
adalimumab in the treatment of preradiographic axial spondyloarthritis: Results of a 20-week,
randomized controlled trial with an open-label extension phase. Z Rheumatol 2007;66:14-.
177. Haibel H, Rudwaleit M, Amtenbrink A, Heldmann F, Listing J, Wong R, et al. Efficacy of
adalimumab in the treatment of preiradiographic axial spondyloarthritis: Results of a 20-week,
randomized controlled trial with an open-label extension phase. Ann Rheum Dis 2007;66:64-.
178. van der Heijde D, Maksymowych W, Sieper J, Lambert R, Brown MA, Rathmann S, et al.
Relationship between MRI and clinical remission in patients with non-radiographic axial
spondyloarthritis after two years of adalimumab therapy. Ann Rheum Dis 2013;72.
179. Sieper J, Baeten DL, Van Den Bosch F, Rathmann SS, Anderson J, Pangan AL. Sustained
clinical remission in patients with non-radiographic axial spondyloarthritis after two years of
adalimumab treatment. Ann Rheum Dis 2013;72.
180. Sieper J, Van Der Heijde D, Dougados M, Van Den Bosch F, Goupille P, Sarkar S, et al.
Sustained efficacy of adalimumab in patients with non-radiographic axial spondyloarthritis: Week 68
results from ability 1. Annals of the Rheumatic Disease 2013;71.
181. van der Heijde DM, Mease PJ, Pangan AL, Rao SA, Chen N, Cifaldi M. Improvement in
physical function, health-related quality of life, and work productivity with adalimumab treatment in
non-radiographic axial spondyloarthritis. Arthritis Rheum 2013;65:S1052.
182. Sieper J, Van Der Heijde D, Dougados M, Van Den Bosch F, Goupille P, Rathmann SS, et al.
Sustained efficacy of adalimumab in patients with non-radiographic axial spondyloarthritis with
positive MRI of the sacroiliac joints or spine or elevated C-reactive protein at baseline. Rheumatology
(United Kingdom) 2013;52:i52-i3.
183. van der Heijde D, Mease P, Pangan AL, Rao S, Chen N, Cifaldi MA. Improvement in physical
function, health-related quality of life, and work productivity with adalimumab treatment in
nonradiographic axial SPA: WK-52 results from ability-1. Arthritis Rheum 2012;64:S583.
184. Kimel M, Revicki D, Rao S, Fryback D, Feeny D, Harnam N, et al. Norms-based assessment of
patient-reported outcomes associated with adalimumab monotherapy in patients with ankylosing
spondylitis. Clin Exp Rheumatol 2011;29:624-32.
185. van der Heijde DM, Revicki DA, Gooch KL, Wong RL, Kupper H, Harnam N, et al. Physical
function, disease activity, and health-related quality-of-life outcomes after 3 years of adalimumab
treatment in patients with ankylosing spondylitis. Arthritis Res Ther 2009;11:R124.
186. Revicki DA, Luo MP, Wordsworth P, Wong RL, Chen N, Davis JC, Jr., et al. Adalimumab
reduces pain, fatigue, and stiffness in patients with ankylosing spondylitis: results from the

Technology Assessment Report for NICE
TNF-alpha inhibitors for ankylosing spondylitis and nr-AxSpA
12/12/2014 366
adalimumab trial evaluating long-term safety and efficacy for ankylosing spondylitis
(ATLAS).[Erratum appears in J Rheumatol. 2011 Apr;38(4):788]. J Rheumatol 2008;35:1346-53.
187. van der Heijde D, Breban MA, Halter DG, DiVittorio G, Bratt J, Cantini F, et al. Sustained
improvement of spinal mobility, physical function, and quality of life in patients with ankylosing
spondylitis: 5-year results. Arthritis Rheum 2011;1).
188. Maksymowych W, Van Der Heijde D, Landewe R, Pangan A, Brown S, Lavie F. Predictors of
radiographic progression in adalimumab-treated patients with Ankylosing Spondylitis. Arthritis
Rheum 2010;62:1949.
189. van der Heijde D, Emery P, Patra K, Lavie F. Relationship between bone formation in patients
with ankylosing spondylitis and clinical signs and symptoms. Rheumatology 2010;49:i18.
190. Scott DG, Van Der Heijde D, Schiff MH, Sieper J, Kivitz A, Dijkmans BA, et al. Improvement
in long-term spinal mobility in patients with ankylosing spondylitis (AS) is sustained during up to 3
years of adalimumab treatment: 3-Year atlas results. Rheumatology 2009;48:i56.
191. Landewe RBM, Rudwaleit M, Van Der Heijde DM, Dougados M, Mease PJ, Reveille JD, et al.
Effect of certolizumab pegol over 48 weeks in patients with axial spondyloarthritis, including
ankylosing spondylitis and non-radiographic axial spondyloarthritis. Arthritis Rheum 2013;65:S767.
192. Sieper J, Kivitz A, Van Tubergen A, Deodhar A, Coteur G, Singh P, et al. Long-term
maintenance of improvements in patient-reported outcomes with certolizumab pegol in patients with
axial spondyloarthritis, including ankylosing spondylitis and non-radiographic axial spondyloarthritis:
48-week results of the rapid-axspa study. Value Health 2013;16 (7):A569.
193. Maksymowych W, Landewe R, Rudwaleit M, van der Heijde D, Dougados M, Mease P, et al.
Effect of certolizumab pegol over 48 weeks in patients with axial spondyloarthritis, including
ankylosing spondylitis and non-radiographic axial spondyloarthritis. J Rheumatol 2014;41:1496-7.
194. Boonen A, Patel V, Traina S, Chiou CF, Maetzel A, Tsuji W. Rapid and sustained improvement
in health-related quality of life and utility for 72 weeks in patients with ankylosing spondylitis
receiving etanercept. J Rheumatol 2008;35:662-7.
195. Davis JC, van der Heijde D, Dougados M, Woolley JM. Reductions in health-related quality of
life in patients with ankylosing spondylitis and improvements with etanercept therapy. Arthritis
Rheum 2005;53:494-501.
196. Dougados M, Van Der Heijde D, Sieper J, Braun J, Maksymowych WP, Citera G, et al. Safety
and efficacy of etanercept in early non-radiographic axial spondyloarthritis: A randomized, double-
blind, placebo-controlled trial at 24 weeks. Arthritis Rheum 2013;65:S642-S3.
197. Davis J, Jr., Webb A, Lund S, Sack K. Results from an open-label extension study of etanercept
in ankylosing spondylitis. Arthritis Rheum 2004;51:302-4.
198. Bao C, Huang F, Khan MA, Fei K, Wu Z, Zhuang Y, et al. Safety and efficacy of golimumab, a
human anti-tnf monoclonal antibody injected subcutaneously every 4 weeks, in chinese patients with
active ankylosing spondylitis: One-year results of a phase 3, randomized, placebo-controlled study.
Ann Rheum Dis 2013;72.
199. Bao C, Huang F, Khan A, Fei K, Wu Z, Zhuang Y, et al. Safety and efficacy of golimumab, a
human anti-tumor necrosis factor monoclonal antibody injected subcutaneously every 4 weeks, in
Chinese patients with active ankylosing spondylitis: 1-year results of a phase 3, randomized, placebo-
controlled study. Arthritis Rheum 2013;65:S651.

Technology Assessment Report for NICE
TNF-alpha inhibitors for ankylosing spondylitis and nr-AxSpA
12/12/2014 367
200. van der Heijde D, Braun J, Deodhar A, Inman RD, Xu S, Mack ME, et al. Comparison of three
enthesitis indices in a multicentre, randomized, placebo-controlled trial of golimumab in ankylosing
spondylitis (GO-RAISE). Rheumatology 2013;52:321-5.
201. Deodhar A, Braun J, Inman R, Van Der Heijde D, Zhou Y, Hsu B. Long-term safety and efficacy
of golimumab in the treatment of ankylosing spondylitis: Results through 5 years of the go-raise trial.
Ann Rheum Dis 2013;72.
202. Braun J, Van Der Heijde D, Hermann KG, Baraliakos X, Deodhar A, Beutler A, et al. The effect
of anti-tumor necrosis factor therapy with golimumab on radiographic progression in definite
ankylosing spondylitis: 4-year results. Annals of the Rheumatic Disease 2013;71.
203. van der Heijde D, Deodhar A, Braun J, Mack M, Hsu B, Gathany T, et al. Achieving ASDAS-
CRP major improvement and inactive disease in patients with ankylosing spondylitis after treatment
with golimumab is associated with normalized health related quality of life: Two-year results from the
go-raise trial. Annals of the Rheumatic Disease 2013;71.
204. van der Heijde D, Deodhar A, Braun J, Mack M, Hsu B, Gathany T, et al. Achieving ankylosing
spondylitis disease activity score c-reactive protein major improvement and inactive disease in
patients with ankylosing spondylitis after treatment with golimumab is associated with normalized
health-related quality of life: 2-year results from go-raise. Rheumatology (United Kingdom)
2013;52:i161-i2.
205. Braun J, Beutler A, Deodhar A, Hsu B, Van Der Heijde D, Hermann KG, et al. The effect of
anti-tumor necrosis factor therapy with golimumab on radiographic progression in definite ankylosing
spondylitis: 4-year results. International Journal of Rheumatic Diseases 2012;15:91.
206. Braun J, Van Der Heijde D, Hermann KG, Baraliakos X, Deodhar A, Beutler A, et al. The effect
of anti-tumor necrosis factor therapy with two different doses of golimumab on radiographic
progression in definite ankylosing spondylitis: 4-year results. Arthritis Rheum 2011;1).
207. Braun J, Van Der Heijde D, Deodhar A, Beutler A, Mack M, Hsu B, et al. Sustained clinical
response with golimumab administered subcutaneously every 4 weeks in ankylosing spondylitis: 104-
week results of a randomized, placebo-controlled study. Arthritis Rheum 2011;1).
208. Braun J, Van Der Heijde D, Deodhar A, Diekman L, Sieper J, Kim SI, et al. Golimumab, a new,
human, TNF-alpha antibody administered subcutaneously every 4 weeks, in ankylosing spondylitis:
104-week efficacy and safety results of the randomized, placebo-controlled go-raise study. Scand J
Rheumatol 2010;39:24.
209. Kim SI, Braun J, Van Der Heijde D, Deodhar A, Dieckman L, Sieper J, et al. Golimumab, a new,
human, TNF-alpha antibody administered subcutaneously every 4 weeks, in ankylosing spondylitis:
104 week efficacy and safety results of the randomized, placebo-controlled GO-RAISE study.
International Journal of Rheumatic Diseases 2010;13:152-3.
210. Braun J, Van Der Heijde DMFM, Deodhar AA, Diekman L, Sieper J, Kim SI, et al. Golimumab,
a new, human, TNF-antibody administered subcutaneously every 4 weeks, in ankylosing spondylitis
(AS): 104-Week efficacy and safety results of the randomized, placebo-controlled GO-RAISE study.
Arthritis Rheum 2009;60:1259.
211. Braun J, van der Heijde D, Deodhar A, Diekman L, Sieper J, Kim SI, et al. GOLIMUMAB, A
NEW, HUMAN, TNF-ALPHA ANTIBODY ADMINISTERED SUBCUTANEOUSLY EVERY 4
WEEKS, IN ANKYLOSING SPONDYLITIS: 104-WEEK EFFICACY AND SAFETY RESULTS
OF THE RANDOMIZED, PLACEBOCONTROLLED GO-RAISE STUDY. Clin Exp Rheumatol
2010;28:618-.

Technology Assessment Report for NICE
TNF-alpha inhibitors for ankylosing spondylitis and nr-AxSpA
12/12/2014 368
212. Braun J. GOLIMUMAB, A NEW, HUMAN, TNF-? ANTIBODY ADMINISTERED
SUBCUTANEOUSLY EVERY 4 WEEKS, IN ANKYLOSING SPONDYLITIS: 104-WEEK
EFFICACY AND SAFETY RESULTS OF THE RANDOMIZED, PLACEBO-CONTROLLED GO-
RAISE STUDY. Scand J Rheumatol 2010;39:24-.
213. Park W, Miranda P, Brzosko M, Wiland P, Gutierrez-Urena S, Mikazane H, et al. Efficacy and
safety of CT-P13 (infliximab biosimilar) over two years in patients with ankylosing spondylitis:
Comparison between continuing with CT-P13 and switching from infliximab to CT-P13. Arthritis
Rheum 2013;65 (12):3326.
214. Baraliakos X, Listing J, Fritz C, Haibel H, Alten R, Burmester GR, et al. Persistent clinical
efficacy and safety of infliximab in ankylosing spondylitis after 8 years--early clinical response
predicts long-term outcome. Rheumatology 2011;50:1690-9.
215. Braun J, Baraliakos X, Listing J, Fritz C, Alten R, Burmester G, et al. Persistent clinical efficacy
and safety of anti-tumour necrosis factor alpha therapy with infliximab in patients with ankylosing
spondylitis over 5 years: evidence for different types of response. Ann Rheum Dis 2008;67:340-5.
216. Braun J, Baraliakos X, Brandt J, Listing J, Zink A, Alten R, et al. Persistent clinical response to
the anti-TNF-alpha antibody infliximab in patients with ankylosing spondylitis over 3 years.
Rheumatology 2005;44:670-6.
217. Braun J, Brandt J, Listing J, Zink A, Alten R, Burmester G, et al. Long-term efficacy and safety
of infliximab in the treatment of ankylosing spondylitis: an open, observational, extension study of a
three-month, randomized, placebo-controlled trial. Arthritis Rheum 2003;48:2224-33.
218. Baraliakos X, Brandt J, Listing J, Rudwaleit M, Sieper J, Braun J. Clinical response to long-term
therapy with infliximab in patients with ankylosing spondylitis - Results after 3 years. Ann Rheum Dis
2004;63:412-.
219. Baraliakos X, Brandt J, Listing J, Rudwaleit M, Sieper J, Braun J. Clinical response to
withdrawal of anti-TNF therapy in patients with ankylosing spondylitis (AS) after 3 years of
continous treatment with infliximab. Ann Rheum Dis 2004;63:413-.
220. Brandt J, Listing J, Alten R, Bumester G, Gromnica-Ihle E, Kellner H, et al. Two year follow up
results of a controlled trial of the anti-TNF alpha antibody infliximab in active ankylosing spondylitis.
Arthritis Rheum 2003;48:S172-S3.
221. Brandt J, Listing J, Alten R, Burmester G, Gromnica-Ihle E, Schneider M, et al. One year results
of a double-blind placebo controlled, Phase-III clinical trial of infliximab in active Ankylosing
spondylitis. Arthritis Rheum 2002;46:S429-S.
222. Heldmann F, Brandt J, van der Horst-Bruinsma IE, Landewe R, Sieper J, Burmester GR, et al.
The European ankylosing spondylitis infliximab cohort (EASIC): a European multicentre study of
long term outcomes in patients with ankylosing spondylitis treated with infliximab. Clin Exp
Rheumatol 2011;29:672-80.
223. Braun J, Deodhar A, Dijkmans B, Geusens P, Sieper J, Williamson P, et al. Efficacy and safety
of infliximab in patients with ankylosing spondylitis over a two-year period. Arthritis Rheum
2008;59:1270-8.
224. Machado P, Landewe R, Braun J, Baraliakos X, Hermann KGA, Hsu B, et al. MRI inflammation
and its relation with measures of clinical disease activity and different treatment responses in patients
with ankylosing spondylitis treated with a TNF inhibitor. Annals of the Rheumatic Disease 2013;71.
225. Heldmann F, Brandt J, Braun J. European ankylosing spondylitis infliximab cohort (EASIC):
Long-term (5 years) efficacy of infliximab on disease activity and functiona real life experience after
the end of ASSERT. Arthritis Rheum 2009;60:520.

Technology Assessment Report for NICE
TNF-alpha inhibitors for ankylosing spondylitis and nr-AxSpA
12/12/2014 369
226. Braun J, Han C, Kellner H, Deodhar A, Inman R, Xu W, et al. Infliximab improves spinal
mobility in patients with ankylosing spondylitis: Two-year findings from the assert clinical trial.
Rheumatology 2008;47:II72-II.
227. Braun J, Han C, Kellner H, Deodhar A, Inman R, Xu W, et al. Infliximab improves spinal
mobility in patients with ankylosing spondylitis: Two-year findings from the assert clinical trial. Ann
Rheum Dis 2007;66:390-1.
228. Drummond MF, Sculpher MJ, Torrance GW, O'Brien BJ, Stoddart GL. Methods for the
economic evaluation of health care programmes. 3rd ed. Oxford: Oxford University Press; 2005.
229. Pumford N, Wade A, Crawford G, McConnachie A. Sensitivity of pro's to detect changes in
quality of life in patients treated with a biologic agent. Value Health 2011;14 (7):A314.
230. Wade AG, Crawford GM, Pumford N, Koscielny V, Maycock S, McConnachie A. Baseline
characteristics and patient reported outcome data of patients prescribed etanercept: web-based and
telephone evaluation. BMC Med Res Methodol 2011;11:91.
231. Lee TJ, Park BH, Son HK, Kim JW, Shin K, Lee EB, et al. Differences in cost-of-illness and
quality of life between rheumatoid arthritis and ankylosing spondylitis in South Korea. Value Health
2011;14 (7):A306.
232. Lee T-J, Park B-H, Kim JW, Shin K, Lee EB, Song Y-W. Cost-of-illness and quality of life in
patients with ankylosing spondylitis at a tertiary hospital in Korea. J Korean Med Sci 2014;29:190-7.
233. Joore M, Brunenberg D, Nelemans P, Wouters E, Kuijpers P, Honig A, et al. The impact of
differences in EQ-5D and SF-6D utility scores on the acceptability of cost-utility ratios: results across
five trial-based cost-utility studies. Value Health 2010;13:222-9.
234. Van Tubergen A, Boonen A, Landewe R, Rutten-Van Molken M, Van der Heijde D, Hidding A,
et al. Cost effectiveness of combined spa-exercise therapy in ankylosing spondylitis: A randomized
controlled trial. Arthritis Rheum-Arthritis Care Res. 2002;47:459-67.
235. Kobelt G, Andlin-Sobocki P, Collantes-Estevez E, Gratacos-Masmitja J, Pocovi A, Mulero-
Mendoza J. The cost effectiveness of infliximab in the treatment of ankylosing spondylitis in Spain.
Comparison of clinical trial and clinical practice data. Ann Rheum Dis 2006;65:282-3.
236. Kobelt G, Sobocki P, Mulero J, Gratacos J, Collantes-Estevez E, Braun J. The cost-effectiveness
of infliximab in the treatment of ankylosing spondylitis in Spain: comparison of clinical trial and
clinical practice data. Scand J Rheumatol 2008;37:62-71.
237. Haywood KL, Garratt AM, Jordan KP, Healey EL, Packham JC. Evaluation of ankylosing
spondylitis quality of life (EASi-QoL): reliability and validity of a new patient-reported outcome
measure. J Rheumatol 2010;37:2100-9.
238. Kvamme MK, Kristiansen IS, Lie E, Kvien TK. Identification of cutpoints for acceptable health
status and important improvement in patient-reported outcomes, in rheumatoid arthritis, psoriatic
arthritis, and ankylosing spondylitis. J Rheumatol 2010;37:26-31.
239. Osnes-Ringen H, Kvamme MK, Kristiansen IS, Thingstad M, Henriksen JE, Kvien TK, et al.
Cost-effectiveness analyses of elective orthopaedic surgical procedures in patients with inflammatory
arthropathies. Scand J Rheumatol 2011;40:108-15.
240. Boonen A, van der Heijde D, Landewe R, van Tubergen A, Mielants H, Dougados M, et al. How
do the EQ-5D, SF-6D and the well-being rating scale compare in patients with ankylosing
spondylitis? Ann Rheum Dis 2007;66:771-7.
241. Boonen A, van der Heijde D, Landewe R, Guillemin F, Spoorenberg A, Schouten H, et al. Costs
of ankylosing spondylitis in three European countries: the patient's perspective. Ann Rheum Dis
2003;62:741-7.

Technology Assessment Report for NICE
TNF-alpha inhibitors for ankylosing spondylitis and nr-AxSpA
12/12/2014 370
242. Boonen A, van der Heijde D, Landewe R, Spoorenberg A, Schouten H, Rutten-van Molken M, et
al. Work status and productivity costs due to ankylosing spondylitis: comparison of three European
countries. Ann Rheum Dis 2002;61:429-37.
243. Haywood KL, Garratt AM, Dziedzic K, Dawes PT. Generic measures of health-related quality of
life in ankylosing spondylitis: reliability, validity and responsiveness. Rheumatology 2002;41:1380-7.
244. Lindstrom U, Bremander A, Bergman S, Haglund E, Petersson IF, Jacobsson LT. Patients with
non-as axial SPA have similar prevalence compared to as, but worse perceived health. Results from a
population based study. Ann Rheum Dis 2013;72.
245. Dolan P. Modeling valuations for EuroQol health states. Med Care 1997;35:1095-108.
246. Gordeev VS, Maksymowych WP, Evers SM, Ament A, Schachna L, Boonen A. Role of
contextual factors in health-related quality of life in ankylosing spondylitis. Ann Rheum Dis
2010;69:108-12.
247. Kind P, Dolan P, Gudex C, Williams A. Variations in population health status: results from a
United Kingdom national questionnaire survey. BMJ 1998;316:736-41.
248. Dolan P, Gudex C, Kind P, Williams A. A social tariff for EuroQol: results from a UK general
population survey. York: University of York Centre for Health Economics; 1995.
249. Dolan P, Gudex C, Kind P, Williams A. The time trade-off method: Results from a general
population study. Health Econ 1996;5:141-54.