tno report tno 2017 r11689 elemental carbon emission factors...
TRANSCRIPT
Circular Economy &
Environmental
Princetonlaan 6
3584 CB Utrecht
Postbus 80015
3508 TA Utrecht
www.tno.nl
T +31 88 866 42 56
TNO report
TNO 2017 R11689
Elemental carbon emission factors of vehicles
for Dutch air-quality assessments
Date 20 September 2018
Author(s) N.E. Ligterink PhD
Number of pages 37 (incl. appendices)
Number of
appendices
1
Sponsor RIVM Emissieregistratie
Project name Emissieregistratie 2017
Project number 060.22922
All rights reserved.
No part of this publication may be reproduced and/or published by print, photoprint,
microfilm or any other means without the previous written consent of TNO.
In case this report was drafted on instructions, the rights and obligations of contracting
parties are subject to either the General Terms and Conditions for commissions to TNO, or
the relevant agreement concluded between the contracting parties. Submitting the report for
inspection to parties who have a direct interest is permitted.
© 2018 TNO
TNO report | TNO 2017 R11689 2 / 37
Summary
Since a number of years, indicative elemental carbon (EC) emission factors have
been circulating in the Netherlands. These numbers had no official status, but grew
from a collection of sources. Some important numbers in this collection were
questionable, based on outdated test results, or different vehicle technology
categories not applicable to new vehicle technologies. Most important GDI’s
(gasoline direct injection) EC emissions test results were missing. From the
Pollutant Release and Transfer Register (PRTR) there is an interest in the EC
emission factors, since EC emissions are used as an estimate to report BC
emissions to the Convention of Long-Range Transboundary Air Pollution
(CLRTAP). The PRTR have requested this study, to make the results generally
available. The Ministry of Infrastructure and the Environment provided additional
sponsoring for the emission tests on GDI vehicles. In the process of giving EC
emission factors a more official status in the Netherlands, additional tests and
analyses were carried out, and this report summarizes aspects related to EC
emissions and emission factors.
With complex after-treatment systems the fractional contribution of elemental
carbon to total particulate matter in exhaust seems to be decreasing. An increasing
fraction of the vehicle fleet is equipped with a particulate filter. Eventually, the
remaining differences in elemental carbon contributions for the different after-
treatments are of decisive importance for total elemental carbon emissions and for
the fractional contribution to total particulate matter. Currently, older diesel vehicles
without after-treatment and thus with high particulate emissions and relatively high
elemental carbon contributions are the dominant source of PM and EC emissions
and thereby determine the correlation between both in the ambient air. In the future,
this correlation will change, as older diesel vehicle will phase out.
This report is an overview of the research of the recent years culminating in the
publication of the complete set of verified PM10 and EC emission factors of road
transport for all vehicle categories (see Appendix A), as used for national models.
The intention is to provide the information to ensure a consistent bottom-up
determination of emission totals and air-quality prognoses. This report is therefore
supportive to the national monitoring of elemental carbon in the ambient air.
Combustion exhaust aerosols are experimentally characterised by measurements
of different properties such as particulate number concentration, light absorption
(blackness), morphology and its refractoriness. Due to the different applied
measurement techniques, the association between the parameters is not
unambiguous and the correlations are not well defined. The advantage of using
elemental carbon as central marker is that, unlike other metrics, elemental carbon is
unaffected by atmospheric processes such as chemical reactions and
condensation. Hence, measurements at the source, i.e., at the tailpipe, and air-
quality measurements are directly comparable. This will still depend on the
measurement protocol used.
TNO report | TNO 2017 R11689 3 / 37
A few groups of vehicles required additional investigations to confirm, or adapt, the
current estimates based on limited data of elemental carbon emission factors:
• The petrol vehicles with direct injection (GDI) have high fractions of elemental
carbon in the particulate matter, but, on the other hand, low overall particulate
matter emissions. Particulate matter emissions from petrol cars are associated
mainly with deterioration.
• Another group of specific interest is Euro-V heavy-duty vehicles without filter,
but with Selective Catalytic Reduction (SCR). They have lower fractions of
elemental carbon than older vehicles without SCR. Seemingly, the SCR
changes the composition of the particulate matter. Moreover, the exhaust gas
temperature generates history effects which can delay the actual particulate
emissions for minutes to hours.
The main uncertainty in current emission factors is the malfunctioning and
tampering of the vehicles, which generates much higher particulate emissions than
a properly functioning vehicle. This uncertainty is still remaining for both particulate
matter and elemental carbon emission factors. Such malfunctions are not
uncommon. Estimates are one-in-ten to one-in-twenty vehicles show malfunctions
with a manifold increase in emissions. The number of vehicles tampered with, i.e.,
the filter removed, is unknown. Malfunctions of the combustion technology are
associated with high elemental carbon fractions. Malfunctions of the particulate filter
are associated with lower fractions of elemental carbon. The removal of a soot filter
will bring the emission levels and elemental fractions back to Euro-3 or Euro-4
levels.
TNO report | TNO 2017 R11689 4 / 37
Contents
Summary .................................................................................................................. 2
1 Introduction .............................................................................................................. 5 1.1 Indicative numbers for vehicle elemental carbon emission factors ........................... 5 1.2 Data gaps in the indicative numbers ......................................................................... 7 1.3 Elemental carbon emission factors in this report ....................................................... 7
2 Elemental carbon emission from the vehicle exhaust ......................................... 9 2.1 Particulate mass, particulate number, and elemental carbon measurement
techniques ................................................................................................................. 9 2.2 Absorption measurements for determining equivalent black carbon ...................... 10 2.3 EUSAAR/SUNSET method of determining elemental carbon fractions .................. 12 2.4 International reporting of elemental carbon concentrations .................................... 13 2.5 Chemical soup theory versus isolated effects ......................................................... 13 2.6 Important vehicle categories for total emissions and local hotspots ....................... 14
3 Recent testing for elemental carbon emissions ................................................. 15 3.1 Important vehicle categories and their emission legislation .................................... 16 3.2 Gasoline Direct Injection (GDI) vehicles .................................................................. 16 3.3 Euro-4 diesel vehicle without particulate filter ......................................................... 18 3.4 Euro-5 and Euro-6 diesel passenger cars with broken particulate filters ................ 18 3.5 Euro-V heavy duty vehicles ..................................................................................... 18 3.6 Euro-VI trucks with particulate filter ......................................................................... 26 3.7 Mopeds .................................................................................................................... 26
4 Driving behaviour and vehicle usage effects ..................................................... 28 4.1 Emissions from high engine load ............................................................................. 28 4.2 Emissions from cold start ........................................................................................ 28 4.3 Deterioration effects on PM emissions .................................................................... 28
5 Conclusions ........................................................................................................... 30
6 Signature ................................................................................................................ 31
Appendix A: List of PM10 and elemental carbon emission factors .................................. 32
TNO report | TNO 2017 R11689 5 / 37
1 Introduction
This report supplies the necessary background to the publication of elemental
carbon emission factors of all vehicle categories in the national emission inventory.
Elemental carbon is that part of particulate matter in ambient air which is directly
related to combustion processes. In many cases, in urban environments, the main
source is the exhaust gas of vehicles, in particular older diesel vehicles. Both the
temporal and the spatial distribution of the concentrations of elemental carbon are
closely linked to the diurnal traffic flows. Because elemental carbon is correlated to
the toxic particulate matter in the exhaust gas, and because recently a monitoring
network for black carbon is established, there is increasing interest in linking air-
quality observations of black carbon and elemental carbon concentrations with
elemental carbon emissions. Emission factors for elemental carbon from emission
measurements provide direct evidence for the different vehicle categories
contribution to the elemental carbon particulates in the atmosphere.
Although it is difficult to establish the direct link between elemental carbon and
health problems, the link between particulate matter in diesel combustion gas and
health problems is well established, for example by the IARC (International Agency
for Research on Cancer). Even more, the cocktail of vehicles emissions of
elemental carbon, polluting exhaust gases like NO2, metals from brake wear, and
organic compounds is likely to be more toxic than the separate components. The
concentration of elemental carbon in the ambient air can at least serve as a marker
or health risk indicator of the vehicle particulate emissions. This marker is also more
constant than many other markers, like total particulate mass and the particulate
number concentration, which readings depends very much ambient air chemistry
and the ambient conditions.
There is no international obligation to supply the elemental carbon emissions
inventories, but there is an international obligation to report black carbon (BC)
emissions inventories to the Convention on Long-Range Transboundary Air
Pollution (CLRTAP), as described in the Guidelines for Reporting Emissions and
Projections Data (ECE/EB.AIR/125). The Dutch PRTR uses the calculated EC
emissions to report the BC emissions. Moreover, there seems to be little consensus
on the best method to determine the elemental carbon, or black smoke, or black
carbon, concentration. Many studies of correlation between different test methods
are based on a single, or a limited number of combustion and engine technologies.
Experiences with different technologies show that there is already a large variation
in the formation and nature of particulate matter before it leaves the exhaust
tailpipe.
1.1 Indicative numbers for vehicle elemental carbon emission factors
For a number of years there have been indicative numbers for vehicle elemental
carbon emission factors, collected from different sources. These numbers have
been used by a number of parties. Although, not all elemental carbon emissions
results are consistent which each other. Moreover, for a number of categories the
underlying data is limited. In the last couple of years there has been some studies
to fill in these gaps in knowledge.
TNO report | TNO 2017 R11689 6 / 37
The complete picture for road transport, presented in this report, is meant to be part
of the Dutch Pollutant Release and Transfer Register, which also has sponsored
part of the analyses.
The limited information of the elemental carbon fraction was not necessarily a large
problem for the indicative numbers. Elemental carbon is a fraction of the total
particulate matter emissions, and it can therefore not exceed the particulate matter
emissions. With the substantial decrease of particulate matter emissions of the
main vehicle source, the diesel vehicles, the elemental carbon emissions have
decreased as well. Even if the fraction of elemental carbon has increased for some
technologies, the total emissions has dropped. For example, the indicative emission
factors for passenger cars, show the dominance of older diesel vehicles in the total
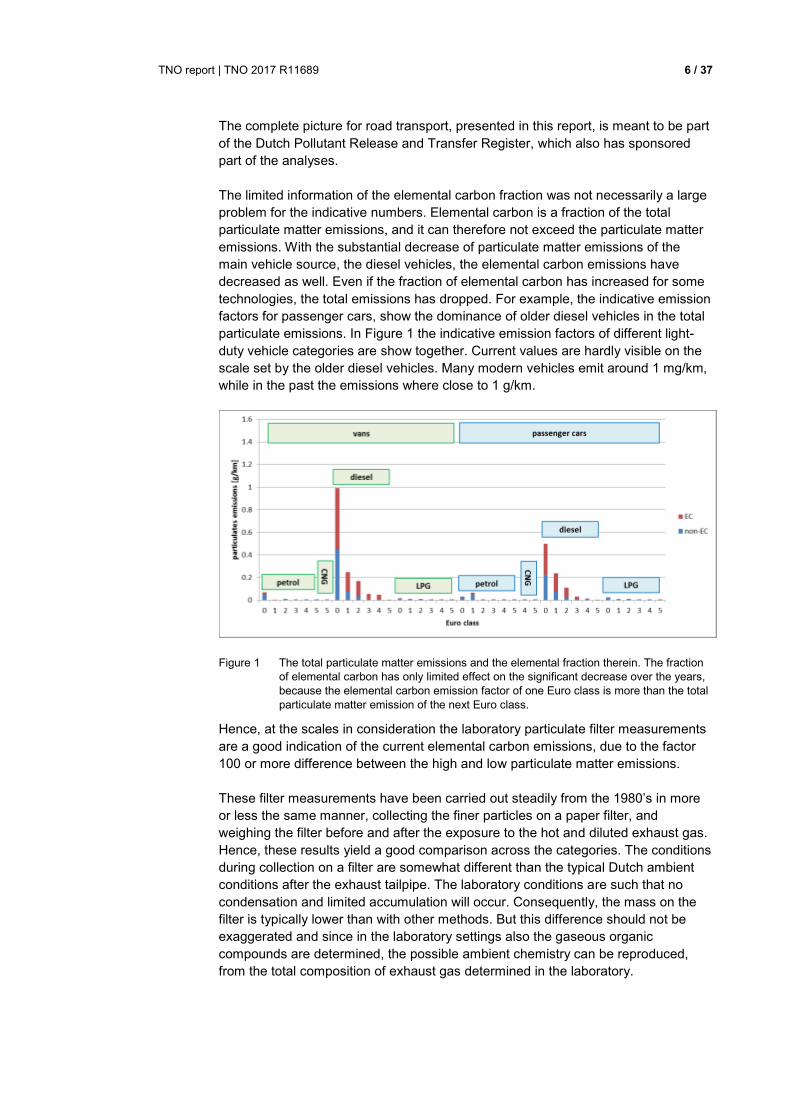
particulate emissions. In Figure 1 the indicative emission factors of different light-
duty vehicle categories are show together. Current values are hardly visible on the
scale set by the older diesel vehicles. Many modern vehicles emit around 1 mg/km,
while in the past the emissions where close to 1 g/km.
Figure 1 The total particulate matter emissions and the elemental fraction therein. The fraction
of elemental carbon has only limited effect on the significant decrease over the years,
because the elemental carbon emission factor of one Euro class is more than the total
particulate matter emission of the next Euro class.
Hence, at the scales in consideration the laboratory particulate filter measurements
are a good indication of the current elemental carbon emissions, due to the factor
100 or more difference between the high and low particulate matter emissions.
These filter measurements have been carried out steadily from the 1980’s in more
or less the same manner, collecting the finer particles on a paper filter, and
weighing the filter before and after the exposure to the hot and diluted exhaust gas.
Hence, these results yield a good comparison across the categories. The conditions
during collection on a filter are somewhat different than the typical Dutch ambient
conditions after the exhaust tailpipe. The laboratory conditions are such that no
condensation and limited accumulation will occur. Consequently, the mass on the
filter is typically lower than with other methods. But this difference should not be
exaggerated and since in the laboratory settings also the gaseous organic
compounds are determined, the possible ambient chemistry can be reproduced,
from the total composition of exhaust gas determined in the laboratory.
TNO report | TNO 2017 R11689 7 / 37
Consequently, the gaseous hydrocarbons will yield an upper bound to the total
particulate matter in other conditions than the laboratory conditions. In many cases
the hydrocarbon emissions are from different engine operation conditions; low load
rather than high load. If the emissions of particulate matter and hydrocarbons do not
occur simultaneously, they cannot form compounds different from the composition
collected on the filter.
The complex emission-reduction after-treatment systems of modern diesel vehicles
does seem to have altered the nature and formation of diesel particulates after the
engine. For example, high-pressure exhaust gas recirculation (HP-EGR), will re-
introduce particulate matter in the engine again and it will likely yield a larger
fraction of elemental carbon in this second round combustion. Furthermore,
catalytic after-treatment technology will affect the exhaust gas composition in many
complex ways. Consequently, it is important that the measurement of particulate
matter and elemental carbon should be executed on common technology and in
representative situations for the emission factors. The storage and release of
particulates from the after-treatment components depends on the built-up and the
temperature management which can be related to urban or motorway driving the
previous day.
1.2 Data gaps in the indicative numbers
The indicative emission factors and the development of vehicle technologies have
been key in establishing the major gaps in the current knowledge regarding
elemental carbon emissions. In that case the Euro-V trucks, the last diesel vehicles
without particulate filter, and the Euro-4 diesel passenger cars, the last light-duty
vehicles without particulate filter, are the dominant categories. Some increase in
particulate matter emissions and elemental carbon emissions are expected with the
introduction of gasoline direct injection (GDI). In the light of the low emissions of
port-injection petrol vehicles, the increase may be substantial. Especially cold start
emissions and high load emissions are reasons for concern. The GDI’s have been
tested for particulate mass, particulate mass, and elemental carbon emissions.1
A few years ago, a Euro-V engine with SCR have been used to determine
elemental carbon emissions.2 Apart from the cross correlation of different methods,
this study gave indications that the heat up of the after-treatment system affects the
results.
1.3 Elemental carbon emission factors in this report
This report is the background to the publication of the elemental carbon emissions
factors for all categories of vehicles. Indicative elemental carbon emission factors
have been used indicatively from 2011 onwards. In order to link these emissions to
particular sources a backlog of vehicle categories is updated in the emission factors
database at TNO. Additional tests are carried out and used to update and expand
the list of emission factors.
1 TNO 2016 R11247 Emissions of three common GDI vehicles, Norbert E. Ligterink 2 TNO 2015 R11041 HD Euro-V truck PM10 and EC emission factors, Uilke Stelwagen and
Norbert Ligterink
TNO report | TNO 2017 R11689 8 / 37
It should be noted, however, that special particulate matter reduction technologies,
as was common around 2000-2009, with, for example, the CRT (Continuous
Regenerating Trap) technology with the stricter EEV emission standards for busses
are not properly represented in the data underlying these emission factors.
Another feature, regarding particulate matter emissions, which would require further
study for a complete picture is the deterioration of the particulate emissions. It is
expected that with the aging of vehicles, and, e.g., the increase of the lubricant
consumption, the particulate matter emissions are expected to increase. Currently,
for example, the particulate emissions of older diesel vehicles are based on
measurements from the past, when these vehicles had a lower mileage, combined
with a limited deterioration factor based on conservative estimates of the
deterioration. The number of vehicles concerned is small, but the emissions are
high compared to newer and petrol vehicles.
Hence, current elemental emission factors are suitable to determine total and the
average elemental carbon emissions. The comparison of the relative impact of
different vehicle categories must be done with great care. For a number of cases
the relative difference between vehicle categories is uncertain. This uncertainty is
large for two cases: First, the emissions below 5 mg/km is close to the standard
measurement accuracy. Results in the order of 1-2 mg/km require dedicated
testing, to ensure the collection of enough material on the filter. Moreover, for
example filter regenerations in diesel vehicles occur about once every 500 km,
contributing significantly to the total emissions of a few mg/km, but of unclear
composition. The second case is special technologies and fuels, which also include
CNG, LPG, bio-admixture in fuel, all known to affect the particulate emissions, but
without enough test results to distinguish relative effects accurately. As it is unlikely
the emissions are more than twofold higher than the conventional counterparts,
they have received little attention because of the limited impact on the emission
totals.
Chapter 2 provides a general description of the elemental carbon emissions from
vehicle exhaust, including a description of measurement techniques and the
importance of certain vehicle categories. Chapter 3 discusses the indicative
elemental carbon emission factors and the results of recent testing on elemental
carbon emission factors, providing the background data on the PM and EC
emission factors (as presented in Appendix A). The effects of driving behaviour and
vehicle usage on emission factors are discussed in chapter 4. Chapter 5 provides
the conclusions.
TNO report | TNO 2017 R11689 9 / 37
2 Elemental carbon emission from the vehicle exhaust
Elemental carbon is a fraction of the total particulate matter. In exhaust emissions,
the fractions typically vary between 10% and 95%. Diesel vehicles with EGR but
without after-treatment technology generally have the highest elemental carbon
fraction and mopeds the lowest. In its most strict sense, determination of elemental
carbon emissions requires chemical analysis of an inert filter, typically quartz, which
collects exhaust gas directly from the tailpipe, prior to subsequent reactions in the
ambient air. References to “elemental carbon” are often based on simpler,
approximate methods, like black carbon or opacity meters. However, many
alternative proxy methods have been used, to establish elemental carbon emission
factors. In the recent testing, some methods have been compared. In other cases,
the emission measurements have been conform the air-quality methods as much as
possible. For diesel vehicles with a filter (DPF, Diesel Particulate Filter) the
emissions were often so low that an accurate determination of the EC fraction was
not possible.
Paragraph 2.1 provides a description of different measurement methods and the
possible drawbacks of these measurement methods, while paragraph 2.2 and 2.3
provides a more detailed description of the measurement possibilities and
drawbacks.
Paragraph 2.4 describes the international reporting of elemental carbon
concentrations in ambient air and paragraph 2.5 describes the health effects. In
paragraph 2.6, a description of important vehicle categories with regard to EC
emissions is provided.
2.1 Particulate mass, particulate number, and elemental carbon measurement
techniques
Black smoke, black carbon and elemental carbon are different measures to quantify
the dark exhaust smoke. Elemental carbon is the mass amount of thermally stable
carbon. On the other hand, black carbon and black smoke are based on the light
absorption properties of the particulate matter. The black smoke, or smoke, has
been the initial measure of a performance of a vehicle on particulate matter,
developed by the combustion engineers themselves. Different tests are correlated
by comparable scales, such as Bosch smoke number, Hartridge smoke units and
light absorption in [m-1]. Black smoke is visible from 0.15 g/m33. This corresponds to
about 1 g/kWh under normal engine operation; double the Euro-I emission limit.
These measurement techniques have been replaced in the European legislation
with a filter weight measurement, and recently with particle number measurements.
The filter results reproduced better, at the time, than the variety of smoke
measurement techniques, some of which are rather historic.
This paragraph provides information on the different definitions and different
measurement methods to express black carbon. Black Carbon (BC) is quantitatively
not well defined and it is a generally descriptive term given to a collection of optical
techniques. Emission sources of incomplete combustion processes, BC is
particulate matter, which contains a lot of carbon and is strongly light absorbing.
3 Benzine en dieselmotoren. H. Grohe.
TNO report | TNO 2017 R11689 10 / 37
It is a primary source, linking emissions with ambient concentrations, in the sense
that it cannot be formed in the atmosphere from other precursor species. When
definitions are given, it often does not become more clear how to measure it, e.g.,
US, EPA (2012)4 defines BC as a solid form of mostly pure carbon that absorbs
solar radiation (light) at all wavelengths. BC is the most effective form of PM, by
mass, at absorbing solar energy, and is produced by incomplete combustion. IPCC
(2013)5 states that “BC is an operationally defined aerosol species based on
measurement of light absorption and chemical reactivity and/or thermal stability. It is
sometimes referred to as soot”. Recently Petzold et al. (2013)6 concluded that BC is
a qualitative description when referring to light absorbing carbonaceous
substances in atmospheric aerosol. Most importantly, BC has four properties (Bond
et al., 2013)7:
1. Chemically stable: Refractory with vaporization temperature near 4000 K 8
2. Strong visible light absorption at 550 nm 9
3. Aggregate morphology 10
4. Insolubility in water and common organic solvents11:
The properties 3 and 4 (on morphology and solubility) find their applications more
frequent in academic studies. The properties 1 and 2 are measured and can be
used to quantify black carbon.
EC (Elemental Carbon) refers to chemically stable carbon (property 1), whereas
opacity meters, smoke meters, and absorption photometers rely on the absorption
property (property 2). Both properties measure a property of black carbon, but both
properties are different and so are the outcomes. Both methods EC and light
absorption refer to the black carbon and associations are thus to be expected,
correlations depend on the specific sampling conditions.
2.2 Absorption measurements for determining equivalent black carbon
Opacity instruments are quick and cheap and designed and used for inspection and
maintenance or periodical technical inspection. However, better filtering and after-
treatment techniques put the usability of opacity meters under pressure.
E.g., the cleaner exhaust brings the meters to their lower detection limit, with
stronger particulate emission reduction as compared to NO2, the cross sensitivity of
NO2 absorption becomes increasingly important, and thirdly opacity meters are
4 EPA, 2012. Report to congress on black carbon. EPA-450/R-12-01. Mach 2012. 5 IPCC, 2013. Climate Change 2013. The Physical Science Basis. Contribution of Working Group I
to the Fifth assessment Report of the Intergovernmental Panel on Climate Change. 6 Petzold, A., et al., 2013, 'Recommendations for the interpretation of "black carbon"
measurements', Atmospheric Chemistry and Physics, (13) 9 485–9 517. 7 Bond TC, et al., 2013. Bounding the role of black carbon in the climate system: a scientific
assessment. J Geophys Res. 118(11), 5380–5552. 8. Schwarz, J.P. et al., Single-Particle Measurements of Midlatitude Black Carbon and Light-
Scattering Aerosols from the Boundary Layer to the Lower Stratosphere. J. Geophys. Res. Atmos.,
111(D16). 9 Bond, T. C., and R. W. Bergstrom (2006), Light absorption by carbonaceous
particles: An investigative review, Aerosol Sci. Technol.,41(1), 27–47 10 Medalia, A. I., and Heckman, F. A. (1969). Morphology of Aggregates II. Size and Shape
Factors of Carbon Black Aggregates from Electron Microscopy. Carbon 7:567–582. 11 Fung, K., Particulate Carbon Speciation by MnO2 Oxidation, 1990, Aerosol Science and
Technology 12(1):122-127.
TNO report | TNO 2017 R11689 11 / 37
insensitive to the smallest particles (e.g. <200nm) that becomes relatively more
abundant in modern exhaust emissions.
Smoke meters that rely on transmission or reflection of light through a particle laden
filter, report in different units such as Filter Smoke Number, Bosch Smoke unit, or
Hartridge Smoke Units.12 The advantage of these techniques is that they are
comparable to ambient air monitoring that rely on the same principle. The daily
average Black Smoke Index that faded into oblivion, is now replaced by filter based
absorption photometers such as Aethalometer and Multi Angle Absorption
Photometer (MAAP) that provide temporally resolved light absorption coefficients.
With the appropriate mass specific extinction coefficient, i.e., how much light is
absorbed per unit of mass, the absorption photometers report the convenient
equivalent Black Carbon mass concentrations that are easily compared to air
quality model calculations. The drawback of filter-based metrics is the sensitivity to
condensable co-emitted species and thus the sampling temperature and dilution
conditions. In automotive measurements these conditions are prescribed to achieve
reproducible results. Moreover, this hampers the inter-comparability between
emission measurements and ambient air monitoring that are not representative for
same conditions. Finally, the aerosol light absorption properties are not constant
after emissions, because during aging coatings are formed that may enhance the
light absorption.
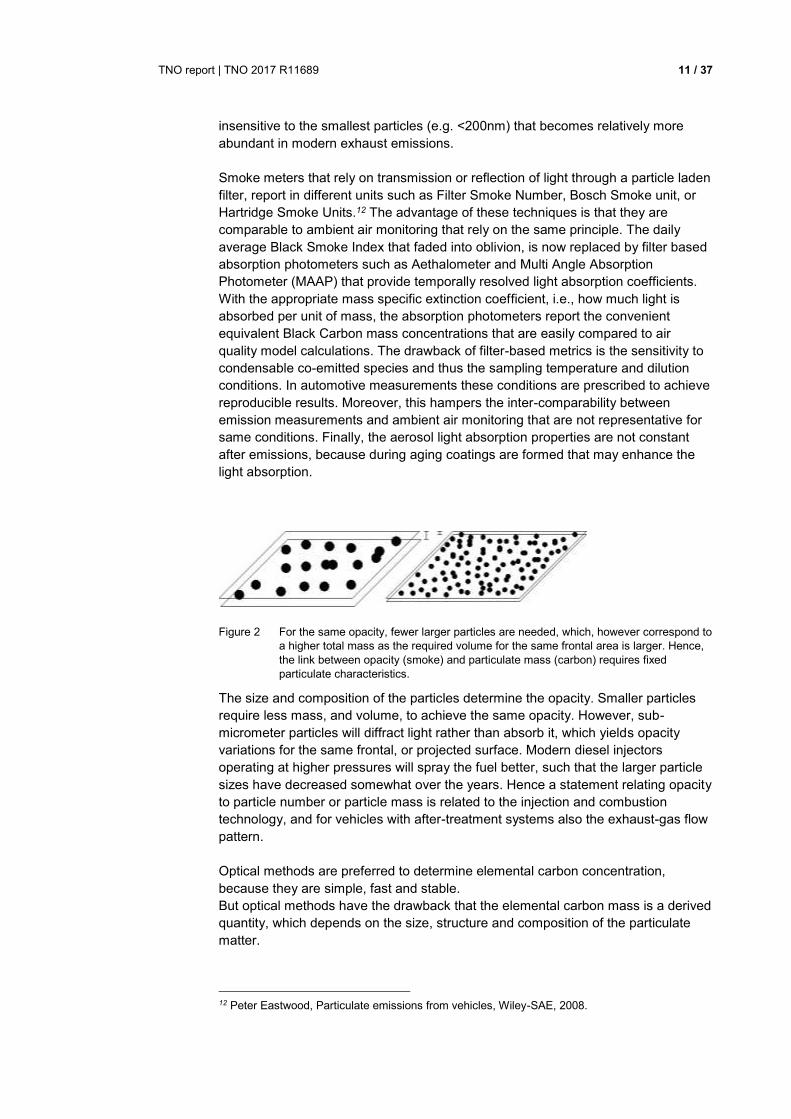
Figure 2 For the same opacity, fewer larger particles are needed, which, however correspond to
a higher total mass as the required volume for the same frontal area is larger. Hence,
the link between opacity (smoke) and particulate mass (carbon) requires fixed
particulate characteristics.
The size and composition of the particles determine the opacity. Smaller particles
require less mass, and volume, to achieve the same opacity. However, sub-
micrometer particles will diffract light rather than absorb it, which yields opacity
variations for the same frontal, or projected surface. Modern diesel injectors
operating at higher pressures will spray the fuel better, such that the larger particle
sizes have decreased somewhat over the years. Hence a statement relating opacity
to particle number or particle mass is related to the injection and combustion
technology, and for vehicles with after-treatment systems also the exhaust-gas flow
pattern.
Optical methods are preferred to determine elemental carbon concentration,
because they are simple, fast and stable.
But optical methods have the drawback that the elemental carbon mass is a derived
quantity, which depends on the size, structure and composition of the particulate
matter.
12 Peter Eastwood, Particulate emissions from vehicles, Wiley-SAE, 2008.
TNO report | TNO 2017 R11689 12 / 37
Hence the correlation with mass, of any optical methods, may vary with the
combustion technology and the path between combustion and measurement
instrument.
Depending on the particle concentration, duration, and flow, particles may
coagulate or cluster. At concentrations in the dilution tunnel and the ambient air this
process will take hours to days to produce the larger particles of 200 nm. Hence this
will only play a limited role in experiments with an engine test bed. The initial
nucleation, to 20-30 nm occurs already in the combustion chamber. The medium
accumulation from 30 nm to 100 nm will occur rapidly, and this may be affected by
the dilution ratio, flow profiles, and residence time, in the experiment.
During sampling, conditions such as temperature and composition of the ambient
air are important, because it will affect the measurements of equivalent black
carbon. To avoid formation of droplets and evaporation of e.g. hydrates and
sulphates from the soluble organic fraction, the dry air temperatures should be kept
between 20 and 52 degrees Celsius.
Most of the drawbacks for measuring equivalent black carbon, can be overcome
when elemental carbon is used in the monitoring networks, i.e. air quality
measurements and modelling, and when emission factors are based on elemental
carbon. The disadvantage is that EC measurements in a network are more time
consuming (costly) and for high quality data 24-hour sampling is the standard, so
that information on diurnal time scales is lost. Measurement networks therefore
frequently rely on absorption photometers (MAAP). The advantage of harmonized
high quality EC emission factors outweigh the lacking direct comparability to air
quality measurement metrics of (equivalent) black carbon.
2.3 EUSAAR/SUNSET method of determining elemental carbon fractions
The elemental carbon fraction, as opposed to the carbon which is part of organic
material, is determined in physical-chemical analysis, where the filter material is
exposed to increasing temperatures in an oven in different atmospheres. The filter
material must be inert not to contaminate the results. Therefore quartz filters are
used. Quartz filters are brittle, so parts can break off such that the mass of the filter
before and after the emission test is no longer a measure of the amount of
particulate matter deposited. This disadvantage is taken on board in the use of
quartz filters in repeat experiments in different projects. The filters were
subsequently analysed for elemental carbon and organic carbon fractions. The
separation between OC and EC is based on the thermal and chemical stability of
the aerosol, i.e., OC comes off the filter at lower temperatures in an inert Helium
atmosphere and EC leaves the filter at higher temperatures when oxygen is added.
The method is less accurate for the total amount of material as two features play a
role: the material may not have been deposited homogenously, such that the result
of a part of the filter cannot be scaled to the total result. Second, the method tests
only for the states of matter of carbon. The total mass contains organic matter,
which may be a larger fraction than it used to be due to the use of oxygenated fuels.
Moreover, metal and other non-organic mineral material, like ash, may be present
on the filter in small fractions. Some bounds on limitations are given in Table 1.
Non-organic material does not come up in the EUSAAR analysis.
TNO report | TNO 2017 R11689 13 / 37
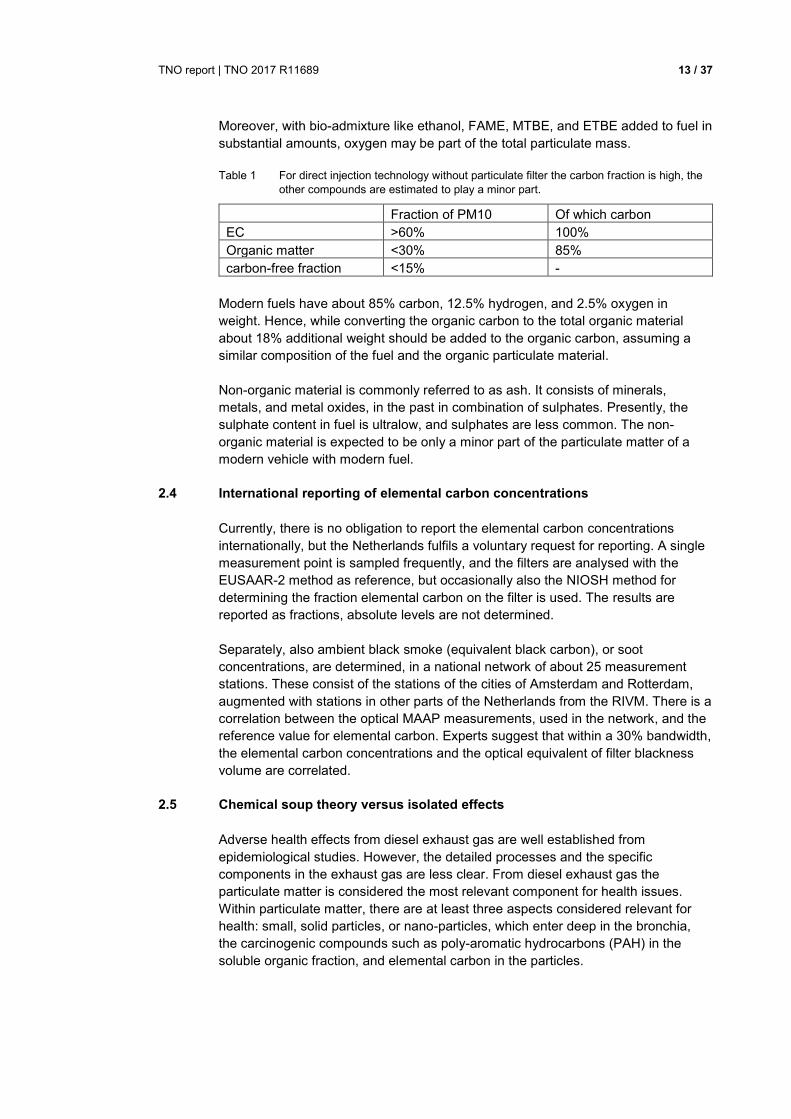
Moreover, with bio-admixture like ethanol, FAME, MTBE, and ETBE added to fuel in
substantial amounts, oxygen may be part of the total particulate mass.
Table 1 For direct injection technology without particulate filter the carbon fraction is high, the
other compounds are estimated to play a minor part.
Fraction of PM10 Of which carbon
EC >60% 100%
Organic matter <30% 85%
carbon-free fraction <15% -
Modern fuels have about 85% carbon, 12.5% hydrogen, and 2.5% oxygen in
weight. Hence, while converting the organic carbon to the total organic material
about 18% additional weight should be added to the organic carbon, assuming a
similar composition of the fuel and the organic particulate material.
Non-organic material is commonly referred to as ash. It consists of minerals,
metals, and metal oxides, in the past in combination of sulphates. Presently, the
sulphate content in fuel is ultralow, and sulphates are less common. The non-
organic material is expected to be only a minor part of the particulate matter of a
modern vehicle with modern fuel.
2.4 International reporting of elemental carbon concentrations
Currently, there is no obligation to report the elemental carbon concentrations
internationally, but the Netherlands fulfils a voluntary request for reporting. A single
measurement point is sampled frequently, and the filters are analysed with the
EUSAAR-2 method as reference, but occasionally also the NIOSH method for
determining the fraction elemental carbon on the filter is used. The results are
reported as fractions, absolute levels are not determined.
Separately, also ambient black smoke (equivalent black carbon), or soot
concentrations, are determined, in a national network of about 25 measurement
stations. These consist of the stations of the cities of Amsterdam and Rotterdam,
augmented with stations in other parts of the Netherlands from the RIVM. There is a
correlation between the optical MAAP measurements, used in the network, and the
reference value for elemental carbon. Experts suggest that within a 30% bandwidth,
the elemental carbon concentrations and the optical equivalent of filter blackness
volume are correlated.
2.5 Chemical soup theory versus isolated effects
Adverse health effects from diesel exhaust gas are well established from
epidemiological studies. However, the detailed processes and the specific
components in the exhaust gas are less clear. From diesel exhaust gas the
particulate matter is considered the most relevant component for health issues.
Within particulate matter, there are at least three aspects considered relevant for
health: small, solid particles, or nano-particles, which enter deep in the bronchia,
the carcinogenic compounds such as poly-aromatic hydrocarbons (PAH) in the
soluble organic fraction, and elemental carbon in the particles.
TNO report | TNO 2017 R11689 14 / 37
For mopeds with poor combustion characteristics, the organic matter may play a
more important role in the toxic nature of the exhaust gas. The elemental carbon
fraction is smaller for these vehicles and determining the relative impact of moped
solely on the basis of elemental carbon emission may underestimate the relevance
for health.
2.6 Important vehicle categories for total emissions and local hotspots
Vehicle PM emissions range between 1 mg/km and 1000 mg/km, and a similar
range for EC emissions. This wide range implies that a few strongly emitting
vehicles make up a large fraction of total emissions. For example, one old diesel
vehicle will fully compensate the effect of emission reduction measures of hundreds
of diesel vehicles that are fitted with a wall-flow diesel particulate filter (DPF). The
DPF technology, that is more or less compulsory since the European vehicle
legislation, effectively reduces particulate emissions to a factor five to ten below the
limit. Generally, ambient air contains more particulates than the diesel exhaust gas
after the DPF. The fact that some vehicle categories dominate the (uncertainty of)
emission totals and/or concentrations, these categories received special attention in
this work.
For the future, the last of the heavy-duty trucks and busses without DPF are an
important vehicle category, Euro-V, for particulate emissions. A number of studies
have been devoted to determine the elemental carbon emissions, and to link the
emission to driving behaviour. Since elemental carbon is obtained from a filter
measurement, i.e., the results over longer time, relating the results back to
instantaneous behaviour is not trivial.
Another emerging vehicle category for particulate and elemental carbon emissions
are the GDI. This is not because of the high emissions, but because of the number
of vehicles and the lifespan of sixteen years or more, on the Dutch road. The
majority of the kilometres on the Dutch roads are driven with petrol passenger cars.
The new cars have direct injection technology in large numbers. Consequently, 1
mg/km extra elemental carbon emissions of GDIs can mean 50 tons of elemental
carbon emissions every year, least up to 2030. The difference of 1 mg/km is a very
small number, close to the measuring uncertainty. But the total number of vehicles
and the mileages associated generates one of the largest impacts. Therefore, this
technology was studied to complete the picture on elemental carbon.
The diesel passenger cars without particulate filter are exported in large numbers,
but also a number of these vehicles are imported. Consequently, a small group of
older diesel passenger cars are retained in the Netherlands. It is not a large group
but with particulate mass emissions of 30 mg/km and more, and a large fraction of
elemental carbon, and typically larger annual mileages the contribution of this group
of vehicles to elemental carbon is quickly tenfold of what one would expect based
on the number of vehicles solely. That is to say, if 1% of the vehicles is a diesel
vehicle without a particulate filter, they are likely to contribute around 10% to the
total elemental carbon emissions. A minor check on the elemental carbon fraction of
90% and on the total emissions of these vehicles is the minimal requirement to
establish the remaining uncertainty.
TNO report | TNO 2017 R11689 15 / 37
3 Recent testing for elemental carbon emissions
This chapter gives an overview of the sources of data underlying the current EC
emission factors, and the use of these emission factors so far in comparison with air
quality. The emission factors circulated already for many years. They have been
updated and improved on the fly. But given their indicative nature, they were never
reported. This chapter reconstructs as well as possible the underlying sources used
to determine these emission factors.
Early indicative numbers for elemental carbon emission factors are circulating for a
few years. They were initially based on COPERT and additional studies and
entered into the VERSIT+ database. Additional data was checked against the
available bandwidth, and from time to time errors were corrected, and numbers
were changed to reflect the current understanding of different vehicle technologies
in Europe and the Netherlands. An initial project13 in 2011 to establish the need and
use of soot concentration measurements lay the basis of the EC emission factors.
For four years, indicative numbers were published and compared with air-quality
results and top-down assessments by the RIVM. This generated confidence that the
bottom-up elemental carbon emissions matched the common understanding of the
contribution of the current vehicle fleet to the air-quality measurements.
The main uncertainties, relevant for the total emissions, were with Euro-V trucks
and GDIs. Before the publication of elemental carbon emission factors, these
figures required additional validation. For Euro-V trucks two internal research
programs gave the opportunity to have a closer look at these elemental carbon
emissions factors. For GDIs the Ministry of Infrastructure and Environment
sponsored a small test program to investigate elemental carbon emission factors of
this category.
Additionally, from a larger test program for the European Commission14 on mopeds
a number of filters were analysed for elemental carbon. Mopeds are a complex
urban problem, and the emissions are unlike the modern passenger cars and
trucks. The hydrocarbon and carbon monoxide emissions are high. The question
remains if elemental carbon is part of the chemical soup, and how. The testing gave
an opportunity to investigate this. However, no conclusive EC emission factor can
be deduced from this testing, because of the large variation in the results. In
absolute sense, moped emissions of EC are relatively low, compared to diesel
vehicles without filter and also most of the petrol passenger cars. Combined with
the limited distance covered, the mopeds play only a minor part in the total EC
emissions. Only because of their presence on the cycle lanes, local exposure of
cyclists and inner-city dwellers, mopeds may be an issue.
13 TNO-060-UT-2011-02161 Verantwoording operationalisering roetindicator in Nederland, M.P
Keuken et al.. 14 TNO 2017 R10565 Effect study of the environmental step Euro 5 for L-category vehicles.
TNO report | TNO 2017 R11689 16 / 37
3.1 Important vehicle categories and their emission legislation
In the total elemental carbon emissions, the older diesel vehicles play an important
role. Unlike NOx emission control, the particulate emissions control is more robust,
i.e., it requires technology which functions more or less irrespectively of the
circumstances. Therefore, the real-world particulate emissions of diesel cars follow
the same trend as the emission limits. The evolution of the emission limits is shown
in Table 2. Hence, for elemental carbon a similar trend is expected, with a thirtyfold
decrease in emission limits over 25 years. The real world emissions have
decreased even more, because of the diesel particulate filter. The emission
legislation has stimulated a hundredfold decrease in real-world PM emissions. The
real-world values have decreased from about 200-300 mg PM10/km at the start of
Euro-0 to 1-2 mg PM10/km for Euro-5 and Euro-6.
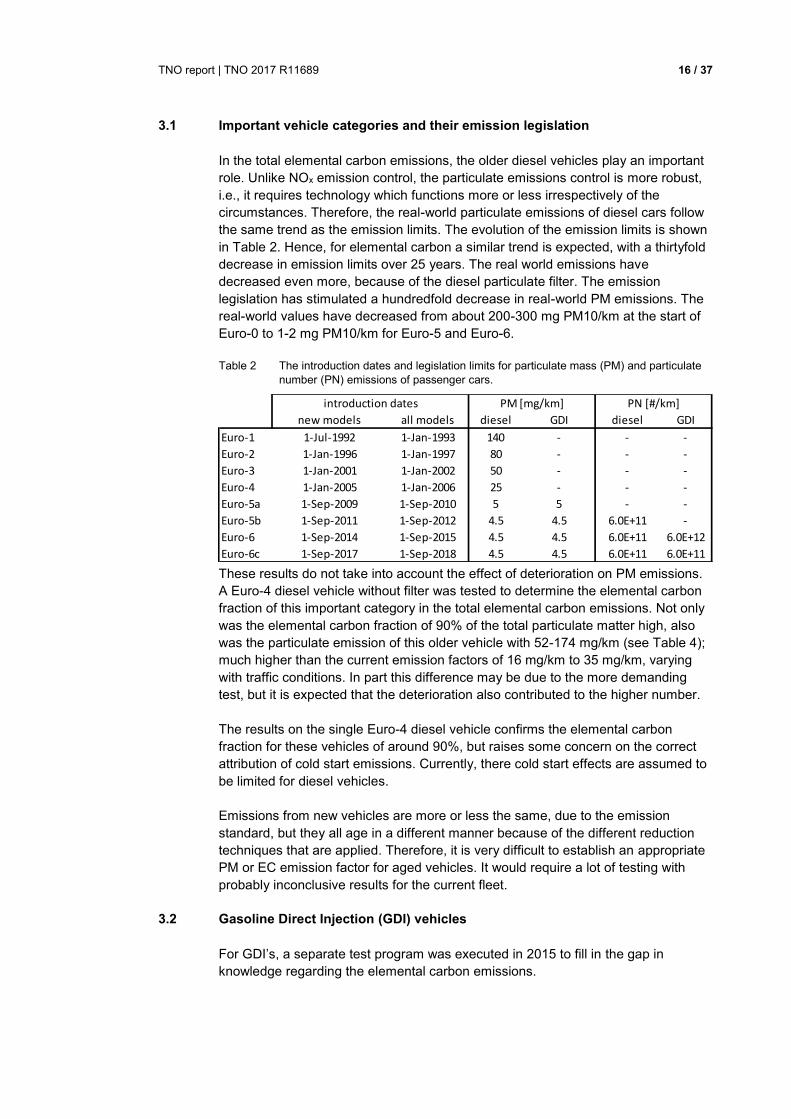
Table 2 The introduction dates and legislation limits for particulate mass (PM) and particulate
number (PN) emissions of passenger cars.
These results do not take into account the effect of deterioration on PM emissions.
A Euro-4 diesel vehicle without filter was tested to determine the elemental carbon
fraction of this important category in the total elemental carbon emissions. Not only
was the elemental carbon fraction of 90% of the total particulate matter high, also
was the particulate emission of this older vehicle with 52-174 mg/km (see Table 4);
much higher than the current emission factors of 16 mg/km to 35 mg/km, varying
with traffic conditions. In part this difference may be due to the more demanding
test, but it is expected that the deterioration also contributed to the higher number.
The results on the single Euro-4 diesel vehicle confirms the elemental carbon
fraction for these vehicles of around 90%, but raises some concern on the correct
attribution of cold start emissions. Currently, there cold start effects are assumed to
be limited for diesel vehicles.
Emissions from new vehicles are more or less the same, due to the emission
standard, but they all age in a different manner because of the different reduction
techniques that are applied. Therefore, it is very difficult to establish an appropriate
PM or EC emission factor for aged vehicles. It would require a lot of testing with
probably inconclusive results for the current fleet.
3.2 Gasoline Direct Injection (GDI) vehicles
For GDI’s, a separate test program was executed in 2015 to fill in the gap in
knowledge regarding the elemental carbon emissions.
new models all models diesel GDI diesel GDI
Euro-1 1-Jul-1992 1-Jan-1993 140 - - -
Euro-2 1-Jan-1996 1-Jan-1997 80 - - -
Euro-3 1-Jan-2001 1-Jan-2002 50 - - -
Euro-4 1-Jan-2005 1-Jan-2006 25 - - -
Euro-5a 1-Sep-2009 1-Sep-2010 5 5 - -
Euro-5b 1-Sep-2011 1-Sep-2012 4.5 4.5 6.0E+11 -
Euro-6 1-Sep-2014 1-Sep-2015 4.5 4.5 6.0E+11 6.0E+12
Euro-6c 1-Sep-2017 1-Sep-2018 4.5 4.5 6.0E+11 6.0E+11
introduction dates PM [mg/km] PN [#/km]
TNO report | TNO 2017 R11689 17 / 37
The EC fraction was expected to be much higher than the elemental carbon
emissions of port-injection petrol cars, but on the other hand there is little
information on the absolute emissions and the relation with driving behaviour and
circumstances. Some intermittent testing by for example VTT in Finland and the
University of Prague gave indications that the cold start and the high load may lead
to high particulate mass emissions from GDI’s. In the recent TNO test program,
emissions of urban, rural, and motorway driving are separately determined, with the
cold start factored into the urban test. In this manner the results already match for a
greater part the three main road types for which emission factors are determined.
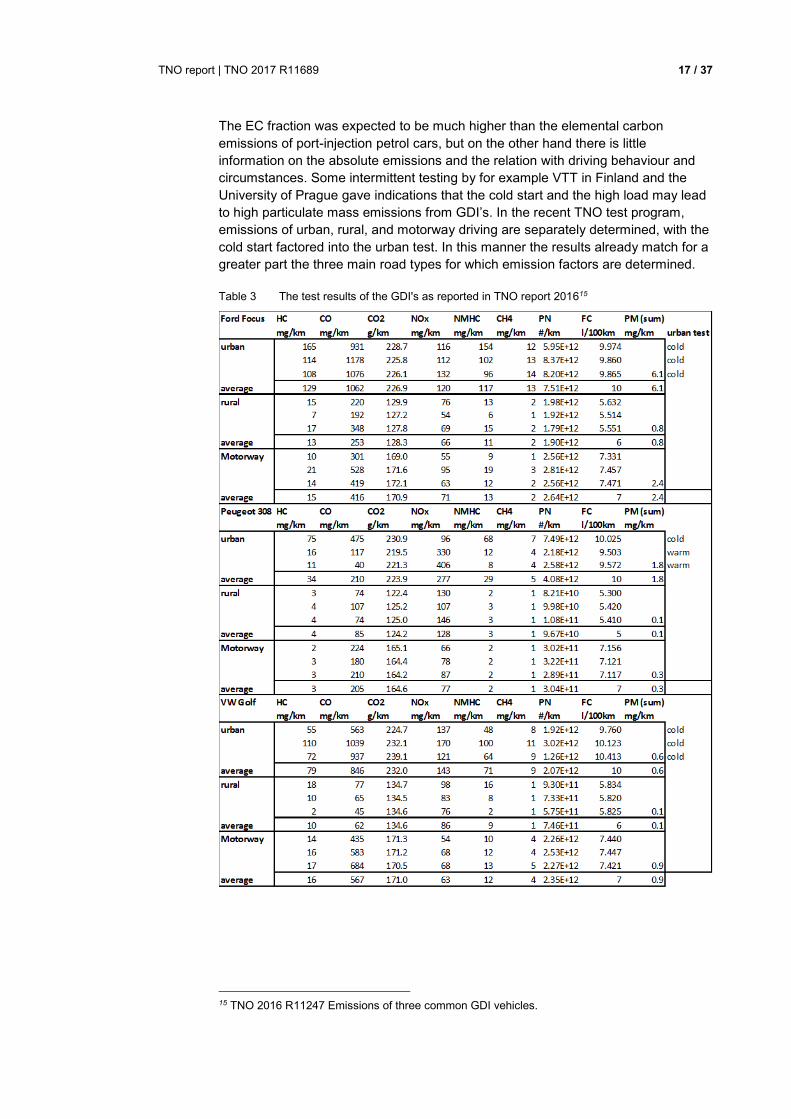
Table 3 The test results of the GDI's as reported in TNO report 201615
15 TNO 2016 R11247 Emissions of three common GDI vehicles.
TNO report | TNO 2017 R11689 18 / 37
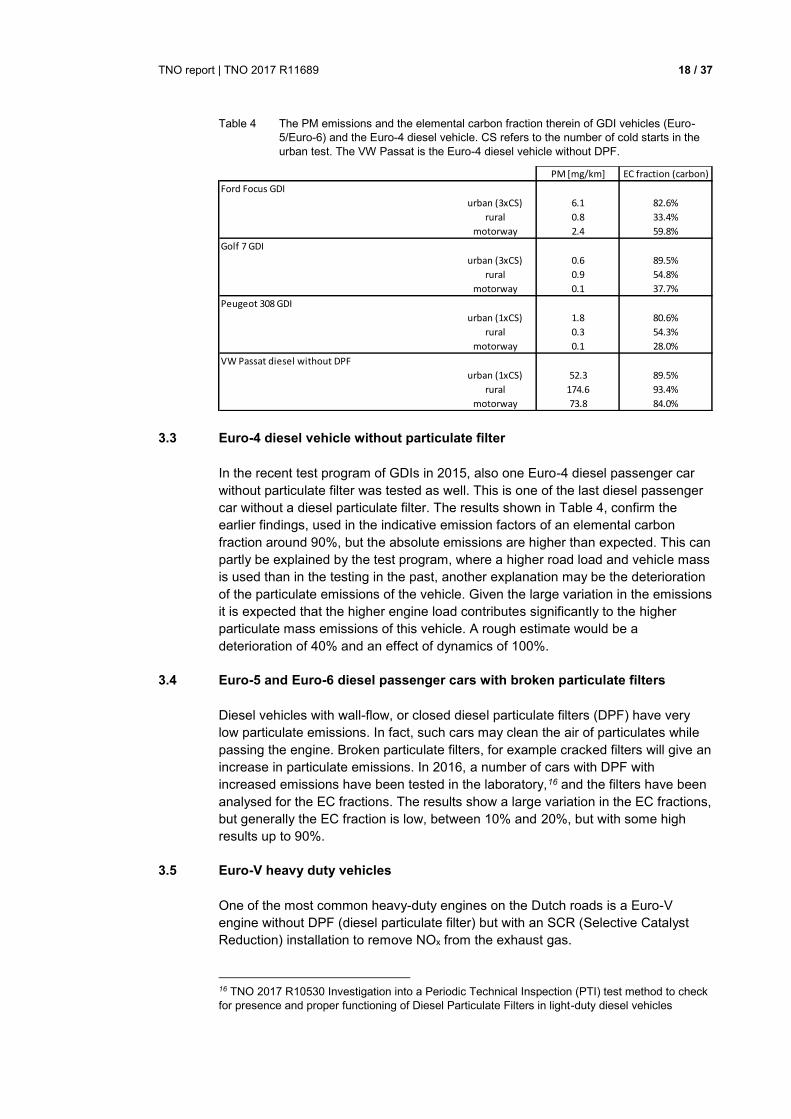
Table 4 The PM emissions and the elemental carbon fraction therein of GDI vehicles (Euro-
5/Euro-6) and the Euro-4 diesel vehicle. CS refers to the number of cold starts in the
urban test. The VW Passat is the Euro-4 diesel vehicle without DPF.
3.3 Euro-4 diesel vehicle without particulate filter
In the recent test program of GDIs in 2015, also one Euro-4 diesel passenger car
without particulate filter was tested as well. This is one of the last diesel passenger
car without a diesel particulate filter. The results shown in Table 4, confirm the
earlier findings, used in the indicative emission factors of an elemental carbon
fraction around 90%, but the absolute emissions are higher than expected. This can
partly be explained by the test program, where a higher road load and vehicle mass
is used than in the testing in the past, another explanation may be the deterioration
of the particulate emissions of the vehicle. Given the large variation in the emissions
it is expected that the higher engine load contributes significantly to the higher
particulate mass emissions of this vehicle. A rough estimate would be a
deterioration of 40% and an effect of dynamics of 100%.
3.4 Euro-5 and Euro-6 diesel passenger cars with broken particulate filters
Diesel vehicles with wall-flow, or closed diesel particulate filters (DPF) have very
low particulate emissions. In fact, such cars may clean the air of particulates while
passing the engine. Broken particulate filters, for example cracked filters will give an
increase in particulate emissions. In 2016, a number of cars with DPF with
increased emissions have been tested in the laboratory,16 and the filters have been
analysed for the EC fractions. The results show a large variation in the EC fractions,
but generally the EC fraction is low, between 10% and 20%, but with some high
results up to 90%.
3.5 Euro-V heavy duty vehicles
One of the most common heavy-duty engines on the Dutch roads is a Euro-V
engine without DPF (diesel particulate filter) but with an SCR (Selective Catalyst
Reduction) installation to remove NOx from the exhaust gas.
16 TNO 2017 R10530 Investigation into a Periodic Technical Inspection (PTI) test method to check
for presence and proper functioning of Diesel Particulate Filters in light-duty diesel vehicles
PM [mg/km] EC fraction (carbon)
Ford Focus GDI
urban (3xCS) 6.1 82.6%
rural 0.8 33.4%
motorway 2.4 59.8%
Golf 7 GDI
urban (3xCS) 0.6 89.5%
rural 0.9 54.8%
motorway 0.1 37.7%
Peugeot 308 GDI
urban (1xCS) 1.8 80.6%
rural 0.3 54.3%
motorway 0.1 28.0%
VW Passat diesel without DPF
urban (1xCS) 52.3 89.5%
rural 174.6 93.4%
motorway 73.8 84.0%
TNO report | TNO 2017 R11689 19 / 37
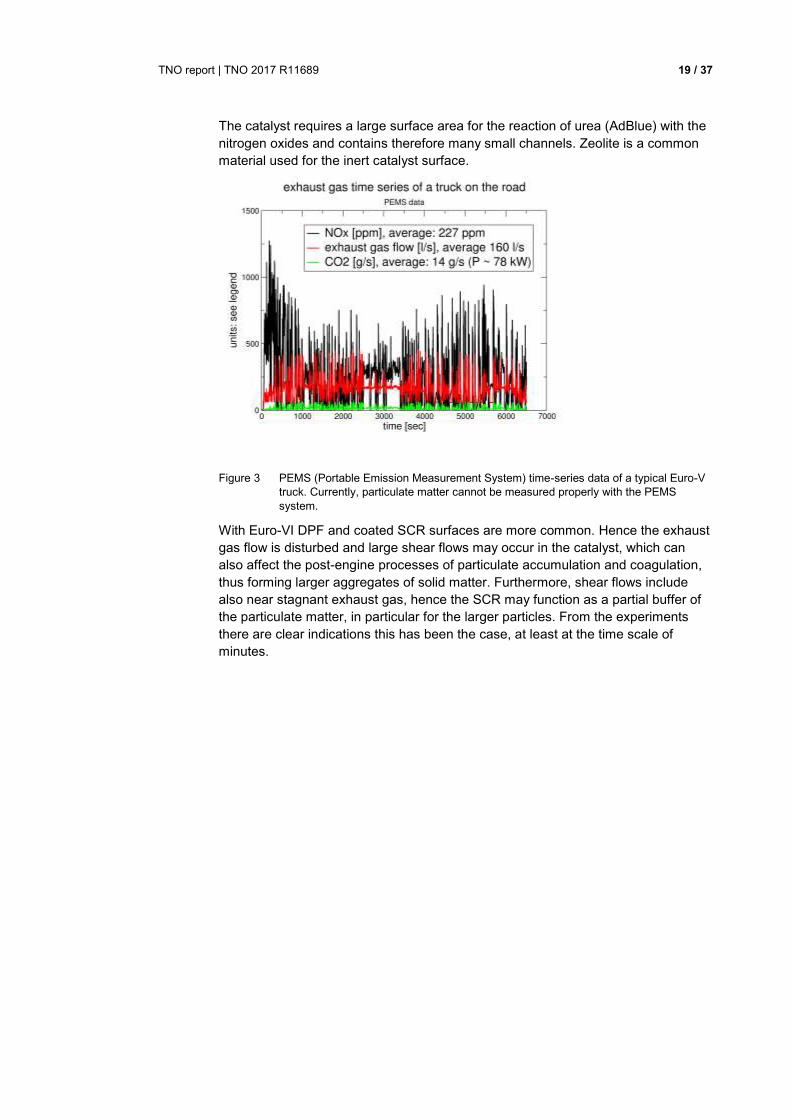
The catalyst requires a large surface area for the reaction of urea (AdBlue) with the
nitrogen oxides and contains therefore many small channels. Zeolite is a common
material used for the inert catalyst surface.
Figure 3 PEMS (Portable Emission Measurement System) time-series data of a typical Euro-V
truck. Currently, particulate matter cannot be measured properly with the PEMS
system.
With Euro-VI DPF and coated SCR surfaces are more common. Hence the exhaust
gas flow is disturbed and large shear flows may occur in the catalyst, which can
also affect the post-engine processes of particulate accumulation and coagulation,
thus forming larger aggregates of solid matter. Furthermore, shear flows include
also near stagnant exhaust gas, hence the SCR may function as a partial buffer of
the particulate matter, in particular for the larger particles. From the experiments
there are clear indications this has been the case, at least at the time scale of
minutes.
TNO report | TNO 2017 R11689 20 / 37
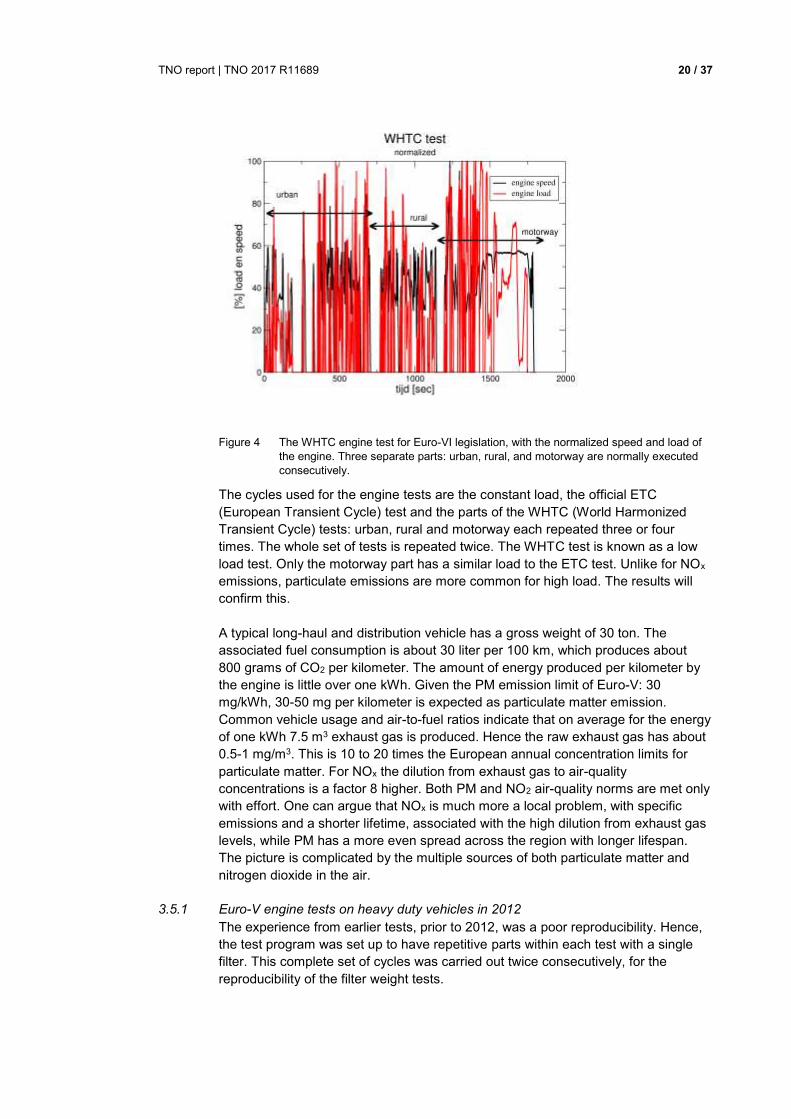
Figure 4 The WHTC engine test for Euro-VI legislation, with the normalized speed and load of
the engine. Three separate parts: urban, rural, and motorway are normally executed
consecutively.
The cycles used for the engine tests are the constant load, the official ETC
(European Transient Cycle) test and the parts of the WHTC (World Harmonized
Transient Cycle) tests: urban, rural and motorway each repeated three or four
times. The whole set of tests is repeated twice. The WHTC test is known as a low
load test. Only the motorway part has a similar load to the ETC test. Unlike for NOx
emissions, particulate emissions are more common for high load. The results will
confirm this.
A typical long-haul and distribution vehicle has a gross weight of 30 ton. The
associated fuel consumption is about 30 liter per 100 km, which produces about
800 grams of CO2 per kilometer. The amount of energy produced per kilometer by
the engine is little over one kWh. Given the PM emission limit of Euro-V: 30
mg/kWh, 30-50 mg per kilometer is expected as particulate matter emission.
Common vehicle usage and air-to-fuel ratios indicate that on average for the energy
of one kWh 7.5 m3 exhaust gas is produced. Hence the raw exhaust gas has about
0.5-1 mg/m3. This is 10 to 20 times the European annual concentration limits for
particulate matter. For NOx the dilution from exhaust gas to air-quality
concentrations is a factor 8 higher. Both PM and NO2 air-quality norms are met only
with effort. One can argue that NOx is much more a local problem, with specific
emissions and a shorter lifetime, associated with the high dilution from exhaust gas
levels, while PM has a more even spread across the region with longer lifespan.
The picture is complicated by the multiple sources of both particulate matter and
nitrogen dioxide in the air.
3.5.1 Euro-V engine tests on heavy duty vehicles in 2012
The experience from earlier tests, prior to 2012, was a poor reproducibility. Hence,
the test program was set up to have repetitive parts within each test with a single
filter. This complete set of cycles was carried out twice consecutively, for the
reproducibility of the filter weight tests.
TNO report | TNO 2017 R11689 21 / 37
Black smoke was measured via two different means: an automotive opacity meter
and an ambient air black carbon instrument, used in the national monitoring
network. The latter is using the discoloration of filter material to determine average
concentration levels.
The engine test was carried out on an engine test bed with a dilution tunnel. The
exhaust-gas black smoke sampling was carried out with the AVL439 opacity
equipment in the exhaust gas. The ambient-air black carbon was measured by
diluting the gas in the dilution tunnel by another factor twenty, by a TSI 3302A
diluter. The Thermo Model 5012 MAAP detector sampled this doubly-diluted gas on
a minute-by-minute basis. The AVL439 sampled the tunnel gas at a higher rate, but
the data was down sampled for comparison with the MAAP result.
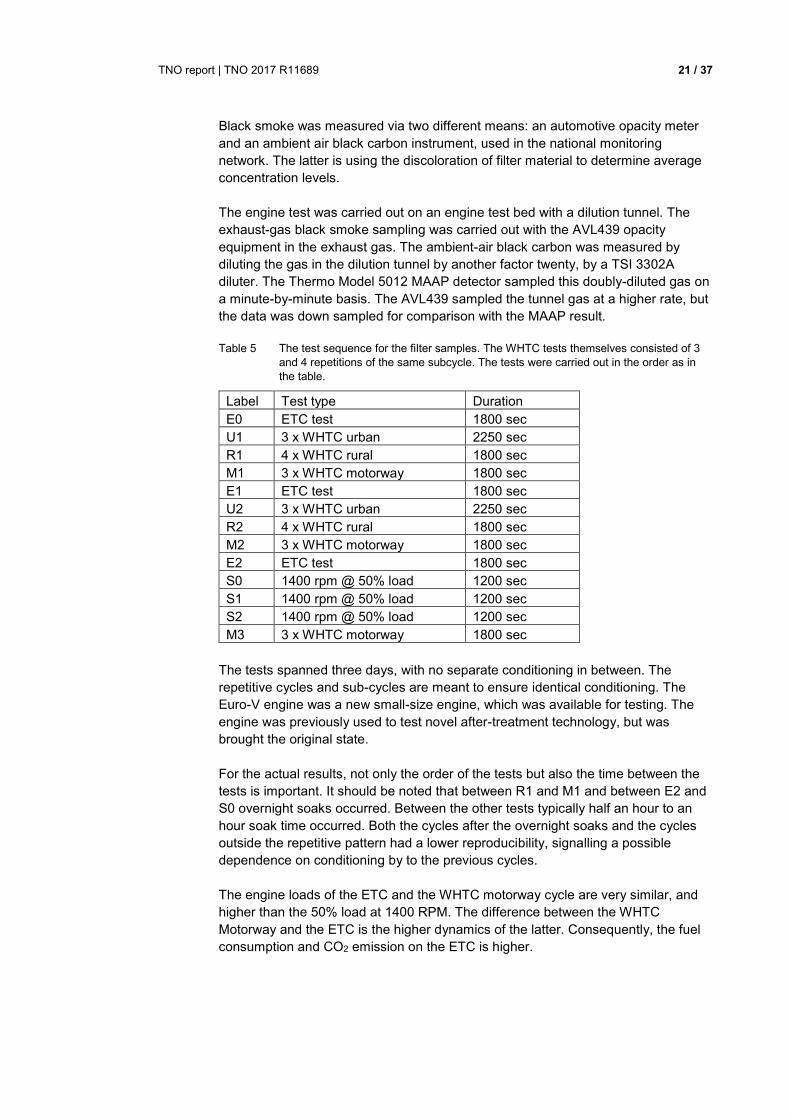
Table 5 The test sequence for the filter samples. The WHTC tests themselves consisted of 3
and 4 repetitions of the same subcycle. The tests were carried out in the order as in
the table.
Label Test type Duration
E0 ETC test 1800 sec
U1 3 x WHTC urban 2250 sec
R1 4 x WHTC rural 1800 sec
M1 3 x WHTC motorway 1800 sec
E1 ETC test 1800 sec
U2 3 x WHTC urban 2250 sec
R2 4 x WHTC rural 1800 sec
M2 3 x WHTC motorway 1800 sec
E2 ETC test 1800 sec
S0 1400 rpm @ 50% load 1200 sec
S1 1400 rpm @ 50% load 1200 sec
S2 1400 rpm @ 50% load 1200 sec
M3 3 x WHTC motorway 1800 sec
The tests spanned three days, with no separate conditioning in between. The
repetitive cycles and sub-cycles are meant to ensure identical conditioning. The
Euro-V engine was a new small-size engine, which was available for testing. The
engine was previously used to test novel after-treatment technology, but was
brought the original state.
For the actual results, not only the order of the tests but also the time between the
tests is important. It should be noted that between R1 and M1 and between E2 and
S0 overnight soaks occurred. Between the other tests typically half an hour to an
hour soak time occurred. Both the cycles after the overnight soaks and the cycles
outside the repetitive pattern had a lower reproducibility, signalling a possible
dependence on conditioning by to the previous cycles.
The engine loads of the ETC and the WHTC motorway cycle are very similar, and
higher than the 50% load at 1400 RPM. The difference between the WHTC
Motorway and the ETC is the higher dynamics of the latter. Consequently, the fuel
consumption and CO2 emission on the ETC is higher.
TNO report | TNO 2017 R11689 22 / 37
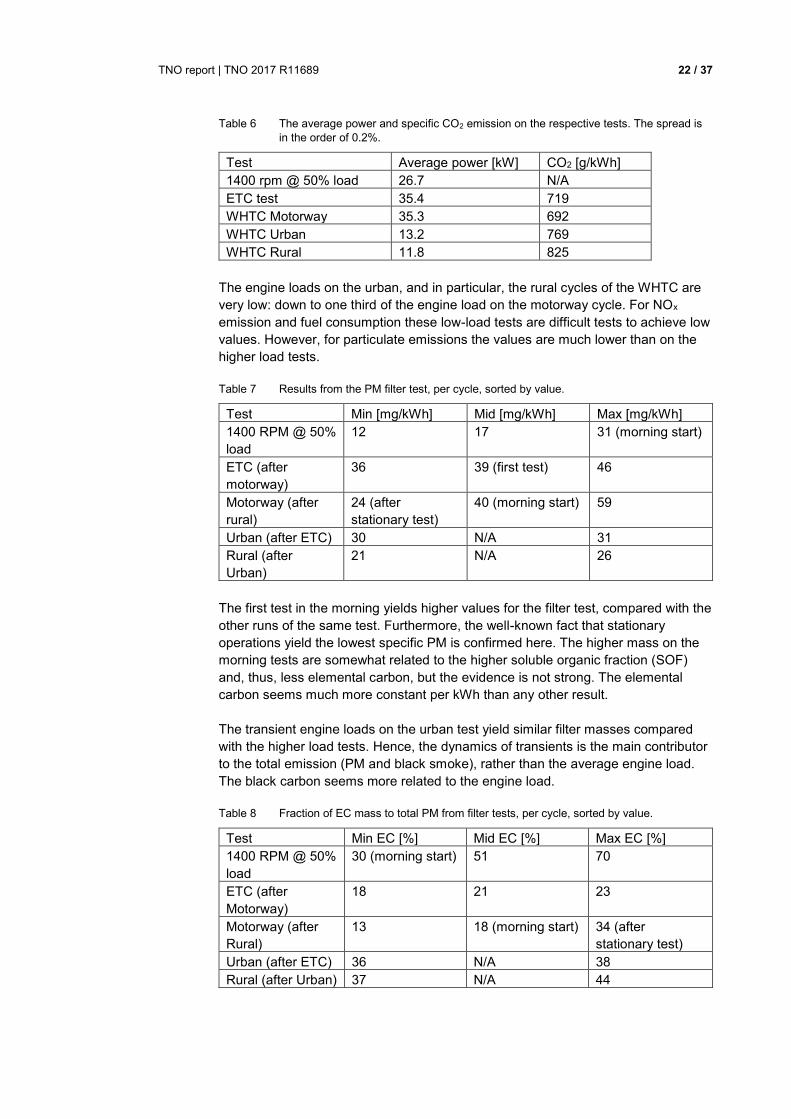
Table 6 The average power and specific CO2 emission on the respective tests. The spread is
in the order of 0.2%.
Test Average power [kW] CO2 [g/kWh]
1400 rpm @ 50% load 26.7 N/A
ETC test 35.4 719
WHTC Motorway 35.3 692
WHTC Urban 13.2 769
WHTC Rural 11.8 825
The engine loads on the urban, and in particular, the rural cycles of the WHTC are
very low: down to one third of the engine load on the motorway cycle. For NOx
emission and fuel consumption these low-load tests are difficult tests to achieve low
values. However, for particulate emissions the values are much lower than on the
higher load tests.
Table 7 Results from the PM filter test, per cycle, sorted by value.
Test Min [mg/kWh] Mid [mg/kWh] Max [mg/kWh]
1400 RPM @ 50%
load
12 17 31 (morning start)
ETC (after
motorway)
36 39 (first test) 46
Motorway (after
rural)
24 (after
stationary test)
40 (morning start) 59
Urban (after ETC) 30 N/A 31
Rural (after
Urban)
21 N/A 26
The first test in the morning yields higher values for the filter test, compared with the
other runs of the same test. Furthermore, the well-known fact that stationary
operations yield the lowest specific PM is confirmed here. The higher mass on the
morning tests are somewhat related to the higher soluble organic fraction (SOF)
and, thus, less elemental carbon, but the evidence is not strong. The elemental
carbon seems much more constant per kWh than any other result.
The transient engine loads on the urban test yield similar filter masses compared
with the higher load tests. Hence, the dynamics of transients is the main contributor
to the total emission (PM and black smoke), rather than the average engine load.
The black carbon seems more related to the engine load.
Table 8 Fraction of EC mass to total PM from filter tests, per cycle, sorted by value.
Test Min EC [%] Mid EC [%] Max EC [%]
1400 RPM @ 50%
load
30 (morning start) 51 70
ETC (after
Motorway)
18 21 23
Motorway (after
Rural)
13 18 (morning start) 34 (after
stationary test)
Urban (after ETC) 36 N/A 38
Rural (after Urban) 37 N/A 44
TNO report | TNO 2017 R11689 23 / 37
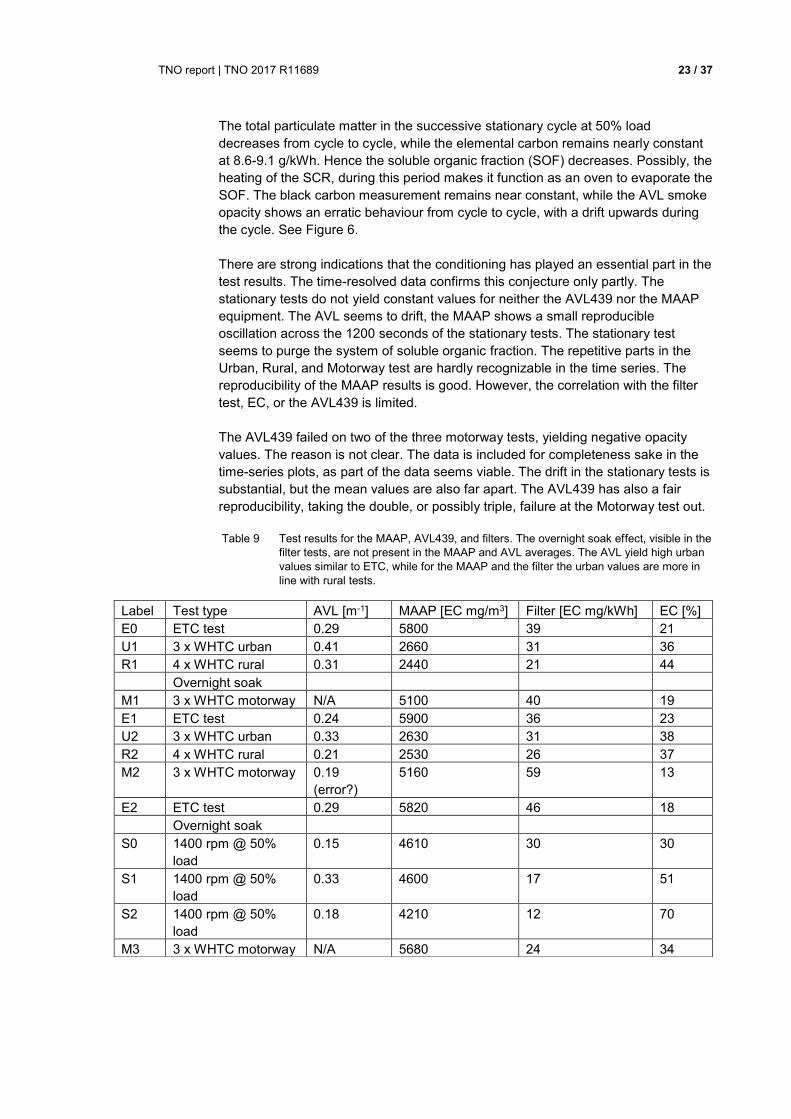
The total particulate matter in the successive stationary cycle at 50% load
decreases from cycle to cycle, while the elemental carbon remains nearly constant
at 8.6-9.1 g/kWh. Hence the soluble organic fraction (SOF) decreases. Possibly, the
heating of the SCR, during this period makes it function as an oven to evaporate the
SOF. The black carbon measurement remains near constant, while the AVL smoke
opacity shows an erratic behaviour from cycle to cycle, with a drift upwards during
the cycle. See Figure 6.
There are strong indications that the conditioning has played an essential part in the
test results. The time-resolved data confirms this conjecture only partly. The
stationary tests do not yield constant values for neither the AVL439 nor the MAAP
equipment. The AVL seems to drift, the MAAP shows a small reproducible
oscillation across the 1200 seconds of the stationary tests. The stationary test
seems to purge the system of soluble organic fraction. The repetitive parts in the
Urban, Rural, and Motorway test are hardly recognizable in the time series. The
reproducibility of the MAAP results is good. However, the correlation with the filter
test, EC, or the AVL439 is limited.
The AVL439 failed on two of the three motorway tests, yielding negative opacity
values. The reason is not clear. The data is included for completeness sake in the
time-series plots, as part of the data seems viable. The drift in the stationary tests is
substantial, but the mean values are also far apart. The AVL439 has also a fair
reproducibility, taking the double, or possibly triple, failure at the Motorway test out.
Table 9 Test results for the MAAP, AVL439, and filters. The overnight soak effect, visible in the
filter tests, are not present in the MAAP and AVL averages. The AVL yield high urban
values similar to ETC, while for the MAAP and the filter the urban values are more in
line with rural tests.
Label Test type AVL [m-1] MAAP [EC mg/m3] Filter [EC mg/kWh] EC [%]
E0 ETC test 0.29 5800 39 21
U1 3 x WHTC urban 0.41 2660 31 36
R1 4 x WHTC rural 0.31 2440 21 44
Overnight soak
M1 3 x WHTC motorway N/A 5100 40 19
E1 ETC test 0.24 5900 36 23
U2 3 x WHTC urban 0.33 2630 31 38
R2 4 x WHTC rural 0.21 2530 26 37
M2 3 x WHTC motorway 0.19
(error?)
5160 59 13
E2 ETC test 0.29 5820 46 18
Overnight soak
S0 1400 rpm @ 50%
load
0.15 4610 30 30
S1 1400 rpm @ 50%
load
0.33 4600 17 51
S2 1400 rpm @ 50%
load
0.18 4210 12 70
M3 3 x WHTC motorway N/A 5680 24 34
TNO report | TNO 2017 R11689 24 / 37
The elemental carbon emission has limited variation over all the tests: 7.2 – 11.3
g/kWh. The rural and especially urban tests have the highest elemental carbon
emissions per kWh. Hence the variation in filter mass is in the soluble organic
fraction. From the MAAP the black carbon seems lowest on these tests, so the
correlation between MAAP and filter values is not possible.
For the AVL439 the conditioning seems play a bigger part than for the MAAP.
Deviations in the start of the ETC and the urban tests, between test and between
the first sub-cycle and the latter sub-cycles indicate a history effect of about 200
seconds. Most interesting, the large effects from the morning start, observed in the
filter tests, are not visible in neither the MAAP nor the AVL data.
TNO report | TNO 2017 R11689 25 / 37
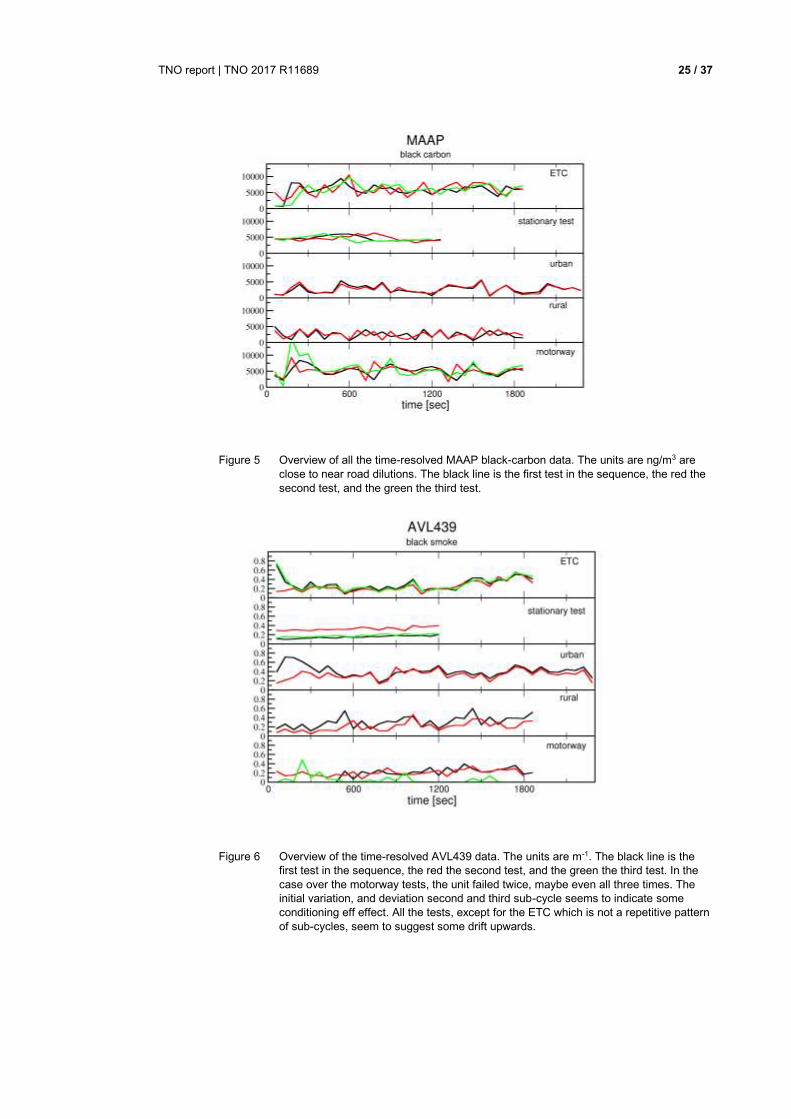
Figure 5 Overview of all the time-resolved MAAP black-carbon data. The units are ng/m3 are
close to near road dilutions. The black line is the first test in the sequence, the red the
second test, and the green the third test.
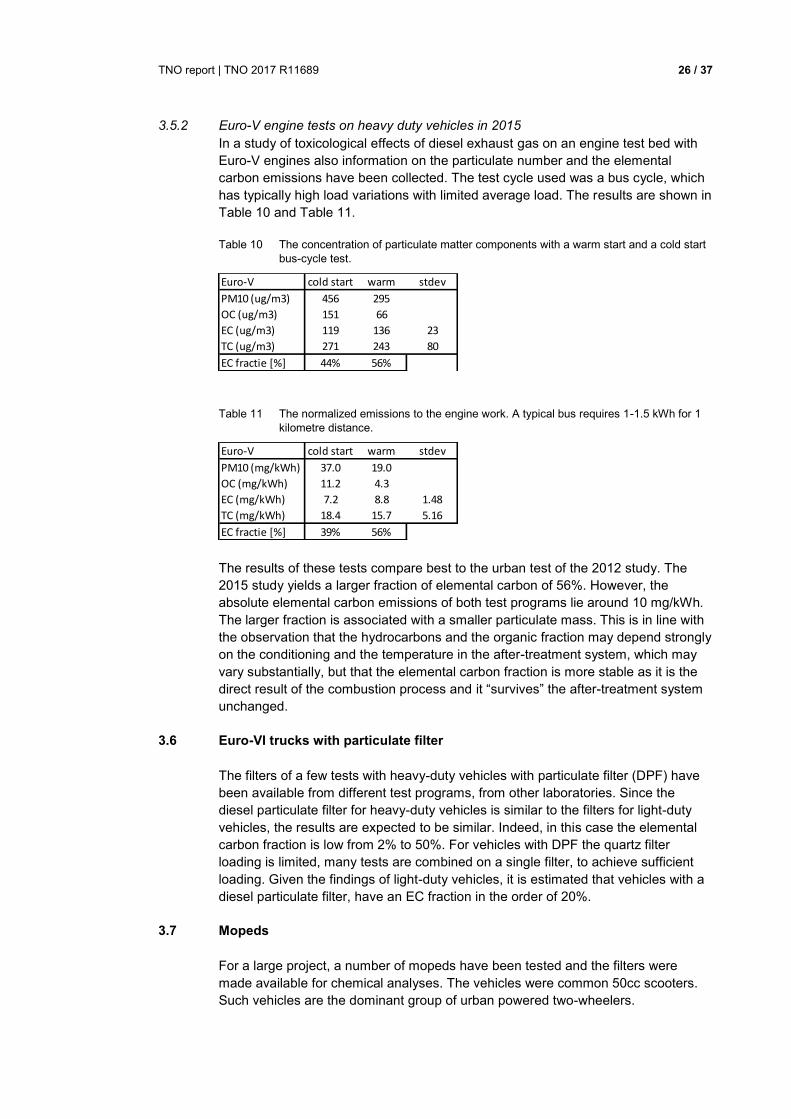
Figure 6 Overview of the time-resolved AVL439 data. The units are m-1. The black line is the
first test in the sequence, the red the second test, and the green the third test. In the
case over the motorway tests, the unit failed twice, maybe even all three times. The
initial variation, and deviation second and third sub-cycle seems to indicate some
conditioning eff effect. All the tests, except for the ETC which is not a repetitive pattern
of sub-cycles, seem to suggest some drift upwards.
TNO report | TNO 2017 R11689 26 / 37
3.5.2 Euro-V engine tests on heavy duty vehicles in 2015
In a study of toxicological effects of diesel exhaust gas on an engine test bed with
Euro-V engines also information on the particulate number and the elemental
carbon emissions have been collected. The test cycle used was a bus cycle, which
has typically high load variations with limited average load. The results are shown in
Table 10 and Table 11.
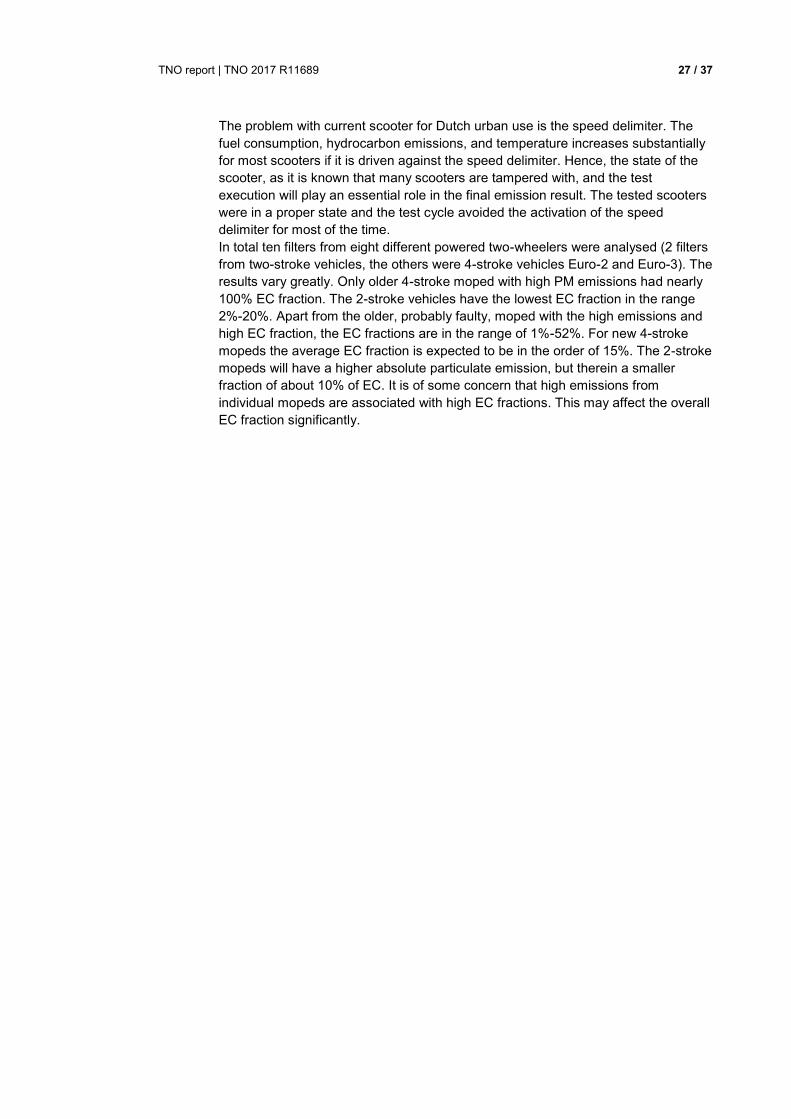
Table 10 The concentration of particulate matter components with a warm start and a cold start
bus-cycle test.
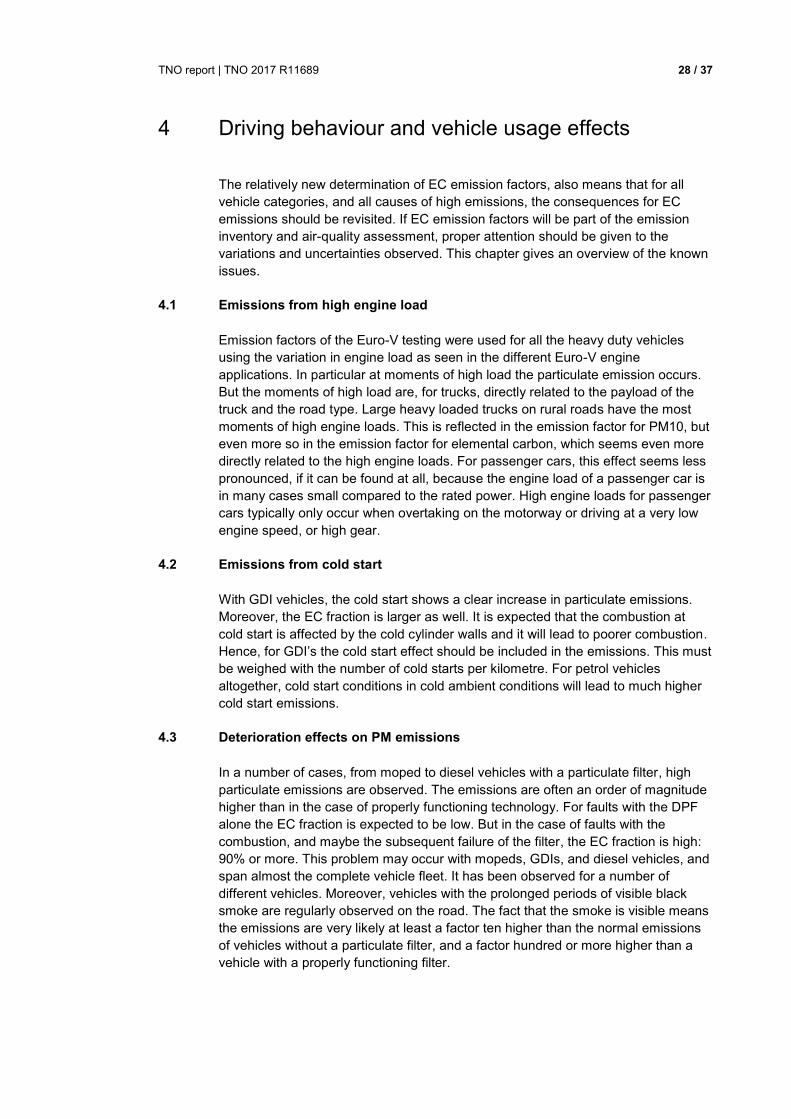
Table 11 The normalized emissions to the engine work. A typical bus requires 1-1.5 kWh for 1
kilometre distance.
The results of these tests compare best to the urban test of the 2012 study. The
2015 study yields a larger fraction of elemental carbon of 56%. However, the
absolute elemental carbon emissions of both test programs lie around 10 mg/kWh.
The larger fraction is associated with a smaller particulate mass. This is in line with
the observation that the hydrocarbons and the organic fraction may depend strongly
on the conditioning and the temperature in the after-treatment system, which may
vary substantially, but that the elemental carbon fraction is more stable as it is the
direct result of the combustion process and it “survives” the after-treatment system
unchanged.
3.6 Euro-VI trucks with particulate filter
The filters of a few tests with heavy-duty vehicles with particulate filter (DPF) have
been available from different test programs, from other laboratories. Since the
diesel particulate filter for heavy-duty vehicles is similar to the filters for light-duty
vehicles, the results are expected to be similar. Indeed, in this case the elemental
carbon fraction is low from 2% to 50%. For vehicles with DPF the quartz filter
loading is limited, many tests are combined on a single filter, to achieve sufficient
loading. Given the findings of light-duty vehicles, it is estimated that vehicles with a
diesel particulate filter, have an EC fraction in the order of 20%.
3.7 Mopeds
For a large project, a number of mopeds have been tested and the filters were
made available for chemical analyses. The vehicles were common 50cc scooters.
Such vehicles are the dominant group of urban powered two-wheelers.
Euro-V cold start warm stdev
PM10 (ug/m3) 456 295
OC (ug/m3) 151 66
EC (ug/m3) 119 136 23
TC (ug/m3) 271 243 80
EC fractie [%] 44% 56%
Euro-V cold start warm stdev
PM10 (mg/kWh) 37.0 19.0
OC (mg/kWh) 11.2 4.3
EC (mg/kWh) 7.2 8.8 1.48
TC (mg/kWh) 18.4 15.7 5.16
EC fractie [%] 39% 56%
TNO report | TNO 2017 R11689 27 / 37
The problem with current scooter for Dutch urban use is the speed delimiter. The
fuel consumption, hydrocarbon emissions, and temperature increases substantially
for most scooters if it is driven against the speed delimiter. Hence, the state of the
scooter, as it is known that many scooters are tampered with, and the test
execution will play an essential role in the final emission result. The tested scooters
were in a proper state and the test cycle avoided the activation of the speed
delimiter for most of the time.
In total ten filters from eight different powered two-wheelers were analysed (2 filters
from two-stroke vehicles, the others were 4-stroke vehicles Euro-2 and Euro-3). The
results vary greatly. Only older 4-stroke moped with high PM emissions had nearly
100% EC fraction. The 2-stroke vehicles have the lowest EC fraction in the range
2%-20%. Apart from the older, probably faulty, moped with the high emissions and
high EC fraction, the EC fractions are in the range of 1%-52%. For new 4-stroke
mopeds the average EC fraction is expected to be in the order of 15%. The 2-stroke
mopeds will have a higher absolute particulate emission, but therein a smaller
fraction of about 10% of EC. It is of some concern that high emissions from
individual mopeds are associated with high EC fractions. This may affect the overall
EC fraction significantly.
TNO report | TNO 2017 R11689 28 / 37
4 Driving behaviour and vehicle usage effects
The relatively new determination of EC emission factors, also means that for all
vehicle categories, and all causes of high emissions, the consequences for EC
emissions should be revisited. If EC emission factors will be part of the emission
inventory and air-quality assessment, proper attention should be given to the
variations and uncertainties observed. This chapter gives an overview of the known
issues.
4.1 Emissions from high engine load
Emission factors of the Euro-V testing were used for all the heavy duty vehicles
using the variation in engine load as seen in the different Euro-V engine
applications. In particular at moments of high load the particulate emission occurs.
But the moments of high load are, for trucks, directly related to the payload of the
truck and the road type. Large heavy loaded trucks on rural roads have the most
moments of high engine loads. This is reflected in the emission factor for PM10, but
even more so in the emission factor for elemental carbon, which seems even more
directly related to the high engine loads. For passenger cars, this effect seems less
pronounced, if it can be found at all, because the engine load of a passenger car is
in many cases small compared to the rated power. High engine loads for passenger
cars typically only occur when overtaking on the motorway or driving at a very low
engine speed, or high gear.
4.2 Emissions from cold start
With GDI vehicles, the cold start shows a clear increase in particulate emissions.
Moreover, the EC fraction is larger as well. It is expected that the combustion at
cold start is affected by the cold cylinder walls and it will lead to poorer combustion.
Hence, for GDI’s the cold start effect should be included in the emissions. This must
be weighed with the number of cold starts per kilometre. For petrol vehicles
altogether, cold start conditions in cold ambient conditions will lead to much higher
cold start emissions.
4.3 Deterioration effects on PM emissions
In a number of cases, from moped to diesel vehicles with a particulate filter, high
particulate emissions are observed. The emissions are often an order of magnitude
higher than in the case of properly functioning technology. For faults with the DPF
alone the EC fraction is expected to be low. But in the case of faults with the
combustion, and maybe the subsequent failure of the filter, the EC fraction is high:
90% or more. This problem may occur with mopeds, GDIs, and diesel vehicles, and
span almost the complete vehicle fleet. It has been observed for a number of
different vehicles. Moreover, vehicles with the prolonged periods of visible black
smoke are regularly observed on the road. The fact that the smoke is visible means
the emissions are very likely at least a factor ten higher than the normal emissions
of vehicles without a particulate filter, and a factor hundred or more higher than a
vehicle with a properly functioning filter.
TNO report | TNO 2017 R11689 29 / 37
Hence, faults in the combustion technology will lead to increased particulate
emissions and in many cases an even larger increase in EC emissions. The
magnitude of the effect, and the fact that it is typically observed in about one in ten
to twenty older vehicles (be it mopeds or passenger cars), give rise to concern
about the contribution of faulty combustion technology and faulty or removed filters
in the total particulates and EC emissions of road transport. The relative
contribution will increase as the well-functioning vehicles will be cleaner and the
relative increase is greater, and the technology which may develop faults, such as
direct injection, will be more ubiquitous.
Two main effects of deterioration are discussed here. They are known effects for
older vehicles in particular.
4.3.1 Injection fouling
The injection fouling will increase the droplet sizes of the injected fuel. Large
droplets may not burn completely and yield partly burned products in the exhaust
gas. Poor fuel quality, like for example, the use of vegetable oil in diesel engines,
may aggravate the problem of injector fouling to the point of engine failure.
Unburned fuel will reduce the power and efficiency of the engine.
4.3.2 Lubricant consumption
At some point the piston wear will leave more space between the piston head and
the cylinder wall. Consequently, lubricants can end up in the combustion chamber
and burn with the fuel. Lubricants are not meant to be burned and consist generally
of larger molecules and additives which are a source of particulate emissions. Also,
an oil level in the engine which is too high can increase the burning of lubricants. If
a vehicle uses one litre of lubricant per 5000 km of driving, and, roughly, 2% of the
lubricants is emitted as particulates, it is expected that the additional particulate
emissions are in the range of 4 mg/km. Such oil consumption is not uncommon in
older vehicles. These are large particulate emissions for modern vehicles by all
accounts. The lubricant usage and contribution to particulate emissions are in a
realistic range. This raises some concern on the end-of-life usage of vehicles, well
beyond their durability requirements in combination with, possibly, reduced
maintenance. These effects are partially covered by the emission tests, as vehicles
have some mileage when tested, but end-of-life effects, or effects above 100,000
km, are not covered.
There has been a limited investigation into the increase of particulate emissions
from lubricant burning with the aging of the vehicles. However, it is expected that
these emissions are not negligible to the total particulate emissions from the
exhaust.
TNO report | TNO 2017 R11689 30 / 37
5 Conclusions
Elemental carbon emission factors are a relatively new type of emission factors,
linked to the interest in toxic particulate concentration in the ambient air beyond the
total particulate mass concentration set out in European regulations. They have
been used indicatively from 2011 onwards and were compared with EC and BC
concentrations in the ambient air.
In order to link these emissions to particular sources, a backlog of vehicle
categories had to be updated in the emission factors database at TNO. Additional
tests were carried out, and in the running test programs quartz filters were used to
allow for the physical-chemical analyses to determine the elemental carbon fraction,
via the EUSAAR method, in the total particulate matter, or PM10.
The results confirmed the existing elemental carbon emission factors and they
provided the necessary confidence for the publication and general use of these
elemental carbon emission factors. It should be noted that GDI vehicles emit a
higher elemental fraction than the port-injection petrol vehicles, but the absolute
particulate emissions are low, such that no increase in elemental carbon emissions
from petrol cars is to be expected.
A number of older vehicles, passenger cars and mopeds have an increased
particulate emission. If the increase in these emissions is linked to a malfunction or
deterioration of the combustion technology, it is also linked to a substantial increase
in the elemental fraction in the particulate matter.
The set of current PM and EC emission factors are presented in Appendix A. Given
the large variation in the EC fractions, encountered in different tests, only EC
emission factors in the database with a systematic deviation from the current
findings were corrected.
It is important to note, that vehicle technology and vehicle usage strongly influence
the EC emission factors. Current results are suitable to use to determine average
EC emissions for a normal fleet. The emission factors do not allow for comparison
of technologies in detail. The vehicle categories are grouped at a high aggregate
level and a limited number of vehicles are tested in a few representative tests.
Consequently, some detail will be missing from these emission factors.
Importantly, EC emissions are part of PM emissions. The level of EC emissions is
bounded by the level of the PM emission. Given the longstanding testing of PM
emissions, and the rapid decrease of PM emissions with new vehicle legislation, the
EC emission factors follow the same trend. The fraction of EC in PM varies mainly
with technology. Generally said, more and more complex after-treatment technology
will bring the EC fraction down. On the other hand, the history effects: buffering,
heat-up, and chemical reactions in catalysts, seem to reduce the repeatability of PM
and EC emission tests without a lengthy and well-described preconditioning.
TNO report | TNO 2017 R11689 31 / 37
6 Signature
Name and address of the principal
RIVM
T.a.v. mevrouw M. van Zanten
Postbus 1
3720 BA Bilthoven
Names of the cooperators
N.E. Ligterink PhD
Date upon which, or period in which the research took place
January 2016 until December 2017
Name and signature reviewer
J.S. Henzing PhD
Signature: Release:
R. Dröge MSc R.A.W. Albers MSc MPA
Projectleader Research Manager
TNO report | TNO 2017 R11689 32 / 37
Appendix A: List of PM10 and elemental carbon emission factors
The list of emissions factors of exhaust emissions PM10 and EC dated 1-1-2017.
Vehicle categories are according to the definitions of the Taakgroep Verkeer en
Vervoer (Taskforce Transport) from the Emissieregistratie (Dutch emission
inventory).
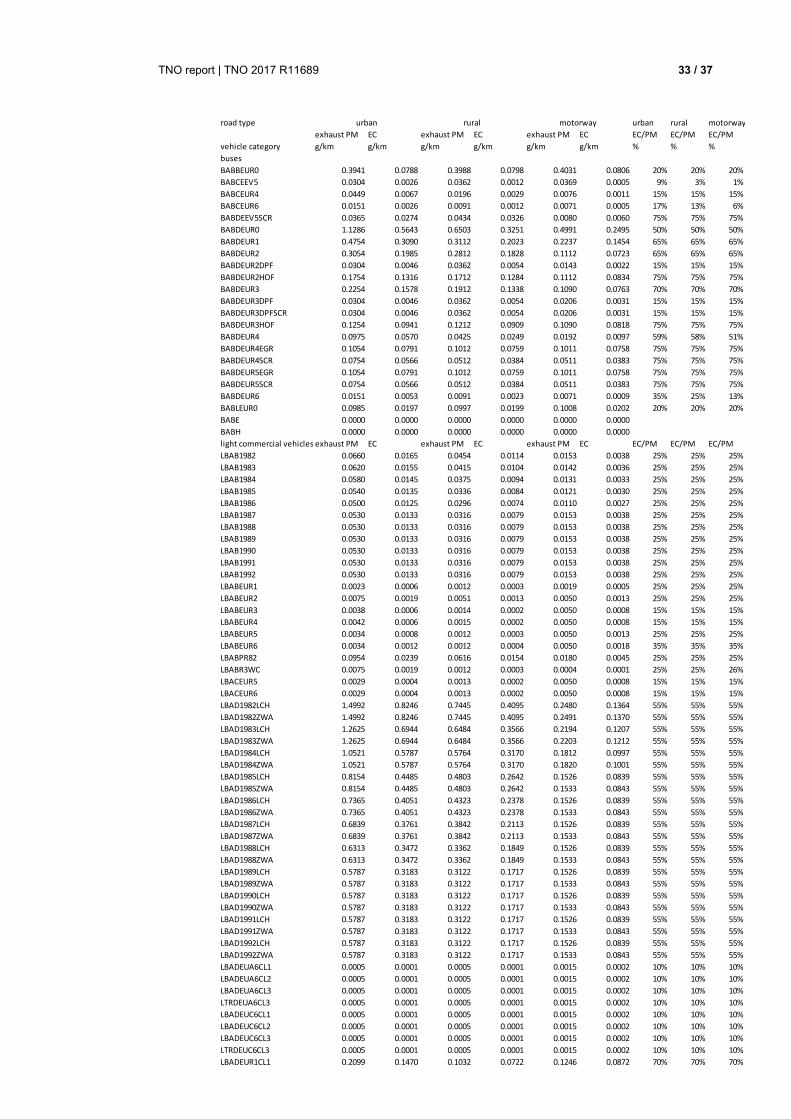
TNO report | TNO 2017 R11689 33 / 37
road type urban rural motorway
exhaust PM EC exhaust PM EC exhaust PM EC EC/PM EC/PM EC/PM
vehicle category g/km g/km g/km g/km g/km g/km % % %
buses
BABBEUR0 0.3941 0.0788 0.3988 0.0798 0.4031 0.0806 20% 20% 20%
BABCEEV5 0.0304 0.0026 0.0362 0.0012 0.0369 0.0005 9% 3% 1%
BABCEUR4 0.0449 0.0067 0.0196 0.0029 0.0076 0.0011 15% 15% 15%
BABCEUR6 0.0151 0.0026 0.0091 0.0012 0.0071 0.0005 17% 13% 6%
BABDEEV5SCR 0.0365 0.0274 0.0434 0.0326 0.0080 0.0060 75% 75% 75%
BABDEUR0 1.1286 0.5643 0.6503 0.3251 0.4991 0.2495 50% 50% 50%
BABDEUR1 0.4754 0.3090 0.3112 0.2023 0.2237 0.1454 65% 65% 65%
BABDEUR2 0.3054 0.1985 0.2812 0.1828 0.1112 0.0723 65% 65% 65%
BABDEUR2DPF 0.0304 0.0046 0.0362 0.0054 0.0143 0.0022 15% 15% 15%
BABDEUR2HOF 0.1754 0.1316 0.1712 0.1284 0.1112 0.0834 75% 75% 75%
BABDEUR3 0.2254 0.1578 0.1912 0.1338 0.1090 0.0763 70% 70% 70%
BABDEUR3DPF 0.0304 0.0046 0.0362 0.0054 0.0206 0.0031 15% 15% 15%
BABDEUR3DPFSCR 0.0304 0.0046 0.0362 0.0054 0.0206 0.0031 15% 15% 15%
BABDEUR3HOF 0.1254 0.0941 0.1212 0.0909 0.1090 0.0818 75% 75% 75%
BABDEUR4 0.0975 0.0570 0.0425 0.0249 0.0192 0.0097 59% 58% 51%
BABDEUR4EGR 0.1054 0.0791 0.1012 0.0759 0.1011 0.0758 75% 75% 75%
BABDEUR4SCR 0.0754 0.0566 0.0512 0.0384 0.0511 0.0383 75% 75% 75%
BABDEUR5EGR 0.1054 0.0791 0.1012 0.0759 0.1011 0.0758 75% 75% 75%
BABDEUR5SCR 0.0754 0.0566 0.0512 0.0384 0.0511 0.0383 75% 75% 75%
BABDEUR6 0.0151 0.0053 0.0091 0.0023 0.0071 0.0009 35% 25% 13%
BABLEUR0 0.0985 0.0197 0.0997 0.0199 0.1008 0.0202 20% 20% 20%
BABE 0.0000 0.0000 0.0000 0.0000 0.0000 0.0000
BABH 0.0000 0.0000 0.0000 0.0000 0.0000 0.0000
light commercial vehicles exhaust PM EC exhaust PM EC exhaust PM EC EC/PM EC/PM EC/PM
LBAB1982 0.0660 0.0165 0.0454 0.0114 0.0153 0.0038 25% 25% 25%
LBAB1983 0.0620 0.0155 0.0415 0.0104 0.0142 0.0036 25% 25% 25%
LBAB1984 0.0580 0.0145 0.0375 0.0094 0.0131 0.0033 25% 25% 25%
LBAB1985 0.0540 0.0135 0.0336 0.0084 0.0121 0.0030 25% 25% 25%
LBAB1986 0.0500 0.0125 0.0296 0.0074 0.0110 0.0027 25% 25% 25%
LBAB1987 0.0530 0.0133 0.0316 0.0079 0.0153 0.0038 25% 25% 25%
LBAB1988 0.0530 0.0133 0.0316 0.0079 0.0153 0.0038 25% 25% 25%
LBAB1989 0.0530 0.0133 0.0316 0.0079 0.0153 0.0038 25% 25% 25%
LBAB1990 0.0530 0.0133 0.0316 0.0079 0.0153 0.0038 25% 25% 25%
LBAB1991 0.0530 0.0133 0.0316 0.0079 0.0153 0.0038 25% 25% 25%
LBAB1992 0.0530 0.0133 0.0316 0.0079 0.0153 0.0038 25% 25% 25%
LBABEUR1 0.0023 0.0006 0.0012 0.0003 0.0019 0.0005 25% 25% 25%
LBABEUR2 0.0075 0.0019 0.0051 0.0013 0.0050 0.0013 25% 25% 25%
LBABEUR3 0.0038 0.0006 0.0014 0.0002 0.0050 0.0008 15% 15% 15%
LBABEUR4 0.0042 0.0006 0.0015 0.0002 0.0050 0.0008 15% 15% 15%
LBABEUR5 0.0034 0.0008 0.0012 0.0003 0.0050 0.0013 25% 25% 25%
LBABEUR6 0.0034 0.0012 0.0012 0.0004 0.0050 0.0018 35% 35% 35%
LBABPR82 0.0954 0.0239 0.0616 0.0154 0.0180 0.0045 25% 25% 25%
LBABR3WC 0.0075 0.0019 0.0012 0.0003 0.0004 0.0001 25% 25% 26%
LBACEUR5 0.0029 0.0004 0.0013 0.0002 0.0050 0.0008 15% 15% 15%
LBACEUR6 0.0029 0.0004 0.0013 0.0002 0.0050 0.0008 15% 15% 15%
LBAD1982LCH 1.4992 0.8246 0.7445 0.4095 0.2480 0.1364 55% 55% 55%
LBAD1982ZWA 1.4992 0.8246 0.7445 0.4095 0.2491 0.1370 55% 55% 55%
LBAD1983LCH 1.2625 0.6944 0.6484 0.3566 0.2194 0.1207 55% 55% 55%
LBAD1983ZWA 1.2625 0.6944 0.6484 0.3566 0.2203 0.1212 55% 55% 55%
LBAD1984LCH 1.0521 0.5787 0.5764 0.3170 0.1812 0.0997 55% 55% 55%
LBAD1984ZWA 1.0521 0.5787 0.5764 0.3170 0.1820 0.1001 55% 55% 55%
LBAD1985LCH 0.8154 0.4485 0.4803 0.2642 0.1526 0.0839 55% 55% 55%
LBAD1985ZWA 0.8154 0.4485 0.4803 0.2642 0.1533 0.0843 55% 55% 55%
LBAD1986LCH 0.7365 0.4051 0.4323 0.2378 0.1526 0.0839 55% 55% 55%
LBAD1986ZWA 0.7365 0.4051 0.4323 0.2378 0.1533 0.0843 55% 55% 55%
LBAD1987LCH 0.6839 0.3761 0.3842 0.2113 0.1526 0.0839 55% 55% 55%
LBAD1987ZWA 0.6839 0.3761 0.3842 0.2113 0.1533 0.0843 55% 55% 55%
LBAD1988LCH 0.6313 0.3472 0.3362 0.1849 0.1526 0.0839 55% 55% 55%
LBAD1988ZWA 0.6313 0.3472 0.3362 0.1849 0.1533 0.0843 55% 55% 55%
LBAD1989LCH 0.5787 0.3183 0.3122 0.1717 0.1526 0.0839 55% 55% 55%
LBAD1989ZWA 0.5787 0.3183 0.3122 0.1717 0.1533 0.0843 55% 55% 55%
LBAD1990LCH 0.5787 0.3183 0.3122 0.1717 0.1526 0.0839 55% 55% 55%
LBAD1990ZWA 0.5787 0.3183 0.3122 0.1717 0.1533 0.0843 55% 55% 55%
LBAD1991LCH 0.5787 0.3183 0.3122 0.1717 0.1526 0.0839 55% 55% 55%
LBAD1991ZWA 0.5787 0.3183 0.3122 0.1717 0.1533 0.0843 55% 55% 55%
LBAD1992LCH 0.5787 0.3183 0.3122 0.1717 0.1526 0.0839 55% 55% 55%
LBAD1992ZWA 0.5787 0.3183 0.3122 0.1717 0.1533 0.0843 55% 55% 55%
LBADEUA6CL1 0.0005 0.0001 0.0005 0.0001 0.0015 0.0002 10% 10% 10%
LBADEUA6CL2 0.0005 0.0001 0.0005 0.0001 0.0015 0.0002 10% 10% 10%
LBADEUA6CL3 0.0005 0.0001 0.0005 0.0001 0.0015 0.0002 10% 10% 10%
LTRDEUA6CL3 0.0005 0.0001 0.0005 0.0001 0.0015 0.0002 10% 10% 10%
LBADEUC6CL1 0.0005 0.0001 0.0005 0.0001 0.0015 0.0002 10% 10% 10%
LBADEUC6CL2 0.0005 0.0001 0.0005 0.0001 0.0015 0.0002 10% 10% 10%
LBADEUC6CL3 0.0005 0.0001 0.0005 0.0001 0.0015 0.0002 10% 10% 10%
LTRDEUC6CL3 0.0005 0.0001 0.0005 0.0001 0.0015 0.0002 10% 10% 10%
LBADEUR1CL1 0.2099 0.1470 0.1032 0.0722 0.1246 0.0872 70% 70% 70%
urban rural motorway
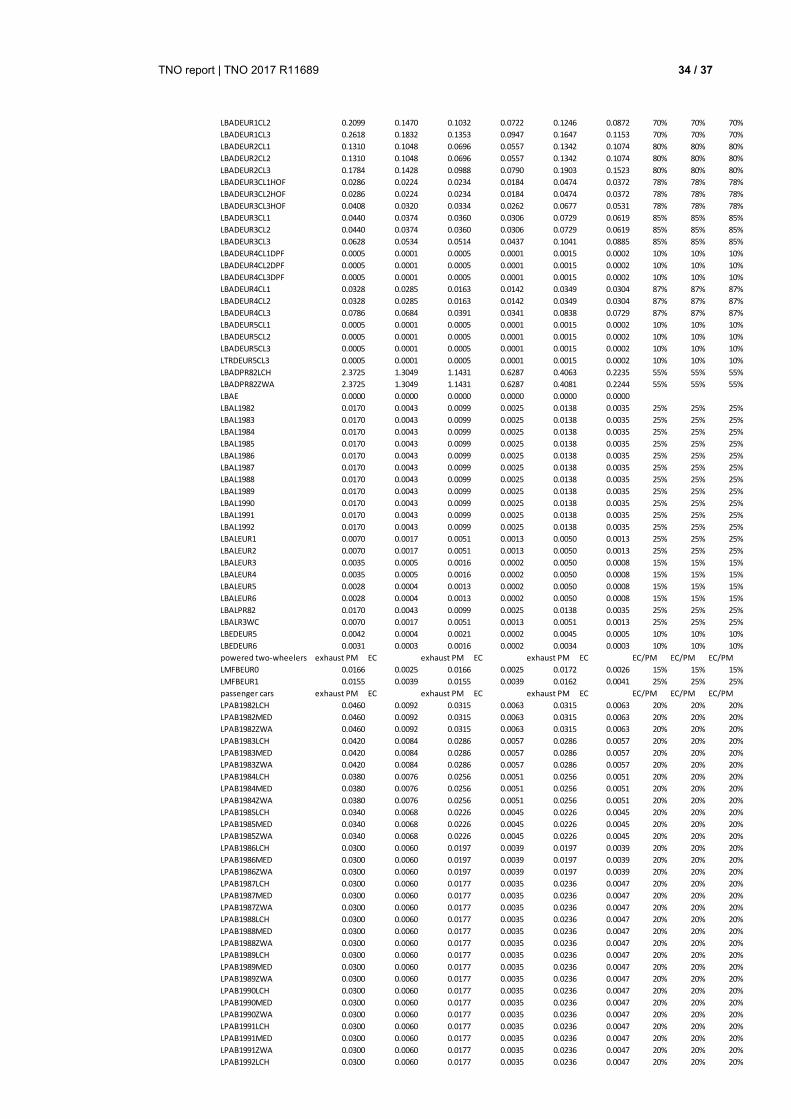
TNO report | TNO 2017 R11689 34 / 37
LBADEUR1CL2 0.2099 0.1470 0.1032 0.0722 0.1246 0.0872 70% 70% 70%
LBADEUR1CL3 0.2618 0.1832 0.1353 0.0947 0.1647 0.1153 70% 70% 70%
LBADEUR2CL1 0.1310 0.1048 0.0696 0.0557 0.1342 0.1074 80% 80% 80%
LBADEUR2CL2 0.1310 0.1048 0.0696 0.0557 0.1342 0.1074 80% 80% 80%
LBADEUR2CL3 0.1784 0.1428 0.0988 0.0790 0.1903 0.1523 80% 80% 80%
LBADEUR3CL1HOF 0.0286 0.0224 0.0234 0.0184 0.0474 0.0372 78% 78% 78%
LBADEUR3CL2HOF 0.0286 0.0224 0.0234 0.0184 0.0474 0.0372 78% 78% 78%
LBADEUR3CL3HOF 0.0408 0.0320 0.0334 0.0262 0.0677 0.0531 78% 78% 78%
LBADEUR3CL1 0.0440 0.0374 0.0360 0.0306 0.0729 0.0619 85% 85% 85%
LBADEUR3CL2 0.0440 0.0374 0.0360 0.0306 0.0729 0.0619 85% 85% 85%
LBADEUR3CL3 0.0628 0.0534 0.0514 0.0437 0.1041 0.0885 85% 85% 85%
LBADEUR4CL1DPF 0.0005 0.0001 0.0005 0.0001 0.0015 0.0002 10% 10% 10%
LBADEUR4CL2DPF 0.0005 0.0001 0.0005 0.0001 0.0015 0.0002 10% 10% 10%
LBADEUR4CL3DPF 0.0005 0.0001 0.0005 0.0001 0.0015 0.0002 10% 10% 10%
LBADEUR4CL1 0.0328 0.0285 0.0163 0.0142 0.0349 0.0304 87% 87% 87%
LBADEUR4CL2 0.0328 0.0285 0.0163 0.0142 0.0349 0.0304 87% 87% 87%
LBADEUR4CL3 0.0786 0.0684 0.0391 0.0341 0.0838 0.0729 87% 87% 87%
LBADEUR5CL1 0.0005 0.0001 0.0005 0.0001 0.0015 0.0002 10% 10% 10%
LBADEUR5CL2 0.0005 0.0001 0.0005 0.0001 0.0015 0.0002 10% 10% 10%
LBADEUR5CL3 0.0005 0.0001 0.0005 0.0001 0.0015 0.0002 10% 10% 10%
LTRDEUR5CL3 0.0005 0.0001 0.0005 0.0001 0.0015 0.0002 10% 10% 10%
LBADPR82LCH 2.3725 1.3049 1.1431 0.6287 0.4063 0.2235 55% 55% 55%
LBADPR82ZWA 2.3725 1.3049 1.1431 0.6287 0.4081 0.2244 55% 55% 55%
LBAE 0.0000 0.0000 0.0000 0.0000 0.0000 0.0000
LBAL1982 0.0170 0.0043 0.0099 0.0025 0.0138 0.0035 25% 25% 25%
LBAL1983 0.0170 0.0043 0.0099 0.0025 0.0138 0.0035 25% 25% 25%
LBAL1984 0.0170 0.0043 0.0099 0.0025 0.0138 0.0035 25% 25% 25%
LBAL1985 0.0170 0.0043 0.0099 0.0025 0.0138 0.0035 25% 25% 25%
LBAL1986 0.0170 0.0043 0.0099 0.0025 0.0138 0.0035 25% 25% 25%
LBAL1987 0.0170 0.0043 0.0099 0.0025 0.0138 0.0035 25% 25% 25%
LBAL1988 0.0170 0.0043 0.0099 0.0025 0.0138 0.0035 25% 25% 25%
LBAL1989 0.0170 0.0043 0.0099 0.0025 0.0138 0.0035 25% 25% 25%
LBAL1990 0.0170 0.0043 0.0099 0.0025 0.0138 0.0035 25% 25% 25%
LBAL1991 0.0170 0.0043 0.0099 0.0025 0.0138 0.0035 25% 25% 25%
LBAL1992 0.0170 0.0043 0.0099 0.0025 0.0138 0.0035 25% 25% 25%
LBALEUR1 0.0070 0.0017 0.0051 0.0013 0.0050 0.0013 25% 25% 25%
LBALEUR2 0.0070 0.0017 0.0051 0.0013 0.0050 0.0013 25% 25% 25%
LBALEUR3 0.0035 0.0005 0.0016 0.0002 0.0050 0.0008 15% 15% 15%
LBALEUR4 0.0035 0.0005 0.0016 0.0002 0.0050 0.0008 15% 15% 15%
LBALEUR5 0.0028 0.0004 0.0013 0.0002 0.0050 0.0008 15% 15% 15%
LBALEUR6 0.0028 0.0004 0.0013 0.0002 0.0050 0.0008 15% 15% 15%
LBALPR82 0.0170 0.0043 0.0099 0.0025 0.0138 0.0035 25% 25% 25%
LBALR3WC 0.0070 0.0017 0.0051 0.0013 0.0051 0.0013 25% 25% 25%
LBEDEUR5 0.0042 0.0004 0.0021 0.0002 0.0045 0.0005 10% 10% 10%
LBEDEUR6 0.0031 0.0003 0.0016 0.0002 0.0034 0.0003 10% 10% 10%
powered two-wheelers exhaust PM EC exhaust PM EC exhaust PM EC EC/PM EC/PM EC/PM
LMFBEUR0 0.0166 0.0025 0.0166 0.0025 0.0172 0.0026 15% 15% 15%
LMFBEUR1 0.0155 0.0039 0.0155 0.0039 0.0162 0.0041 25% 25% 25%
passenger cars exhaust PM EC exhaust PM EC exhaust PM EC EC/PM EC/PM EC/PM
LPAB1982LCH 0.0460 0.0092 0.0315 0.0063 0.0315 0.0063 20% 20% 20%
LPAB1982MED 0.0460 0.0092 0.0315 0.0063 0.0315 0.0063 20% 20% 20%
LPAB1982ZWA 0.0460 0.0092 0.0315 0.0063 0.0315 0.0063 20% 20% 20%
LPAB1983LCH 0.0420 0.0084 0.0286 0.0057 0.0286 0.0057 20% 20% 20%
LPAB1983MED 0.0420 0.0084 0.0286 0.0057 0.0286 0.0057 20% 20% 20%
LPAB1983ZWA 0.0420 0.0084 0.0286 0.0057 0.0286 0.0057 20% 20% 20%
LPAB1984LCH 0.0380 0.0076 0.0256 0.0051 0.0256 0.0051 20% 20% 20%
LPAB1984MED 0.0380 0.0076 0.0256 0.0051 0.0256 0.0051 20% 20% 20%
LPAB1984ZWA 0.0380 0.0076 0.0256 0.0051 0.0256 0.0051 20% 20% 20%
LPAB1985LCH 0.0340 0.0068 0.0226 0.0045 0.0226 0.0045 20% 20% 20%
LPAB1985MED 0.0340 0.0068 0.0226 0.0045 0.0226 0.0045 20% 20% 20%
LPAB1985ZWA 0.0340 0.0068 0.0226 0.0045 0.0226 0.0045 20% 20% 20%
LPAB1986LCH 0.0300 0.0060 0.0197 0.0039 0.0197 0.0039 20% 20% 20%
LPAB1986MED 0.0300 0.0060 0.0197 0.0039 0.0197 0.0039 20% 20% 20%
LPAB1986ZWA 0.0300 0.0060 0.0197 0.0039 0.0197 0.0039 20% 20% 20%
LPAB1987LCH 0.0300 0.0060 0.0177 0.0035 0.0236 0.0047 20% 20% 20%
LPAB1987MED 0.0300 0.0060 0.0177 0.0035 0.0236 0.0047 20% 20% 20%
LPAB1987ZWA 0.0300 0.0060 0.0177 0.0035 0.0236 0.0047 20% 20% 20%
LPAB1988LCH 0.0300 0.0060 0.0177 0.0035 0.0236 0.0047 20% 20% 20%
LPAB1988MED 0.0300 0.0060 0.0177 0.0035 0.0236 0.0047 20% 20% 20%
LPAB1988ZWA 0.0300 0.0060 0.0177 0.0035 0.0236 0.0047 20% 20% 20%
LPAB1989LCH 0.0300 0.0060 0.0177 0.0035 0.0236 0.0047 20% 20% 20%
LPAB1989MED 0.0300 0.0060 0.0177 0.0035 0.0236 0.0047 20% 20% 20%
LPAB1989ZWA 0.0300 0.0060 0.0177 0.0035 0.0236 0.0047 20% 20% 20%
LPAB1990LCH 0.0300 0.0060 0.0177 0.0035 0.0236 0.0047 20% 20% 20%
LPAB1990MED 0.0300 0.0060 0.0177 0.0035 0.0236 0.0047 20% 20% 20%
LPAB1990ZWA 0.0300 0.0060 0.0177 0.0035 0.0236 0.0047 20% 20% 20%
LPAB1991LCH 0.0300 0.0060 0.0177 0.0035 0.0236 0.0047 20% 20% 20%
LPAB1991MED 0.0300 0.0060 0.0177 0.0035 0.0236 0.0047 20% 20% 20%
LPAB1991ZWA 0.0300 0.0060 0.0177 0.0035 0.0236 0.0047 20% 20% 20%
LPAB1992LCH 0.0300 0.0060 0.0177 0.0035 0.0236 0.0047 20% 20% 20%
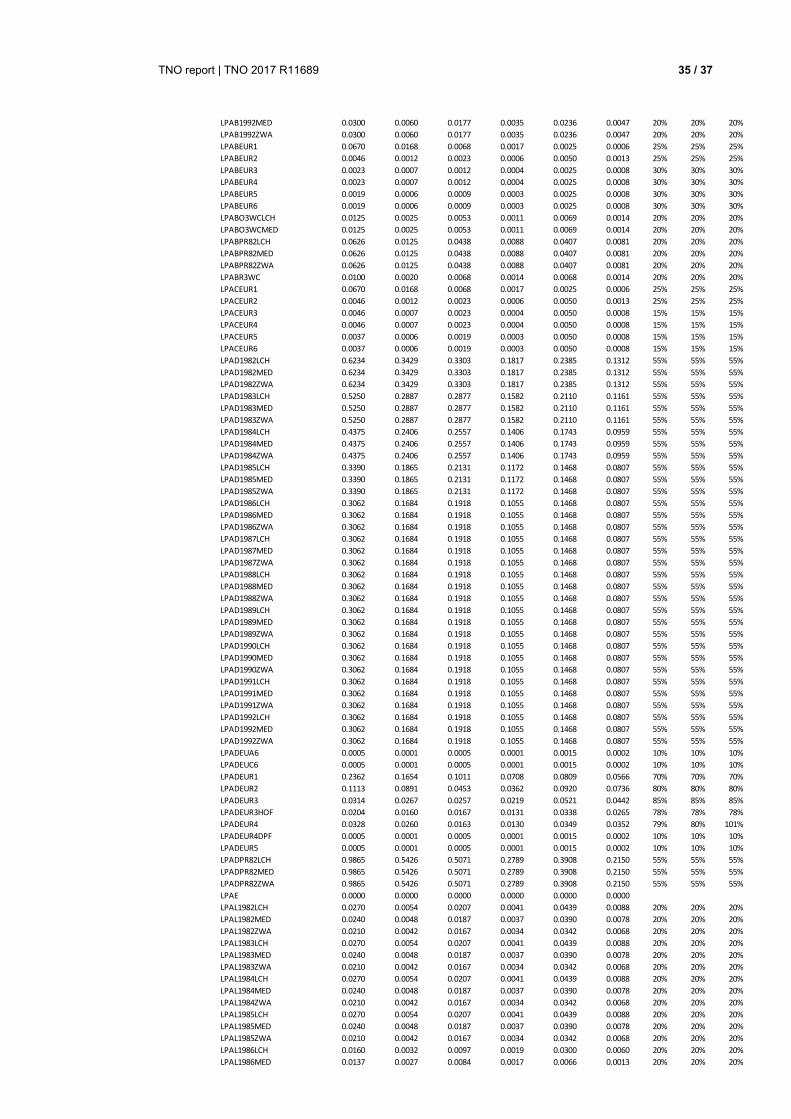
TNO report | TNO 2017 R11689 35 / 37
LPAB1992MED 0.0300 0.0060 0.0177 0.0035 0.0236 0.0047 20% 20% 20%
LPAB1992ZWA 0.0300 0.0060 0.0177 0.0035 0.0236 0.0047 20% 20% 20%
LPABEUR1 0.0670 0.0168 0.0068 0.0017 0.0025 0.0006 25% 25% 25%
LPABEUR2 0.0046 0.0012 0.0023 0.0006 0.0050 0.0013 25% 25% 25%
LPABEUR3 0.0023 0.0007 0.0012 0.0004 0.0025 0.0008 30% 30% 30%
LPABEUR4 0.0023 0.0007 0.0012 0.0004 0.0025 0.0008 30% 30% 30%
LPABEUR5 0.0019 0.0006 0.0009 0.0003 0.0025 0.0008 30% 30% 30%
LPABEUR6 0.0019 0.0006 0.0009 0.0003 0.0025 0.0008 30% 30% 30%
LPABO3WCLCH 0.0125 0.0025 0.0053 0.0011 0.0069 0.0014 20% 20% 20%
LPABO3WCMED 0.0125 0.0025 0.0053 0.0011 0.0069 0.0014 20% 20% 20%
LPABPR82LCH 0.0626 0.0125 0.0438 0.0088 0.0407 0.0081 20% 20% 20%
LPABPR82MED 0.0626 0.0125 0.0438 0.0088 0.0407 0.0081 20% 20% 20%
LPABPR82ZWA 0.0626 0.0125 0.0438 0.0088 0.0407 0.0081 20% 20% 20%
LPABR3WC 0.0100 0.0020 0.0068 0.0014 0.0068 0.0014 20% 20% 20%
LPACEUR1 0.0670 0.0168 0.0068 0.0017 0.0025 0.0006 25% 25% 25%
LPACEUR2 0.0046 0.0012 0.0023 0.0006 0.0050 0.0013 25% 25% 25%
LPACEUR3 0.0046 0.0007 0.0023 0.0004 0.0050 0.0008 15% 15% 15%
LPACEUR4 0.0046 0.0007 0.0023 0.0004 0.0050 0.0008 15% 15% 15%
LPACEUR5 0.0037 0.0006 0.0019 0.0003 0.0050 0.0008 15% 15% 15%
LPACEUR6 0.0037 0.0006 0.0019 0.0003 0.0050 0.0008 15% 15% 15%
LPAD1982LCH 0.6234 0.3429 0.3303 0.1817 0.2385 0.1312 55% 55% 55%
LPAD1982MED 0.6234 0.3429 0.3303 0.1817 0.2385 0.1312 55% 55% 55%
LPAD1982ZWA 0.6234 0.3429 0.3303 0.1817 0.2385 0.1312 55% 55% 55%
LPAD1983LCH 0.5250 0.2887 0.2877 0.1582 0.2110 0.1161 55% 55% 55%
LPAD1983MED 0.5250 0.2887 0.2877 0.1582 0.2110 0.1161 55% 55% 55%
LPAD1983ZWA 0.5250 0.2887 0.2877 0.1582 0.2110 0.1161 55% 55% 55%
LPAD1984LCH 0.4375 0.2406 0.2557 0.1406 0.1743 0.0959 55% 55% 55%
LPAD1984MED 0.4375 0.2406 0.2557 0.1406 0.1743 0.0959 55% 55% 55%
LPAD1984ZWA 0.4375 0.2406 0.2557 0.1406 0.1743 0.0959 55% 55% 55%
LPAD1985LCH 0.3390 0.1865 0.2131 0.1172 0.1468 0.0807 55% 55% 55%
LPAD1985MED 0.3390 0.1865 0.2131 0.1172 0.1468 0.0807 55% 55% 55%
LPAD1985ZWA 0.3390 0.1865 0.2131 0.1172 0.1468 0.0807 55% 55% 55%
LPAD1986LCH 0.3062 0.1684 0.1918 0.1055 0.1468 0.0807 55% 55% 55%
LPAD1986MED 0.3062 0.1684 0.1918 0.1055 0.1468 0.0807 55% 55% 55%
LPAD1986ZWA 0.3062 0.1684 0.1918 0.1055 0.1468 0.0807 55% 55% 55%
LPAD1987LCH 0.3062 0.1684 0.1918 0.1055 0.1468 0.0807 55% 55% 55%
LPAD1987MED 0.3062 0.1684 0.1918 0.1055 0.1468 0.0807 55% 55% 55%
LPAD1987ZWA 0.3062 0.1684 0.1918 0.1055 0.1468 0.0807 55% 55% 55%
LPAD1988LCH 0.3062 0.1684 0.1918 0.1055 0.1468 0.0807 55% 55% 55%
LPAD1988MED 0.3062 0.1684 0.1918 0.1055 0.1468 0.0807 55% 55% 55%
LPAD1988ZWA 0.3062 0.1684 0.1918 0.1055 0.1468 0.0807 55% 55% 55%
LPAD1989LCH 0.3062 0.1684 0.1918 0.1055 0.1468 0.0807 55% 55% 55%
LPAD1989MED 0.3062 0.1684 0.1918 0.1055 0.1468 0.0807 55% 55% 55%
LPAD1989ZWA 0.3062 0.1684 0.1918 0.1055 0.1468 0.0807 55% 55% 55%
LPAD1990LCH 0.3062 0.1684 0.1918 0.1055 0.1468 0.0807 55% 55% 55%
LPAD1990MED 0.3062 0.1684 0.1918 0.1055 0.1468 0.0807 55% 55% 55%
LPAD1990ZWA 0.3062 0.1684 0.1918 0.1055 0.1468 0.0807 55% 55% 55%
LPAD1991LCH 0.3062 0.1684 0.1918 0.1055 0.1468 0.0807 55% 55% 55%
LPAD1991MED 0.3062 0.1684 0.1918 0.1055 0.1468 0.0807 55% 55% 55%
LPAD1991ZWA 0.3062 0.1684 0.1918 0.1055 0.1468 0.0807 55% 55% 55%
LPAD1992LCH 0.3062 0.1684 0.1918 0.1055 0.1468 0.0807 55% 55% 55%
LPAD1992MED 0.3062 0.1684 0.1918 0.1055 0.1468 0.0807 55% 55% 55%
LPAD1992ZWA 0.3062 0.1684 0.1918 0.1055 0.1468 0.0807 55% 55% 55%
LPADEUA6 0.0005 0.0001 0.0005 0.0001 0.0015 0.0002 10% 10% 10%
LPADEUC6 0.0005 0.0001 0.0005 0.0001 0.0015 0.0002 10% 10% 10%
LPADEUR1 0.2362 0.1654 0.1011 0.0708 0.0809 0.0566 70% 70% 70%
LPADEUR2 0.1113 0.0891 0.0453 0.0362 0.0920 0.0736 80% 80% 80%
LPADEUR3 0.0314 0.0267 0.0257 0.0219 0.0521 0.0442 85% 85% 85%
LPADEUR3HOF 0.0204 0.0160 0.0167 0.0131 0.0338 0.0265 78% 78% 78%
LPADEUR4 0.0328 0.0260 0.0163 0.0130 0.0349 0.0352 79% 80% 101%
LPADEUR4DPF 0.0005 0.0001 0.0005 0.0001 0.0015 0.0002 10% 10% 10%
LPADEUR5 0.0005 0.0001 0.0005 0.0001 0.0015 0.0002 10% 10% 10%
LPADPR82LCH 0.9865 0.5426 0.5071 0.2789 0.3908 0.2150 55% 55% 55%
LPADPR82MED 0.9865 0.5426 0.5071 0.2789 0.3908 0.2150 55% 55% 55%
LPADPR82ZWA 0.9865 0.5426 0.5071 0.2789 0.3908 0.2150 55% 55% 55%
LPAE 0.0000 0.0000 0.0000 0.0000 0.0000 0.0000
LPAL1982LCH 0.0270 0.0054 0.0207 0.0041 0.0439 0.0088 20% 20% 20%
LPAL1982MED 0.0240 0.0048 0.0187 0.0037 0.0390 0.0078 20% 20% 20%
LPAL1982ZWA 0.0210 0.0042 0.0167 0.0034 0.0342 0.0068 20% 20% 20%
LPAL1983LCH 0.0270 0.0054 0.0207 0.0041 0.0439 0.0088 20% 20% 20%
LPAL1983MED 0.0240 0.0048 0.0187 0.0037 0.0390 0.0078 20% 20% 20%
LPAL1983ZWA 0.0210 0.0042 0.0167 0.0034 0.0342 0.0068 20% 20% 20%
LPAL1984LCH 0.0270 0.0054 0.0207 0.0041 0.0439 0.0088 20% 20% 20%
LPAL1984MED 0.0240 0.0048 0.0187 0.0037 0.0390 0.0078 20% 20% 20%
LPAL1984ZWA 0.0210 0.0042 0.0167 0.0034 0.0342 0.0068 20% 20% 20%
LPAL1985LCH 0.0270 0.0054 0.0207 0.0041 0.0439 0.0088 20% 20% 20%
LPAL1985MED 0.0240 0.0048 0.0187 0.0037 0.0390 0.0078 20% 20% 20%
LPAL1985ZWA 0.0210 0.0042 0.0167 0.0034 0.0342 0.0068 20% 20% 20%
LPAL1986LCH 0.0160 0.0032 0.0097 0.0019 0.0300 0.0060 20% 20% 20%
LPAL1986MED 0.0137 0.0027 0.0084 0.0017 0.0066 0.0013 20% 20% 20%
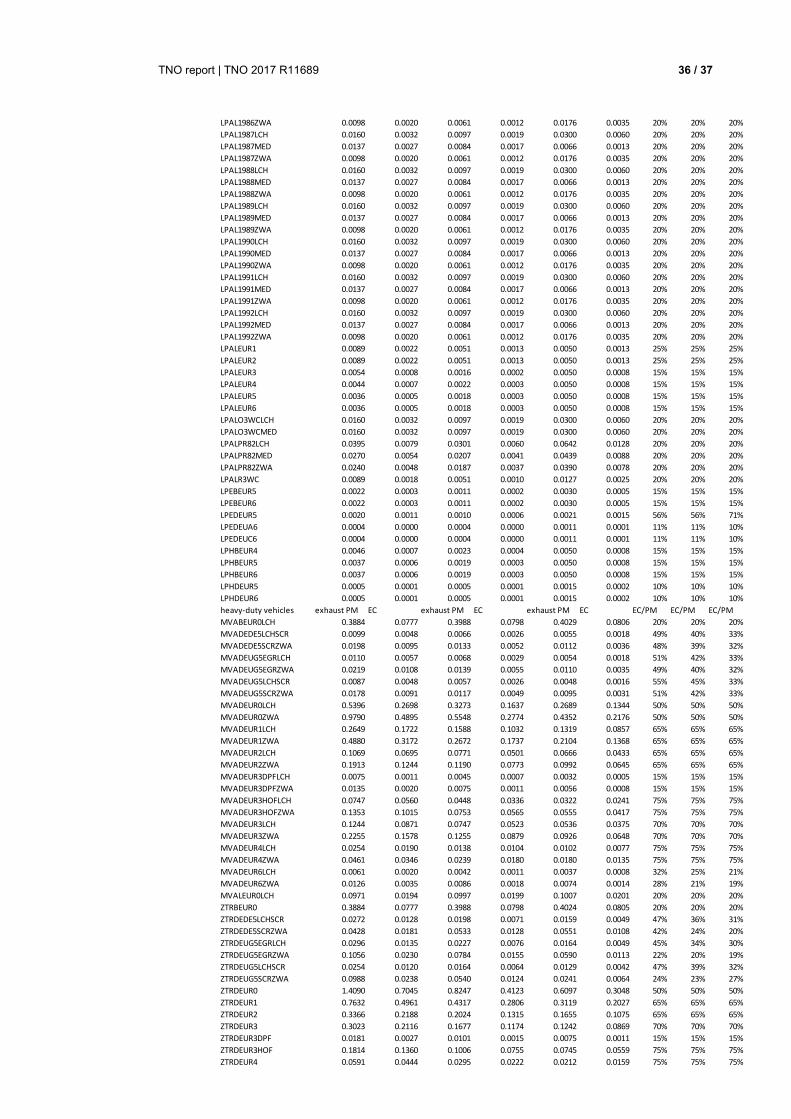
TNO report | TNO 2017 R11689 36 / 37
LPAL1986ZWA 0.0098 0.0020 0.0061 0.0012 0.0176 0.0035 20% 20% 20%
LPAL1987LCH 0.0160 0.0032 0.0097 0.0019 0.0300 0.0060 20% 20% 20%
LPAL1987MED 0.0137 0.0027 0.0084 0.0017 0.0066 0.0013 20% 20% 20%
LPAL1987ZWA 0.0098 0.0020 0.0061 0.0012 0.0176 0.0035 20% 20% 20%
LPAL1988LCH 0.0160 0.0032 0.0097 0.0019 0.0300 0.0060 20% 20% 20%
LPAL1988MED 0.0137 0.0027 0.0084 0.0017 0.0066 0.0013 20% 20% 20%
LPAL1988ZWA 0.0098 0.0020 0.0061 0.0012 0.0176 0.0035 20% 20% 20%
LPAL1989LCH 0.0160 0.0032 0.0097 0.0019 0.0300 0.0060 20% 20% 20%
LPAL1989MED 0.0137 0.0027 0.0084 0.0017 0.0066 0.0013 20% 20% 20%
LPAL1989ZWA 0.0098 0.0020 0.0061 0.0012 0.0176 0.0035 20% 20% 20%
LPAL1990LCH 0.0160 0.0032 0.0097 0.0019 0.0300 0.0060 20% 20% 20%
LPAL1990MED 0.0137 0.0027 0.0084 0.0017 0.0066 0.0013 20% 20% 20%
LPAL1990ZWA 0.0098 0.0020 0.0061 0.0012 0.0176 0.0035 20% 20% 20%
LPAL1991LCH 0.0160 0.0032 0.0097 0.0019 0.0300 0.0060 20% 20% 20%
LPAL1991MED 0.0137 0.0027 0.0084 0.0017 0.0066 0.0013 20% 20% 20%
LPAL1991ZWA 0.0098 0.0020 0.0061 0.0012 0.0176 0.0035 20% 20% 20%
LPAL1992LCH 0.0160 0.0032 0.0097 0.0019 0.0300 0.0060 20% 20% 20%
LPAL1992MED 0.0137 0.0027 0.0084 0.0017 0.0066 0.0013 20% 20% 20%
LPAL1992ZWA 0.0098 0.0020 0.0061 0.0012 0.0176 0.0035 20% 20% 20%
LPALEUR1 0.0089 0.0022 0.0051 0.0013 0.0050 0.0013 25% 25% 25%
LPALEUR2 0.0089 0.0022 0.0051 0.0013 0.0050 0.0013 25% 25% 25%
LPALEUR3 0.0054 0.0008 0.0016 0.0002 0.0050 0.0008 15% 15% 15%
LPALEUR4 0.0044 0.0007 0.0022 0.0003 0.0050 0.0008 15% 15% 15%
LPALEUR5 0.0036 0.0005 0.0018 0.0003 0.0050 0.0008 15% 15% 15%
LPALEUR6 0.0036 0.0005 0.0018 0.0003 0.0050 0.0008 15% 15% 15%
LPALO3WCLCH 0.0160 0.0032 0.0097 0.0019 0.0300 0.0060 20% 20% 20%
LPALO3WCMED 0.0160 0.0032 0.0097 0.0019 0.0300 0.0060 20% 20% 20%
LPALPR82LCH 0.0395 0.0079 0.0301 0.0060 0.0642 0.0128 20% 20% 20%
LPALPR82MED 0.0270 0.0054 0.0207 0.0041 0.0439 0.0088 20% 20% 20%
LPALPR82ZWA 0.0240 0.0048 0.0187 0.0037 0.0390 0.0078 20% 20% 20%
LPALR3WC 0.0089 0.0018 0.0051 0.0010 0.0127 0.0025 20% 20% 20%
LPEBEUR5 0.0022 0.0003 0.0011 0.0002 0.0030 0.0005 15% 15% 15%
LPEBEUR6 0.0022 0.0003 0.0011 0.0002 0.0030 0.0005 15% 15% 15%
LPEDEUR5 0.0020 0.0011 0.0010 0.0006 0.0021 0.0015 56% 56% 71%
LPEDEUA6 0.0004 0.0000 0.0004 0.0000 0.0011 0.0001 11% 11% 10%
LPEDEUC6 0.0004 0.0000 0.0004 0.0000 0.0011 0.0001 11% 11% 10%
LPHBEUR4 0.0046 0.0007 0.0023 0.0004 0.0050 0.0008 15% 15% 15%
LPHBEUR5 0.0037 0.0006 0.0019 0.0003 0.0050 0.0008 15% 15% 15%
LPHBEUR6 0.0037 0.0006 0.0019 0.0003 0.0050 0.0008 15% 15% 15%
LPHDEUR5 0.0005 0.0001 0.0005 0.0001 0.0015 0.0002 10% 10% 10%
LPHDEUR6 0.0005 0.0001 0.0005 0.0001 0.0015 0.0002 10% 10% 10%
heavy-duty vehicles exhaust PM EC exhaust PM EC exhaust PM EC EC/PM EC/PM EC/PM
MVABEUR0LCH 0.3884 0.0777 0.3988 0.0798 0.4029 0.0806 20% 20% 20%
MVADEDE5LCHSCR 0.0099 0.0048 0.0066 0.0026 0.0055 0.0018 49% 40% 33%
MVADEDE5SCRZWA 0.0198 0.0095 0.0133 0.0052 0.0112 0.0036 48% 39% 32%
MVADEUG5EGRLCH 0.0110 0.0057 0.0068 0.0029 0.0054 0.0018 51% 42% 33%
MVADEUG5EGRZWA 0.0219 0.0108 0.0139 0.0055 0.0110 0.0035 49% 40% 32%
MVADEUG5LCHSCR 0.0087 0.0048 0.0057 0.0026 0.0048 0.0016 55% 45% 33%
MVADEUG5SCRZWA 0.0178 0.0091 0.0117 0.0049 0.0095 0.0031 51% 42% 33%
MVADEUR0LCH 0.5396 0.2698 0.3273 0.1637 0.2689 0.1344 50% 50% 50%
MVADEUR0ZWA 0.9790 0.4895 0.5548 0.2774 0.4352 0.2176 50% 50% 50%
MVADEUR1LCH 0.2649 0.1722 0.1588 0.1032 0.1319 0.0857 65% 65% 65%
MVADEUR1ZWA 0.4880 0.3172 0.2672 0.1737 0.2104 0.1368 65% 65% 65%
MVADEUR2LCH 0.1069 0.0695 0.0771 0.0501 0.0666 0.0433 65% 65% 65%
MVADEUR2ZWA 0.1913 0.1244 0.1190 0.0773 0.0992 0.0645 65% 65% 65%
MVADEUR3DPFLCH 0.0075 0.0011 0.0045 0.0007 0.0032 0.0005 15% 15% 15%
MVADEUR3DPFZWA 0.0135 0.0020 0.0075 0.0011 0.0056 0.0008 15% 15% 15%
MVADEUR3HOFLCH 0.0747 0.0560 0.0448 0.0336 0.0322 0.0241 75% 75% 75%
MVADEUR3HOFZWA 0.1353 0.1015 0.0753 0.0565 0.0555 0.0417 75% 75% 75%
MVADEUR3LCH 0.1244 0.0871 0.0747 0.0523 0.0536 0.0375 70% 70% 70%
MVADEUR3ZWA 0.2255 0.1578 0.1255 0.0879 0.0926 0.0648 70% 70% 70%
MVADEUR4LCH 0.0254 0.0190 0.0138 0.0104 0.0102 0.0077 75% 75% 75%
MVADEUR4ZWA 0.0461 0.0346 0.0239 0.0180 0.0180 0.0135 75% 75% 75%
MVADEUR6LCH 0.0061 0.0020 0.0042 0.0011 0.0037 0.0008 32% 25% 21%
MVADEUR6ZWA 0.0126 0.0035 0.0086 0.0018 0.0074 0.0014 28% 21% 19%
MVALEUR0LCH 0.0971 0.0194 0.0997 0.0199 0.1007 0.0201 20% 20% 20%
ZTRBEUR0 0.3884 0.0777 0.3988 0.0798 0.4024 0.0805 20% 20% 20%
ZTRDEDE5LCHSCR 0.0272 0.0128 0.0198 0.0071 0.0159 0.0049 47% 36% 31%
ZTRDEDE5SCRZWA 0.0428 0.0181 0.0533 0.0128 0.0551 0.0108 42% 24% 20%
ZTRDEUG5EGRLCH 0.0296 0.0135 0.0227 0.0076 0.0164 0.0049 45% 34% 30%
ZTRDEUG5EGRZWA 0.1056 0.0230 0.0784 0.0155 0.0590 0.0113 22% 20% 19%
ZTRDEUG5LCHSCR 0.0254 0.0120 0.0164 0.0064 0.0129 0.0042 47% 39% 32%
ZTRDEUG5SCRZWA 0.0988 0.0238 0.0540 0.0124 0.0241 0.0064 24% 23% 27%
ZTRDEUR0 1.4090 0.7045 0.8247 0.4123 0.6097 0.3048 50% 50% 50%
ZTRDEUR1 0.7632 0.4961 0.4317 0.2806 0.3119 0.2027 65% 65% 65%
ZTRDEUR2 0.3366 0.2188 0.2024 0.1315 0.1655 0.1075 65% 65% 65%
ZTRDEUR3 0.3023 0.2116 0.1677 0.1174 0.1242 0.0869 70% 70% 70%
ZTRDEUR3DPF 0.0181 0.0027 0.0101 0.0015 0.0075 0.0011 15% 15% 15%
ZTRDEUR3HOF 0.1814 0.1360 0.1006 0.0755 0.0745 0.0559 75% 75% 75%
ZTRDEUR4 0.0591 0.0444 0.0295 0.0222 0.0212 0.0159 75% 75% 75%
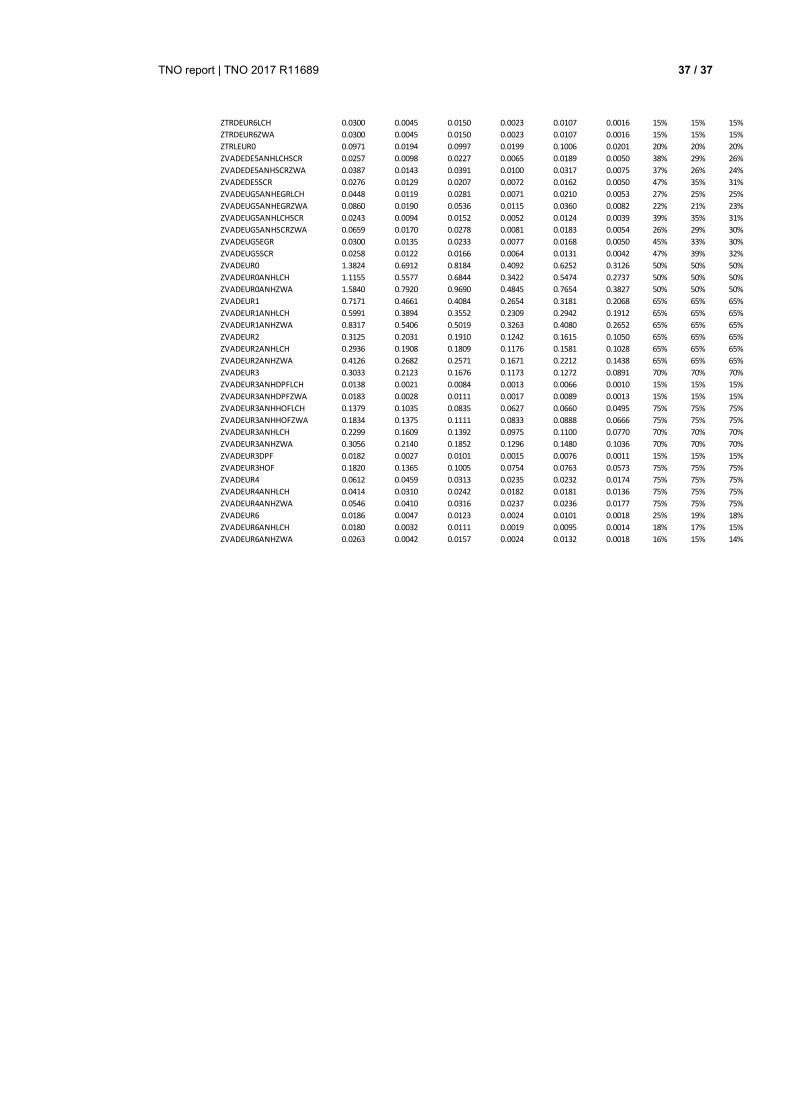
TNO report | TNO 2017 R11689 37 / 37
ZTRDEUR6LCH 0.0300 0.0045 0.0150 0.0023 0.0107 0.0016 15% 15% 15%
ZTRDEUR6ZWA 0.0300 0.0045 0.0150 0.0023 0.0107 0.0016 15% 15% 15%
ZTRLEUR0 0.0971 0.0194 0.0997 0.0199 0.1006 0.0201 20% 20% 20%
ZVADEDE5ANHLCHSCR 0.0257 0.0098 0.0227 0.0065 0.0189 0.0050 38% 29% 26%
ZVADEDE5ANHSCRZWA 0.0387 0.0143 0.0391 0.0100 0.0317 0.0075 37% 26% 24%
ZVADEDE5SCR 0.0276 0.0129 0.0207 0.0072 0.0162 0.0050 47% 35% 31%
ZVADEUG5ANHEGRLCH 0.0448 0.0119 0.0281 0.0071 0.0210 0.0053 27% 25% 25%
ZVADEUG5ANHEGRZWA 0.0860 0.0190 0.0536 0.0115 0.0360 0.0082 22% 21% 23%
ZVADEUG5ANHLCHSCR 0.0243 0.0094 0.0152 0.0052 0.0124 0.0039 39% 35% 31%
ZVADEUG5ANHSCRZWA 0.0659 0.0170 0.0278 0.0081 0.0183 0.0054 26% 29% 30%
ZVADEUG5EGR 0.0300 0.0135 0.0233 0.0077 0.0168 0.0050 45% 33% 30%
ZVADEUG5SCR 0.0258 0.0122 0.0166 0.0064 0.0131 0.0042 47% 39% 32%
ZVADEUR0 1.3824 0.6912 0.8184 0.4092 0.6252 0.3126 50% 50% 50%
ZVADEUR0ANHLCH 1.1155 0.5577 0.6844 0.3422 0.5474 0.2737 50% 50% 50%
ZVADEUR0ANHZWA 1.5840 0.7920 0.9690 0.4845 0.7654 0.3827 50% 50% 50%
ZVADEUR1 0.7171 0.4661 0.4084 0.2654 0.3181 0.2068 65% 65% 65%
ZVADEUR1ANHLCH 0.5991 0.3894 0.3552 0.2309 0.2942 0.1912 65% 65% 65%
ZVADEUR1ANHZWA 0.8317 0.5406 0.5019 0.3263 0.4080 0.2652 65% 65% 65%
ZVADEUR2 0.3125 0.2031 0.1910 0.1242 0.1615 0.1050 65% 65% 65%
ZVADEUR2ANHLCH 0.2936 0.1908 0.1809 0.1176 0.1581 0.1028 65% 65% 65%
ZVADEUR2ANHZWA 0.4126 0.2682 0.2571 0.1671 0.2212 0.1438 65% 65% 65%
ZVADEUR3 0.3033 0.2123 0.1676 0.1173 0.1272 0.0891 70% 70% 70%
ZVADEUR3ANHDPFLCH 0.0138 0.0021 0.0084 0.0013 0.0066 0.0010 15% 15% 15%
ZVADEUR3ANHDPFZWA 0.0183 0.0028 0.0111 0.0017 0.0089 0.0013 15% 15% 15%
ZVADEUR3ANHHOFLCH 0.1379 0.1035 0.0835 0.0627 0.0660 0.0495 75% 75% 75%
ZVADEUR3ANHHOFZWA 0.1834 0.1375 0.1111 0.0833 0.0888 0.0666 75% 75% 75%
ZVADEUR3ANHLCH 0.2299 0.1609 0.1392 0.0975 0.1100 0.0770 70% 70% 70%
ZVADEUR3ANHZWA 0.3056 0.2140 0.1852 0.1296 0.1480 0.1036 70% 70% 70%
ZVADEUR3DPF 0.0182 0.0027 0.0101 0.0015 0.0076 0.0011 15% 15% 15%
ZVADEUR3HOF 0.1820 0.1365 0.1005 0.0754 0.0763 0.0573 75% 75% 75%
ZVADEUR4 0.0612 0.0459 0.0313 0.0235 0.0232 0.0174 75% 75% 75%
ZVADEUR4ANHLCH 0.0414 0.0310 0.0242 0.0182 0.0181 0.0136 75% 75% 75%
ZVADEUR4ANHZWA 0.0546 0.0410 0.0316 0.0237 0.0236 0.0177 75% 75% 75%
ZVADEUR6 0.0186 0.0047 0.0123 0.0024 0.0101 0.0018 25% 19% 18%
ZVADEUR6ANHLCH 0.0180 0.0032 0.0111 0.0019 0.0095 0.0014 18% 17% 15%
ZVADEUR6ANHZWA 0.0263 0.0042 0.0157 0.0024 0.0132 0.0018 16% 15% 14%