to: all councilmembers july 21, ,,011 gerr f. mile '7...
TRANSCRIPT
CLA Memorandum
TO: All Councilmembers July 21, ,,011
FROM: Gerr F. Mile '7Chief Legislati e Analyst
Assignment No: 11-07-0685
AEG Economic Reports
Attached are two reports prepared by consultants to AEG that analyze the proposed Event Centerproject. These are the complete studies, not executive summaries. The MR+E study considersgeneral revenues that could be generated by the project and the PKF study estimates potentialconvention business and hotel occupancy resulting from the project. We have just received thesedocuments and have not yet prepared an analysis of their findings. We wil be prepared to do sonext week.
Please note that the City has retained its own consultants to review the economic impacts of the
project. The City staff report concerning the project wil contain that full analysis, with detailedattachments, wil be released soon.
If we may be of further assistance, please us let know.
~Attachments: MR+E Economic Study
PKF Convention Study
Draft
Fiscal Analysis - Special Events Center and Los AngelesConvention Center Expansion
Prepared forAEG
Prepared by
Metropolitan Research and Economics
With
PKF Consulting
7/15/11
3308 Helms
Culver CA 90232
Section I Executive Summary
I ntrod uction
This report establishes the fiscal contributions of annual operatións of the proposed AEG Special Events
Center (SEC) and expansion of the Los Angeles Convention Center (LACC). The analysis investigates the
revenue implications for jurisdictions affected by activities at the future facilty. These include:
. State of Caliornia-- sales taxes
. Los Angeles County-- property taxes
. Metropolian Transportation Authority (MTA)-- sales taxes
. City of Los Angeles-- property and sales taxes along with a set of local options
. Los Angeles Unified School District-- propert taxes
. Other special districts-- property taxes
The analysis considers two locations for impacts:
1) On-site impacts-- these are fiscal impacts that occur directly as result of activities that take place
within special events center and the expanded LACC.
2) Off-site impactsmWhich are the fiscal impacts of activities that are directly related to events that
occur at the new project but take place elsewhere in the City of LA. A key example of this would
be hotel room night generation attributable to an event held at the project.
Another important feature of this analysis is that it only focuses on net new incremental growth in activities
at the LACC. This analysis is based on a complimentary work effort undertaken by MR+E and PKF to
determine growth in the market that would be likely to occur once the SEC and improvements to the LACC
have been built.
Existing fiscal policy was used as the basis for determining impacts and all estimated values are shown as
2011 dollars.
Fiscal Analysis-SEC and LACC Expansion Section 1-1
Key findings
Table 1-1 summarizes the revenue impacts from all sources for activities at the SEC and expanded LACC
for a stable operating year. This includes both direct on-site impacts as well as off-site impacts that are
directly attributable to activities at the project. It is important to note that these off -site impacts are direct
primary impacts (that is to say they are not forecast based on economic multipliers representing secondary
rounds of expenditure) but are referred to as off-site due the location where the tax event would take place.
On an ongoing annual operating basis, the project can be anticipated to contribute over $41 million in total
from all sources both on and off-site. The total amount is comprised of $17.3 milion of on-site impacts and
$24.3 milion of off-site impacts.
The largest recipient of on-site impacts is the City of Los Angeles with an estimated $6.5 milion in revenue
generated by activities that occur directly at the SEC and expanded LACC. These revenues are made up of
a mix of property, sales and business activity taxes that are detailed in the supporting tables.
The City of Los Angeles is forecast to be the largest recipient of revenue from the projects operations, which
are forecast to contribute over $22 million per year on an annual recurring basis stemming from activities at
the SEC and the expanded LACC. The largest single component of the contribution is expected to come
from transient occupancy tax estimated at just over $11.5 milion per year. Other significant sources of
revenue include property tax at $5.6 million per year based on the value of improvements made at the
project and forecast development off-site.
Fiscal Analysis-SEC and LACC Expansion Section 1-2
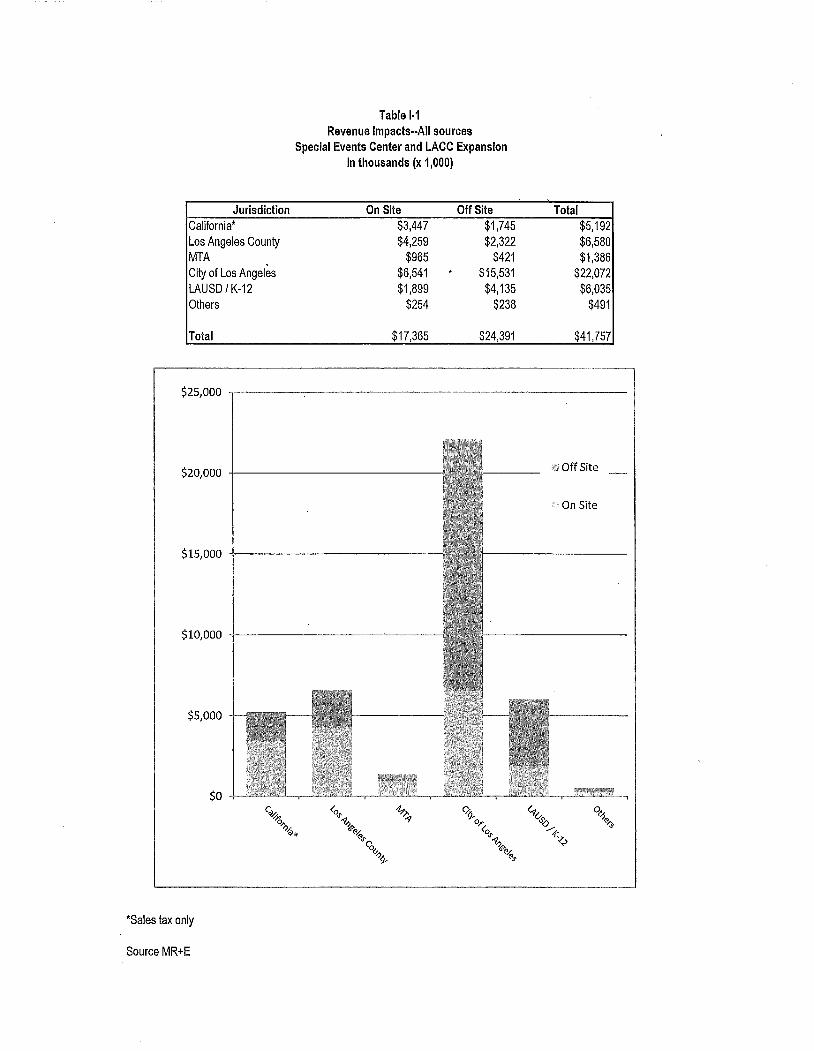
Table 1-1
Revenue Impacts--AII sources
Special Events Center and LACC Expansion
In thousands (x 1,000)
Jurisdiction On Site Off Site TotalCalifornia' $3,447 $1,745 $5,192Los Angeles County $4,259 $2,322 $6,580MTA $965 $421 $1,386City of Los Angeles $6,541 . $15,531 $22,072LAUSD / K-12 $1,899 $4,135 $6,035others $254 $238 $491
Total $17,365 $24,391 $41,757
$25,000
$20,000
$15,000 -
$10,000 -
$5,000
$0
q,1i!0.,?~*
('0 -i""'"'? "'~ø/-ø",
ç,v?1-
ç~0,.
('0"'"'?
~ø/-ø",
'Sales tax only
Source MR+E
Off Site
On Site
0~%/
1-'.~
°0ø~
Section II Technical Analysis ~,
I ntrod uction
This report represents an analysis of the public are revenue genêration anticipated from the development of
a special events (SEC) and expansion of the Los Angeles convention center that is been proposed by AEG,
for a site currently occupied by West Hall of the Los Angeles Convention Center (LACC). The goal of the
development program is to provide Los Angeles with increased convention hosting capacities through an
expanded and improved convention center, as well as to provide a special events center that is capable of
accommodating large-scale scale spectator events. The SEC is envisioned as being a home stadium for a
National Football League (NFL) franchise team and wil have the abilty to accommodate major international
sporting events and championship series events for professional and college athletics. The project is
anticipated to have a significant effect on the economy of Los Angeles and on business conditions in the
hospitaliy and convention industries in the city. The project represents a very substantial investment and as
such wil have the ability to positively influence the levels of economic activities that occur in the area around
Staples Center LA live the LACC and the South Park district as a whole.
This study focuses in on one particular facet of the economic contribution of the project-- namely fiscal
revenues. This is an analysis of the public revenue streams that can be anticipated from annual operations
of the SEC and expanded LA CC on a recurring basis for a stabilzed operating year. The study was
prepared by MR+E in cooperation with PKF Consulting. PKF has provided information on forecast
utilzation of the LACC for citywide conventions and the resulting room night generation and its implications
for the City of Los Angeles in terms of transient occupancy tax. MR+E has provided the fiscal impact
analysis for the other aspects of the project. A market study analyzing the potential for the expanded LACC
and special event center to accommodate net new business in Los Angeles is provided in an accompanying
study provided to AEG.
The following are key assumptions that underlie the analysis:
. All impacts are presented in 2011 dollars.
Fiscal Analysis-SEC and LACC Expansion Section 11-1
. Only net new incremental impacts are assessed. These are activities that can be directly attributed
to the new development program at the special event center and the expanqed LA CC
. The analysis proceeds using existing fiscal policy and rates.
.. Baseline information on capital costs and the event schedule at the special event center have been
provided by AEG.
In an attempt to capture the full fiscal contributions the project this study considers impacts of the following-
levels of geography in terms of relevant fund accounts. These include:
. state of California.. sales taxes
. Los Angeles County-- property taxes
. Metropolian Transportation Authority (MTA)-- sales taxes
. City of Los Angeles-- property and sales taxes along with a set of local options
. Los Angeles Unified School District.. propert taxes
.. Other special districts-- property taxes
The analysis considers two locations for impacts:
.. On-site impacts-- these are fiscal impacts that occur directly as result of activities that take place
within special events center and the expanded LACC.
. Off-site impacts---Which are the fiscal impacts of activities that are directly related to events that
occur at the new project but take place elsewhere in the City of LA. A key example of this would
be hotel room night generation attributable to an event held at the project.
The distinction between on-site and off-site impacts is geographic in nature and should not be confused with
direct and indirect impacts. That is to say all of the off-site impacts that are accounted for in this analysis
can be directly attributed to primary first round activities that occur within the project area.
Fiscal Analysis-SEC and LACC Expansion Section 11-2
Project description
Table 11-1 ilustrates the anticipated development program associated with theSEC and LA CC expansion.
The on-site development program is made up of three components:
1. The special event center (SEC)-- this is a 72,000 sea! facilty with a gross building area of 1.75
milion sq. ft.. This facility will be able to host large-scale sporting events including NFL football
and is convertible into exhibit space that can be used as part of the overall LACC operations
2. Parking facilties-- the project anticipates adding over 1,200 net new parking spaces in order to
accommodate anticipated increased visitation volumes on site.
3. Pico Hall-- This is an approximately 500,000 square-foot convention and exhibit facilty that
replaces the existing West Hall of the LACC.
The off-site development program is made up principally of two components that are directly attributable to
AEG's investment in the special event center and the LACC expansion. The project is likely to engender
additional off-site private investment throughout Downtown Los Angeles and in the South Park district.
However this analysis focuses on two specific categories of development that have been identified by AEG's
internal planning and through PKF's analysis of the downtown hotel market. These include the following:
1. Retail center-- AEG anticipates an additional development of 500,000 sq. ft. of destination
oriented retail to be co-developed along with the SEC development program.
2. Hotels-- PKF's market study from June 2011 anticipates that the downtown hotel market wil be
able to absorb 2,414 new rooms as a direct result of activities at the expanded LACC and the SEC
this additional room night capacity is based on demand from incremental growth directly attributed
to forecast activities at the project. Fiscal impacts of hotel operations discussed in this study are
limited to an analysis of the net incremental growth rather than the total inventory of hotel rooms in
downtown Los Angeles
Table 11- 2provides a forecast of annual events that are expected to occur at the project after construction of
the SEC and LACC expansion. It is likely that large-scale events will take place in both the SEC and
components of LACC so event to been divided into two basic categories:
Fiscal Analysis-SEC and LACC Expansion Section 11-3
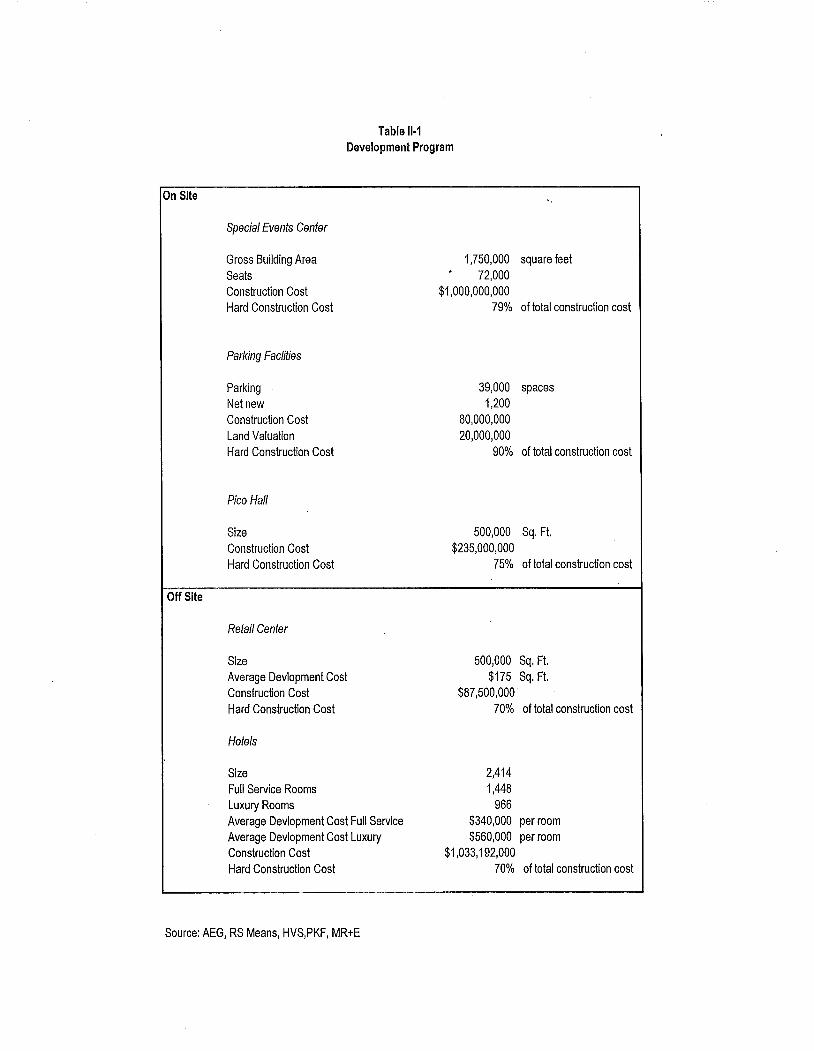
Table 11-1
Development Program
On Site
Special Events Center
Gross Building Area
SeatsConstruction Cost
Hard Construction Cost
1,750,000 square feet72,000
$1,000,000,00079% of total construction cost
Parking Facliies
Parking
Net new
Construction Cost
Land Valuation
Hard Construction Cost
39,000 spaces
1,200
80,000,000
20,000,000
90% of total construction cost
Pico Hall
Size
Construction Cost
Hard Construction Cost
500,000 Sq. Ft.
$235,000,00075% of total construction cost
Off Site
Retail Center
Size
Average Devlopment Cost
Construction Cost
Hard Construction Cost
500,000 Sq. Ft.
$175 Sq. Ft.$87,500,000.
70% of total construction cost
Hotels
Size
Full Service Rooms
Luxury Rooms
Average Devlopment Cost Full Service
Average Devlopment Cost Luxury
Construction Cost
Hard Construction Cost
2,414
1,448
966
$340,000 per room
$560,000 per room
$1,033,192,00070% of total construction cost
Source: AEG, RS Means, HVS,PKF, MR+E
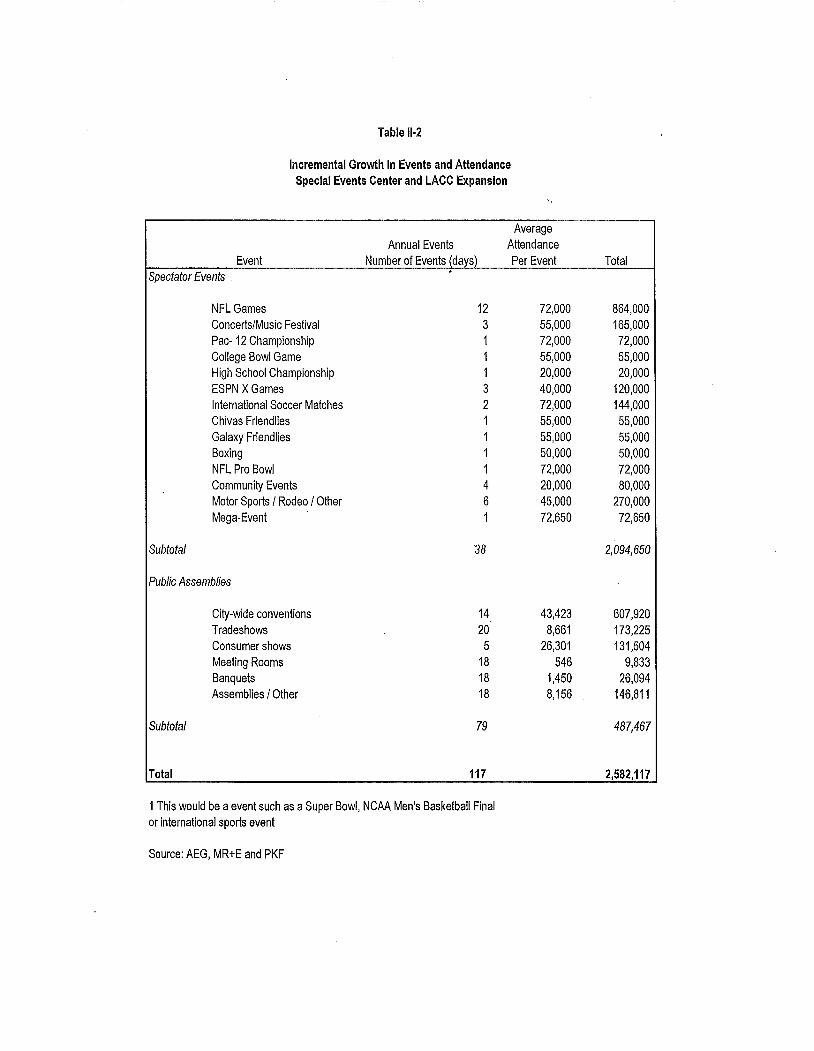
Table 11-2
Incremental Growth in Events and Attendance
Special Events Center and LACC Expansion
Average
Annual Events Attendance
Event Number of Events (days) Per Event Total
Spectator Events
NFL Games 12 72000 864,000
Concerts/Music Festival 3 55,000 165,000
Pac- 12 Championship 1 72,000 72,000
College Bowl Game 1 55,000 55,000
High School Championship 1 20,000 20,000
ESPN X Games 3 40,000 120,000
International Soccer Matches 2 72,000 144,000
Chivas Friendlies 1 55,000 55,000
Galaxy Friendlies 1 55,000 55,000
Boxing 1 50,000 50,000
NFL Pro Bowl 1 72000 72,000
Community Events 4 20,000 80,000
Motor Sports / Rodeo / Other 6 45,000 270,000
Mega-Event 1 72,650 72,650
Subtotal 38 2,094,650
Public Assemblies
City-wide conventions 14 43,423 607,920
Tradeshows 20 8,661 173,225
Consumer shows 5 26,301 131,504
Meeting Rooms 18 546 9,833
Banquets 18 1,450 26,094
Assemblies / Other 18 8,156 146,811
Subtotal 79 487,467
Total 117 2,582,117
1 This would be a event such as a Super Bowl, NCAA Men's Basketball Final
or international sports event
Source: AEG, MR+E and PKF
1. Spectator events-- these included spectator sports exhibitions and national championship events
that would primarily use the Stadium configuration of the SEC.
2. Public assemblies-- this is the incremental growth in the number of events and size of anticipated
by MR+E and PKF's earlier market analysis. This does-not represent the total amount of activity
that would occur at the LACC, but rather represents net new business that otherwise would not be
accommodated in Los Angeles.
Within the spectator event category NFL games represent the largest single category of event. The facilty
is expected to accommodate a variety of spectator sports many of which will have a draw for attendance
beyond the Los Angeles market. Of particular importance are the anticipated annual mega-events which wil
change in nature periodically. These are expected to include events such as the NFL Super Bowl the NCAA
men's basketball final four or an international sports event such as a World Cup or similar event.
Public assemblies are made up of a variety of activities. This analysis is based on the existing system of
categorization of events used by LACC management and LA Inc. These include the following:
1. Citywide conventions--. these are conventions that are booked at least 18 months in advance
and consume a significant number of hotel rooms as part of the event. Citywide conventions are
typically national and international scale and are focused on an extra regional market.
2. Tradeshows-- these are events that are open "to the trade" only. And represent an opportunity for
vendors to exhibit services and equipment to potential customers. These are business-to-business
events, typically aimed at a regional market, without a public component.
. 3. Consumer shows-- these are events open to the general public generally with the gated
admission. Consumer shows may include a retail component with direct sales.
4. Meeting room use-- this represents the use of the LACC's meeting rooms by businesses and
organizations independent of a larger exhibit or convention program.
5. Banquets and catered events-These are special events with seated meals
6. Assemblies-These are large scale public meetings often religious in nature
Fiscal Analysis-SEC and LACC Expansion Section 11-6
In total is anticipated that the project wil be able to accommodate an average annual basis 38 spectator
events with a total attendance of 2.09 milion. The LACC expansion is anticipated to generate 79 events net
new incremental events with an attendance of over 487,000. This combined total would yield 117 annual
events with a total attendance of just over 2.5 milion.
Fiscal revenues
The activities at the new project wil have fiscal implications for a broad variety of jurisdictions for both
dedicated and general fund purposes. This analysis looks at the total private flow of funds from all sources
to relevant jurisdictions generated from annual operations.
Property tax
Table 11-3 provides the allocation for property taxes from direct on-site investments. This is based on a total
value of improvements for the SEC and parking garage at just over $1 billion. This is a significant capital
investment in its own right that will have important contributions in terms of property tax. Over and above
the capital cost associated with improvements is a possessory interest which accounts for the value of land
occupied by private projects where in the city of Los Angeles retains title. This possessory interest assumes
a land valuation a $45 per sq. ft.. Pico Hall would remain a public facility as part of LACC and would be
exempt from property taxes. The distribution of the annual assessment of over $9.6 milion is shown on the
table and is based on existing tax rate area (TRA) that is in place for the site. The largest single recipient of
funds at just over $4.1 millon would be Los Angeles County's general fund. The County, including general
fund and flood control accounts, make up 44% of the total distribution of property tax generated by the
project. The city of Los Angeles would receive 33% of the direct on-site propert tax generated by the
project estimated at just over $3.1 million per year. K-12 education including LAUSD would receive 20% of
the total with LAUSD itself receiving just over $1.8 milion per year.
In terms of the estimated off-site propert tax stemming from the retail center and the net new incremental
hotel development, the tax rate area including city of Los Angeles TD#1 was used for analyzing the property
Fiscal Analysis-SEC and LACC Expansion Section 11-7
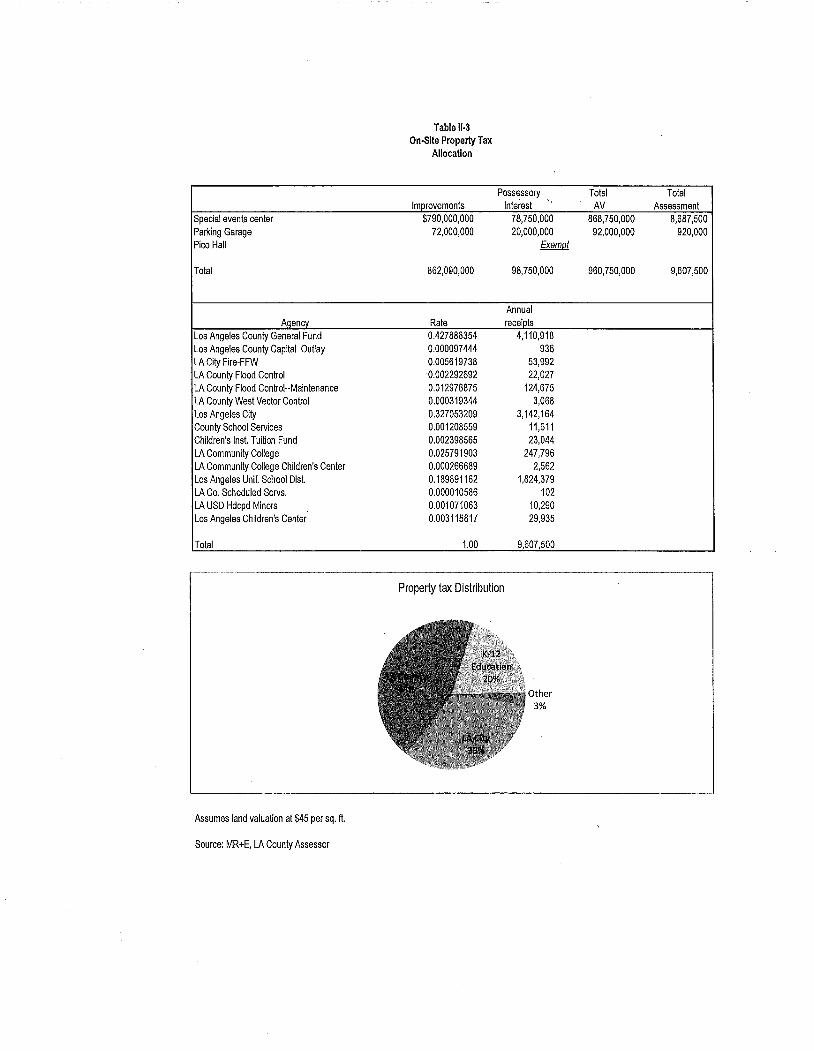
Table 11-3
On-Site Propert TaxAllocation
Possessory Total Total
Imorovements Interest"
AV AssessmentSpecial events center $790,000,000 78,750,000 868,750,000 8,687.500Parking Garage 72.000,000 20,000,000 92,000,000 920,000
Pico Hall Exemol
Total 862,OQO.000 98,750,000 960,750,000 9,607,500
Annual
Aaencv Rate receiots
Los Angeles County General Fund 0.427886354 4.110.918
Los Angeles County Capital Outlay 0.000097444 936
LA City Fire-FFW 0.005619738 53,992
LA County Flood Control . 0.002292692 22.027
LA County Flood ControlnMaintenance 0.012976875 124,675
LA County West Vector Control 0.000319344 3,068
Los Angeles City 0.327053209 3.142,164
County School Services 0.001208559 11.611
Chlldren's Insl. Tuition Fund 0.002398565 23,044
LA Community College 0.025791903 247,796
LA Community College Children's Center 0.000266689 2.562
Los Angeles Unif. School Dist. 0.189891162 1.824.379
LA Co. Scheduled Servs. 0.000010586 102
LA USD Hdcpd Minors 0.001071063 10,290
Los Angeles Children's Center 0.003115817 29,935
Total 1.00 9,607,500
Property tax Distribution
other3%
Assumes land valuation at $45 per sq. ft.
Source: MR+E, LA County Assessor

Table II- 4
Estimated Off-Site Propert TaxAllocation
Total Total
Imorovements Land AV Assessment
Retail Center $61,250,000 6,750,000 68,000,000 680,000
Hotel 72,234,400 123,983,040 847,217,40 8,472,174
Total 784,484,400 130,733,040 915,217,440 9,152,174
.
Annual
Aaencv Rate receiots
Los Angeles County General Fund 0.24463767 2,238,967
Los Angeles County Capital Outlay 0.000097444 892
LA City Fire-FFW 0.005619738 51 ,433
LA County Flood Control 0.00134472 12,307
LA County Flood Control--Maintenance 0.007609695 69,645
LA County West Vector Control 0.000190083 1,740
Los Angeles City 1 0.262842057 2,405.576
ERAF 0.081471093 745,638
ERAF Imp. 0.17433158 1,578,138
County School Seivices 0.001208559 11,061
Children's Ins!. Tuition Fund 0.002398565 21,952
LA Community College 0.025791903 236,052
LA Community College Children's Center 0.000266689 2,41.Los Angeles Unif. School Dis!. 0.189891162 1,737,917
LA Co. Scheduled Seivs. 0.000010586 97
LA USD Hdcpd Minors 0.001071063 9,803
Los Angeles Children's Center 0.003115817 28,517
Total 1.00 9,152,174
Property tax Distribution
Other3%
1) LA City TO #1
Assumes land valuation at $45 per sq. ft.
Source: MR+E, LA County Assessor
tax implications. The specific geography of the investment may be spread out over l1u1tiple TRA's however
TO #1 and its associated rates were used for the purposes of this analysis. Note that this is subject to
ERAF distributions and as such K-12 education receives a larger proportion of property tax revenues. In
terms of the direct offsite investments the total assessed valuatiçn is estimated at just over $915 million.
Resulting in over $9.1 million in total tax assessed. The largest recipient of this revenue would be K-12
education due to the presence of the ERAF funding formula. The largest single amount would be the City of
Los Angeles general fund at $2.4 million per year followed by Los Angeles County general fund at just over
$2.2 million per year.
Sales tax
Table 11-5 presents an estimate of direct retail sales that occur on site. This analysis is based on an
estimate of per capita sales by event attendees at events that occur within the project. This represents
spending on taxable goods such as prepared food and merchandise at the facility. MR+E has provided the
analysis of per capita sales for the spectator events and non-citywide public assemblies based on an
analysis of industry data and financial reports for various spectator events where available and survey data.
PKF has provided the data on citywide conventions. Presently Los Angeles County's sales tax rate is
8.,75%. This analysis anticipates that spectator events would generate just over $49.1 million in taxable
sales per year yielding total tax receipts of $4.3 millon. Net incremental growth in public assemblies is
anticipated to generate over $5.9 milion in direct taxable sales on-site which would generate over $480,000
in sales tax receipts. In total on annual recurring basis on site retail sales are forecast to generate over $4.8
milion in sales tax revenue.
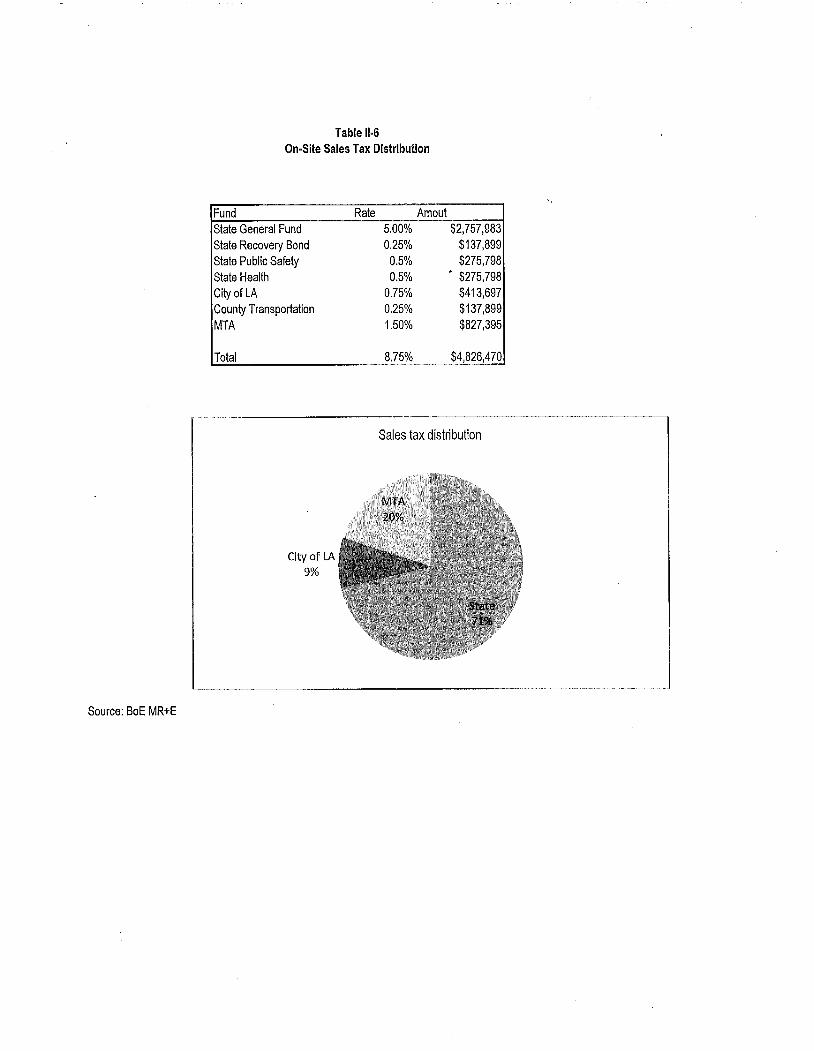
Table 11-6 provides the distribution of the 8.75% rate by fund. The largest single recipient of sales tax is the
State of California general fund which would receive 5% of the 8.75% collected. The second largest
recipient of sales tax is the MT A which would receive 1.5% of all retail sales. This is a result of measure R
and additional assessments within the County. The City of Los Angeles would receive .75%, or an estimated
$413,000, per year from direct on-site retail sales.
Fiscal Analysis-SEC and LACC Expansion Section 11-10
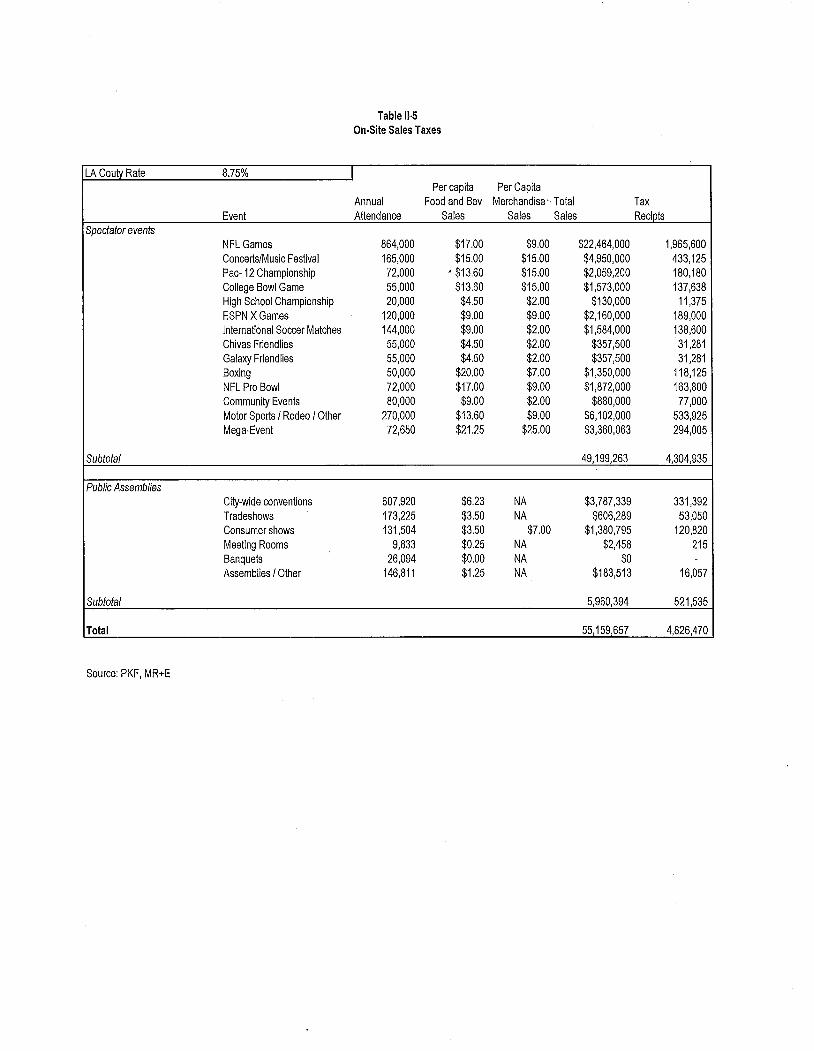
Table 11.5
On.Site Sales Taxes
LA Couty Rate 8.75% I
Per capita Per Capita
Annual Food and Bev Merchandise" Total Tax
Event Attendance Sales Sales Sales Recipts
Spectator eventsNFL Games 864,000 $17.00 $9.00 $22,464,000 1,965,600
ConcertslMusic Festival 165,000 $15.00 $15.00 $4,950,000 433,125
Pac-12 Championship 72,000 . $13.60 $15.00 $2,059,200 180,180
College Bowl Game 55,000 $13.60 $15.00 $1,573,000 137,638
High School Championship 20,000 $4.50 $2.00 $130,000 11,375
ESPN X Games 120,000 $9.00 $9.00 $2,160,000 189,000
International Soccr Matches 144,000 $9.00 $2.00 $1,584,000 138,600
Chivas Friendlies 55,000 $4.50 $2.00 $357,500 31,281
Galaxy Friendlies 55,000 $4,50 $2.00 $357,500 31,281
Boxing 50,000 $20.00 $7.00 $1,350,000 118,125
NFL Pro Bowl 72,000 $17.00 $9.00 $1,872,000 163,800
Community Events 80,000 $9.00 $2.00 $880,000 77,000
Motor Sports I Rodeo I Other 270,000 $13.60 $9.00 $6,102,000 533,925Mega-Event 72,650 $21,25 $25.00 $3,360,063 294,005
Subtotal 49,199,263 4,304,935
Public Assemblies
City-wide conventions 607,920 $6.23 NA $3,787,339 331,392
Tradeshows 173,225 $3.50 NA $606,289 53,050
Consumer shows 131,504 $3.50 $7.00 $1,380,795 120,820
Meeting Rooms 9,833 $0.25 NA $2,458 215
Banquets 26,094 $0.00 NA $0 -
Assemblies i Other 146,811 $1.25 NA $183,513 16,057
Subtotal 5,960,394 521 ,535
Total 55,159,657 4,826,470
Source: PKF, MR+E
Source: BoE MR+E
Table 11-6
On-Site Sales Tax Distribution
Fund
State General Fund
State Recovery Bond
State Public Safety
State Health
City of LA
County Transportation
MTA
Total
City of LA
9%
Rate Amoul5.00% $2,757,9830.25% $137,8990.5% $275,7980.5% . $275,798
0.75% $413,6970.25% $137,8991.50% $827,395
8.75% $4,826,70
Sales tax distribution
"
Table 11-7 provides an estimate for the direct off-site retail sales. Off-site sales include delegate
expenditures at citywide conventions in expenditures by attendees at spectator events directly attributable to
their attendance at an event at either the SEC or the expanded LACC. Again note that the public assembly
expenditures represent only the net growth in advance attributable to the expansion program and does not
represent the total off-site retail sales tax implications of LACC operations. In addition to attendance-based
estimates of retail sales of value of $550 per square foot is assigned to the destination retail complex that is
anticipated as part of the development program. It is assumed that this faciliy would draw a significant
amount of its patronage from consumers attending events at the SEC and the expanded LA CC. Therefore
to avoid double counting the value of off-site expenditures attributable to the development program have
been subtracted from the total level of taxable retail sales anticipated at the retail complex.
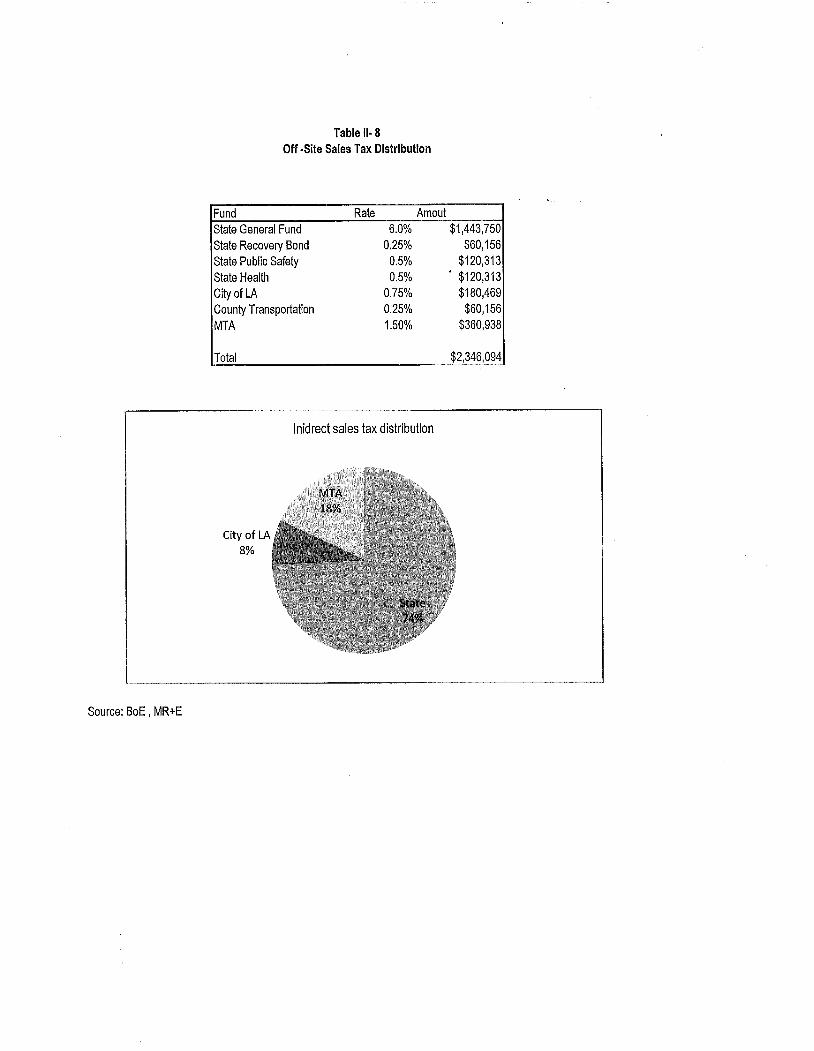
Off-site direct retail sales are estimated to generate over $24 million in recurring annual revenues. Table 11-
8 provides a distribution of the sales tax based on existing splits of the county's 8.75% sales tax rate. The
State of California can anticipate receiving $1.4 million per year which would be the largest portion, the MT A
is forecast to receive over $360,000 per year and the City of Los Angeles general fund would be anticipated
to receive approximately $180,000 per year from direct off-site retail sales associated with the development
program.
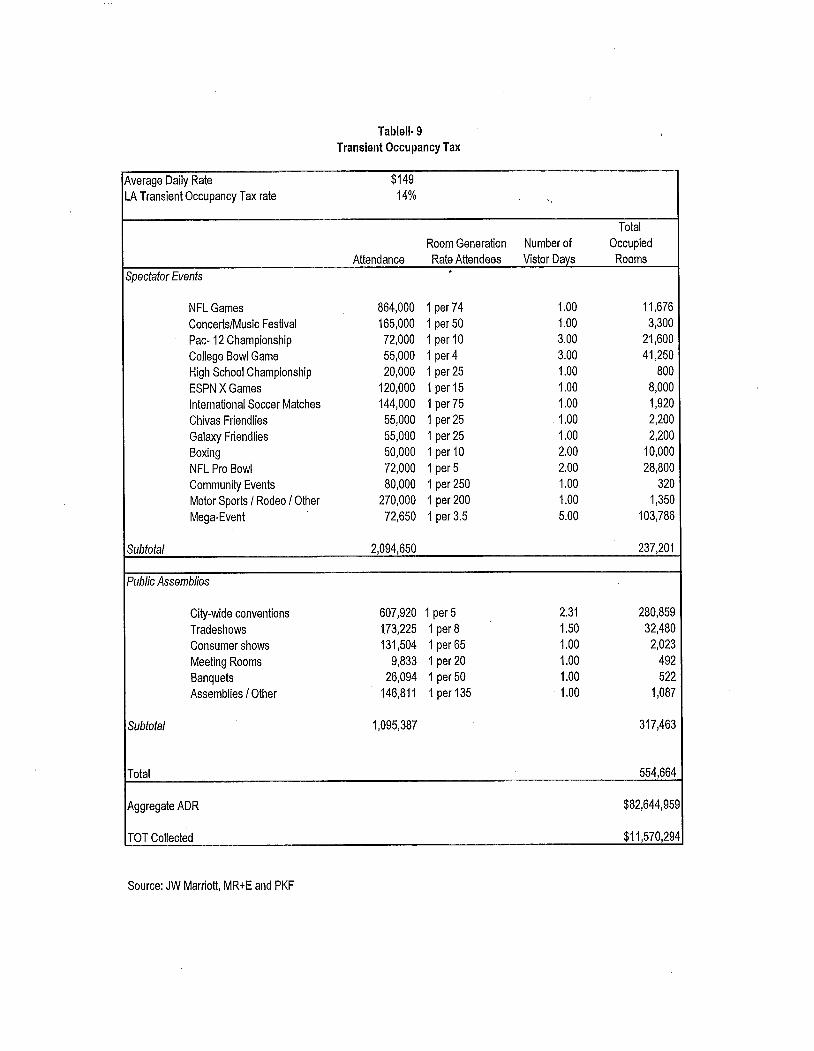
Transient occupancy tax
The city of Los Angeles charges a 14% levy on hotel space occupied for less than 30 days. This transient
occupancy tax (TOT) is an important part of the fiscal rationale for the maintenance and operation of the
LACe and the city's tourism-based economic development programs. Table 11-9 provides an attendance-
based analysis of rooms night generation associated with activities at the project. PKF has supplied the
room a generation rate for citywide conventions based on its previous market work MR+E has provided
estimates for the other categories of events. According to PKF the current average daily rate in downtown
Los Angeles is $149. This is used as the basis for the valuation of the aggregate average daily rate (AOR)
associated with the project.
Fiscal Analysis-SEC and LACe Expansion Section 11-13
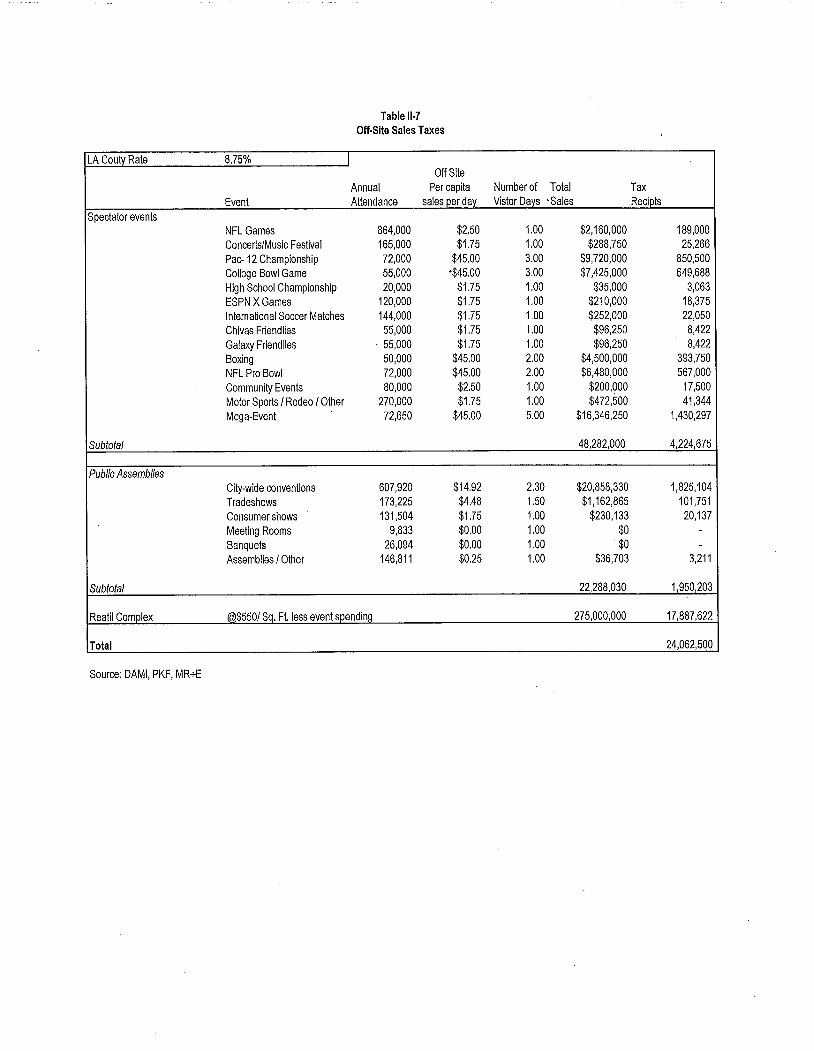
Table 11.7
Off.Site Sales Taxes
LA Couty Rate 8.75% I
Off Site
Annual Per capita Number of Total Tax
Event Attendance sales oer dav Vistor Davs 'Sales Reciots
Spectator eventsNFL Games 864,000 $2.50 1.00 $2,160,000 189,000
Concerts/Music Festival 165,000 $1.75 1.00 $288,750 25,266
Pac-12 Championship 72,000 $45.00 3.00 $9,720,000 850,500
College Bowl Game 55,000 '$45.00 3.00 $7,425,000 649,688
High School Championship 20,000 $1.75 1.00 $35,000 3,063
ESPN X Games 120,000 $1.75 1.00 $210,000 18,375
International Soccr Matches 144,000 $1.75 1.00 $252,000 22,050
Chivas Friendlies 55,000 $1.75 1.00 $96,250 8,422
Galaxy Friendlies 55,000 $1.75 1.00 $96,250 8,422
Boxing 50,000 $45.00 2.00 $4,500,000 393,750
NFL Pro Bowl 72,000 $45.00 2.00 $6,480,000 567,000
Community Events 80,000 $2.50 1.00 $200,000 17,500
Motor Sports I Rodeo / Other 270,000 $1.75 1.00 $472,500 41,344
Mega-Event 72,650 $45.00 5.00 $16,346,250 1,430,297
Subtotal 48,282,000 4,224,675
Public Assemblies
City-wide conventions 607,920 $14.92 2.30 $20,858,330 1,825,104
Tradeshows 173,225 $4.48 1.50 $1,162,865 101,751
Consumer shows 131,504 $1.75 1.00 $230,133 20,137
Meeting Rooms 9,833 $0.00 1.00 $0 -
Banquets 26,094 $0.00 1.00 $0 -
Assemblies / Other 146,811 $0.25 1.00 $36,703 3.211
Subtotal 22,288,030 1,950,203
Reati Complex tw$5501 Sq. Ft less event spendinq 275,000,000 17,887,622
Total 24,062,500
Source: DAMI, PKF, MR+E
Source: BoE , MR+E
Table II- 8
Off -Site Sales Tax Distribution
Fund
State General Fund
State Recovery Bond
State Public Safety
State Health
City of LA
County Transportation
MTA
Rate Amout6.0% $1,443,750
0.25% $60,1560.5% $120,3130.5% . $120,313
0.75% $180,4690.25% $60,1561.50% $360,938
Total $2,346,094
Inidrect sales tax distribution
City of LA8%
Tablell- 9
Transient Occupancy Tax
Average Daily Rate $149LA Transient Occupancy Tax rate 14% "
Total
Room Generation Number of Occupied
Attendance Rate Attendees Vistor Davs Rooms
Spectator Events.
NFL Games 864,000 1 per 74 1.00 11,676
Concerts/Music Festival 165,000 1 per 50 1.00 3,300
Pac- 12 Championship 72,000 1 per 10 3.00 21,600
College Bowl Game 55,000 1 per 4 3.00 41 ,250
High School Championship 20,000 1 per 25 1.00 800
ESPN X Games 120,000 1 per 15 1.00 8,000
International Soccer Matches 144,000 1 per 75 1.00 1,920
Chivas Friendlies 55,000 1 per 25 1.00 2,200
Galaxy Friendlies 55,000 1 per 25 1.00 2,200
Boxing 50,000 1 per 10 2.00 10,000
NFL Pro Bowl 72,000 1 per 5 2.00 28,800
Community Events 80,000 1 per 250 1.00 320
Motor Sports I Rodeo / Other 270,000 1 per 200 1.00 1,350
Mega-Event 72,650 1 per 3.5 5.00 103,786
Subtotal 2,094,650 237,201
Public Assemblies
City-wide conventions 607,920 1 per 5 2.31 280,859
Tradeshows 173,225 1 per 8 1.50 32,480
Consumer shows 131,504 1 per 65 1.00 2,023
Meeting Rooms 9,833 1 per 20 1.00 492
Banquets 26,094 1 per 50 1.00 522
Assemblies / Other 146,811 1 per 135 1.00 1,087
Subtotal 1,095,387 317,463
Total 554,664
Aggregate ADR $82,644,959
TOT Collected $11,570,294
Source: JW Marriott, MR+E and PKF
Spectator events are anticipated to support over 327,000 occupied room nights per year with the bulk of
these rooms being generated by mega-events and college championships which draw national and non-
local attendance. In terms of public assemblies, citywide conventions are the largest single driver of
occupied room nights estimated by PKF at 280,000. In total thi9 yields an aggregated ADR of $82.5 million
per year yielding a total of $11.5 milion in TOT available to the city of Los Angeles is general fund as a
result of that new activities at the expanded LACC and SEC project.
Parking tax
The City of Los Angeles levies a 10% parking tax on all automobile parking facilties. Based on the parking
generation rates shown on Table 11-10 the project is anticipated to generate $15.7 million aggregate parking
expenditure. This would yield over $1.5 million per year to the general fund accounts of the City of Los
Angeles. A split is shown between parking at LACC/SEC facilities as opposed to anticipated off site
parking.
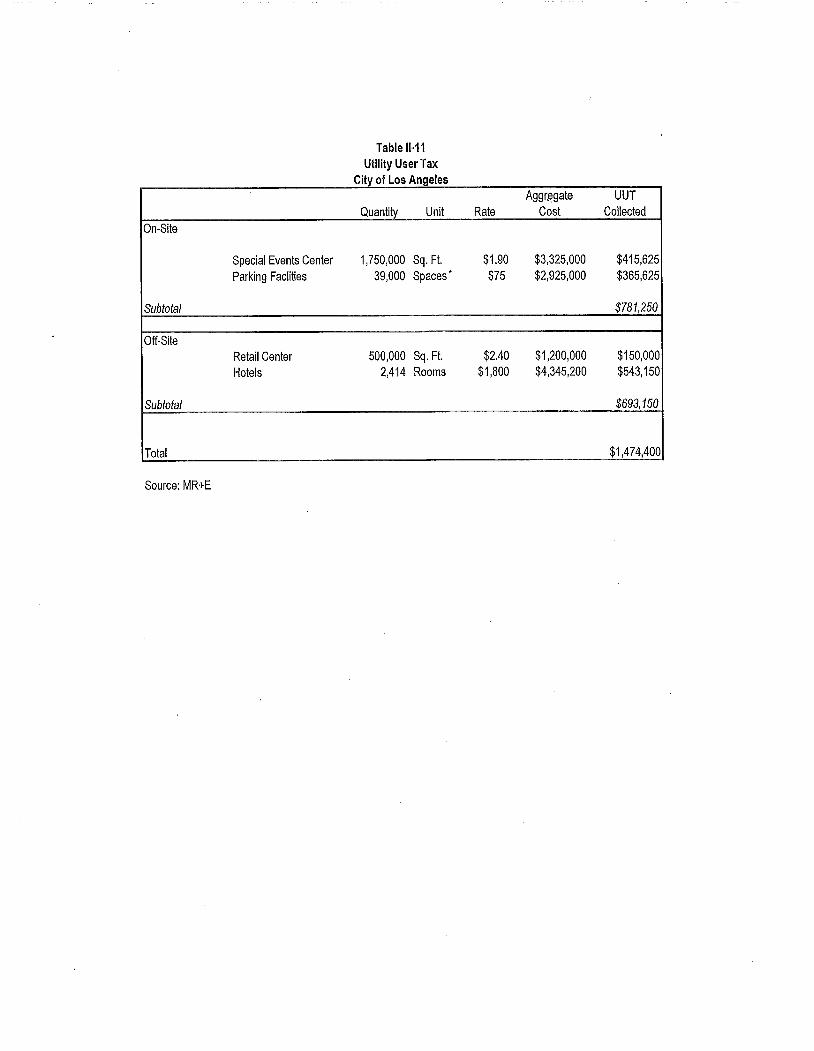
Utiliy user tax
The City of Los Angeles levies a utility user tax (UUT) on electricity gas and telephone use at all addresses
in LA. On-site generation of UUT wil come primarily from the consumption of electricity at the special
events center as well as utilities by exhibitors and attendees at Pico HalL. Using an average annual rate of
utility consumption of $1.90 per sq. ft. the SEC can be anticipated to generate over $781 ,000 worth of
annual UUT revenue for the City of Los Angeles. Off-site consumption of utilties at the retail center and the
incremental additional hotel rooms is estimated at just over 693,000 per year yielding a total estimated UUT
levy of $1.4 million in net new revenue to the city's general fund accounts. Table 11-11 shows the generation
rates aggregate cost and total yield for this category of revenue.
Business license tax
Los Angeles municipal code provides for a gross receipts tax on business operations located within the city.
The primary source of business license assessments from on-site activities would stem from operations of
Fiscal Analysis-SEC and LACe Expansion Section 11-17
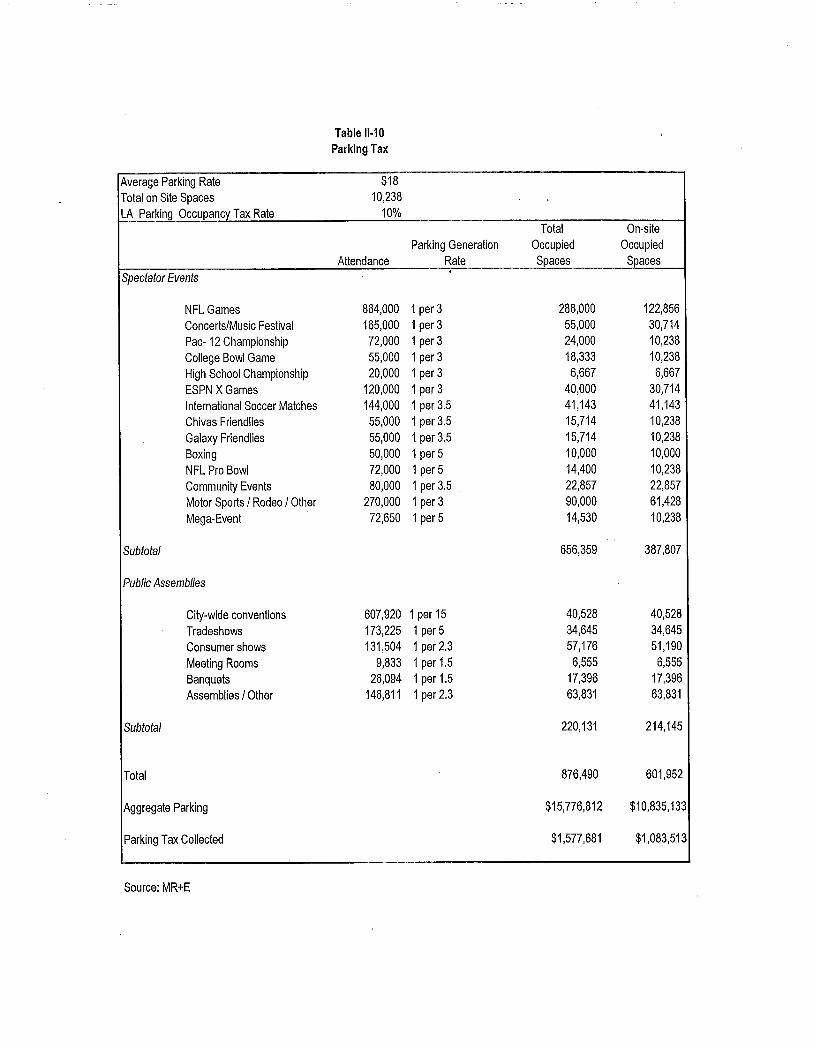
Table 11.10
Parking Tax
Average Parking Rate $18
Total on Site Spaces 10,238 .,
LA Parking Occupancy Tax Rate 10%
Total On-site
Parking Generation Occupied Occupied
Attendance Rate Spaces Spaces
Spectator Events,
NFL Games 864,000 1 per 3 288,000 122,856
Concerts/Music Festival 165,000 1 per 3 55,000 30,714
Pac- 12 Championship 72,000 1 per 3 24,000 10,238
College Bowl Game 55,000 1 per 3 18,333 10,238
High School Championship 20,000 1 per 3 6,667 6,667
ESPN X Games 120,000 1 per 3 40,000 30,714
International Soccer Matches 144,000 1 per 3.5 41,143 41,143
Chivas Friendlies 55,000 1 per 3.5 15,714 10,238
Galaxy Friendlies 55,000 1 per 3.5 15,714 10,238
Boxing 50,000 1 per 5 10,000 10,000
NFL Pro Bowl 72,000 1 per 5 14,400 10,238
Community Events 80,000 1 per 3.5 22,857 22,857
Motor Sports / Rodeo / Other 270,000 1 per 3 90,000 61,428
Mega-Event 72,650 1 per 5 14,530 10,238
Subtotal 656,359 387,807
Public Assembles
City-wide conventions 607,920 1 per 15 40,528 40,528
Tradeshows 173,225 1 per 5 34,645 34,645
Consumer shows 131,504 1 per 2.3 57,176 51,190
Meeting Rooms 9,833 1 per 1.5 6,555 6,555
Banquets 26,094 1 per 1.5 17,396 17,396
Assemblies / Other 146,811 1 per 2.3 63,831 63,831
Subtotal 220,131 214,145
Total 876,490 601,952
Aggregate Parking $15,776,812 $10,835,133
Parking Tax Collected $1,577,681 $1,083,513
Source: MR+E
Aggr¡:gate UUT
Quantity Unit Rate Cost Collected
On-Site
Special Events Center 1,750,000 Sq. Ft $1.90 $3,325,000 $415,625
Parking Faclities 39,000 Spaces,
$75 $2,925,000 $365,625
Subtotal $781,250
Off-Site
Retail Center 500,000 Sq. Ft $2.40 $1,200,000 $150,000
Hotels 2,414 Rooms $1,800 $4,345,200 $543,150
Subtotal $693,150
Total $1,474,400
Table 11.11
Utilty User TaxCity of Los Angeles
Source: MR+E
the NFL team and other event operations. The internal financial operations of an NFL franchise are
notoriously difficult for outsiders to gain access to. However, in their preliminary pla,nning AEG estimates
gross receipts of $262 rnillon on team and stadium operations. The sum of the value of the other event
operators is based on 80% of the NFL team's annual operating gross receipts. Gross receipts of retail sales
are based on estimates of on-site retail sales file categories of users. Direct off-site business license tax is
based on the aggregate ADR of the hotels and sales per square foot of the retail center combined on and
off-site direct activities are estimated to generate over $1.2 milion per year to general fund revenues the
City of Los Angeles. The derivation of this estimate is shown on Table 11-12.
Summary and implications
Table 11-13 provides a summary of all of the on and off-site revenue streams described in the report by
jurisdiction and fund account. The project can be anticipated to generate over $41 million in fiscal revenue.
In terms of local governments the City of Los Angeles would be the largest single recipient of operational
revenues with the forecasted total revenue stream of $22 milion per year-with $11.5 million being
generated by transient occupancy. This would account for over half the total of anticipated revenues to the
City of Los Angeles form the project. Transient occupancy tax is the largest single category of local
government revenue identified by this analysis. The second largest recipient of revenues amongst local
governments is Los Angeles County which can be anticipated to receive $6.5 million per year on an annual
recurring basis as result of the LACC expansion and SEC project. Of that $4.2 million would occur from
direct on-site propert taxes. This is the second largest individual source of public revenues generated from
the project's annual operations. LAUSD and County K-12 revenue funds can be anticipated to receive $6
milion on a recurring annual basis based on property taxes generated by the project.
Fiscal Analysis-SEC and LAee Expansion Section 11-21
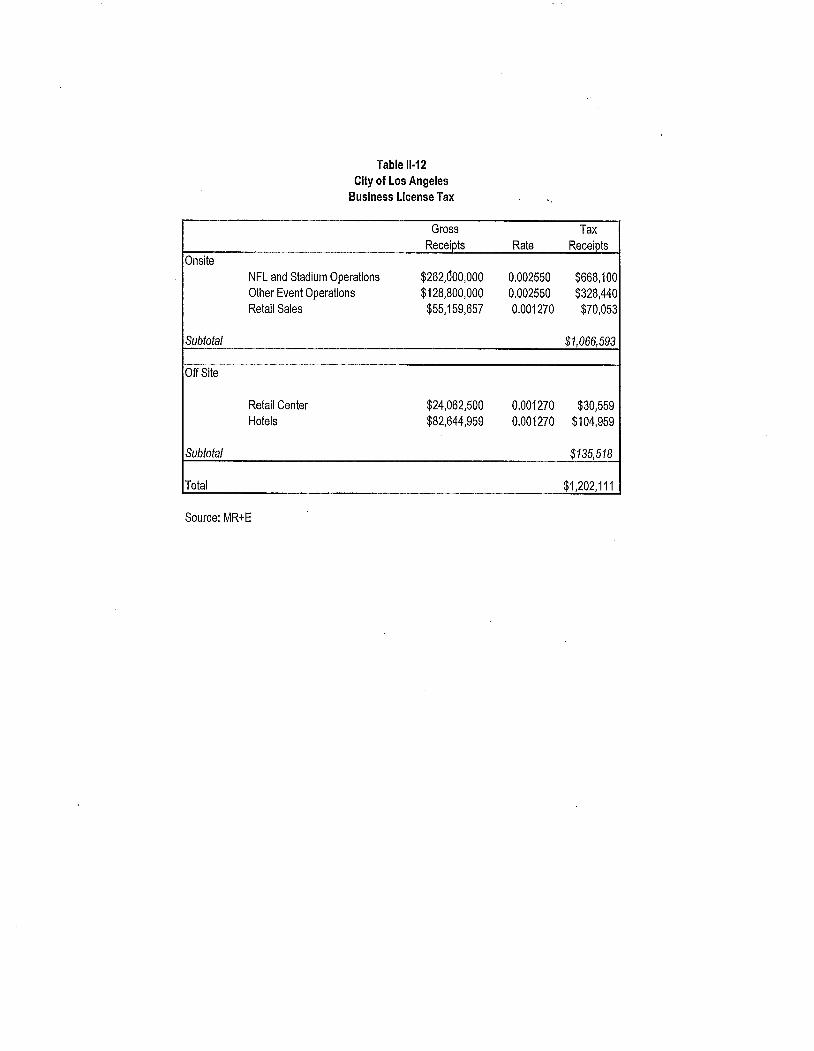
Table 11.12
City of Los Angeles
Business License Tax
Gross Tax
Receipts Rate ReceiptsOnsite
NFL and Stadium Operations $262,doo,oOO 0.002550 $668,100Other Event Operations $128,800,000 0.002550 $328,40Retail Sales $55,159,657 0.001270 $70,053
Subtotal $1,066,593
Off Site
Retail Center $24,062,500 0.001270 $30,559Hotels $82,644,959 0.001270 $104,959
Subtotal $135,518
Total $1,202,111
Source: MR+E
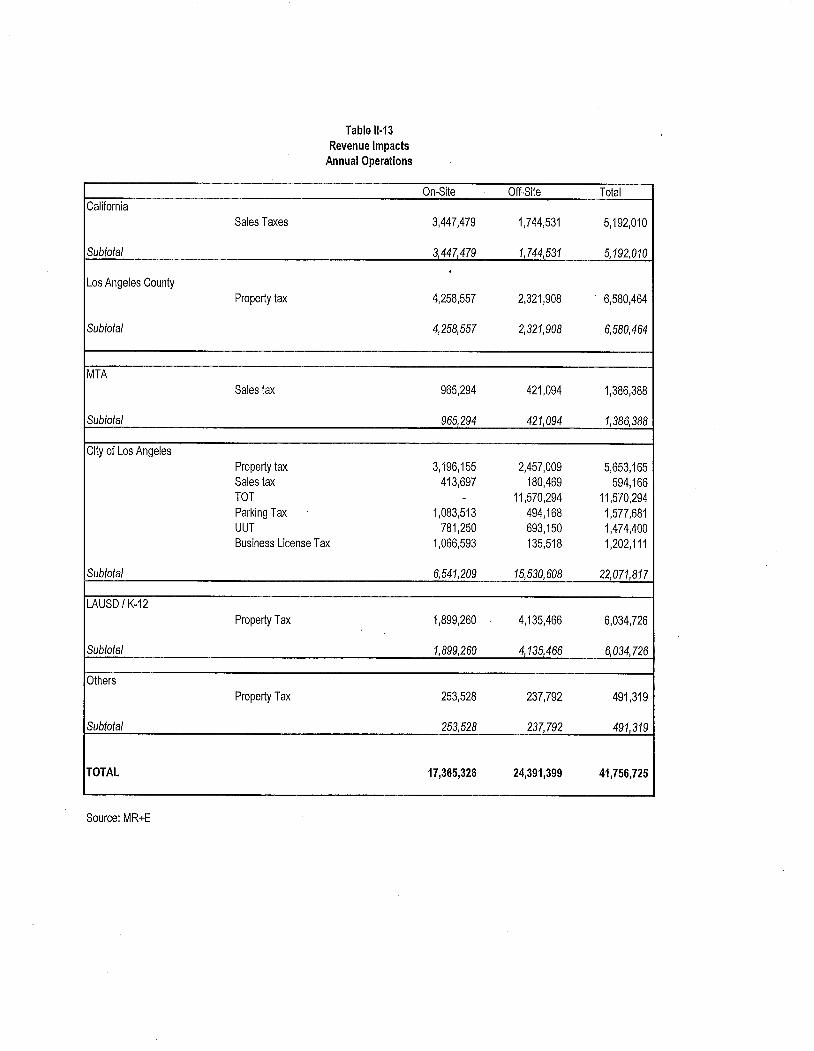
Table 11.13
Revenue ImpactsAnnual Operations
On-Site Off-Site Total
California
Sales Taxes 3,447,479 1,744,531 5,192,010
Subtotal 3,447,479 1,744,531 5,192,010
,Los Angeles County
Property tax 4,258,557 2,321,908 6,580,464
Subtotal 4,258,557 2,321,908 6,580,464
MTA
Sales tax 965,294 421,094 1,386,388
Subtotal 965,294 421,094 1,386,388
City of Los Angeles
Property tax 3,196,155 2,457,009 5,653,165Sales tax 413,697 180,469 594,166TOT - 11,570,294 11,570,294Parking Tax 1,083,513 494,168 1,577,681
UUT 781,250 693,150 1,474,400Business License Tax 1,066,593 135,518 1,202,111
Subtotal 6,541,209 15,530,608 22,071,817
LAUSD / K-12
Property Tax 1,899,260 4,135,466 6,034,726
Subtotal 1,899,260 4,135,466 6,034,726
Others
Property Tax 253,528 237,792 491,319
Subtotal 253,528 237,792 491,319
TOTAL 17,365,326 24,391,399 41,756,725
Source: MR+E
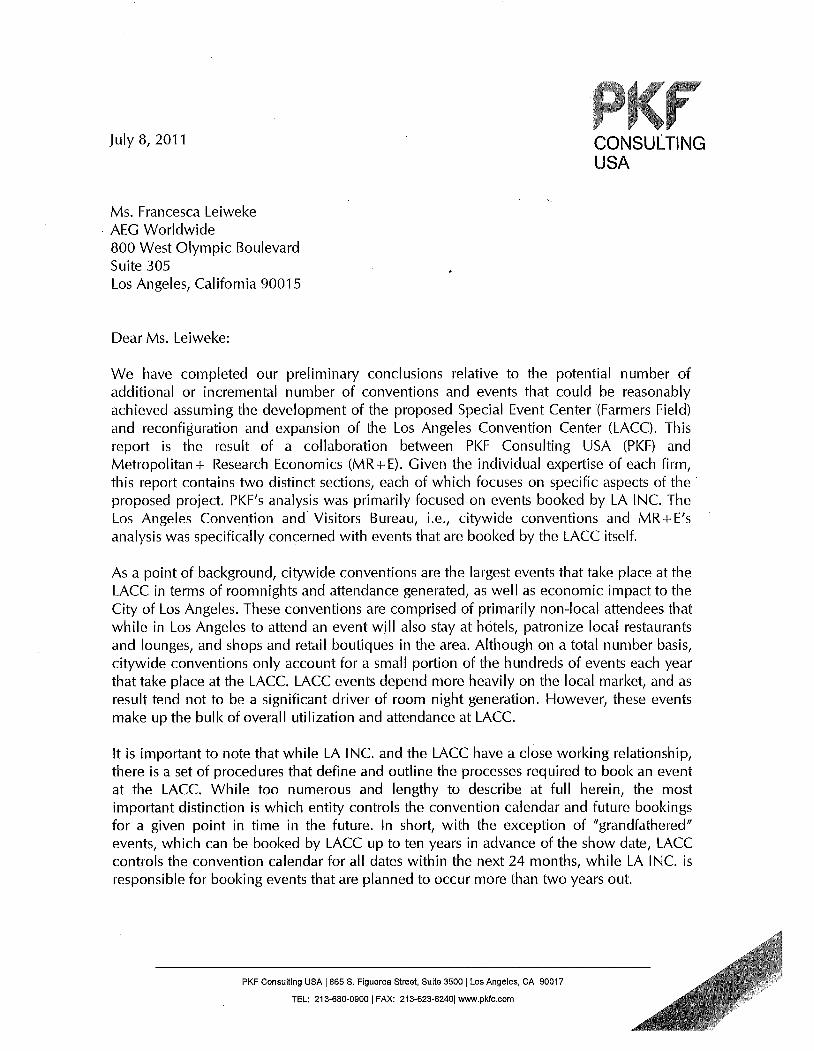
July 8, 2011 CONSULTINGUSA
Ms. Francesca Leiweke. AEG Worldwide800 West Olympic Boulevard
Suite 305Los Angeles, California 90015
Dear Ms. Leiweke:
We have completed our preliminary conclusions relative to the potential number ofadditional or incremental number of conventions and events that could be reasonablyachieved assuming the development of the proposed Special Event Center (Farmers Field)and reconfiguration and expansion of the Los Angeles Convention Center (LACC). This
report is the result of a collaboration between PKF Consulting USA (PKF) and
Metropolitan+ Research Economics (MR+E). Given the individual expertise of each firm,this report contains two distinct sections, each of which focuses on specific aspects of the'proposed project. PKF's analysis was primarily focused on events booked by LA INe. TheLos Angeles Convention and Visitors Bureau, Le., citywide conventions and MR + E'sanalysis was specifically concerned with events that are booked by the LACC itself.
As a point of background, citywide conventions are the largest events that take place at theLACC in terms of roomnights and attendance generated, as well as economic impact to theCity of Los Angeles. These conventions are comprised of primarily non-local attendees thatwhile in Los Angeles to attend an event will also stay at hotels, patronize local restaurantsand lounges, and shops and retail boutiques in the area. Although on a total number basis,citywide conventions only account for a small portion of the hundreds of events each yearthat take place at the LACe. LACC events depend more heavily on the local market, and asresult tend not to be a significant driver of room night generation. However, these eventsmake up the bulk of overall utilization and attendance at LACe.
It is important to note that while LA INe. and the LACC have a close working relationship,there is a set of procedures that define and outline the processes required to book an eventat the LACe. While too numerous and lengthy to describe at full herein, the mostimportant distinction is which entity controls the convention calendar and future bookingsfor a given point in time in the future. In short, with the exception of "grandfathered"
events, which can be booked by LACC up to ten years in advance of the show date, LACCcontrols the convention calendar for all dates within the next 24 months, while LA INe. isresponsible for booking events that are planned to occur more than two years out.
PKF Consulting USA 1865 S. Figueroa Street, Suite 3500 1 Los Angeles, CA 90017
TEL: 213-680-09001 FAX: 213-623-82401 ww.pkfc.com
Ms. Francesca LeiwekeAEG Worldwide ii
EXECUTIVE SUMMARY
Based on the analysis provided by both firms and provided herein, we have collectivelyconcluded to the anticipated growth in events, attendance, and room,nights generated from
the development of the proposed Special Event Center (Farmers Field) and reconfigurationand expansion of the Los Angeles Convention Center (LACC). As previously discussed inthe introduction, this analysis has been separated into two distinct analyses, andaccordingly is presented below in a similar manner. ,
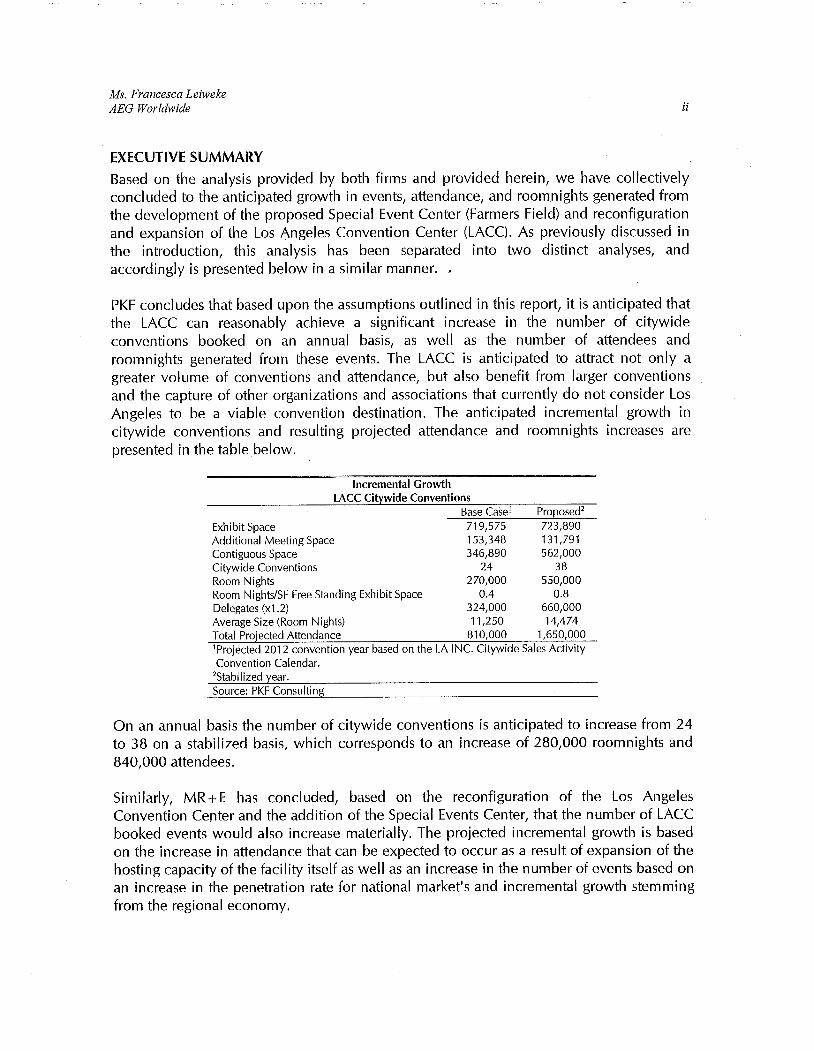
PKF concludes that based upon the assumptions outlined in this report, it is anticipated thatthe LACC can reasonably achieve a significant increase in the number of citywideconventions booked on an annual basis, as well as the number of attendees androomnights generated from these events. The LACC is anticipated to attract not only agreater volume of conventions and attendance, but also benefit from larger conventionsand the capture of other organizations and associations that currently do not consider LosAngeles to be a viable convention destination. The anticipated incremental growth incitywide conventions and resulting projected attendance and roomnights increases arepresented in the table below.
Incremental GrowthLACC Citywide Conventions
Base Casel Proposed2
Exhibit Space 719,575 723,890Additional Meeting Space 153,348 131,791Contiguous Space 346,890 562,000Citywide Conventions 24 38Room Nights 270,000 550,000Room Nights/SF Free Standing Exhibit Space 0.4 0.8Delegates (x1.2) 324,000 660,000Average Size (Room Nights) 11,250 14,474Total Projected Attendance 810,000 1,650,000'Projected 2012 convention year based on the LA INC. Citywide Sales ActivityConvention Calendar.
2Stabilized year.
Source: PKF Consulting
On an annual basis the number of citywide conventions is anticipated to increase from 24to 38 on a stabilized basis, which corresponds to an increase of 280,000 roomnights and840,000 attendees.
Similarly, MR+E has concluded, based on the reconfiguration of the Los AngelesConvention Center and the addition of the Special Events Center, that the number of LACCbooked events would also increase materially. The projected incremental growth is basedon the increase in attendance that can be expected to occur as a result of expansion of thehosting capacity of the facility itself as well as an increase in the number of events based onan increase in the penetration rate for national market's and incremental growth stemmingfrom the regional economy.
Ms. Francesca LeiwekeAEG Worldwide ii
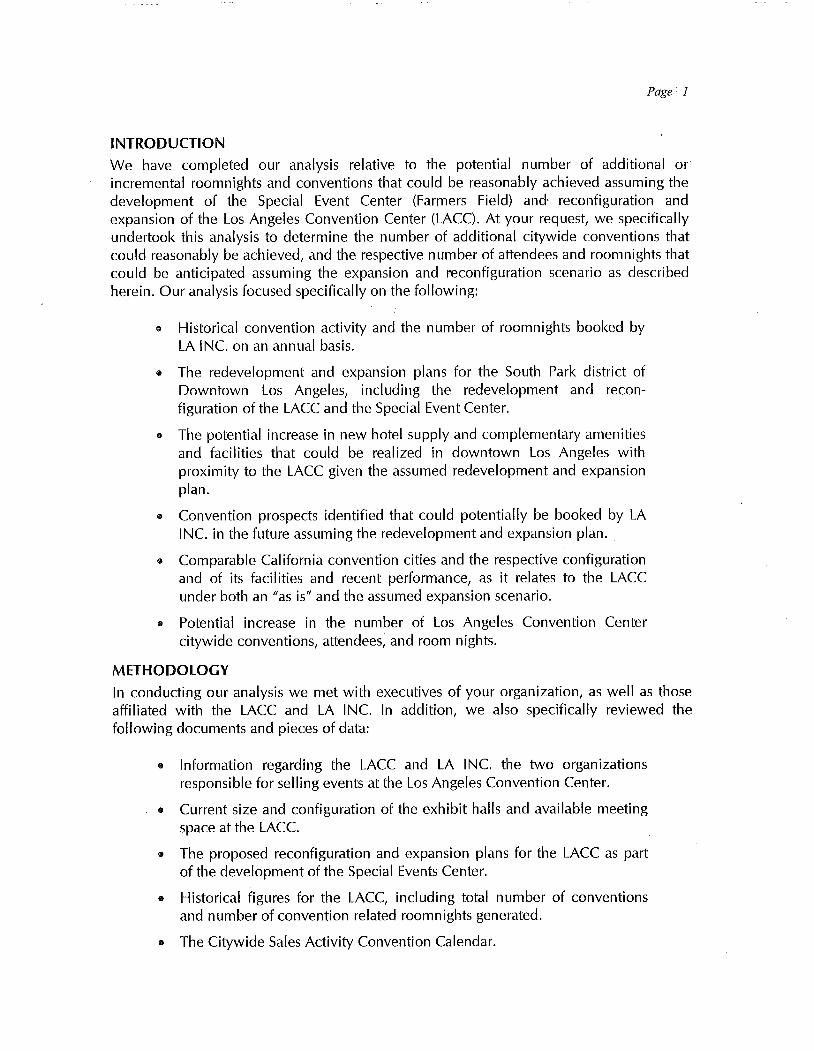
Current Forecast GrowthEvents Attendance Events Attendance Events Attendance Events Attendance
Tradeshows 28 196,185 47 369,411 20 173,225 71.1 % 88.3%Consumer shows 48 652,962 53 784,466 5 131,504 10.4 20.1Meeting Rooms 189 71,841 207 81,674 18 9,833 9.5 137Banquets 9 11,875 27 37,969 18 26,094 211.8 219.7Assemblies / Other 66 354,345 84 501,155 18 146,811 27.2 41.4
,
Total 339 1,287,208 418 1,774,675 79 487,467 23.2 37.9
Incremental GrowthLACC Events
Source: MR + E
In total the forecast anticipates a 23.2 percent increase in the number of eventscorresponding to a 37.9 percent increase in attendance. In terms of total attendance thetradeshow category can be anticipated to be the largest sector of new activity at the facilityat just over 173,000 new attendees. In terms of total attendance consumer shows areanticipated to remain the largest single category of use at the convention center with aforecast attendance of just over 784,000 per year.
This report was prepared for your internal use to assist you in evaluating futuredevelopment planning. As is customary in assignments of this type, neither our name northe material submitted may be included in any prospectus or as part of any printed materialor used in offerings or representations in connection with the sale of securities orparticipation interest to the public without our prior written consent. This report is subjectto the attached Statement of Assumptions and Limiting Conditions.
We appreciate the opportunity to work on this assignment and look forward to answeringany questions you may have regarding our preliminary findings and conclusions presentedherein.
Sincerely,
PKF Consulting USA
By Bruce BaltinSenior Vice President
Page 11
INTRODUCTION
We have completed our analysis relative to the potential number of additional orincremental roomnights and conventions that could be reasonably achieved assuming the
development of the Special Event Center (Farmers Field) and" reconfiguration andexpansion of the Los Angeles Convention Center (LACC). At your request, we specificallyundertook this analysis to determine the number of additional citywide conventions thatcould reasonably be achieved, and the respective number of attendees and roomnights thatcould be anticipated assuming the expansion and reconfiguration scenario as describedherein. Our analysis focused specifically on the following:
e Historical convention activity and the number of roomnights booked byLA INe. on an annual basis.
e The redevelopment and expansion plans for the South Park district ofDowntown Los Angeles, including the redevelopment and recon-figuration of the LACC and the Special Event Center.
e The potential increase in new hotel supply and complementary amenitiesand facilities that could be realized in downtown Los Angeles withproximity to the LACC given the assumed redevelopment and expansionplan.
e Convention prospects identified that could potentially be booked by LAINe. in the future assuming the redevelopment and expansion plan.
e Comparable California convention cities and the respective configurationand of its facilities and recent performance, as it relates to the LACCunder both an "as is" and the assumed expansion scenario.
e Potential increase in the number of Los Angeles Convention Center
citywide conventions, attendees, and room nights.
METHODOLOGY
In conducting our analysis we met with executives of your organization, as well as thoseaffiliated with the LACC and LA INe. In addition, we also specifically reviewed thefollowing documents and pieces of data:
. Information regarding the LACC and LA INe. the two organizations
responsible for selling events at the Los Angeles Convention Center.
. Current size and configuration of the exhibit halls and available meeting
space at the LACe.
. The proposed reconfiguration and expansion plans for the LACC as partof the development of the Special Events Center.
. Historical figures for the LACC, including total number of conventions
and number of convention related roomnights generated.
e The Citywide Sales Activity Convention Calendar.
Page 12
II The Los Angeles Convention Center Citywide Convention Availabilitycalendar
II A listing of hundreds of future potential citywide events, representing
more than seven million roomnights, identified as potential opportunitiesfor future convention business.
II Size and space configurations of comparable, competitive centers and the
respective number of conventions and rooninights booked by each.
II The number of hotels and total hotel rooms within proximity to theLACC, under the current and proposed scenarios; compared to similarfigures for the competitive centers.
OVERVIEW Of LACC
Originally opened in 1971, the Los Angeles Convention Center is located at 1201 SouthFigueroa Street in downtown Los Angeles. It is the main demand generator for largeconvention and meeting activity in Los Angeles. The Convention Center, which completeda major expansion in 1993, offers approximately 720,000 square feet of exhibit hall spaceand 150,000 square feet of meeting space split between its two halls. This makes it one ofthe largest meeting and convention facilities in the country. LACC is responsible forbooking space at the Convention Center and coordinates with representatives and the salesstaff of LA INe. to ensure thatthe facility maintains a high occupancy rate. In the 2008-09fiscal year LACC hosted nearly 400 events, welcoming approximately 2.5 million guests.Further, the Convention Center is one of the most important and unique economic assets inthe City of Los Angeles, generating an estimated economic impact of over $1 billion a year.
Historically, LA INe. has been given the primary task of booking citywide conventions(defined as 3,000-plus minimum roomnights in total), while LACC has been tasked to booktrade shows, consumer shows, special events, and other activities which generate revenLÍesthrough the sales of services and rentals, but primarily draw a local attendance andgenerate a limited number of roomnights and economic impact to the City of Los Angeles.These events are typically booked between the then current date up 24 months out, exceptfor a limited collection of "grandfathered" shows, which retained their right to book up toten years in advance of the show date, due to revisions made to the booking policy in1992, which remains in effect today.
OVERVIEW Of LA INC.
LA INe., the Los Angeles Convention and Visitors Bureau is responsible for attracting andbooking major citywide conventions to meet in the City of Los Angeles and utilize theConvention Center. LA INe. also markets the city as travel destination, regional, nationally,and internationally - promoting tourism and a positive image of the city. As mentionedpreviously, LA INe. works with LACC to ensure that the Convention Center is fullyutilized, with LA INe. being tasked to book conventions occurring typically two or moreyears into the future which attract out of town visitors requiring a block of hotel roomswithin Los Angeles. Bookings are cyclical in nature, reflecting the typical patterns of
Page i 3
convention markets, in part because many major conventions either meet in alternate yearsor in alternate cities according to a set geographical rotation. These citywide conventionsare given priority over trade and consumer shows due to the significant economic impactthat these events have on the City of Los Angeles, given the consumer spending and
applicable taxes. Between 1996 and 2009, LA INe. was responsib'le for the booking ofnearly 3.6 million roomnights and $445 million of room revenues to Los Angeles areahotels. Additiönally, according to LA INe., the organization will have created an economicbenefit to the City of Los Angeles of more than $1.1 pi Ii ion between fiscal years 2008 and2012.
In an effort to attract citywide conventions to downtown Los Angeles, rather than losingthem to regional competitors such as San Diego, Anaheim, San Francisco, or Las Vegas,conventions meeting a certain threshold are incentivized to meet at LACC through anabatement of rent payable to the Center. These measures were enacted to better positionthe City of Los Angeles and the Center relative to the abovementioned regional
competitors, which benefit from a larger supply of hotel rooms proximate to the facility andgreater and more varied number of entertainment and food and beverage outlets. With theevolution of LA LIVE and the JW MarriottRitz Carlton headquarters hotel recently comingto fruition these challenges have been lessened to some extent, although as a conventiondestination Los Angeles is still evolving into a top tier convention destination.
LACC HISTORICAL PERFORMANCE
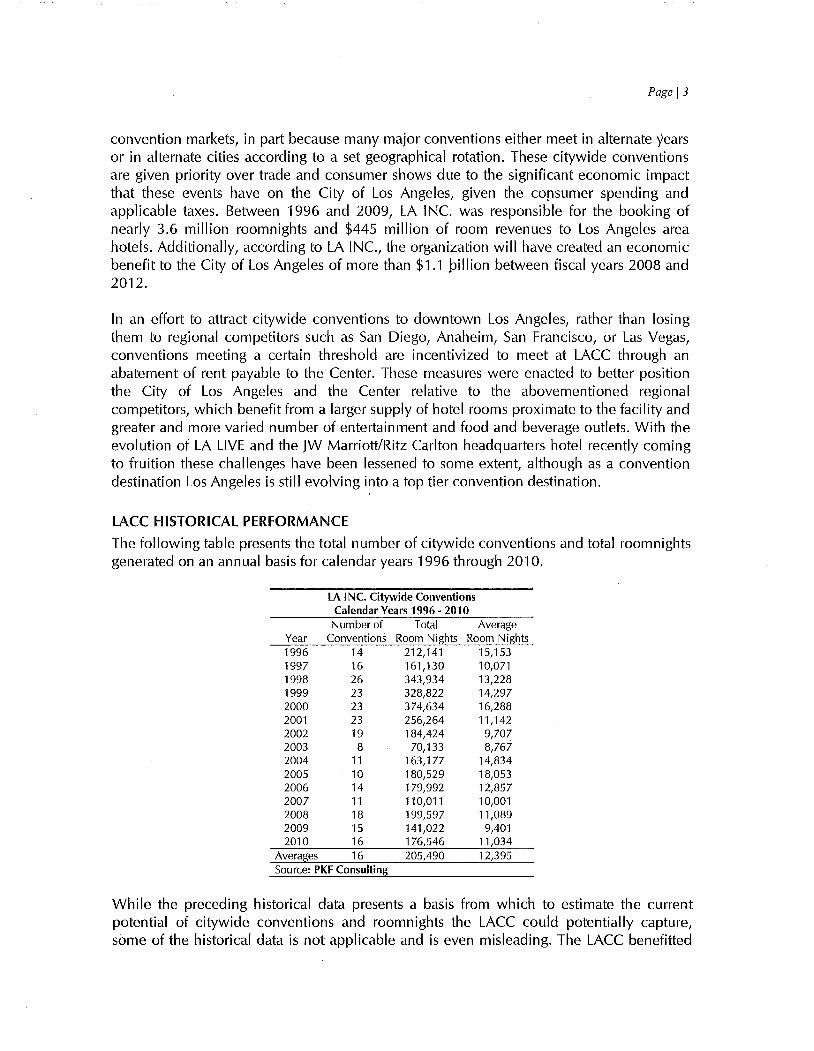
The following table presents the total number of citywide conventions and total roomnightsgenerated on an annual basis for calendar years 1996 through 2010.
LA INC. Citywide Conventions
Calendar Years 1996 - 2010Number of Total
Year Conventions Room Nights
1996 14 212,1411997 16 161,1301998 26 343,9341999 23 32~8222000 23 374,6342001 23 256,2642002 19 184,4242003 8 70,1332004 11 163,1772005 10 180,5292006 14 179,9922007 11 110,0112008 18 199,5972009 15 141,0222010 16 176,546
Averages 16 205,490Source: PKF Consulting
AverageRoom Nights
15,15310,07113,22814,29716,28811,1429,7078,767
14,83418,05312,85710,00111,089
9,40111,03412,395
While the preceding historical data presents a basis from which to estimate the currentpotential of citywide conventions and roomnights the LACC could potentially capture,some of the historical data is not applicable and is even misleading. The LACC benefitted
Page i 4
tremendously from construction activity that displaced business from its primarycompetitive convention centers in the late 1990's and soon after from the National
Democratic Presidential Convention in 2000. On the other hand, historical figures did nothave the benefit of a headquarters hotel such as the recently constrLlcted lWMarriott andRitz-Carlton, or the direct access to the restaurants and entertainment opportunities of LALIVE. Based on recent trends and the future bookings report prepared by LA INe., the
opening of the JW Marriott and Ritz-Carlton Hotels have proven to be an excellent sellingtool in licensing future business for the LACC and, the City of Los Angeles. One suchexample is the American Heart Association, which previously did not consider Los Angelesa viable convention destination, but is now planning to hold their annual meeting nextyear in Los Angeles that will fill more than 45,000 hotel rooms.
DOWNTOWN LOS ANGELES
Unlike many metropolitan areas across the United States, historically the Downtown LosAngeles was considered a secondary to its surrounding cities, and as a result the hotelmarket achieved average daily rate and occupancy levels below that of its immediatecompetitors, and often this discount was significant. Additionally, and specifically relatedto the national convention market, Los Angeles as a convention destination has not beenable to capture a similar amount of citywide events as its regional competitors, includingAnaheim, San Diego, and San Francisco. In conjunction with prior engagements wecompleted for the City of Los Angeles and the JW Marriott and Ritz-Carlton Hotels, weinterviewed meeting planners and organizations active in organizing large meetings andconventions in order to better understand this trend. These meeting planners identified anumber of attributes that would potentially position Los Angeles as a top-tier conventiondestination (population, airlift, access to media, climate, image) but more often than not thenegatives outweighed the positives and Los Angeles was judged to be only an averagedestination. In the past, particular items identified as negatively impacting the perception ofLos Angeles as a convention destination were: the lack of hotel rooms within proximity toLACC, the lack of restaurants, nightlife and entertainment options proximate to LACC andthe available facilities and configuration of the LACC itself.
The above detailed public perception of Downtown Los Angeles continued for more than adecade and not only until recently has the perception changed. One of the primarycatalysts for this change was the development of LA LIVE, the $2 billion, four millionsquare foot sports, residential and entertainment complex that features the JW Marriott andRitz-Carlton Hotels, Ritz-Carlton luxury residences, Nokia Theater, Club Nokia, GrammyMuseum, ESPN Zone and broadcasting studios, Regal Entertainment 14-screen theater, andmore than a dozen popular restaurants. Further, with the opening of the HeadquartersHotel OW Marriott and Ritz-Carlton) the local hotel market is beginning to gain marketshare relative to hotels in Pasadena, Santa Monica, and the Westside of Los Angeles.Additionally, it should be noted that the upon opening in early 2010 the 1,001-roomheadquarters hotel was fully absorbed as the demand for hotel rooms far outpaced theincrease in supply. This example is one of many transformative trends that supports thepotential for forecasted evolution of Los Angeles as top-tier convention destination.
Page 15
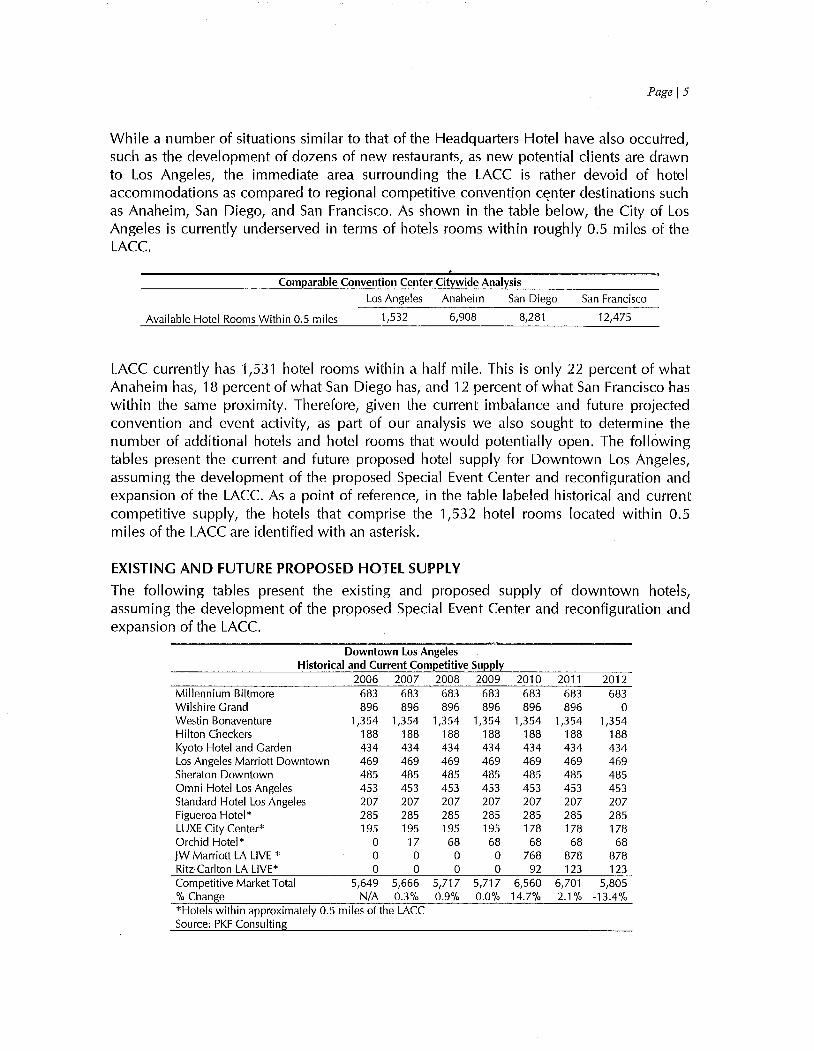
While a number of situations similar to that of the Headquarters Hotel have also occulTed,such as the development of dozens of new restaurants, as new potential clients are drawnto Los Angeles, the immediate area surrounding the LACC is rather devoid of hotelaccommodations as compared to regional competitive convention center destinations such"
as Anaheim, San Diego, and San Francisco. As shown in the table below, the City of LosAngeles is currently underserved in terms of hotels rooms within roughly 0.5 miles of theLACe.
Comparable Convention Center Citywide Analysis
Los Angeles Anaheim San Diego
Available Hotel Rooms Within 0.5 miles 1,532 6,908 8,281San Francisco
12,475
LACC currently has 1,531 hotel rooms within a half mile. This is only 22 percent of whatAnaheim has, 18 percent of what San Diego has, and 12 percent of what San Francisco haswithin the same proximity. Therefore, given the current imbalance and future projectedconvention and event activity, as part of our analysis we also sought to determine thenumber of additional hotels and hotel rooms that would potentially open. The followingtables present the current and future proposed hotel supply for Downtown Los Angeles,assuming the development of the proposed Special Event Center and reconfiguration andexpansion of the LACe. As a point of reference, in the table labeled historical and currentcompetitive supply, the hotels that comprise the 1,532 hotel rooms located within 0.5miles of the LACC are identified with an asterisk.
EXISTING AND FUTURE PROPOSED HOTEL SUPPLY
The following tables present the existing and proposed supply of downtown hotels,assuming the development of the proposed Special Event Center and reconfiguration andexpansion of the LACe.
Downtown Los AngelesHistorical and Current Competitive Supply
2006 2007 2008Millennium Biltmore 683 683 683Wilshire Grand 896 896 896Westin Bonaventure 1,354 1,354 1,354Hilton Checkers 188 188 188Kyoto Hotel and Garden 434 434 434Los Angeles Marriott Downtown 469 469 469Sheraton Downtown 485 485 485Omni Hotel Los Angeles 453 453 453Standard Hotel Los Angeles 207 207 207Figueroa Hotel* 285 285 285LUXE City Center* 195 195 195Orchid Hotel* 0 17 68JW Marriott LA LIVE * 0 0 0Ritz-Carlton LA L1VE* 0 0 0Competitive Market Total 5,649 5,666 5,717% Change N/A 0.3% 0.9%*Hotels within approximately 0.5 miles of the LACCSource: PKF Consulting
2009683896
1,354188434469485453207285195
68oo
5,7170.0%
2010683896
1,354188434469485453207285178
68768
926,560
14.7%
2011683896
1,35418843446948545320728517868
878123
6,7012.1%
2012683
o1,354
188434469485453207285178
68878123
5,805-13.4%
Page 16
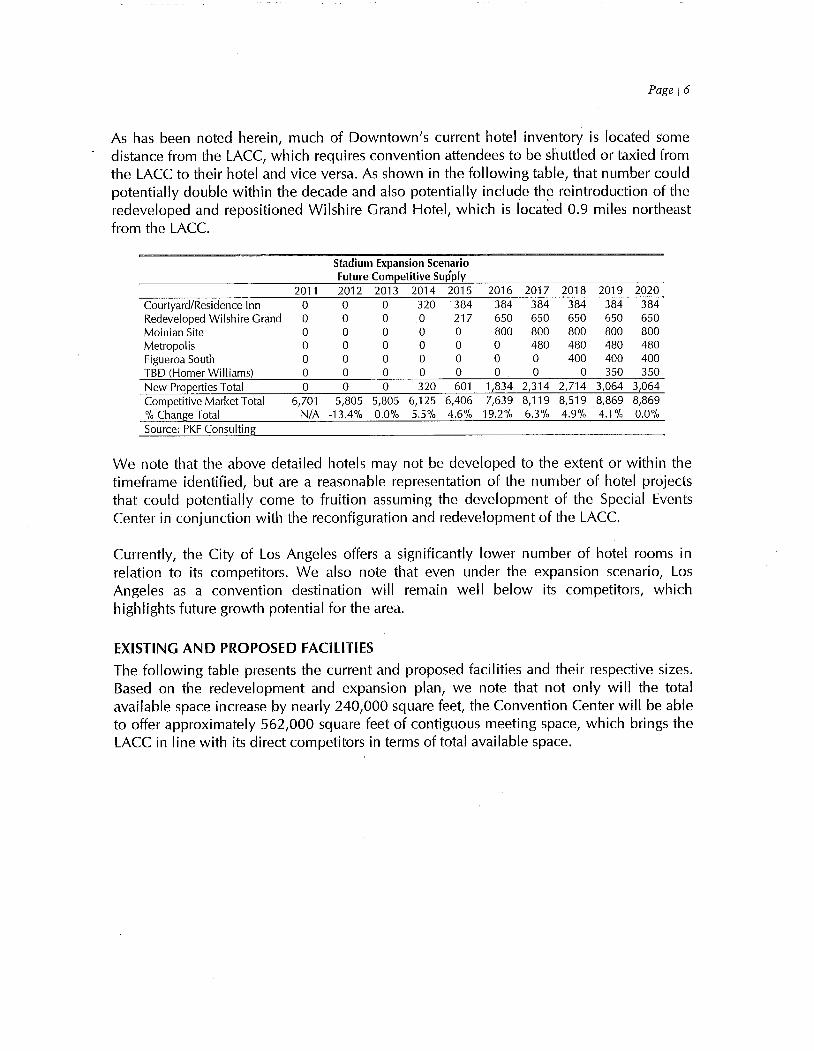
As has been noted herein, much of Downtown's current hotel inventory is located somedistance from the LACC, which requires convention attendees to be shuttled or taxied fromthe LACC to their hotel and vice versa. As shown in the following table, that number couldpotentially double within the decade and also potentially include the reintroduction of theredeveloped and repositioned Wilshire Grand Hotel, which is locat~d 0.9 miles northeastfrom the LACe.
Stadium Expansion ScenarioFuture Competitive Supply
2011 2012 2013 2014 2015 2016 2017 2018 2019 2020Courtyard/Residence Inn 0 0 0 320 384 384 384 384 384 384Redeveloped Wilshire Grand 0 0 0 0 217 650 650 650 650 650Moinian Site 0 0 0 0 0 800 800 800 800 800Metropolis 0 0 0 0 0 0 480 480 480 480Figueroa South 0 0 0 0 0 0 0 400 400 400TBD (Homer Williams) 0 0 0 0 0 0 0 0 350 350New Properties Total 0 0 0 320 601 1,834 2,314 2,714 3,064 3,064Competitive Market Total 6,701 5,805 5,805 6,125 6,406 7,639 8,119 8,519 8,869 8,869% Change Total N/A -13.4% 0.0% 5.5% 4.6% 19.2% 6.3% 4.9% 4.1% 0.0%Source: PKF Consulting
We note that the above detailed hotels may not be developed to the extent or within thetimeframe identified, but are a reasonable representation of the number of hotel projectsthat could potentially come to fruition assuming the development of the Special EventsCenter in conjunction with the reconfiguration and redevelopment of the LACe.
Currently, the City of Los Angeles offers a significantly lower number of hotel rooms inrelation to its competitors. We also note that even under the expansion scenario, LosAngeles as a convention destination will remain well below its competitors, whichhighlights future growth potential for the area.
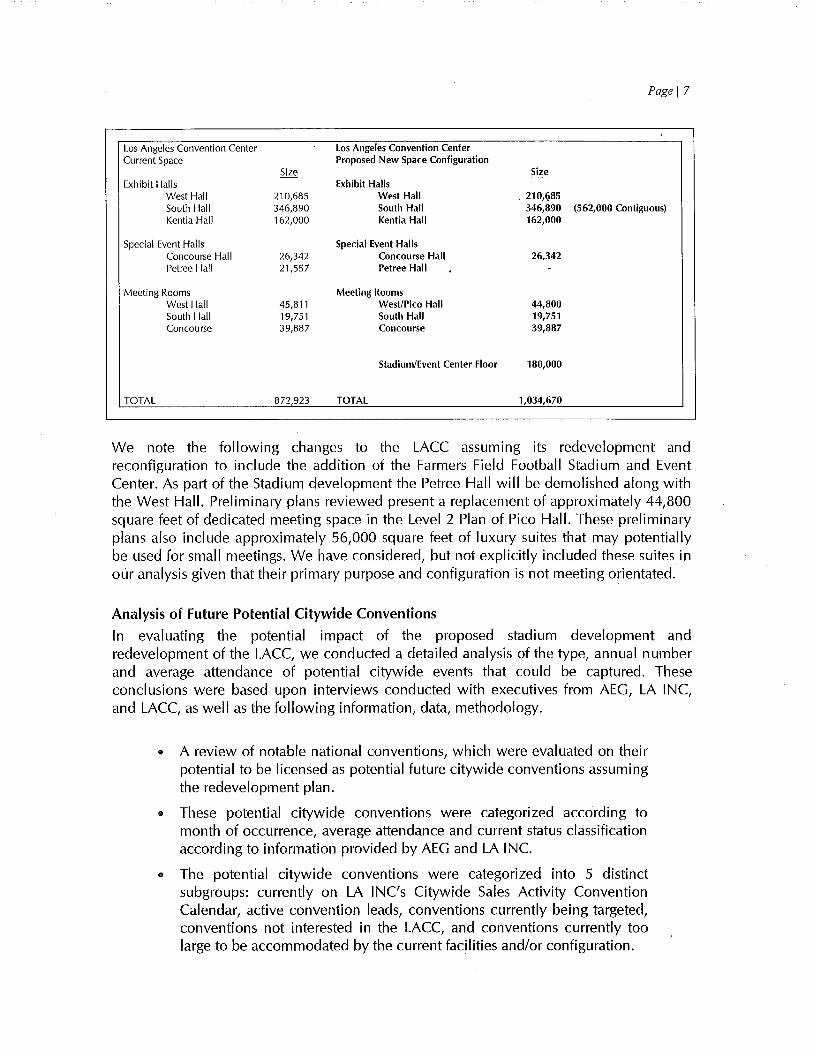
EXISTING AND PROPOSED FACILITIES
The following table presents the current and proposed facilities and their respective sizes.Based on the redevelopment and expansion plan, we note that not only will the totalavailable space increase by nearly 240,000 square feet, the Convention Center will be ableto offer approximately 562,000 square feet of contiguous meeting space, which brings theLACC in line with its direct competitors in terms of total available space.
Page I 7
Los Angeles Convention Center Los Angeles Convention CenterCurrent Space Proposed New Space Configuration
Size SizeExhibit Halls Exhibit Halls
West Hall 210,685 West Hall 210,/l,85South Hall 346,890 South Hall 346,890 (562,000 Contiguous)
Kentia Hall 162,000 Kentia Hall 162,000
Special Event Halls Special Event Halls
Concourse Hall 26,342 Concourse Hall 26,342Petree Hall 21,557 Petree Hall , -
Meeting Rooms Meeting RoomsWest Hall 45,811 West/Pico Hall 44,800South Hall 19,751 South Hall 19,751Concourse 39,887 Concourse 39,887
Stadium/Event Center Floor 180,000
TOTAL 872,923 TOTAL 1,034,670
We note the following changes to the LACC assuming its redevelopment and
reconfiguration to include the addition of the Farmers Field Football Stadium and EventCenter. As part of the Stadium development the Petree Hall will be demolished along withthe West HalL. Preliminary plans reviewed present a replacement of approximately 44,800square feet of dedicated meeting space in the Level 2 Plan of Pica HalL. These preliminaryplans also include approximately 56,000 square feet of luxury suites that may potentiallybe used for small meetings. We have considered, but not explicitly included these suites inoùr analysis given that their primary purpose and configuration is not meeting orientated.
Analysis of Future Potential Citywide ConventionsIn evaluating the potential impact of the proposed stadium development and
redevelopment of the LACC, we conducted a detailed analysis of the type, annual numberand average attendance of potential citywide events that could be captured. These
conclusions were based upon interviews conducted with executives from AEG, LA INC,and LACC, as well as the following information, data, methodology.
e A review of notable national conventions, which were evaluated on theirpotential to be licensed as potential future citywide conventions assumingthe redevelopment plan.
e These potential citywide conventions were categorized according tomonth of occurrence, average attendance and current status classificationaccording to information provided by AEG and LA INe.
e The potential citywide conventions were categorized into 5 distinctsubgroups: currently on LA INC's Citywide Sales Activity ConventionCalendar, active convention leads, conventions currently being targeted,conventions not interested in the LACC, and conventions currently toolarge to be accommodated by the current facilities and/or configuration.
Page 18
. From the above distinct sub-categorizations we identified conventionsthat could potentially be licensed as citywide conventions, including inparticular, those previously identified as not interested in the LACC or toolarge.
Through an analysis of the data, we were able to determine a number of important piecesof information and trends, including: distribution of conventions by month, averageattendance by month, future years in which the ,greatest number of conventions areplanned to meet in the west, and the number of conventions potentially likely to meet inLos Angeles currently, and the number that may be accommodated or enticed byredevelopment and expansion plan of LACC and Farmers Field. Key findings relative tofuture potential citywide convention bookings include:
. On a national basis citywide conventions tènd to be more prevalent in
the Spring and early Summer, with the low points being Winter,especially December. Of all months identified, October was the one inwhich the most conventions were to be held.
. The number of convention roomnights booked varies only moderatelyfrom month to month, ranging from 9,456 in August to 15,961, with anoverall average of 12,349 roomnights per citywide convention.
. According to LA INe. representatives, the average booking window from
initial interest in the LACC to the occurrence of the event isapproximately five years. Based on our review of future potential eventswith a planned West rotation, as well as licensed, prospective, andtentative bookings already on the convention .calendar - an opportunityexists to significantly increase the annual number of citywide conventionsfrom historical levels.
. Given the current configuration of the LACC and current roomnight
availability more than 400 citywide conventions are currently beingtargeted by LA INe. This figure could potentially increase by more thanten percent based solely on conventions identified as not currentlyinterested in Los Angeles as a destination, or conventions considered toolarge for the current facilities and/or configuration of the LACe.
The above data was thoroughly analyzed in order to determine the number of conventionsthat the LACC could accommodate under the redevelopment scenario, which to recapincludes:
. An addition of 2,414 new, good and high quality hotel rooms, within ahalf-mile walking distance of the LACC, as well as the reintroduction ofthe repositioned Wilshire Grand HoteL.
Page 19
Ð The reconfiguration of LACC's primary exhibit space, which will result in561,890 square feet of contiguous space contained within the West andSouth Halls.
. The addition of the Stadium, which while not in use for sporting events,will provide 180,000 additional square feet of exhibit space and meetingspace on the concourse levels.
Lastly taking all of the above into consideration, wê determined the potential amount ofbusi ness that LA I Ne. and the LACC could potentially generate in a representative orstabilized year. The performance of a property in a stabilized year reflects the normal levelor operation of the LACC at its stabilized occupancy, unaffected by temporary non-recurring expenses such as extraordinary start-up marketing, administrative, or operationalcosts, which can occur in the initial years following opening or upon repositioning of thefacility. Our estimated performance of the LACC was made using the followingassumptions.
Ð The average convention,approximately seven days,conventions per month.
Ð Grandfathered shows remain as is, including Gift Show in January andJuly, Boat Show and WESTEC in March, and the Auto Show inNovember/December.
including move-in and move-out isallowing for a maximum of four major
. Move-in for the Auto Show does not begin before mid-November.
. The EMMY Awards occupy one hall for 21 days in September.
. Each of the newly developed, continuous meeting halls could be used
independently if necessary.
. Union work rules, including an avoidance of Sunday as a move-in ormove-out day were not given strong consideration.
Ð On a national basis, citywide conventions exhibit a consistent andsomewhat predictable seasonal pattern, which was taken into account.
Ð From lead date to meeting date, the average length of time isapproximately five years.
Based on the above analysis and assumptions we have concluded that in a representativeor stabilized year, the LACC could potentially accommodate 550,000 roomnights and asmany as 38 citywide conventions.
As a point of comparison, we have also provided information on the size and recentperformance of the comparable convention centers. It should be noted that there is not auniversally agreed upon definition of a citywide convention, and therefore it is left up tothe individual convention centers or convention bureaus to classify citywide events. Forexample Los Angeles has one of the higher thresholds for defining a citywide, requiring
Page 110
that each event produces a minimum of 1,200 roomnights on peak. As a point ofcomparison, to quålify as a citywide in San Diego, a convention has to only generate 750roomnights on peak. In addition, the comparable centers have greater flexibility inbooking citywide conventions as they are able to do so up unta between 12 and 14months before the start of the event. As a point of comparison, LACC controls the
convention calendar for all dates within the next 24 months.
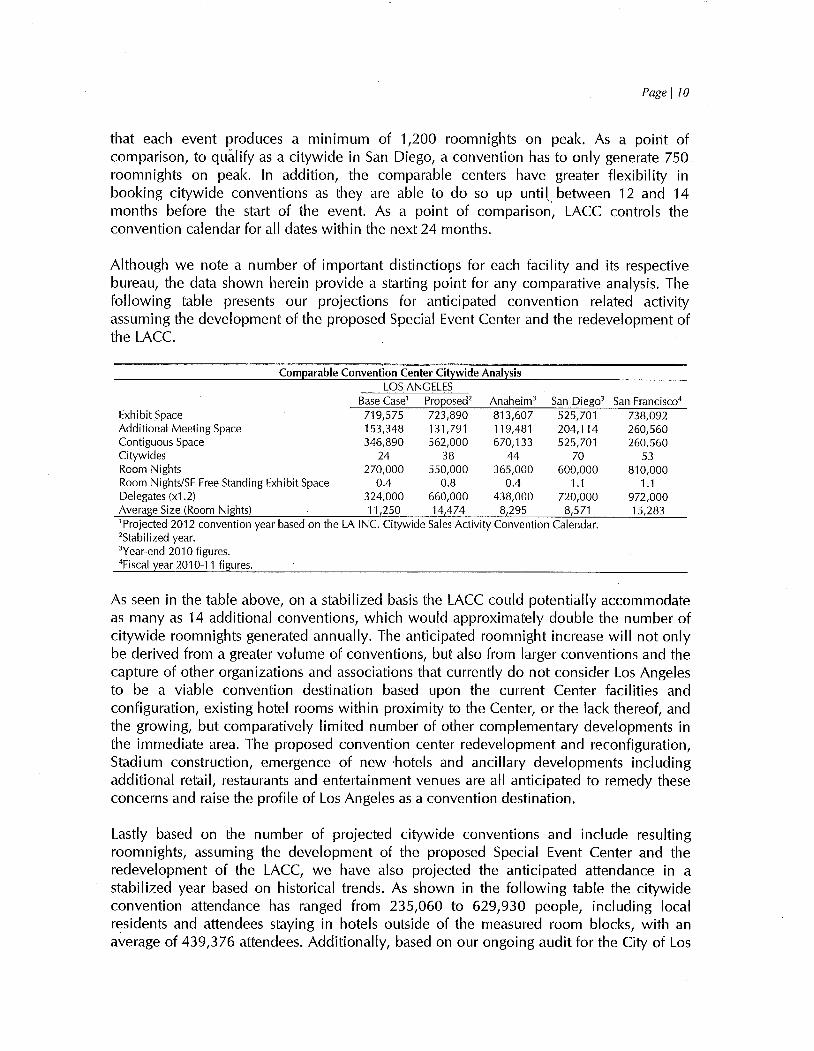
Although we note a number of important distinctiops for each facility and its respectivebureau, the data shown herein provide a starting point for any comparative analysis. Thefollowing table presents our projections for anticipated convention related activityassuming the development of the proposed Special Event Center and the redevelopment ofthe LACe.
Comparable Convention Center Citywide AnalysisLOS ANGELES
Base Casel Proposed2 Anaheim3 San Dieg03
ExhibitSpace 719,575 723,890 813,607 525,701Additional Meeting Space 153,348 131,791 119,481 204,114Contiguous Space 346,890 562,000 670,133 525,701Citywides 24 38 44 70Room Nights 270,000 550,000 365,000 600,000Room Nights/SF Free Standing Exhibit Space 0.4 0.8 0.4 1.1Delegates (xl.2) 324,000 660,000 438,000 720,000Average Size (Room Nights) 11,250 14,474 8,295 8,5711 Projected 2012 convention year based on the LA INC. Citywide Sales Activity Convention Calendar.2Stabilized year.
3Year-end 2010 figures.4Fiscal year 2010-11 figures.
San Francisco4738,092260,560260,560
53810,000
1.1
972,00015,283
As seen in the table above, on a stabilized basis the LACC could potentially accommodateas many as 14 additional conventions, which would approximately double the number ofcitywide roomnights generated annually. The anticipated roomnight increase will not onlybe derived from a greater volume of conventions, but also from larger conventions and thecapture of other organizations and associations that currently do not consider Los Angelesto be a viable convention destination based upon the current Center facilities andconfiguration, existing hotel rooms within proximity to the Center, or the lack thereof, andthe growing, but comparatively limited number of other complementary developments inthe immediate area. The proposed convention center redevelopment and reconfiguration,Stadium construction, emergence of new .hotels and ancillary developments includingadditional retail, restaurants and entertainment venues are all anticipated to remedy theseconcerns and raise the profile of Los Angeles as a convention destination.
Lastly based on the number of projected citywide conventions and include resultingroomnights, assuming the development of the proposed Special Event Center and theredevelopment of the LACC, we have also projected the anticipated attendance in astabilized year based on historical trends. As shown in the following table the citywideconvention attendance has ranged from 235,060 to 629,930 people, including localresidents and attendees staying in hotels outside of the measured room blocks, with anaverage of 439,376 attendees. Additionally, based on our ongoing audit for the City of Los
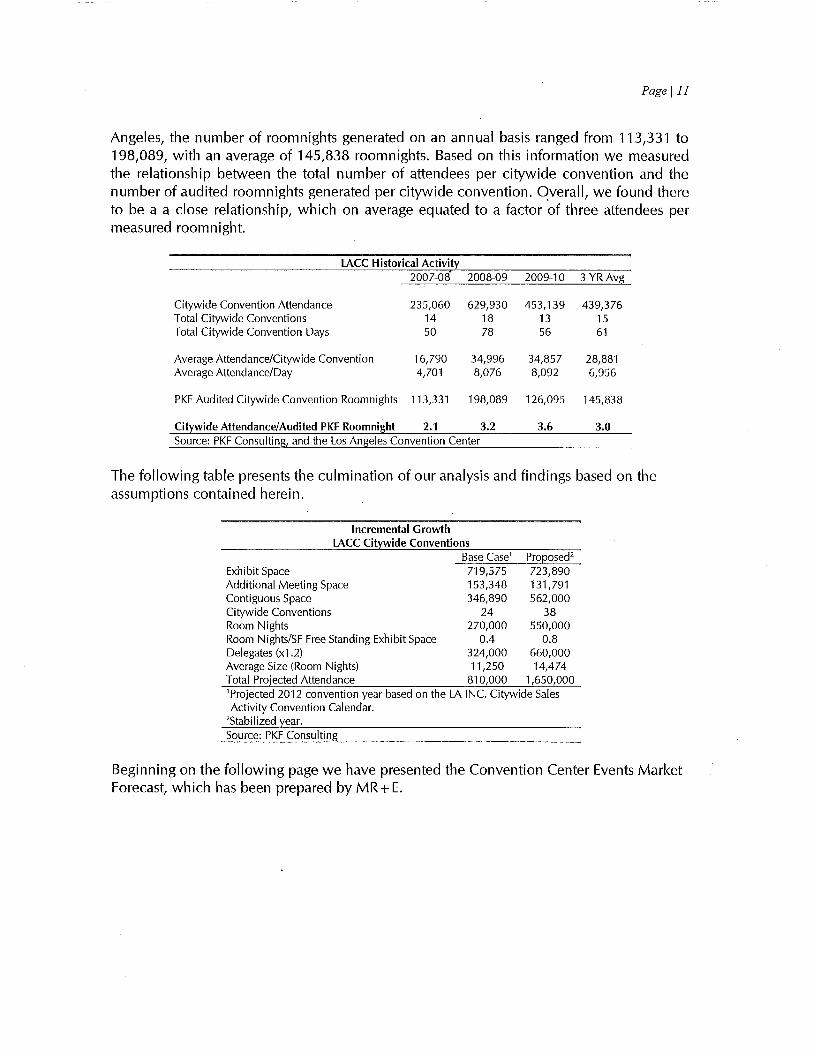
Page III
Angeles, the number of roomnights generated on an annual basis ranged from 113,331 to198,089, with an average of 145,838 roomnights. Based on this information we measuredthe relationship between the total number of attendees per citywide convention and thenumber of audited roomnights generated per citywide convention. Overall, we found thereto be a a close relationship, which on average equated to a factor ~f three attendees permeasured roomnight.
LACC Historical Activity2007-08 2008-09 2009-10 3 YR Avg
Citywide Convention Attendance 235,060 629,930 453,139 439,376Total Citywide Conventions 14 18 13 15Total Citywide Convention Days 50 78 56 61
Average Attendance/Citywide Convention 16,790 34,996 34,857 28,881Average Attendance/Day 4,701 8,076 8,092 6,956
PKF Audited Cityide Convention Roomnights 113,331 198,089 126,095 145,838
Citywide Attendance/Audited PKF Roomnight 2.1 3.2 3.6 3.0Source: PKF Consulting, and the Los Angeles Convention Center
The following table presents the culmination of our analysis and findings based on theassumptions contained herein.
Incremental GrowthLACC Citywide Conventions
Base Casel Proposed2
Exhibit Space 719,575 723,890Additional Meeting Space 153,348 131,791Contiguous Space 346,890 562,000Citywide Conventions 24 38Room Nights 270,000 550,000Room Nights/SF Free Standing Exhibit Space 0.4 0.8Delegates (x1.2) 324,000 660,000Average Size (Room Nights) 11,250 14,474Total Projected Attendance 810,000 1,650,000lProjected 2012 convention year based on the LA INC. Citywide Sales
Activity Convention Calendar.2Stabilized year.
Source: PKF Consulting
Beginning on the following page we have presented the Convention Center Events MarketForecast, which has been prepared by MR+E.
Convention Center Events Market and Forecast
Introduction
The focus of this section of the report is to identiy the likely futúre levels of util ization at the expanded. Los
Angeles Convention Center (LAC C) after the development of the proposed Special Events Center (SEC). In
particular this analysis is specifcally concerned with events that are booked by the LACC itself rather than
the citywide co nventions that are the responsibilty of LA Inc. In general this class of events depends more
heavily on the local market as result tends not to be a significant driver of room night generation. However
these events make up the bulk of overall utilzation and attendance at LACC.
Table 1 shows the anticipated changes in the physical programming of the convention center after the
development of the (SEC), The proposed development will replace the existing West Hall building, which
was part of the original 1973 development of the facility, with a state-of-the-art facility capable of seating
over 60,000 people. The SEC will have the capacity to host major public assemblies and sporting events
including NFL football. At present the facility is envisioned to have a retractable roof that wil allow for
conversion of the facilty from a stadium configuration to an exhibit hall or enclosed space arrangement.
Replacing West Hall is a proposed Pico Hall facility that will be joining the existing South Hall space that
was developed as part of the 1992 expansion. This wil create a continuous high-quality space that wil allow
for combined programming between the two halls., Total square footage is expected to increase by just over
68,000 ft.2 to a total of 788545 ft.2 as compared to the present configuration of 720,000 ft.2 this represents a
9.5% increase in the size of the exhibit Hall space available the LACC. I n addition to this net increase in
exhibit hall space the SEC can be used as meeting and exhibition space when the retractable roof is
deployed this wil add an additional 225,000 ft.2 of usable space for the convention center resulting in an
overall increase of 40.8% in gross leasable area.
Definitions
This section wil provide a forecast of future utiization of the expanded LACC for the following types of
events:
Tradeshows-- these are business-to-business events that are generally open only "to the trade".
Attendance is generally free for qualified delegates in the primary revenue source for the show are
AEG Special Events Center
fees paid by the exhibitors seeking to demonstrate their products and services to qualified
audience.
Consumer shows-- these are business to consumer events that are open to the general public,
Most consumer shows have an admission entry fee and are open to the pu blic at large, Oftentimes
consumer shows wil include a retail component where'vendors sell items directly to consumers.
Meeting room use-- the Los Angeles convention center has 64 meeting and conference rooms
that can be booked by civic and social organizations and for private events meeting room use is
often independent of other events that are taking place simultaneously at the convention center
however conventions and tradeshows will oftentimes include a meetings component within their
program.
Banquets-- these are catered events for large groups either social or civic organizations,
Assemblies-- often times these are religious groups and similar organizations that require rental of
large spaces for community and group activities.
Most of the patronage for this category of events listed above comes from the local market. Historically
LAce has been effective at accommodating the needs of the local market which is significant considering
the size of the Los Angeles metropolian area both in terms of the number of residents and businesses. That
focus on serving local market is evident in the levels of utilzation described below.
Number of events
Table 2 shows the historic volume of events that have occurred at the Los Angeles convention center
between 2008 and 2011, The 2011 figures are total year figures based on the existing schedule, During this
time the total number of events peaked in 2008 before the severe effects of the economic crisis were felt on
the regional economy of Southern California. Events declined to a low of 300 in 2010 and are showing an
increase for 2011, Over the course of this entire time period meeting room use was the largest single
category of the event, followed by assemblies and consumer shows. This distribution is co nsistent with the
regional focus of utiization at the convention center.
AEG Special Events Center 2
Table 3 shows the total number of use days at the LACC over the same time. Which range from a high of
1,119 in 2010 to a low of 733 in 2009. Meeting room use and consumer shows mad~ up the bulk of facilty
utilization. Table 4 translates the total num ber of events and use days into an average of days per event.
Attendance
Attendance at the LACC has ranged from a high of 1,6 million in 2008 to a low of 1,09 millon in 2010. Table
5 shows the distribution of attendance by category of event with consumer shows accounting for over half
the total attendance at the LACC. Table 6 provides an average attendance per event based on the total
attendance and a number of events reported previously. Table 7 provides the same information for
attendance by event day. Note that the size of attendance and per event remain relatively constant over the
time period investigated with the exception of banquets which show a fair amount of variability in
attendance.
Competitive Facilties
In order to gain an understanding of the pote ntial opportunities for new business in an expanded LACC it is
useful to establish the parameters of performance at other convention facilties within Los Angeles'
competiive set. Because of the unique nature of the special events center competitive convention centers
in the West coast market are examined. In addition because of the presence of the special events center
NFL stadiums that are co-located with convention centers are also described.
Convention Centers
Anaheim
In 2010, the total attendance to the Anaheim Convention Center was 1,171,626 people who spent just over
$850 milion. In addition to convention attendance, 920,742 hotel room nights were sold from these groups
within the same year.
Categories --The Anaheim Convention Center was home to 22 Conventions, 8 trade shows, 14
consumer shows, 31 special events, and over 200 meetings and corporate conferences.
AEG Special Events Center 3
Facilty--The Anaheim Convention Center is the largest faciliy of its type on the West Coast,
offering over 1.6 million square feet of space, including over 813,000 squara feet of exhibit space,
As one of the busiest convention centers in the United States, the Anaheim Convention Center and
its 8,000 seat arena, host approximately 300 events per year attracting over 1,000,000 guests
annually,
Economic Indicators--The Anaheim Convention Center has seen revenues decrease, as fewer
trade shows and conventions are being held; the shows that are held use less space and have
fewer attendees. This decline in revenues has put an undeniable strain on the City as it strives to
provide the same services that have been available in the past.
Renovation--As of 201 0, the Anaheim Convention Center began renovation. This will has included
(and will include in the future) renovation of the parking areas, roof replacement, and other
aesthetic improvements, The estimated cost for these improvements will upwards of $12,975,000
through the year 2015.
Las Vegas
In 2010, the number of visitors to all convention centers in Las Vegas was 4,473,134 for a total of 18,004
events. While the Las Vegas Convention Center (L VCC) is the largest venue, the City has numerous
facilities throughout the strip and downtown in nearly every major hoteL. They are all a part of the Las Vegas
Convention and Visitors Authority (LVCVA), Of the 18,004 events that took place in 2010, LVCVA reports
only the major conventions/events, as there are too many varying events and venues to record.
Categories--Total number of major conventions throughout the City in 2010 was 250 including 64
at the LVCC; the City also hosted 60 special events.
Facilties -- L VCC Opened in 1959 with a 20,340-square-foot rotunda, 18 meeting rooms and a
90,000-square-foot exhibit hall with a total of 3.2 million square feet of meeting and exhibit space.
The major hotel facilities under the jurisdiction of the Las Vegas Convention and Visitors Authority
are as follows: The Mandalay Bay Convention Center which boasts total meeting space of
1,663,697 Square feet, and The Sand Expo Center and the Venetian hotel which houses 1,8
AEG Special Events Center 4
milion Square feet of combined meeting and event space. The Sands Expo Center is the site of
numerous events throughout the year, including portions of the Consumer E)ectronics Show (CES)
and the World Shoe Association show.
The Cashman Center in downtown Las Vegas is a multi-use facility encompassing 483,000 square
feet on a 55-acre site near downtown Las Vegas, The facilty includes 98,100 square feet of exhibit
space, 12 meeting rooms, a 1,922 seat state-of-the-art theatre, over 2,500 spaces for parking, and
a 10,000 seat baseball stadium which is the home of the Las Vegas 51s, AM affilate of the
Toronto Blue Jays. Each segment of the facility is capable of functioning independently or in any
combination for conventions and trade shows, business/group meetings, theatrical presentations,
and sporting events.
Some other notable convention centers that are included in this study are the Cox Pavilon with a
total meeting space of 26,125 Square feet, Sam Boyd Stadium - 92,665, Thomas & Mack Center-
33,582 Square feet, and Henderson Convention Center with a total of 13,765 Square feet.
Economic Indicators-- 11 % of all Las Vegas visitors attended a convention, trade show,
consumer show, or special event at one the City's convention centers. Over 64 conventions and
tradeshows were held at the L VCC during FY10. Some of the largest tradeshows and conventions
held here annually include: MAGIC International, International CES, Specialty Equipment
Marketing Association (SEMA), and the National Association of Broadcasters (NAB). Since the
overall economy of the Las Vegas area is heavily dependent on its tourism and convention
industries, the LVCVA has been severely impacted in the last two years. During FY 2010, the
national and state economies continued to weaken and directly impact tourism and room tax
revenues. The most significant effect for the L VCV A was the decline in room tax, the primary
revenue source,
San Diego
The San Diego Convention Center is the premier convention and conference center in San Diego City and
County. The facilty is one of the major economic forces in San Diego with an estimated $1.27 billion dollar
impact to the overall economy including $20,2 million in tax revenues. As a result of the convention center,
AEG Special Events Center 5
in 2010 the City estimates that 709,298 hotel nights were sold. The total attendance in 2010 was 786,403
including 552,237 out-of-town visitors.
Facilty-- The San Diego Convention Center has a total of 2.6 million gross square feet including
615,701 dedicated to exhibit space and 204,114 in meéting space, There is a proposed 550 million
dollar expansion underway for improvements which wil be funded through increased tax revenue
from City hotel rooms. The total space dedicated for conventions totals 205,700 square feet which
is divisible into six halls and accommodates up to 965 1 Ox1 0 booths. There are 20 covered bays at
two loading docks, 45,000 square feet of ballroom space, 57,000 of meeting space which is
divisible into 61 versatie meeting rooms, and foùr separate and independent registration lobbies.
The meeting and conference centers have a total of 102,201 square feet dedicated space which
can accommodate groups from 20 to 3,500 in a general session. There are also four separate
ballrooms totaling 45,000 square feet including 61 separate meeting rooms with numerous
combination possibilties. The area that allows for special events allows se rvice from 10 to 10,000
guests covering a total of 45,000 square feet in four separate ballrooms, In general sessions, the
area allows from 20 to 3,500,
The Convention Center Expansion Program-- The Expansion portion of the Proposed Project
wil include a two-story structure with a mezzanine level matching existing building floor elevations
of varying heights up to approximately 95 feet above grade, There wil also be a 35-foot wide
pedestrian promenade immediately adjacent to the water's edge connecting to the existing
promenade along the waterfront. Furthermore, up to 30,000 square feet of visitor-serving retail in
the Expansion facility will be evenly distributed along the waterfront and parallel to Convention Way
and the pedestrian promenade, There will also be an additional 15,000 square feet of visitor-
serving retail located predominantly in the southerly end of the facilty. Thirdly, the wil be landside
improvements to an existing water transportation center facing the waterfront including a ticket
booth, administrative offces, public restrooms, a bus drop-off area, and parking,
Economic Indicators--72 conventions generate $1.4 bilion regionally and produce $20 million in
tax revenues for the City of San Dieg o. Despite the ling ering effects of the global and national
recession, the San Diego Convention Center is predicting positive gains in key economic and
AEG Special Events Center 6
business measures in 2011. Seventy-two conventions are forecast to generate $1,392,778,284 in
economic im pact and $20,028,015 in tax revenue for the City of San Pieg o~both metrics are higher
than those posted in last year's forecast in the same categories. Local hotels wil also pick up
737,820 hotel room nights as a result of the influx of convention business.
San Francisco
The San Francisco Moscone Center caters to nearly one millon exhibitors and attendees every year; in fact,
conventions account for more than one-third of the City's $8 bilion annual tourism industry. It is estimated
by the Visitors Bureau that 35.3 percent of visitors who come to San Francisco are attending a meeting or
convention.
CategoriesuMoscone center on average hosts between 30-35 conventions each year, 25 trade
shows, 20 consumer shows, and 10-15 special events plus hundreds of corporate and continuing
educational seminars.
Facilties-- Moscone Center is San Francisco's largest convention and meeting space. The three
buildings - Moscone South, Moscone North, and M oscone West - cover more than 20 acres on
three adjacent blocks with over 2 million square feet of building area. Combined, the three
buildings consist of over 740,000 square feet of exhibit space, more than 100 meeting rooms, and
as many as four ballrooms. '
In looking at each facilty individually, Moscone Center South (the largest) allows 650,000 Square
feet of building area includ ing a column-free hall of 260,560 square feet. There are also 41 rooms
that total up to 60,920 square feet. Moscone Center North has a meeting area of 570,000 square
feet including 18,140 square feet in two major halls, and 17 meeting rooms totaling 53,440 square
feet. Finally, the Esplanade Ballroom totals 126,000 square feet of building area. There are 10
meeting rooms including one totaling 2,870 square feet, the rest totaling 42,750 square feet.
Moscone Center Renovation Update --The Tourism Improvement District, in partnership with the
City & County of San Francisco, is well underway with a $56 milion dollar renovation of Moscone
Center. Work began in August of 2010 and wil continue through June 2012. Other upgrades
AEG Special Events Center 7
include a facelift to meeting rooms and public spaces with new carpet, ceilngs, lighting and paint. It
wil be LEED Gold Certified and more tech-savvy with telecom and data capling upgrades
In exchange for the City issuing up to $45 million in Certificates of Participation (C.O.P.s) to
renovate and improve Moscone, San Francisco hotels have agreed to assess themselves up to 1.5
percent of the gross revenues they receive from tourist rooms. This assessment wil more than
double the City's hotel-specific marketing and sales programs and generate $22 milion for
aesthetic improvements to Moscone over the next five years. While the amount for aesthetic
improvement is less than half of original estimates due to lower than expected hotel revenue, these
funds wil contribute greatly to the visitor experience. The goal is to complete the capital
improvements by early 2012 and to maintain the competitiveness of San Francisco as a convention
destination.
Seattle
The Washington State Center confirmed 474 events in fiscal 2009, drawing a total of 430, 771 attendees and
providing $4,182,663 in gross building rent revenues. A total of 51 "citywide" events brought such diverse
groups as the New York Life Insurance Company's Executive Council, the American Academy of Neurology
and the International Trademark Association. The Center continues to be a popular destination formeetings
and maintains an exceptional return client rate. A good example of this is the American Epilepsy Society,
which indicated that its events in Seattle (2002 and 2008) were such a success that it has contracted to
return in 2014. Two Microsoft 'Tech Ready' events drew employees from all around the world. The popular
annual Northwest Flower & Garden Show-a fixture on the calendar since 1989-is one of the Center's long
standing clients. The successful 'OneStop' sales program supports smaller local meetings and events,
allowing the Center to maximize occupancy during and between large national events. OneStop staff
managed a total of 351 events in fiscal 2009.
CategoriesuWashington Convention Center holds on overage 40-45 conventions, 3-5 trade
shows, 8-10 consumer events, and over 300 special events including continuing education and
corporate meetings each year.
AEG Special Events Center 8
Faciliy--The facility is home to 71,000 square feet of meeting, exhibit, banquet and pre-function
space. There are up to 17 flexible, fully carpeted meeting rooms with the ability to connect to
205,700 square feet of heavy load exhibit space. Meeting rooms equipped with adjustable lighting,
built-in sound system and programmable LCD screens at the entrances. This facilty is designed
and furnished to exceed LEED Silver certification.
Economic Indicators.- Washington State Co nvention Center has experienced higher than
anticipated revenues. A solid backlog of events and a limited number of cancellations enabled the
Center to a post a $2,382,441 positive bottom line for fiscal 2009. The board of directors heeded
early indications of the financial downturn and authorized exceptional actions to offset an expected
decline in revenues. These actions included reductions in utiity consumption, goods and services,
and a state-mandated wage and hiring freeze to bring expenses in much lower than originally
budgeted. Total operating revenue for fiscal 2009 exceeded $25.5 milion, just slightly below the
all-time high of $25.7 milion. Building rent, food service and faciliy services revenues were all
higher than 2008 levels; fòod service led the way with an impressive net increase of $1.1 millon
over the prior year's results.
Market Share
Table 8 shows the number of tradeshow news network 250 events by city. Tradeshow news network that
tracks the 250 largest public assembly events (including both conventions and tradeshows but excluding
consumer shows) held in the United States each year. The events are ranked by the total amount of floor
space that they consume. The largest event is the international consumer electronics show (CES) held in
Las Vegas which occupies just over 1.4 milion ft.2. Of the West Coast comparator cities Las Vegas hosts
by far the largest number of these large events hosting 58 last year. In comparison Los Angeles was the
site of only four of the top 250 largest shows. The largest of which (NCT A) was ranked 157tl. Details on the
range of events staged in each of the cities are shown on the table.
Stadiums
Cowboys Stadium-opened in 2009 Cowboys Stadium located in Arlington Texas is one of the newest
NFL venues. The facility is primarily designed as a football stadium but it is available to host other public
AEG Special Events Center 9
events including amateur sports concerts and public exhibitions. The final ca pital construction costs for the
project was es timated at $1.15 billion a which is currently a record in the U nited Stat~s a fo otball stadium.
Cowboys Stadium has a retractable roof that can be mechanically used to cover the Stadium that will allow
it to be used in all seasons and for indoor events. It's two years of operations Cowboys Stadium has
primarily been used for NFL football and selected NCAA events pdditionally the venue hosted Super Bowl
XLV in 2011. It is anticipated that over time the Stadium will be used more frequently for tradeshows and
public events however it has currently not been utilzed for those purposes at this time.
Georgia Dome.. the Georgia Dome is a publicly owned facilty that is located as part of the Georgia world
Congress Center which is Atlanta's primary convention venue. The dome was completed in 1992 with a
capital cost of $214 million, all of which was financed by the state of Georgia itself. Since opening the facilty
the Georgia World Congress Ctr., Authority has undertaken a $30 million two-phase renovation program
that began in 2006. The facilties integration into a larger convention complex has allowed for its use in
public event programs however primarily the facilty is used as an NFL stadium and NCAA venue and for
related spectator sports events. One of the recurring events that utiizes both the Georgia world Congress
Center in the dome is the annual passion conference which is a religious meeting of college students. This
event has an attendance of approximately 75,000.
University of Phoenix Stadium--Iocated in Glendale Arizona the University of Phoenix Stadium is the
home of the NFL Cardinals football franchise. Developed by the Arizona sports and tourism authority, with
public financing generated by an additional sales tax levy in Maricopa County, the Stadium was specifically
charged with being a multi-use facility capable of hosting conventions and public events. The Stadium
opened in 2006 with a total capital cost of $455 milion. How well the Stadium is primarily used for spectator
sports it has been the site of a number of trade shows and special events since its opening and the nature
of its retractable grass field allows for the use of the floor of the facilty as exhibition space.
Edward Jones Dome-- this is the home stadium of the NFL's St. Louis Cardinals football team is owned
and operated by the St. Louis visitors and convention. The dome was built in 2005, speculative basis prior to
the relocation of the Rams football team from Anaheim to St. Louis and as such it was always conceived
that the facilty would be integrated into the city's convention center (the America's Center). The dome has a
false roof that can be installed over the playing field that allows the building to be connected to the
AEG Special Events Center 10
convention center itself. The dome has the abilty to act as primary exhibit space for the convention center
and is frequently used as part of the trade and consumer shows that take place in th~ venue. The faciliy is
very popular with relig ious groups as well in addition to spectator sports and concerts.
.Lucas Oil Stadium-- 2008 the $720 million project located in Indianapolis Indiana is the second Stadium
venue that has been integrated into the development of the Indianapolis convention Center. This replaces
the RCA dome that had previously been located on the same site. The facilty is owned by the state of
Indiana convention and is operated by the capital improvement Board of Marion County Indiana. And
related facilities used for sporting events is the home of the NFL Colts franchise however because
Indianapolis is the home of the NCAA the facility has been used for a number of college sports events as
well as high school events and concerts since its opening the facilty has been used by approximately twice
a year for trade and consumer shows and 4 times as a site for public assemblies.
Table 9 summarizes the public events at these comparable NFL venues based on their average annual or
most recent reported year which varies for each facility looked at all of these com parables are located in
metropolian areas with populations considerably smaller than Los Angeles ranging from 6.37 milion in the
Dallas MSA 2.01 mill on in the Indianapolis MSA. This compares to the Los Angeles MSA population of just
over 15.7 million. In general the nonsports utilization of these venues has been somewhat limited ranging
from a hig h of 31 events at the Edward Jones Dome in St. Louis to a low three at Cowboys Stadium in
Arlington Texas. Note that the figure for the Edward Jones, includes events at the of the adjacent
convention center as a and the sellers exhibit halls are integrated in a manner where individual use of each
faciliy is not reported out by the venue.
Forecast of future events
The public events market
While the tradeshow news network 250 tracks the largest events in the United States annually it focuses on
conventions and trade shows rather than the more narrowly focused category of consumer shows and
business-to-business trade shows. A secondary data source, Events in America (EIA), which is used by
professional meeting planners and exhibitors to track trends in the industry and develop their markets can
AEG Special Events Center 11
provide a more focused view of these particular categories of events. The EIA database which reports
public events can be sorted by location industry and venue type.
Table 10 presents data on consumer shows that US convention venues with a total of gross leasable area
of over 100,000 ft.20f. The data is available for2010 and for committed events through 2011. In 2010 there
were 548 consumer shows held in US co nvention venues of this'size n umber increased to 697 through
2011. Looking at the LACC 's share of this market it was 8.2% in 2010 and 6% for 2011. This level of
penetration represents a significant market share for the LA CC in this sector of the events ind ustry.
Table 11 provides similar info rmation for business-to-business trade shows 2010 saw just over 1,800 trade
shows in US convention venues with gross leasable area over hundred thousand square feet this figure is
expected to grow by nearly 1,000 to 2,793 for 2001 in the sector Los Angeles has a considerably smaller
market share penetrating just 1.6% of the market for 2010 and .8% for 2011. The distribution by sector is
shown on the table.
Forecast
Growth in utiization at an expanded LA CC can be expected to come from to factors. Firstly as the' center
itself expands in terms of floor area existing shows and events will be able to grow their attendance.
Secondly as the facilty adds new capabilties it wil be able to penetrate existing markets more effectively. In
order to forecast the likely future level of event utilization at the faciliy both of these factors were considered
based on an extension of current business volumes.
Table 12 shows the incremental growth in attendance based on the existing distribution of event days and
average attendance per event. A 9.5% growth rate in attendance was applied to exhibit Hall consuming
events based on the expanded size of the new facilty after the project is developed. A growth rate of 3%
was applied to meeting room use and banquets in order to reflect the rate of expansion in the general
economy. Incremental growth for each type of event per event is shown on the table under the heading
forecast growth.
The second factor in determining a forecast of utilzation is a growth in the number of events that can be
attracted to LA CC after the improvements in the facilties hosting capacities. In this case a market
penetration rate approach and growth in occupancy rate were applied to the existing annual average event
base by type. Assuming a .5% increase in market penetration for trade shows and consumer shows the LA
CC can expect a net growth of 20 additional trade shows and five additional consumer shows during a
AEG Special Events Center 12

stable operating year. For the events that are tied much more closely to the local economy such as meeting
room use banquets and assemblies a 5% increase in occupancy rate based on a 360 day occupancy year"
was used as an estimate of likely future performance. Table 12 displays the forecast the future events
based on these growth expectations.
Table 14 presents a forecast of future incremental growth at the expanded LA CC in the stable year after the
completion of the project this forecast is based on of the increase in attendance that can be expected to
occur as a result of expansion of the hosting capacity of the facility itself as well as an increase in the
number of events based on an increase in the penetration rate for national market's and incremental growth
stemming from the regional economy. In total the forecast anticipates a 23.2% increase in the number of
events corresponding to a 37.9% increase in attendance. In terms of total attendance the tradeshow
category can be anticipated to be the la rgest sector of new activity at the facility at just over hundred and
73000 new attendees.. In terms of total attendance consumer shows are anticipated to remain the largest
single category of use at the convention center with a forecast attendance of just over 784,000 per year.
This information is translated into change in event days based on the new number of events and attendance
and forecasts a range of attendance based on a confidence interval of 20% to provide a high and low
estimate. This inform ation is translated into event days and forecast of use of floor area and a number of
meeting rooms as appropriate. Table 15 provides the same information with a floor area use estimate.
AEG Special Events Center 13
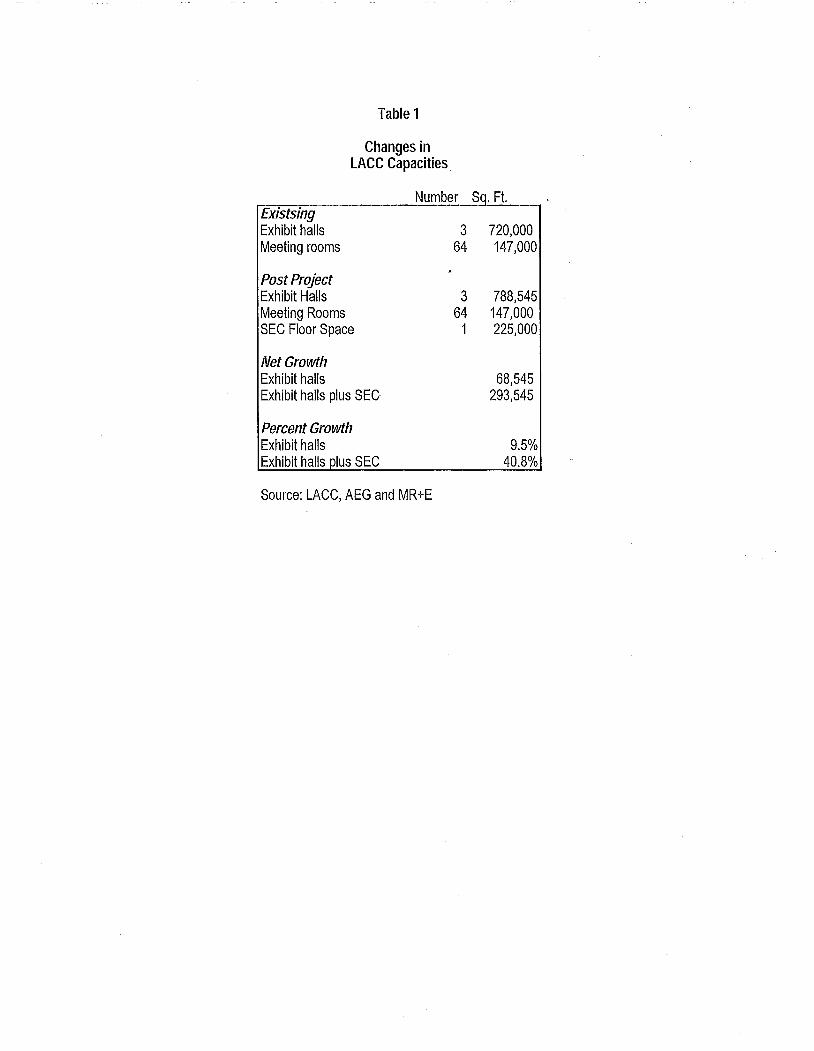
Table 1
Changes inLACC Capacities
Number Sq. Ft.ExistsingExhibit halls 3 720,000Meeting rooms 64 147,000
Post Project
Exhibit Halls 3 788,545Meeting Rooms 64 147,000SEC Floor Space 1 225,000
Net GrowthExhibit halls 68,545Exhibit halls plus SEC 293,545
Percent GrowthExhibit halls 9.5%Exhibit halls plus SEC 40.8%
Source: LACC, AEG and MR+E
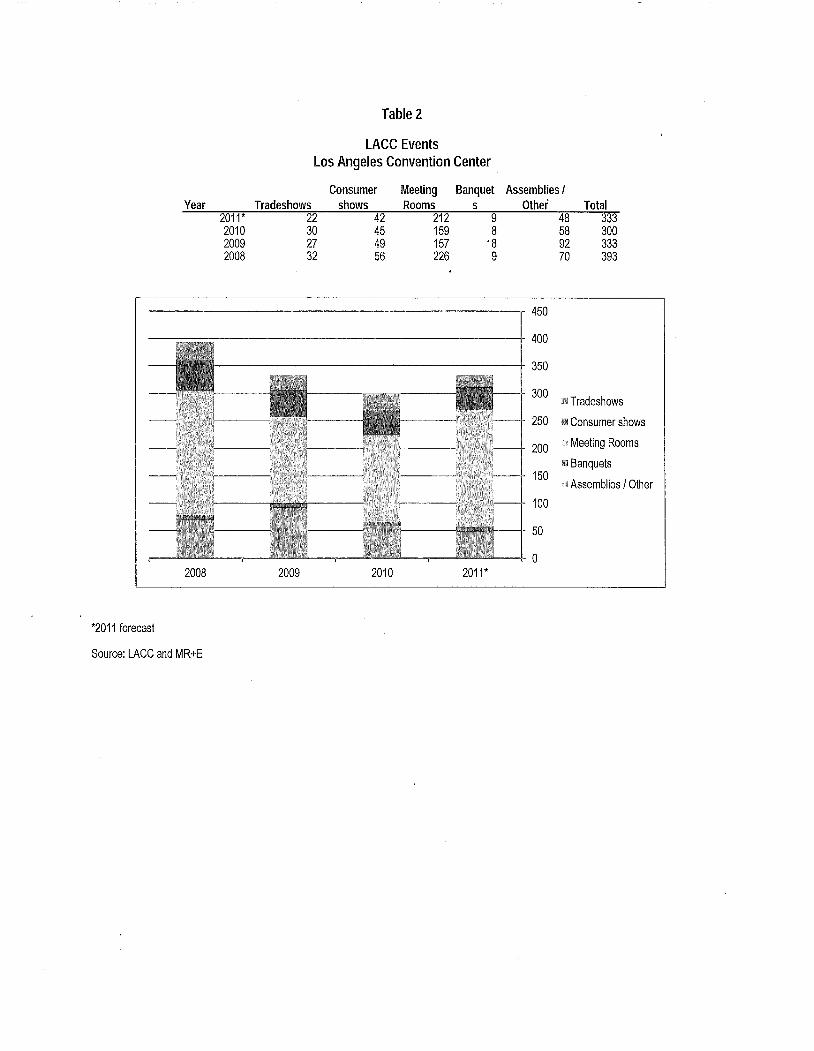
Table 2
LACC EventsLos Angeles Convention Center
Consumer Meeting Banquet Assemblies I
Year Tradeshows shows Rooms s Other' Total2011* 22 42 212 9 48 3332010 30 45 159 8 58 3002009 27 49 157 '8 92 3332008 32 56 226 9 70 393
- ~~-=.-=~.~" - 450
400
350
Tradeshows
II Consumer shows
200Meeting Rooms
Banquets150
Assemblies / Other
100
o
2008 2009 2010 2011*
*2011 forecast
Source: LACC and MR+E
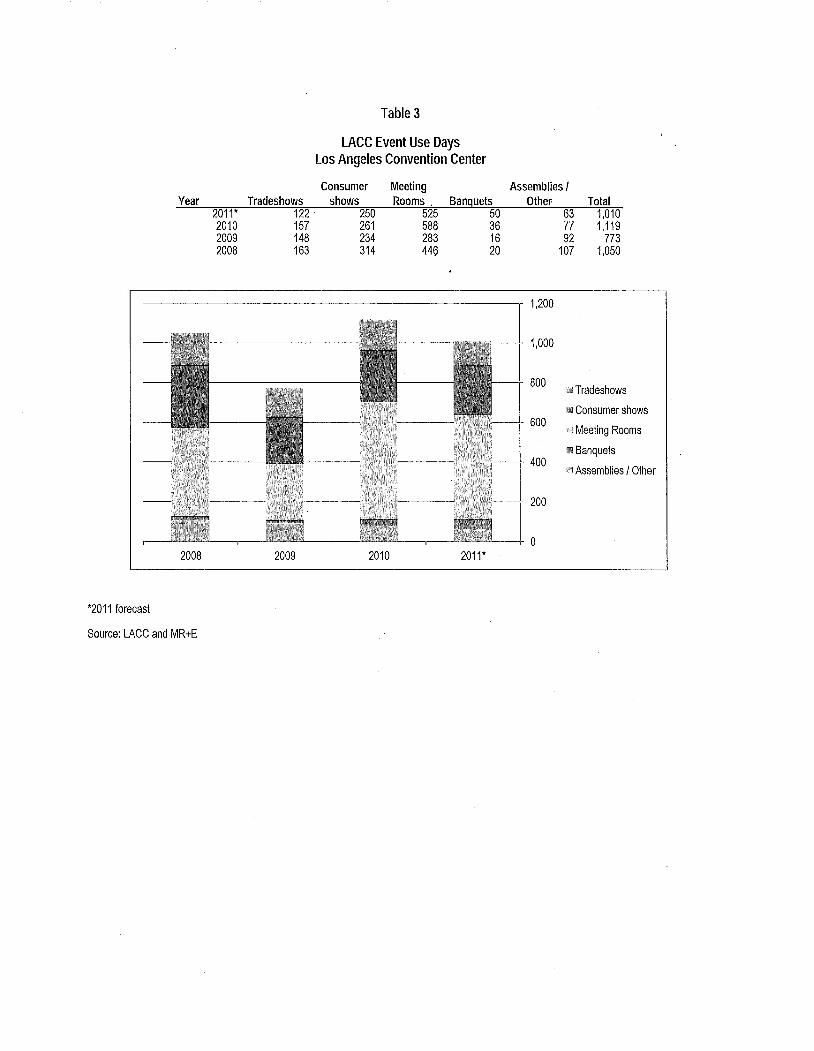
Table 3
LACC Event Use Days
Los Angeles Convention Center
YearConsumer
shows250261234314
MeetingRooms.
525588283449
Banquets50361620
Tradeshows122157148163
2011*201020092008
2008 2010 2011*2009
*2011 forecast
Source: LACC and MR+E
Assemblies IOther
1,200
1,000
800
600
400
200
637792
107
Total1,0101,119
7731,050
Tradeshows
Consumer shows
Meeting Rooms
Banquets
Assemblies I Other
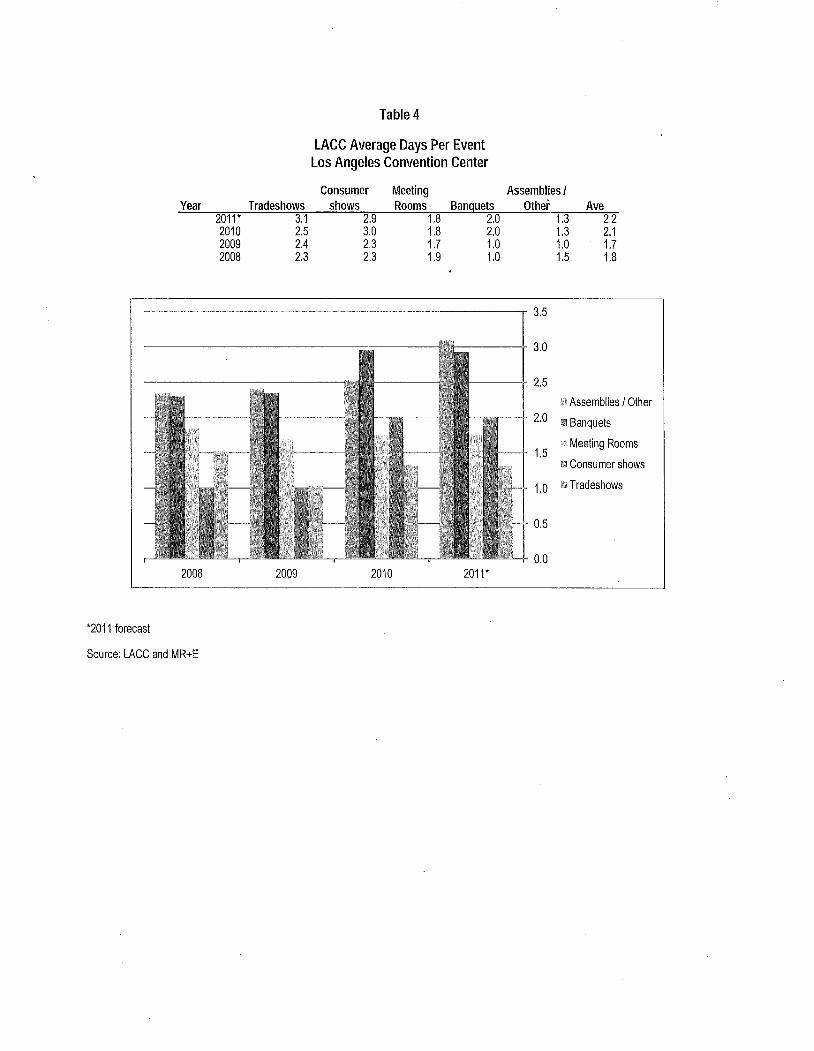
Table 4
LAce Average Days Per EventLos Angeles Convention Center
Year Tradeshows3.1
2.52.42.3
Consumershows
2.93.02.32.3
Meeting
Rooms1.81.81.71.9
Banquets2.02.01.01.0
2011 *
201020092008
2008 2011 *2009 2010
*2011 forecast
Source: LACC and MR+E
Assemblies I
Other'1.31.31.01.5
Ave2.22.11.71.8
3.5
3.0
2.5
2.0
Assemblies I Other
Banquets
Meeting Rooms
Consumer shows
Tradeshows
1.5
1.0
0.5
0.0
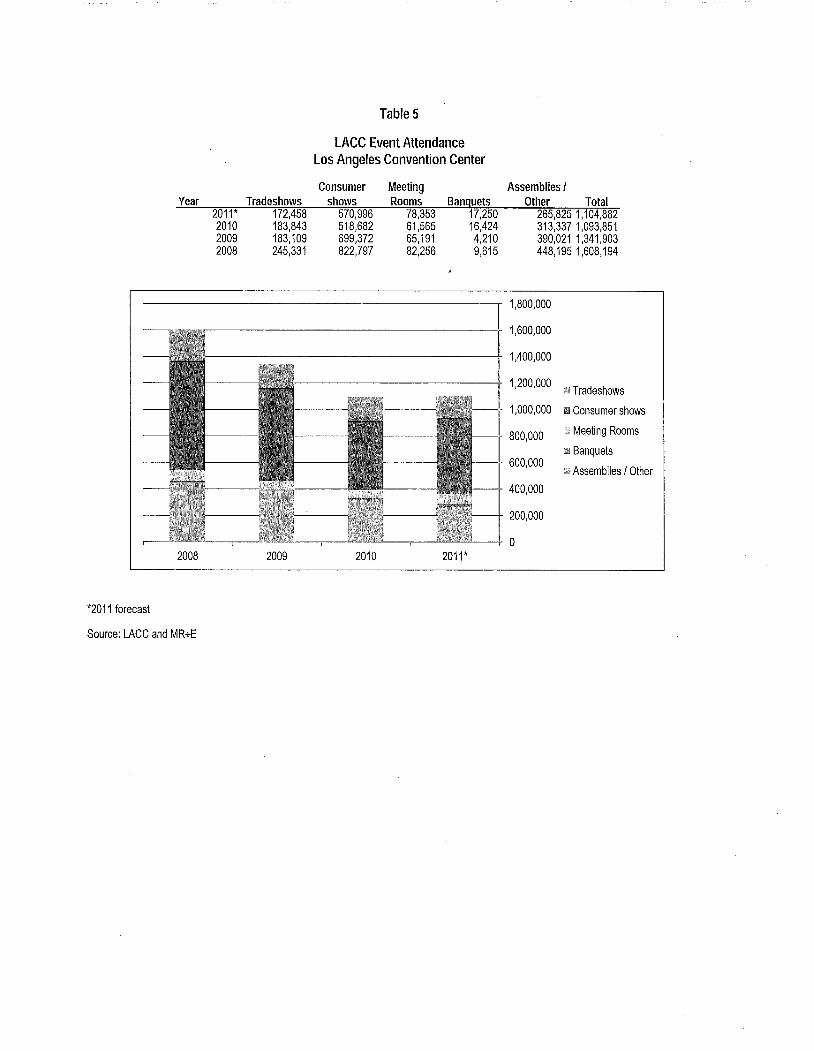
Table 5
LAce Event AttendanceLos Angeles Convention Center
YearConsumer
shows570,996518,682699,372822,797
MeetingRooms
78,35361,56565,19182,256
Banquets17,25016,244,2109,615
Assemblies IOther' Total
265,825 1,104,882
313,3371,093,851390,021 1,341.903
448,195 1,608,194
Tradeshows2011* 172,4582010 183,832009 183,1092008 245,331
1,800,000
1,600,000
1,400,000
1,200,000
- 1,000,000
800,000
600,000
- 400,000
2008 2009 2010 2011*
*2011 forecast
Source: LACC and MR+E
Tradeshows
Consumer shows
Meeting Rooms
Banquets
Assemblies / Other
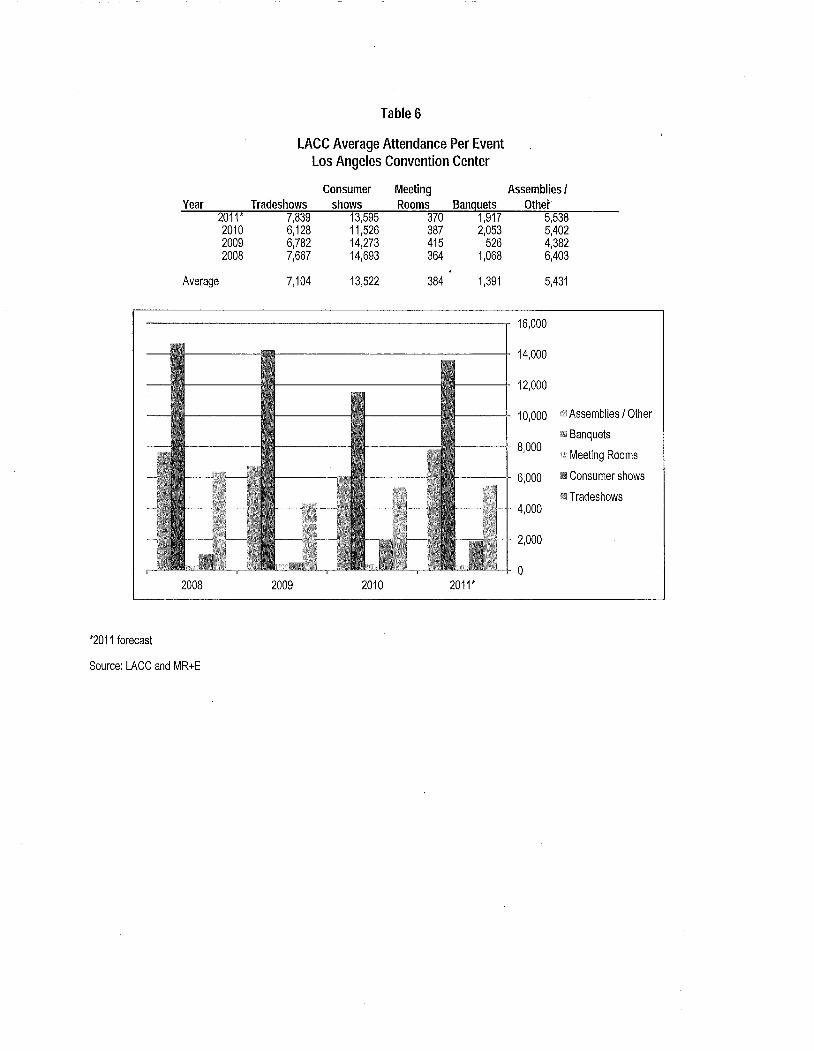
Table 6
LACC Average Attendance Per EventLos Angeles Convention Center
Year Tradeshows7,8396,1286.7827,667
7,104
Consumershows
13,59511,52614,27314,693
13,522
Banquets1,9172,053
5261,068
1,391
Meeting
Rooms370387415364
384
2011*201020092008
Average
2008 2010 2011*2009
*2011 forecast
Source: LACC and MR+E
Assemblies I
Other5,5385.424,3826.403
5.431
16,000
14,000
Assemblies I Other
Banquets
Meeting Rooms
Consumer shows
Tradeshows4,000
- -- 2,000
o
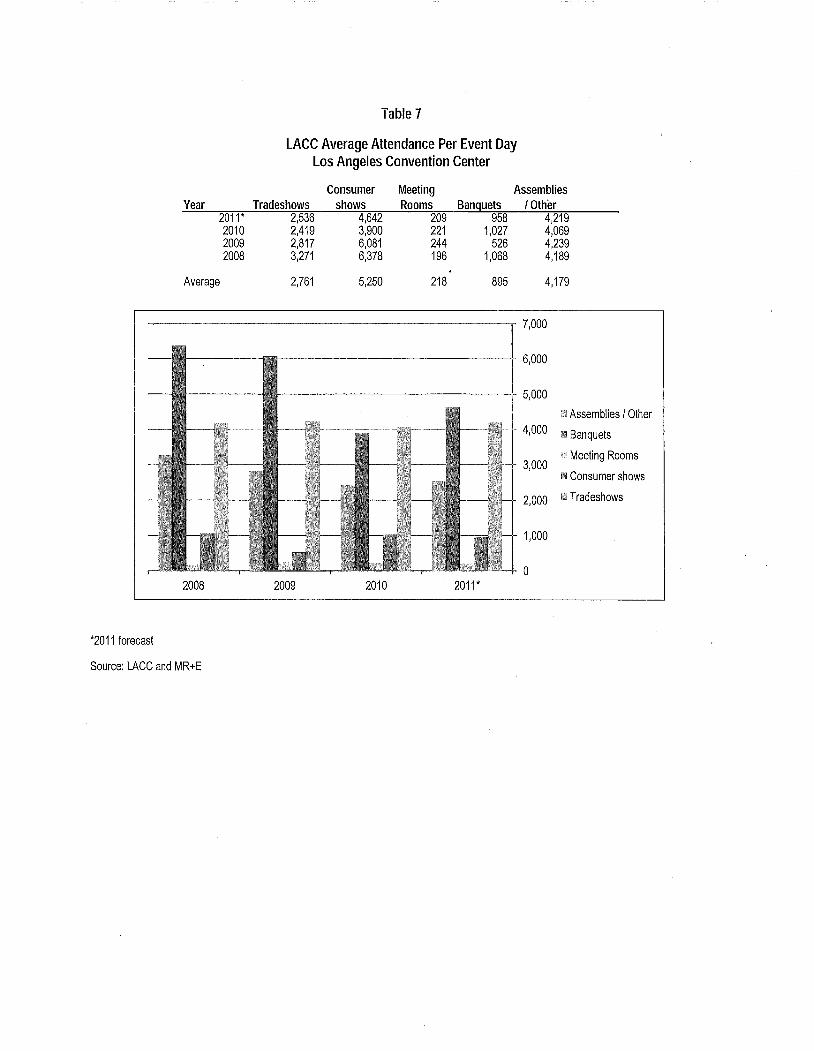
Table 7
LACC Average Attendance Per Event DayLos Angeles Convention Center
Year Tradeshows2,5362,4192,8173,271
2,761
Consumershows
4,6423,9006,0816,378
5,250
Meeting
Rooms209221244196
218
Banquets958
1,027526
1,068
895
2011 *
201020092008
Average
2008 2010 2011*2009
*2011 forecast
Source: LACC and MR+E
AssembliesI Other
4,2194,0694,2394,189
4,179
7,000
6,000
3,000
Assemblies I Other
Banquets
Meeting Rooms
Consumer shows
Tradeshows2,000
1,000
o
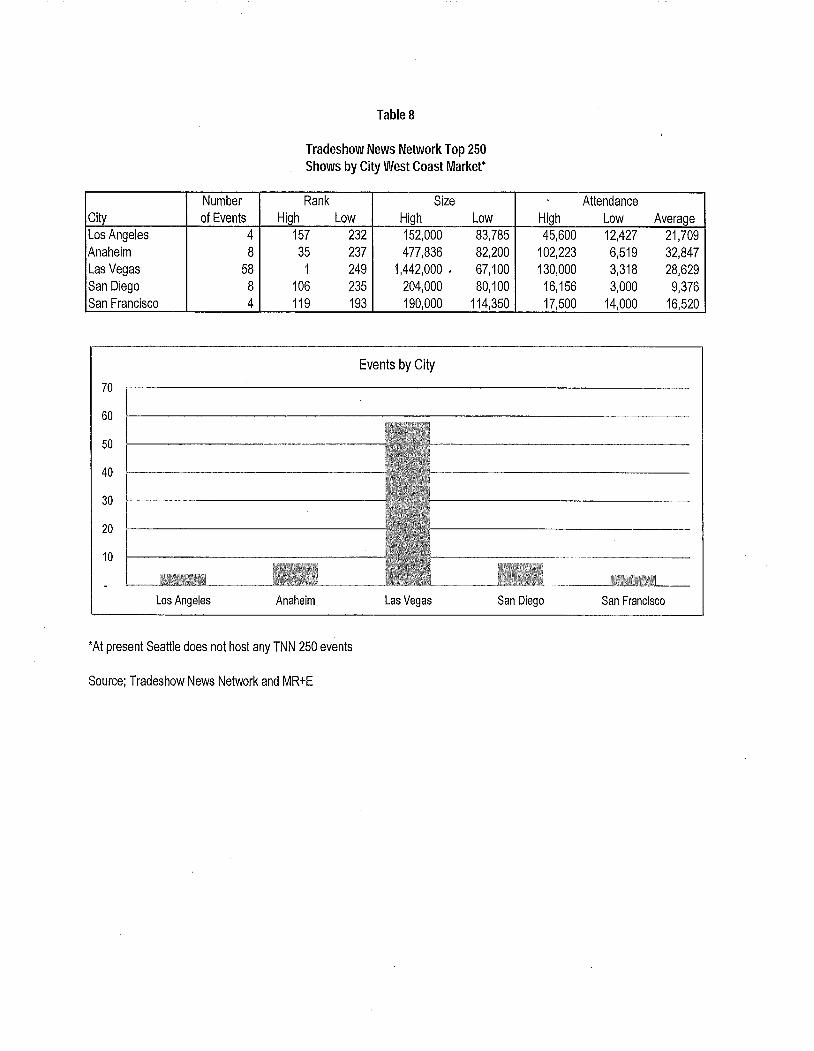
Table 8
Tradeshow News Network Top 250
Shows by City West Coast Market*
Number Rank Size " AttendanceCity of Events High Low High Low High Low AverageLos Angeles 4 157 232 152,000 83,785 45,600 12,427 21,709Anaheim 8 35 237 477,836 82,200 102,223 6,519 32,847Las Vegas 58 1 249 1,442,000 . 67,100 130,000 3,318 28,629San Diego 8 106 235 204,000 80,100 16,156 3,000 9,376San Francisco 4 119 193 190,000 114,350 17,500 14,000 16,520
Events by City
70
10
60
50
40
30
20
Los Angeles Anaheim Las Vegas San Diego San Francisco
'At present Seattle does not host any TNN 250 events
Source; Tradeshow News Network and MR+E
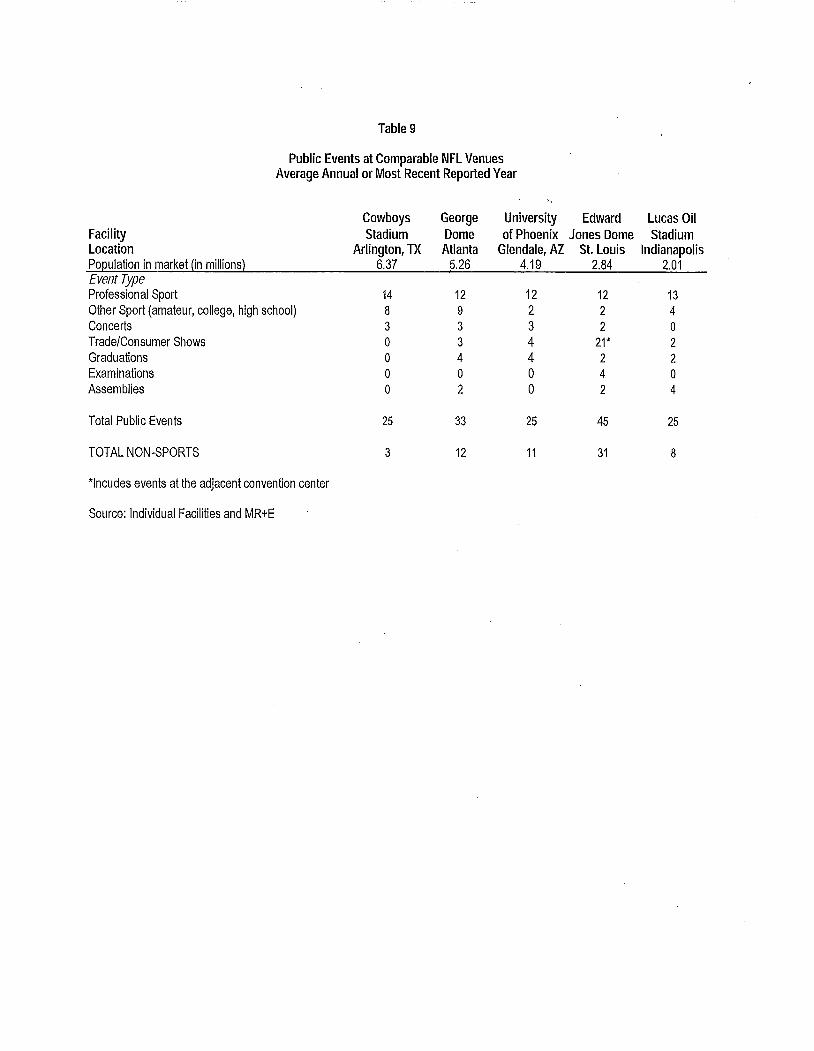
Table 9
Public Events at Comparable NFL VenuesAverage Annual or Most Recent Reported Year
Cowboys George University Edward Lucas OilFacilty Stadium Dome of Phoenix Jones Dome StadiumLocation Arlington, TX Atlanta Glendale, AZ St. Louis IndianapolisPopulation in market (in millions) 6.37 5.26 4.19 2.84 2.01Event Type
Professional Sport 14 12 12 12 13
Other Sport (amateur, college, high school) 8 9 2 2 4
Concerts 3 3 3 2 0
Trade/Consumer Shows 0 3 4 21* 2
Graduations 0 4 4 2 2
Examinations 0 0 0 4 0
Assemblies 0 2 0 2 4
Total Public Events 25 33 25 45 25
TOTAL NON-SPORTS 3 12 11 31 8
*Incudes events at the adjacent convention center
Source: Individual Facilities and MR+E
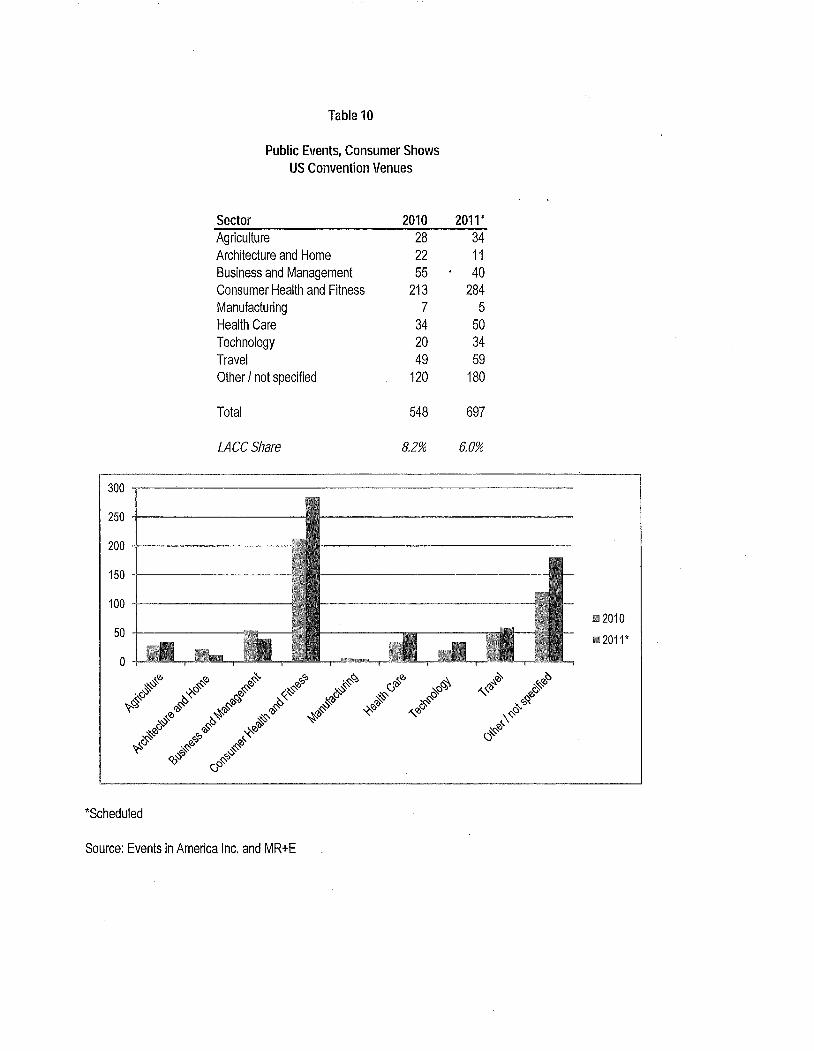
Table 10
Public Events, Consumer ShowsUS Convention Venues
Sector 2010 2011*
Agriculture 28 34
Architecture and Home 22 11
Business and Management 55 40
Consumer Health and Fitness 213 284
Manufacturing 7 5
Health Care 34 50
Technology 20 34
Travel 49 59
Other / not specified 120 180
Total 548 697
LACC Share 8.2% 6.0%
300 J
,- ==~~~250 I'
200 -
150 -
o
~e, ~e, fò~ fòC,C,
~,,~ 't~c rb¿¡~ l-~~~ 'ò~ _..'ò~ 'ò~ò"te, 't""' ~.~v ~ . ')e,'I~ i¡c, i,'-!"v 's:(l #~ ;:~ i¡'S
~ cP~
~~ 't",''0 fòk'õ
~c,~~c:
i,\o~(l
.~Ò;~~'òv
~~
vr6e, ~éi~ s:C,')e,'I ~,- ",'õ
.Scheduled
Source: Events in America Inc. and MR+E
2010
112011*
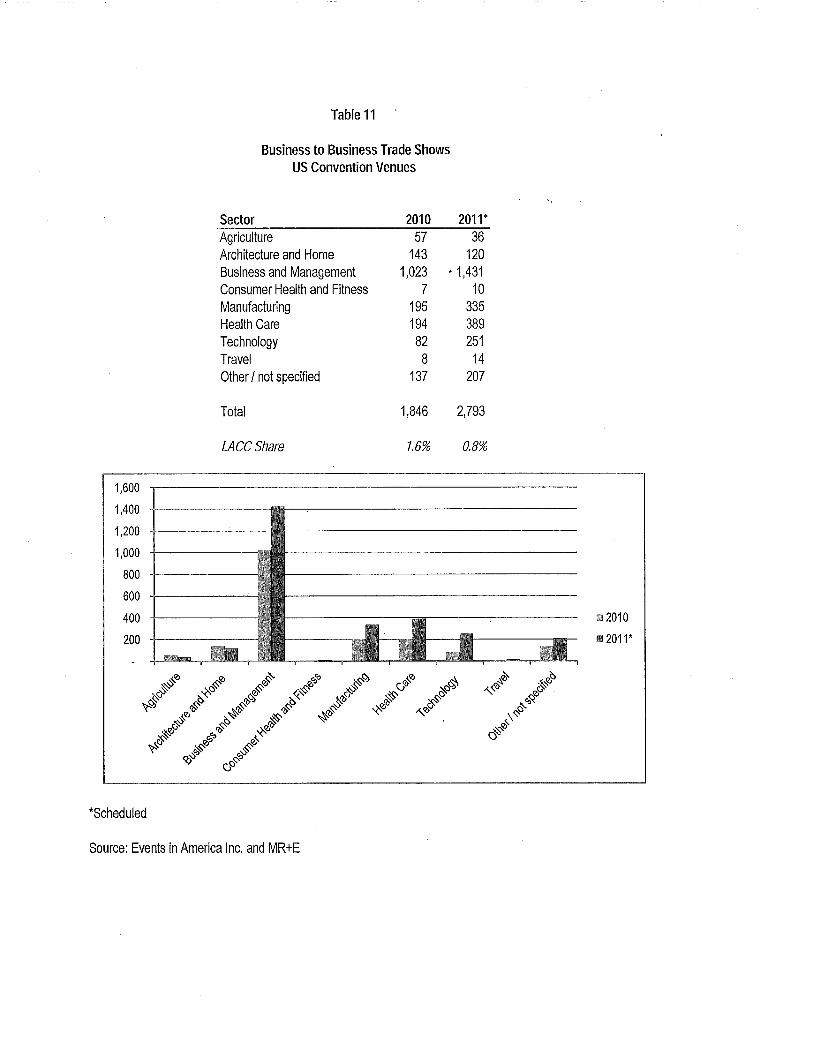
*Scheduled
Table 11
Business to Business Trade Shows
US Convention Venues
Sector 2010 2011"
Agriculture 57 36
Architecture and Home 143 120
Business and Management 1,023 . 1,431
Consumer Health and Fitness 7 10
Manufacturing 195 335
Health Care 194 389
Technology 82 251
Travel 8 14
Other I not specified 137 207
Total 1,846 2,793
LACC Share 1.6% 0.8%
1,600
1 ,400
1,200
1,000
800
600
400
200
~q, rà~ 'ò'?'?~~(j ~dj~ ~(l~
#' ...# #'~'ò ~~. ~.~ÇJ #' ~q,~
~èJ 'ò'?'? r/~ ~~ -;~~'5 ~C;c.P
,:~ ~'\ \'b rà#:'õ
~~~Çj
i,\Q~'õ
~'ò
~i:ÇJ~'S
.~ò.~
~r§~~#'
v~'ò '.~~ ~Çj. ')q,'b õ:'(' ,\'õ
Source: Events in America Inc. and MR+E
2010
2011*
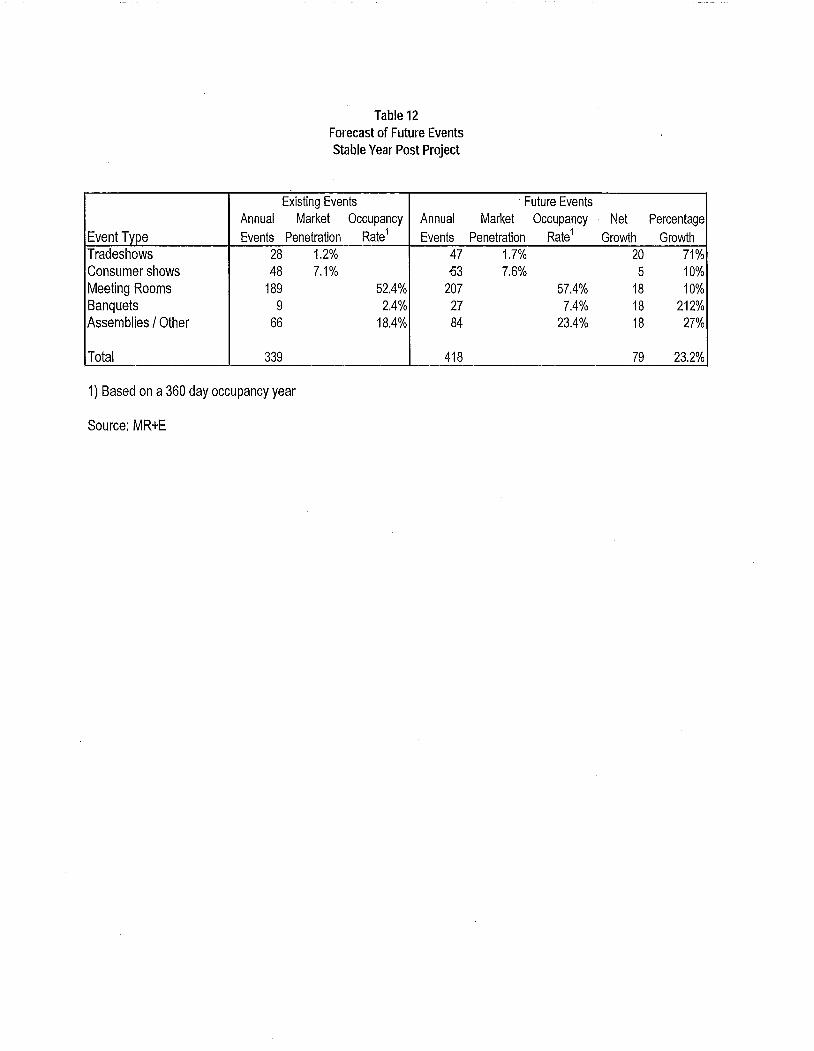
Table 12
Forecast of Future Events
Stable Year Post Project
Existing Events Future Events
Annual Market Occupancy Annual Market Occupancy Net Percentage
Event Type Events Penetration Rate1 Events Penetration Rate1 Growth Growth
Tradeshows 28 1.2% 47 1.7% 20 71%
Consumer shows 48 7.1% -53 7.6% 5 10%
Meeting Rooms 189 52.4% 207 57.4% 18 10%
Banquets 9 2.4% 27 7.4% 18 212%
Assemblies I Other 66 18.4% 84 23.4% 18 27%
Total 339 418 79 23.2%
1) Based on a 360 day occupancy year
Source: MR+E
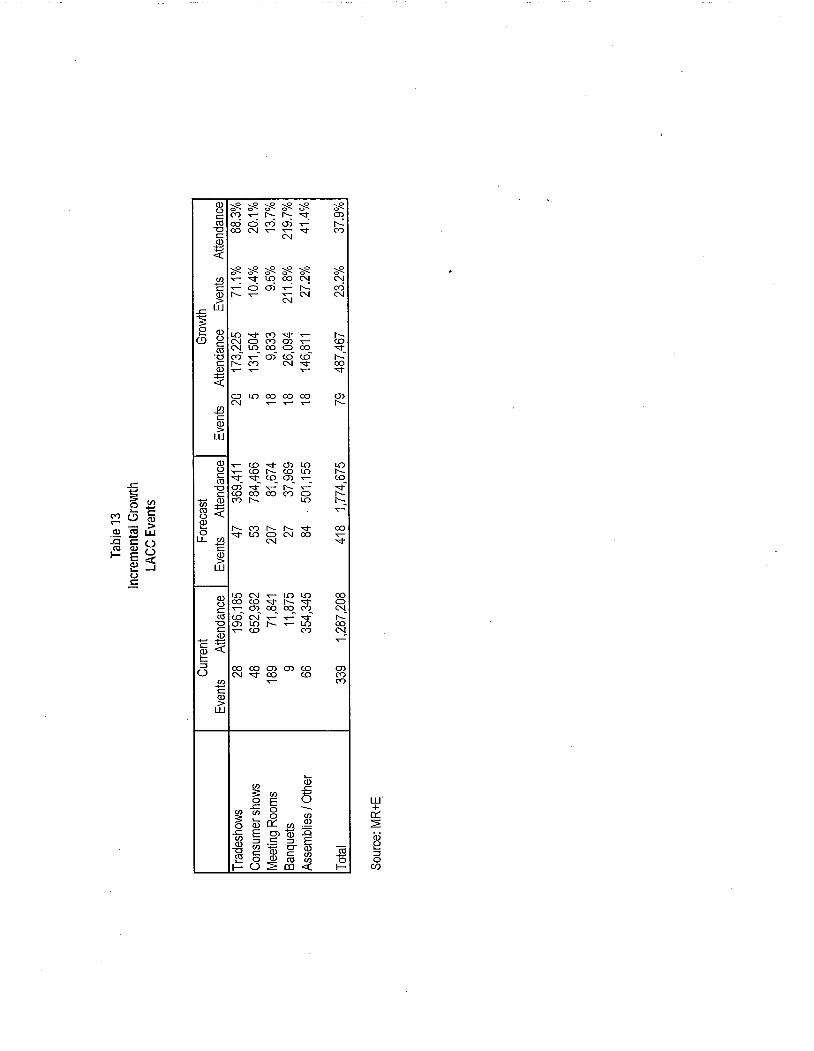
Table 13
Incr
emen
tal G
row
thLA
CC
Eve
nts
Current I Forecast 1
Gro
wth
Events Attendance Events Attendance
Eve
nts
Atte
ndan
ceE
vent
sA
ttend
ance
Tra
desh
ows
2819
6,18
547
369,
411
2017
3,22
571
.1%
88.3
%
Con
sum
er s
how
s48
652,
962
5378
4,46
65
131,
504
10.4
%20
.1%
Mee
ting
Roo
ms
189
71,8
4120
781
,674
189,
833
9.5%
13.7
%
Ban
quet
s9
11,8
7527
37,9
6918
26,0
9421
1.8%
219.
7%
Ass
embl
ies
I Oth
er66
354,
345
84. 501,155
1814
6,81
127
.2%
41.4
%
Tot
al33
91,
287,
208
418
1,77
4,67
579
487,
467
23.2
%37
.9%
Sou
rce:
MR
+E
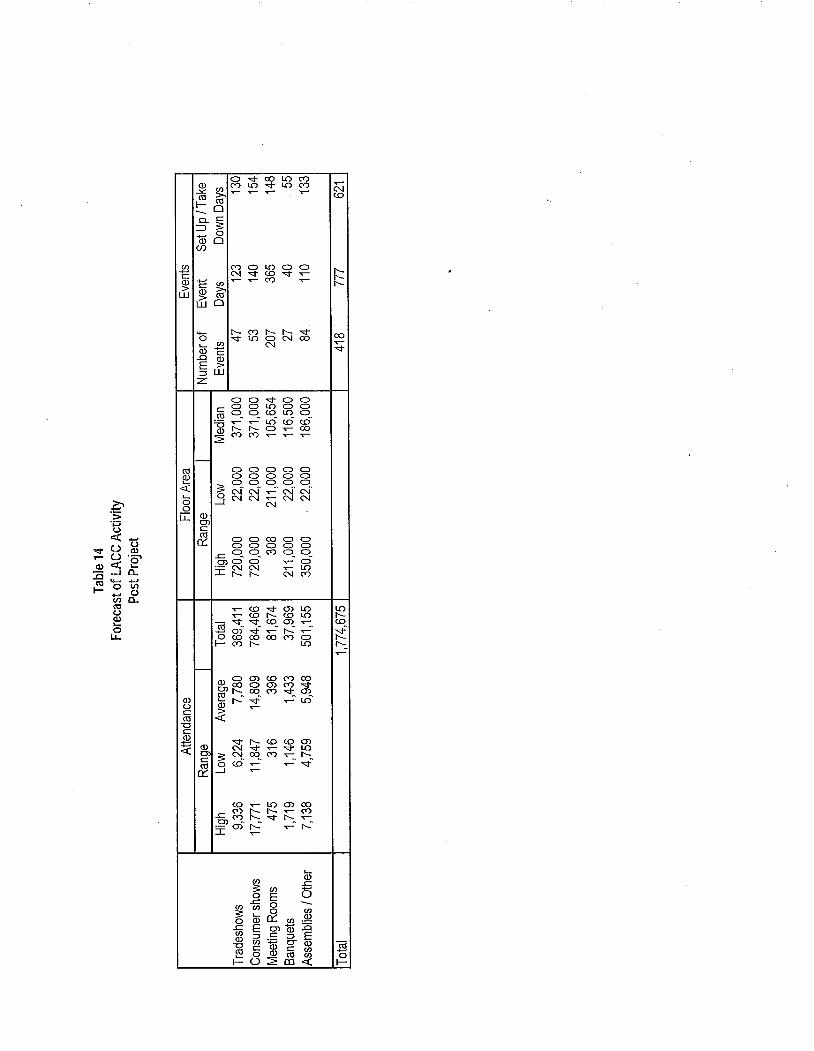
~'S:''¡uo:
." Ü.. Ü~ :sco "-i- ~
vicoucul-eI.
tlcu.Õ'l-e...viee.
o "T co L( ÇfQ) CI Çf L( "T L( Çf.. ~~~-r ~~ CI__ 0g ~ã5 8en
~ ~~in~~g; 1: ~ -r -r (' ~w ~ CIW 0
4- I' Çf I' I' "To "T L( 0 N coL- 2 NQ) i:.. Q)E ~:: WZ
o 0 "T 0 0§88inß8:. ~ ""~ L. (0- (0'"Q) I' I' 0 .. co:2 Çf Çf .. .. ..- o 0 0 0 0o 0 0 0 0o 0 0 0 0;s N. N- ~ N- N-SNNNNN
CI~-:i-oor: ~
i:CIci o 0o 0.. 0_ q
OJ 0 0.- N N:i I' I'
co 0 0o 0 0Çf 0 0..- ò.. L(N Çf
.. CD "T CJ L(
.. CD I' CD L(- "' "T CD CJ ..CI CJ "T- ..- 1'- ..-Õ CD co co Çf 0i- Çf I' L(
-Q)t)i:CI-ci:l Q)-- OJ ;s
i: 0&. -i
Q) 0 CJ CDOJ co 0 CJCI 1'_ co_ Çfi- I' "TQ) .".¿
"T I' CDN "T ."N co Çfin ~."
CD ." L(.. Çf I' I'OJ Çf_ 1'_ "T.- CJ I':i ."
~o..~ ~o Q).. ECI ::Q) CI-c i:~ 0i- 0
Çf coÇf "T"T. CJ.. id
CD CJ"T L(." I'."- "T-
CJ co.. ÇfI' ."~~
CIEo --o CIci CI.~C) 1D :ai: :: E1i g- Q)Q) CI ii:2 in -:
."NCD
I'I'I'
co.""T
L(I'CD-.I'1'_."
i-Q)..Õ
roÕi-
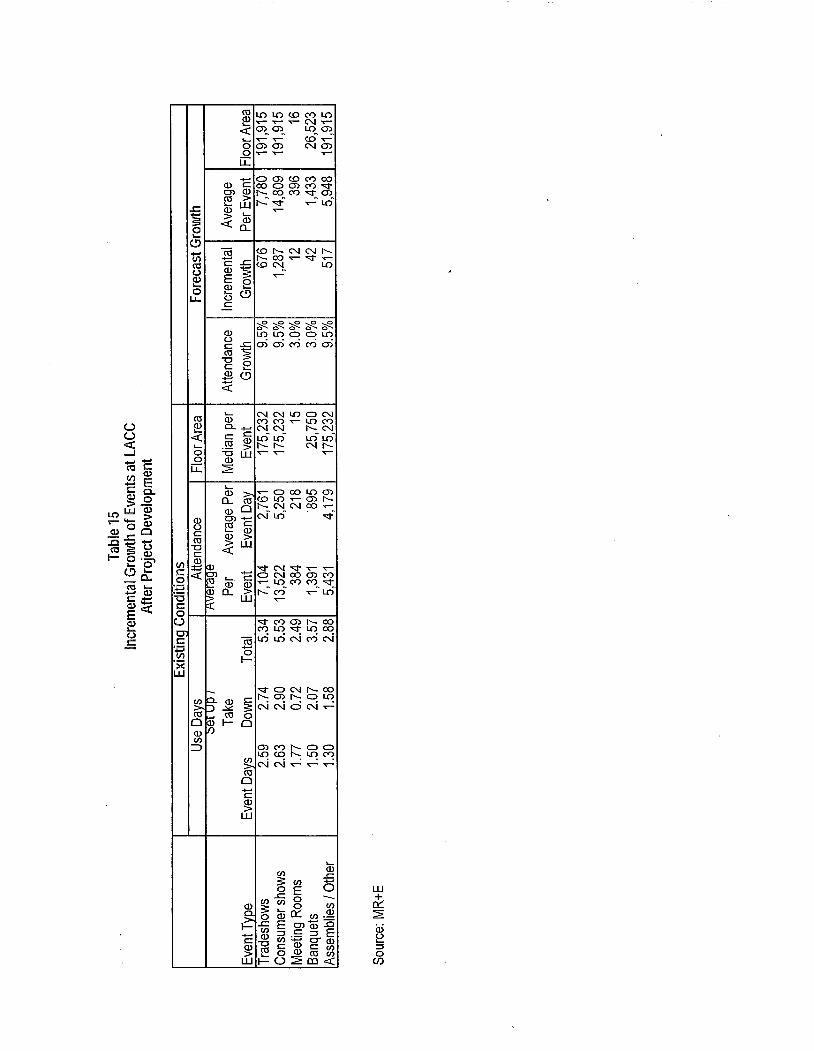
Table 15
Incr
emen
tal G
row
th o
f Eve
nts
at L
AC
CA
fter
Pro
ject
Dev
elop
men
t
Exi
stin
Çl C
ondi
tions
Use
Day
sA
ttend
ance
Flo
or A
rea
For
ecas
t Gro
wth
\:et u
p I
'.;'
Tak
ePe
rAverage Per
Med
ian
per
Atte
ndan
ceIn
crem
enta
lA
vera
ge
Eve
nt T
vpe
Eve
nt D
avs
Dow
nT
otal
Eve
ntE
vent
Dav
Eve
ntG
row
thG
row
thP
er E
vent
Flo
or A
rea
Tra
desh
ows
2.59
2.74
5.34
7,10
42,
761
175,
232
9.5%
676
7,78
019
1,91
5
Con
sum
er s
how
s2.
632.
905.
5313
,522
5,25
017
5,23
29.
5%1,
287
14,8
0919
1,91
5
Mee
ting
Roo
ms
1.77
0.72
2.49
384
218
153.
0%12
396
16
Ban
quet
s1.
502.
073.
571,
391
895
25,7
503.
0%42
1 ,4
3326
,523
Ass
embl
ies
I Oth
er1.
301.
582.
885,
431
4,17
917
5,23
29.
5%51
75,
948
191,
915
Sou
rce:
MR
+E

Addendum
STATEMENT OF ASSUMPTIONS AND LIMITING CONDITIONS
This report is made with the following assumptions and limiting conditions:
Economic and Social Trends - The consultant assumes no responsibility for economic, physical or demographicfactors which may affect or alter the opinions in this report if said economic, physical or demographic factors were notpresent as of the date of the letter of transmittal accompanying this report. The consultant is not obligated to predict futu repolitical, economic or social trends.
Information Furnished by Others - In preparing this report, the consultant was required to rely on informationfurnished by other individuals or found in previously existing records and/or documents. Unless otherwise indicated,such information is presumed to be reliable. However, no warranty, either express or implied, is given by the consultantfor the accuracy of such information and the consultant assumes no responsibility for information relied upon later foundto have been inaccurate. The consultant reserves the right to make such adjustments to the analyses, opinions andconclusions set forth in this report as may be required by consideration of additional data or more reliable data that maybecome available.
Hidden Conditions - The consultant assumes no responsibility for hidden or unapparent conditions of the property,subsoil, ground water or structures that render the subject property more or less valuable. No responsibility is assumed forarranging for engineering, geologic or environmental studies that may be required to discover such hidden or unapparentconditions.
Hazardous Materials - The consultant has not been provided any information regarding the presence of anymaterial or substance on or in any portion of the subject property or improvements thereon, which material or substancepossesses or may possess toxic, hazardous and/or other harmful and/or dangerous characteristics. Unless otherwise statedin the report, the consultant did not become aware of the presence of any such material or substance during theconsultant's inspection of the subject property. However, the consultant is not qualified to investigate or test for thepresence of such materials or substances. The presence of such materials or substances may adversely affect the value ofthe subject property. The value estimated in this report is predicated on the assumption that no such material or substanceis present on or in the subject property or in such proximity thereto that it would cause a loss in value. The consultantassumes no responsibility for the presence of any such substance or material on or in the subject property, nor for anyexpertise or engineering knowledge required to discover the presence of such substance or materiaL. Unless otherwise
stated, this report assumes the subject property is in compliance with all federal, state and local environmental laws,regulations and rules.
Zoning and land Use - Unless otherwise stated, the projections were formulated assuming the hotel to be in fullcompliance with all applicable zoning and land use regulations and restrictions.
licenses and Permits - Unless otherwise stated, the property is assumed to have all required licenses, permits,certificates, consents or other legislative and/or administrative authority from any local, state or national governm.ent orprivate entity or organization have been or can be obtained or renewed for any use on which the value estimatecontained in this report is based.
Engineering Survey - No engineering survey has been made by the consultant. Except as specifically stated, datarelative to size and area of the subject property was taken from sources considered reliable and no encroachment of thesubject property is considered to exist.
Subsurface Rights - No opinion is expressed as to the value of subsurface oil, gas or mineral rights or whether theproperty is subject to surface entry for the exploration or removal of such materials, except as is expressly stated.
Maps, Plats and Exhibits -Maps, plats and exhibits included in this report are for illustration only to serve as anaid in visualizing matters discussed within the report. They should not be considered as surveys or relied upon for anyother purpose, nor should they be removed from, reproduced or used apart from the report.
STATEMENT OF ASSUMPTIONS AND LIMITING CONDITIONS(continued)
Legal Matters - No opinion is intended to be expressed for matters which require legal expertise or specializedinvestigation or knowledge beyond that customarily employed by real estate consultants. \,
Right of Publication - Possession of this report, or a copy of it, does not carry with it the right of publication.Without the written consent of the consultant, this report may not be used for any purpose by any person other than theparty to whom it is addressed. In any event, this report may be used only with proper written qualification and only in itsenti rety for its stated purpose.
Testimony in Court - Testimony or attendance in court or at any other hearing is not required by reason ofrendering this appraisal, unless such arrangements are made a reasonable time in advance of said hearing. Further, unlessotherwise indicated, separate arrangements shall be made concerning compensation for the consultant's time to preparefor and attend any such hearing.
Archeological Significance - No investigation has been made by the consultant and no information has been
provided to the consultant regarding potential archeological significance of the subject property or any portion thereof.This report assumes no portion of the subject property has archeological significance.
Compliance with the American Disabilties Act - The Americans with Disabilities Act ("ADA") became
effective January 26, 1992. We assumed that the property will be in direct compliance with the various detailedrequirements of the ADA.
Definitions and Assumptions - The definitions and assumptions upon which our analyses, opinions andconclusions are based are set forth in appropriate sections of this report and are to be part of these general assumptions asif included here in their entirety. '
Dissemination of Material - Neither all nor any part of the contents of this report shall be disseminated to thegeneral public through advertising or sales media, public relations media, news medi.a or other public means ofcommunication without the prior written consent and approval of the consultant(s).
Distribution and Liabilty to Third Parties - The party for whom this report was prepared may distribute
copies of this appraisal report only in its entirety to such third parties as may be selected by the party for whom this reportwas prepared; however, portions of this report shall notbe given to third parties without our written consent. Liability tothird parties will not be accepted.
Use in Offering Materials - This report, including all cash flow forecasts, market suiveys and related data,conclusions, exhibits and supporting documentation, may not be reproduced or references made to the report or to PKFConsulting in any sale offering, prospectus, public or private placement memorandum, proxy statement or otherdocument ("Offering Material") in connection with a merger, liquidation or other corporate transaction unless PKFConsulting has approved in writing the text of any such reference or reproduction prior to the distribution and filingthereof.
Limits to Liabilty - PKF Consulting cannot be held liable in any cause of action resulting in litigation for any dollaramount, which exceeds the total fees collected from this individual engagement.
Legal Expenses - Any legal expenses incurred in defending or representing ourselves concerning this assignment willbe the responsibility of the client.