to analysts investors group strategy - cloud object …s3.amazonaws.com/zanran_storage/ acid...
TRANSCRIPT
Presentation to Analysts / InvestorsJohnson Matthey Group Strategy
2nd February 2011
Cautionary StatementCautionary StatementThis presentation contains forward looking statements that are subject to risk factors associated with, amongst other things, the economic and business circumstances occurring from time to time in the countries and sectors in which Johnson Matthey operates. It is y pbelieved that the expectations reflected in these statements are reasonable but they may be affected by a wide range of variables which could cause actual results to differ materially from those currently anticipated.

Introduction and Key Strategic OpportunitiesIntroduction and Key Strategic Opportunities
Neil Carson
Chief Executive

JM Executive Board
Neil Carson Robert MacLeodG i iChief Executive Group Finance Director
Larry PentzExecutive Director
Environmental Technologies
Bill SandfordExecutive Director
Precious Metal Products
4

Other Senior Management
Barry MurrerJohn Fowler Jack Frost yDirector
Technology Centre Division DirectorFine Chemicals
DirectorFuel Cells
Nick GarnerGroup DirectorCorporate and
Geoff OttermanDivision Director
Catalysts, Chemicals
John WalkerDivision DirectorEmission Control
Strategic Developmenty
and Refining Technologies
Neil Whitley Ian GodwinNeil WhitleyDivision Director
Process Technologies
Ian GodwinDirector
Investor Relations
Sally JonesPublic Relations Manager
5

Programme
Introduction and Key Strategic Opportunities (Neil Carson)13.30Emissions Legislation, Energy Security and a Low Carbon Economy (Larry Pentz, Jack Frost) 14 00 Coffee break in this session 14.00
Global Drivers for Precious Metal Products (Bill Sandford) Coffee break after this session15.50
Global Drivers for Fine Chemicals (John Fowler)16.35
Further Growth ‐ R&D Focus (Robert MacLeod, Barry Murrer)17 00 Further Growth R&D Focus (Robert MacLeod, Barry Murrer)17.00
Summary and Conclusions (Neil Carson)17.25
Q&A17 40 Q&A17.40
Drinks Reception (Restaurant Sauterelle)18.10
6
Dinner19.00
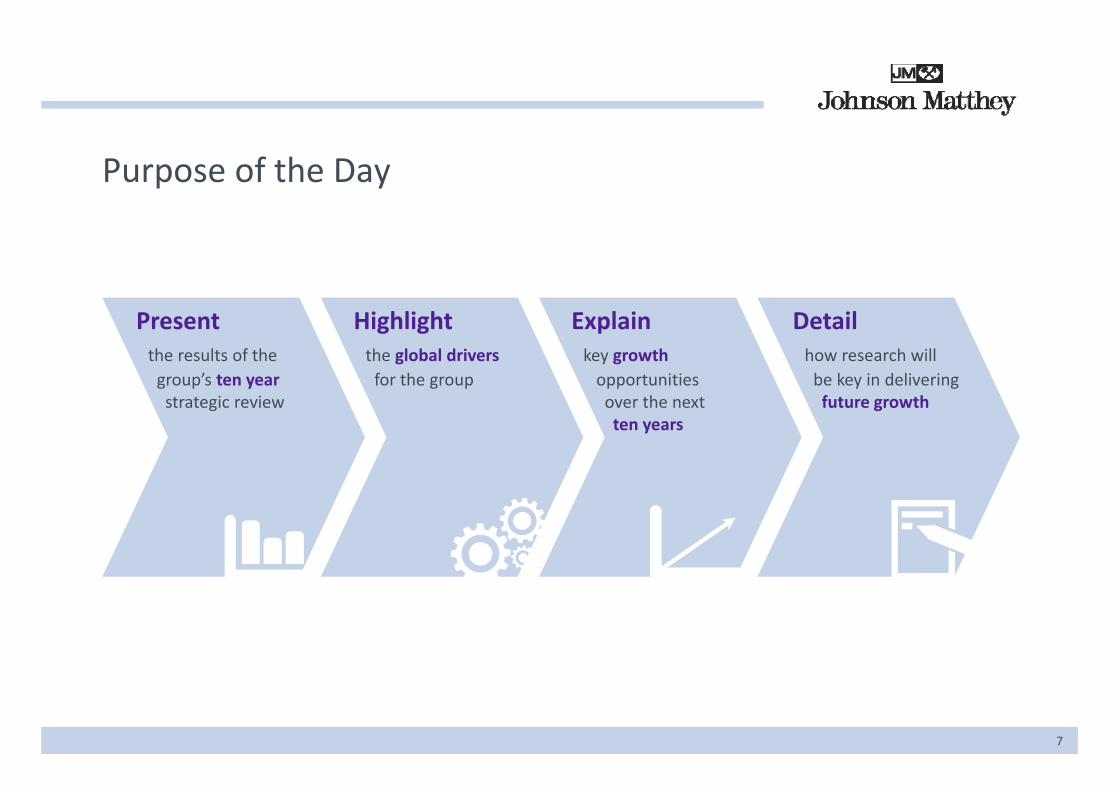
Purpose of the Day
Presentthe results of thegroup’s ten year
Highlightthe global driversfor the group
Explainkey growthopportunities
h
Detailhow research willbe key in deliveringf hstrategic review over the next
ten yearsfuture growth
7

Evolution of the JM Group Sales ex pms
Growth in shareholder value from focus on environmental technologies…
12%2000/01 2009/10
22%
19%
22%5%
45%
£1,886m£977m
66%
31%
8
Environmental Technologies Precious Metal Products Fine Chemicals Other
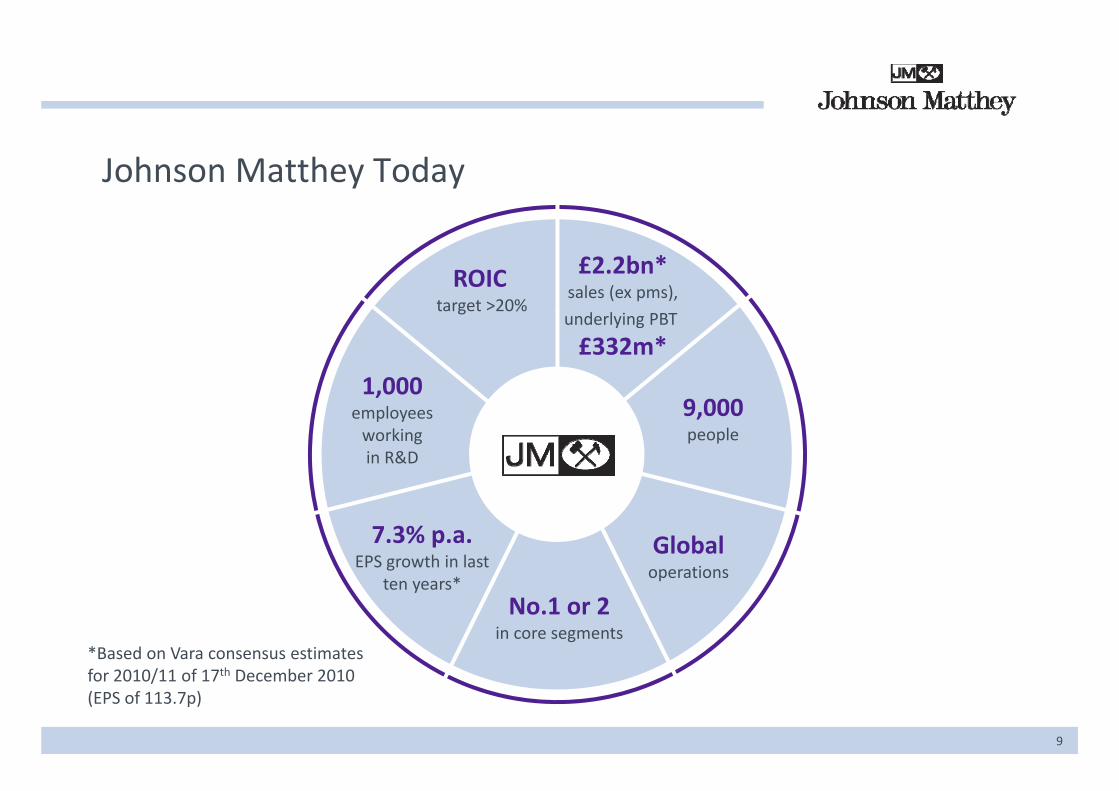
Johnson Matthey Today
£2.2bn*sales (ex pms),
ROICtarget >20%
underlying PBT
£332m*
1,000
target >20%
9,000people
,employeesworkingin R&D
Globaloperations
7.3% p.a.EPS growth in last operations
No.1 or 2in core segments
ten years*
*Based on Vara consensus estimates
9
for 2010/11 of 17th December 2010 (EPS of 113.7p)

JM Attributes
Environmentalfocus,Significant barriers
• Common features of a successful JM businessfocus,
regulatory driven
Focus on core
gto entry• Provides focus for future investment
N t th l d t i t f d JM b i chemistry, pgms
and catalysis
Leading industrypositions with highmargin products
Peopleand
culture
• Not the sole determinant of a good JM business
A leading technology based company
Goodunderstanding ofmarkets and
Differentiationthrough
technology
cultureA leading technology based company
customersInvestment intechnologyand productdevelopment
technology
10

JM’s Key Strengths
Expertise in the fundamental Deep involvement in and Ability to maximise synergiesExpertise in the fundamental science that underpins our technologies
• Catalysis, materials chemistry, t h l
Deep involvement in and understanding of pgms • Expertise spanning refining, pgm
chemistry, market dynamics
Ability to maximise synergies • E.g. complementary offering of DPT
technologies and JM’s process catalysts
nanotechnology, pgms
Trusted partner with customers, regulators etc.
Reputation
• Fundamental understanding of what our products do for our customers –enables us to make better products
• Regulatory understanding, materials h dl ll d
11
handling – managing pgms, controlled substances

Global Drivers Impacting the Chemical Industry*
Population Growth Health & Nutrition Natural
Resource
Environmental Factors
Cli ChUrbanisation
Increasing Wealth Ageing Population
Resource Constraints
Climate Change
Regulation
DevelopingEconomies
DevelopedWorldEconomies World
12
* Based upon key megatrends identified by Goldman Sachs Global Investment Research

Global Drivers Impacting the Chemical Industry
EmissionAutomotive
Emission control catalysts
Population Growth
Urbanisation
ElectronicsObscuration enamels
Urbanisation
Increasing Wealth Construction Pgms
PetrochemicalBulk chemicals
Petrochemical catalysts and processes
13

Global Drivers Impacting the Chemical Industry
APIsAPIs
Medical t
Health & Nutrition
Ageing Population
components
Ammonia synthesis and
it i id
Pharma‐ceuticals
Ageing Population nitric acid catalysts
Finechemicals
Agricultural chemicals
chemicals
Pgmcatalysts
14
catalysts

Global Drivers Impacting the Chemical Industry
Energy security Gas / coal to
products technology
NaturalResource
Resource efficiency
technology
Catalysts
Constraints Alternative energy
Pgmrefining
Recycling
15

Global Drivers Impacting the Chemical Industry
Emission control
Emission control catalysts
Purification products
Environmental Factors
Climate ChangeClean fuel
catalysts
Abatement technologies
Fuel cellsClimate Change
RegulationLow carbon Hydrogen
catalysts
Carbon capture and storagestorage
16

Global Drivers Impacting the Chemical IndustryPgm
Automotive ElectronicsEmission control catalysts
Obscuration enamels
APIs Medical components
catalysts
Health & Nutrition
Ageing Population
ConstructionBulk
chemicals
catalysts
Pgms
Petrochemic‐al catalysts
and processes
Pharma‐ceuticals
Agricultural Chemicals Ammonia
synthesis and nitric acid catalysts
Finechemicals
Population Growth
Urbanisation Ageing Population
Environmental
Increasing Wealth
l Factors
Climate Change
Regulation
Energy security
Alternative energy
Gas / coal to products technology
Emission control
Clean fuelEmission control catalysts
Abatement technologies
d P ifi i
NaturalResource Constraints
Resource efficiency
RecyclingCatalysts Pgmrefining
Low carbonHydrogencatalysts
Purification products
Carbon capture and Fuel cells
17
storage (CCS)
Fuel cells
JM attributes deliver superior growth

Our Strategy to Deliver Growth in ValueKey Elements Unchanged
Continued core focus Maintain Strong position in Primary focus is
Pt
Continued core focus on leading edge catalysis driven by:
Maintain differentiation through technology
Strong position in pgms remains an intrinsic part of group
Primary focus is organic growth
• Ever improving air quality
• Energy security
• Enhanced investment in R&D in core markets
• Sustainability
• Development in emerging markets
18
emerging markets

Our Strategy to Deliver Growth in ValueIncreased Emphasis on:
Developing new JM attributes Manufacturing People and cultureDeveloping new opportunities underpinned by our core chemistry
JM attributes
• Provides focus for investment and growing new business
Manufacturing excellence
• High technology, high ffi i
People and culture
• Globalisation drives integration of cultures
core chemistry expertise
• Materials science and f h
growing new business efficiency
surface chemistry
19

Our Strategy – Looking Forward
fi fi ki f h h dFor first five years:
• Strength in core segments anticipated to deliver double digit growth in group sales (ex pms)
Looking further ahead:
• Good opportunities in existing segments
• Step change in development of fuel cell market• Higher growth in catalyst segments
• Mid to high single digit growth in other businesses
• Step change in development of fuel cell market
• New opportunities through R&D
• Some growth in EBITDA margins (ex substrates)
20

Our Strategy – Looking Forward
ffIncrease total R&D spend:
Existing businesses
• Up from £100m p a to £135m p a to
Capital efficiency remains embedded:
• ROIC target >20%
• Net debt (incl pension) / EBITDA between 1 5 to• Up from £100m p.a. to £135m p.a. to extend technology advantage
Targeting new opportunities
• Net debt (incl. pension) / EBITDA between 1.5 to 2.0 times
• Average capital expenditure 1.2 to 1.3 times depreciation
• Initially up to £5m p.a.
• New structure in place
• New £200m p a business in ten years
depreciation
• New £200m p.a. business in ten years
21

Our Strategy – Sustainability and Manufacturing Excellence
By 2017:
Achieve carbon neutralityAchieve a zero ‘greater than three day accidents’ safety target
Achieve zero waste to landfill
accidents safety target
Implement ISO 14001 at all manufacturing sites by 2010
Halve key resources consumed per it f t t
sites by 2010
Reduce annual incidence of occupational ill b t l t 30% b 2013/14unit of output illness cases by at least 30% by 2013/14
22

Summary
i j l b l d l f h fStrategy review emphasised attributes and t th f JM
Major global trends provide strong drivers for growth
Key elements of strategy unchanged
Further focus on growth through R&D
strengths of JM
Group well positioned for long term growth
23

24

Emissions Legislation, Energy Security and a Low Carbon Economy
Larry Pentz
Executive Director, Environmental Technologies

Key Strategic Opportunities – Emissions, Energy and Low CarbonA convergence of trends supports an environmental strategy…
Global Trends Resulting Focus
• Growing populationEmissions Regulations
• Growing population
• Increasing wealth
• Urbanisation
• Global warming
• Shifting energy sources
Low Carbon Economy
Energy Security
• Respiratory health concerns
creating a ‘sweet spot’ for JM technology
26
…creating a sweet spot for JM technology

Emissions RegulationsEmissions Regulations

Legislation Drives Growth
Emission control
Emission control catalysts
Purification products
• ~50% JM sales ex pms driven by legislation
Environmental Factors
Climate ChangeClean fuel
catalysts
Abatement technologies
Fuel cells
• Tighter legislation still to come
• Substantial growth over Climate Change
RegulationLow carbon Hydrogen
catalysts
Carbon capture and storage (CCS)
next five years
storage (CCS)
28
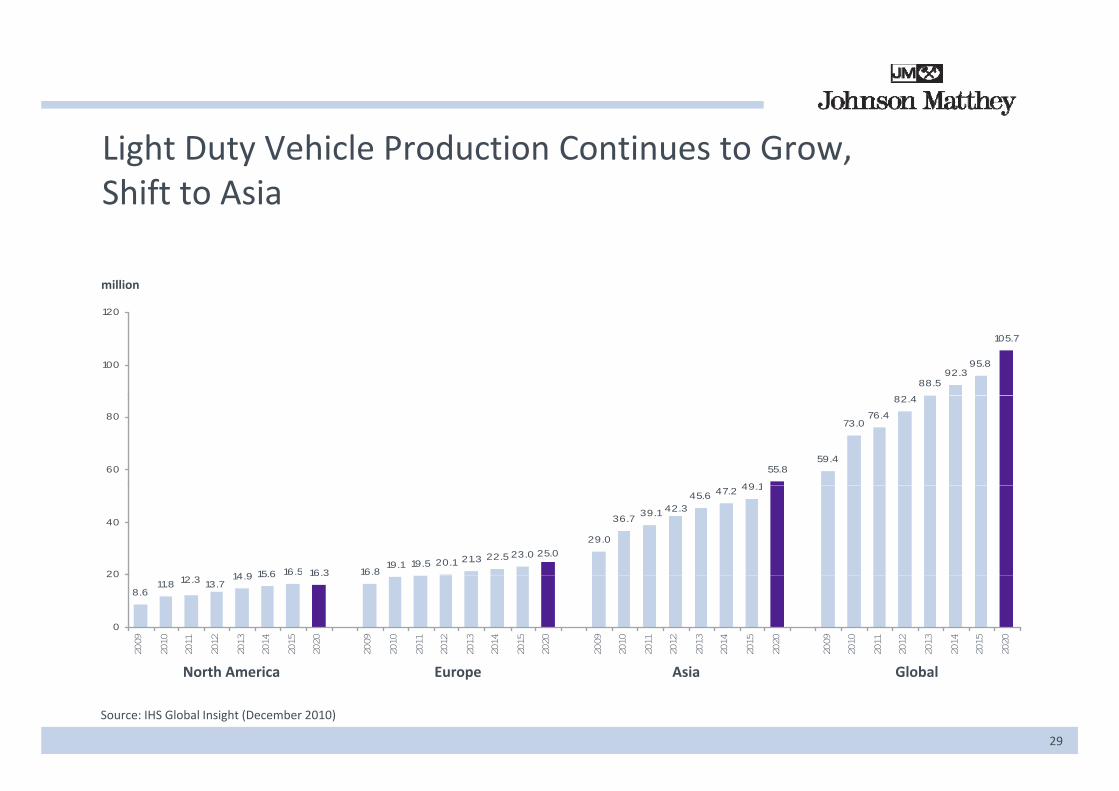
Light Duty Vehicle Production Continues to Grow, Shift to Asia
million
88.592.3
95.8
105.7
100
120
49 1
55.859.4
73.076.4
82.4
60
80
14 9 15 6 16.5 16.3 16.819.1 19.5 20.1 21.3 22.5 23.0
29.0
36.7 39.1
45.6 47.2 49.1
25.0
42.3
20
40
8.611.8
14.9 15.6 16.313.712.3
0
20
2009
2010
2011
2012
2013
2014
2015
2020
2009
2010
2011
2012
2013
2014
2015
2020
2009
2010
2011
2012
2013
2014
2015
2020
2009
2010
2011
2012
2013
2014
2015
2020
29
North America Europe Asia
Source: IHS Global Insight (December 2010)
Global

New and Tighter Regulations Across the World
EU Euro 6Euro 4 Euro 5
Light Duty 2007 2008 2009 2010 2011 2012 2013 2014 2015 2016
Russia
United States LEV III
United States ‐ Cal.
Brazil
LEV IIILEV II
Tier II
Euro 3 Euro 4
EU
Euro 3 Euro 5Euro 2 Euro 4
Euro 6Euro 4 Euro 5
Brazil
Japan
South Korea Diesel
South Korea Gasoline
China ‐ Taiwan Euro 4Euro 3 Euro 5
Japan 2005
Euro 4 Euro 5 Euro 6
Japan 2009
Euro 3 Euro 4
KULEV LEV II
China ‐ Taiwan Euro 4
China ‐ Beijing
China ‐ Other
Australia Euro 3
Malaysia
Euro 3 Euro 5
Euro 3 Euro 4 Euro 5
Euro 5
Euro 4
Euro 3 Euro 4
Euro 2 Euro 4Malaysia
Thailand
India ‐ Cities
India ‐ National
Indonesia Euro 2 Euro 4
BS IVBS II BS III
Euro 2 Euro 4
BS V
Euro 3 Euro 4
BS III BS IV
30
Indonesia Euro 2 Euro 4

Tighter Regulations Drive Increased Value
• Lower pollution levels 250
Euro 3Gasoline
• Particulate number legislation
• More stringent in‐use compliance
M d i t t l d100
150
200
HC (m
g/km
)
Euro 3
Euro 4
• More dynamic test cycle proposed
• Current and future standards for ROW 0
50
0 20 40 60 80 100 120 140 160NOx (mg/km)
Euro 5/6
Diesel
40
50
60
g/km
)
Euro 3• Requires improved catalyst technology
0
10
20
30
PM (m
g
Euro 6
Euro 5
Euro 4
100 200 300 400 500 600
31
00
NOx (mg / km)0 100 200 300 400 500 600

OEMs have Options to Achieve Regulations
• Number of catalysts (or volume) / vehicle will vary
• Powertrain vs emission control cost trade off
• Tighter regulations require improved catalyst technology
L l di i i d t l t t h l• Lower pgm loading requires improved catalyst technology
• Wide range of catalyst value per vehicle
• Ensures continued catalyst value growth
32

Light Duty Diesel – A European Market
• Particulate matter is a major concern
• Potential of markets outside Europe?
• Tightening regulations add additional catalysts:
Urea
Euro 4: Oxidation catalyst (DOC)
DOC
Euro 5: DOC plus diesel particulate filter (DPF)
DOC DPF
Euro 6: DOC + DPF plus NOx control
DOC DPF SCR
33

Additional Greenhouse Gas Regulations Provide Further Opportunities
• CO2 – a new pollutantPowertrain Development
Additional Catalyst Value
• A product of combustion
• Cannot be catalytically transformed
C b d d b
Development Catalyst Value
Smaller powered engines
Hybrid
X
• Can be reduced by:
• Consumer decisions – smaller powered engines
• Powertrain development
Hybrid
Direct injection
Turbocharging
• Will require emission control modifications
g g
Start / stop
New engine technologies • Will require emission control modifications
• Net benefit in catalyst value Electric vehicles X
34

OE O R d M k tHeavy Duty Diesel
OE On Road MarketHeavy Duty Vehicle Volumes Will Grow But with Annual Volatility
No. of Vehicles (>6t)
million
3
4
million
2
0
1
Western Europe USA Japan / Korea India / China / Brazil Rest of World
0
2005 2010 2015
35
Source: JD Power and IHS Automotive

O R d R l ti D l tHeavy Duty Diesel
On Road Regulation DevelopmentTighter Regulations – New Countries, Additional Vehicles
New Models All ModelsEuropeEuro IV 01‐Oct‐05 01‐Oct‐06
0.025
0.03
W‐hr)
JP 05
EU V (2008)
Euro V 01‐Oct‐08 01‐Oct‐09Euro VI 31‐Dec‐12 31‐Dec‐13United StatesUS 2007 01‐Jan‐07US 2010 01‐Jan‐10US 2014? 01 Jan 14
0 01
0.015
0.02
Emission
s (g/kW EU V (2008)
EPA 07
EPA 10
EPA 07
US 2014? 01‐Jan‐14JapanNew Long Term 01‐Oct‐05Post New Long Term 01‐Oct‐09JP16 01‐Oct‐16China
0.005
0.01
0 0 5 1 1 5 2 2 5
PM
JP 09EU VI(2014)
JP 16JP16
0
Beijing – Euro V 2012Rest of country – Euro IV 2013IndiaBS IV – Major cities 2010BS IV – Nationwide 2014South Korea0 0.5 1 1.5 2 2.5
NOx Emissions (g/kW‐hr)‐
South KoreaEuro V 01‐Jul‐09 01‐Jul‐10RussiaEuro IV 01‐Jan‐10 01‐Jan‐12BrazilEuro V 2012
36

Increased Value with Tightening Regulations
• Engine management and emission control trade offs
• Alternative choices but increasing catalyst value per vehicleg y p
DOC
US 04
Retrofit
Tier 4A
SCRT®
US 2010
Euro VI
CRT®/CCRT®
US 07
Tier 4A
SCR
Euro IV
Euro V
Tier 4A
37
Tier 4A Tier 4A
A $2.5bn Market by the end of 2015
2,000
2,500Non‐road, <56kW
Non‐road, 56‐130kW
Non‐road, 130‐560kW
Brazil
1 000
1,500
x pm
s $ million India
China
Russia
Japan & Korea
Eastern Europe
500
1,000
Sales e
x Eastern Europe
Western Europe
North America
0
2005 2006 2007 2008 2009 2010 2011 2012 2013 2014 2015
38
Source: JD Power and JM estimates

Technology Investment to Keep Pace with Growth
R&D dimensions: Investment in:• 5% sales ex pms
• Eight R&D facilities
• 50 test cells globally
• Applied research in materials
• Catalyst formulation design
• OEM specific application development• 50 test cells globally
• 500 R&D people (11% of ECT)
• OEM specific application development
• Manufacturing techniques
More efficient Lower pgm usage Combination of Greater focus on
Development of:
catalysts technologies ‘in‐use’ emissions
39

\Emissions Regulations – Further Tightening to Come
Cars US LEV III
EU 7
Trucks
ROW Catch Up
Next US HDD
Non‐road Tier 4B
EU VII
ROW Catch Up
Other
Non‐road Stage V PM Number
US Locomotive Tier 4
IMO Tier III Marine
Discussions occurring, Focus on NOx and Secondary pollutants to Further emphasis on in
IMO Tier III Marine
2016 2017 2018 2019 2020
40
timing not fixed particulate control be added use compliance

Emissions Regulations – Opportunities for Process Technologies
H O
O2H2
H2O
S
Global tightening of sulphur levels in
Methanol substitution in
Alternative fuel mandates
Oil refining discharge limits
And for fuel cells –zero emission
fuels transportationfuels
e.g. SOx, NOx, Hg vehicle requirements
• Biofuels, naturalgas, GTL diesel etc.
41

Tightening Regulations Drives Hydrogen Market
• Low sulphur fuel, heavier oil, diesel demand drive h d
Share of Market Growth by Region(72 7 billi bi t )hydrogen
• Hydrogen demand increases, particularly in Asia
• Hydrogen installed catalyst market of $800m
(72.7 billion cubic meters)
US10.6%
y g y $– averages $200m p.a.
• Expect hydrogen market growth of 6 to 8% p.a. over next five years
OtherAsia / Pacific
All Other31.5%
y29.4%
WesternEurope6.5%• 35% average market share today
China22.0%
35% average market share today
• Strong presence in Asia
• Good relationships with major industrial gas li
42
suppliers Source: Freedonia Group Inc.

Emissions Regulations – Summary
• Legislation drives growth
• Vehicle volumes expected to be up in both light and heavy duty vehicles
• Fuel efficiency requirements offer new opportunities
Ti ht l i l ti id dd d l f JM• Tighter legislation provides added value for JM
• Substantial growth over next five years
43

Energy SecurityEnergy Security

Opportunities in Energy Drive Growth
Energy security
Resource
Gas / coal to products technology
• ~10% JM sales driven by natural resource utilisation
NaturalResource Constraints Alternative
efficiency
Catalysts
• Energy security concerns result in increased interest in coal / gas to products
energy
Recycling
Pgmrefining
• Double digit sales growth over next five years
Recycling
45

More Value from Coal
• Coal is an abundant and key strategic resource Proved Reserves at end 2009(Th d illi t )
• Primarily used to produce electricity and for industrial consumption
• Energy consumption growing in China
(Thousand million tonnes) (anthracite and bituminous coal shown in brackets)
gy p g g
• Power generation technology improving
• New processes use coal as substitute for natural gas and oil
Middle East 1.4 (1.4)S. and Cent. America 15.0 (7.0)Africa 32.0 (31.8)North America 246.1 (113.3)A i P ifi 259 3 (155 8)
46
Source: BP Statistical Review of World Energy 2010
Asia Pacific 259.3 (155.8)Europe and Eurasia 272.2 (102.0)

Increase in Useable Natural Gas Reserves
• Rapid deployment of new drilling technique
• Projected shale gas will supply 40% of US gas by 2020
• Shale formations found around the world
• Improved natural gas transport infrastructure
• Gas pricing decoupled from oil
• Growth potential as a feedstock for chemicals pand fuels
47
Source: EIA

Coal, Gas and Biomass to Products
T i f l
SteamReforming
Transportation fuel
Traditional markets (refineries)
Traditional markets (formaldehyde etc.)
Water Gas Shift
Hydrogen
Methanol
Ammonia
Gasoline blending
Olefins
Propylene
Methanol
Gasifierpy
DME
Diesel
Sour Shift
Fischer‐Tropsch
PipelineSubstitute Natural Gas
(SNG)
Wood Crops AlcoholFuels
LandfillGas
Garbage
48
Fuels Chemicals / Refineries

Alternative to Oil Based Feedstocks
• Substitute for transportation fuels
• Alternative routes to petrochemical products
• Trade off between financial cost and reduced imports
• Development and growth of process technology and catalysts
49

Methanol Demand Remains Significant in China
• Shift towards energy Demand for Methanol2005 2015E
‘000 tonnes
• Fuel blending – M5, M15, M85, M100
• Methanol to Olefins now proven (Shenhua)
Gl b l th l i t ll d t l t k t f
2005 – 2015E40,000
35,000
30,000
25 000• Global methanol installed catalyst market of $400m – averages $100m p.a.
25,000
20,000
15,000
10,000
Asia North America South America Europe Rest of World China
5,000
02005 2006 2007 2008 2009 2010E 2011E 2012E 2013E 2014E 2015E• 45% average market share today
• China focusing on larger more efficient plants• China focusing on larger more efficient plants
• Well positioned with new market leading JM Apico catalyst and technology
Source: MMSA
50
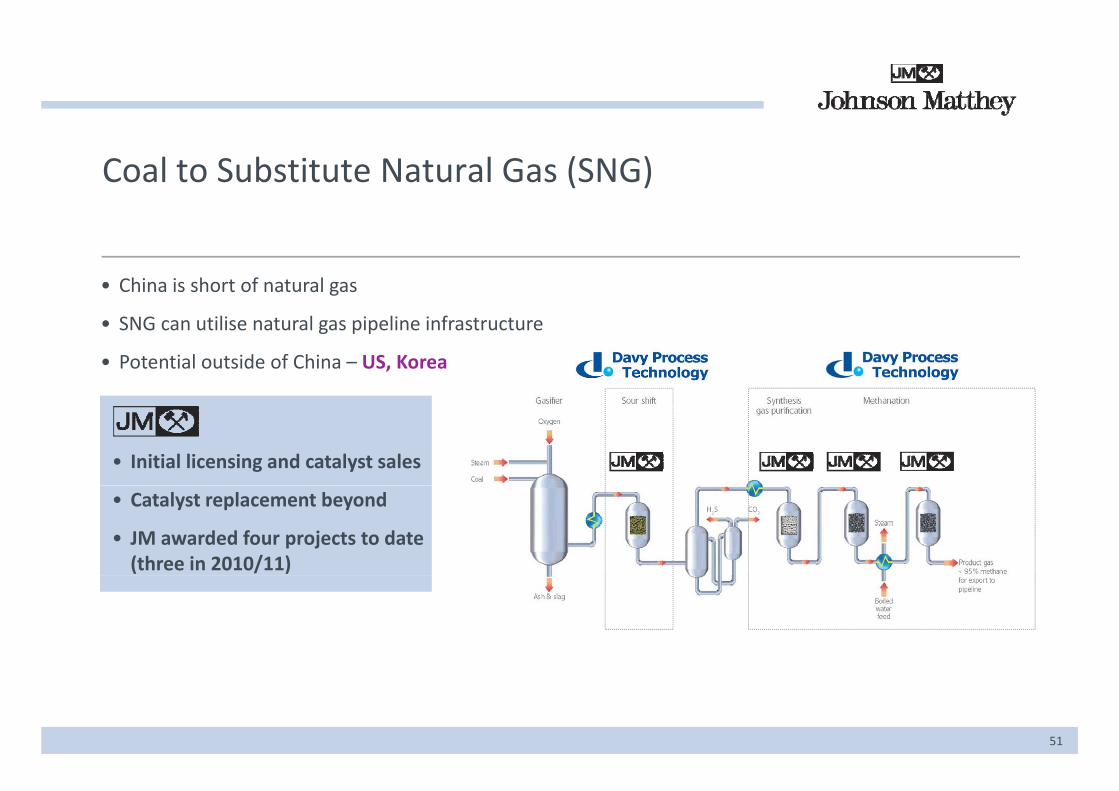
Coal to Substitute Natural Gas (SNG)
• China is short of natural gas
• SNG can utilise natural gas pipeline infrastructure
• Potential outside of China – US, Korea
• Initial licensing and catalyst sales
• Catalyst replacement beyond
• JM awarded four projects to date (three in 2010/11)
51

Energy Security Drives Growth for Process Technologies
• Coal to substitute natural gas (SNG)
• Coal to methanol
• Coal / gas to liquids and compact GTL
I d i d ifi ti• Increased gas processing and purification
• Biomass conversion
• Double digit growth over next five years
52
Photo courtesy of Shenhua

Low Carbon EconomyLow Carbon Economy

New Opportunities from a Low Carbon Economy
Emission control
Emission control catalysts
Purification products
• Developing markets – some early commercialisation
Environmental Factors
Climate ChangeClean fuel
catalysts
Abatement technologies
Fuel cells
• Technologies play to JM’s strengths
• Potentially large markets Climate Change
RegulationLow carbon Hydrogen
catalysts
Carbon capture and storage (CCS)
e.g. fuel cells
storage (CCS)
54

Low Carbon Economy
JM has a range of core technologies which will develop over the next five years…
E d C b d G h R bl d l
CCS C
Energy and resource efficiency• Advanced gas heated
f
Carbon capture and storage• Syngas technology for
b i d
Greenhouse gas abatement • New markets for N2O
b l
Renewable and low carbon energy technologies
reformer
• Process and catalyst improvements
precombustion and capture
abatement catalyst
• Coal methane abatement t h l
• Advanced biofuels technology and catalysts
• Fuel cell vehiclestechnology • Silver inks for
photovoltaics
• Fuel cells for CHP l
55
applications

The Low Carbon Economy Fuel CellsThe Low Carbon Economy – Fuel Cells
Jack Frost Director, Fuel Cells

Fuel Cells
O2H2
H2O
Fuel cells JM and fuel cells Fuel cells and cars
22
Fuel cells
• A clean efficient electricitygeneration technology
JM and fuel cells
• Targeted the key catalytic components of the fuel cell –themembrane electrode
Fuel cells and cars
• Electric cars set to grow in importance driven by:
• Central to the development of the low carbon economy, reducing urban emissions and providing energy diversity and
the membrane electrode assembly (MEA) as our primary product
• Strong parallels with our
• Zero emission regulations
• Decarbonisation of the transport sector
security
• Good fit with JM core skills in catalysis, technology and precious metals and with our
vehicle emission control catalysis business
• Energy security
57
precious metals and with our strategic focus

The Nature of Electric Cars
HElectric cars Batteries are an Consensus1 that electric Hydrogen supply
H2Electric cars • Quiet, very efficient and non‐polluting at the point of use
Batteries are an important technology for electric cars but…
• Limited range, heavy,
Consensus1 that electric vehicle fleet will be a combination of…
• Plug in hybrid electric
Hydrogen supply infrastructure • Cheaper than a battery charging infrastructure
• Electricity can be produced from a variety of fuels including low carbon fuels
Limited range, heavy, long refuelling times
g yvehicles (PHEV) with an internal combustion engine (ICE)
B tt l t i hi l
• Only a small fraction (5%) of the total cost of ownership of a FCEV
carbon fuels • Battery electric vehicles (BEV)
• Fuel cell electric vehicles (FCEV)
58
1 A portfolio of power trains for Europe – a fact based study, McKinsey 2010
http://www.iphe.net/docs/Resources/Power_trains_for_Europe.pdf
( )

Power Train Costs Converge Rapidly
1
Total Cost of Ownership – excluding taxEUR/km
0.8
1
C/D SEGMENTFCEVBEVPHEV
0.6
ICE
0.2
0.4
02010 2015 2020 2025 2030
Ranges based on data variance and sensitivities (fossil fuel prices varied by +/‐ 50%; learning rates varied by +/‐ 50%)
Source: McKinsey
59

Fuel Cells for Larger Cars and Longer Journeys
Lowest Cost CO2 Abatement Solution in 2050
Battery electric
<10
Battery electric vehicle
10 ‐ 20
Increasing annual driving distance
>20
(1,000km)
A/B C/D J
Fuel cell electric vehicle
Increasing car sizeSource: McKinsey
60

Fuel Cell Costs – McKinsey 2010Fuel cell stack cost EUR per fuel systemFuel cell stack costEUR/kW
EUR per fuel systemC/D segment
800 781
14,274
81,362
MEA (excl. catalyst, incl GDLs)
~90%
600
50022,228
6,296
14,274incl. GDLs)
Catalyst (incl. platinum)
Structure
200
400
252
38 565
18,8927 475Periphery
221
42 1602010 2015 2020
98110
43
38,565
9,516
3,2123,1942,970
2010 2015 2020 2050
7,475
4,306
Periphery-42%
FCEV units (installed cumulative number)
~1,000 ~100,000 ~1,000,000FC stack lifetime (‘000km) 115 180 247 290
Platinum use (g/kW) 0.93 0.44 0.24 0.11
Ø Fuel cell stack cost EUR/kW 500 110 431 million cars = ~0.1% of global car fleet
61
Source: McKinsey
Min 221 42 16
Max 781 252 98

Size of Merchant MEA Car MarketValue of Car MEA Market (ex pms)
25
15
20
ns
10
15
Euro billion
5Cumulative
1m FCEV 2020
0
2010 2015 2020 2025 2030 2035 2040 2045 2050 2055 2060
62
Year
Source: McKinsey

What is JM doing about this Opportunity?
• Fuel cell technology investment
l h l
• Provides revenue and learning by doing
h f h• Catalysis technology is critical
• Participation in early fuel cell markets
• In the next decademany of these markets are as large as cars
63

Today’s Markets – Stationary CHP
• Hydrogen generated in‐situ using a range of fuels: natural gas, renewable gas etc.
• Enables clean, quiet, pollution free power generation on a scale from 1kW to MWs
• Large units for combined heat and power for hospitals hotels and• Large units for combined heat and power for hospitals, hotels and banks. Commercial sales in the US and Korea
• Fuel cells can be scaled to give power to individual houses (or smaller offices clinics etc )(or smaller offices, clinics etc.)
• Large government funded programmes underway in Japan and Korea
• First commercial sales underway in US
• Large homes in California with expensive electricity
• Forecast a rapid expansion into worldwide markets as costs reduce
64
Forecast a rapid expansion into worldwide markets as costs reduce

Markets – Direct Methanol (DMFC)
Readily available fuel, especially at small scale enabling commercial portable devices now
Leisure• Recreational vehicles, leisure craft,
t bi
Military• Infantry men, unmanned craft
Electronics• Near term – stand alone chargers
ff i i tremote cabins
• Dissatisfaction with batteries, solar and wind
• Noise and pollution of IC generators
• US infantryman carries >20kg batteries
• Low weight, long run times, fast ‘recharging’
offering mains autonomy
• Possible future products have significant potential
• Battery / fuel cell hybrid laptops, portable electronics, cellphones
65

The Fuel Cell MEA business in 2020
MEA market size >£1 billion 1,800
£ million
excluding pgm
Cars are important but so are other1,400
1,600
1,800
Cars are important… but so are other markets
All k t i idl800
1,000
1,200
All markets growing rapidlysupported by global trends and advancing technology
200
400
600
JM positioned to participate in each of these markets
0
200
2018 2019 2020 2021 2022
Cars Electronics Small back‐up and Portable
66
Cars Electronics Small back up and Portable
Other mobile Stationary / CHP

67

Key Strategic Opportunities – Emissions, Energy and Low Carbon
• Emissions regulations – a growing global vehicle market with tightening regulationsmarket with tightening regulations
• Energy security – strong interest to get more value from coal and natural gas
L b d i bli CO i h
Emissions Regulations
• Low carbon – desire to stablise CO2 in the atmosphere using novel low carbon technologies
Low Carbon Economy
Energy Security
• All require high technology catalytic solutions
• JM well placed• JM well placed
• Significant growth potential
68

6969

Global Drivers for Precious Metal ProductsGlobal Drivers for Precious Metal Products
Bill Sandford
Executive Director, Precious Metal Products

Global Drivers Impacting the Chemical IndustryPgm
Automotive ElectronicsEmission control catalysts
Obscuration enamels
APIs Medical components
catalysts
Health & Nutrition
Ageing Population
ConstructionBulk
chemicals
catalysts
Pgms
Petrochemic‐al catalysts
and processes
Pharma‐ceuticals
Agricultural Chemicals Ammonia
synthesis and nitric acid catalysts
Finechemicals
Population Growth
Urbanisation Ageing Population
Environmental
Increasing Wealth
l Factors
Climate Change
Regulation
Energy security
Alternative energy
Gas / coal to products technology
Emission control
Clean fuelEmission control catalysts
Abatement technologies
d P ifi i
NaturalResource Constraints
Resource efficiency
RecyclingCatalysts Pgmrefining
Low carbonHydrogencatalysts
Purification products
Carbon capture and
Fuel cells
71
storage (CCS)
Fuel cells

Sales Excluding Precious Metals
Manufacturing Precious Metal Services 2009/10
35%
• Noble Metals
• Colour Technologies
• Pgm trading and marketing
• Precious metal
£420m
• Catalysts and Chemicals
• Precious metal refining
65%
Manufacturing Services
72
Our Manufacturing Businesses
Account for 65% or ~£270m of division’s sales ex pms
• A wide range of products / applications
• 19 manufacturing sites worldwide
• Investing in manufacturing excellence / product innovation
• All businesses have good ROIC
• Some mature products with limited growth potential• Some mature products with limited growth potential…
• …other products impacted by global drivers have good growth potential
73

Global DriversManufacturing Businesses
Global Drivers End Uses
Ageing PopulationAutomotive
g g p
Climate Change
Nutrition
Nutrition
Growing WealthHealthcareHealthcare
74

Automotive
Products End Uses Sales by Product Group
8%• Glass obscuration enamels
• Conductive tracks
• Auto glass protection
• Heated rear glass
33%53%• Pgm alloys
• Pgm wire / powder
• Spark plug tips
• Engine sensors
£85m
6%
Pgm wire / powder
• Pgm salts
Engine sensors
• Autocatalysts 6%
Enamels and Conductive TracksPgm Alloys / Wires / Powder
Pgm Salts• Base metal catalysts • Plastics / polymers
Base Metal Catalysts
75

Automotive
Accounts for £85m (31%) sales ex pms
P lt ld t All th d t A i bi t th CAGR 10% l
( ) p
Pgm salts sold to internal (ECT) and external customers
All other products sold to external customers
Asia biggest growth area
CAGR 10% sales ex pms
76

Nutrition
Products End Uses Sales by Product Group
43%
• Pgm catalysts
• Base metal catalysts
• Fertilisers
• N2O abatement
57%
43%
• Nickel catalysts
• Pgm scavenger
• Edible oils / sweetners
• Food spoilage inhibitor
£30mPgm scavenger Food spoilage inhibitor
Fertilisers Catalysts / ScavengersAccounts for £30m (11%) sales ex pms
>10% CAGR sales ex pms
77
>10% CAGR sales ex pms
Nutrition
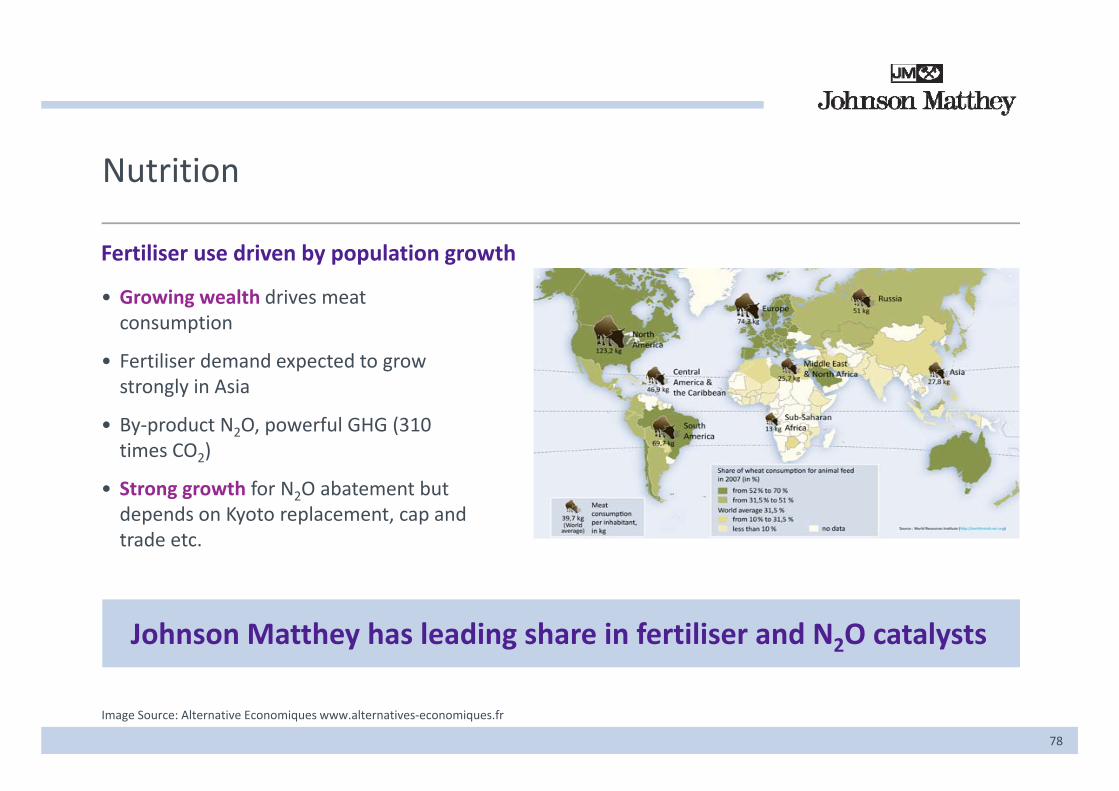
Fertiliser use driven by population growth
• Growing wealth drives meat gconsumption
• Fertiliser demand expected to growstrongly in Asiag y
• By‐product N2O, powerful GHG (310 times CO2)
• Strong growth for N O abatement but• Strong growth for N2O abatement but depends on Kyoto replacement, cap and trade etc.
Johnson Matthey has leading share in fertiliser and N2O catalysts
78
Image Source: Alternative Economiques www.alternatives‐economiques.fr
Nutrition
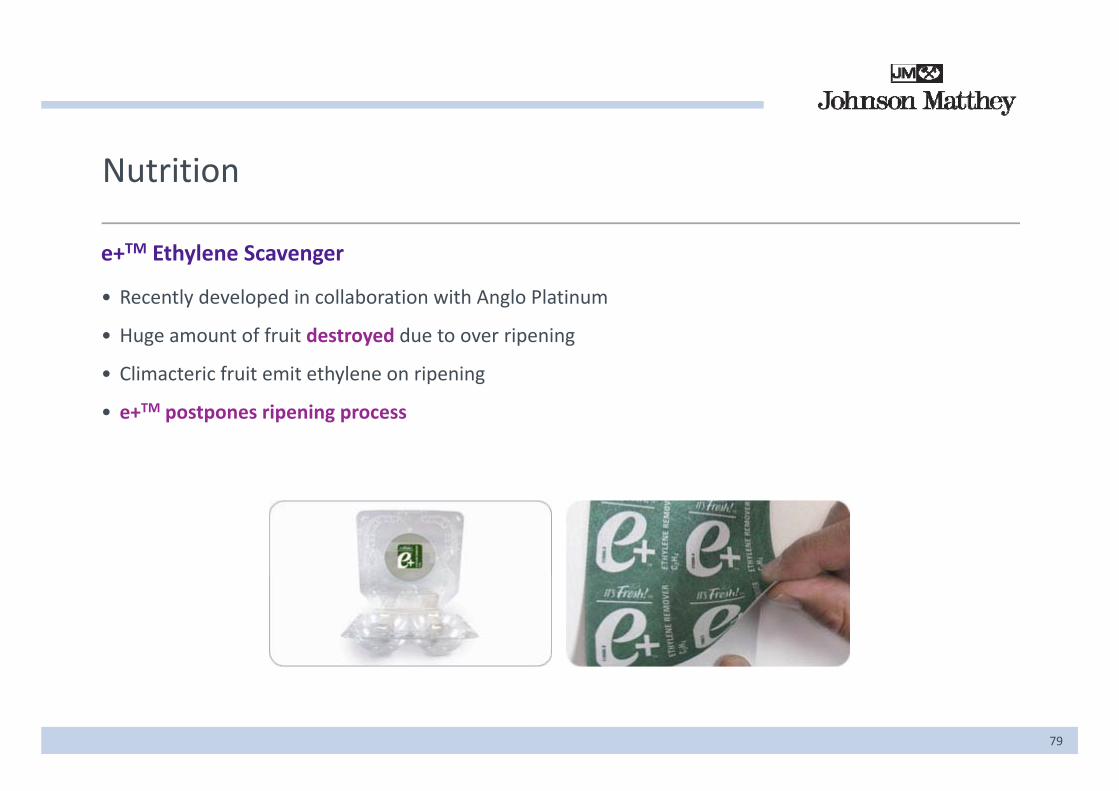
e+TM Ethylene Scavenger
• Recently developed in collaboration with Anglo Platinumy p g
• Huge amount of fruit destroyed due to over ripening
• Climacteric fruit emit ethylene on ripening
• e+TM postpones ripening process
79

Health and Personal Care
Products End Uses Sales by Product Group
19%• Pt alloys • Medical device components
46%• Pgm catalysts • Eyecare
• Pharma APIs £65m
35%• Base metal catalysts • Personal care items
Pt Alloys
Pgm Catalysts
B M t l C t l t
Accounts for £65m (24%) sales ex pmsBase Metal Catalysts
80

Health and Personal Care
Demand for medical products driven by growing population…
• …and also ageing population in wealthy countries
• Largest market for medical devices is USA
• Other markets growing quickly• Other markets growing quickly
• Demand for APIs largely in West
• Demand and manufacturing moving East
• CAGR 9% sales ex pms
81
Precious Metal Services
Accounts for 35% or £150m of division’s sales ex pms
Provides service to Johnson Matthey group and its
t
Volume growth will (largely) reflect growth in market / J h M tth
Profitability influenced by pgm prices
customers
• 65% of group sales are pgm based
Johnson Matthey group sales
• Pgm trading and marketing
• Precious metal refining
82
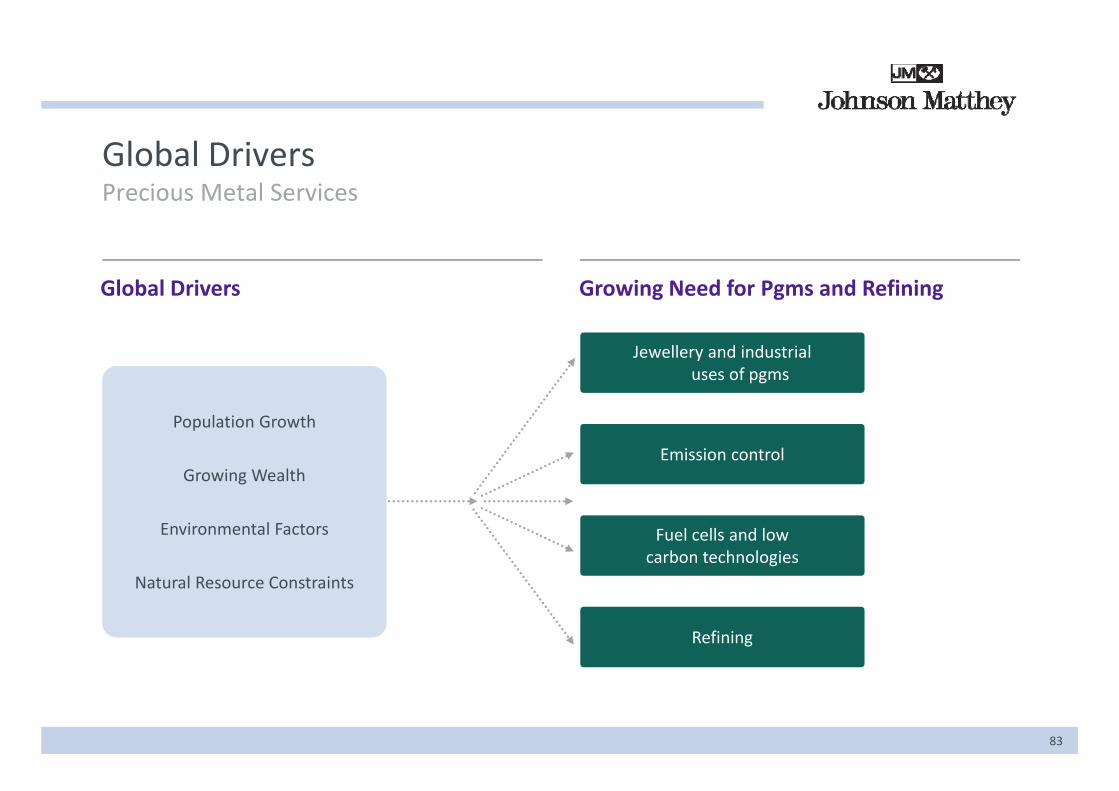
Global DriversPrecious Metal Services
Global Drivers Growing Need for Pgms and Refining
Jewellery and industrialuses of pgms
Population Growth
Growing Wealth Emission control
Environmental Factors Fuel cells and lowcarbon technologies
Natural Resource Constraints
Refining
83
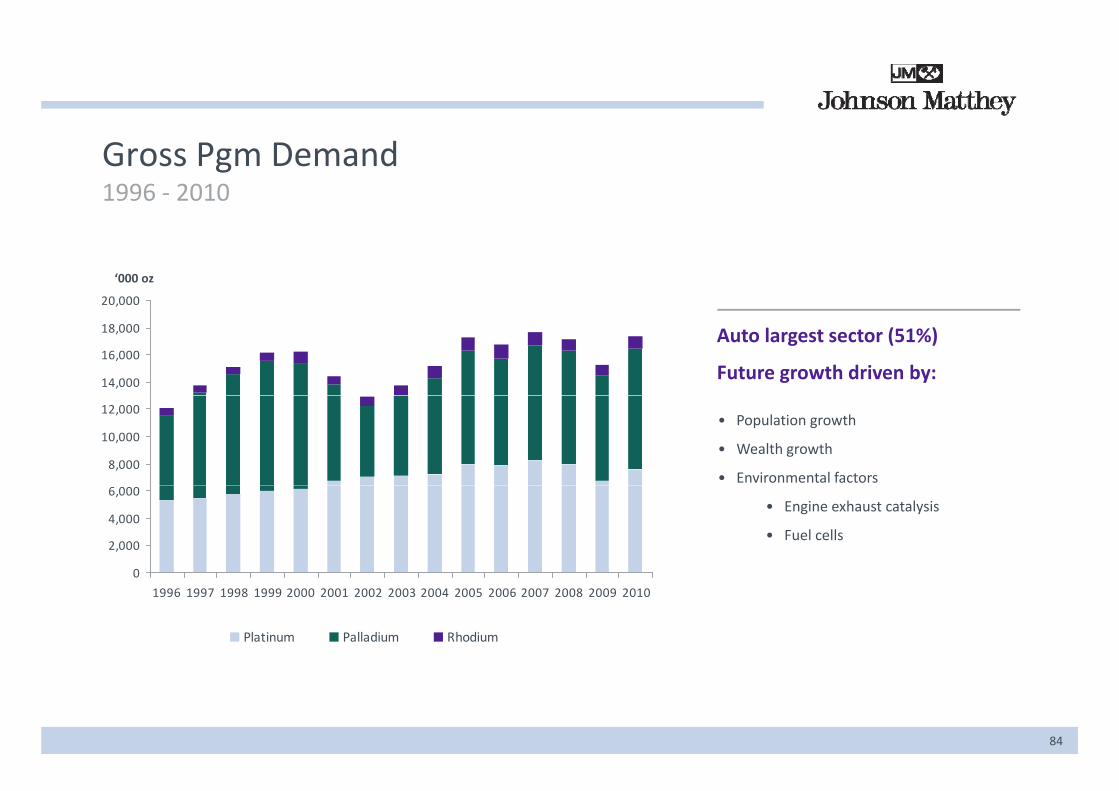
Gross Pgm Demand 1996 ‐ 2010
20,000
‘000 oz
14,000
16,000
18,000
,
Auto largest sector (51%)
Future growth driven by:
Heavy D t
8,000
10,000
12,000• Population growth
• Wealth growth
• Environmental factorsDuty
Diesel Off Road
0
2,000
4,000
6,000• Engine exhaust catalysis
• Fuel cells
0
1996 1997 1998 1999 2000 2001 2002 2003 2004 2005 2006 2007 2008 2009 2010
Platinum Palladium Rhodium
84
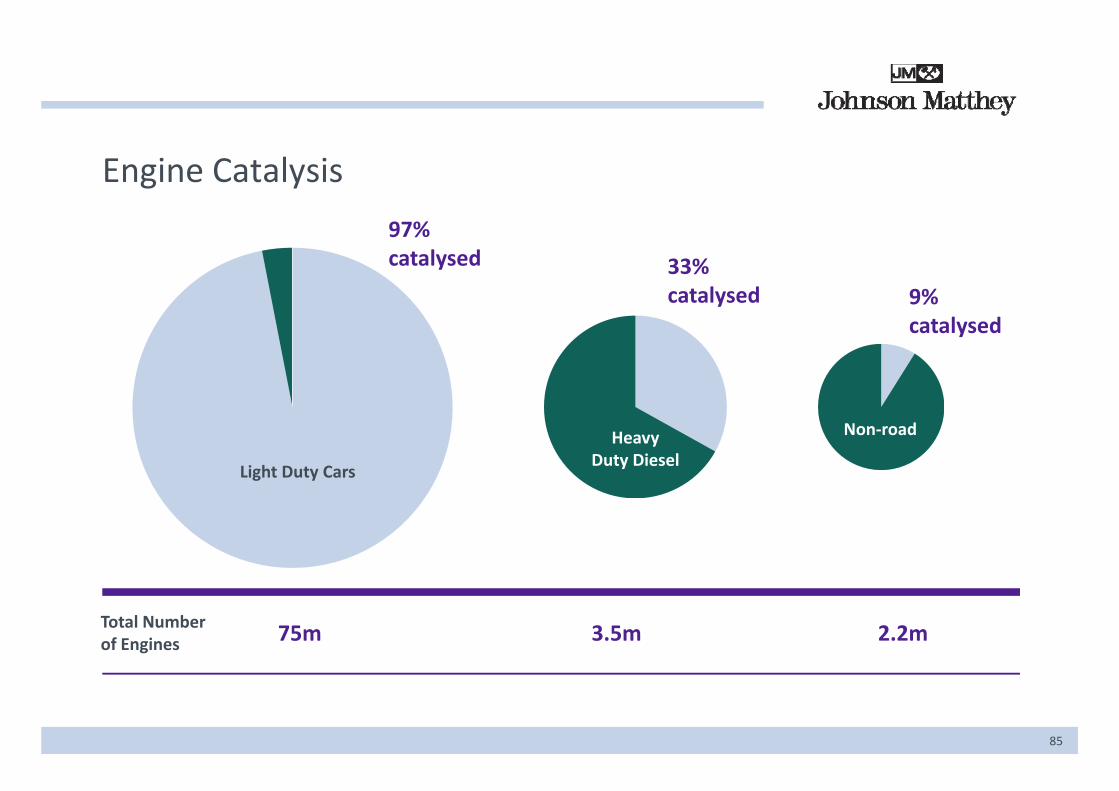
Engine Catalysis
97%catalysed 33%
catalysed 9%ycatalysed
Light Duty Cars
HeavyDuty Diesel
Non‐road
Total Number of Engines 75m 3.5m 2.2m
85

Pgm Trading and MarketingPlatinum Demand in Fuel Cells 2001 ‐ 2010
18
20
Pt ozs ‘000
12
14
16
6
8
10 Non‐auto
Auto
0
2
4
2001 2002 2003 2004 2005 2006 2007 2008 2009 2010
Fuel cell loadings* significantly higher than ICE (4‐5g):
2001 2002 2003 2004 2005 2006 2007 2008 2009 2010
Early signs of market traction
Pt demand sensitive to fuel cell car penetration
• 84g in 2011
• 40g in 2017
• 22g towards 2050
• 10g beyond 2050
86
* Based on McKinsey study

Pgm Trading and MarketingPlatinum Supply‐Demand
7 000
Pt ozs ‘000
5,000
6,000
7,000
RSA main producer
Significant reserves
2,000
3,000
4,000
• Higher capex
• Rising operating costs
RSA mines having to deal with:
0
1,000
2,000
2000 2001 2002 2003 2004 2005 2006 2007 2008 2009 2010
• New mining legislation
2000 2001 2002 2003 2004 2005 2006 2007 2008 2009 2010
RSA Supply ROW Supply Demand
87
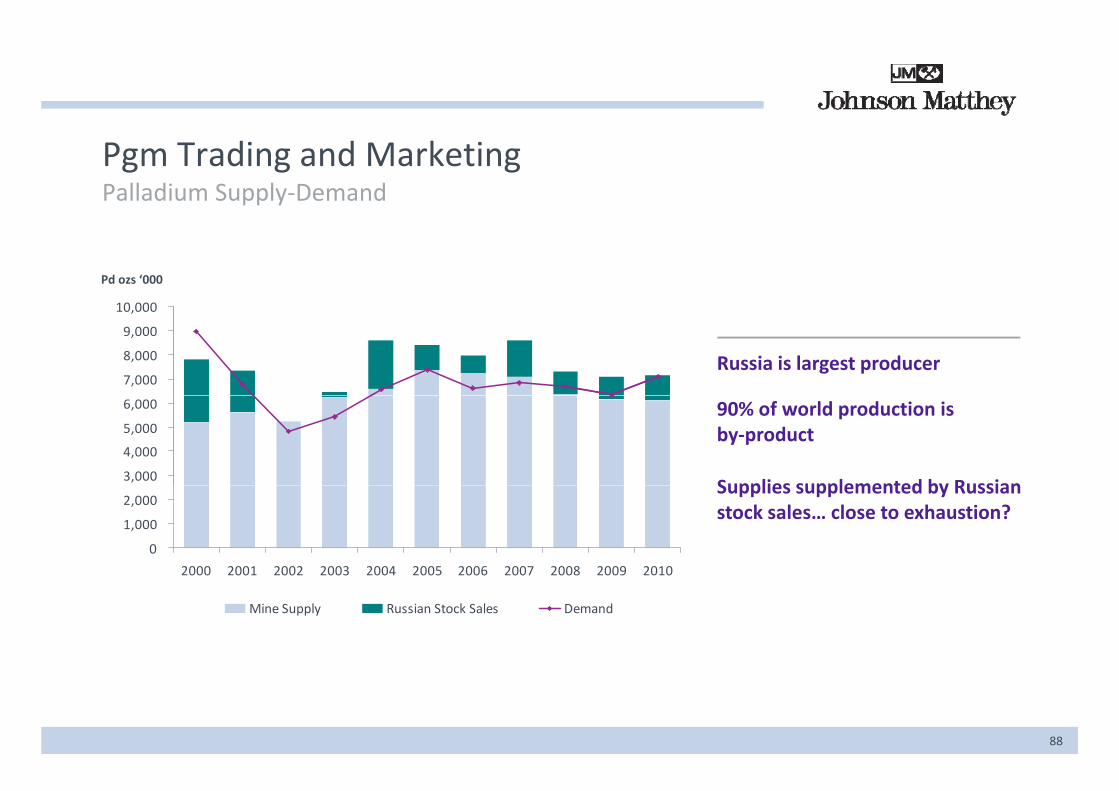
Pgm Trading and MarketingPalladium Supply‐Demand
10 000
Pd ozs ‘000
7,000
8,000
9,000
10,000
Russia is largest producer
3,000
4,000
5,000
6,000 90% of world production is by‐product
Supplies supplemented by Russian
‐
1,000
2,000
2000 2001 2002 2003 2004 2005 2006 2007 2008 2009 2010
Supplies supplemented by Russian stock sales… close to exhaustion?
0
2000 2001 2002 2003 2004 2005 2006 2007 2008 2009 2010
Mine Supply Russian Stock Sales Demand
88

Pgm Refining
O h“High grade” refineries in UK and USA
Primary25%
Other8%• Two key sectors
• JM product customers 25%
JM Product Customers
32%
• Autocat recycling
• Profitability strongly influenced by pgm price movements
Autocat Scrap35%
Outputs: Pt 45t p.a. Pd 50t p.a.
89
Outputs: Pt 45t p.a. Pd 50t p.a.

Conclusions
f d d i l S iManufactured Products
• Key products with strong drivers
• Double digit growth in sales
Precious Metal Services
• Global drivers support growing demand for pgms
• Volume growth to reflect Johnson Matthey sales /• Double digit growth in sales
• Some mature products with limited growth potential
• Volume growth to reflect Johnson Matthey sales / total market
• Profitability impacted by pgm prices
• Average sales ex pms CAGR in high single digits
90


Global Drivers for Fine Chemicals
John Fowler
Division Director, Fine Chemicals

Global Drivers Impacting the Chemical Industry
APIsAPIs
Medical t
Health & Nutrition
Ageing Population
components
Ammonia synthesis and
it i id
Pharma‐ceuticals
Ageing Population nitric acid catalysts
Finechemicals
Agricultural chemicals
chemicals
Pgmcatalysts
93
catalysts

Global Trends Driving Fine Chemicals’ Strategy
Global Trends
• Ageing population
Resulting In
• Generics will continue to grow double digit over
• Longer life expectancies
• Economic development (BRIC)
the next ten years
• Emerging markets will see strong growth in pharmaceuticals
• Expanded access to healthcare
• Drive to lower cost medicines• Fine Chemicals’ leading global position in narcotic based pain therapy will benefit
94

Key Business Strengths in Fine Chemicals
Advantage through broad skills in chemistry
Investment in R&D and technology• Critical mass in API
development through
Leading market share in key therapeutic areas• Pain therapy• Attention Deficit and
Highly regulated markets with significant barriers to entry
Pharma Services Hyperactivity Disorder (ADHD)• Drug addiction treatment• Platinum oncologics
Focused niches targeting higher margin APIs, 20%+
Strong customer relationships with both brand and generic companies
Diverse and flexible manufacturing capability
Outstanding record of regulatory compliance
95
generic companies

The Global Pharma Market
Market
$530bn
Market
$800bn
$30bn
Pharmaceuticals Small Molecule Pharmaceuticals
Small MoleculeAPI
96
Source: IMS, Datamonitor, Business Insights, Pollak, Kalorama, LCM M&I
Strategic Focus – Niche APIs
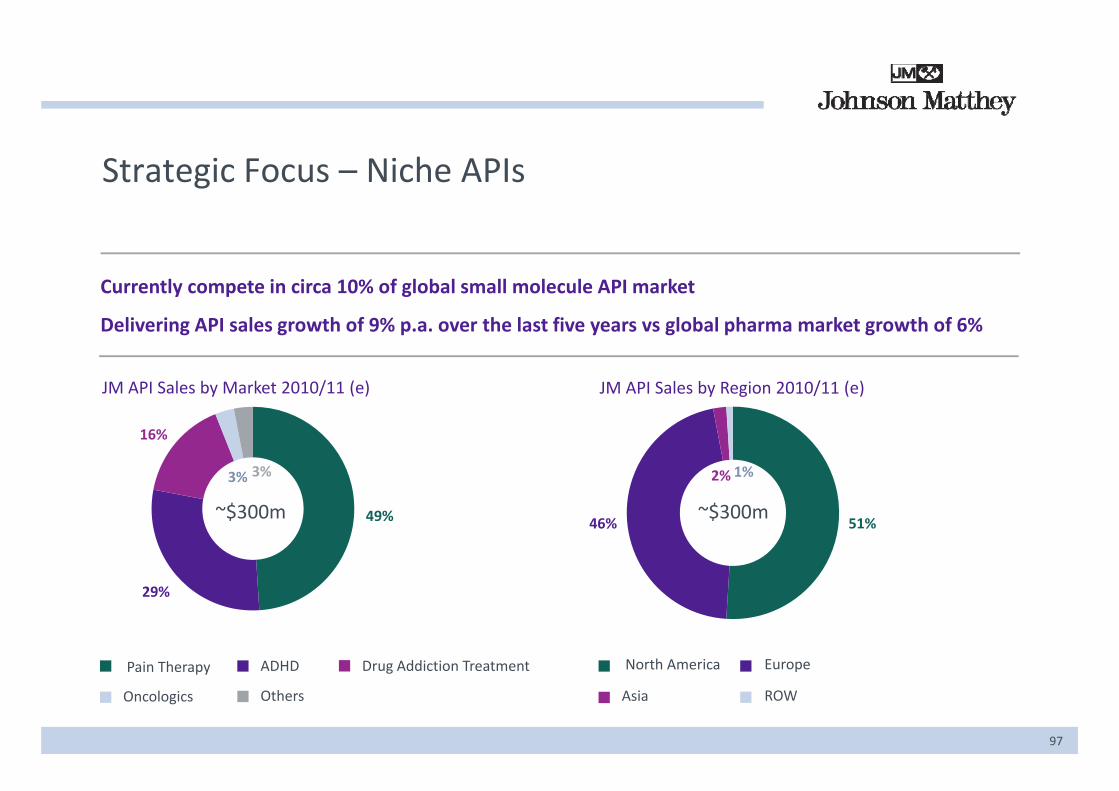
Currently compete in circa 10% of global small molecule API market
Delivering API sales growth of 9% p.a. over the last five years vs global pharma market growth of 6%
JM API Sales by Market 2010/11 (e) JM API Sales by Region 2010/11 (e)y / ( ) y g / ( )
16%
3%3% 2% 1%
49% 46% 51%~$300m~$300m
Pain Therapy ADHD Drug Addiction Treatment North America Europe
29%
97
Pain Therapy ADHD Drug Addiction Treatment
Oncologics Others
North America Europe
Asia ROW

Strategic Focus – Global Pain Therapy
Significant barriers to entryHi hl l t d k t
Opiates Consumption 2008 by Region Percentages in parentheses refer to share of global population• Highly regulated markets
• Tight control over import / export of narcotics
Percentages in parentheses refer to share of global population
North America3 % ( %)
ROW( )Globally a key therapeutic area
• Codeine third leading therapy class in the US
• Ageing population in the West increasing demand
35% (5%)19% (43%)
Growth in emerging markets• Pressure from WHO to make pain medication more freely available
Emerging12% (45%)
freely available
Opiate API market to accelerate from 4% CAGR to 6% over the next ten years
Europe34% (7%)
98
Source: INCB, IMS and JM dataEmerging markets are China, India, Brazil, Russia, Mexico, Turkey and South Korea

Global API Market Share by Volume – Opiatesl l b
Covidien18%
Weifa‐Norway
Rhodes12%
Alcaliber1%
JM Regional Market Shares
USA 5%
T fi EU 34%Others4%
Chattem1%
3%
Top five EU 34%
Rest of EU 41%
Latin America 16%
Johnson Matthey25%
4%
ROW 4%Noramco18%
Siegfried2%Francopia
13%
FCC2%
HSK1%
99
Source: NRM‐INCB Annual Report 2009
13%

Strategic Focus – Generics
• Leadership in terms of volume and growth
Total Prescriptions Dispensed (USA) %
90%
100%
and growth
• Government healthcare reforms
%
11
46 50 54 58 63 66 6975 80
50%
60%
70%
80%
• Insurance bias towards generic usage
• Current market forecast to grow in rket Share
43 40 37 33
1110
99
99
87
620%
30%
40%
50%gexcess of 10% p.a. M
ar37 33 28 26 23 18 14
6
0%
10%
2004 2005 2006 2007 2008 2009 2010 (e) 2015 (e) 2020 (e)
Brands Branded Generics Unbranded Generics
• Circa 80% of current JM sales to generic markets
• Ability to leverage R&D for first to file
100
Brands Branded Generics Unbranded Generics
Source: IMS and JM estimates
y gopportunities

Strategic Focus – Emerging Markets
• Current CAGR of 15% is forecast to continue at similar rates through to 2014
Global Sales’ Trends
900
1,000
18.0
20.0
at similar rates through to 2014
• Economic development will drive use of pharmaceuticals
600
700
800
12.0
14.0
16.0pharmaceuticals
• Pain therapy is under utilised in emerging markets Growth forecast at least 15% n
(bars)
Grow
th rate
300
400
500
6.0
8.0
10.0markets. Growth forecast at least 15%CAGR
Sales US $b
at const $ (line
0
100
200
2004 2009 2010 (f) 2014
0.0
2.0
4.0
es)
101
2004 2009 2010 (f) 2014
Global Sales Global Emerging MarketsSource: IMS Health Market Prognosis, JM estimatesEmerging markets are China, India, Brazil, Russia, Mexico, Turkey, and South Korea

China – Significantly Underserved Narcotics Pain Market
• Only 22 narcotic drugs available in China vs 123 in the West
Illustrative Morphine Per Capita Consumption Between China and Other Countriesvs 123 in the West
• Narcotic consumption has more than tripled over the last five years albeit
China and Other Countries (grams / million population)
70,000 66,000tripled over the last five years, albeit from a low base
• Historical reticence to the use of opiates 40,000
50,000
60,000
37,000• Historical reticence to the use of opiates is changing
• China pharmaceutical growth at 20%20,000
30,000
40,000 ,
China pharmaceutical growth at 20%
0
10,000
China France USA
1,000
102
• Hebei Aoxing JV established
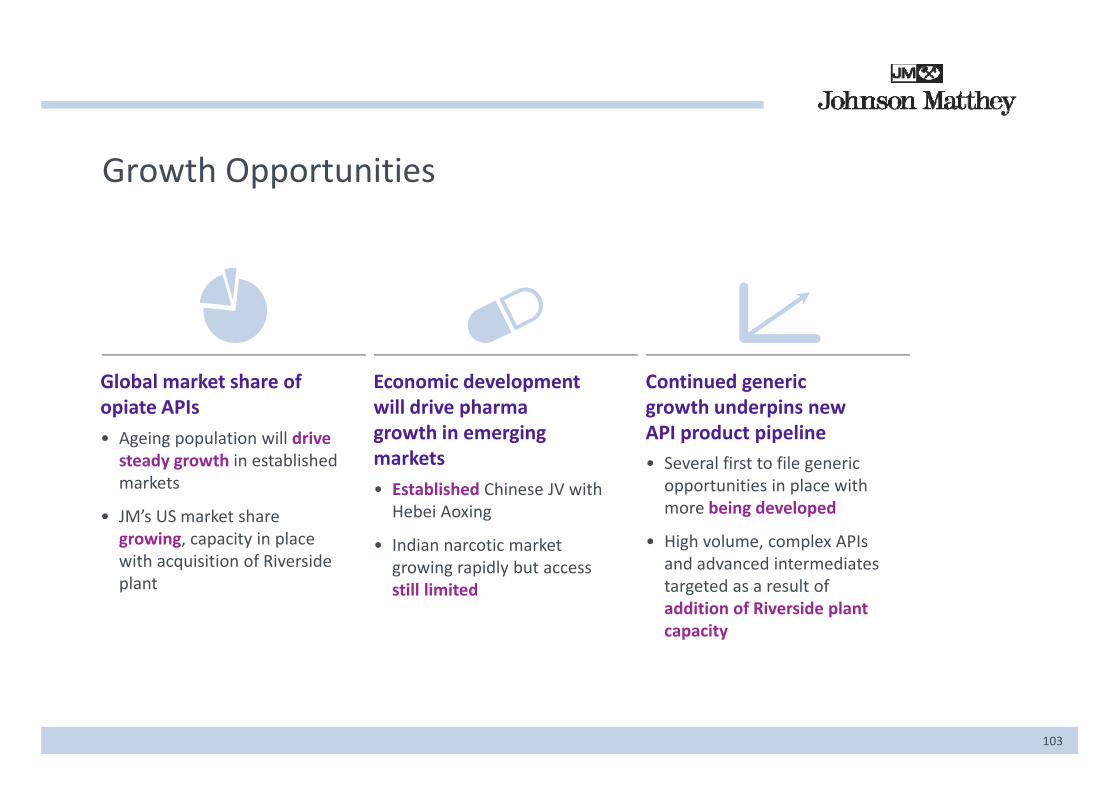
Growth Opportunities
Global market share of Economic development Continued generic opiate APIs• Ageing population will drive steady growth in established markets
will drive pharma growth in emerging markets E t bli h d Chi JV ith
growth underpins new API product pipeline• Several first to file generic opportunities in place withmarkets
• JM’s US market share growing, capacity in place with acquisition of Riverside
• Established Chinese JV with Hebei Aoxing
• Indian narcotic market growing rapidly but access
opportunities in place with more being developed
• High volume, complex APIs and advanced intermediates
plantg g p ystill limited targeted as a result of
addition of Riverside plant capacity
103
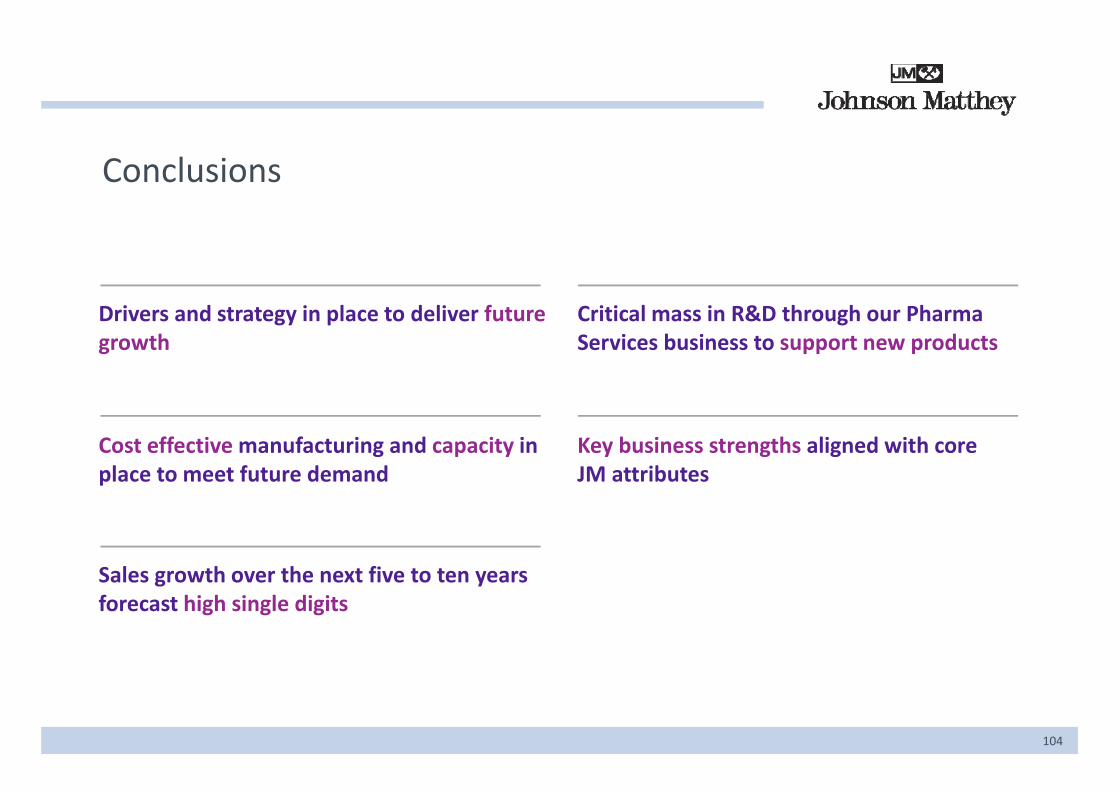
Conclusions
i d i l d li f C i i l i & h h hDrivers and strategy in place to deliver future growth
Critical mass in R&D through our Pharma Services business to support new products
Cost effective manufacturing and capacity in place to meet future demand
Key business strengths aligned with core JM attributesp
Sales growth over the next five to ten yearsSales growth over the next five to ten years forecast high single digits
104


Further Growth R&D FocusFurther Growth – R&D Focus
Robert MacLeod
Group Finance Director
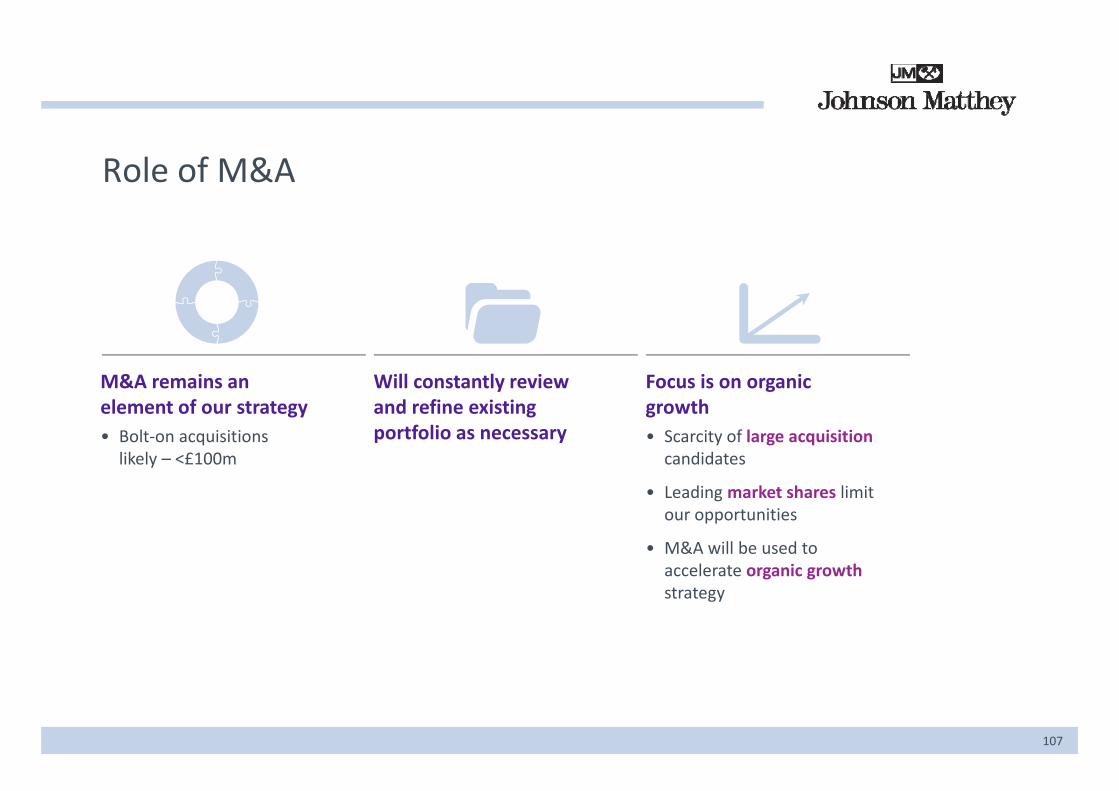
Role of M&A
M&A remains an Will constantly review Focus is on organic element of our strategy• Bolt‐on acquisitions likely – <£100m
and refine existing portfolio as necessary
growth• Scarcity of large acquisitioncandidates
d k h l• Leading market shares limit our opportunities
• M&A will be used to accelerate organic growthaccelerate organic growthstrategy
107
Balance Sheet Structure
• Target net debt (inc. post tax pension deficit) / EBITDA: 1.5 to 2.0 times
• Large working capital swings possible
• As business grows, requires substantial working capitalAs business grows, requires substantial working capital
• In good times, high working capital exacerbated by higher pgm prices
• Requires relatively conservative balance sheet to fund growth
• In tougher times, balance sheet boosted by large working capital inflows
• Will address balance sheet efficiency as appropriate
108

Further Growth – R&D Driven
• Organic growth prospects in existing businesses are very good
• Strategy process has reconfirmed that R&D is a key component of our strategy evidenced by:
• ECT market sharesECT market shares
• Apico
• Identified opportunity to further leverage group’s R&D expertise
• Increasing focus upon investing in R&D
• Overall R&D spend up from circa £100m to circa £135m p.a.
• Up to £5m p a to target new opportunities in adjacent markets• Up to £5m p.a. to target new opportunities in adjacent markets
• New structure and investment in place
109

Research and DevelopmentResearch and Development
Barry Murrer
Director, Technology Centre

Overview
Research gives options for f t th
A key competence is our bilit t t l
Key abilities strengthened b i iti
• E.g. Synetix on base metals
• Intercat for refineries
future growth ability to arrange, control and anchor metals on a nanometre scale
by acquisitions
• Arises from our catalysis businesses
• Will be needed in future but…
• Intercat for refineries technologies
• X‐zymes for enzymic catalysis
• It also gives us options to enter related areas
catalysis
111

Key CompetenceControlling Materials on a Nanometre Scale
A typical heterogeneous catalyst Pd/C
Control of particle size Control of particle shapecatalyst Pd/C
2 Pd ti l 22 nm Pd particles 2 nm
50 nm
Small anchored particles, highly dispersed, very active,
Control of particle size, tunes activity and selectivity
New shapes can take us into new applications
112
highly dispersed, very active, best use of expensive metals
activity and selectivity into new applications

Markets from Nanoscale Materials Chemistry
Catalystsbroad, existing JM business Sensors Photovoltaics, g Sensors Photovoltaics
JM competence
Displays Thermoelectrics PrintedElectronics
Batteries
Core competence allows us to grow in existing business but to develop new opportunities
113

Modelling and Synthesis
Expertise in modelling and synthesis helps us develop materials with better performance
Developing models for core Synthesis of Au/Pd and Pd/Au Alternating layers of Pt/CoDeveloping models for core shell nanoparticle activity
Synthesis of Au/Pd and Pd/Au core shell particles
Alternating layers of Pt/Co
2 nm 2 nm
2 nm
114

Research Projects Nearing Commercialisation
Bi t f l d S d Fi h Ad d f l llBiomass to fuel and chemicals
Syngas and Fischer‐Tropsch (FT) catalysis – enabling
Advanced fuel cell catalysts
catalysis enabling technology for clean and secure fuels
115

Pgm
Global Drivers Impacting the Chemical Industry
Automotive ElectronicsEmission control catalysts
Obscuration enamels APIs Medical
components
catalysts
Health & Nutrition
Ageing Population
ConstructionBulk
chemicals
catalysts
Pgms
Petrochemic‐al catalysts
and processes
Pharma‐ceuticals
Agricultural Chemicals
Finechemicals
Population Growth
Urbanisation
Ammonia synthesis and nitric acid catalysts
Ageing Population
Environmental
Increasing Wealth
l
Biomass to fuelFuel cell catalysts
Factors
Climate Change
Regulation
Energy security
Alternative energy
Gas / coal to products technology
Emission control
Clean fuelEmission control catalysts
Abatement technologies
d P ifi i
NaturalResource Constraints
Resource efficiency
RecyclingCatalysts Pgmrefining
Low carbonHydrogencatalysts
Purification products
Carbon capture and
Fuel cells
FT catalystsstorage (CCS)
Fuel cells
116

Biomass to FuelsFeedstocks for Next Generation Biofuels
Waste Cellulose Pyrolysis Oil Algae
• Versatile option for biomass processing
• E.g. wood processing, agricultural residues
• High yield, non‐food energy source
JM Opportunity
f d f l dSyngas purification and conversion
PurificationDeoxygenationIsomerisationC ki
Triglyceride conversion
117
Cracking

Algae to FuelsConversion of Triglycerides
US Department of Energy Advanced Research Projects Agency (ARPA‐E) funding awarded
Further develops JM technology developed in DARPA project
• Microbial conversion of hydrogen and carbon dioxide into biodiesel
• Three year, $6m project between Johnson Matthey,
• Multifunctional catalysts developed for conversion of methyl esters and acids to hydrocarbon fuels
• Hydrogenation (pgm) centre and zeoliteOPX‐BIO and National Renewable Energy Laboratory
O
O O R
O
O
R
R
O
Vegetable oilDeoxygenation Linear alkanes
O
Vegetable oil
Fatty acidOR Isomerisation
Branched alkanes
118
JM patent WO 2009095711
OH
Syngas and FT Catalysis
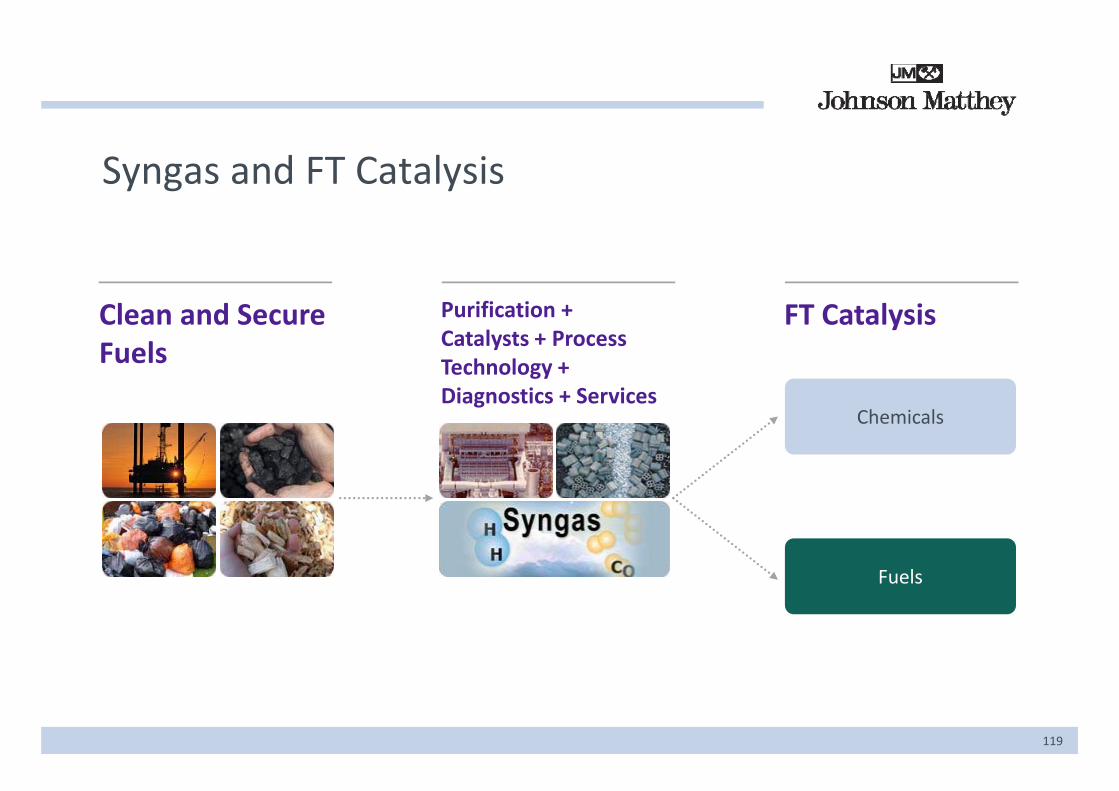
Cl d S Purification + FT C t l iClean and Secure Fuels
Purification + Catalysts + Process Technology + Diagnostics + Services
FT Catalysis
Diagnostics + ServicesChemicals
FuelsFuels
119

Syngas and FT CatalysisLarge or Small Scale?
Opportunities are emerging across all scales
New process technologies => new catalyst solutions
JM optimises the catalyst form to suit the application
• Advanced reforming / combustion products for distributed syngas
across all scales => new catalyst solutions form to suit the application
• Market drivers are complex and geographical, but real
distributed syngas
• Tar reforming and sour shift catalysts for bioderived syngas
• Highly active and selective Fischer‐Tropsch catalysts
120

FT Catalysis Timelines
JMTC restarts FT DPT acquisition brings reactor design and
catalyst research process technology
1999 2000 2001 2002 2003 2004 2005 2006 2007 2008 2009 2010 2011
Synetix acquisition brings base metal expertise in FT and scale up
Projects with customers ‐ FT catalysts for variety of scales, reactors, feedstocks( )
Expanded JM research project on pgm promoted cobalt
(BTL, GTL, CTL)
121

Gas to Liquids (GTL)Fischer‐Tropsch Catalyst R&D
Micro reactors used to simulate large scale Franz Fischer at work in 1918FT operating conditions
• High throughput catalyst screening with fully integrated analysis
122

FT Catalyst Progress
FT Conditions: P = 20 bar, H2/CO = 2, Temperature = 210C
100.0
90.0
Excellent selectivity
Good activity and selectivity
80.0
+ Se
lect
ivity
60.0
70.0
%C
5+
50.00 0.5 1 1.5 2 2.5 3 3.5 4
Relative Activity (to Internal Standard)
123
Relative Activity (to Internal Standard)

Advanced Fuel Cell CatalystsCatalyst Layer and Catalyst Structure
124
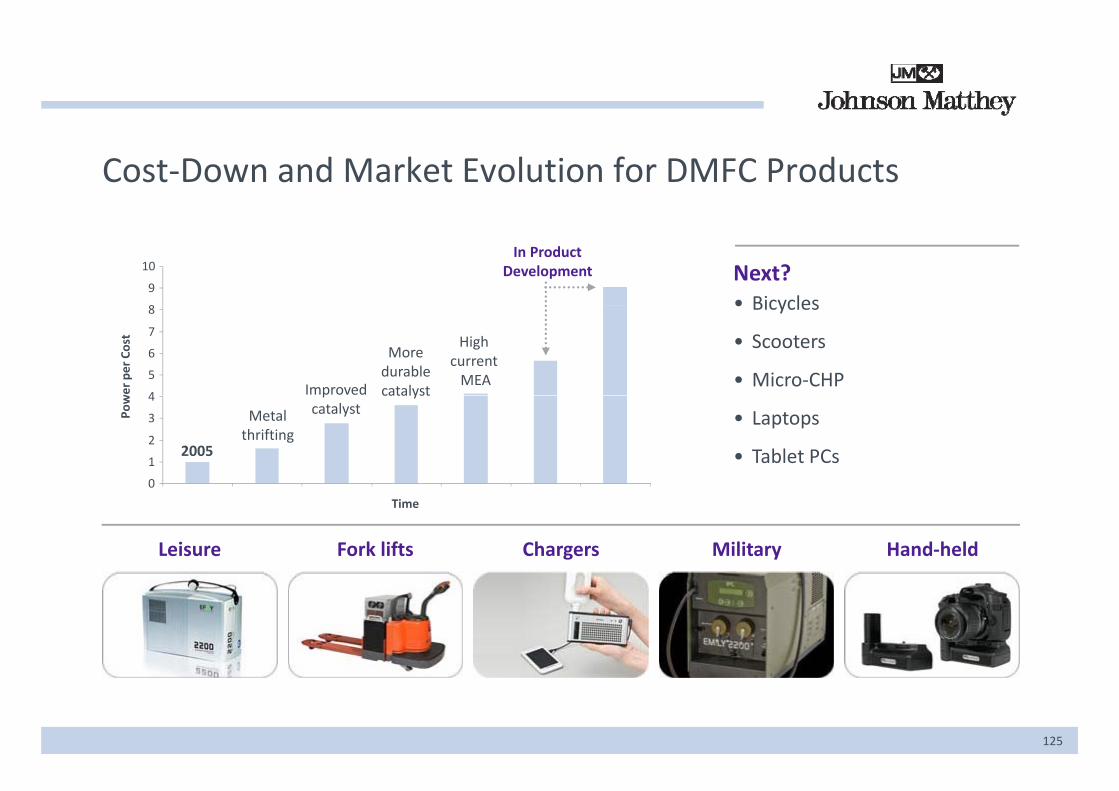
Cost‐Down and Market Evolution for DMFC Products
8
9
10In Product
Development Next?• Bicycles
4
5
6
7
8
wer per Cost
Improved
More durablecatalyst
High current MEA
• Bicycles
• Scooters
• Micro‐CHP
0
1
2
3
4
Pow
Metalthrifting
pcatalyst
catalyst
2005
• Laptops
• Tablet PCs0
Leisure Fork lifts Chargers Military Hand‐held
Time
125
126
Conclusions
i i i dj k ib id f f & ffMany opportunities in adjacent markets JM attributes provide focus for R&D effort
Increase emphasis on commercialisation New structure in place and investmentbudgeted g
New business in ten years sales target circaNew business in ten years, sales target circa £200m p.a.
127

128128

Summary and ConclusionsSummary and Conclusions
Neil Carson
Chief Executive
Global Drivers Impacting the Chemical IndustryPgm
Automotive ElectronicsEmission control catalysts
Obscuration enamels
APIs Medical components
catalysts
Health & Nutrition
Ageing Population
ConstructionBulk
chemicals
catalysts
Pgms
Petrochemic‐al catalysts
and processes
Pharma‐ceuticals
Agricultural Chemicals Ammonia
synthesis and nitric acid catalysts
Finechemicals
Population Growth
Urbanisation Ageing Population
Environmental
Increasing Wealth
l Factors
Climate Change
Regulation
Energy security
Alternative energy
Gas / coal to products technology
Emission control
Clean fuelEmission control catalysts
Abatement technologies
d P ifi i
NaturalResource Constraints
Resource efficiency
RecyclingCatalysts Pgmrefining
Low carbonHydrogencatalysts
Purification products
Carbon capture and Fuel cells
130
storage (CCS)
Fuel cells
JM attributes deliver superior growth
Our Strategy in Summary
Key elements unchanged: Increased emphasis on:
Continued focus on leading edge catalysis
Developing new opportunities underpinned by core chemistry
Maintain differentiation through technology
JM attributes provide focus for investment
Strong position in pgms remains an intrinsic part of group
Manufacturing excellence Pt
Primary focus is organic growth People and culture
131

Conclusions
We believe that the strategy is right
Group well positioned for growth in nextfive years
• Strong positions in core markets
Group well positioned for future growth in five years +
• Global drivers show good fit for JM technology g p
• Group anticipated to grow at double digit rates with ROIC >20%
B i d i fi l i l
g gy
• Strategy in place to monitor changing landscape
C it t i t t i i b fit f• Business drivers firmly in place
• Continued investment in infrastructure and R&D
• Capacity to invest to maximise benefit of opportunities
• Proven R&D approach to deliver commercial success
132

133

Glossary
ADHD Attention deficit and hyperactivity disorderAPI Active pharmaceutical ingredient
CTL Coal to liquidsDARPA Defense Advanced Research Projects AgencyAPI Active pharmaceutical ingredient
Apico Johnson Matthey’s new methanol synthesis catalyst
ARPA‐E Advanced Research Projects Agency ‐ Energy A G ld
DARPA Defense Advanced Research Projects Agency DME Dimethyl ether DMFC Direct methanol fuel cell DOC Diesel oxidation catalyst
Au Gold BEV Battery electric vehicle BRIC Brazil, Russia, India, China BTL Biomass to liquids
DPF Diesel particulate filter DPT Davy Process Technology e+TM Ethylene scavenger that postpones fresh produce
ripening C Carbon CAGR Compound annual growth rate CCRT® Coated continuously regenerating trap CCS Carbon capture and storage
EBITDA Earnings before interest, tax, depreciation and amortisation
ECT Emission Control Technologies EPS Earnings per share CCS Carbon capture and storage
CHP Combined heat and powerCo Cobalt CO Carbon monoxide CO C b di id
g pEU European Union FCEV Fuel cell electric vehicle FT Fischer‐TropschGDL Gas diffusion layer
134
CO2 Carbon dioxide CRT® Continuously regenerating trap
GDL Gas diffusion layer GHG Greenhouse gas

Glossary
GTL Gas to liquids H Hydrogen
PBT Profit before tax Pd PalladiumH2 Hydrogen
HC Hydrocarbon Hg Mercury IC Internal combustion
Pd Palladium Pgm Platinum group metal PHEV Plug in hybrid electric vehicle PM Particulate matter
ICE Internal combustion engine INCB International Narcotics Control Board ISO 14001 Series of standards specifying requirements of
an environmental management system
Pms Precious metals Pt Platinum R&D Research and development ROIC Return on invested capital
JM Johnson Matthey JMTC Johnson Matthey Technology Centre JV Joint venture MEA Membrane electrode assembly
pROW Rest of the world RSA Republic of South Africa SCR Selective catalytic reduction SCRT® Selective catalytic reduction + CRT®MEA Membrane electrode assembly
MW MegaWattN2O Nitrous oxide NOx Nitrogen oxides OEM O i i l i f
SCRT® Selective catalytic reduction + CRT® SNG Substitute natural gas SOx Oxides of sulphur Syngas A mixture of hydrogen and carbon oxides
135
OEM Original equipment manufacturer WHO World Health Organization

136