to be or not to be: major choices in budding scientists · to be or not to be: major choices in...
TRANSCRIPT

To Be or Not to Be:Major Choices in
Budding Scientists
Eric BettingerStanford School of Education and NBER
3 December 2008

State of the STEM Pipeline
Perennial interest in state of U.S. Education particularly in STEM fieldsRecent concern that STEM Pipeline is weak
Hart-Rudman (2001): “. . . a greater threat to U.S. national security over the next quarter century than any potential conventional war . . .”National Academy of Science (2007): “. . . the scientific and technological building blocks critical to our economic leadership are eroding . . .”

Concern Up and Down the Pipeline
Perception that NAEP Scores in Math & Science are flat or growing slowlyUS Rank on International Tests
2003 TIMSS4th Grade Math => 12th of 24; 6th of 10 OECD8th Grade Math => 19th of 44; 10th of 12 OECDBetter ranks in science although still lagging
High School Students Lack STEM Coursework (ACT 2006)

Concern Up and Down the Pipeline (cont.)
Percentage of College Freshmen w/ Intent to Major in S&E is StagnantNumber of Majors Increased SlightlyNumber of US Residents Pursuing STEM Doctoral Degrees Lags 1970 Levels

Freshmen with Intention to Major in Science & Engineering
10.0
15.0
20.0
25.0
30.0
35.0
40.0
1976
1980
1982
1984
1986
1988
1990
1992
1994
1996
Year
Perc
ent
Whites Blacks White Females Black Females

-100
-50
0P
erce
nt C
hang
e fro
m B
asel
ine
1970 1980 1990 2000 2010Year
Engineering MathPhysical Science
Data from NSF Survey of Earned Doctorates
US Citizens and Permanent ResidentsGrowth of Total Doctorates Relative to 1970

Major Choices
Integral Part of STEM PipelineMajor Pre-req for STEM If major is not STEM, less than 1-2 percent chance of graduate study in engineering or biological sciences. 3-5 percent chance in math or physical sciences.
Limited Information on Major ChoiceAdmissions Exams Provide IntentBeginning Post-Secondary Survey
Key Career Decision
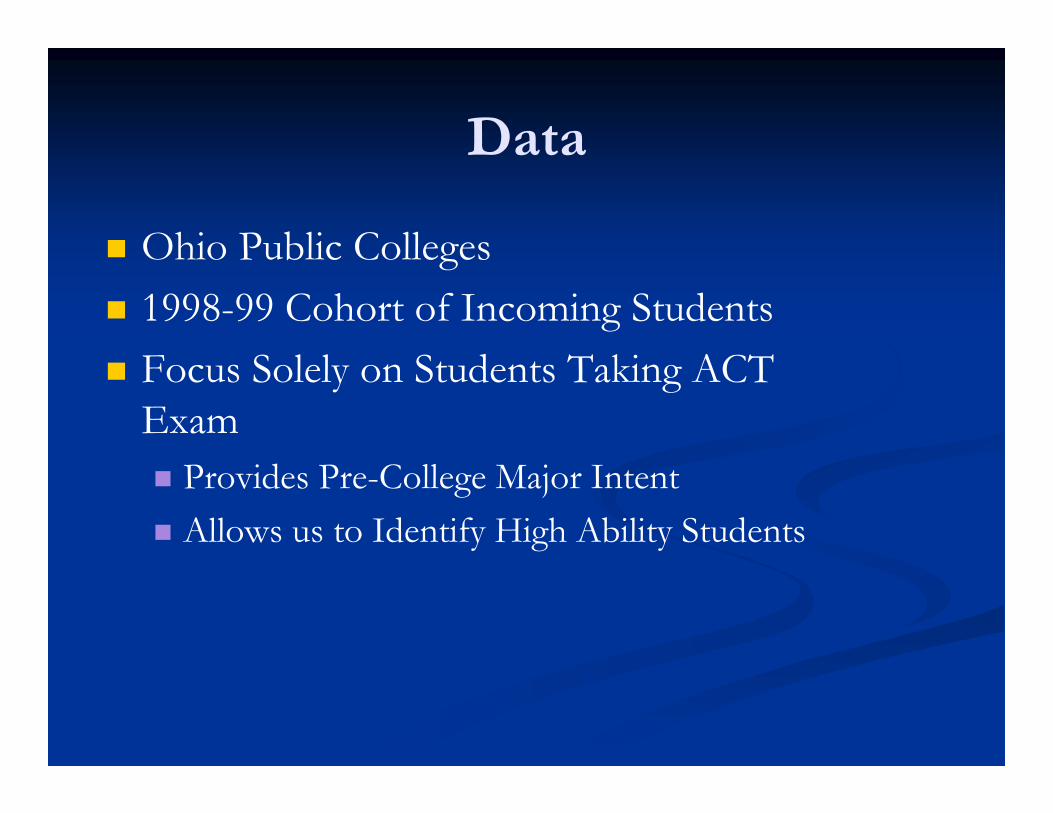
Data
Ohio Public Colleges1998-99 Cohort of Incoming StudentsFocus Solely on Students Taking ACT Exam
Provides Pre-College Major IntentAllows us to Identify High Ability Students

Intended Major AllStudents
Students w/Overall
ACT>24
Students w/ScienceACT>24
Students w/Math
ACT>24
Students at 2yr
Campus
Humanities 2.1 3.2 2.7 2.2 1.9Foreign Language 0.5 0.8 0.6 0.8 0.2
Social Science 13.3 14.6 13.3 11.6 10.5Communications 8.1 8.0 6.7 5.9 6.6
Science (Biological or Physical)
8.0 11.7 12.6 10.7 5.5
Math 0.6 1.0 1.1 1.3 0.4Business 23.4 19.1 18.4 22.4 24.6Computers 4.7 6.3 6.9 6.4 6.5Engineering 11.7 18.0 19.9 20.9 9.4Engineering
Technology2.4 2.5 3.0 2.8 4.0
Architecture 3.8 3.0 3.5 3.8 5.0Education 17.5 10.2 9.7 9.6 17.0Social Work 4.0 1.5 1.7 1.6 8.4N 17,969 5,031 4,702 5,676 5,091

Student Characteristic
AllStudents
Students w/Overall
ACT>24
Students w/ScienceACT>24
Students w/Math
ACT>24
2 yr Campus
Age 18.4(0.5)
18.3(0.5)
18.4(0.5)
18.4(0.5)
18.8(1.8)
White 0.86 0.92 0.93 0.92 0.88
Black 0.07 0.02 0.01 0.02 0.08
Female 0.52 0.47 0.40 0.40 0.49
Overall ACT 22.0(4.3)
27.4(2.2)
26.9(2.8)
26.2(3.1)
19.3(3.8)
Math ACT 21.9(4.8)
27.1(3.4)
26.6(3.8)
27.7(2.4)
19.0(3.9)
Science ACT 22.0(4.3)
26.7(3.2)
27.5(2.6)
25.6(3.7)
19.7(4.0)
Attending 4-yr College
0.78 0.92 0.90 0.92 --
Attended Math Remediation
0.22 0.02 0.04 0.01 --
N 17,969 5,031 4,702 5,676 6,265
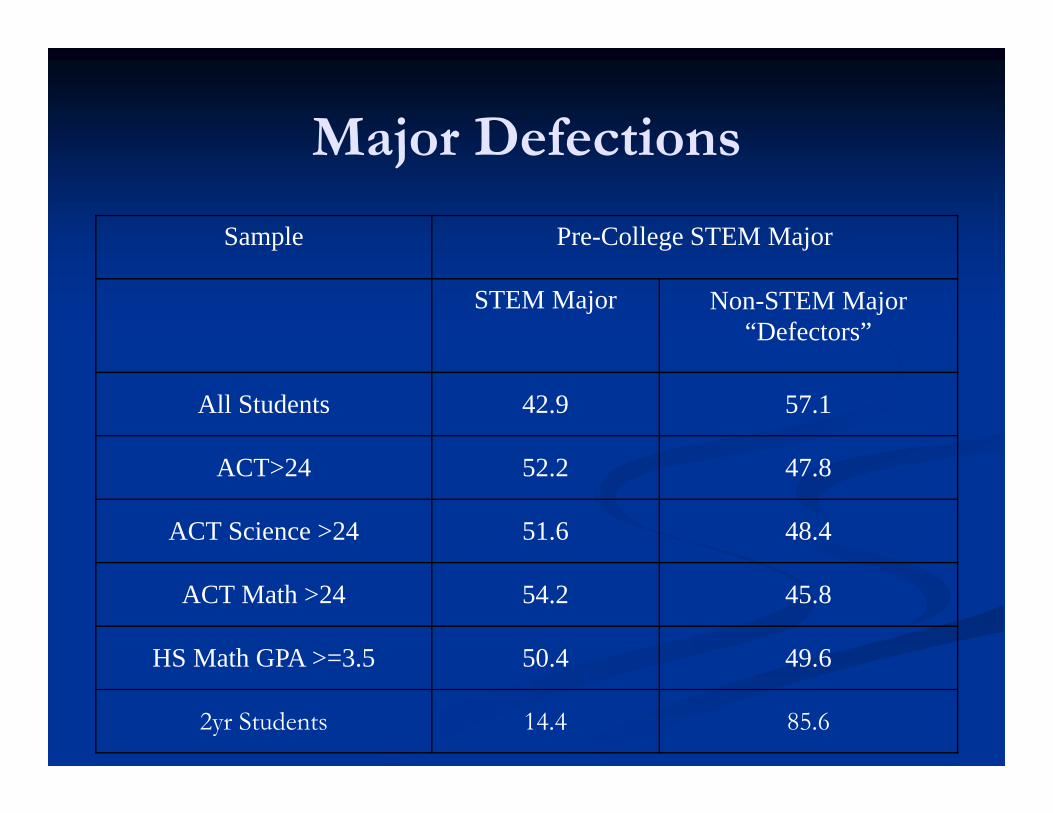
Major Defections
Sample Pre-College STEM Major
STEM Major Non-STEM Major“Defectors”
All Students 42.9 57.1
ACT>24 52.2 47.8
ACT Science >24 51.6 48.4
ACT Math >24 54.2 45.8
HS Math GPA >=3.5 50.4 49.6
2yr Students 14.4 85.6

The Converted
Sample Pre-College Non-STEM Major
STEM Major“Converts”
Non-STEM Major
All Students 5.5 94.6
ACT>24 7.7 92.3
ACT Science >24 8.7 91.3
ACT Math >24 8.5 91.5
HS Math GPA >=3.5 7.0 93.0
2yr Students 3.4 96.6

Where Do They Go?
Major All Stude
nts
ACT>24 ACT Science
>24
ACT Math >24
2yr Studnts
Humanities 8.2 10.7 8.4 7.9 7.0Foreign
Language1.0 1.5 1.4 1.3 1.5
Social Science 21.2 24.3 23.9 21.3 23.6Communications 6.5 5.4 5.9 4.8 10.9
Business 48.7 46.2 47.8 53.2 29.5Architecture 2.2 1.5 1.3 2.0 1.9Education 11.1 9.6 10.6 9.3 22.1Social Work 2.0 1.0 0.6 0.3 3.5

Likely Explanations for the Dearth of STEM Degree Holders
1. Few are prepared, at the end of secondary school, to enter STEM fields.
2. Few express initial interest in entering STEM fields.3. Once a student is off the STEM “wagon”, he cannot
get on it.4. The culture of STEM fields is off-putting once higher
education is reached.5. The returns are insufficiently high to justify greater
adherence to STEM fields.
From Hoxby (2008)

Percent of Students Scoring at Top LevelPISA math test for 15-year-olds
0
2
4
6
8
10
12
Tunisia
Indon
esia
Mexico
Braz
ilTha
iland
Serbia
and M
onten
egro
Urugua
yGree
ce
Portug
al Turk
ey Italy
Russia
n Fed
eratio
nSpa
inLa
tvia
Poland
United
States
Hunga
ry
Luxe
mbourg
…Ire
land
Norway
Slovak
Rep
ublic
Austria
United
Kingdo
mFran
ce
Icelan
d Swed
enDen
mark
German
y
Czech
Rep
ublic
Macao
-Chin
aAus
tralia
Can
ada
New Zea
land
Switzerl
and
Finlan
d Ja
pan
Korea
Netherl
ands
Liech
tenste
inBelg
ium
Hong K
ong-C
hina
Perc
enta
ge
From Hoxby (2008)

Number of STEM bachelor's degree recipients per 100 persons of relevant age in the population
0
2
4
6
8
10
12
14
16
18
Mexico
Hunga
ryBelg
iumAus
triaUnit
ed Stat
esSwitz
erlan
d
Czech
Rep
ublic
German
yNeth
erlan
dsNorw
ayDen
markSpa
inIce
land
Italy
New Zea
land
Irelan
d
United
Kingdo
mFran
ceJa
pan
Austra
liaKore
aSwed
enFinl
and
Num
ber p
er 1
00 p
erso
ns
From Hoxby (2008)

Rigidity of Major
STEM Majors Usually Have Rigid StructuresExtensive Hour RequirementsSequential Course
Supporting Evidence:Defections start in 1st Semester
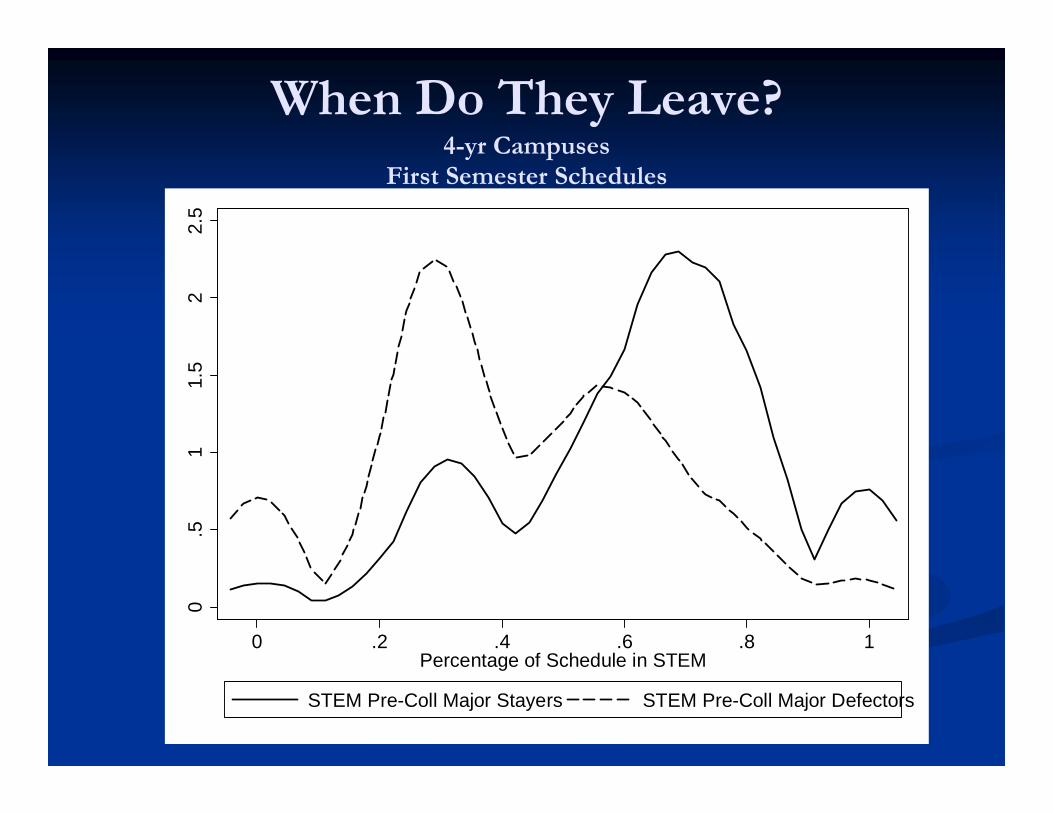
When Do They Leave?4-yr Campuses
0.5
11.
52
2.5
0 .2 .4 .6 .8 1Percentage of Schedule in STEM
STEM Pre-Coll Major Stayers STEM Pre-Coll Major Defectors
First Semester Schedules

First Semester Schedules (ACT>24)0
.51
1.5
22.
5
0 .2 .4 .6 .8 1Percentage of Schedule in STEM
STEM Pre-Coll Major Stayers STEM Pre-Coll Major Defectors
When Do They Leave?4-yr Campuses

0.2
.4.6
.8
0 20 40 60 80 100Percentage of 1st Semester in STEM
Pre-College STEM Major Pre-College non-STEM Major
Pro
babi
lity
of M
ajor
ing
in S
TEM
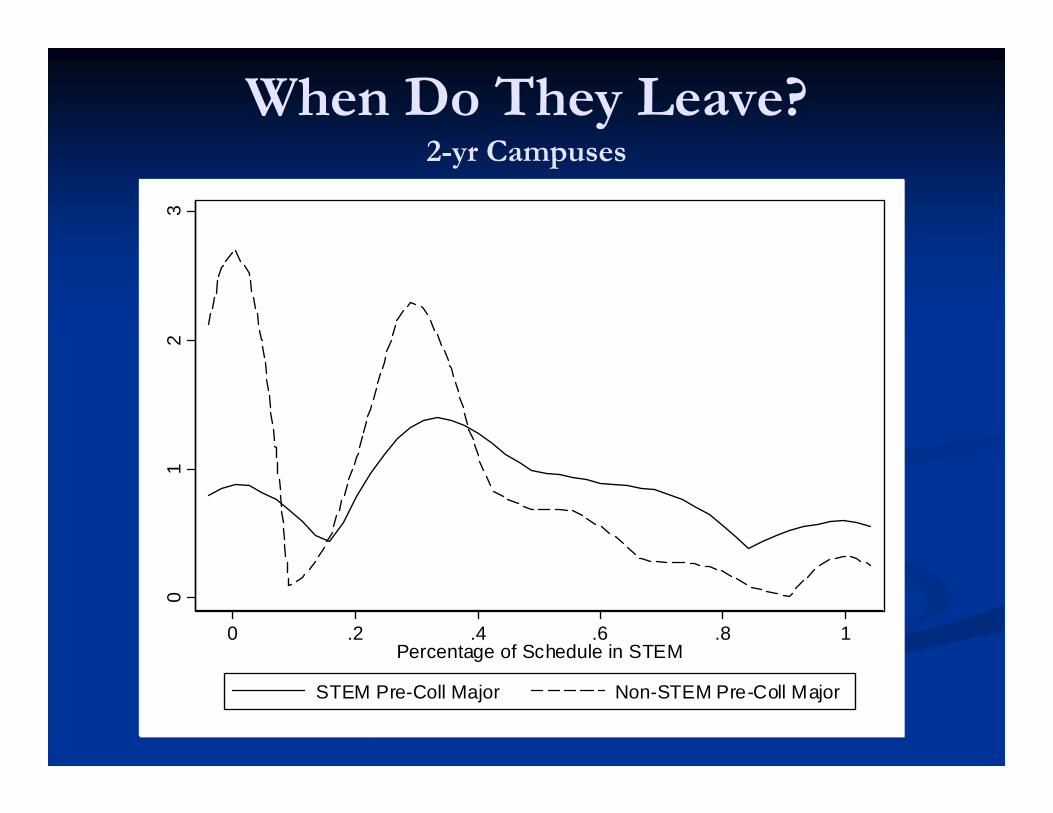
When Do They Leave?2-yr Campuses
01
23
0 .2 .4 .6 .8 1Percentage of Schedule in STEM
STEM Pre-Coll Major Non-STEM Pre-Coll Major

When Do They Leave?2-yr Campuses
0.5
11.
5
0 .2 .4 .6 .8 1Percentage of Schedule in STEM
STEM Pre-Coll Major Stayers STEM Pre-Coll Major Defectors

When Do They Leave?2-yr Campuses – ACT>24
.2.4
.6.8
11.
2
0 .5 1Percentage of Schedule in STEM
STEM Pre-Coll Major Stayers STEM Pre-Coll Major Defectors

Defectors vs. Converts0
.51
1.5
22.
5
0 .2 .4 .6 .8 1Percentage of Schedule in STEM
STEM Major who was Pre-Non-STEM Non-STEM Major who was Pre-STEM
First Semester Schedules

Rigidity of Major
STEM Majors Usually Have Rigid StructuresExtensive Hour RequirementsSequential Course
Supporting Evidence:Defections start in 1st Semester
Dissenting Evidence:Similar Students “Convert” to STEM FieldsDestinations Are Often Hours IntensiveAmong Top Students, Defectors are Just as Less Likely to Pass

Is the culture of STEM fields off-putting once higher education is reached?
Since students take STEM classes in high school and still express interest in the fields, cultural problems would need to start in college to produce defection.The fact that students who show early immersion in STEM classes are more likely to persist could be indicative. Women and Minorities?
Adapted From Hoxby (2008)

Women and Minorities
Largest growth in STEM Majors are among Women, Blacks and HispanicsWomen are more likely to defect from STEM
Even among the top studentsBlacks are less likely to defect from STEM
Especially true among top students

Is the culture of STEM fields off-putting once higher education is reached?
Since students take STEM classes in high school and still express interest in the fields, cultural problems would need to start in college to produce defection.The fact that students who show early immersion in STEM classes are more likely to persist could be indicative. Women do defect disproportionately: women with high science or math ACT scores are 9 to 14% more likely to leave STEM majors than men.
Adapted From Hoxby (2008)

Earnings in Majors
Major Destinations4-yr Campuses
50 Percent Move to BusinessAbout 20 Percent Move to Education, Social Work, or Humanities
2-yr Campuses30 Percent to Business30 Percent to Education, Social Work, or Humanities
Movements toward Business and Social SciencesWomen’s earnings in business and economics earn as much or more than any STEM fields.Men’s earnings are similar across STEM, business, and social sciences.Wages growth in these fields greater than STEM fields
STEM Earnings would fall if greater supply of STEM workers.
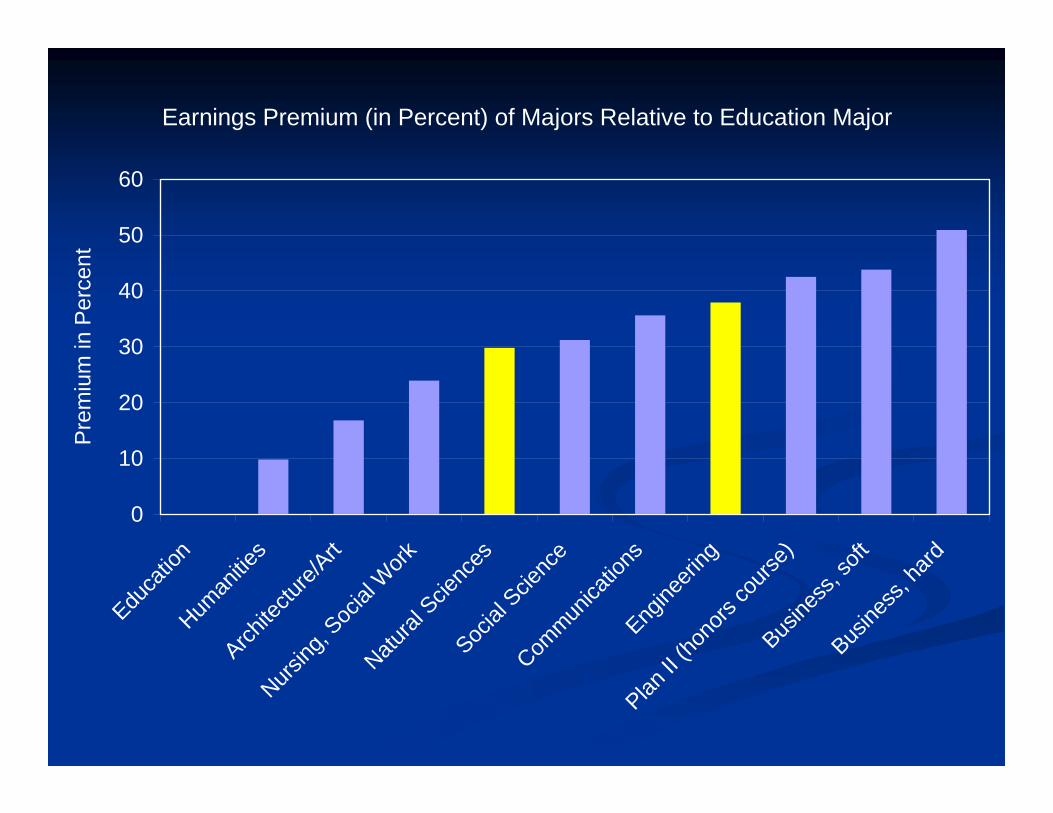
Earnings Premium (in Percent) of Majors Relative to Education Major
0
10
20
30
40
50
60
Educa
tion
Human
ities
Archite
cture/
Art
Nursing
, Soc
ial W
orkNatu
ral Scie
nces
Social
Scie
nce
Commun
icatio
nsEng
ineeri
ng
Plan II
(hono
rs co
urse)
Busine
ss, s
oftBus
iness
, hard
Pre
miu
m in
Per
cent

Changing Values
74% say that an important part of college is to be “well off financially”Increased focus on vocational offerings (Adelman 1995)Especially True in 2-year Campuses

Additional Defections
50 percent of engineering majors aim to pursue MBA or lawSimilar defection rates in other STEM fields but more movement toward medicine30-40 percent retention in graduate study plans among engineering, physical and computer science and math

How do we know that the number of STEM degree holders is deficient?
There is no magic number that we need. As a rule, we look to earnings as guidance:
High average earnings indicate generalized excess demand.Superstar earnings indicate a demand for a big pool to produce a small number of superstars.Computer science, the one field with obvious earnings growth & superstar earnings, has experienced tremendous growth in majors/degrees.
From Hoxby (2008)

Hypotheses that Can Reconcile the Lack of Economic Symptoms with our Sense that
STEM Degrees are Insufficient
The supply of foreign people with STEM degrees keeps earnings at a modest level.Earnings in certain STEM fields (math, theoretical physics, etc.) are not set by the private market.We do not really need numerous STEM majors: we need a small number of people with extraordinary STEM ability.
In this case, we should be looking for symptoms that people who should not fall off the wagon do.
From Hoxby (2008)

Implications and Conclusions
Half of well prepared, top students defect from STEM majors
Women are more likely to leaveDefections start in 1st semester (rigidity?)Defections are higher in 2yr Campuses
More Lucrative MajorsStudents go to business and social scienceEchoes previous findings on markets with cobwebs