to create any charts (whether whole building or retuning...
TRANSCRIPT

1

2

To create any charts (whether whole building or retuning), the first two items of ECAM
must be completed.
3

4
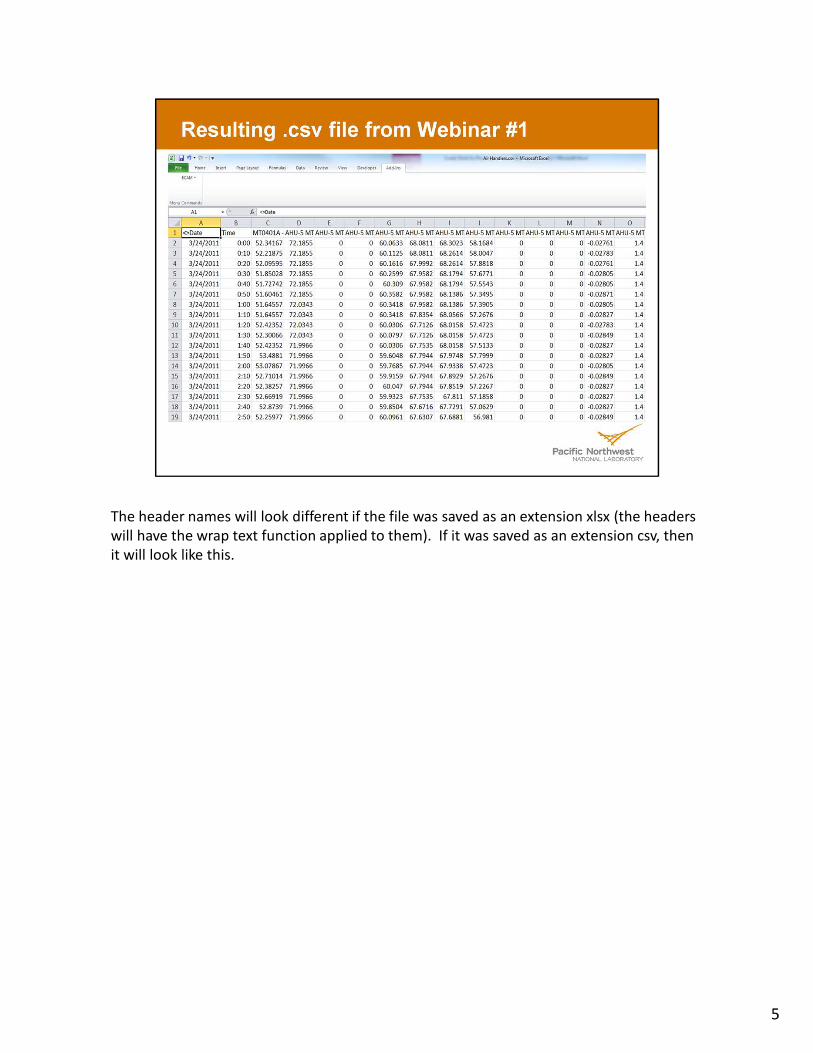
The header names will look different if the file was saved as an extension xlsx (the headers
will have the wrap text function applied to them). If it was saved as an extension csv, then
it will look like this.
5

6
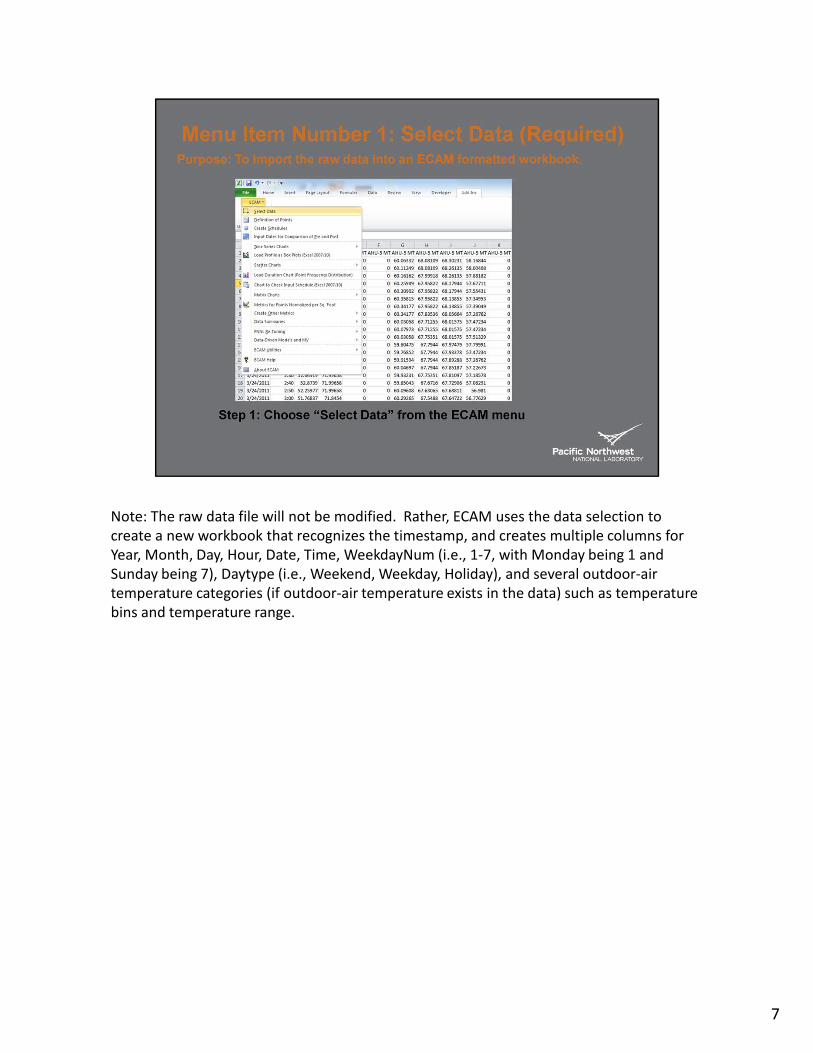
Note: The raw data file will not be modified. Rather, ECAM uses the data selection to
create a new workbook that recognizes the timestamp, and creates multiple columns for
Year, Month, Day, Hour, Date, Time, WeekdayNum (i.e., 1-7, with Monday being 1 and
Sunday being 7), Daytype (i.e., Weekend, Weekday, Holiday), and several outdoor-air
temperature categories (if outdoor-air temperature exists in the data) such as temperature
bins and temperature range.
7

Note that for this file, the time stamps are in 2 columns instead of 1.
8
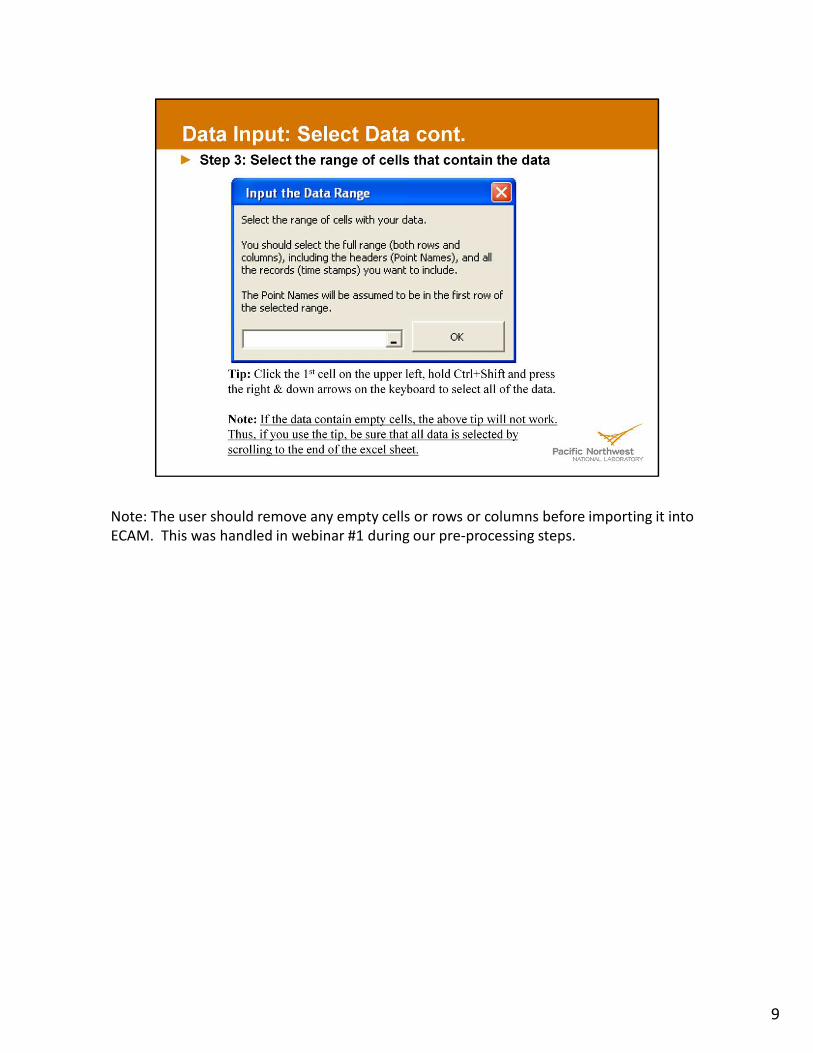
Note: The user should remove any empty cells or rows or columns before importing it into
ECAM. This was handled in webinar #1 during our pre-processing steps.
9

Note: Having the outdoor-air temperature located at the first column after the timestamp
makes it easy to remember for this step in ECAM.
10

11
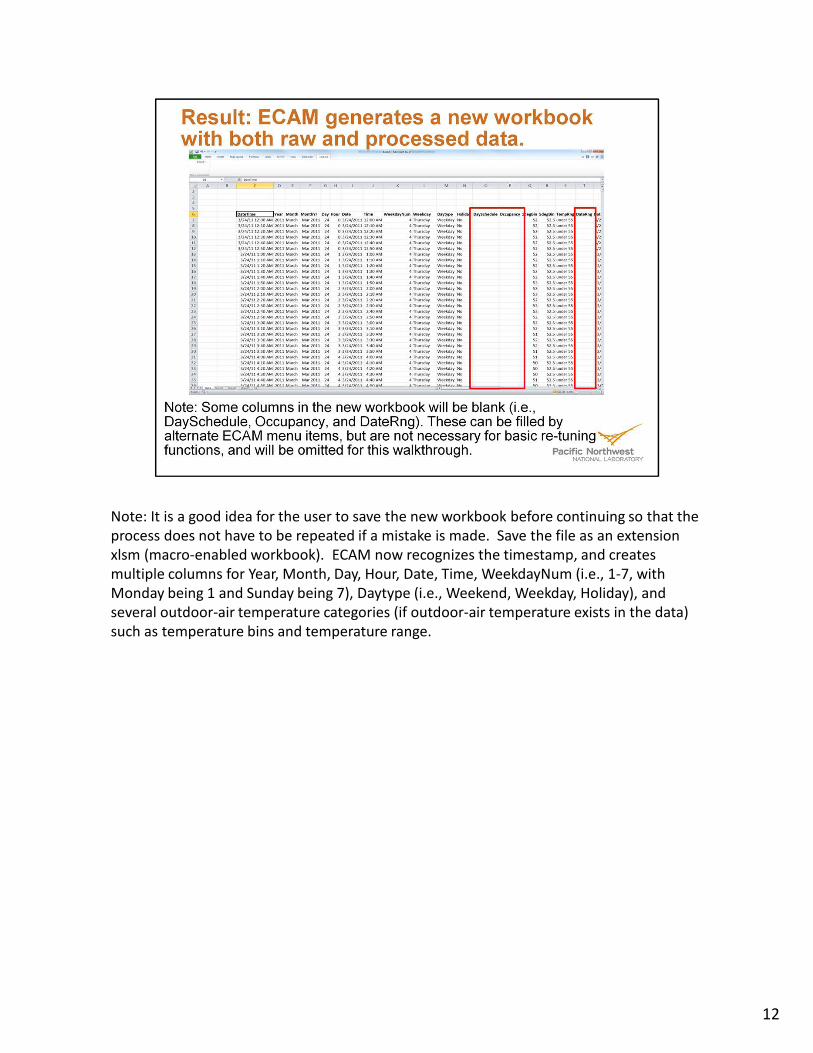
Note: It is a good idea for the user to save the new workbook before continuing so that the
process does not have to be repeated if a mistake is made. Save the file as an extension
xlsm (macro-enabled workbook). ECAM now recognizes the timestamp, and creates
multiple columns for Year, Month, Day, Hour, Date, Time, WeekdayNum (i.e., 1-7, with
Monday being 1 and Sunday being 7), Daytype (i.e., Weekend, Weekday, Holiday), and
several outdoor-air temperature categories (if outdoor-air temperature exists in the data)
such as temperature bins and temperature range.
12

Note: The number of points trended and exported from the BAS can be very large (i.e.,
2,000 points). However, only certain points are necessary for ECAM to generate useful
charts to analyze. Thus, mapping the points of interest in ECAM allows the user to keep all
data in the workbook, but only utilize that which is useful for generating charts to analyze.
13

Tip: ECAM needs this input to create metrics. However, PNNL Re-tuning does not require
this input and thus the default values (e.g, building area = 100,000sq.feet and 3-phase
voltage = 480 V are acceptable).
14

Note: The Definition of Points window needs to be refreshed before mapping any points. To
do so simply click on any subsystem and everything else will refresh.
15

Note: Identifying what each point name from the BAS is can be confusing unless you are
the one who set up the trends. Generally, the end of the point name will give a good
indication of what the point that is trended corresponds to.
16

17

Note: although it is clear (per the Points List) that the air-handlers for this building are AHU-
5 and AHU-1, ECAM will label the air-handlers as AHU-1 and AHU-2. This is because of the
ECAM naming convention, so the only way to identify which AHU is from the building is to
label the corresponding charts that are created.
18

You can see the difference here, where the names at the top are AHU-5 and the bottom
shows AHU-1
19
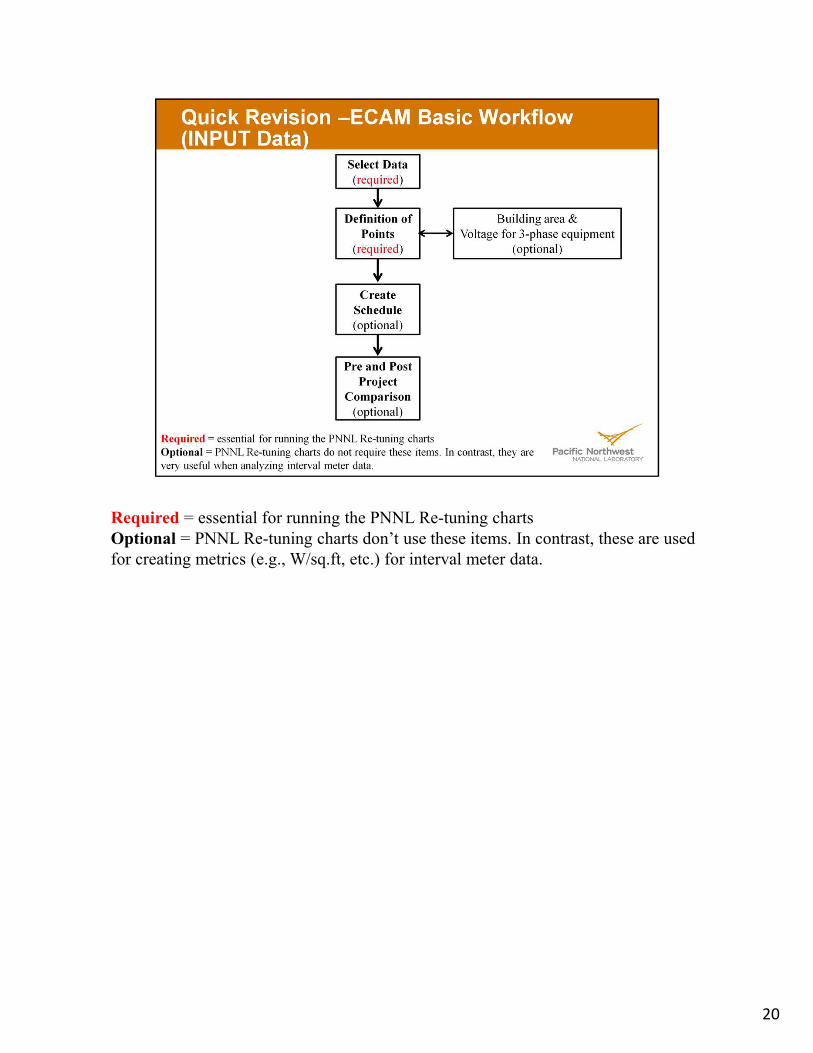
Required = essential for running the PNNL Re-tuning charts
Optional = PNNL Re-tuning charts don’t use these items. In contrast, these are used
for creating metrics (e.g., W/sq.ft, etc.) for interval meter data.
20

墰ͺ
21
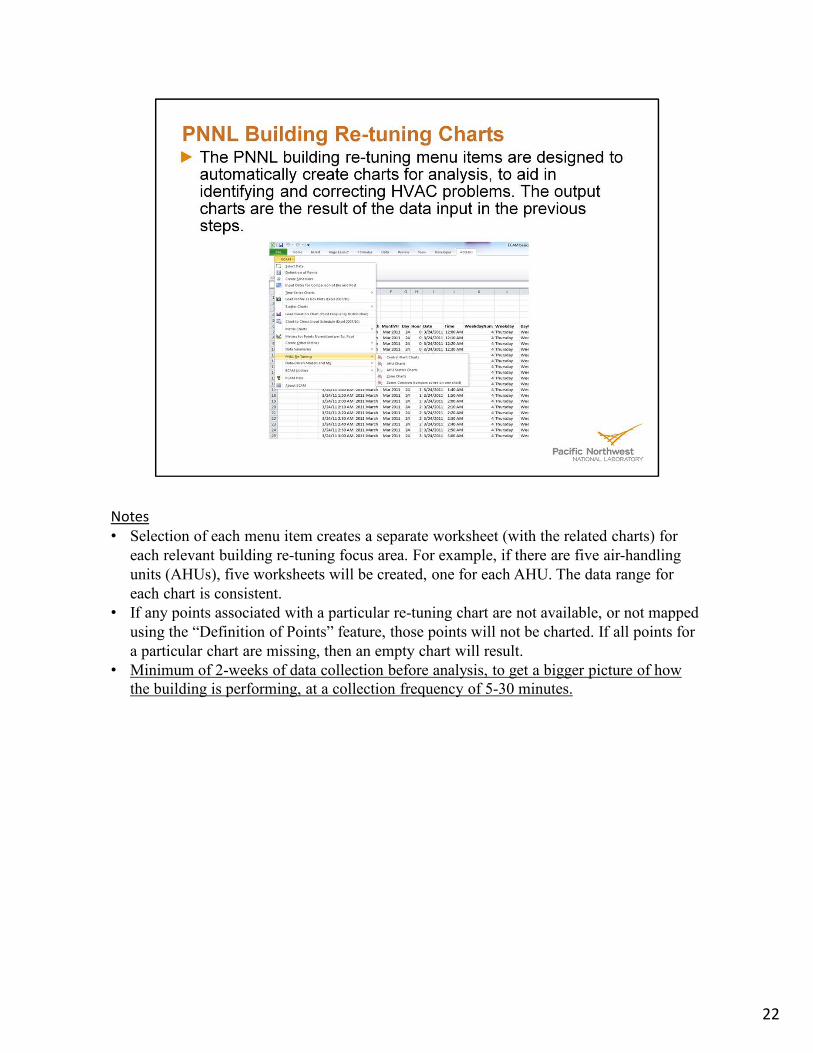
ὀͿNotes
• Selection of each menu item creates a separate worksheet (with the related charts) for
each relevant building re-tuning focus area. For example, if there are five air-handling
units (AHUs), five worksheets will be created, one for each AHU. The data range for
each chart is consistent.
• If any points associated with a particular re-tuning chart are not available, or not mapped
using the “Definition of Points” feature, those points will not be charted. If all points for
a particular chart are missing, then an empty chart will result.
• Minimum of 2-weeks of data collection before analysis, to get a bigger picture of how
the building is performing, at a collection frequency of 5-30 minutes.
22
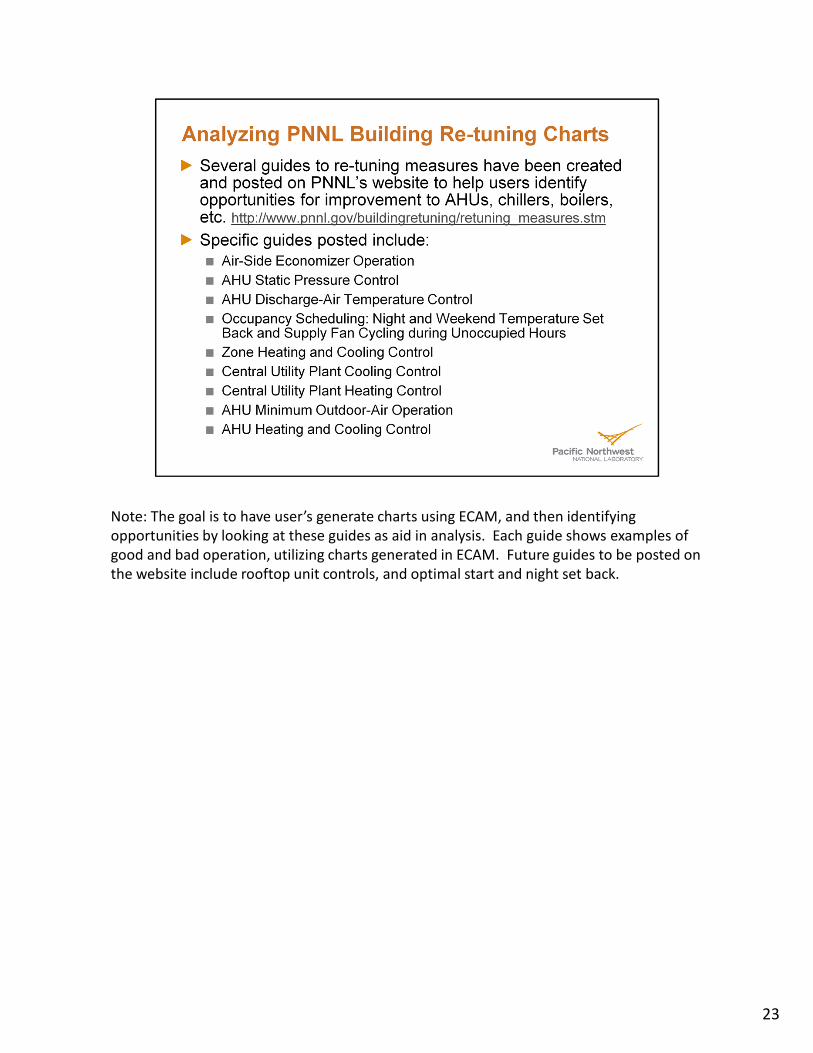
ὀͿNote: The goal is to have user’s generate charts using ECAM, and then identifying
opportunities by looking at these guides as aid in analysis. Each guide shows examples of
good and bad operation, utilizing charts generated in ECAM. Future guides to be posted on
the website include rooftop unit controls, and optimal start and night set back.
23
輀Ά
24
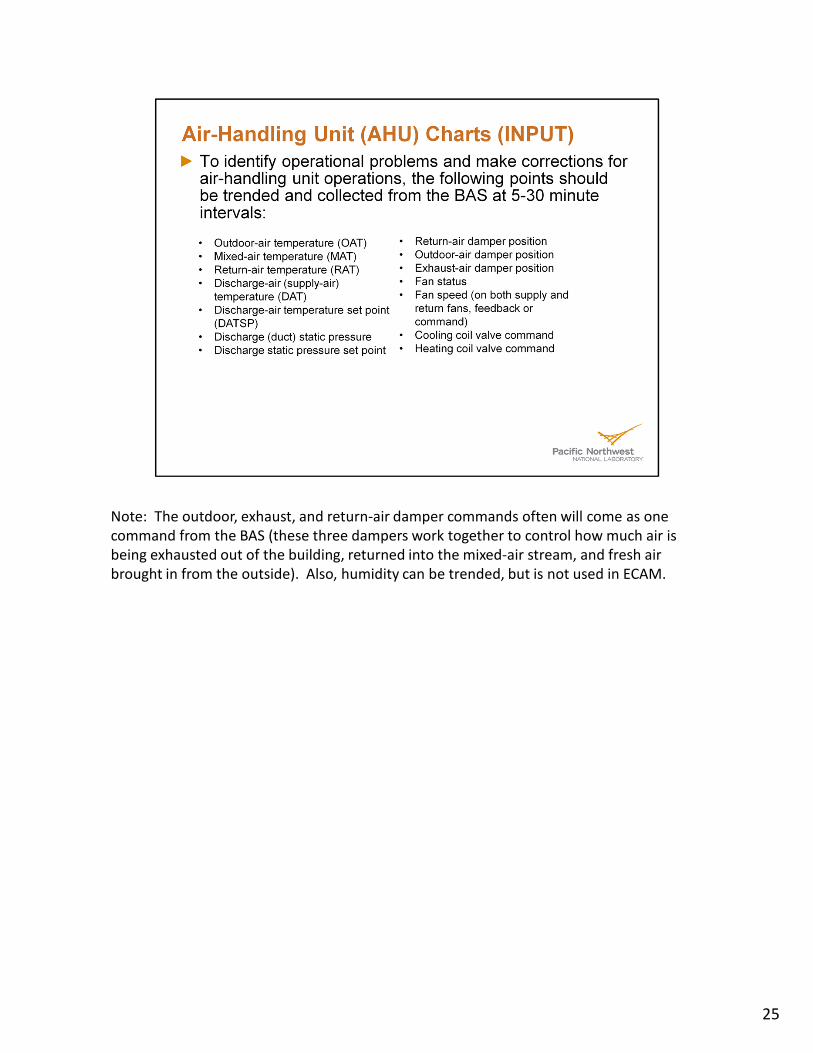
因�Note: The outdoor, exhaust, and return-air damper commands often will come as one
command from the BAS (these three dampers work together to control how much air is
being exhausted out of the building, returned into the mixed-air stream, and fresh air
brought in from the outside). Also, humidity can be trended, but is not used in ECAM.
25

쟐�
26

27
꿠е
28
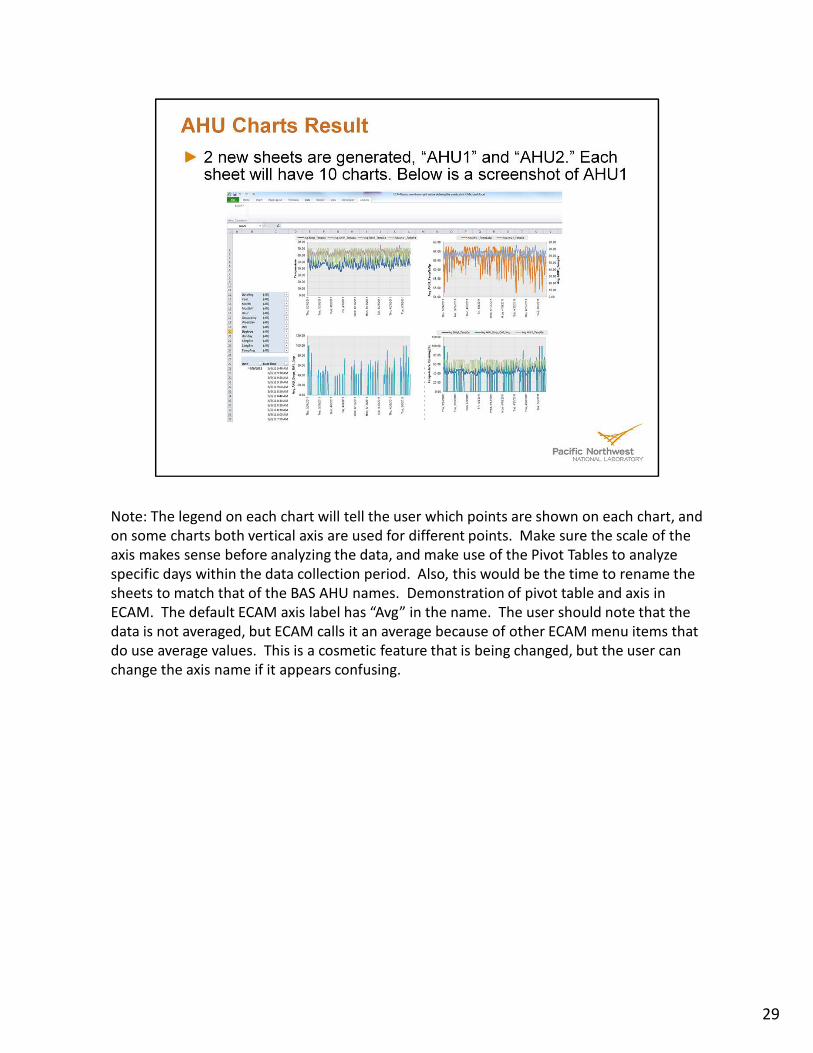
䪠ΆNote: The legend on each chart will tell the user which points are shown on each chart, and
on some charts both vertical axis are used for different points. Make sure the scale of the
axis makes sense before analyzing the data, and make use of the Pivot Tables to analyze
specific days within the data collection period. Also, this would be the time to rename the
sheets to match that of the BAS AHU names. Demonstration of pivot table and axis in
ECAM. The default ECAM axis label has “Avg” in the name. The user should note that the
data is not averaged, but ECAM calls it an average because of other ECAM menu items that
do use average values. This is a cosmetic feature that is being changed, but the user can
change the axis name if it appears confusing.
29

뤰е
30
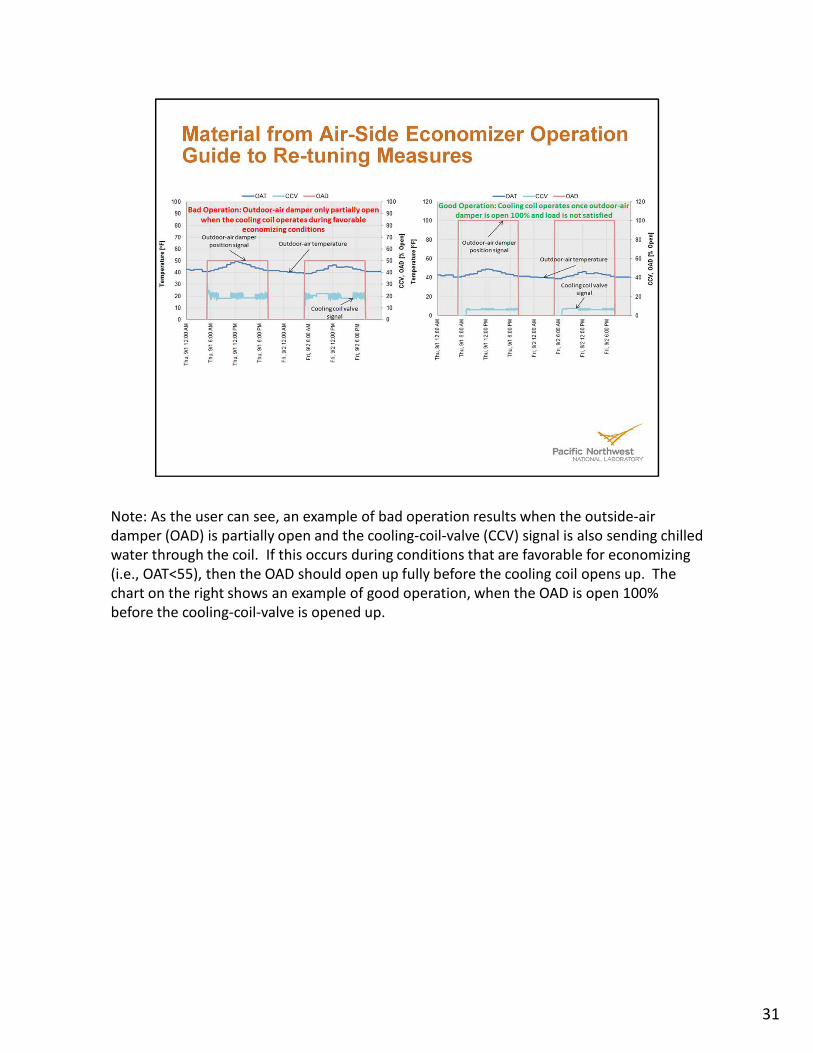
좠жNote: As the user can see, an example of bad operation results when the outside-air
damper (OAD) is partially open and the cooling-coil-valve (CCV) signal is also sending chilled
water through the coil. If this occurs during conditions that are favorable for economizing
(i.e., OAT<55), then the OAD should open up fully before the cooling coil opens up. The
chart on the right shows an example of good operation, when the OAD is open 100%
before the cooling-coil-valve is opened up.
31

땠еNote: When the user modifies the charts with the pivot table, the specified selection will
be saved if the user overwrites the previously saved workbook or creates a new file with
the desired pivot table selection. However, if the user does not save, then the pivot table
will revert back to the last time the file was saved and can be modified each time the user
opens the workbook.
The outdoor-air fraction (OAF) is not something that is calculated by ECAM, but is going to
be an added feature. The user can generate this manually, but the main takeaway is to look
at the mixed-air temperature data and make sure that it is between the outdoor and
return-air temperatures. As the MAT gets closer to the OAT, the OAF gets greater (closer to
1, or 100% outdoor air), and as the MAT gets closer to the RAT, the OAF gets smaller (OAF
closer to 0, or no outdoor air). However, to accurately use the OAF, make sure that the OAT
and RAT have at least 5oF difference between them.
32
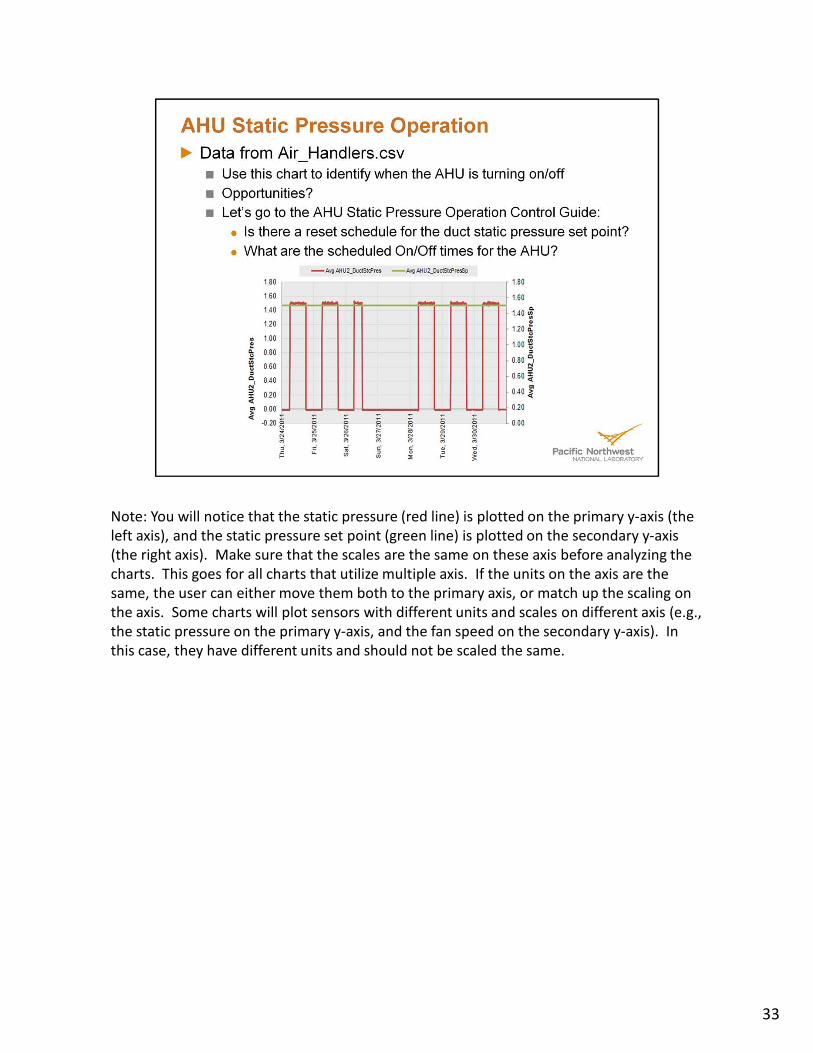
몐еNote: You will notice that the static pressure (red line) is plotted on the primary y-axis (the
left axis), and the static pressure set point (green line) is plotted on the secondary y-axis
(the right axis). Make sure that the scales are the same on these axis before analyzing the
charts. This goes for all charts that utilize multiple axis. If the units on the axis are the
same, the user can either move them both to the primary axis, or match up the scaling on
the axis. Some charts will plot sensors with different units and scales on different axis (e.g.,
the static pressure on the primary y-axis, and the fan speed on the secondary y-axis). In
this case, they have different units and should not be scaled the same.
33

좠жNote: In retuning, changing the set point for discharge static pressure or any temperature
or command in the system is the focus when trying to save energy or identify corrective
actions based on the performance of the system.
34

뙐е
35

밀еNote: There should be a second chart for the cooling coil valve command vs. the heating
coil valve command. However, since there was no heating coil valve command data given
by the BAS, this chart does not show up. Also, the top left chart should be the supply-air
temperature vs. the supply-air temperature set point. ECAM shows the y-axis as the set
point, but in reality it is the temperature and not the set point.
When analyzing the bottom left chart (OAD vs. OAT), there should be a positive linear trend
between 40oF and 60oF. This is because these temperatures are optimal for economizing,
and as the temperature gets closer to 60oF, the OAD should be closer to 100% open, and as
the temperature gets closer to 40oF the OAD should start to close to the minimum position.
This example appears to follow this guideline.
36
좠ж
37
띀е
38

뵠е
39
좠ж
40

렰е
41

뻐еNote: Many VAV box BAS controllers will only have 5 to 6 of these data points configured.
The zone discharge-air temperature and the fan status/fan command may not exist. This is
ok, the user should trend all points from this list that are available.
42

좠ж
43
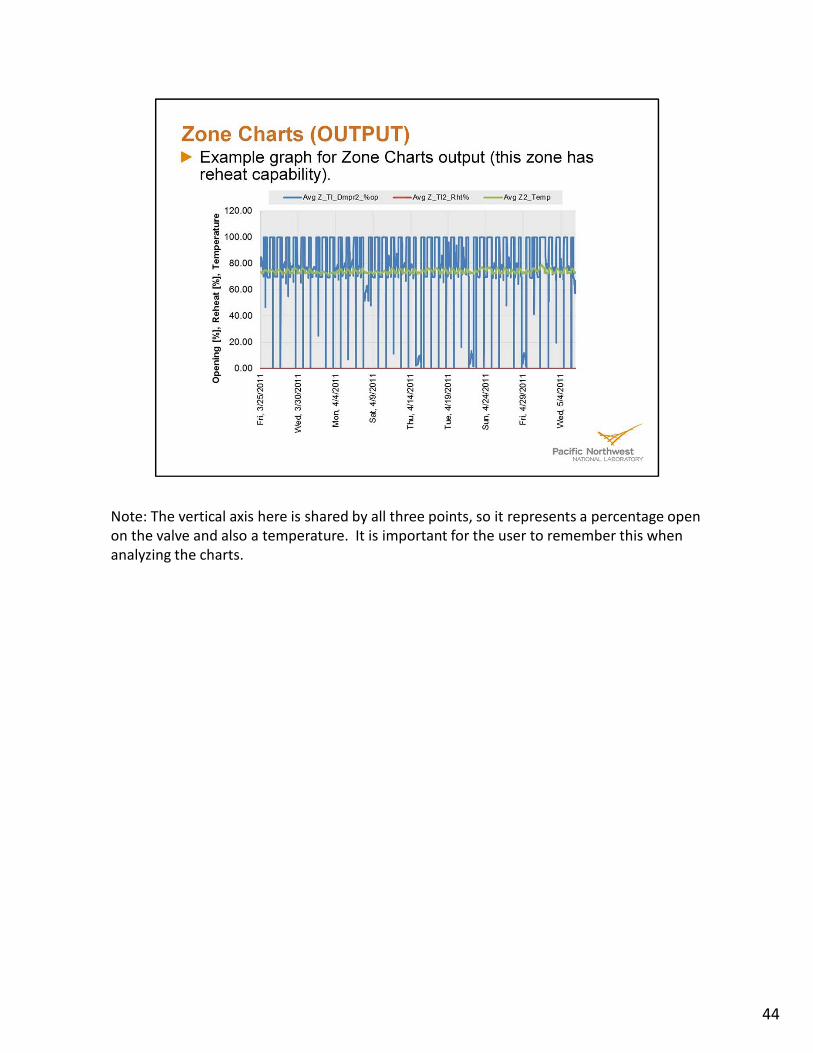
뤠еNote: The vertical axis here is shared by all three points, so it represents a percentage open
on the valve and also a temperature. It is important for the user to remember this when
analyzing the charts.
44

쀰еNote:
45

좠ж
46

먐е
47
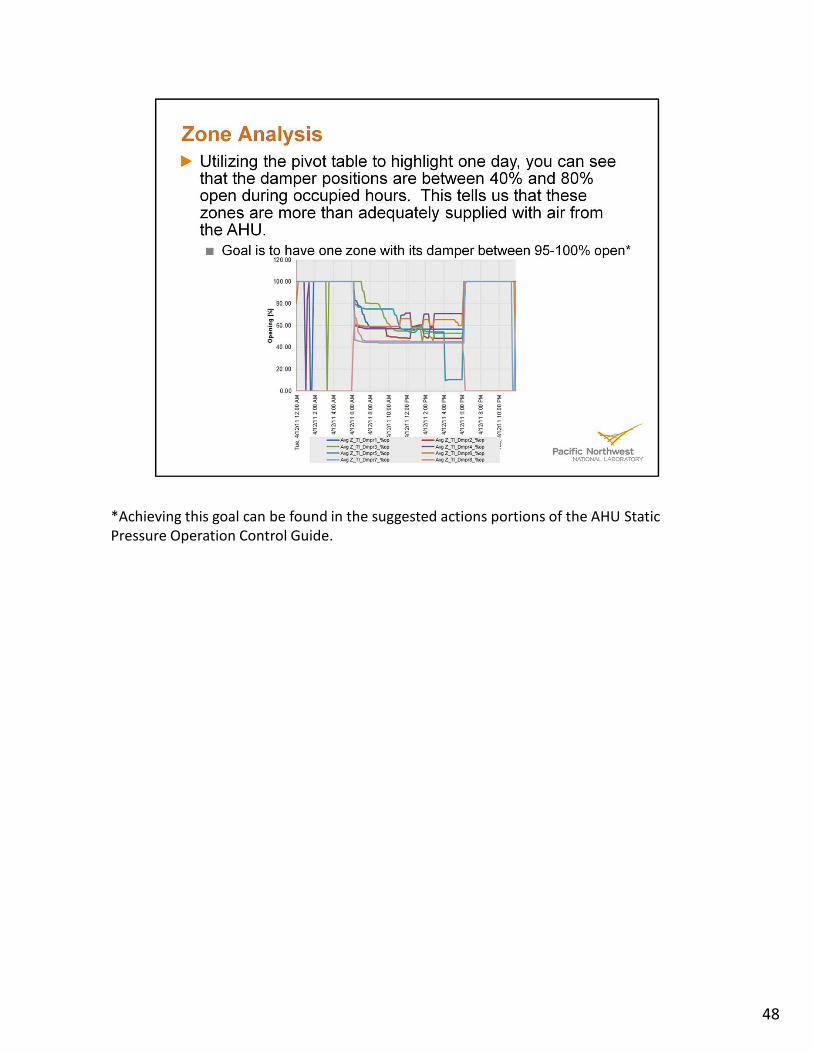
좠ж*Achieving this goal can be found in the suggested actions portions of the AHU Static
Pressure Operation Control Guide.
48

좠жNote: Although discharge-air temperature is not included in these charts, future additions
of ECAM are to add more charts and display them in a way that enable the user to analyze
them more efficiently.
49
좠ж
50

좠ж
51
52

믰еNote: The first chart (top left) is for the chilled water temperatures, the second chart (top
right) is for the hot water temperatures, and the third chart (bottom left) is for the chilled
water pump and outdoor-air temperature.
53

좠ж
54
좠ж
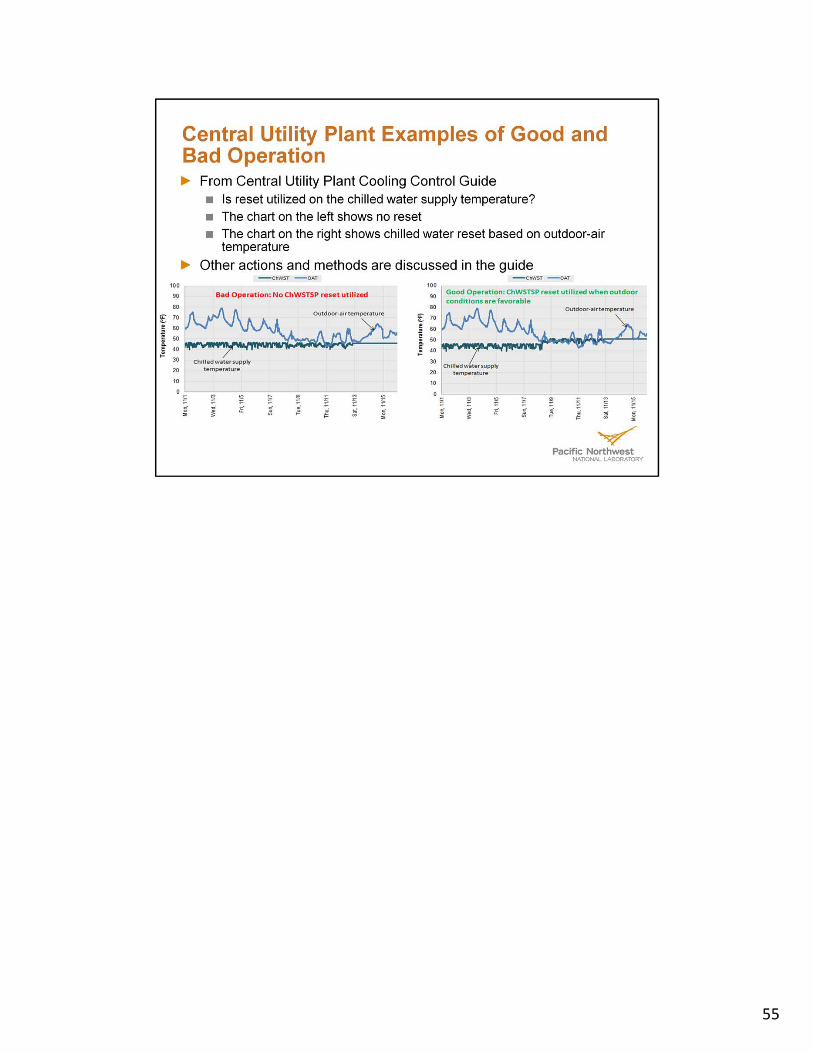
55
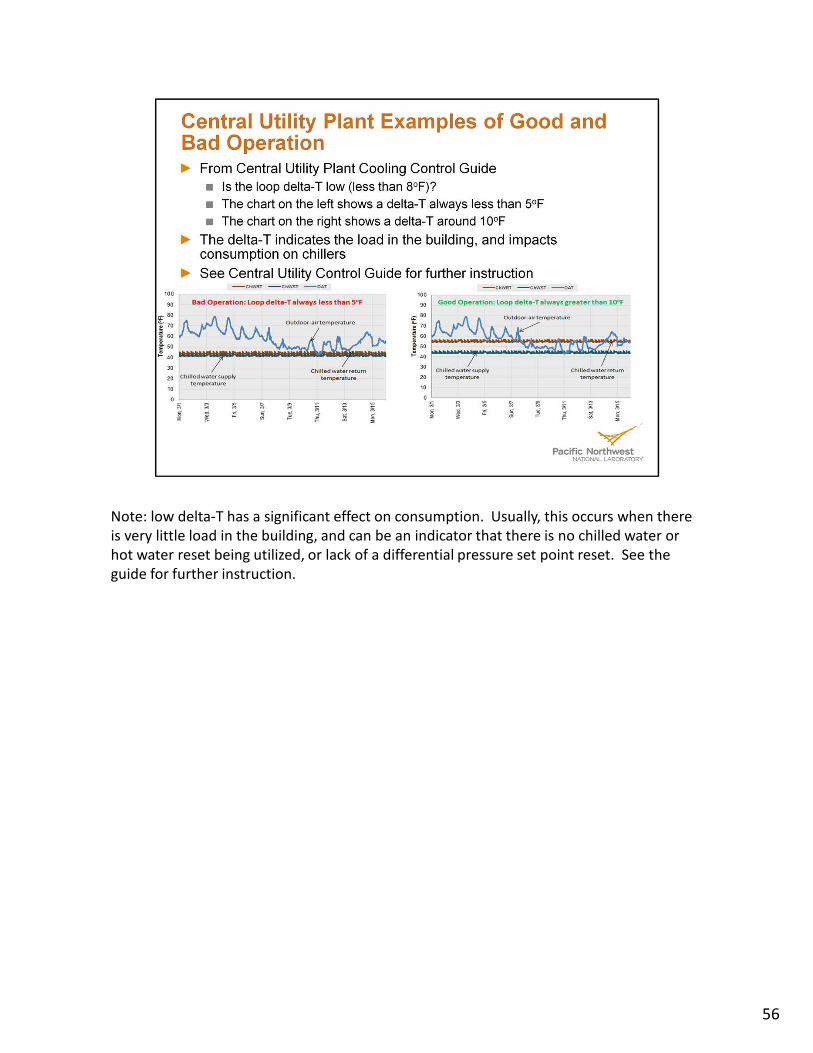
좠жNote: low delta-T has a significant effect on consumption. Usually, this occurs when there
is very little load in the building, and can be an indicator that there is no chilled water or
hot water reset being utilized, or lack of a differential pressure set point reset. See the
guide for further instruction.
56

봰е
57

좠ж
58

좠ж
59