to download the 2013 tti company report
TRANSCRIPT

Annual Report 2013
Powerful Brands InnovatIve Products excePtIonal PeoPle oPeratIonal excellence
6th page proof

Record Sales Record Profits
Techtronic Industries Company Limited (the “Company” or “TTI”) is a world-class leader in design, manufacturing and marketing of Power Tools, Outdoor Power Equipment, and Floor Care and Appliances for consumers, professional and industrial users in the home improvement, repair and construction industries. Our unrelenting strategic focus on Powerful Brands, Innovative Products, Operational Excellence and Exceptional People drives our culture.
Our brands and products are recognized worldwide for their deep heritage, superior quality, outstanding performance and compelling innovation. Through a company-wide commitment to innovation and strong customer partnerships, we consistently deliver new products that enhance customer satisfaction and productivity. This focus and drive provides TTI with a powerful platform for sustainable leadership and strong growth.
Founded in 1985 in Hong Kong, TTI has a portfolio of industry leading brands, a worldwide customer reach, and over 18,000 staff. TTI is listed on the Stock Exchange of Hong Kong and in 2013 had worldwide annual sales of USD4.3 billion.
Contents
1 Financial Highlights
4 Chairman’s Statement
6 Chief Executive Officer’s Strategic Review
8 Power Equipment, Accessories and Hand Tools Overview
10 Power Equipment, Accessories and Hand Tools
26 Floor Care and Appliances Overview
28 Floor Care and Appliances
36 Board of Directors
40 Management’s Discussion and Analysis
46 Corporate Governance Report
55 Report of the Directors
63 Independent Auditor’s Report
64 Consolidated Financial Statements
71 Notes to the Consolidated Financial Statements
155 Financial Summary
156 Corporate Information
1Techtronic Industries Annual Report 2013
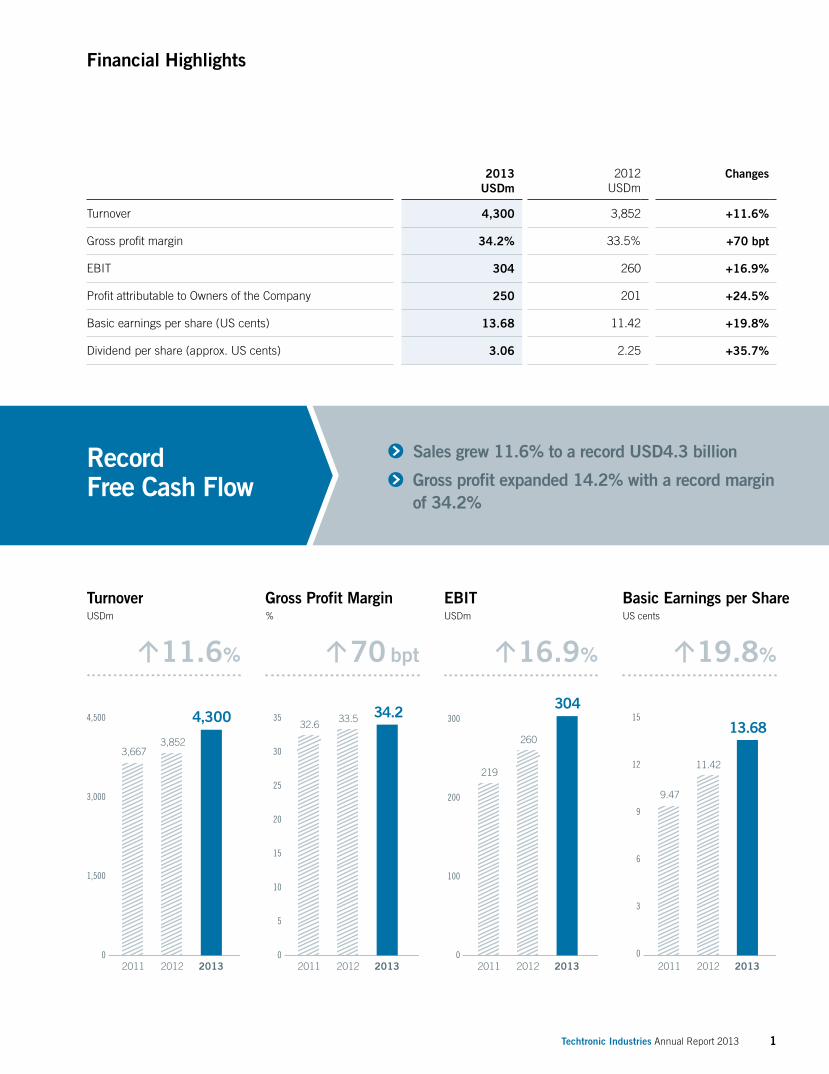
Financial Highlights
Turnover USDm
Gross Profit Margin %
EBIT USDm
Basic Earnings per ShareUS cents
Sales grew 11.6% to a record USD4.3 billion
Gross profit expanded 14.2% with a record margin of 34.2%
2013USDm
2012USDm
Changes
Turnover 4,300 3,852 +11.6%
Gross profit margin 34.2% 33.5% +70 bpt
EBIT 304 260 +16.9%
Profit attributable to Owners of the Company 250 201 +24.5%
Basic earnings per share (US cents) 13.68 11.42 +19.8%
Dividend per share (approx. US cents) 3.06 2.25 +35.7%
11.6% 70 bpt 16.9% 19.8%
Record Free Cash Flow
34.2
201320110
10
20
30
5
15
25
3532.6
2012
33.5304
201320110
100
200
300
219
2012
260
0
3
6
9
12
1513.68
20132011
9.47
2012
11.42
201320110
1,500
3,000
4,500 4,300
3,667
2012
3,852

2 Techtronic Industries Annual Report 2013
Record Sales Record Profits
Financial Highlights
Sales by Business Sales by Location
Floor Care and Appliances
Power Equipment, Accessories and Hand Tools73.1% 72.6% North America
20.2% Europe
7.2% Rest of the World26.9%
North AmericaUSDm
EuropeUSDm
Rest of the WorldUSDm
Turnover from Customers
11.2% 13.3% 11.5%
20132011
0
1,000
2,000
1,500
500
2,500
3,500
3,000
2,648
2012
2,807
3,120
350
20132011
0
300
600
900
764
2012
768
870
20132011
0
150
50
250
350
100
200
300
255
2012
277
20132011
0
2012
310

3Techtronic Industries Annual Report 2013
Record Sales Record Profits
ProfitUSDm
Net profit increased to USD250 million, growing 24.5%
Another strong year delivering free cash flow of USD332 million
Working capital improved to 13.9% of sales
Gearing improved and was lowered from 25.8% to 10.6%
Free Cash FlowUSDm
Working Capitalas % of sales
%
Gearing Ratio
%
0
20
40
60
2011 2012 2013
10.6
59.3
25.8
0
100
200
300
50
150
250
350
2011 2012 2013
150
275
332
0
100
200
50
150
250
2011 2012 2013
152
201
250
0
5
10
20
15
2011 2012 2013
18.9
16.213.9
Record Free Cash Flow
24.5% 20.7%
13.9% 10.6%
4 Techtronic Industries Annual Report 2013
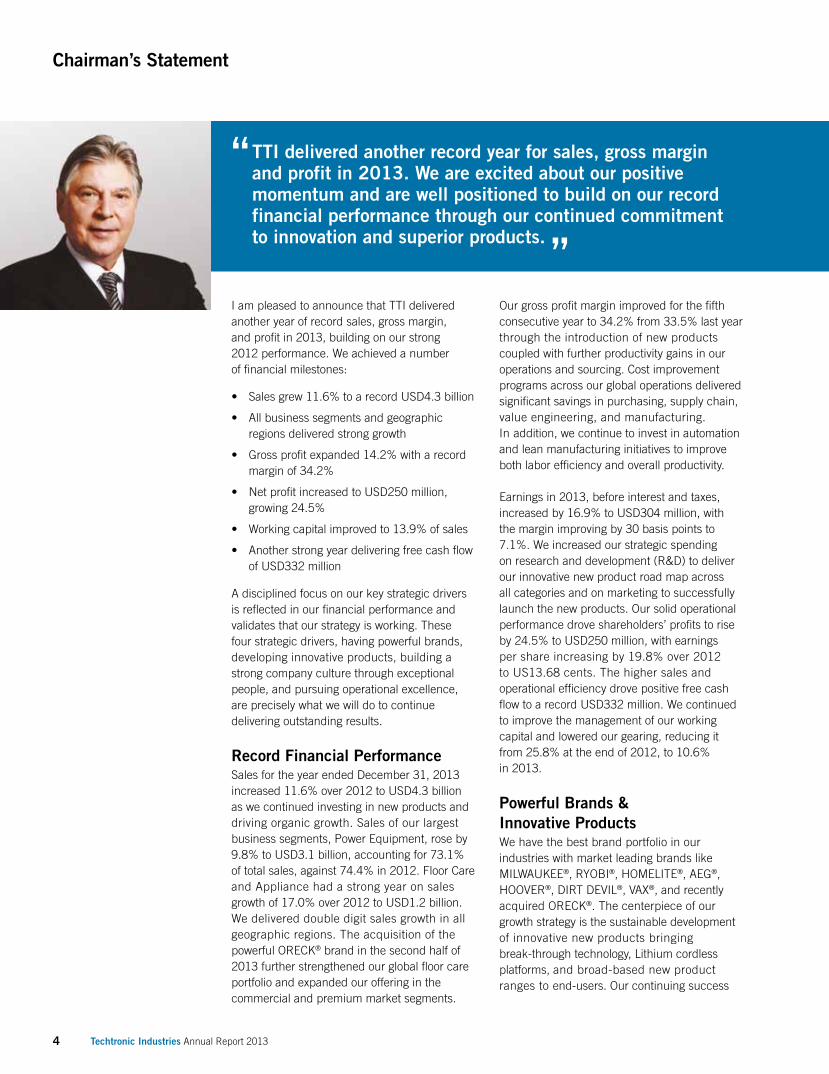
Chairman’s Statement
“ TTI delivered another record year for sales, gross margin and profit in 2013. We are excited about our positive momentum and are well positioned to build on our record financial performance through our continued commitment to innovation and superior products. „
Our gross profit margin improved for the fifth consecutive year to 34.2% from 33.5% last year through the introduction of new products coupled with further productivity gains in our operations and sourcing. Cost improvement programs across our global operations delivered significant savings in purchasing, supply chain, value engineering, and manufacturing. In addition, we continue to invest in automation and lean manufacturing initiatives to improve both labor efficiency and overall productivity.
Earnings in 2013, before interest and taxes, increased by 16.9% to USD304 million, with the margin improving by 30 basis points to 7.1%. We increased our strategic spending on research and development (R&D) to deliver our innovative new product road map across all categories and on marketing to successfully launch the new products. Our solid operational performance drove shareholders’ profits to rise by 24.5% to USD250 million, with earnings per share increasing by 19.8% over 2012 to US13.68 cents. The higher sales and operational efficiency drove positive free cash flow to a record USD332 million. We continued to improve the management of our working capital and lowered our gearing, reducing it from 25.8% at the end of 2012, to 10.6% in 2013.
Powerful Brands & Innovative ProductsWe have the best brand portfolio in our industries with market leading brands like MILWAUKEE®, RYOBI®, HOMELITE®, AEG®, HOOVER®, DIRT DEVIL®, VAX®, and recently acquired ORECK®. The centerpiece of our growth strategy is the sustainable development of innovative new products bringing break-through technology, Lithium cordless platforms, and broad-based new product ranges to end-users. Our continuing success
I am pleased to announce that TTI delivered another year of record sales, gross margin, and profit in 2013, building on our strong 2012 performance. We achieved a number of financial milestones:
• Salesgrew11.6%toarecordUSD4.3billion
• Allbusinesssegmentsandgeographicregions delivered strong growth
• Grossprofitexpanded14.2%witharecordmargin of 34.2%
• NetprofitincreasedtoUSD250million,growing 24.5%
• Workingcapitalimprovedto13.9%ofsales
• Anotherstrongyeardeliveringfreecashflowof USD332 million
A disciplined focus on our key strategic drivers is reflected in our financial performance and validates that our strategy is working. These four strategic drivers, having powerful brands, developing innovative products, building a strong company culture through exceptional people, and pursuing operational excellence, are precisely what we will do to continue delivering outstanding results.
Record Financial Performance Sales for the year ended December 31, 2013 increased 11.6% over 2012 to USD4.3 billion as we continued investing in new products and driving organic growth. Sales of our largest business segments, Power Equipment, rose by 9.8% to USD3.1 billion, accounting for 73.1% of total sales, against 74.4% in 2012. Floor Care and Appliance had a strong year on sales growth of 17.0% over 2012 to USD1.2 billion. We delivered double digit sales growth in all geographic regions. The acquisition of the powerful ORECK® brand in the second half of 2013 further strengthened our global floor care portfolio and expanded our offering in the commercial and premium market segments.
5Techtronic Industries Annual Report 2013
DELIvERING oUTSTANDING PERFoRMANCE
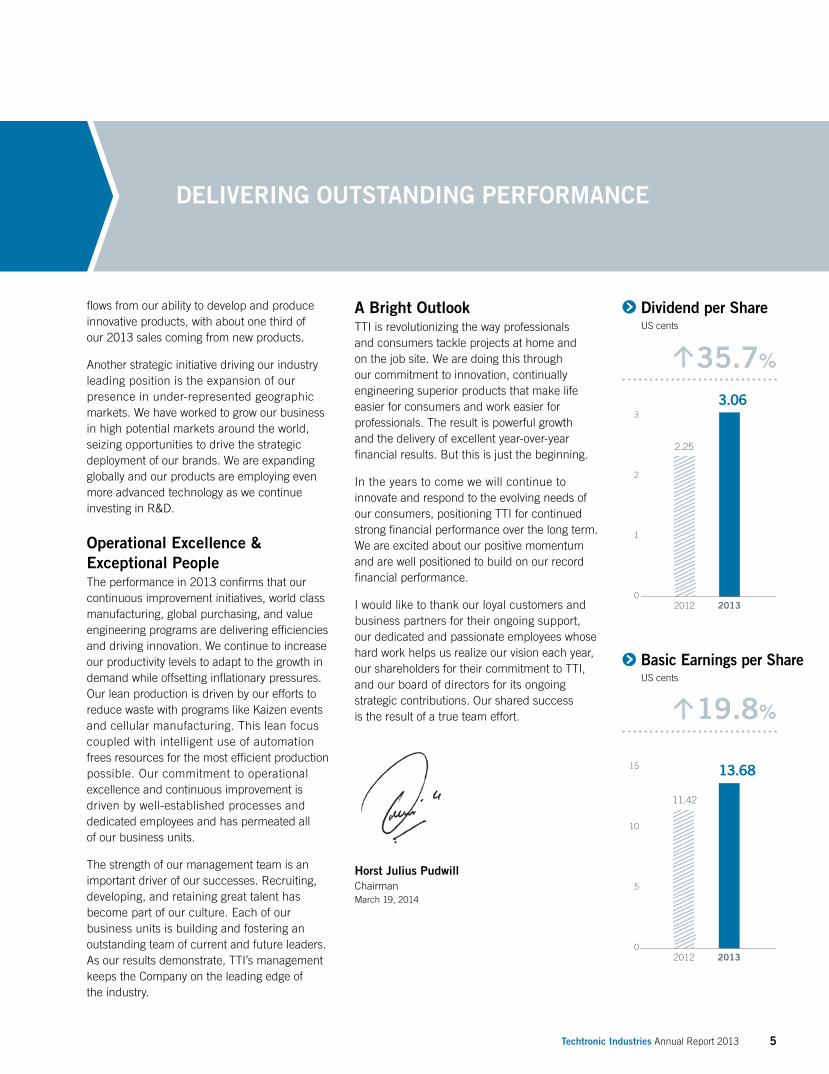
Dividend per ShareUS cents
Basic Earnings per ShareUS cents
20130
1
2
3
2012
2.25
3.06
0
5
10
15
20132012
11.42
13.68
35.7%
19.8%
flows from our ability to develop and produce innovative products, with about one third of our 2013 sales coming from new products.
Another strategic initiative driving our industry leading position is the expansion of our presence in under-represented geographic markets. We have worked to grow our business in high potential markets around the world, seizing opportunities to drive the strategic deployment of our brands. We are expanding globally and our products are employing even more advanced technology as we continue investing in R&D.
operational Excellence & Exceptional PeopleThe performance in 2013 confirms that our continuous improvement initiatives, world class manufacturing, global purchasing, and value engineering programs are delivering efficiencies and driving innovation. We continue to increase our productivity levels to adapt to the growth in demand while offsetting inflationary pressures. Our lean production is driven by our efforts to reduce waste with programs like Kaizen events and cellular manufacturing. This lean focus coupled with intelligent use of automation frees resources for the most efficient production possible. Our commitment to operational excellence and continuous improvement is driven by well-established processes and dedicated employees and has permeated all of our business units.
The strength of our management team is an important driver of our successes. Recruiting, developing, and retaining great talent has become part of our culture. Each of our business units is building and fostering an outstanding team of current and future leaders. As our results demonstrate, TTI’s management keeps the Company on the leading edge of the industry.
A Bright outlookTTI is revolutionizing the way professionals and consumers tackle projects at home and on the job site. We are doing this through our commitment to innovation, continually engineering superior products that make life easier for consumers and work easier for professionals. The result is powerful growth and the delivery of excellent year-over-year financial results. But this is just the beginning.
In the years to come we will continue to innovate and respond to the evolving needs of our consumers, positioning TTI for continued strong financial performance over the long term. We are excited about our positive momentum and are well positioned to build on our record financial performance.
I would like to thank our loyal customers and business partners for their ongoing support, our dedicated and passionate employees whose hard work helps us realize our vision each year, our shareholders for their commitment to TTI, and our board of directors for its ongoing strategic contributions. Our shared success is the result of a true team effort.
Horst Julius PudwillChairmanMarch 19, 2014

6 Techtronic Industries Annual Report 2013
STRATEGIC DRIvERS STRATEGIC RoADMAP
Chief Executive officer’s Strategic Review
• PowerfulBrands• InnovativeProducts• ExceptionalPeople• OperationalExcellence
• DriveSalesGrowth• GrossMarginEnhancement• OrganizationalDevelopment• OperatingCycleDevelopment• GenerateFreeCashFlow
Innovation: We convert end-user frustrations and problems into demonstrative solutions with our innovative, high performance products. We often make bold decisions to re-invent our products to deliver better solutions to our users. We are pioneering new technology applications through our R&D efforts across our product categories and continuing to innovate across all categories. We are investing strategically in our engineering capabilities to integrate our advanced technologies into our products.
Speed-to-market: We have created a powerful, streamlined, fast paced, and comprehensive product development process. TTI has a number of brand focused innovation centers in key markets dedicated to research, design, engineering technologies, and developing new products. Across our brands and innovation centers we drive product development through our high speed process to bring a broad range of breakthrough, value added, margin enhancing products to market.
We are striving to change our industries through innovation and are delivering on that.
Developing Great PeopleTTI has assembled an outstanding team of people. Our business unit leaders are industry veterans with exceptional track records and a passion for serving our customers. Across the organization we have the best people in our industries, with a good blend of company veterans and emerging young talent with fresh ideas. We will continue to develop our employees worldwide to support our growth goals.
At TTI we are highly focused on our strategic drivers: powerful brands, innovative products, exceptional people, and operational excellence. These are the keys to our continued growth and success. This strategic foundation is driving our business to record levels by empowering our people to create cutting edge products. It is our innovative technology in breakthrough new products like the MILWAUKEE® FUEL® line that are transforming the power tool industry. Our relentless focus on applying Lithium cordless technology to new categories in power tools, outdoor products, and floor care are revolutionizing these businesses. Our management team is committed to continue to tap the full potential of our business. We refuse to settle for anything less than being the best.
New Product MachineOur new product development system is a rigorous process that ensures high quality, game changing, and innovative products. We are producing a continuous stream of new products that excite end-users, overwhelm the competition, and change the respective industries. TTI invests heavily in product development and 2013 was no exception with research and development (R&D) spending up 34.7% to 2.5% of sales, a very sustainable level for us.
Our new product development system is central to our growth:
Commitment to the end-user: We work closely with our end-users to understand their needs, lifestyles, habits, and frustrations in search of product solutions. We intensely study our users, our industries, and our competitors in search of opportunities to deliver better products.
7Techtronic Industries Annual Report 2013
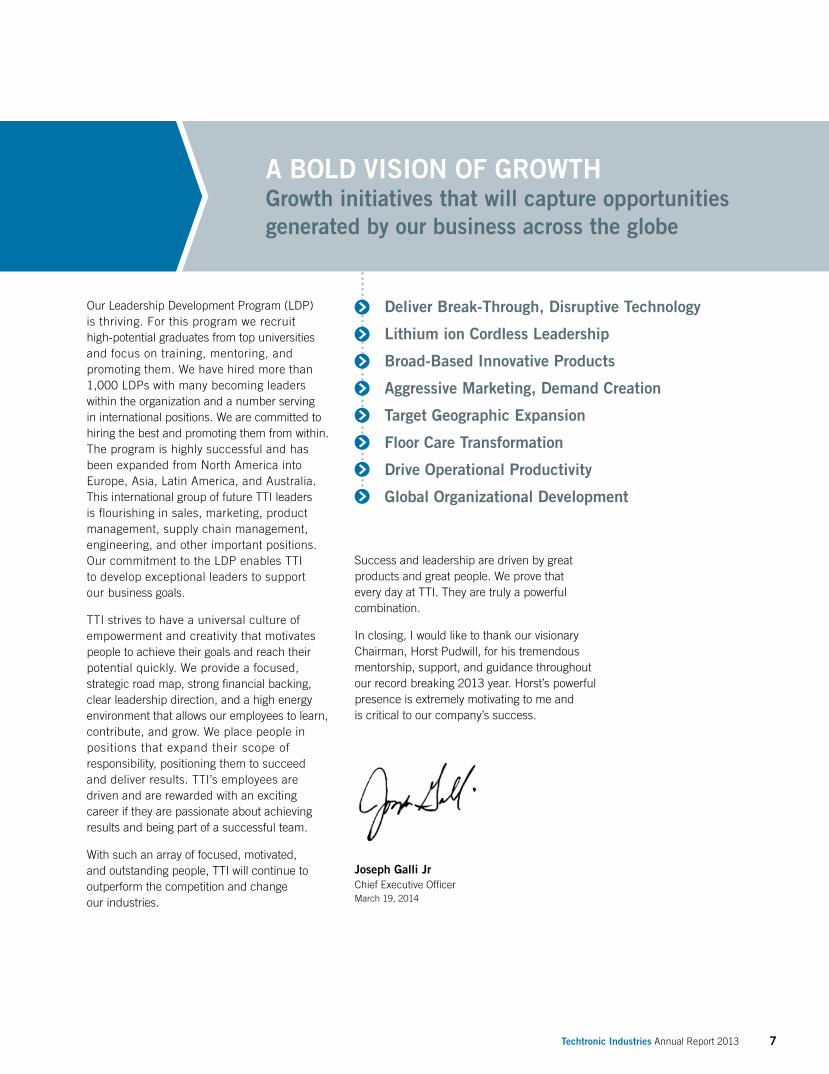
A BoLD vISIoN oF GRoWTHGrowth initiatives that will capture opportunities generated by our business across the globe
• DriveSalesGrowth• GrossMarginEnhancement• OrganizationalDevelopment• OperatingCycleDevelopment• GenerateFreeCashFlow
Our Leadership Development Program (LDP) is thriving. For this program we recruit high-potential graduates from top universities and focus on training, mentoring, and promoting them. We have hired more than 1,000 LDPs with many becoming leaders within the organization and a number serving in international positions. We are committed to hiring the best and promoting them from within. The program is highly successful and has beenexpandedfromNorthAmericaintoEurope, Asia, Latin America, and Australia. This international group of future TTI leaders is flourishing in sales, marketing, product management, supply chain management, engineering, and other important positions. Our commitment to the LDP enables TTI to develop exceptional leaders to support our business goals.
TTI strives to have a universal culture of empowerment and creativity that motivates people to achieve their goals and reach their potential quickly. We provide a focused, strategic road map, strong financial backing, clear leadership direction, and a high energy environment that allows our employees to learn, contribute, and grow. We place people in positions that expand their scope of responsibility, positioning them to succeed and deliver results. TTI’s employees are driven and are rewarded with an exciting career if they are passionate about achieving results and being part of a successful team.
With such an array of focused, motivated, and outstanding people, TTI will continue to outperform the competition and change our industries.
Success and leadership are driven by great products and great people. We prove that every day at TTI. They are truly a powerful combination.
In closing, I would like to thank our visionary Chairman, Horst Pudwill, for his tremendous mentorship, support, and guidance throughout our record breaking 2013 year. Horst’s powerful presence is extremely motivating to me and is critical to our company’s success.
Joseph Galli JrChief Executive OfficerMarch 19, 2014
Deliver Break-Through, Disruptive Technology
Lithium ion Cordless Leadership
Broad-Based Innovative Products
Aggressive Marketing, Demand Creation
Target Geographic Expansion
Floor Care Transformation
Drive operational Productivity
Global organizational Development

RYoBI® 40-voLT 24” CoRDLESS HEDGE TRIMMERRYOBI®takescordlesstechnologytothenextlevelwiththenew40-voltlithiumionOutdoorSeries.Designedfortheperfectmarriageofpowerandconvenience,thishedgetrimmerispowered bya40-voltlithiumionbattery.Thatmeans fade-freeperformance,maximumpower,andmaximumruntime.
Power Equipment, Accessories and Hand Tools overview
Power Equipment & Accessories
Consumer&TradeProfessionalIndustrial
8 Techtronic Industries Annual Report 2013

Hand Tools outdoor
ThePowerEquipmentbusinessisourlargestdivision andconsistsofpowertools,handtools,outdoorproductsandaccessories.In2013,salesinthisbusinessroseby9.8%toarecordUSD3.1billion.Wedeliveredgrowthinallgeographicmarketsandreportedstrongresultsinourindustrialdivision.Thebusinessaccountedfor73.1%ofGroupturnover,against74.4%in2012.Earningsgrew14.2%toUSD261milliononnewproducts,operationalefficiency,andsupplychainproductivity.
FloorCareandAppliances
Power Equipment, Accessories and Hand Tools73.1%
26.9%
Sales by Business
9Techtronic Industries Annual Report 2013

10 Techtronic Industries Annual Report 2013
PowerEquipment,AccessoriesandHandToolsIndustrial Power Tools
Products and TechnologyProducts•CordlessPowerTools,CordedPowerTools,Test&Measurement
diagnostic equipment
Cordless Platforms•Lithium-IonbatteriesM12®, M18®, M28® REDLITHIUM™
Technology•State-of-the-artmotortechnology–POWERSTATE™BrushlessMotor
•Advancedelectronics–REDLINKPLUS™Intelligence
•Upto2Xmorerun-time,20%morepower,and2Xmore
recharges–REDLITHIUM™Batteries
End-Users•Mechanical,electrical,plumbing,remodelingandmaintenance
repair professionals
Distribution•HomeCenterchannels,Hardware,IndustrialMRO,Plumbing,Electrical,
Farm and Agriculture, Construction and Automotive channels
Deliveringunmatchedperformance,theM18FUEL™linefeaturesthreeMILWAUKEE®-exclusiveinnovations: thePOWERSTATE™BrushlessMotor,REDLITHIUM™BatteryPackandREDLINKPLUS™IntelligenceHardwareandSoftware.Theresultiscordlesstoolswithunrivaledpower,run-timeanddurability.
Ourmissionincordlessdesignistointroducenewsolutionsthatmaketradesmenonthejobsitemoreproductive.Workingside-by-sidewith usersduringthedesignandtestingprocessgivesustheabilitytodelivergame-changingsolutions.
™

11Techtronic Industries Annual Report 2013
NorthAmerica International
M18® 2-SPEED GREASE GUNDelivering maximum performance and
unmatched precision, this new Grease Gun
delivers up to 10,000psi operating pressure
and features a new-to-world pre-set grease
counter to dispense exact amounts of grease.
M18® LED FLooD LIGHTDelivering best-in-class light output, functionality and
durability, the new light features eight powerful LEDs to
provide 30% brighter light output and better illuminate
large work spaces for maximum productivity.
NExT GENERATIoN DRILLING & FASTENING TooLSMILWAUKEE® continues to deliver best-in-class
solutions with upgrades to key products.
Newmodelsintroducedthisyearwill
feature improved ergonomics and
increased performance.
TMTM
M18® JoBSITE RADIo/CHARGERThe M18® Jobsite Radio/Charger is the first
charging radio to bring the power of Bluetooth®*
to the jobsite. Delivering the industry’s best
reception and sound, it lets you stream wireless
audio from over 100 feet away. Equipped with
a reinforced roll cage to protect against harsh
conditions, this radio allows you to charge
your M18® batteries, or any other devices
you need via USB port.
® ®
*BLUETOOTH is a registered trademark of Bluetooth SIG, Inc.

12 Techtronic Industries Annual Report 2013
PowerEquipment,AccessoriesandHandToolsAccessories
High Performance. Breakthrough Productivity.
Engineered to stand up to the
hardest, most abrasive materials
on the jobsite. The new diamond
grit hole saw utilizes a higher
grade of diamonds and
heat-resistant braze to deliver
best-in-class performance of
up to 10X longer life.
DIAMoND PLUS™ HoLE SAWS
OurmissionforPowerToolAccessoriesistodeliverbreakthrough innovationsthatsolvejobsiteproblemsandmakeourcoreusersmoreproductive.Wearecommittedtopushingthelimitsofperformancethroughinvestmentsindisruptivemanufacturingtechnologiesandcreativedesigns.Ournewproducteffortsproducevisuallydifferentiatedattributesthatreinforceademonstrableperformanceadvantagevs.ourcompetition.
Products and TechnologyProducts• Sawbladesandholesaws •Fasteningaccessories
• Masonrydrillinganddemolition •Woodboringbits
• Metaldrillbitsandcutters
Technologies•EngineeredsawingtoothformsincludingNailGuard™andDoubleDuty™
•Shockwave™ImpactDutydrivingtechnologies
•Switchblade™woodboringreplacementbladesystem
•ProprietaryhighspeedsteelheattreatingincludingIceHardened™
13Techtronic Industries Annual Report 2013
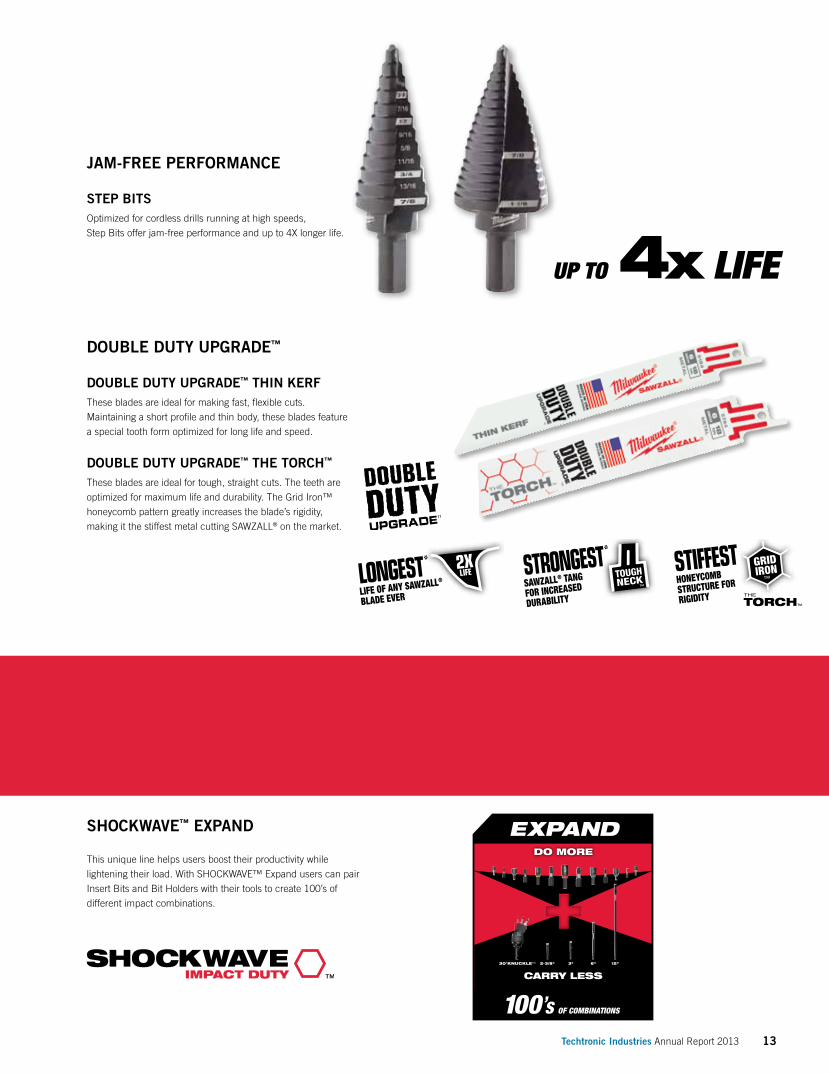
STEP BITSOptimized for cordless drills running at high speeds,
Step Bits offer jam-free performance and up to 4X longer life.
DoUBLE DUTY UPGRADE™
JAM-FREE PERFoRMANCE
DoUBLE DUTY UPGRADE™ THIN KERFThese blades are ideal for making fast, flexible cuts.
Maintaining a short profile and thin body, these blades feature
a special tooth form optimized for long life and speed.
DoUBLE DUTY UPGRADE™ THE ToRCH™
These blades are ideal for tough, straight cuts. The teeth are
optimized for maximum life and durability. The Grid Iron™
honeycomb pattern greatly increases the blade’s rigidity,
making it the stiffest metal cutting SAWZALL® on the market.
UP TO LIFE*X4
SHoCKWAvE™ ExPAND
This unique line helps users boost their productivity while
lightening their load. With SHOCKWAVE™ Expand users can pair
Insert Bits and Bit Holders with their tools to create 100’s of
different impact combinations.

14 Techtronic Industries Annual Report 2013
Ultimate Productivity. Superior Performance.
Withover100newtoolsin2013,we’recontinuouslyexpandingour HandToolline.Dedicatedtodeliveringsolutionstoincreaseproductivity,theHandToolgroupfocusesonprovidingapplication-specificfeaturestotheelectrical,mechanical,HVAC,MROandremodelingtrades.
Products and TechnologyProducts•CuttingandFastening •TapeMeasures
•Layout •Blades
•Screwdriving •Saws
•Knives
Platforms•FASTBACK™, FASTBACK™UtilityKnives,Hollow-CoreNut
Drivers, INKzALL™ Jobsite Markers, Torque Locking Pliers
Technologies•Tapemeasurenylonbondbladeprotection
for up to 10X longer life
•Microcarbidedispersedmetalutilityblades
for up to 3X longer life
•JobsiteStylistMarker
PowerEquipment,AccessoriesandHandToolsHand Tools

15Techtronic Industries Annual Report 2013
LoCKING PLIERSThis tool was inspired by our customers. Using
a screwdriver, workers are able to turn the
Torque Lock™ key to fix the pliers into place,
with the desired torque.
HAND CLAMPSFeaturing a revolutionary smooth
action clamp and release mechanism,
it offers up to 2X the clamping force of
other ratcheting hand clamps.
MAGNETIC TAPE MEASURESThis innovative tool features 10X the life of leading competitors.
Each Tape Measure is outfitted with user-inspired enhancements
like a finger stop for protection during blade retraction, as well as
dual magnets that prevent rollover when measuring.
INKZALL™ JoBSITE MARKERSFeatures a clog-resistant tip
that will write on dusty, oily or
wet surfaces, or a stylus tip
for use with mobile devices.
1000-voLT INSULATED SCREWDRIvERS Our UL®* Classified Screwdrivers are 1000-volt
rated, providing best-in-class safety for users working
on energized and high-voltage equipment.
FASTBACK™ KNIvESDesigned to activate 3X faster than two-handed
opening, FASTBACK™ knives open easily with
the press of a button and a flip of the wrist.
Techtronic Industries Annual Report 2013
* UL is a registered trademark of Underwriters Laboratories Inc.

16 Techtronic Industries Annual Report 2013
PowerEquipment,AccessoriesandHandToolsHand Tools
STILETTO®setsthestandardwithpremiumTitaniumhandtoolsandhammersthatare45%lighterthansteel,whileprovidingthesamestrikingforceandstrength.Inaddition,Titaniumtoolsproduce10Xlessrecoilshock,whichmeanslessdowntimeduetoinjury,moreproductivityandmostimportantlylesspainwhilegettingthejobdone.
Products and Technology Products• Hammers,Lath&DrywallAxes,NailPullers,
Pry Bars and Air Grips
Technology• Patented:TitaniumConstruction,180DegreeSideNail
Pullers, Replaceable Faces, Staple Pullers and Dimplers
End-Users• Avarietyoftradesmenincludingcarpenters,masons,
demolition workers and remodelers
Distribution• Homecenters,hardwarestoresandlumberyards
STILETTo® FIBERGLASS HAMMERSWith an 18” Poly/Fiberglass handle and 14oz
Titanium Head, the STILETTO® Fiberglass Hammer
provides increased strength and the driving power
of a 24oz Steel Hammer. The straight claw design
and magnetic nail starter allow for better nail pulling
and one handed, easy start nails.
STILETTo® HAMMERSWith exceptional design and best-in-class
materials, STILETTO® Hammers are the lightest,
most innovative high-performance hammers
available today.
STILETTo® PRY BARSThe multi-fulcrum design of STILETTO® Pry
Bars provides maximum leverage during
prying applications.
STILETTo® NAIL PULLERSSTILETTO®NailPullersfeatureaninnovative
dimpler which allows for the clean removal
of nails without splitting the wood grain.
16 Techtronic Industries Annual Report 2013

17Techtronic Industries Annual Report 2013
HART® 3.5lbs AxEThe HART® 3.5lbs Axe is equipped with
an arsenal of Signature Features including
Face Cutouts, a Forged Head, SureGrip™
overmold, and much more.
HART® 12lbs SLEDGE HAMMERPower through demolition 44% more efficiently with
the patented PowerStrike™ face Signature Feature.
HART® PRY AND MoLDING BARSMake nail and molding removal
easy with the forged 15” Pry Bar
and 4-in-1 Molding Bar.
HART® HAMMERSPreferred choice of framing contractors
because of the many Signature features
such as the magnetic nail set and the
angled drive face.
HART®productsfocusondeliveringinnovativeSignatureFeaturessuchasexceptionalweightbalanceratio,polishedhammerheads,progressiveangledfacehammerdesigns,sidenailpulls,forgedheadsandPowerStrike™faces.Inaddition,HART®ToolsaredesignedandbuilttowithstandtherigorsofaProfessionalJobsite.HART®’sline ofinnovativeproductsassureyouthatNOTHINGHITSHARDER™.
Products and Technology Products•Hammers,Sledges,Mattocks,Wedges,PryBars,Chisels,AxesandMauls
Technology•HammerSideNailPull,AngledStrikeFaceandMagneticNailSet
•SledgeHammerPowerStrike™Face
•MattocksPowerFinDesign
End-Users•ProfessionalsandDo-It-Yourselfers
Distribution•HomeCentersandHardwareStores
17Techtronic Industries Annual Report 2013

18 Techtronic Industries Annual Report 2013
TheAEG®powertoolsbrandhasbeendeliveringhigh-performancetoolssince1898.115yearslaterandnothinghaschanged,AEG®PowerToolscontinuestopushboundariesandinnovatewithacurrentfocusonthecordlesssector,harnessinglithiumionpoweraswellamyriadoftraditionalbuthighlyinnovativecordedtools.
Products and Technology Products•CordlessandCordedPowerTools
Cordless Platforms•PROLITHIUMION™CordlessSystem12-volt14.4-voltand18-volt
•OMNIPRO® MULTITOOL system with interchangeable heads
•CordlessandCordedPowerTools,andsupportaccessories
End-Users•Professionaltradesmen,Contractors
Distribution•Professional/Traditionaltradeandwholesaledistribution
•ProfessionalsectionofModernchannelsandHomeCenters
AEG® 18-voLT LITHIUM IoN HAMMERTheAEG®18-voltlithiumioncompacthammerdrillhasanewpowerfulnewframelessmotor thatdelivers70Nmmaximumtorquewith a24stagetorqueadjustmentforcompletecontrolanda3modeselectorofeaseof controlbetweenapplications.Itispowered byAEG®PROLITHIUMION™batterytechnologywithoverloadprotectionformaximumdurability ofbatteryandtool.
PowerEquipment,AccessoriesandHandToolsProfessional Power Tools

19Techtronic Industries Annual Report 2013
18-voLT LITHIUM IoN PoWER TooLSAEG®’s cordless 18-volt offering continues to expand, with
aparticularfocusonPROLITHIUMION™cordlessbattery
technology delivering improved power output and run-time.
MASTER oF ALL TRADESOMNIPRO® is a revolutionary system allowing users to
tailor their system depending on application. The system
comes with a wide variety of heads ready to tackle almost
any challenge. The body comes in three different
versions,12V–designedforergonomics,18V–forpower
&controlandanACversion–idealforlongruntimes.
TRADESMANThe tradesman drill drivers and hammer drill drivers have all
the features required for todays professional end users. Across
12-volt, 14.4-volt and 18-volt platforms.
18V–BESTFORPOWER 12V–BESTFORERGONOMICS AC–BESTFORRUNTIME
LATEST BATTERY TECHNoLoGYThe second generation cordless technology of AEG®PROLITHIUMION™
technology, guarantees users receive more run-time, longer life and overall more
productivity. The triple protection system protects the battery cells from over-heating,
over loading, and over/under charging, offering optimum performance at all levels.
The new 2Ah & 4Ah batteries are available in 12V and 18V versions.
™

20 Techtronic Industries Annual Report 2013
Products and Technology Products•CordlessandCordedPowerTools
• PowerToolAccessories
Technology• 18-voltONE+SYSTEM®
• Lithiumion&LITHIUM+®
• AIRSTRIKE™
Accessory Technology• SPEEDLOAD+®
• Universal Shank Jig Saw Blades
PowerEquipment,AccessoriesandHandToolsConsumer and Trade Power Tools
End-Users•Do-It-YourselfandCostConsciousProfessionals
Distribution• HomeCentersandHardwarestores
RYoBI® 18-voLT NAILERCordlessconveniencefeaturing AIRSTRIKE™Technology,whicheliminatestheneedfornoisycompressors,bulky hosesorexpensivegascartridges.
RYOBI®offersthemostextensiveawardwinningandinnovativelineofconsumerfocusedproductsandaccessoriesforworldwideuse.TheRYOBI® powertoolrangeisanchoredbythe18-voltONE+SYSTEM®ofover 50products,rangingfromdrills,drivers,sawsandtrimmerstosanders.

21Techtronic Industries Annual Report 2013
RYoBI® 18-voLT oNE+ SYSTEM®
ofover50+toolsletsyoubuy18-voltcordless
tools, batteries and chargers individually,
in any combination and order you choose.
RYoBI® 18-voLT oNE+® oRBITAL JIG SAWTheONE+® Orbital Jig Saw provides the user with corded
like performance and features the patented BLADESAVER™
technology. BLADESAVER™, a first-to-market innovation,
features a drop base design that allows users to adjust the
base to utilize unused teeth, resulting in optimal blade use.
RYoBI® 18-voLT oNE+® AIRSTRIKE™ TheONE+®BradNailer,FinishNailerandNarrow
Crown Stapler features AIRSTRIKE™ Technology, which
eliminates the need for noisy compressors, bulky hoses
or expensive gas cartridges. This means faster setup
and easier maneuvering on the job site or at home.
RYoBI® 18-voLT oNE+® 6PC LITHIUM+® ULTIMATE CoMBo KITThe ultimate power tool collection,
powered by the next generation
of lithium ion performance.
RYoBI® 18-voLT oNE+® LITHIUM+® HIGH CAPACITY BATTERYNextgenerationLITHIUM+® technology
provides the end user with the best value and
performance proposition in the marketplace.
RYoBI® JIG SAW BLADESThe Universal Shank Jig Saw Blades are the first
of a kind market innovation. The blades are
designed with U and T shank capability which
takes the guesswork out of jig saw blade selection. NorthAmerica Australia&NewzealandEurope

22 Techtronic Industries Annual Report 2013
Products and Technology Products•GasandElectricPoweredTrimmers,Blowers,Chainsaws,HedgeTrimmers,
Lawn Mowers, Pressure Washers and Generators
Cordless Technology• 4-volt,18-volt,36-volt&40-voltlithiumionSystems,BrushlessMotor
Technology increases efficiency and optimizes performance of the tool
Accessory Technology• EXPAND-IT® Attachments
End-Users• Do-It-Yourselfhomeownersandgardenenthusiasts
Distribution• HomeCenters,GardenCentersandHardwareStores
PowerEquipment,AccessoriesandHandToolsoutdoor Products
RYoBI® 40-voLT LITHIUM IoN SYSTEMThe RYOBI® 40-volt lithium ion system introduced four new tools providing
Gas-Like Power. The 40-volt System powers nine tools using the same
40-volt battery. The lithium ion battery delivers powerful performance
and is quiet and convenient.
RYoBI® 40-voLT-x ExPAND-IT®
STRING TRIMMERRYOBI®40-volt-XEXPAND-IT® String Trimmer
is going to revolutionize the market. This
trimmer delivers gas-like power and
accepts gas attachments.
RYoBI® 40-voLT LITHIUM IoN BATTERYThe first to take lithium ion
outdoors, RYOBI® introduced its
most powerful battery ever with
the 40-volt lithium ion. It delivers
fade-free power and longer run
time to over nine 40-volt tools.
RYOBI®brandhasinvestedyearsofresearchintobringingthehigh-performance36-voltand40-voltlithiumioncordlesstoolstothemarket.The36-voltand 40-voltlinesincludestringtrimmers,hedgetrimmers,edgers,blowers, chainsaws,andmowers.

23Techtronic Industries Annual Report 2013
RYoBI® 40 voLT LITHIUM-IoN SYSTEMThe RYOBI 40V Lithion-ion system introduced four new tools providing
Gas-Like Power. The 40V System powers 9 tools using the same 40-volt
battery. The lithium-ion battery delivers powerful performance and is quiet
and convenient.
RYoBI® 18-voLT oNE+® HEDGE TRIMMERLightweightandeasytooperate,the18-voltONE+® Hedge
Trimmer features a dual-action blade, for less vibration and
increased user comfort.
RYoBI® 18-voLT LITHIUM IoN BATTERIESRYOBI® 18-volt lithium ion batteries are lighter, have up to
4timeslongerruntimesthanNiCadbatteries,EcoOptions
certified and work in over 50 RYOBI®18-voltONE+® tools.
RYoBI® 18-voLT LITHIUM IoN SYSTEMTherearemorethan50greatitemsinthe18-voltONE+
SYSTEM® since 1996. All work with any RYOBI® 18-volt
tool and are compatible with any RYOBI® 18-volt battery.
RYoBI®18-voLT oNE+® HYBRID TooLS RYOBI® introduces a revolution in outdoor
power–theonlyoneinthemarketplace
offering Hybrid technology. Dual-power
with a battery or corded connection
for limitless power
and mobility.

24 Techtronic Industries Annual Report 2013
Products and Technology Products•GasTrimmers,Blowers,Chainsaws,HedgeTrimmers,LawnMowers,
Log Splitters, Pressure Washers and Generators
Gas Technology• 2-Cycle&4-Cycle
Accessory Technology• EXPAND-IT® Attachments
End-Users• Do-It-Yourselfhomeownersandgardenenthusiasts
Distribution• HomeCenters,GardenCentersandHardwareStores
RYoBI® PRESSURE WASHERS RYOBI® pressure washers are designed with
onegoalinmind–tohelpourconsumers
clean better and clean faster.
RYOBI®gasproductsdeliverpowerfulperformancetechnologyacrossits2-cycleand4-cycleplatforms.Productsincludestringtrimmers,hedgetrimmers,blowers,chainsaws,wheeledtrimmers,pressurewashersandgenerators.
RYoBI® GAS PRoDUCTS The RYOBI® line of 2-cycle
and 4-cycle gas hand-held
products deliver power
and versatility.
PowerEquipment,AccessoriesandHandToolsoutdoor Products
RYoBI® INvERTER GENERAToRWhen you need power at the job-site the RYOBI® 2200W Quiet Inverter Generator is ready
with clean, quiet power that won’t harm sensitive electronics.

25Techtronic Industries Annual Report 2013
Products and Technology Products•GasandElectricPoweredTrimmers,Blowers,Chainsaws,HedgeTrimmers,
Lawn Mowers, Log Splitters, Pressure Washers, Generators
Technology•HOMELITE® products are designed to provide consumers great
performance at an incredible value.
End-Users•Homeownersandgardenenthusiasts
Distribution•HomeCenters,GardenCentersandHardwareStores
HoMELITE® PRESSURE WASHERS HOMELITE®’s line of entry level
gas pressure washers deliver
maximum power and
incredible reliability at
reasonable prices.
HoMELITE® ELECTRICSThe full range of HOMELITE®
electric outdoor tools deliver
simple, dependable
performance.
HOMELITE®ConsumerProductsmanufacturesafulllineofOutdoorPowerEquipmentincludingstringtrimmers,blowers,chainsaws,hedgetrimmers,pressurewashers,generatorsandoutdooraccessoriesfortheconsumer,do-it-yourselfandgardenenthusiast.
HoMELITE® CHAINSAWSHOMELITE® offers a value-driven selection of homeowner chainsaws that
weigh in at less than 10lbs, but still carry a big bite.

Floor Care and Appliances overview
Premium Cleaning Commercial
WE REMovED THE CoRD BUT KEPT EvERYTHING ELSE.It’sasimplechangethatchangeseverything.LITHIUMLIFE™batterytechnologyprovides 50minutes*ofruntimewithnoplugsrequired.NowgetthepowerofaHOOVER®upright– setfree.
* on average on carpet and hard floors using two batteries
®
®
26 Techtronic Industries Annual Report 2013
High-Performance Consumer
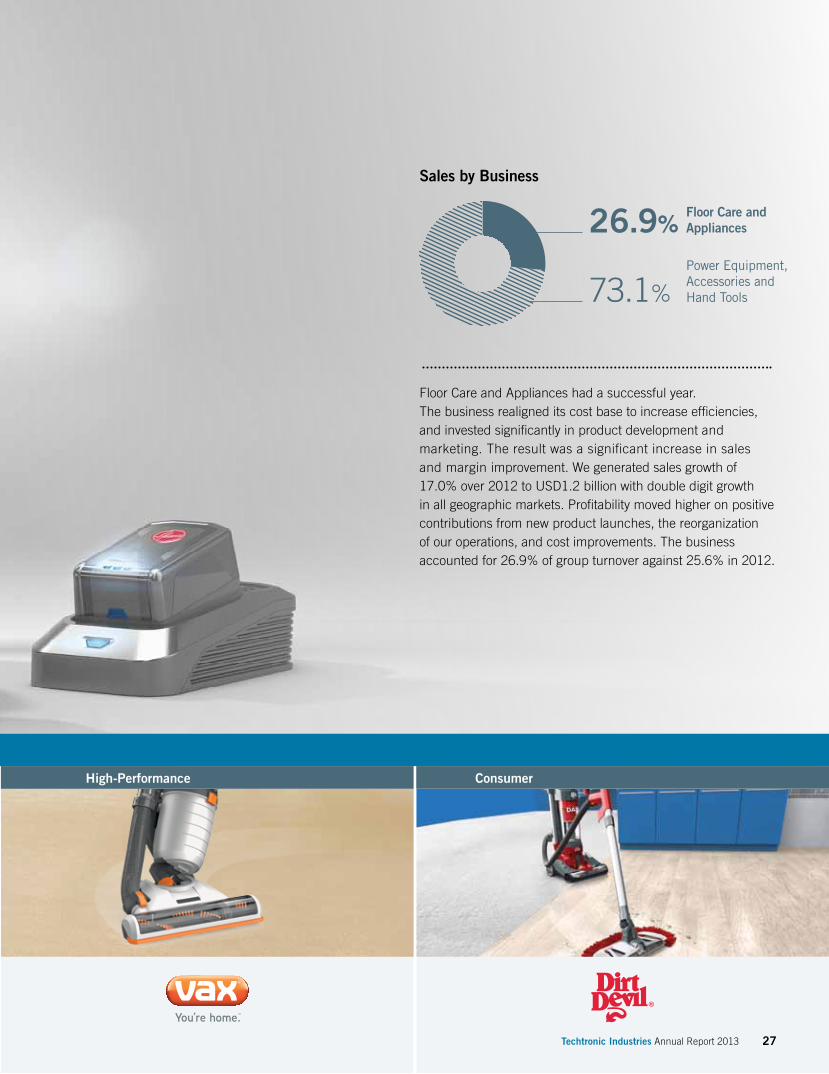
Floor Care and Appliances had a successful year. The business realigned its cost base to increase efficiencies, and invested significantly in product development and marketing. The result was a significant increase in sales and margin improvement. We generated sales growth of 17.0% over 2012 to USD1.2 billion with double digit growth in all geographic markets. Profitability moved higher on positive contributions from new product launches, the reorganization of our operations, and cost improvements. The business accounted for 26.9% of group turnover against 25.6% in 2012.
Floor Care and Appliances
PowerEquipment,AccessoriesandHandTools73.1%
26.9%
Sales by Business
27Techtronic Industries Annual Report 2013

28 Techtronic Industries Annual Report 2013
HOOVER®iscreatingthefutureofFloorCare.Werecognizethatpeople’shomesandlivesareconstantlyevolving,andwe’rechangingwiththem. Weareproudthateachofthe700patentswecurrentlyholdrepresentsachallengewe’veovercomeinourdrivetomakenew,powerfulanddesirablecleaningproducts.Wewanttoberecognizedformakingpeople’sliveseasierandsowemakethosethatdothecleaningthefocusofeverythingwedo.
Products and Technology Products• Upright–BaggedandBagless
• Canister–BaggedandBagless
• Stick
• LithiumionCordless
• HandheldVacuums
• CarpetWashersandSolutions
• HardFloorCleanersandSolutions
• SteamCleanersandCleaningSolutions
• SpecialtyGarageUtility
• CleaningSystemsandAirPurification
Technology• WINDTUNNEL®andWINDTUNNEL® MAX™,
MultipurposeSPINSCRUB®, Max Extract®,
Max Extract® Pressure Pro, Bagged, Bagless
Cyclonic,WIDEPATH™Nozzlesuction,
DUAL V® Twin Air Path Suction, Dual Tank Water
Filtration and lithium ion cordless
AIR® CoRDLESSFinally,afull-sizecordlessvacuumthatcancleanyourwholehome.BuiltonthestrongfoundationoftheAIR®rangeofproducts andpoweredbyLITHIUMLIFE™batteries,AIR®Cordlessprovidesfulluprightpower andcapacity,witha50-minute*runtime andanultra-light9.9lbsframe.
FloorCareandAppliances
Lift deep down messes. Three channels of suction lift and
remove surface debris and deep down embedded dirt.
VacuumswithoutWINDTUNNEL® Technology rely on only
one channel of suction.
Distribution• LeadingHomeCenters,MassMerchants,
Catalogue, TV Shopping, Online Retailers
* on average on carpet and hard floors using two batteries
®

29Techtronic Industries Annual Report 2013
DUAL PoWER™ CARPET WASHER Deep cleans on the double. The
DUAL POWER™ Carpet Washer lifts
tough deep down dirt up and out of
carpetwithinnovativeDUALSPIN™
PowerBrushes that scrub and groom.
The addition of above floor cleaning
makes it a whole-home cleaner for
both carpet and upholstery.
FLooRMATE® DELUxEA powerful cleaner that is lightweight and maneuverable,
the FLOORMATE® Deluxe is designed to deliver the best clean
while gently and safely scrubbing hard floors in a snap.
Dual tanks are easy to fill and empty ensuring clean water
is all that touches the floor. Dirt is scrubbed away with
SPINSCRUB® technology that replaces the bucket, mop
and scrub brush.
AIR® STEERABLE Powerful. Steerable. Lightweight. Another innovative addition to the
AIR® range of products, the highly-maneuverable AIR® Steerable
twists and turns with a flick of the wrist while delivering confident,
whole-home cleaning.
29Techtronic Industries Annual Report 2013nic Industrie

30 Techtronic Industries Annual Report 2013
Products and Technology Products• Upright–BaggedandBagless
• Canister–BaggedandBagless
• Stick
• HandheldVacuums
• CarpetWashersandSolutions
• HardFloorCleanersandSolutions
• SteamCleanersandCleaningSolutions
• CleaningSystemsandAirPurification
• CleaningSolutions
Technology• Saniseal® bag system, QuickSwitch®,
SlimSwivel™, HEPA media, Easy Snap Cord
Clip, Truman Cell® Technology,
PATH™ filtration system
Distribution• 387Exclusiveandauthorizedstoresin
majorUSMetropolitanAreas,National
Commercial Accounts, Catalogue, QVC,
Amazon & Oreck.com online, Axe Houghton
in Canada
ORECK®hasearneditsreputationformakingthefinestvacuumsavailableandprovidingpremiumservice.Originallyamanufacturerofvacuumsfor thehotelindustry,ORECK®isdrivenbyasingular,consumer-satisfyinggoal:toprovideeasy-to-use,lightweight,anddurablevacuumsandothercleaningtools—eachwithexceptionalpower—foreveryroominthehouse.
MAGNESIUM® RS At7.7poundstheMAGNESIUM®RSisthelightestORECK®todate,easilyliftedwithonefinger,thankstoitsmagnesium-steelalloyframe,whichalsomakesitincrediblydurable.Architectural,fashionforward,futuristic,it’sacleanerthatfitsineventhemostmodernhomesbutfindsfunctioninformwitheasyswivelingvacuumheadandalay-flat,lowprofilewhichallowsittoslipeasilyundercouchesandaroundfurniture.
FloorCareandAppliances

31Techtronic Industries Annual Report 2013
CoMMERCIAL xL® 8LB UPRIGHTBecause they are the original inspiration
to the brand, ORECK® continues to innovate
for commercial users. The XL® is no exception,
allowing workers to work smarter, not harder,
because it weighs just under 8lbs. An ergonomic
handle that received the Ease-of-Use
Commendation from the Arthritis Foundation®*
also helps ease the workload.
CoMMERCIAL oRBITER®
One of the most versatile machines for
commercial use, the durable ORECK®
ORBITER® can safely deep clean nearly
any surface found in a commercial setting.
Orbital drive and the ability to add a variety
of cleaning pads allows the unique cleaner
to take on carpet, wood, vinyl, ceramic,
marble and concrete flooring.
CoMMERCIAL xL® UPRIGHT WITH PERMANENT BELTThe XL® Permanent Belt model offers the
same light weight and ergonomic handle,
but goes even further in ease of use.
Advanced circuitry protects from jams
and broken belts, its 40-foot cord is easily
replaced, a lay-flat design allows access
to hard-to-reach places, and a high-speed
double helix brushes pairs with a wide
cleaning path for ultimate efficiency.
Fordecades,theORECK®familyofconsumershasexpressedtheiraffinityforthebenefitsofowninganORECK®.That’swhyORECK®iscommittedtomakingproducts,includinglightweightuprightvacuums,baglessvacuums,convenienthand-heldmodels,versatilesteammopsandafamilyofairpurifiers, whichmakecleaningjustalittlebiteasierforallitscustomers.
*ARTHRITISFOUNDATIONisaregisteredtrademarkofArthritisFoundation,Incorporated

32 Techtronic Industries Annual Report 2013
VAX®istheUK’sbestsellingFloorCarebrand.AndtheonlycompanyintheUKtooffercleaningproductsineverycategory.
Fromcarpetcleaners,uprightandcylindervacuumcleaners,steam,cordless,andhardfloorcleaners–welistencarefullytothosewhoareusingourproducts,sothatwecandesignwiththeirneedsinmind.
Products and Technology Products• CarpetCleaners–Rapide®, DUAL V®
• Upright/CylinderVacuums–AIR®, Power™
• HardFloorCleaners–BareFloorPro,
Floormate®
• LithiumionCordless–Life®
• VAX® Cleaning Solutions
• VAX®CLEANWITHNOMACHINE™solutions
Technology• HeatedCleaning,SingleCyclonic,
Multi-cyclonic, DUAL V® Twin Air Path
Suction,SPINSCRUB® deep cleaning,
HEPA H12 Filtration
End-Users• Domesticandcommercialcleanerswhoare
looking for high-performing products that meet
quality, service, range and price criteria
AIR® CoMPACTTheVAX®AIR3®Compactisthelightestcompactmulti-cyclonicuprightvacuumcleanerintheworld,weighingjust4kg.AirMotionTechnologyprovideseffortlessmanuevrabilitywhilemulti-cyclonictechnologyprovidesconstantpowerfulsuction,allinacompactdesignforeasycarryingandstorage.
FloorCareandAppliances
Distribution• MassMerchandisers,ElectricalMultiples,
Grocery Retailers, Do-It-Yourself Retailers,
TV Shopping, Online Retailers and Direct

33Techtronic Industries Annual Report 2013
STEAM FRESH CoMBI The VAX® Steam Fresh Combo offers two distinct ways to disinfect a variety of surfaces in the home,
both as a conventional steam mop and a convenient handheld. A 15 piece tool kit offers over
15 different uses, penetrating deep into stubborn grime, breaking down stains more quickly
and eliminating 99.9% of harmful germs and bacteria for up to 7 days.
DUAL PoWER™ CARPET WASHERThe VAX® DUAL POWER™ carpet
washer is a powerful and quick
cleaning carpet cleaner with double
the cleaning action thanks to its dual
rotating brushbar, which lifts stubborn,
deep down dirt from carpets. The
carpet cleaner is lightweight, easy
to carry and simple to fill up, empty
and use. It also features 30cm wide
cleaning nozzle enables you to clean
larger areas quickly.

34 Techtronic Industries Annual Report 2013
FloorCareandAppliances
DIRTDEVIL®isavibrantandcontemporarybrandthataddresseseveryfloorcareneedinonegreatvalue,convenientandeasytousepackage.
Eachproductisengineeredtogetajobdonewellandefficiently. Fromquickclean-upstofullhousecleaning,DIRTDEVIL®hastheanswer– sobusypeoplecancleanupfastandwithstyle.
Products and Technology Products• Uprights–BaggedandBagless
• Canisters–BaggedandBagless
• StickVacs
• HandVacs
• SteamCleaners
• PressureWashers
• RoboticVacuumsandAccessories
Technology• Bagged,Bagless,Cyclonic,Corded
& Cordless
Distribution• LeadingHomeCentres,MassMerchants,
Catalogue, TV Shopping, Online Retailers
LIFT&Go™
Thefirstlift-awayfromDIRTDEVIL® providesaperfectsolutionforanythingabovefloor,includingstairsandbookcasesandanythingin-between.WithitsownVac+Dustfloortooland10ft.extendedhose,LIFT&GO™cangetintoeverycorner ofthehome.

35Techtronic Industries Annual Report 2013
SPRAY+MoP & vAC+DUSTThenewSpray+MopandVac+Dustquickclean
products offer versatility in hard floor cleaning with
SWIPES™ reusable pads. Paired with a powerful
cleaning solution or corded and cordless suction,
dust and grime have no place to hide on tile,
hardwood or linoleum.
DASH™
A powerful whole-home upright vacuum cleaner featuring the
firsteverVac+Dustfloortoolthatconnectstoanon-demand
wand for ultimate hard-floor cleaning. Paired with dual cyclonic
power and adjustable height, DASH™ is the most convenient
cleaner for any busy home.
REBEL™ 50 WHITESilent. Powerful. Futuristic. The REBEL™
finds its own path with Smart Air Technology
that provides an optimized air flow thanks to
perfect shaping and a casing sealing. The air
flow stays concentrated and powerful on its
whole way from the nozzle through the filter
system to the air outlet.

36 Techtronic Industries Annual Report 2013
Board of Directors
Horst Julius Pudwill MSc Chairman
Mr Horst Julius Pudwill, aged 69, is Chairman of TTI, a position he has held since he jointly founded
the Group in 1985. Until 2008, he also served as Chief Executive Officer. As Chairman, Mr Pudwill focuses
on the strategic planning and development of the Group and continues to have oversight of the operations,
with the Chief Executive Officer reporting directly to him. Mr Pudwill has extensive experience in international
trade, business and commerce. Mr Pudwill is also a director of Sunning Inc. which has an interest in the equity
of the Company.
Mr Pudwill holds a Master of Science Degree in Engineering and a General Commercial Degree.
Mr Pudwill is the father of Mr Stephan Horst Pudwill, Group Executive Director and President of
Strategic Planning.
Joseph Galli Jr BSBA, MBA
Chief Executive Officer
Mr Joseph Galli Jr, aged 55, joined the Group in 2006 as the Chief Executive Officer of Techtronic Appliances
and was appointed as Chief Executive Officer and Executive Director of TTI effective February 1, 2008.
HeisresponsibleforintegratingacquisitionsinNorthAmericaandEurope,andenhancingtheglobalsales
potential of the Group’s strong brand portfolio. He is also responsible for leading the management team in
the Group’s daily operation.
Mr Galli joined Black & Decker in 1980 where he worked for over 19 years and held various high level
management positions, rising to the position of President of Worldwide Power Tools and Accessories.
During his tenure at Black & Decker, he was responsible for highly successful launch of the “DeWalt®” Brand
heavy duty power tools in 1992. After leaving Black & Decker, Mr Galli joined Amazon.com where he was
President and Chief Operating Officer from 1999 to 2000. From 2001 to 2005, he was a Director and
ChiefExecutiveOfficerofNewellRubbermaidInc.
MrGalligraduatedfromtheUniversityofNorthCarolinain1980withaBachelorofScienceinBusiness
Administration. In 1987, he obtained an MBA from Loyola College in Baltimore, Maryland.
Patrick Kin Wah Chan FCCA, FCPA
Operations Director
Mr Patrick Kin Wah Chan, aged 54, joined the Group in 1988 and was appointed as Executive Director
in 1990. He is now in charge of the manufacturing operations of the Group.
Mr Chan is currently the Vice-Chairman of the Dongguan City Association of Enterprises with Foreign
Investment, the Chairman of Houjie Association of Enterprises with Foreign Investment. He is also
the Vice-Director of Electric Tool Sub-Association of China Electrical Equipment Industrial Association.
Mr Chan is a fellow member of The Association of Chartered Certified Accountants and the Hong Kong
Institute of Certified Public Accountants.
Group Executive Directors
37Techtronic Industries Annual Report 2013
Group Executive Directors
Frank Chi Chung Chan ACA, FCCA, FCPA, CPA (Practising)
Group Chief Financial Officer
Mr Frank Chi Chung Chan, aged 60, joined the Group in 1991 and was appointed as Executive Director in 1992.
He is now responsible for corporate affairs and financial management of the Group.
Mr Chan is a fellow member of The Association of Chartered Certified Accountants and the Hong Kong Institute
of Certified Public Accountants, a member of The Institute of Chartered Accountants in England & Wales,
an associate of the Taxation Institute of Hong Kong and qualified to practise as a Certified Public Accountant
in Hong Kong.
MrChaniscurrentlyanIndependentNon-executiveDirectorofGoldPeakIndustries(Holdings)Limited
which is listed on the stock exchange of Hong Kong.
Stephan Horst PudwillPresident of Strategic Planning
Mr Stephan Horst Pudwill, aged 37, joined the Group in 2004 and was appointed as Executive Director
in 2006. He is mainly responsible for managing, improving and monitoring internal operations and identifying
synergistic business opportunities within the Group.
Prior to joining the Group, Mr Pudwill held managerial positions at Daimler Chrysler AG that included product
marketing and strategic planning for the Mercedes-Benz car group.
Mr Pudwill holds a Bachelor of Arts Degree from the University of British Columbia and
is Mr Horst Julius Pudwill’s son.

38 Techtronic Industries Annual Report 2013
BoardofDirectors
Non-executive Director
Independent Non-executive Directors
Roy Chi Ping Chung BBS, JP
Prof Roy Chi Ping Chung BBS JP, aged 61, is a Co-founder of TTI. Prof Chung, previously the
Group Managing Director since 1985, was appointed as the Group Vice Chairman and Executive Director
oftheCompanyonApril18,2007.Hehasbeenre-designatedtoNon-executiveDirectoroftheCompany
with effect from July 1, 2011.
Prof Chung holds a Doctor of Engineering Degree from the University of Warwick, United Kingdom and Doctor
of Business Administration Degree from City University of Macau. He was appointed as an Industrial Professor
by the University of Warwick, United Kingdom in December 2010. He was awarded an Honorary Doctor of
Business Administration by the Hong Kong Polytechnic University in 2007 and awarded an Honorary Doctorate
DegreebytheUniversityofNewcastle,NewSouthWales,Australiain2006.HewasawardedtheBronze
Bauhinia Star (BBS) Medal by the Hong Kong SAR Government on July 1, 2011. He was also appointed
as Justice of Peace by the Hong Kong SAR Government on July 1, 2005 and won the Hong Kong Young
Industrialists Award in 1997.
Prof Chung is highly dedicated to the advancement of industry and was the Chairman of the Federation
of Hong Kong Industries until July 5, 2013. In addition, Prof Chung holds positions on a number of
Hong Kong SAR Government advisory committees and is also an active member of many social committees
and associations.
ProfChungisalsoanIndependentNon-executiveDirectorofKinYatHoldingsLimited,KFMKingdomHoldings
LimitedandTKGroup(Holdings)Limited(witheffectivefromNovember27,2013).
Joel Arthur Schleicher CPA, BSB
MrJoelArthurSchleicher,aged62,wasappointedasanIndependentNon-executiveDirectorin1998.
He has over 28 years of management experience in the manufacturing and technology/telecom services sectors.
Mr Schleicher is currently working on several initiatives in the Cyber Security arena while also serving as
a Managing Director for MWB Investments, LLC.
Previously Mr Schleicher was the Founder, Chairman and CEO of Presidio, Inc. (2004-2011) the foremost
professionalandmanagedservicesproviderinNorthAmerican,attheforefrontofVirtualization/DataCenter;
Collaboration and other advanced IT infrastructure solutions. Prior he has worked with private equity firms as
a consultant, advisor, board member and held portfolio management roles including as Chairman and CEO
forInterpathCommunications,Inc.;CEOofExpanets,Inc.andPresidentandCOOforNextelCommunications,
Inc.Inthepast,hehasservedontheboardofdirectorsofvariousNorthAmericandomesticandinternational
companies–bothpublicandprivate.
Christopher Patrick Langley OBE
MrChristopherPatrickLangley,aged69,wasappointedasanIndependentNon-executiveDirectorin
May 2001. He was formerly an Executive Director of The Hongkong and Shanghai Banking Corporation Ltd.
Mr Langley maintains close ties with the business community in Hong Kong. He is currently an Independent
Non-executiveDirectorofDicksonConcepts(International)Limited,listedonthestockexchangeof
HongKong,andaNon-executiveDirectorofLeiShingHongLimitedwhichhasbeendelistedfrom
the Stock Exchange of Hong Kong Limited on March 17, 2008. Mr Langley resigned as an Independent
Non-executiveDirectorofWinsorPropertiesHoldingsLimited(nowrenamedasVankeProperty(Overseas)
Limited), which is listed on the stock exchange of Hong Kong, with effective from September 1, 2012.

39Techtronic Industries Annual Report 2013
Manfred KuhlmannMrManfredKuhlmann,aged69,wasappointedasanIndependentNon-executiveDirectorin2004.Hewas
General Manager of Dresdner Bank AG Hong Kong Branch between 1994 and 1998 and General Manager
of Dresdner Bank AG Dubai before he retired in August 2004. Mr Kuhlmann is a graduate of the Banking
Academy, Hamburg and has extensive experience in the finance and banking industry. Since 2005 he served
as “Hamburg Ambassador” in the UAE to support the economic ties between Hamburg, Germany and the
UAE. He retired from that position in May 2013 as he had moved his residence to Cyprus. Since July 2009
MrKuhlmannwasaNon-executiveDirectorandmemberoftheBoardofAvicennaPharmaDevelopment
FZLLC in Dubai, he retired from that position on December 31, 2010.
Peter David Sullivan BS
MrPeterDavidSullivan,aged66,wasappointedasIndependentNon-executiveDirectoreffective
February 1, 2008. He was an Executive Director and Chief Executive Officer of Standard Chartered Bank
(Hong Kong) Limited. Mr Sullivan held governance responsibility for franchises of the Standard Chartered
Group in Japan, Australia, the Philippines and Bohai Bank in Tianjin, China. He also held a number of other
major appointments, including as the Chairman of the Hong Kong Association of Banks and the British
Chamber of Commerce.
MrSullivanhasbeenappointedasaNon-executivedirectortotheboardsofStandardBankGroupand
The Standard Bank of South Africa Limited with effect from January 15, 2013. He is the Chairman and
Non-executivedirectorofHealthcareLocumsplc,andaNon-executivedirectorofWintonCapitalplc.
MrSullivanwasanIndependentNon-executivedirectorofSmarToneTelecommunicationsHoldingsLimited,
aNon-executivedirectorofAXAAsiaPacificHoldingsLimitedthatislistedontheAustralianandNewzealand
stockexchanges,andtheChairmanandNon-executivedirectorofCenkosSecuritiesplclistedonAIM.
MrSullivanholdsaBachelorofScienceDegreefromtheUniversityofNewSouthWales.
vincent Ting Kau CheungMr Vincent Ting Kau Cheung, aged 72, was appointed as a Director in 1991 and was re-designated
asanIndependentNon-executiveDirectoronMarch30,2012.HeisaNon-executiveDirectorof
Gold Peak Industries (Holdings) Limited, listed on The Stock Exchange of Hong Kong Limited.
Mr Cheung is a graduate in law from University College London and has been a practising solicitor since
1970. He is qualified to practice law in Hong Kong and England and Wales and he is now a Consultant
of Vincent T.K. Cheung, Yap & Co. He is also a Fellow of University College London and a Commandeur
de l’Ordre du Mérite Agricole from France.
Management’s Discussion and Analysis
40 Techtronic Industries Annual Report 2013
Financial ReviewFinancial ResultsResult AnalysisThe Group’s turnover for the year amounted to USD4.3 billion, an increase of 11.6% as compared to USD3.9 billion in 2012. Profit attributable to Owners of the Company amounted to USD250 million as compared to USD201 million in 2012, an increase of 24.5%. Basic earnings per share for the year improved to US13.68 cents as compared to US11.42 cents in 2012.
EBITDA amounted to USD443 million, an increase of 13.7% as compared to USD389 million in 2012.
EBIT amounted to USD304 million, an increase of 16.9% as compared to USD260 million in 2012.
Gross MarginGross margin improved to 34.2% as compared to 33.5% last year. The margin improvement was the result of new product introduction, category expansion, efficient production amongst various production facilities, effective supply chain management and volume leverage on our economies of scale.
Operating ExpensesTotal operating expenses for the year amounted to USD1,175 million as compared to USD1,033 million in 2012, representing 27.3% of turnover (2012: 26.8%).
Investments in product design and development amounted to USD107 million, representing 2.5% of turnover (2012: 2.1%) reflecting our continuous strive for innovation. We will continue to invest in design and development as new products and category expansions are most critical not only to maintain sales growth momentum but also margin expansions.
Net interest expenses for the year amounted to USD25 million as compared to USD37 million in 2012. Interest coverage, expressed as a multiple of EBITDA to total interest was 12.4 times (2012: 8.7 times).
The effective tax rate, being tax charged for the year to before tax profits was at 10.5%. The Group will continue to leverage its global operations to sustain the overall tax efficiencies.
Liquidity and Financial ResourcesShareholders’ FundsTotal shareholders’ funds amounted to USD1.7 billion as compared to USD1.5 billion in 2012. Book value per share was at USD0.95 as compared to USD0.85 last year, an increase of 11.8%.
Financial PositionThe Group continued to maintain a strong financial position. As at December 31, 2013, the Group’s cash and cash equivalents amounted to USD698 million (2012: USD618 million), of which 49.2%, 25.5%, 13.6%, 3.7%, 3.6% and 4.4% were denominated in RMB, USD, EUR, AUD, HKD and other currencies respectively.
The Group’s net gearing, expressed as a percentage of total net borrowing (excluding bank advance from factored trade receivables which are without recourse in nature) to equity attributable to Owners of the Company, improved to 10.6% as compared to 25.8% last year. The gearing improvement is the result of very disciplined and focused management over working capital and free cash flow from operations applied to debt repayment. The Group remains confident that gearing can further improve going forward.
Bank BorrowingsLong term borrowings accounted for 42.4% of total debts (2012 : 34.3%).
The Group’s major borrowings continued to be in US Dollars and in HK Dollars. Borrowings are predominantly LIBOR or Hong Kong best lending rates based. There is a natural hedge mechanism in place as the Group’s major revenues are in US Dollars and currency exposure therefore is low. Currency, interest rate exposures, and cash management functions are all being closely monitored and managed by the Group’s treasury team.
During the year, the Group repaid USD39 million of fixed interest rate notes, refinanced by other bank facilities with lower interest rates. This refinancing arrangement will lower our interest cost in future periods.
41Techtronic Industries Annual Report 2013
Working CapitalTotal inventory was at USD884 million as compared to USD689 million in 2012. Days inventory increased by 10 days from 65 days to 75 days. Part of the increase in inventory at year end was a result of pre-build of products before the Chinese New Year in January to prepare for the sales in February and to ensure the service quality level to customers will not be jeopardized having taken into consideration of our sales momentum. The Group will continue to focus in managing the inventory level and improve inventory turns.
Trade receivable turnover days were at 64 days as compared to 61 days last year. Excluding the gross up of the receivables factored which is without recourse in nature, receivable turnover days were at 57 days as compared to 54 days last year. The Group is comfortable with the quality of the receivables and will continue to exercise due care in managing the credit exposure.
Trade payable days were extended by 21 days from 67 days in 2012 to 88 days in 2013, partially offsetting the increase in inventory.
Working capital as a percentage of sales was at 13.9% as compared to 16.2% last year.
Capital ExpenditureTotal capital expenditures for the year amounted to USD105 million (2012: USD103 million).
Capital Commitments and Contingent LiabilitiesAs at December 31, 2013, total capital commitments amounted to USD19 million (2012: USD18 million) and there were no material contingent liabilities or off balance sheet obligations.
ChargeNone of the Group’s assets are charged or subject to encumbrance.
Major Customers and SuppliersFor the year ended December 31, 2013
(i) the Group’s largest customer and five largest customers accounted for approximately 37.7% and 51.3% respectively of the Group’s total turnover; and
(ii) the Group’s largest supplier and five largest suppliers accounted for approximately 4.6% and 17.0% respectively of the Group’s total purchases (not including purchases of items which are of a capital nature).
As far as the Directors are aware, none of the Directors, their associates or any shareholders who owned more than 5% of TTI’s share capital had any interest in the five largest customers or suppliers of the Group.
Human ResourcesThe Group employed a total of 18,746 employees as at December 31, 2013 (2012: 18,068) in Hong Kong and overseas. Total staff cost for the year under review amounted to USD601 million (2012: USD538 million).
The Group regards human capital as vital for the Group’s continuous growth and profitability and remains committed to improving the quality, competence and skills of all employees. It provides job-related training and leadership development programs throughout the organization. The Group continues to offer competitive remuneration packages, discretionary share options and bonuses to eligible staff, based on the performance of the Group and the individual employee.
Corporate Strategy and Business ModelThe Group is a world-class leader in design, manufacturing and marketing of power tools, outdoor power equipment and floor care for consumers, professional and industrial users in the home improvement, infrastructure and construction industries. We are committed to implementing our long term strategic plan that focuses on “Powerful brands, Innovative Products, Operational Excellence and Exceptional People”.
We continue to strengthen our portfolio of powerful brands with a focused marketing approach. Brands extension into new product categories and under-represented markets enable us to generate outstanding growth. Geographic expansion will be a highlight of TTI’s future, our long term strategy is to aggressively build our business outside the U.S. and we have spent relentless efforts to expand or establish presence in high potential markets around the world.
Introducing innovative new products is the centerpiece of our long term strategy. We continue to invest in building a high-speed product development process, enabling us to respond faster to customer requests and emerging opportunities, giving us a vigorous competitive advantage.
Our strategy in operational excellence will continue, we will drive further gains in efficiency across our manufacturing operations, supporting further margin improvement.
We continue to deploy our Leadership Development Program (LDP) to develop our pool of talent for the future. The LDP initiative is successfully feeding talent into key positions throughout the company.
Management’s Discussion and Analysis
42 Techtronic Industries Annual Report 2013
Review Of OperationsTTI delivered another strong year on very good results across our business segments, brands, and geographic locations. North America grew 11.2%, Europe expanded 13.3% and rest of world increased 11.5%. The progress we are making in product development to deliver new and innovative products with advanced technologies and the expansion of our Lithium cordless platforms are driving our growth. We are focused on continuing our success in expanding our market share in Canada, Western Europe, Australia, and New Zealand, as well as the United States. Additionally, we strengthened our distribution footholds across Eastern Europe, Latin America, the Middle East, Africa, and Asia. Our MILWAUKEE® business had a stellar year in all markets as we continued to drive global expansion and made great strides in our Floor Care business. We made significant gains in channel
penetration programs, while deepening strategic customer partnerships.
All business segments delivered record sales and profit this year. Our profit margins expanded, showing the strength of the businesses. We achieved significant cost improvements from our continued focus on value engineering, lean production, and supplier productivity. Our investments in automation are driving efficiency and increasing the quality in our manufacturing. The streamlining of our Floor Care operations boosted productivity and lowered costs. Working capital remained solid with the business generating positive free cash flow.
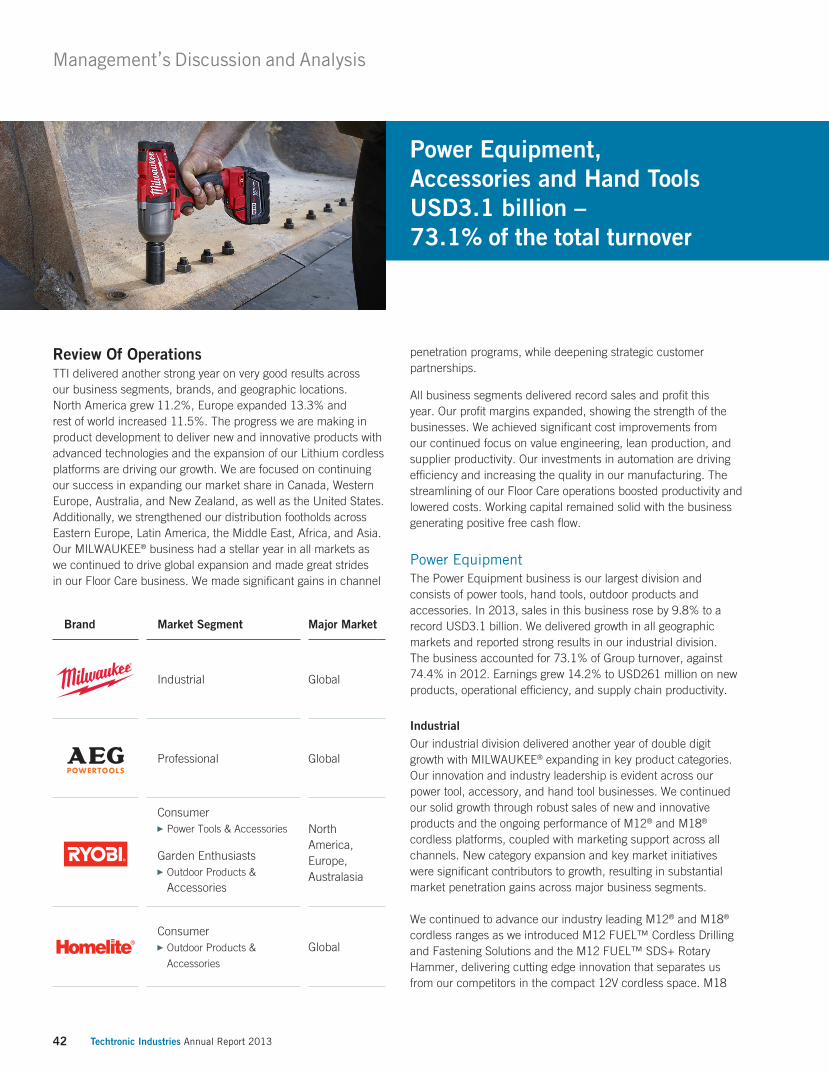
Power EquipmentThe Power Equipment business is our largest division and consists of power tools, hand tools, outdoor products and accessories. In 2013, sales in this business rose by 9.8% to a record USD3.1 billion. We delivered growth in all geographic markets and reported strong results in our industrial division. The business accounted for 73.1% of Group turnover, against 74.4% in 2012. Earnings grew 14.2% to USD261 million on new products, operational efficiency, and supply chain productivity.
IndustrialOur industrial division delivered another year of double digit growth with MILWAUKEE® expanding in key product categories. Our innovation and industry leadership is evident across our power tool, accessory, and hand tool businesses. We continued our solid growth through robust sales of new and innovative products and the ongoing performance of M12® and M18® cordless platforms, coupled with marketing support across all channels. New category expansion and key market initiatives were significant contributors to growth, resulting in substantial market penetration gains across major business segments.
We continued to advance our industry leading M12® and M18® cordless ranges as we introduced M12 FUEL™ Cordless Drilling and Fastening Solutions and the M12 FUEL™ SDS+ Rotary Hammer, delivering cutting edge innovation that separates us from our competitors in the compact 12V cordless space. M18
Brand Market Segment Major Market
Industrial Global
Professional Global
Consumer Power Tools & Accessories
Garden Enthusiasts Outdoor Products &
Accessories
North America,Europe, Australasia
Consumer Outdoor Products &
Accessories
Global
Power Equipment, Accessories and Hand Tools USD3.1 billion – 73.1% of the total turnover

43Techtronic Industries Annual Report 2013
FUEL™ Drilling and Fastening continued to draw new users into the M18® system while the expansion of the new M18 FUEL™ SAWZALL® Reciprocating Saw, High Torque Impact Wrenches, Circular Saw, and Grinders increased momentum for the FUEL® range globally.
The MILWAUKEE® brand has established itself as a preeminent player in the power tool accessories industry by addressing user challenges through innovative design and groundbreaking technology. MILWAUKEE® expanded the leading SAWZALL® blade program with the introduction of DOUBLE DUTY™ Metal Blades and moved into a new drilling segment with the introduction of JAM FREE™ Step Bits. Both of these accessories have proven to increase productivity and efficiency for the end users. The introduction of SHOCKWAVE® Expand to support the SHOCKWAVE® range of Impact Duty driver bits offers key productivity enhancement, allowing users to cover hundreds of applications with a handful of items.
MILWAUKEE® is striving to become the leader in productivity solutions in the industrial hand tool market. Overwhelming acceptance of MILWAUKEE® hand tools by our core users has come from a focus on innovation within key categories such as fastening, cutting, and layout. Our dedication to unveiling new products, such as the innovative HOLLOWCORE™ Nut Drivers and new line of FASTBACK™ Utility Knives, will continue to be a core part of the growth strategy.
Consumer and ProfessionalWe continue to expand our leading North American consumer power tool brand, RYOBI®, driven in large part by the innovative new 18V ONE+® product introductions that utilise the ONE+® Lithium ion battery platform, as well as increased marketing activities. RYOBI® ONE+® continues to add more than one million new customers each year through new product launches and promotional marketing campaigns. The launch of the RYOBI® 18V ONE+® AIRSTRIKE™ Brad Nailer has expanded our ONE+® system and has broadened our professional customer base. AIRSTRIKE™ eliminates the need for a compressor, hose, or gas cartridges and the 18V battery allows users to drive over 700 nails per charge. We are expanding the AIRSTRIKE™ technology with
the introduction of the 18V ONE+® AIRSTRIKE™ Narrow Crown Stapler, another innovative category expansion.
Our professional business grew in all geographic markets with AEG® brand expanding in its core Europe and rest of world geographies. We have a focused distribution strategy in key markets and have nurtured strong distribution partnerships. Growth is being driven by the introduction of innovative new products, strong Lithium cordless platforms, and marketing support programs.
Outdoor ProductsOutdoor Products grew in all geographic regions. We increased profitability with new products, enhanced quality systems, operational efficiency, and supply chain productivity. Our cordless categories have shown tremendous growth over the past few years and 2013 was no exception. The growth came through the ongoing success of the RYOBI® 18V ONE+® program, expansion into higher voltages like RYOBI® 40V, and introducing innovations like the ONE+® Hybrid. The RYOBI® 40V range grew tremendously as users discovered that the run time is comparable to gas powered equipment. The uniqueness of the RYOBI® Hybrid is the dual power source, providing the user with the ability to choose between the powerful Lithium ONE+® battery and an extension cord.
In addition, we maintained our flow of new product innovations in our core gas product categories.
Floor Care and Appliances
Power Equipment, Accessories and Hand Tools
Sales by Business
73.1%
26.9%
Management’s Discussion and Analysis
44 Techtronic Industries Annual Report 2013
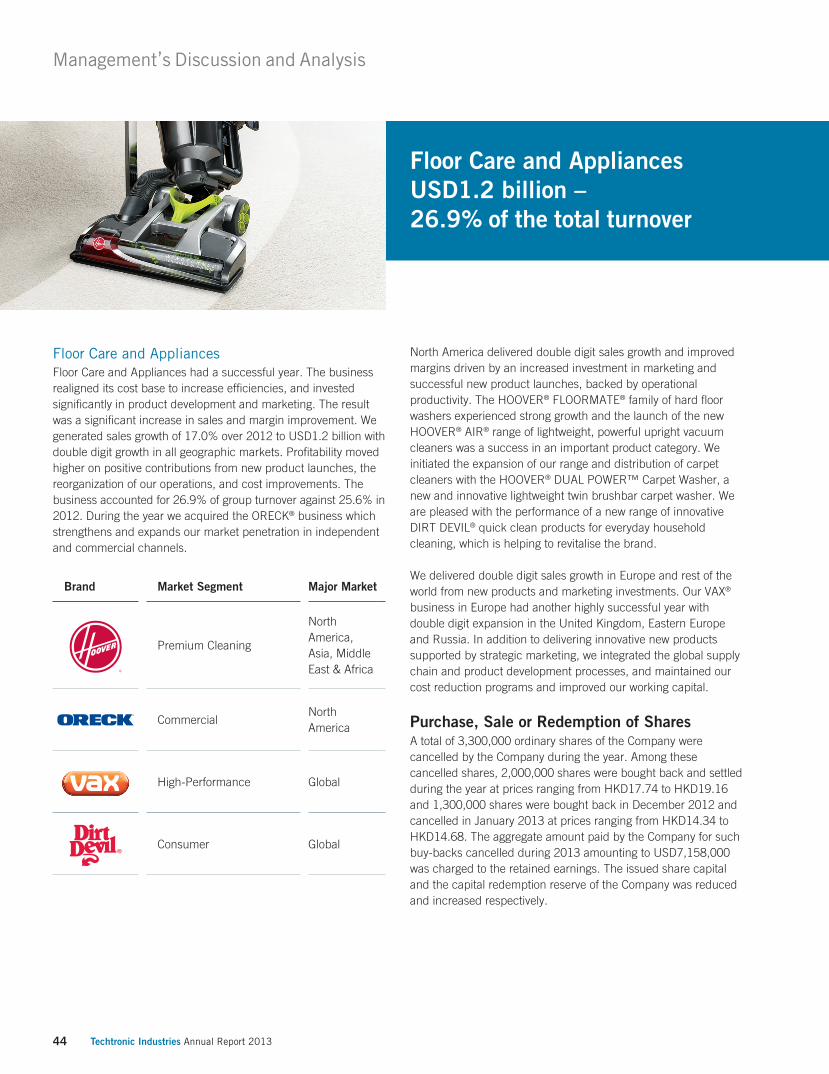
Floor Care and AppliancesFloor Care and Appliances had a successful year. The business realigned its cost base to increase efficiencies, and invested significantly in product development and marketing. The result was a significant increase in sales and margin improvement. We generated sales growth of 17.0% over 2012 to USD1.2 billion with double digit growth in all geographic markets. Profitability moved higher on positive contributions from new product launches, the reorganization of our operations, and cost improvements. The business accounted for 26.9% of group turnover against 25.6% in 2012. During the year we acquired the ORECK® business which strengthens and expands our market penetration in independent and commercial channels.
North America delivered double digit sales growth and improved margins driven by an increased investment in marketing and successful new product launches, backed by operational productivity. The HOOVER® FLOORMATE® family of hard floor washers experienced strong growth and the launch of the new HOOVER® AIR® range of lightweight, powerful upright vacuum cleaners was a success in an important product category. We initiated the expansion of our range and distribution of carpet cleaners with the HOOVER® DUAL POWER™ Carpet Washer, a new and innovative lightweight twin brushbar carpet washer. We are pleased with the performance of a new range of innovative DIRT DEVIL® quick clean products for everyday household cleaning, which is helping to revitalise the brand.
We delivered double digit sales growth in Europe and rest of the world from new products and marketing investments. Our VAX® business in Europe had another highly successful year with double digit expansion in the United Kingdom, Eastern Europe and Russia. In addition to delivering innovative new products supported by strategic marketing, we integrated the global supply chain and product development processes, and maintained our cost reduction programs and improved our working capital.
Purchase, Sale or Redemption of SharesA total of 3,300,000 ordinary shares of the Company were cancelled by the Company during the year. Among these cancelled shares, 2,000,000 shares were bought back and settled during the year at prices ranging from HKD17.74 to HKD19.16 and 1,300,000 shares were bought back in December 2012 and cancelled in January 2013 at prices ranging from HKD14.34 to HKD14.68. The aggregate amount paid by the Company for such buy-backs cancelled during 2013 amounting to USD7,158,000 was charged to the retained earnings. The issued share capital and the capital redemption reserve of the Company was reduced and increased respectively.
Brand Market Segment Major Market
Premium Cleaning
North America,Asia, Middle East & Africa
CommercialNorth America
High-Performance Global
Consumer Global
Floor Care and Appliances USD1.2 billion – 26.9% of the total turnover

45Techtronic Industries Annual Report 2013
The buy-back of the Company’s shares during the year were effected by the Directors pursuant to the mandate received from shareholders at the previous annual general meeting, with a view to benefiting shareholders as a whole by enhancing the net asset value per share and earnings per share of the Company.
Except as disclosed above, neither the Company nor any of its subsidiaries purchased, redeemed or sold any of the Company’s listed securities during the year.
Review of Financial InformationThe Audit Committee has reviewed with senior management of the Group and Messrs Deloitte Touche Tohmatsu the accounting principles and practices adopted by the Group and has discussed internal controls and financial reporting matters, including the review of Group’s consolidated financial statements for the year ended December 31, 2013. The Board acknowledges its responsibility for the preparation of the accounts of the Group.
DividendThe Directors have recommended a final dividend of HK13.75 cents (approximately US1.77 cents) per share with a total of approximately USD32,382,000 for the year ended December 31, 2013 (2012: HK10.75 cents (approximately US1.38 cents)) payable to the Company’s shareholders whose names appear on the register of members of the Company on May 30, 2014. Subject to the approval of the shareholders at the forthcoming annual general meeting of the Company, the proposed final dividend is expected to be paid on or about June 27, 2014. This payment, together with the interim dividend of HK10.00 cents (approximately US1.29 cents) per share (2012: HK6.75 cents (approximately US0.87 cent)) paid on September 27, 2013, makes a total payment of HK23.75 cents (approximately US3.06 cents) per share for 2013 (2012: HK17.50 cents (approximately US2.25 cents)).
Closure of Register of MembersThe register of members of the Company will be closed for the following periods:
To ascertain members’ eligibility to attend and vote at the 2014 Annual General Meeting, the register of members of the Company will be closed from May 22, 2014 to May 23, 2014, both days inclusive, during which period no transfers of shares will be effected. In order to qualify to attend and vote at the 2014 Annual General Meeting, all transfers accompanied by the relevant share certificates must be lodged with the Company’s share registrars, Tricor Secretaries Limited, at 26/F., Tesbury Centre, 28 Queen’s Road East, Wanchai, Hong Kong (which will be relocated to Level 22, Hopewell Centre, 183 Queen’s Road East, Hong Kong with effect from March 31, 2014) for registration not later than 4:00 p.m. on May 21, 2014.
To ascertain members’ entitlement to the final dividend, the register of members of the Company will be closed from May 29, 2014 to May 30, 2014, both days inclusive, during which period no transfers of shares will be effected. In order to qualify for the final dividend, all transfers accompanied by the relevant share certificates must be lodged with the Company’s share registrars, Tricor Secretaries Limited, at 26/F., Tesbury Centre, 28 Queen’s Road East, Wanchai, Hong Kong (which will be relocated to Level 22, Hopewell Centre, 183 Queen’s Road East, Hong Kong with effect from March 31, 2014) for registration not later than 4:00 p.m. on May 28, 2014.
26.9%
73.1%
Sales by Business
Floor Care and Appliances
Power Equipment, Accessories and Hand Tools
Corporate Governance Report
46 Techtronic Industries Annual Report 2013
To enhance shareholders’ interests and promote sustainable development, the Company is committed to maintain a high standard of corporate governance. The Company emphasizes a quality board of directors (the “Board”) for leadership and effective internal controls, transparency and accountability to all shareholders. The codes and practices of corporate governance and the disclosure of this Corporate Governance Report are reviewed from time to time to improve the Company’s corporate governance practices with regards to the latest developments on all applicable laws, rules and regulations.
Compliance with the Corporate Governance CodeThe Company has complied with all the code provisions of the Corporate Governance Code set out in Appendix 14 of the Rules Governing the Listing of Securities on the Stock Exchange of Hong Kong Limited (the “Listing Rules”) (the “Corporate Governance Code”) throughout the year ended December 31, 2013, save that:
1. none of the Directors are appointed for a specific term since they are subject to retirement by rotation and re-election in accordance with the Articles of Association of the Company. Under Article 103 of the Articles of Association of the Company, one-third of the Board must retire by rotation at each general meeting of the Company and if eligible, offer themselves for re-election.
2. Mr Christopher Patrick Langley OBE (an Independent Non-executive Director) and Mr Joel Arthur Schleicher (an Independent Non-executive Director) were unable to attend the annual general meeting of the Company held on May 24, 2013 due to prior engagements.
3. the Board is provided with quarterly updates instead of monthly updates. The Board agreed that quarterly updates give a balanced and understandable assessment of the performance, position and prospects of the Company in supporting the Directors to discharge their responsibilities.
The Company also voluntarily complied with a number of recommended best practices set out in the Corporate Governance Code, which is aimed for further enhancement of the Company’s corporate governance standard and promote the best interests of the Company and shareholders as a whole.
Corporate Governance PolicyThe Board develops and reviews the corporate governance policies and practices to ensure compliance with the Company’s Articles of Association and the laws, rules and regulatory requirements governing the Group. The Board performed the corporate governance function by, but not limited to, the following:
‧ review the compliance of the Corporate Governance Code and the disclosure set out in this Corporate Governance Report.
‧ review and monitor the training and continuous professional development of directors and senior management.
‧ review and monitor the compliance of the Model Code for Securities Transactions by Directors, the Code for Securities Transactions by Relevant Employees and other codes of conduct of the Company.
Board of DirectorsRoles and ResponsibilitiesThe Board is responsible for leading, directing and supervising the Group affairs collectively with an effective corporate governance framework for the long term success of the Company. Principal responsibilities of the Board including, but are not limited to, the following:
‧ formulate overall mid-term and long-term strategy and direction of the Company.
‧ consider matters covering major acquisitions and disposals, appointment of Directors, senior management and external auditors, and other significant operational matters.
‧ develop and review the Company’s policies and practices on corporate governance.
‧ oversee and control the Company’s operations and financial performance through the determination of the annual budget and continuous review of performance results.
‧ monitor risks and changes in local and international business community in order to enhance shareholders’ value.
Written procedures have been formally adopted and reviewed regularly in order to govern the delegation of daily management responsibilities to the senior management of the Group and the reservation to the Board of specifically identified matters.
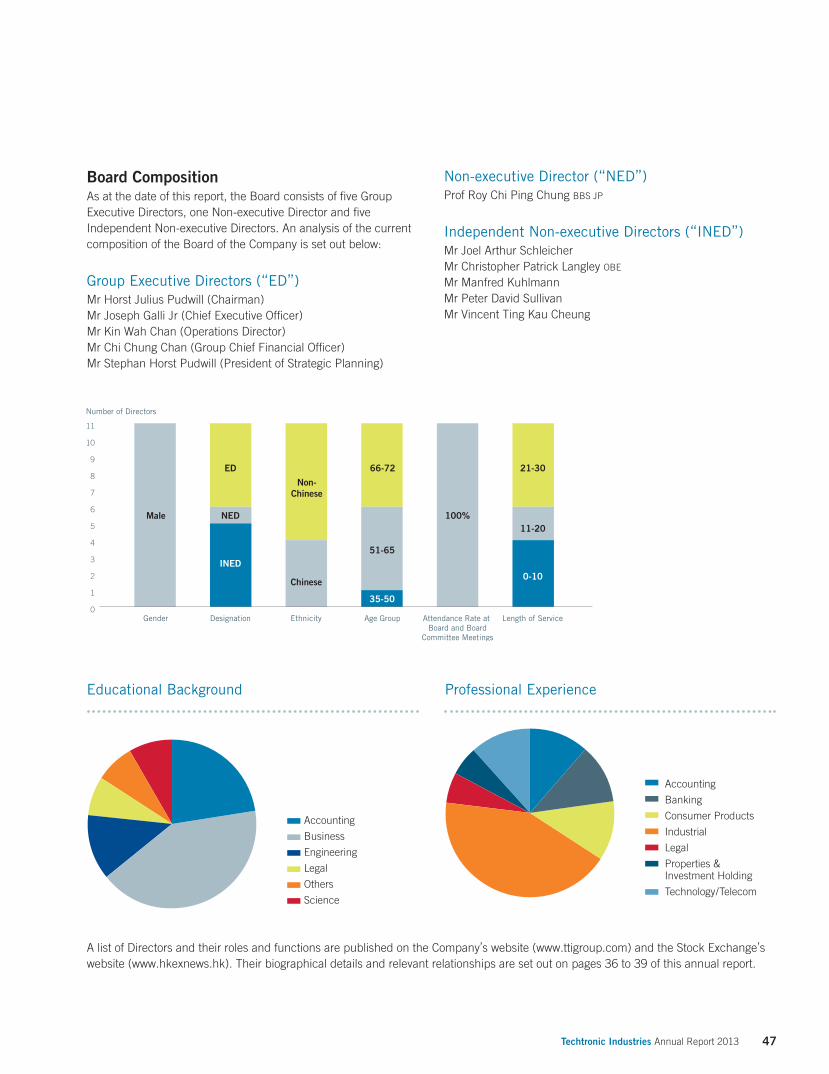
47Techtronic Industries Annual Report 2013
Board CompositionAs at the date of this report, the Board consists of five Group Executive Directors, one Non-executive Director and five Independent Non-executive Directors. An analysis of the current composition of the Board of the Company is set out below:
Group Executive Directors (“ED”)Mr Horst Julius Pudwill (Chairman)Mr Joseph Galli Jr (Chief Executive Officer)Mr Kin Wah Chan (Operations Director)Mr Chi Chung Chan (Group Chief Financial Officer)Mr Stephan Horst Pudwill (President of Strategic Planning)
Educational Background Professional Experience
A list of Directors and their roles and functions are published on the Company’s website (www.ttigroup.com) and the Stock Exchange’s website (www.hkexnews.hk). Their biographical details and relevant relationships are set out on pages 36 to 39 of this annual report.
Non-executive Director (“NED”)Prof Roy Chi Ping Chung BBS JP
Independent Non-executive Directors (“INED”)Mr Joel Arthur SchleicherMr Christopher Patrick Langley OBE
Mr Manfred KuhlmannMr Peter David SullivanMr Vincent Ting Kau Cheung

Corporate Governance Report
48 Techtronic Industries Annual Report 2013
To promote balance of power and authority, the roles of Chairman and Chief Executive Officer of the Company have been segregated and clearly distinguished.
The roles of Chairman comprise, but are not limited to, the following:
‧ lead the Board to ensure it works effectively and acts in the best interests of the Company.
‧ ensure good corporate governance practices and procedures are established.
‧ ensure all Directors are properly briefed on issues arising at Board meetings and receive accurate, timely and reliable information.
‧ encourage all Directors to make full and active contributions to the Board’s affairs.
‧ ensure appropriate steps are taken to provide effective communication with shareholders and that views of shareholders are communicated to the Board as a whole.
The roles of Chief Executive Officer comprise, but are not limited to, the following:
‧ enhance the global sales potential of our strong brand portfolio.
‧ provide leadership for the global management team in the Group’s daily operations.
‧ facilitate the integrating acquisitions in North America and Europe.
Before accepting appointment as a director, every Director is aware that he must be able to contribute sufficient time and attention to the affairs of the Company. Orientation which details the duties and responsibilities of directors under the Listing Rules, the Company’s Articles of Association, related ordinances and relevant regulatory requirements of Hong Kong is provided for every newly appointed director. Presentations are given by senior executives of the Company and external professionals to ensure a proper understanding of the Company’s business and operations.
Appropriate Directors’ and Officers’ liability insurance cover has been arranged to indemnify the Directors and Officers of the Group for liabilities arising out of corporate activities. The coverage and the sum insured under the policy are reviewed annually.
In accordance with the Company’s Articles of Association and the Listing Rules, directors are subject to retirement by rotation at least once every three years. Any Directors appointed to fill a casual vacancy would be subject to election by shareholders at the next annual general meeting after their appointment. As at the date of this report, Independent Non-executive Directors and Non-executive Director form majority of the Board, and the Independent Non-executive Directors represent over one-third of the Board. Furthermore, each of the Independent Non-executive Directors possesses professional qualifications or accounting or related financial management expertise as required under Rule 3.10 of the Listing Rules. All the Independent Non-executive Directors meet the guidelines for assessing independence set out in Rule 3.13 of the Listing Rules. Annual confirmation of independence from each of the Independent Non-executive Directors has been received by the Company and they are still considered to be independent.
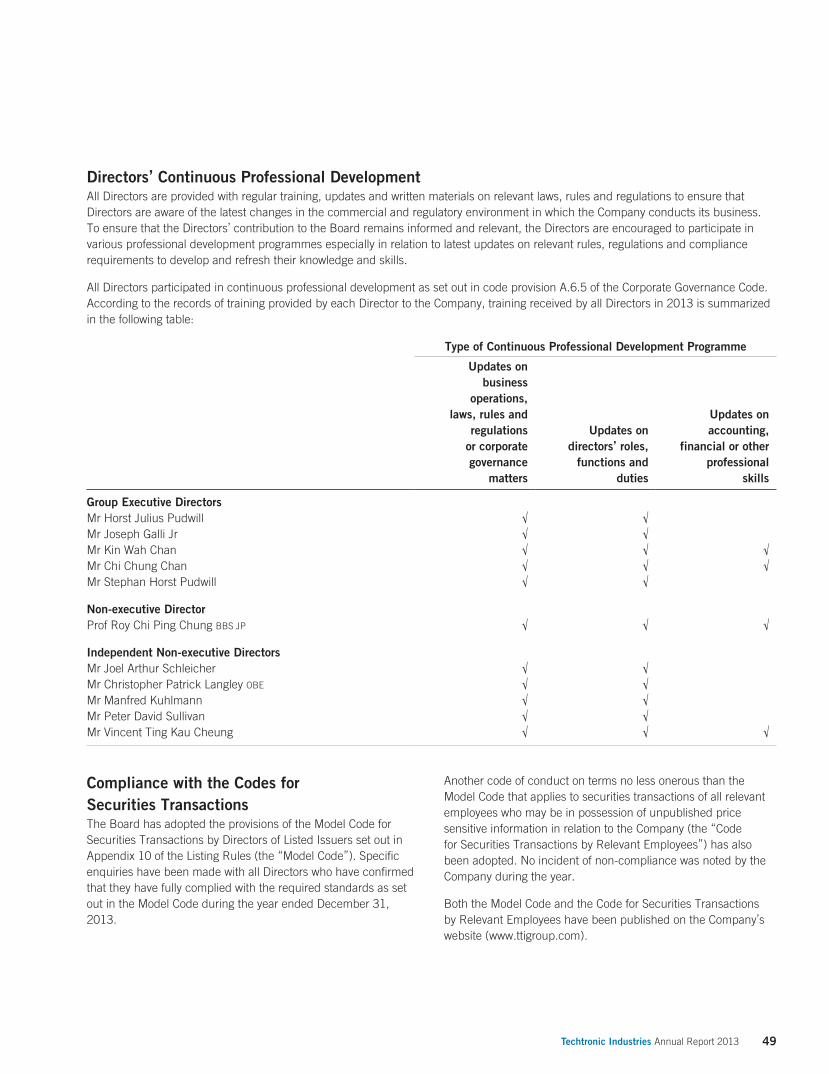
49Techtronic Industries Annual Report 2013
Directors’ Continuous Professional DevelopmentAll Directors are provided with regular training, updates and written materials on relevant laws, rules and regulations to ensure that Directors are aware of the latest changes in the commercial and regulatory environment in which the Company conducts its business. To ensure that the Directors’ contribution to the Board remains informed and relevant, the Directors are encouraged to participate in various professional development programmes especially in relation to latest updates on relevant rules, regulations and compliance requirements to develop and refresh their knowledge and skills.
All Directors participated in continuous professional development as set out in code provision A.6.5 of the Corporate Governance Code. According to the records of training provided by each Director to the Company, training received by all Directors in 2013 is summarized in the following table:
Type of Continuous Professional Development Programme
Updates on business
operations, laws, rules and
regulations or corporate governance
matters
Updates on directors’ roles,
functions and duties
Updates on accounting,
financial or other professional
skills
Group Executive DirectorsMr Horst Julius Pudwill √ √Mr Joseph Galli Jr √ √Mr Kin Wah Chan √ √ √Mr Chi Chung Chan √ √ √Mr Stephan Horst Pudwill √ √
Non-executive DirectorProf Roy Chi Ping Chung BBS JP √ √ √
Independent Non-executive DirectorsMr Joel Arthur Schleicher √ √Mr Christopher Patrick Langley OBE √ √Mr Manfred Kuhlmann √ √Mr Peter David Sullivan √ √Mr Vincent Ting Kau Cheung √ √ √
Compliance with the Codes for Securities TransactionsThe Board has adopted the provisions of the Model Code for Securities Transactions by Directors of Listed Issuers set out in Appendix 10 of the Listing Rules (the “Model Code”). Specific enquiries have been made with all Directors who have confirmed that they have fully complied with the required standards as set out in the Model Code during the year ended December 31, 2013.
Another code of conduct on terms no less onerous than the Model Code that applies to securities transactions of all relevant employees who may be in possession of unpublished price sensitive information in relation to the Company (the “Code for Securities Transactions by Relevant Employees”) has also been adopted. No incident of non-compliance was noted by the Company during the year.
Both the Model Code and the Code for Securities Transactions by Relevant Employees have been published on the Company’s website (www.ttigroup.com).
Corporate Governance Report
50 Techtronic Industries Annual Report 2013
Board MeetingsTo facilitate the effectiveness of the Board, there are at least four scheduled Board meetings in a year and will meet more frequently as and when required. All Directors are provided with timely, complete and reliable information on the affairs of the Group, and have access to all related materials in relation to the Board’s issues to enable informed decisions with sufficient details. Directors receive support from and access to the Company Secretary of the Company (the “Company Secretary”) to ensure Board procedures and all applicable law, rules and regulations are followed. Each Director can access to senior management of the Group on their requests and to independent professional advice on performing their duties at the Company’s expenses. All Directors receive briefings and professional development training as necessary to ensure a proper understanding of the business of the Group and their responsibilities under statute and at common law.
Six Board meetings were held in 2013. Attendance records of each Director are set out in the section “Board, Board Committee and General Meetings in 2013” at the end of this report. The meeting agenda is set by the Chairman in consultation with members of the Board to include any other matters raised by Directors in advance. Minutes of the Board and Board Committee meetings with sufficient details of matters and concerns discussed are kept in safe custody by the Company Secretary, are sent to the Directors for comment and records and are open for inspection by the Directors. To facilitate maximum attendance of Directors, Board meeting, Board Committee meeting and Annual General Meeting dates for 2014 have been agreed at the Board meeting held in August 2013.
Board CommitteesThe Board has delegated various responsibilities to three Board committees which have been set up, namely the Audit Committee, the Nomination Committee and the Remuneration Committee. Each of these Board Committees has specific written terms of reference which deal clearly with their authority and duties and have been published on the Company’s website (www.ttigroup.com) and the Stock Exchange’s website (www.hkexnews.hk).
Independent Non-executive Directors form the majority of all Board Committees with regular attendance and active participation to ensure independent views and opinions contributed and expressed at the Board Committee meetings. The Board monitors and oversees the delegated authority and responsibilities through regular reporting by the Board Committees in relation to their activities involved and recommendations and decisions made. Attendance records of each Board Committee are set out in the section “Board, Board Committee and General Meetings in 2013”.
Audit CommitteeThe Audit Committee is chaired by Mr Peter David Sullivan with other members being Mr Joel Arthur Schleicher and Mr Manfred Kuhlmann. All members of the Audit Committee are Independent Non-executive Directors and each of them has professional qualifications or accounting or related financial management expertise as required under Rule 3.10 of the Listing Rules.
The Audit Committee aims to ensure the effectiveness of internal control system and compliance with the Group’s obligations under the Listing Rules and other applicable laws and regulations and to oversee the integrity of the financial statements of the Company. The Audit Committee is also directly responsible on behalf of the Board for the assessment of the independence and qualifications of the external auditors; the selection, oversight and remuneration of the Company’s external auditors; the maintenance of an appropriate relationship with the external auditors and the oversight of the performance of the Company’s external auditors.
The Audit Committee held four meetings in 2013 and performed duties summarized below:
‧ review the Group’s accounting principles and practices, significant financial matters, internal controls and financial reporting matters.
‧ recommend the re-appointment of the external auditors and review the audit and non-audit services provided by the external auditors.
‧ review the interim and annual financial statements of the Group before submission to the Board.
‧ perform regular update and review on internal audit of the Group.
Nomination CommitteeThe Nomination Committee is chaired by Mr Horst Julius Pudwill (Chairman of the Board) with other members being Mr Vincent Ting Kau Cheung, Mr Christopher Patrick Langley OBE and Mr Manfred Kuhlmann. All members except Mr Horst Julius Pudwill are Independent Non-executive Directors.
51Techtronic Industries Annual Report 2013
The Nomination Committee aims to ensure a fair and transparent process of Board appointments, and in particular to assist the Board to identify suitably qualified candidates and make recommendations for consideration of the Board and shareholders. The Nomination Committee would consider, but not limited to, professional knowledge, industry experience, personal skills, ethics and integrity as well as the ability to contribute sufficient time and attention to the Board when considering suitable candidates of directors.
The Nomination Committee held two meetings in 2013. The work performed by the Nomination Committee in 2013, with sufficient resources provided by the Company and/or independent professional advice if necessary, included:
‧ review of the structure, size and composition of the Board and the existing Nomination Policy on a regular basis.
‧ review and make recommendations to the Board on the Board Diversity Policy.
‧ assess the independence of Independent Non-executive Directors.
‧ make recommendations to the Board on relevant matters relating to the retirement and re-election of the Directors at the 2013 Annual General Meeting.
The Board adopted the Board Diversity Policy with recommendation from the Nomination Committee in August 2013, which is published on the Company’s website (www.ttigroup.com). The Company recognizes that widening diversity at the Board level is essential for sustainable development of the Group. While reviewing the composition of the Board, the Nomination Committee would consider various perspectives, including, but not limited to, age, gender, cultural and educational background, professional experience and length of service. An analysis of the current Board composition based on these objective criteria is set out on page 47 of this report.
Remuneration CommitteeThe Remuneration Committee is chaired by Mr Vincent Ting Kau Cheung with the other members being Mr Christopher Patrick Langley OBE, Mr Manfred Kuhlmann, Mr Joel Arthur Schleicher and Mr Peter David Sullivan. All members of the Remuneration Committee are Independent Non-executive Directors.
The Remuneration Committee aims to assist the Board in developing and administering a fair and transparent procedure for setting policy on the overall human resources strategy of the Group as well as the remuneration of Directors and senior management of the Group, and for determining their remuneration packages, on the basis of their merit, qualifications, and competence, and having regard to the Company’s operating results, individual performance, and comparable market statistics. The Remuneration Committee makes recommendations to the Board on the remuneration packages of Executive Directors and senior management, including, without limitation, base salaries, bonuses, benefits in kind and compensation payments. The Remuneration Committee also makes recommendations to the Board on the remuneration of Non-executive Director and Independent Non-executive Directors. The Remuneration Committee reports directly to the Board on its decisions or recommendations, and consults the Chairman and/or Chief Executive Officer for the proposals of other Executive Directors’ remuneration packages with access to sufficient resources and professional advices if necessary.
The Remuneration Committee held two meetings in 2013 and performed, among other things, the following:
‧ review and make recommendations on the existing remuneration policy for directors and senior management.
‧ assess the performance and remuneration package of Executive Directors.
Company SecretaryAll Directors have access to the advice and services of the Company Secretary. The Company Secretary is responsible for ensuring that Board procedures are followed and for facilitating information flows and communications among Directors as well as with Shareholders and management of the Company. The Company Secretary is an employee of the Company and is appointed by the Board. During 2013, the Company Secretary undertook over 15 hours of professional training to update her skills and knowledge.
Accountability and AuditThe Board acknowledges its responsibility for overseeing the preparation of the accounts of the Group which give a true and fair view of the Group’s state of affairs, results and cash flows for the year.
The Board will present a balanced, clear and understandable assessment of annual and interim reports, other price-sensitive announcements and other financial disclosures required under the Listing Rules, and reports to the regulators as well as information required to be disclosed pursuant to statutory requirements.
Corporate Governance Report
52 Techtronic Industries Annual Report 2013
Internal ControlsThe Board aims to maintain a sound and effective internal control system and is responsible for approving and reviewing key internal control policies which include delegated authorities, policy on market disclosure, investor and media relations, non-audit services and treasury management policy. The Board conducts an annual review of the effectiveness of the internal control system of the Company. An internal control system is designed to provide reasonable, but not absolute assurance that material misstatement or loss can be avoided, and to manage and minimize risks of failure in operational systems.
The Board, and in particular the Audit Committee, conducts a continuous review of the effectiveness of the Group’s internal control system that has been put in place. The reviews covering financial, operational, compliance controls and risk management performed in 2013 included:
‧ the strategic and annual operating plan.
‧ the effectiveness of the Company’s procedures relating to statutory and regulatory compliance.
‧ the organization structure and delegated authorities.
‧ the risk management process including formal risk assessment at the enterprise level upon discussions with senior management responsible for day-to-day management of significant risks.
‧ the performance and adequacy of accounting and financial reporting functions.
‧ the scope and quality of management’s ongoing monitoring of risks and system of internal control.
External AuditorsDeloitte Touche Tohmatsu, the external auditors of the Group, provided the following audit and non-audit services to the Group in 2013:
AmountNature of Services (USD million)
External Audit Services 2.6Taxation Services 0.1Other Services 0.1
The other services provided by Deloitte Touche Tohmatsu comprised professional services conducted under the terms of specified engagements.
The nature and ratio of annual fees to external auditors for audit services and non-audit services are subject to scrutiny by the Audit Committee to ensure the independence of the external auditors. All non-audit services from external auditors are regulated by a Policy on Non-Audit Services published on the Company’s website (www.ttigroup.com).
The members of the Audit Committee and the external auditors of the Group meet without the presence of the management of the Group twice a year to enhance independent reporting by external auditors of the Group. In order to maintain effective communication with shareholders, the external auditors attended the 2013 Annual General Meeting to answer questions about the conduct of the audit, the preparation and content of the auditors’ report, the accounting policies and auditor independence.
Investor Relations and Shareholder CommunicationsThe Company aims to maintain effective communication and on-going dialogue with its shareholders and investors particularly through the following major means:
Shareholders’ Communication PolicyThe Shareholders’ Communication Policy, which primarily covered the current practices for communicating with the shareholders and published on the Company’s website (www.ttigroup.com), has been adopted by the Board on March 22, 2012. All the Company’s circulars, announcements, notices and results of general meetings, annual and interim reports, and webcasts of results presentations conducted at press conferences, which published on the Company’s website (www.ttigroup.com), provide timely, efficient and accurate information to the shareholders and investors. Essential information is communicated to the shareholders mainly through the Company’s financial reports, general meetings and the information published on the Company’s website (www.ttigroup.com) and the Stock Exchange’s website (www.hkexnews.hk). In addition, the Company holds regular meetings with institutional shareholders and analysts and encourages shareholders to attend annual general meetings to communicate with Directors and management of the Company directly.
A Policy on Market Disclosure, Investor and Media Relations, published on the Company’s website (www.ttigroup.com), ensures that the Company complies with its disclosure obligations under the Listing Rules and other applicable laws and regulations, and that all shareholders and potential investors have an equal opportunity to receive and obtain externally available information issued by the Company.
53Techtronic Industries Annual Report 2013
Shareholders’ RightsConvening of extraordinary general meeting on requisition by shareholdersPursuant to Article 66 of the Articles of Association of the Company and Sections 566-568 of the Companies Ordinance (Chapter 622 of the laws of Hong Kong), shareholders holding at least 5% of the total voting rights of all the shareholders having a right to vote at general meetings of the Company (the “Requisitionists”), may request the Directors to convene an extraordinary general meeting (“EGM”). The written requisition must state the general nature of the business to be dealt with at the EGM and must be signed by the Requisitionists and sent to the registered office of the Company which is currently located at 24/F., CDW Building, 388 Castle Peak Road, Tsuen Wan, New Territories, Hong Kong for the attention of the Company Secretary. The requisition may consist of several documents in like form and may include the text of a resolution that may properly be moved and is intended to be moved at the EGM.
If the Directors do not within 21 days after the date on which they become subject to the requirement proceed duly to convene an EGM for a day not more than 28 days after the date of the notice convening the EGM, the Requisitionists, or any of them representing more than one half of the total voting rights of all of them, may themselves convene an EGM. The EGM must be called for a date not more than 3 months after the date on which the Directors become subject to the requirement to call an EGM. Any reasonable expenses incurred by the Requisitionists by reason of the failure of the Directors duly to convene an EGM shall be repaid to the Requisitionists by the Company.
Procedure for nominating a person for election as a DirectorFor the detailed procedure for shareholders to nominate a person to stand for election as a director, please refer to the written procedure named “Nomination of Directors by Shareholder” which was published on the Company’s website (www.ttigroup.com).
Procedure for directing shareholders’ enquiries to the BoardThe Company values feedback from shareholders on its efforts to promote transparency and foster investor relationships. Shareholders may address their comments, suggestions and/ or enquires to the Board in writing through Investor Relations and Communication, contact details are set out in the section “Corporate Information” of this annual report.
Procedure for putting forward proposals at general meetingsPursuant to Section 615 of the Companies Ordinance (Chapter 622 of the laws of Hong Kong), shareholders may submit a written requisition to circulate a resolution at an annual general meeting (“AGM”) if they (a) represent at least 2.5% of the total voting rights of all shareholders having a right to vote on the resolution at the AGM to which the request relates; or (b) are at least 50 shareholders having a right to vote on the resolution at the AGM to which the request relates.
The written requisition must (a) identify the resolution of which notice is to be given, (b) be signed by the requisitionists; (c) be sent to the registered office of the Company for the attention of the Company Secretary; and (d) be received by the Company not later than 6 weeks before the AGM to which the request relates or if later, the time at which notice is given of that AGM. Shareholders are requested to refer to Section 580 and 615 of the Companies Ordinance (Chapter 622 of the laws of Hong Kong) for further details.
Constitutional DocumentNo change has been made to the Company’s constitutional document during 2013. The constitutional document of the Company was published on the Company’s website (www.ttigroup.com) and the Stock Exchange’s website (www.hkexnews.hk).

Corporate Governance Report
54 Techtronic Industries Annual Report 2013
Board, Board Committee and General Meetings in 2013A summary of attendance of Board, Board Committee and general meetings in 2013 are detailed in the following table:
Meetings attended/Held in 2013
BoardAudit
CommitteeNomination Committee
Remuneration Committee
General Meeting
Number of meeting(s) held during the year 6 4 2 2 1
Group Executive Directors
Mr Horst Julius Pudwill 6/6 2/2 1/1
Mr Joseph Galli Jr 6/6 1/1
Mr Kin Wah Chan 6/6 1/1
Mr Chi Chung Chan 6/6 1/1
Mr Stephan Horst Pudwill 6/6 1/1
Non-executive Director
Prof Roy Chi Ping Chung BBS JP 6/6 1/1
Independent Non-executive Directors
Mr Joel Arthur Schleicher 6/6 4/4 2/2 0/1(1)
Mr Christopher Patrick Langley OBE 6/6 2/2 2/2 0/1(2)
Mr Manfred Kuhlmann 6/6 4/4 2/2 2/2 1/1
Mr Peter David Sullivan 6/6 4/4 2/2 1/1
Mr Vincent Ting Kau Cheung 6/6 2/2 2/2 1/1
Date(s) of meeting(s) January 25, 2013
January 25, 2013
March 20, 2013
March 20, 2013
May 24, 2013
March 21, 2013
March 19, 2013
August 20, 2013
May 24, 2013
May 23, 2013
May 23, 2013
August 21, 2013
August 20, 2013
November 19, 2013
December 30, 2013
Notes:
(1) Mr Joel Arthur Schleicher (an Independent Non-executive Director) was unable to attend the annual general meeting of the Company held on May 24, 2013 (the “2013
Annual General Meeting”) due to prior engagements.
(2) Mr Christopher Patrick Langley OBE (an Independent Non-executive Director) was unable to attend the 2013 Annual General Meeting due to prior engagements.

Report of the Directors
55Techtronic Industries Annual Report 2013
The directors have pleasure in presenting their annual report and the audited financial statements for the year ended December 31, 2013.
Principal ActivitiesThe Company acts as an investment holding company.
The principal activities of the principal subsidiaries and associates are set out in Notes 52 and 53 to the financial statements, respectively.
Results and AppropriationsThe results of the Group for the year ended December 31, 2013 are set out in the consolidated statement of profit or loss and other comprehensive income on page 64.
An interim dividend of HK10.00 cents (approximately US1.29 cents) per share amounting to approximately USD23,554,000 was paid to the shareholders during the year.
The directors now recommend the payment of a final dividend of HK13.75 cents (approximately US1.77 cents) per share to the shareholders on the register of members on May 30, 2014, amounting to approximately USD32,382,000.
Property, Plant and EquipmentThe Group continued to expand its business and during the year spent approximately USD7,879,000 on moulds and tooling and acquired office equipment, furniture and fixtures for approximately USD7,635,000 and plant and machinery for approximately USD9,699,000. Details of these and other movements in the property, plant and equipment of the Group and the Company during the year are set out in Note 16 to the financial statements.
Share CapitalDetails of movements during the year in the share capital of the Company are set out in Note 41 to the financial statements.
A total of 3,300,000 ordinary shares of the Company were cancelled by the Company during the year. Among these cancelled shares, 2,000,000 shares were bought back and settled during the year at prices ranging from HKD17.74 to HKD19.16 and 1,300,000 shares were bought back in December 2012 and cancelled in January 2013 at prices ranging from HKD14.34 to HKD14.68. The aggregate amount paid by the Company for such buy-backs cancelled during 2013 amounting to USD7,158,000 was charged to the retained earnings. The issued share capital and the capital redemption reserve of the Company was reduced and increased respectively.
The buy-back of the Company’s shares during the year were effected by the Directors pursuant to the mandate received from shareholders at the previous annual general meeting, with a view to benefiting shareholders as a whole by enhancing the net asset value per share and earnings per share of the Company.
DirectorsThe directors of the Company during the year and up to the date of this report were:
Group Executive Directors:Mr Horst Julius Pudwill, ChairmanMr Joseph Galli Jr, Chief Executive OfficerMr Kin Wah ChanMr Chi Chung ChanMr Stephan Horst Pudwill
Non-executive Director:Prof Roy Chi Ping Chung BBS JP
Independent Non-executive Directors:Mr Joel Arthur SchleicherMr Christopher Patrick Langley OBE
Mr Manfred KuhlmannMr Peter David SullivanMr Vincent Ting Kau Cheung
In accordance with Article 103 of the Company’s Articles of Association, Messrs. Horst Julius Pudwill, Joseph Galli Jr, Manfred Kuhlmann and Peter David Sullivan will retire at the forthcoming Annual General Meeting and, being eligible, offer themselves for re-election.
No director proposed for re-election at the forthcoming Annual General Meeting has a service contract which is not determinable by the Group within one year without payment of compensation, other than statutory compensation.
Terms of Office of Non-executive Directors and Independent Non-executive DirectorsThe term of office for each of the Non-executive Directors and Independent Non-executive Directors is the period up to his retirement by rotation in accordance with Article 103 of the Company’s Articles of Association.
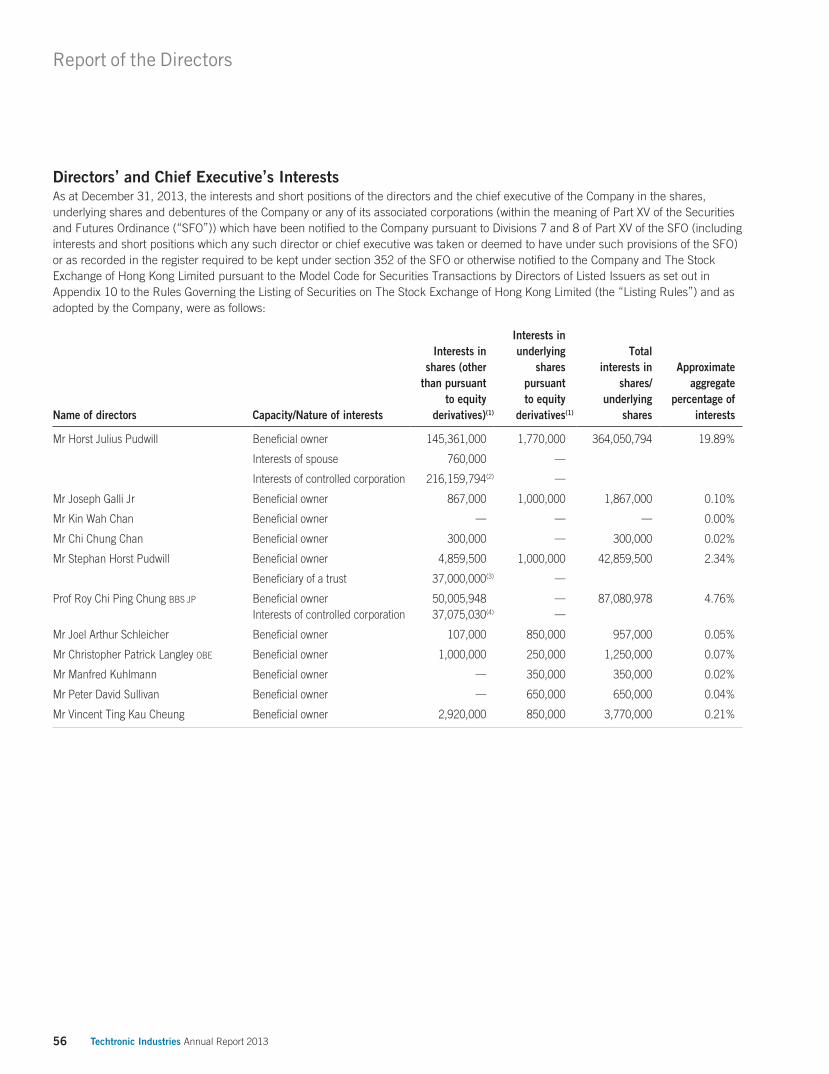
Report of the Directors
56 Techtronic Industries Annual Report 2013
Directors’ and Chief Executive’s InterestsAs at December 31, 2013, the interests and short positions of the directors and the chief executive of the Company in the shares, underlying shares and debentures of the Company or any of its associated corporations (within the meaning of Part XV of the Securities and Futures Ordinance (“SFO”)) which have been notified to the Company pursuant to Divisions 7 and 8 of Part XV of the SFO (including interests and short positions which any such director or chief executive was taken or deemed to have under such provisions of the SFO) or as recorded in the register required to be kept under section 352 of the SFO or otherwise notified to the Company and The Stock Exchange of Hong Kong Limited pursuant to the Model Code for Securities Transactions by Directors of Listed Issuers as set out in Appendix 10 to the Rules Governing the Listing of Securities on The Stock Exchange of Hong Kong Limited (the “Listing Rules”) and as adopted by the Company, were as follows:
Name of directors Capacity/Nature of interests
Interests in shares (other
than pursuantto equity
derivatives)(1)
Interests inunderlying
sharespursuantto equity
derivatives(1)
Totalinterests in
shares/underlying
shares
Approximateaggregate
percentage ofinterests
Mr Horst Julius Pudwill Beneficial owner 145,361,000 1,770,000 364,050,794 19.89%
Interests of spouse 760,000 —
Interests of controlled corporation 216,159,794(2) —
Mr Joseph Galli Jr Beneficial owner 867,000 1,000,000 1,867,000 0.10%
Mr Kin Wah Chan Beneficial owner — — — 0.00%
Mr Chi Chung Chan Beneficial owner 300,000 — 300,000 0.02%
Mr Stephan Horst Pudwill Beneficial owner 4,859,500 1,000,000 42,859,500 2.34%
Beneficiary of a trust 37,000,000(3) —
Prof Roy Chi Ping Chung BBS JP Beneficial owner 50,005,948 — 87,080,978 4.76%Interests of controlled corporation 37,075,030(4) —
Mr Joel Arthur Schleicher Beneficial owner 107,000 850,000 957,000 0.05%
Mr Christopher Patrick Langley OBE Beneficial owner 1,000,000 250,000 1,250,000 0.07%
Mr Manfred Kuhlmann Beneficial owner — 350,000 350,000 0.02%
Mr Peter David Sullivan Beneficial owner — 650,000 650,000 0.04%
Mr Vincent Ting Kau Cheung Beneficial owner 2,920,000 850,000 3,770,000 0.21%

57Techtronic Industries Annual Report 2013
Notes:
(1) Interests in shares and underlying shares stated above represent long
positions of the Company.
The interests of the directors of the Company in the underlying shares
pursuant to equity derivatives, which were held as beneficial owner,
represent share options granted to them respectively pursuant to the share
option schemes adopted by the Company, details of which are separately
disclosed in the section headed “Share Options” below. These share options
are physically settled and unlisted.
(2) These shares were held by the following companies in which Mr Horst Julius
Pudwill has a beneficial interest:
No. of shares Sunning Inc. 179,084,764
Cordless Industries Company Limited * 37,075,030
216,159,794
(3) These shares were held by a trust of which Mr Stephan Horst Pudwill is one
of the beneficiaries.
(4) These shares were held by Cordless Industries Company Limited* in which
Prof Roy Chi Ping Chung BBS JP has a beneficial interest.
* Cordless Industries Company Limited is owned as to 70% by
Mr Horst Julius Pudwill and as to 30% by Prof Roy Chi Ping Chung
BBS JP.
Save as disclosed above, none of the directors and the chief executive of the Company was interested or had any short position in any shares, underlying shares or debentures of the Company and its associated corporations (within the meaning of Part XV of the SFO) as at December 31, 2013.
Share OptionsScheme adopted on May 29, 2007 (“Scheme D”)Following the termination of Scheme C, a new share option scheme was adopted pursuant to a resolution passed on May 29, 2007 for recognition of the contribution to the development and growth of the Group by the eligible persons. This scheme will expire on May 28, 2017. Under Scheme D, the Board of Directors of the Company may grant share options to the following eligible persons (and their wholly owned companies) of the Company, its subsidiaries and any companies in which the Group holds any equity interest, to subscribe for shares in the Company:
(i) employees; or
(ii) Non-executive Directors (including Independent Non-executive Directors or Officers); or
(iii) secondees; or
(iv) business partners, agents, consultants; or
(v) suppliers or customers; or
(vi) any person or entity that provides research, development or other technological support; or
(vii) shareholders.
Share options granted must be taken up within 21 days of the date of grant, upon payment of HKD1.00 in cash by way of consideration for the grant thereof. Share options may be exercised at any time, subject to vesting conditions from the date of grant to the tenth anniversary thereof. The subscription price is set at the highest of: the closing price of the shares on the date of offer of the share option; or the average closing price of shares as stated in the daily quotation sheets issued by the Stock Exchange for the five trading days immediately preceding the date of offer; or the nominal value of shares on the date of offer.
The maximum number of shares in respect of which share options may be granted under Scheme D is not permitted to exceed 30.0% of the issued share capital of the Company from time to time or 10.0% of shares in issue as at the adoption date of Scheme D. No person shall be granted an option which exceeds 1.0% of the shares in issue as at the date of offer in any 12-month period up to the date thereof.

Report of the Directors
58 Techtronic Industries Annual Report 2013
Share Options (continued)
The following table discloses movements in the Company’s share options during the year:
Share option holders
Date ofshare
optionsgranted
Shareoption
schemecategory
Outstandingat beginning
of the year
Grantedduring
the year
Exercisedduring
the year
Lapsedduring
the year
Outstandingat end ofthe year
Subscriptionprice Exercise periodHKD
Directors
Mr Horst Julius Pudwill 16.11.2009 D 600,000 — — — 600,000 6.770 16.11.2009 - 15.11.2019
26.11.2010 D 600,000 — — — 600,000 8.310 26.11.2010 - 25.11.2020
21.5.2012 D 570,000 — — — 570,000 8.742 21.5.2012 - 20.5.2022
Mr Joseph Galli Jr 16.11.2009 D 1,000,000 — — — 1,000,000 6.770 16.11.2009 - 15.11.2019
Mr Kin Wah Chan 16.11.2009 D 1,000,000 — (1,000,000) — — 6.770 16.11.2009 - 15.11.2019
Mr Stephan Horst Pudwill 21.5.2012 D 1,000,000 — — — 1,000,000 8.742 21.5.2012 - 20.5.2022
Prof Roy Chi Ping Chung BBS JP 16.11.2009 D 600,000 — (600,000) — — 6.770 16.11.2009 - 15.11.2019
Mr Joel Arthur Schleicher 16.11.2009 D 400,000 — — — 400,000 6.770 16.11.2009 - 15.11.2019
23.5.2011 D 200,000 — — — 200,000 9.872 23.5.2011 - 22.5.2021
21.5.2012 D 250,000 — — — 250,000 8.742 21.5.2012 - 20.5.2022
Mr Christopher Patrick Langley OBE 23.5.2011 D 200,000 — (200,000) — — 9.872 23.5.2011 - 22.5.2021
21.5.2012 D 250,000 — — — 250,000 8.742 21.5.2012 - 20.5.2022
Mr Manfred Kuhlmann 23.5.2011 D 100,000 — — — 100,000 9.872 23.5.2011 - 22.5.2021
21.5.2012 D 250,000 — — — 250,000 8.742 21.5.2012 - 20.5.2022
Mr Peter David Sullivan 16.11.2009 D 400,000 — (200,000) — 200,000 6.770 16.11.2009 - 15.11.2019
23.5.2011 D 200,000 — — — 200,000 9.872 23.5.2011 - 22.5.2021
21.5.2012 D 250,000 — — — 250,000 8.742 21.5.2012 - 20.5.2022
Mr Vincent Ting Kau Cheung 16.11.2009 D 400,000 — — — 400,000 6.770 16.11.2009 - 15.11.2019
23.5.2011 D 200,000 — — — 200,000 9.872 23.5.2011 - 22.5.2021
21.5.2012 D 250,000 — — — 250,000 8.742 21.5.2012 - 20.5.2022
Total for directors 8,720,000 — (2,000,000) — 6,720,000
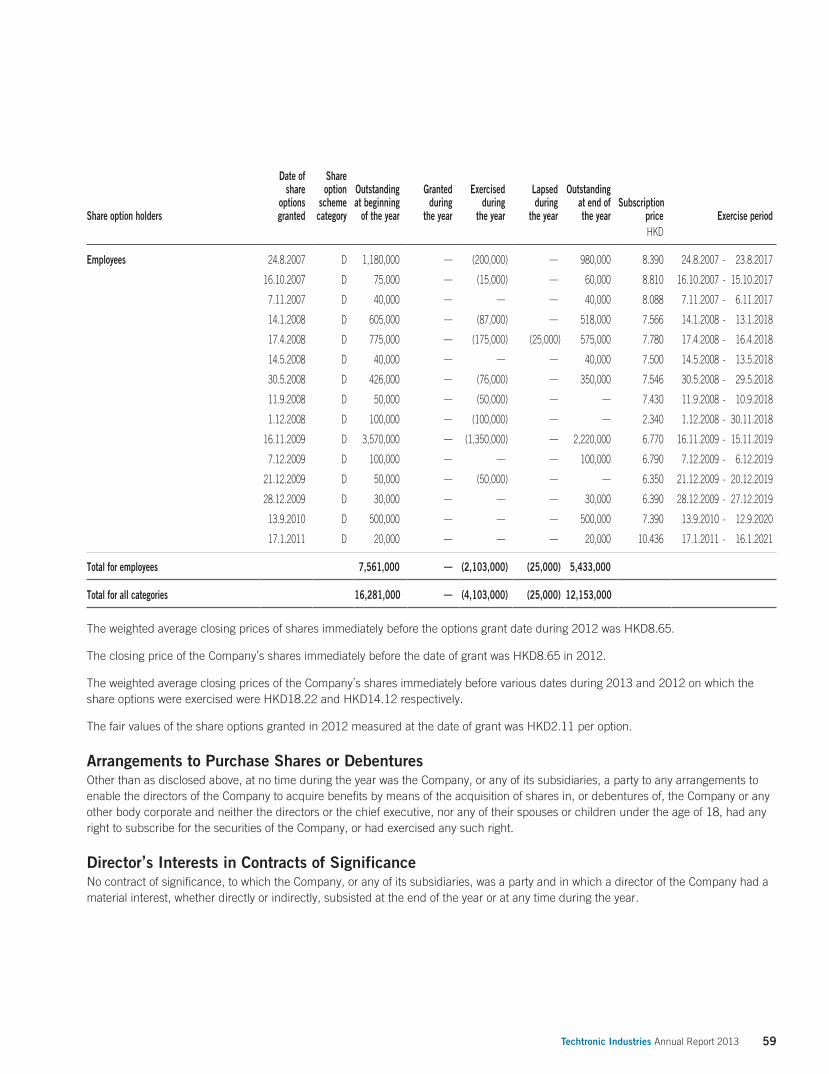
59Techtronic Industries Annual Report 2013
Share option holders
Date ofshare
optionsgranted
Shareoption
schemecategory
Outstandingat beginning
of the year
Grantedduring
the year
Exercisedduring
the year
Lapsedduring
the year
Outstandingat end ofthe year
Subscriptionprice Exercise periodHKD
Employees 24.8.2007 D 1,180,000 — (200,000) — 980,000 8.390 24.8.2007 - 23.8.2017
16.10.2007 D 75,000 — (15,000) — 60,000 8.810 16.10.2007 - 15.10.2017
7.11.2007 D 40,000 — — — 40,000 8.088 7.11.2007 - 6.11.2017
14.1.2008 D 605,000 — (87,000) — 518,000 7.566 14.1.2008 - 13.1.2018
17.4.2008 D 775,000 — (175,000) (25,000) 575,000 7.780 17.4.2008 - 16.4.2018
14.5.2008 D 40,000 — — — 40,000 7.500 14.5.2008 - 13.5.2018
30.5.2008 D 426,000 — (76,000) — 350,000 7.546 30.5.2008 - 29.5.2018
11.9.2008 D 50,000 — (50,000) — — 7.430 11.9.2008 - 10.9.2018
1.12.2008 D 100,000 — (100,000) — — 2.340 1.12.2008 - 30.11.2018
16.11.2009 D 3,570,000 — (1,350,000) — 2,220,000 6.770 16.11.2009 - 15.11.2019
7.12.2009 D 100,000 — — — 100,000 6.790 7.12.2009 - 6.12.2019
21.12.2009 D 50,000 — (50,000) — — 6.350 21.12.2009 - 20.12.2019
28.12.2009 D 30,000 — — — 30,000 6.390 28.12.2009 - 27.12.2019
13.9.2010 D 500,000 — — — 500,000 7.390 13.9.2010 - 12.9.2020
17.1.2011 D 20,000 — — — 20,000 10.436 17.1.2011 - 16.1.2021
Total for employees 7,561,000 — (2,103,000) (25,000) 5,433,000
Total for all categories 16,281,000 — (4,103,000) (25,000) 12,153,000
The weighted average closing prices of shares immediately before the options grant date during 2012 was HKD8.65.
The closing price of the Company’s shares immediately before the date of grant was HKD8.65 in 2012.
The weighted average closing prices of the Company’s shares immediately before various dates during 2013 and 2012 on which the share options were exercised were HKD18.22 and HKD14.12 respectively.
The fair values of the share options granted in 2012 measured at the date of grant was HKD2.11 per option.
Arrangements to Purchase Shares or DebenturesOther than as disclosed above, at no time during the year was the Company, or any of its subsidiaries, a party to any arrangements to enable the directors of the Company to acquire benefits by means of the acquisition of shares in, or debentures of, the Company or any other body corporate and neither the directors or the chief executive, nor any of their spouses or children under the age of 18, had any right to subscribe for the securities of the Company, or had exercised any such right.
Director’s Interests in Contracts of SignificanceNo contract of significance, to which the Company, or any of its subsidiaries, was a party and in which a director of the Company had a material interest, whether directly or indirectly, subsisted at the end of the year or at any time during the year.
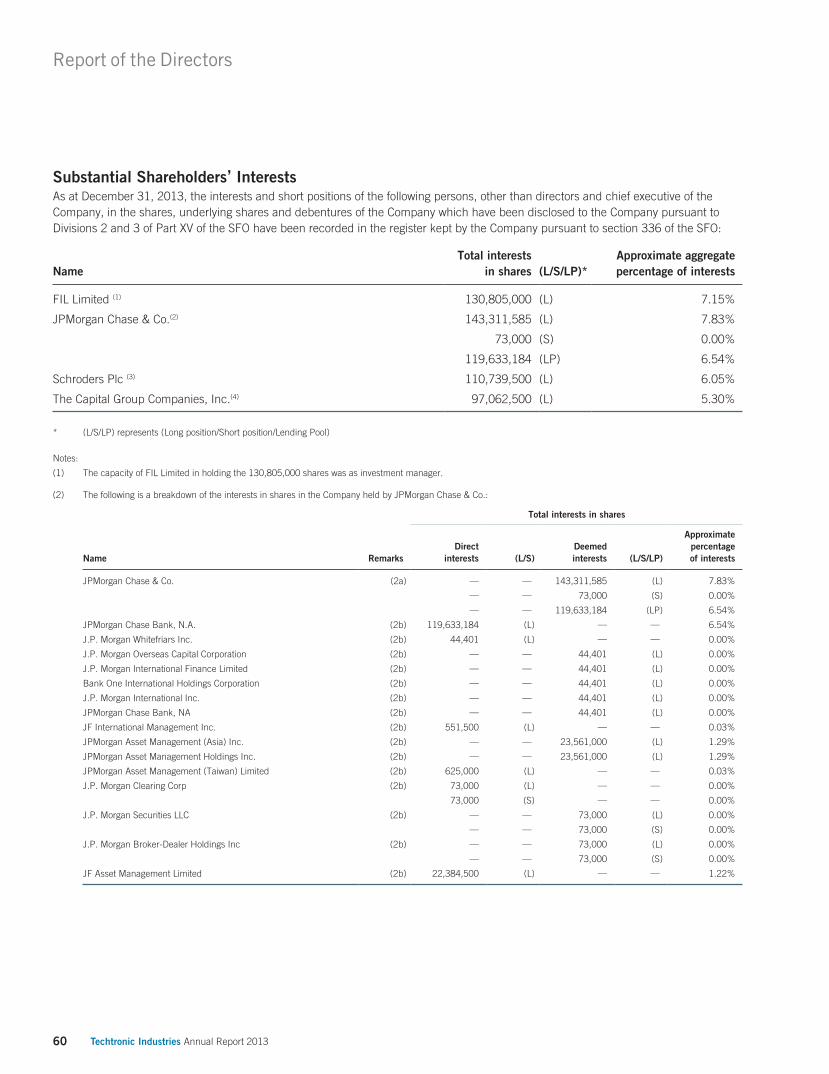
Report of the Directors
60 Techtronic Industries Annual Report 2013
Substantial Shareholders’ InterestsAs at December 31, 2013, the interests and short positions of the following persons, other than directors and chief executive of the Company, in the shares, underlying shares and debentures of the Company which have been disclosed to the Company pursuant to Divisions 2 and 3 of Part XV of the SFO have been recorded in the register kept by the Company pursuant to section 336 of the SFO:
Total interestsin shares
Approximate aggregatepercentage of interestsName (L/S/LP)*
FIL Limited (1) 130,805,000 (L) 7.15%
JPMorgan Chase & Co.(2) 143,311,585 (L) 7.83%
73,000 (S) 0.00%
119,633,184 (LP) 6.54%
Schroders Plc (3) 110,739,500 (L) 6.05%
The Capital Group Companies, Inc.(4) 97,062,500 (L) 5.30%
* (L/S/LP) represents (Long position/Short position/Lending Pool)
Notes:
(1) The capacity of FIL Limited in holding the 130,805,000 shares was as investment manager.
(2) The following is a breakdown of the interests in shares in the Company held by JPMorgan Chase & Co.:
Total interests in shares
Name RemarksDirect
interests (L/S)Deemedinterests (L/S/LP)
Approximatepercentageof interests
JPMorgan Chase & Co. (2a) — — 143,311,585 (L) 7.83%
— — 73,000 (S) 0.00%
— — 119,633,184 (LP) 6.54%
JPMorgan Chase Bank, N.A. (2b) 119,633,184 (L) — — 6.54%
J.P. Morgan Whitefriars Inc. (2b) 44,401 (L) — — 0.00%
J.P. Morgan Overseas Capital Corporation (2b) — — 44,401 (L) 0.00%
J.P. Morgan International Finance Limited (2b) — — 44,401 (L) 0.00%
Bank One International Holdings Corporation (2b) — — 44,401 (L) 0.00%
J.P. Morgan International Inc. (2b) — — 44,401 (L) 0.00%
JPMorgan Chase Bank, NA (2b) — — 44,401 (L) 0.00%
JF International Management Inc. (2b) 551,500 (L) — — 0.03%
JPMorgan Asset Management (Asia) Inc. (2b) — — 23,561,000 (L) 1.29%
JPMorgan Asset Management Holdings Inc. (2b) — — 23,561,000 (L) 1.29%
JPMorgan Asset Management (Taiwan) Limited (2b) 625,000 (L) — — 0.03%
J.P. Morgan Clearing Corp (2b) 73,000 (L) — — 0.00%
73,000 (S) — — 0.00%
J.P. Morgan Securities LLC (2b) — — 73,000 (L) 0.00%
— — 73,000 (S) 0.00%
J.P. Morgan Broker-Dealer Holdings Inc (2b) — — 73,000 (L) 0.00%
— — 73,000 (S) 0.00%
JF Asset Management Limited (2b) 22,384,500 (L) — — 1.22%

61Techtronic Industries Annual Report 2013
Notes: (continued)
Remarks:
(2a) JPMorgan Chase & Co. is listed on New York Stock Exchange. The capacity of JPMorgan Chase & Co. in holding the 143,311,585 shares of long position,
73,000 shares of short position and 119,633,184 shares of lending pool respectively was as controlled corporation.
(2b) JPMorgan Chase Bank, N.A., J.P. Morgan Whitefriars Inc., J.P. Morgan Overseas Capital Corporation, J.P. Morgan International Finance Limited, Bank One
International Holdings Corporation, J.P. Morgan International Inc., JPMorgan Chase Bank, NA, JF International Management Inc., JPMorgan Asset Management
(Asia) Inc., JPMorgan Asset Management Holdings Inc., JPMorgan Asset Management (Taiwan) Limited, J.P. Morgan Clearing Corp, J.P. Morgan Securities
LLC, J.P. Morgan Broker-Dealer Holdings Inc and JF Asset Management Limited were all direct or indirect owned by JPMorgan Chase & Co. and by virtue of the
SFO, JPMorgan Chase & Co. was deemed to be interested in the shares held by these subsidiaries.
(3) The following is a breakdown of the interests in shares in the Company held by Schroders Plc.:
Total interests in shares
Name RemarksDirect
interests (L/S)Deemedinterests (L/S)
Approximatepercentageof interests
Schroders Plc (3a) — — 110,739,500 (L) 6.05%
Schroder Administration Limited (3b) — — 110,739,500 (L) 6.05%
Schroder International Holdings Limited (3b) — — 82,683,500 (L) 4.52%
Schroder Holdings (Bermuda) Limited (3b) — — 82,683,500 (L) 4.52%
Schroder International Holdings (Bermuda) Limited (3b) — — 82,683,500 (L) 4.52%
Schroder Investment Management Limited (3b) 12,644,500 (L) — — 0.69%
Schroder & Co Limited (3b) 142,000 (L) — — 0.00%
Schroder Investment Management Limited (3b) — — 15,064,500 (L) 0.82%
Schroder Investment Management North America Limited (3b) 15,064,500 (L) — — 0.82%
Schroder Investment Management (Guernsey) Limited (3b) 205,000 (L) — — 0.01%
Schroder Investment Management (Singapore) Limited (3b) 42,307,000 (L) — — 2.31%
Schroder Investment Management (Hong Kong) Limited (3b) 40,376,500 (L) — — 2.21%
Remarks:
(3a) Schroders Plc is listed on London Stock Exchange. The capacity of Schroders Plc in holding the 110,739,500 shares of long position was as investment
manager.
(3b) Schroder Administration Limited, Schroder International Holdings Limited, Schroder Holdings (Bermuda) Limited, Schroder International Holdings (Bermuda)
Limited, Schroder Investment Management Limited, Schroder & Co Limited, Schroder Investment Management Limited, Schroder Investment Management
North America Limited, Schroder Investment Management (Guernsey) Limited, Schroder Investment Management (Singapore) Limited and Schroder Investment
Management (Hong Kong) Limited were all direct or indirect owned by Schroders Plc and by virtue of the SFO, Schroders Plc was deemed to be interested in
the shares held by these subsidiaries.
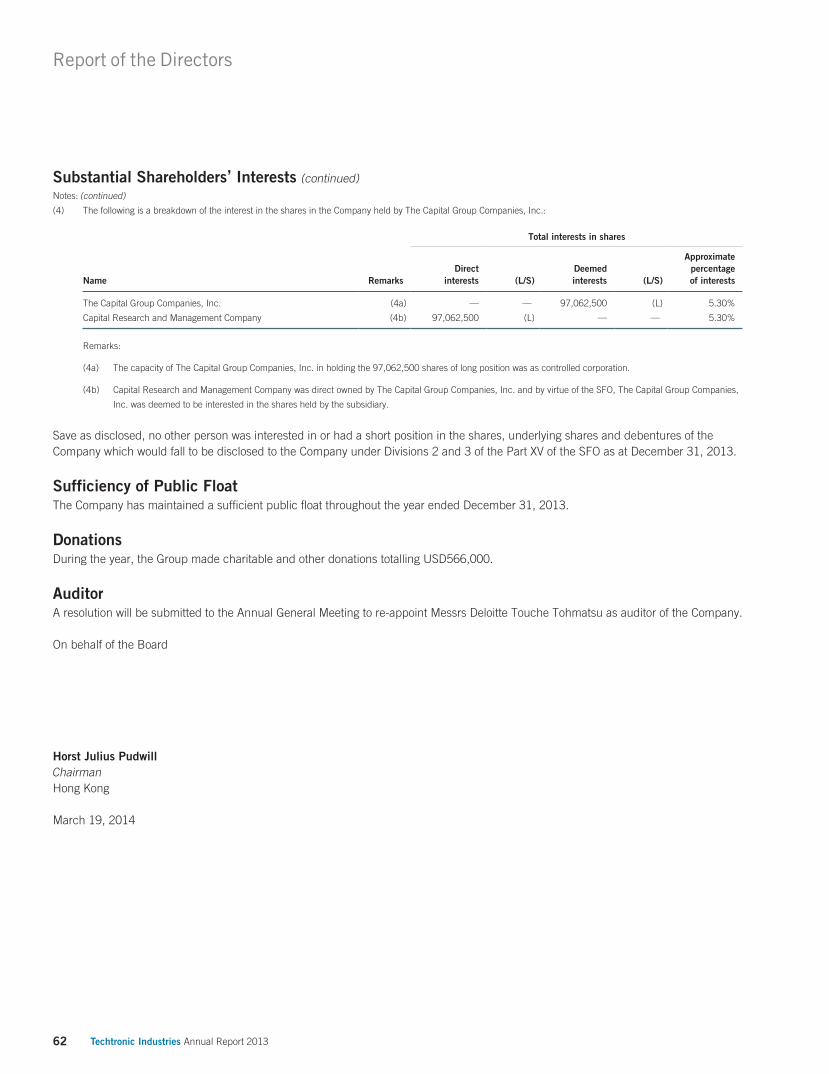
Report of the Directors
62 Techtronic Industries Annual Report 2013
Substantial Shareholders’ Interests (continued)Notes: (continued)
(4) The following is a breakdown of the interest in the shares in the Company held by The Capital Group Companies, Inc.:
Total interests in shares
Name RemarksDirect
interests (L/S)Deemedinterests (L/S)
Approximatepercentageof interests
The Capital Group Companies, Inc. (4a) — — 97,062,500 (L) 5.30%
Capital Research and Management Company (4b) 97,062,500 (L) — — 5.30%
Remarks:
(4a) The capacity of The Capital Group Companies, Inc. in holding the 97,062,500 shares of long position was as controlled corporation.
(4b) Capital Research and Management Company was direct owned by The Capital Group Companies, Inc. and by virtue of the SFO, The Capital Group Companies,
Inc. was deemed to be interested in the shares held by the subsidiary.
Save as disclosed, no other person was interested in or had a short position in the shares, underlying shares and debentures of the Company which would fall to be disclosed to the Company under Divisions 2 and 3 of the Part XV of the SFO as at December 31, 2013.
Sufficiency of Public FloatThe Company has maintained a sufficient public float throughout the year ended December 31, 2013.
DonationsDuring the year, the Group made charitable and other donations totalling USD566,000.
AuditorA resolution will be submitted to the Annual General Meeting to re-appoint Messrs Deloitte Touche Tohmatsu as auditor of the Company.
On behalf of the Board
Horst Julius PudwillChairmanHong Kong
March 19, 2014
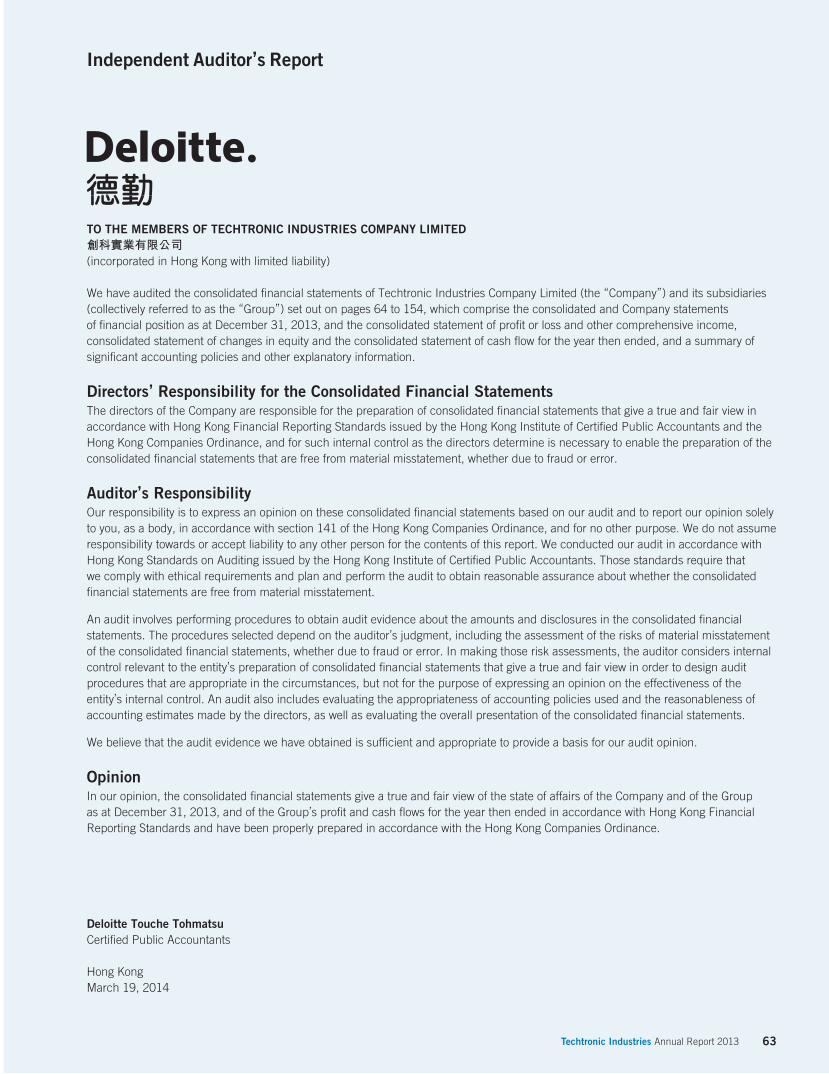
Independent Auditor’s Report
63Techtronic Industries Annual Report 2013
TO THE MEMBERS OF TECHTRONIC INDUSTRIES COMPANY LIMITED創科實業有限公司(incorporated in Hong Kong with limited liability)
We have audited the consolidated financial statements of Techtronic Industries Company Limited (the “Company”) and its subsidiaries (collectively referred to as the “Group”) set out on pages 64 to 154, which comprise the consolidated and Company statements of financial position as at December 31, 2013, and the consolidated statement of profit or loss and other comprehensive income, consolidated statement of changes in equity and the consolidated statement of cash flow for the year then ended, and a summary of significant accounting policies and other explanatory information.
Directors’ Responsibility for the Consolidated Financial StatementsThe directors of the Company are responsible for the preparation of consolidated financial statements that give a true and fair view in accordance with Hong Kong Financial Reporting Standards issued by the Hong Kong Institute of Certified Public Accountants and the Hong Kong Companies Ordinance, and for such internal control as the directors determine is necessary to enable the preparation of the consolidated financial statements that are free from material misstatement, whether due to fraud or error.
Auditor’s ResponsibilityOur responsibility is to express an opinion on these consolidated financial statements based on our audit and to report our opinion solely to you, as a body, in accordance with section 141 of the Hong Kong Companies Ordinance, and for no other purpose. We do not assume responsibility towards or accept liability to any other person for the contents of this report. We conducted our audit in accordance with Hong Kong Standards on Auditing issued by the Hong Kong Institute of Certified Public Accountants. Those standards require that we comply with ethical requirements and plan and perform the audit to obtain reasonable assurance about whether the consolidated financial statements are free from material misstatement.
An audit involves performing procedures to obtain audit evidence about the amounts and disclosures in the consolidated financial statements. The procedures selected depend on the auditor’s judgment, including the assessment of the risks of material misstatement of the consolidated financial statements, whether due to fraud or error. In making those risk assessments, the auditor considers internal control relevant to the entity’s preparation of consolidated financial statements that give a true and fair view in order to design audit procedures that are appropriate in the circumstances, but not for the purpose of expressing an opinion on the effectiveness of the entity’s internal control. An audit also includes evaluating the appropriateness of accounting policies used and the reasonableness of accounting estimates made by the directors, as well as evaluating the overall presentation of the consolidated financial statements.
We believe that the audit evidence we have obtained is sufficient and appropriate to provide a basis for our audit opinion.
OpinionIn our opinion, the consolidated financial statements give a true and fair view of the state of affairs of the Company and of the Group as at December 31, 2013, and of the Group’s profit and cash flows for the year then ended in accordance with Hong Kong Financial Reporting Standards and have been properly prepared in accordance with the Hong Kong Companies Ordinance.
Deloitte Touche TohmatsuCertified Public Accountants
Hong KongMarch 19, 2014
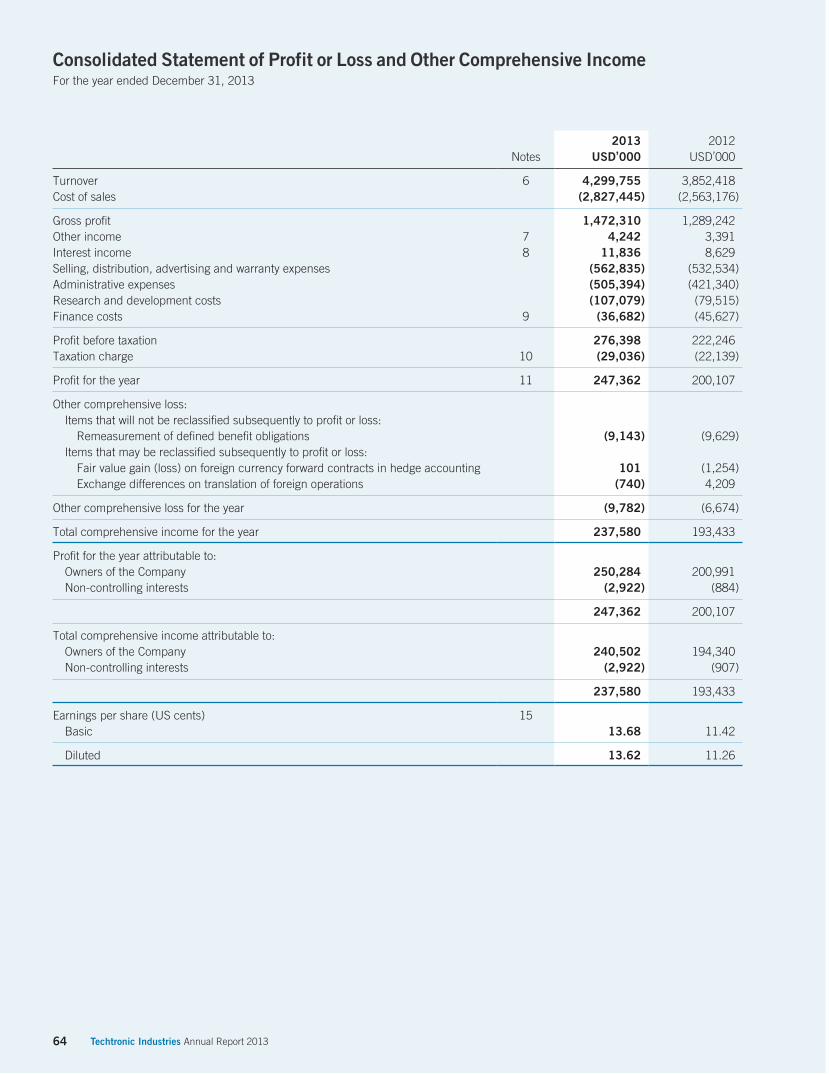
Consolidated Statement of Profit or Loss and Other Comprehensive IncomeFor the year ended December 31, 2013
64 Techtronic Industries Annual Report 2013
2013 2012Notes USD’000 USD’000
Turnover 6 4,299,755 3,852,418Cost of sales (2,827,445) (2,563,176) Gross profit 1,472,310 1,289,242Other income 7 4,242 3,391Interest income 8 11,836 8,629Selling, distribution, advertising and warranty expenses (562,835) (532,534)Administrative expenses (505,394) (421,340)Research and development costs (107,079) (79,515)Finance costs 9 (36,682) (45,627) Profit before taxation 276,398 222,246Taxation charge 10 (29,036) (22,139) Profit for the year 11 247,362 200,107 Other comprehensive loss: Items that will not be reclassified subsequently to profit or loss: Remeasurement of defined benefit obligations (9,143) (9,629) Items that may be reclassified subsequently to profit or loss: Fair value gain (loss) on foreign currency forward contracts in hedge accounting 101 (1,254) Exchange differences on translation of foreign operations (740) 4,209 Other comprehensive loss for the year (9,782) (6,674) Total comprehensive income for the year 237,580 193,433 Profit for the year attributable to: Owners of the Company 250,284 200,991 Non-controlling interests (2,922) (884)
247,362 200,107 Total comprehensive income attributable to: Owners of the Company 240,502 194,340 Non-controlling interests (2,922) (907)
237,580 193,433 Earnings per share (US cents) 15 Basic 13.68 11.42 Diluted 13.62 11.26
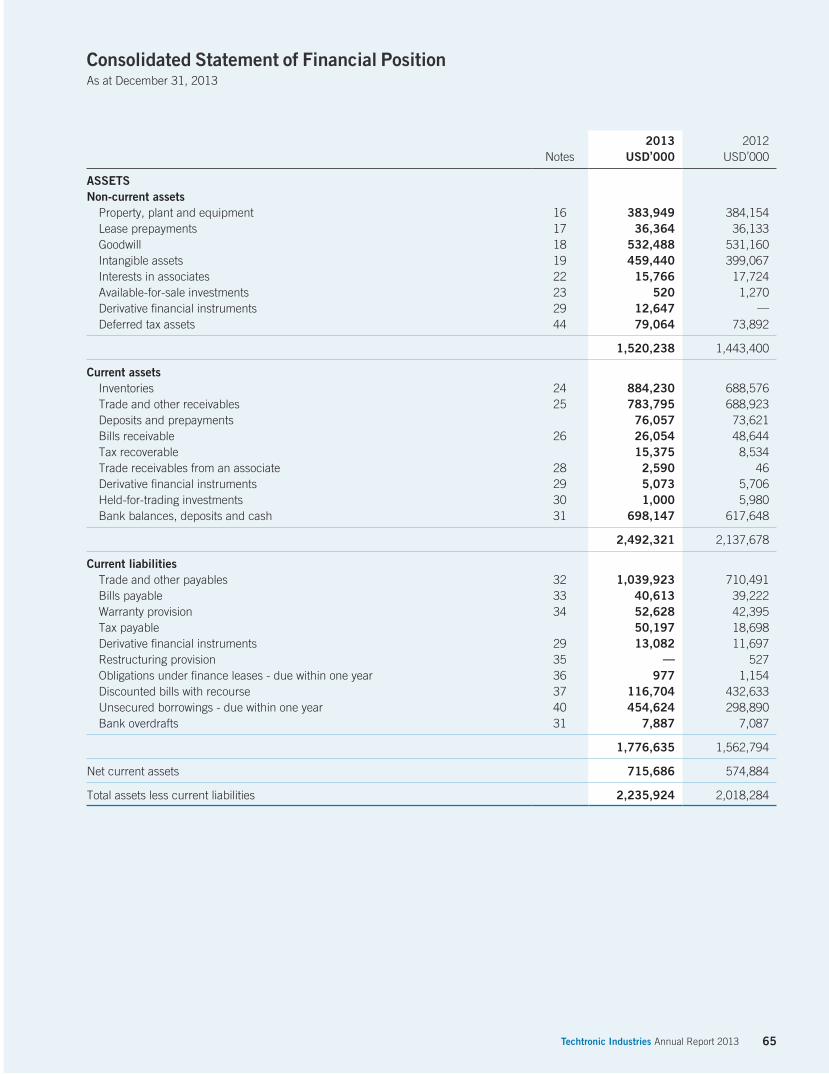
Consolidated Statement of Financial PositionAs at December 31, 2013
65Techtronic Industries Annual Report 2013
2013 2012Notes USD’000 USD’000
ASSETSNon-current assets Property, plant and equipment 16 383,949 384,154 Lease prepayments 17 36,364 36,133 Goodwill 18 532,488 531,160 Intangible assets 19 459,440 399,067 Interests in associates 22 15,766 17,724 Available-for-sale investments 23 520 1,270 Derivative financial instruments 29 12,647 — Deferred tax assets 44 79,064 73,892
1,520,238 1,443,400 Current assets Inventories 24 884,230 688,576 Trade and other receivables 25 783,795 688,923 Deposits and prepayments 76,057 73,621 Bills receivable 26 26,054 48,644 Tax recoverable 15,375 8,534 Trade receivables from an associate 28 2,590 46 Derivative financial instruments 29 5,073 5,706 Held-for-trading investments 30 1,000 5,980 Bank balances, deposits and cash 31 698,147 617,648
2,492,321 2,137,678 Current liabilities Trade and other payables 32 1,039,923 710,491 Bills payable 33 40,613 39,222 Warranty provision 34 52,628 42,395 Tax payable 50,197 18,698 Derivative financial instruments 29 13,082 11,697 Restructuring provision 35 — 527 Obligations under finance leases - due within one year 36 977 1,154 Discounted bills with recourse 37 116,704 432,633 Unsecured borrowings - due within one year 40 454,624 298,890 Bank overdrafts 31 7,887 7,087
1,776,635 1,562,794 Net current assets 715,686 574,884 Total assets less current liabilities 2,235,924 2,018,284
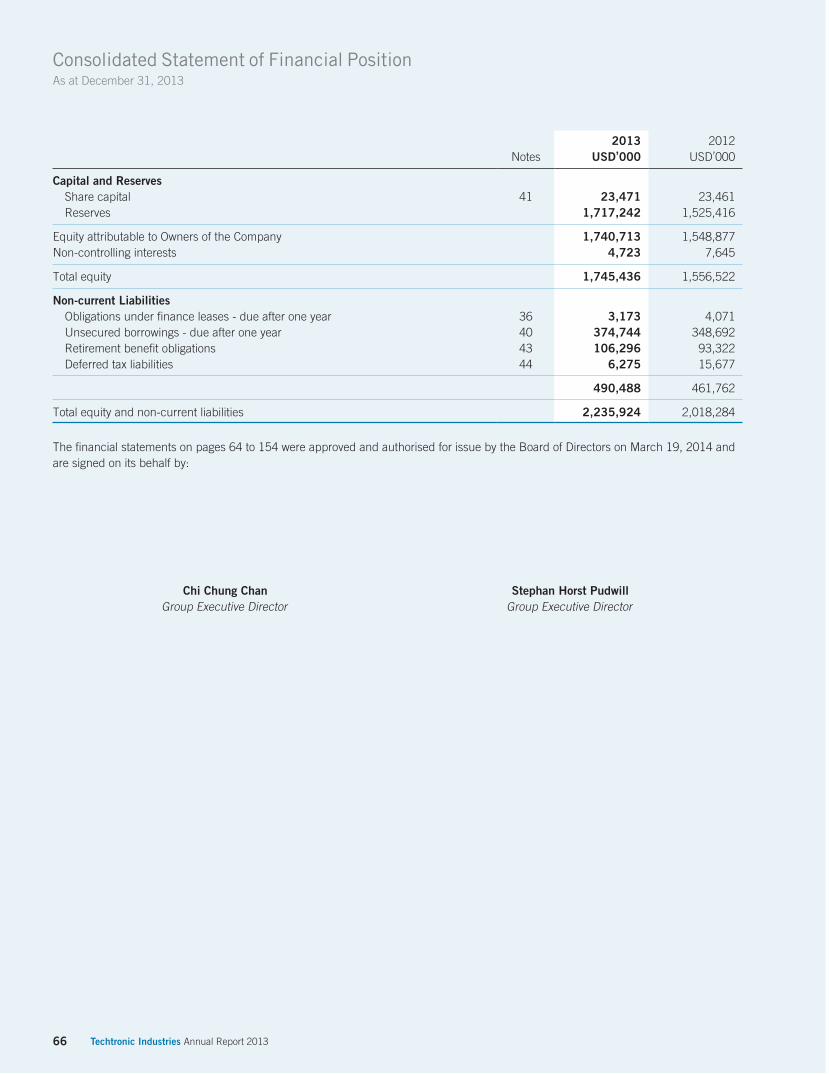
Consolidated Statement of Financial PositionAs at December 31, 2013
66 Techtronic Industries Annual Report 2013
2013 2012Notes USD’000 USD’000
Capital and Reserves Share capital 41 23,471 23,461 Reserves 1,717,242 1,525,416 Equity attributable to Owners of the Company 1,740,713 1,548,877Non-controlling interests 4,723 7,645 Total equity 1,745,436 1,556,522 Non-current Liabilities Obligations under finance leases - due after one year 36 3,173 4,071 Unsecured borrowings - due after one year 40 374,744 348,692 Retirement benefit obligations 43 106,296 93,322 Deferred tax liabilities 44 6,275 15,677
490,488 461,762 Total equity and non-current liabilities 2,235,924 2,018,284
The financial statements on pages 64 to 154 were approved and authorised for issue by the Board of Directors on March 19, 2014 and are signed on its behalf by:
Chi Chung Chan Stephan Horst PudwillGroup Executive Director Group Executive Director

Statement of Financial PositionAs at December 31, 2013
67Techtronic Industries Annual Report 2013
Notes2013
USD’0002012
USD’000
ASSETS
Non-current assets Property, plant and equipment 16 1,431 2,122 Intangible assets 19 — 5,909 Investments in subsidiaries 21 412,256 404,481 Loans to subsidiaries 21 560,129 546,422 Interests in associates 22 14,478 16,436 Available-for-sale investments 23 196 218
988,490 975,588 Current assets Inventories 24 — 573 Other receivables 25 6,207 8,005 Deposits and prepayments 5,385 3,803 Amounts due from subsidiaries 27 1,241,483 961,475 Derivative financial instruments 29 653 49 Held-for-trading investments 30 1,000 5,980 Bank balances, deposits and cash 31 52,462 44,978
1,307,190 1,024,863 Current liabilities Trade and other payables 32 26,403 20,966 Tax payable 2,700 — Derivative financial instruments 29 7,578 5,970 Amounts due to subsidiaries 27 579,524 513,587 Unsecured borrowings - due within one year 40 371,072 118,023
987,277 658,546 Net current assets 319,913 366,317 Total assets less current liabilities 1,308,403 1,341,905 Capital and Reserves Share capital 41 23,471 23,461 Reserves 42 1,005,509 1,064,695
1,028,980 1,088,156 Non-current Liabilities Unsecured borrowings - due after one year 40 279,423 253,749 Total equity and non-current liabilities 1,308,403 1,341,905
Chi Chung Chan Stephan Horst PudwillGroup Executive Director Group Executive Director
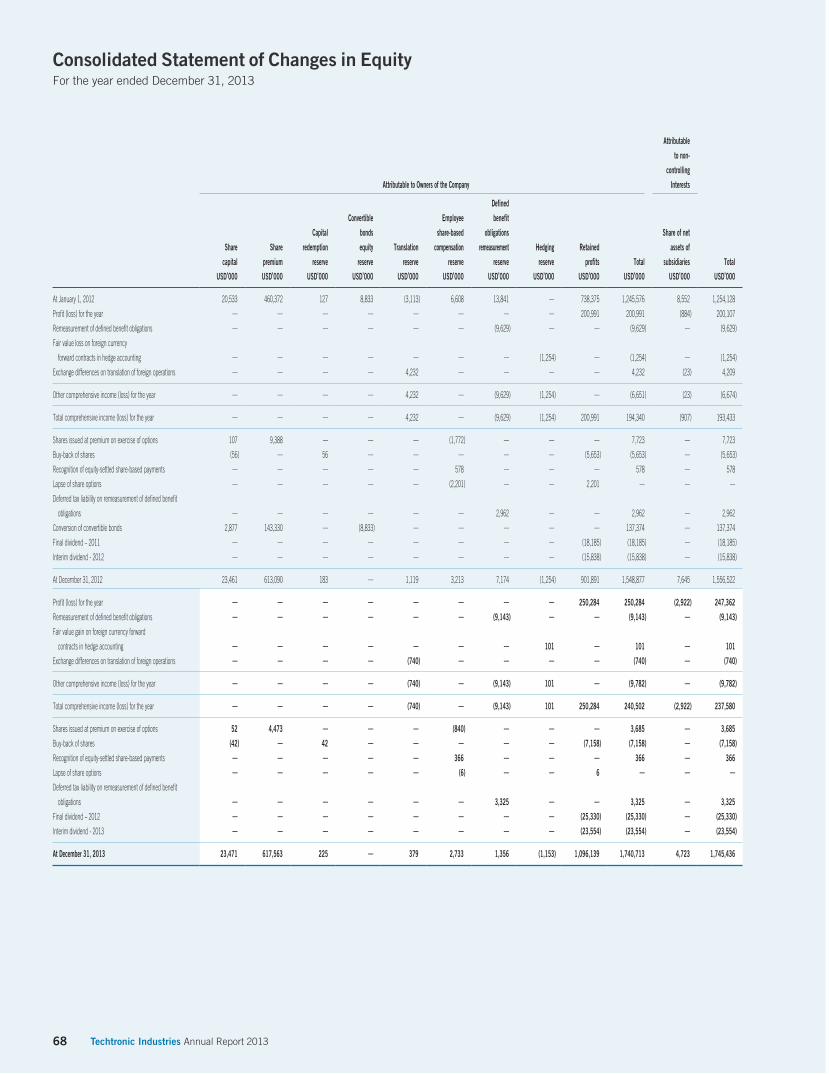
Consolidated Statement of Changes in EquityFor the year ended December 31, 2013
68 Techtronic Industries Annual Report 2013
Attributable
to non-
controlling
Attributable to Owners of the Company Interests
Share
capital
Share
premium
Capital
redemption
reserve
Convertible
bonds
equity
reserve
Translation
reserve
Employee
share-based
compensation
reserve
Defined
benefit
obligations
remeasurement
reserve
Hedging
reserve
Retained
profits Total
Share of net
assets of
subsidiaries Total
USD’000 USD’000 USD’000 USD’000 USD’000 USD’000 USD’000 USD’000 USD’000 USD’000 USD’000 USD’000 At January 1, 2012 20,533 460,372 127 8,833 (3,113) 6,608 13,841 — 738,375 1,245,576 8,552 1,254,128
Profit (loss) for the year — — — — — — — — 200,991 200,991 (884) 200,107
Remeasurement of defined benefit obligations — — — — — — (9,629) — — (9,629) — (9,629)
Fair value loss on foreign currency
forward contracts in hedge accounting — — — — — — — (1,254) — (1,254) — (1,254)
Exchange differences on translation of foreign operations — — — — 4,232 — — — — 4,232 (23) 4,209 Other comprehensive income (loss) for the year — — — — 4,232 — (9,629) (1,254) — (6,651) (23) (6,674) Total comprehensive income (loss) for the year — — — — 4,232 — (9,629) (1,254) 200,991 194,340 (907) 193,433 Shares issued at premium on exercise of options 107 9,388 — — — (1,772) — — — 7,723 — 7,723
Buy-back of shares (56) — 56 — — — — — (5,653) (5,653) — (5,653)
Recognition of equity-settled share-based payments — — — — — 578 — — — 578 — 578
Lapse of share options — — — — — (2,201) — — 2,201 — — —
Deferred tax liability on remeasurement of defined benefit
obligations — — — — — — 2,962 — — 2,962 — 2,962
Conversion of convertible bonds 2,877 143,330 — (8,833) — — — — — 137,374 — 137,374
Final dividend – 2011 — — — — — — — — (18,185) (18,185) — (18,185)
Interim dividend - 2012 — — — — — — — — (15,838) (15,838) — (15,838) At December 31, 2012 23,461 613,090 183 — 1,119 3,213 7,174 (1,254) 901,891 1,548,877 7,645 1,556,522 Profit (loss) for the year — — — — — — — — 250,284 250,284 (2,922) 247,362
Remeasurement of defined benefit obligations — — — — — — (9,143) — — (9,143) — (9,143)
Fair value gain on foreign currency forward
contracts in hedge accounting — — — — — — — 101 — 101 — 101
Exchange differences on translation of foreign operations — — — — (740) — — — — (740) — (740) Other comprehensive income (loss) for the year — — — — (740) — (9,143) 101 — (9,782) — (9,782) Total comprehensive income (loss) for the year — — — — (740) — (9,143) 101 250,284 240,502 (2,922) 237,580 Shares issued at premium on exercise of options 52 4,473 — — — (840) — — — 3,685 — 3,685
Buy-back of shares (42) — 42 — — — — — (7,158) (7,158) — (7,158)
Recognition of equity-settled share-based payments — — — — — 366 — — — 366 — 366
Lapse of share options — — — — — (6) — — 6 — — —
Deferred tax liability on remeasurement of defined benefit
obligations — — — — — — 3,325 — — 3,325 — 3,325
Final dividend – 2012 — — — — — — — — (25,330) (25,330) — (25,330)
Interim dividend - 2013 — — — — — — — — (23,554) (23,554) — (23,554) At December 31, 2013 23,471 617,563 225 — 379 2,733 1,356 (1,153) 1,096,139 1,740,713 4,723 1,745,436
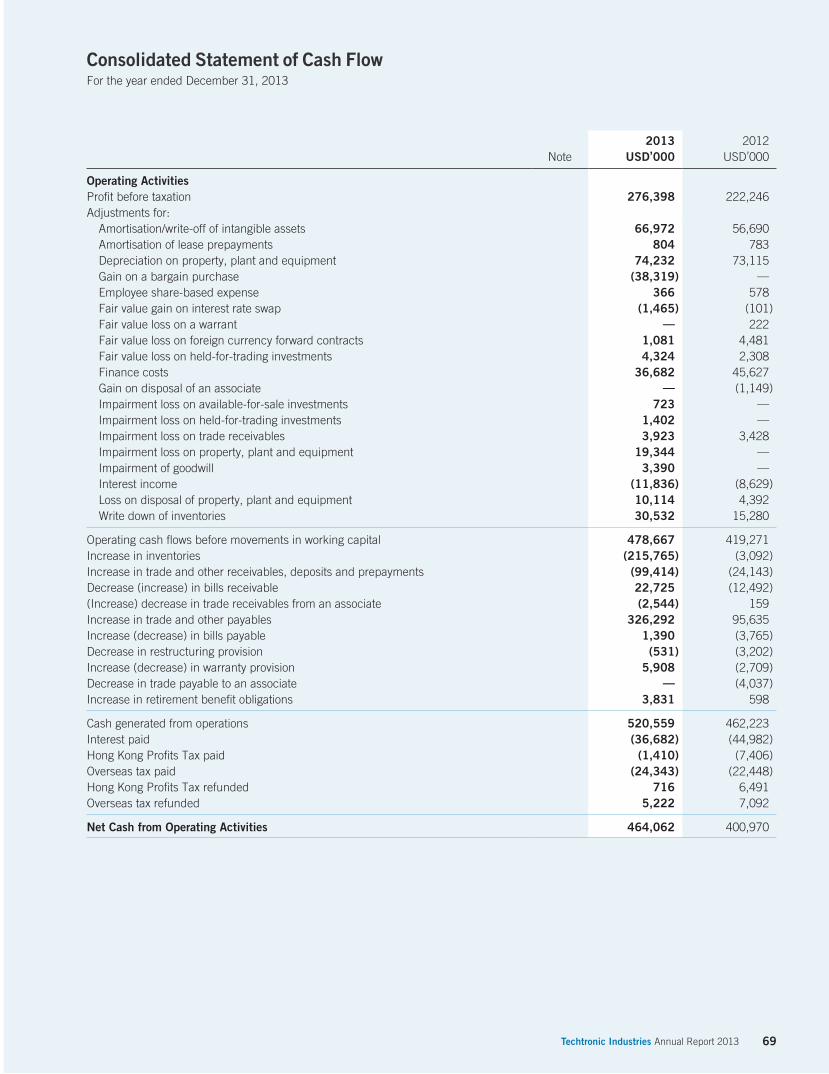
Consolidated Statement of Cash FlowFor the year ended December 31, 2013
69Techtronic Industries Annual Report 2013
Note2013
USD’0002012
USD’000
Operating ActivitiesProfit before taxation 276,398 222,246Adjustments for: Amortisation/write-off of intangible assets 66,972 56,690 Amortisation of lease prepayments 804 783 Depreciation on property, plant and equipment 74,232 73,115 Gain on a bargain purchase (38,319) — Employee share-based expense 366 578 Fair value gain on interest rate swap (1,465) (101) Fair value loss on a warrant — 222 Fair value loss on foreign currency forward contracts 1,081 4,481 Fair value loss on held-for-trading investments 4,324 2,308 Finance costs 36,682 45,627 Gain on disposal of an associate — (1,149) Impairment loss on available-for-sale investments 723 — Impairment loss on held-for-trading investments 1,402 — Impairment loss on trade receivables 3,923 3,428 Impairment loss on property, plant and equipment 19,344 — Impairment of goodwill 3,390 — Interest income (11,836) (8,629) Loss on disposal of property, plant and equipment 10,114 4,392 Write down of inventories 30,532 15,280 Operating cash flows before movements in working capital 478,667 419,271Increase in inventories (215,765) (3,092)Increase in trade and other receivables, deposits and prepayments (99,414) (24,143)Decrease (increase) in bills receivable 22,725 (12,492)(Increase) decrease in trade receivables from an associate (2,544) 159Increase in trade and other payables 326,292 95,635Increase (decrease) in bills payable 1,390 (3,765)Decrease in restructuring provision (531) (3,202)Increase (decrease) in warranty provision 5,908 (2,709)Decrease in trade payable to an associate — (4,037)Increase in retirement benefit obligations 3,831 598 Cash generated from operations 520,559 462,223Interest paid (36,682) (44,982)Hong Kong Profits Tax paid (1,410) (7,406)Overseas tax paid (24,343) (22,448)Hong Kong Profits Tax refunded 716 6,491Overseas tax refunded 5,222 7,092 Net Cash from Operating Activities 464,062 400,970

Consolidated Statement of Cash FlowFor the year ended December 31, 2013
70 Techtronic Industries Annual Report 2013
Note2013
USD’0002012
USD’000
Investing ActivitiesAcquisition of businesses 45 (21,823) —Additions to intangible assets (89,109) (84,482)Increase in held-for-trading investments (1,000) —Interest received 11,836 8,629Proceeds from disposal of an associate — 2,000Proceeds from disposal of held-for-trading investments 253 —Proceeds from disposal of property, plant and equipment 6,386 4,231Purchase of property, plant and equipment (104,615) (102,427)Repayment from associates 1,957 1,635 Net Cash Used in Investing Activities (196,115) (170,414) Financing ActivitiesDecrease in discounted bills with recourse (317,097) (86,211)Decrease in trust receipt loans (1,050) (2,828)Dividends paid (48,884) (34,023)New bank loans obtained 1,111,936 792,931Proceeds from issue of shares 3,685 7,723Repayment of bank loans (890,039) (703,842)Repayment of fixed interest rate notes (39,375) (30,000)Repayment of obligations under finance leases (1,198) (1,773)Buy-back of shares (7,158) (5,653) Net Cash Used in Financing Activities (189,180) (63,676) Net Increase in Cash and Cash Equivalents 78,767 166,880 Cash and Cash Equivalents at Beginning of the Year 610,561 439,678Effect of Foreign Exchange Rate Changes 932 4,003 Cash and Cash Equivalents at End of the Year 690,260 610,561 Analysis of the Balances of Cash and Cash EquivalentsRepresented by: Bank balances, deposits and cash 698,147 617,648 Bank overdrafts (7,887) (7,087)
690,260 610,561
Notes to the Consolidated Financial StatementsFor the year ended December 31, 2013
71Techtronic Industries Annual Report 2013
1. GeneralThe Company is a public limited company incorporated in Hong Kong and its shares are listed on The Stock Exchange of Hong Kong Limited (the “Stock Exchange”). The address of the registered office and principal place of business of the Company is 24/F., CDW Building, 388 Castle Peak Road, Tsuen Wan, N.T., Hong Kong.
The principal activities of the Group are the manufacturing and trading of electrical and electronic products.
The functional currency of the Company is United States dollars.
2. Application of New and Revised Hong Kong Financial Reporting Standards (“HKFRSs”)In the current year, the Group and the Company have applied the following revised and amendments to HKFRSs issued by the Hong Kong Institute of Certified Public Accountants (“HKICPA”):
Amendments to HKFRS Annual Improvements to HKFRSs 2009 – 2011 CycleAmendments to HKFRS 7 Disclosures – Offsetting Financial Assets and Financial LiabilitiesAmendments to HKFRS 10, Consolidated Financial Statements, Joint Arrangements HKFRS 11 and HKFRS 12 and Disclosures of Interests in Other Entities: Transition GuidanceHKFRS 10 Consolidated Financial StatementsHKFRS 11 Joint ArrangementsHKFRS 12 Disclosure of Interests in Other EntitiesHKFRS 13 Fair Value MeasurementHKAS 27 (as revised in 2011) Separate Financial StatementsHKAS 28 (as revised in 2011) Investments in Associates and Joint VenturesAmendments to HKAS 1 Presentation of Items of Other Comprehensive IncomeHK (IFRIC)-Int 20 Stripping Costs in the Production Phase of a Surface Mine
Except as described below, the application of the revised and amendments to HKFRSs in the current year has had no material impact on the Group’s and the Company’s financial performance and positions for the current and prior years and/or on the disclosures set out in these consolidated financial statements. Besides, the Group has early applied HKAS 19 Retirement Benefits in 2012 in advance of its effective date and consistently reported for both years.
HKFRS 13 Fair Value MeasurementThe Group has applied HKFRS 13 for the first time in the current year. HKFRS 13 establishes a single source of guidance for, and disclosures about, fair value measurements. The scope of HKFRS 13 is broad: the fair value measurement requirements of HKFRS 13 apply to both financial instrument items and non-financial instrument items for which other HKFRSs require or permit fair value measurements and disclosures about fair value measurements, except for share-based payment transactions that are within the scope of HKFRS 2 Share-based Payment, leasing transactions that are within the scope of HKAS 17 Leases, and measurements that have some similarities to fair value but are not fair value (e.g. net realisable value for the purposes of measuring inventories or value in use for impairment assessment purposes).
HKFRS 13 defines the fair value of an asset as the price that would be received to sell an asset (or paid to transfer a liability, in the case of determining the fair value of a liability) in an orderly transaction in the principal (or most advantageous) market at the measurement date under current market conditions. Fair value under HKFRS 13 is an exit price regardless of whether that price is directly observable or estimated using another valuation technique. Also, HKFRS 13 includes extensive disclosure requirements.
HKFRS 13 requires prospective application. In accordance with the transition, provisions of HKFRS 13, the Group has not made any new disclosures required by HKFRS 13 for the 2012 comparative period (please see note 39.3 for 2013 disclosures). The application of HKFRS 13 has not had any material impact on the amounts recognised in the consolidated financial statements.
Notes to the Consolidated Financial StatementsFor the year ended December 31, 2013
72 Techtronic Industries Annual Report 2013
2. Application of New and Revised Hong Kong Financial Reporting Standards (“HKFRSs”) (continued)
Amendments to HKAS 1 Presentation of Items of Other Comprehensive IncomeThe Group has applied the amendments to HKAS 1 Presentation of Items of Other Comprehensive Income. Upon the adoption of the amendments to HKAS 1, the Group’s ‘statement of comprehensive income’ is renamed as the ‘statement of profit or loss and other comprehensive income’. Furthermore, the amendments to HKAS 1 require additional disclosures to be made in the other comprehensive income section such that items of other comprehensive income are grouped into two categories: (a) items that will not be reclassified subsequently to profit or loss and (b) items that may be reclassified subsequently to profit or loss when specific conditions are met. Income tax on items of other comprehensive income is required to be allocated on the same basis – the amendments do not change the option to present items of other comprehensive income either before tax or net of tax. The amendments have been applied retrospectively, and hence the presentation of items of other comprehensive income has been modified to reflect the changes.
Other than the above mentioned presentation changes, the application of the amendments to HKAS 1 does not result in any impact on profit or loss, other comprehensive income and total comprehensive income.
New and revised HKFRSs issued but not yet effectiveThe Group have not early applied the following new and revised HKFRSs that have been issued but are not yet effective as at January 1, 2013:
Amendments to HKAS 19 Defined Benefit Plans: Employee Contributions4
Amendments to HKFRSs Annual Improvements to HKFRSs 2010 – 2012 Cycle3
Amendments to HKFRSs Annual Improvements to HKFRSs 2011 – 2013 Cycle4
HKFRS 9 Financial Instrument2
Amendments to HKFRS 9 and HKFRS 7 Mandatory Effective Date of HKFRS 9 and Transition Disclosures2
Amendments to HKFRS 10, Investment Entities1
HKFRS 12 and HKAS 27Amendments to HKFRS 32 Offsetting Financial Assets and Financial Liabilities1
Amendments to HKFRS 36 Recoverable Amount Disclosures for Non-Financial Assets1
Amendments to HKFRS 39 Novation of Derivatives and Contribution of Hedge Accounting1
HK(IFRIC) – Int 21 Levies1
1 Effective for annual periods beginning on or after January 1, 2014.2 Available for application – the mandatory effective date will be determined when the outstanding phase of HKFRS 9 are finalised.3 Effective for annual periods beginning on or after July 1, 2014, with limited exceptions.4 Effective for annual periods beginning on or after July 1, 2014.
73Techtronic Industries Annual Report 2013
2. Application of New and Revised Hong Kong Financial Reporting Standards (“HKFRSs”) (continued)
Annual Improvements to HKFRSs 2010-2012 CycleThe “Annual Improvements to HKFRSs 2010-2012 Cycle” include a number of amendments to various HKFRSs, which are summarised below.
The amendments to HKFRS 2 (i) change the definitions of ‘vesting condition’ and ‘market condition’; and (ii) add definitions for ‘performance condition’ and ‘service condition’ which were previously included within the definition of ‘vesting condition’. The amendments to HKFRS 2 are effective for share-based payment transactions for which the grant date is on or after July 1, 2014.
The amendments to HKFRS 3 clarify that contingent consideration that is classified as an asset or a liability should be measured at fair value at each reporting date, irrespective of whether the contingent consideration is a financial instrument within the scope of HKFRS 9 or HKAS 39 or a non-financial asset or liability. Changes in fair value (other than measurement period adjustments) should be recognised in profit and loss. The amendments to HKFRS 3 are effective for business combinations for which the acquisition date is on or after July 1, 2014.
The amendments to the basis for conclusions of HKFRS 13 clarify that the issue of HKFRS 13 and consequential amendments to HKAS 39 and HKFRS 9 did not remove the ability to measure short-term receivables and payables with no stated interest rate at their invoice amounts without discounting, if the effect of discounting is immaterial.
The amendments to HKAS 16 and HKAS 38 remove perceived inconsistencies in the accounting for accumulated depreciation/amortisation when an item of property, plant and equipment or an intangible asset is revalued. The amended standards clarify that the gross carrying amount is adjusted in a manner consistent with the revaluation of the carrying amount of the asset and that accumulated depreciation/amortisation is the difference between the gross carrying amount and the carrying amount after taking into account accumulated impairment losses.
The amendments to HAKS 24 clarify that a management entity providing key management personnel services to a reporting entity is a related party of the reporting entity. Consequently, the reporting entity should disclose as related party transactions the amounts incurred for the service paid or payable to the management entity for the provision of key management personnel services. However, disclosure of the components of such compensation is not required.
The directors do not anticipate that the application of the amendments included in the “Annual Improvements to HKFRSs 2010-2012 Cycle” will have a material effect on the Group’s consolidated financial statements.
Annual Improvements to HKFRSs 2011-2013 CycleThe “Annual Improvements to HKFRSs 2011-2013 Cycle” include a number of amendments to various HKFRSs, which are summarised below.
The amendments to HKFRS 13 clarify that the scope of the portfolio exception for measuring the fair value of a group of financial assets and financial liabilities on a net basis includes all contracts that are within the scope of, and accounted for in accordance with, HKAS 39 or HKFRS 9, even if those contracts do not meet the definitions of financial assets or financial liabilities within HKAS 32.
The directors do not anticipate that the application of the amendments included in the “Annual Improvements to HKFRSs 2011-2013 Cycle” will have a material effect on the Group’s consolidated financial statements.

Notes to the Consolidated Financial StatementsFor the year ended December 31, 2013
74 Techtronic Industries Annual Report 2013
2. Application of New and Revised Hong Kong Financial Reporting Standards (“HKFRSs”) (continued)
HKFRS 9 Financial InstrumentsHKFRS 9 issued in 2009 introduces new requirements for the classification and measurement of financial assets. HKFRS 9 amended in 2010 includes the requirements for the classification and measurement of financial liabilities and for derecognition, and further amended in 2013 to include the new requirements for hedge accounting.
Key requirements of HKFRS 9 are described as follows:
• With regards to financial assets, HKFRS 9 requires all recognised financial assets that are within the scope of HKAS 39 Financial Instruments: Recognition and Measurement are subsequently measured at amortised cost or fair value. Specifically, debt investments that are held within a business model whose objective is to collect the contractual cash flows, and that have contractual cash flows that are solely payments of principal and interest on the principal outstanding, are generally measured at amortised cost at the end of subsequent accounting periods. All other debt investments and equity investments are measured at their fair values at the end of subsequent reporting periods. In addition, under HKFRS 9, entities may make an irrevocable election to present subsequent changes in the fair value of an equity investment (that is not held for trading) in other comprehensive income, with only dividend income generally recognised in profit or loss. The adoption of HKFRS 9 will require the Group’s and the Company’s available-for-sale investments that are currently measured at cost less impairment to be measured at fair value instead of being measured at cost.
• With regard to the measurement of financial liabilities designated as at fair value through profit or loss, HKFRS 9 requires that the amount of change in the fair value of the financial liability that is attributable to changes in the credit risk of that liability is presented in other comprehensive income, unless the recognition of the effects of changes in the liability’s credit risk in other comprehensive income would create or enlarge an accounting mismatch in profit or loss. Changes in fair value of financial liabilities attributable to changes in the financial liabilities’ credit risk are not subsequently reclassified to profit or loss. Under HKAS 39, the entire amount of the change in the fair value of the financial liability designated as fair value through profit or loss was presented in profit or loss.
The new general hedge accounting requirements retain the three types of hedge accounting. However, greater flexibility has been introduced to the types of transactions eligible for hedge accounting, specifically broadening the types of instruments that qualify for hedging instruments and the types of risk components of non-financial items that are eligible for hedge accounting. In addition, the effectiveness test has been overhauled and replaced with the principle of an ‘economic relationship’. Retrospective assessment of hedge effectiveness is also no longer required. Enhanced disclosure requirements about an entity’s risk management activities have also been introduced.
The directors anticipate that the adoption of HKFRS 9 in the future may have an impact on amounts reported in respect of the Group’s financial assets and financial liabilities. However, it is not practicable to provide a reasonable estimate of that effect until a detailed review has been completed.
Amendments to HKAS 19 Defined Benefit Plans: Employee ContributionsThe amendments to HKAS 19 clarify how an entity should account for contributions made by employees or third parties to defined benefit plans, based on whether those contributions are dependent on the number of years of service provided by the employee.
For contributions that are independent of the number of years of service, the entity may either recognise the contributions as a reduction in the service cost in the period in which the related service is rendered, or to attribute them to the employees’ periods of service using the projected unit credit method; whereas for contributions that are dependent on the number of years of service, the entity is required to attribute them to the employees’ periods of service.
The directors of the Company do not anticipate that the application of these amendments to HKAS 19 will have a significant impact on the Group’s consolidated financial statements.

75Techtronic Industries Annual Report 2013
2. Application of New and Revised Hong Kong Financial Reporting Standards (“HKFRSs”) (continued)
Amendments to HKAS 32 Offsetting Financial Assets and Financial LiabilitiesThe amendments to HKAS 32 clarify existing application issues relating to the offset of financial assets and financial liabilities requirements. Specifically, the amendments clarify the meaning of ‘currently has a legally enforceable right of set-off’ and ‘simultaneous realisation and settlement’.
The directors of the Company do not anticipate that the application of these amendments to HKAS 32 will have a significant impact on the Group’s consolidated financial statements as the Group does not have any material financial assets and financial liabilities that qualify for offset.
Amendments to HKAS 36 Recoverable Amount Disclosures for Non-Financial AssetsThe amendments to HKAS 36 remove the requirement to disclose the recoverable amount of a cash-generating unit (CGU) to which goodwill or other intangible assets with indefinite useful lives had been allocated when there has been no impairment or reversal of impairment of the related CGU. Furthermore, the amendments introduce additional disclosure requirements regarding the fair value hierarchy, key assumptions and valuation techniques used when the recoverable amount of an asset or CGU was determined based on its fair value less costs of disposal.
The directors of the Company do not anticipate that the application of these amendments to HKAS 36 will have a significant impact on the Group’s consolidated financial statements.
Amendments to HKAS 39 Novation of Derivatives and Continuation of Hedge AccountingThe amendments to HKAS 39 provide relief from the requirement to discontinue hedge accounting when a derivative hedging instrument is novated under certain circumstances. The amendments also clarify that any change to the fair value of the derivative hedging instrument arising from the novation should be included in the assessment of hedge effectiveness.
The directors of the Company do not anticipate that the application of these amendments to HKAS 39 will have any material effect on the Group’s consolidated financial statements as the Group does not have any derivatives that are subject to novation.
HK (IFRIC) – Int 21 LeviesHK (IFRIC) – Int 21 Levies addresses the issue of when to recognise a liability to pay a levy. The Interpretation defines a levy, and specifies that the obligating event that gives rise to the liability is the activity that triggers the payment of the levy, as identified by legislation. The Interpretation provides guidance on how different levy arrangements should be accounted for, in particular, it clarifies that neither economic compulsion nor the going concern basis of financial statements preparation implies that an entity has a present obligation to pay a levy that will be triggered by operating in a future period.
The directors of the Company anticipate that the application of HK (IFRIC) – Int 21 will have no effect on the Group’s consolidated financial statements as the Group does not have any material levy arrangements.
Notes to the Consolidated Financial StatementsFor the year ended December 31, 2013
76 Techtronic Industries Annual Report 2013
3. Significant Accounting PoliciesThe consolidated financial statements have been prepared in accordance with HKFRSs issued by the HKICPA. In addition, the consolidated financial statements include applicable disclosures required by the Rules Governing the Listing of Securities on The Stock Exchange of Hong Kong Limited (the “Listing Rules”) and by the Hong Kong Companies Ordinance.
The consolidated financial statements have been prepared on the historical cost basis except for certain financial instruments, which are measured at fair values, as explained in the accounting policies set out below.
Historical cost is generally based on the fair value of the consideration given in exchange for goods.
Fair value is the price that would be received to sell an asset or paid to transfer a liability in an orderly transaction between market participants at the measurement date, regardless of whether that price is directly observable or estimated using another valuation technique. In estimating the fair value of an asset or a liability, the Group takes into account the characteristics of the asset or liability if market participants would take those characteristics into account when pricing the asset or liability at the measurement date. Fair value for measurement and/or disclosure purposes in these consolidated financial statements is determined on such a basis, except for share-based payment transactions that are within the scope of HKFRS 2, leasing transactions that are within the scope of HKAS 17, and measurements that have some similarities to fair value but are not fair value, such as net realisable value in HKAS 2 or value in use in HKAS 36.
In addition, for financial reporting purposes, fair value measurements are categorised into Level 1, 2 or 3 based on the degree to which the inputs to the fair value measurements are observable and the significance of the inputs to the fair value measurement in its entirety, which are described as follows:
• Level 1 inputs are quoted prices (unadjusted) in active markets for identical assets or liabilities that the entity can access at the measurement date;
• Level 2 inputs are inputs, other than quoted prices included within Level 1, that are observable for the asset or liability, either directly or indirectly; and
• Level 3 inputs are unobservable inputs for the asset or liability.
The principal accounting policies are set out below.
Basis of ConsolidationThe consolidated financial statements incorporate the financial statements of the Company and entities controlled by the Company and its subsidiaries. Control is achieved when the Company:
• has the power over the investee;
• is exposed, or has rights, to variable returns from its involvement with the investee; and
• has the ability to use its power to affect its returns.
The Group reassesses whether or not it controls an investee if facts and circumstances indicate that there are changes to one or more of the three elements of control listed above.
Consolidation of a subsidiary begins when the Group obtains control over the subsidiary and ceases when the Group loses control of the subsidiary. Specifically, income and expenses of a subsidiary acquired or disposed of during the year are included in the consolidated statement of profit or loss and other comprehensive income from the date the Group gains control until the date when the Group ceases to control the subsidiary.
Profit or loss and each item of other comprehensive income are attributed to the owners of the Company and to the non-controlling interests. Total comprehensive income of subsidiaries is attributed to the owners of the Company and to the non-controlling interests even if this results in the non-controlling interests having a deficit balance.

77Techtronic Industries Annual Report 2013
3. Significant Accounting Policies (continued)
Basis of Consolidation (continued)
When necessary, adjustments are made to the financial statements of subsidiaries to bring their accounting policies into line with the Group’s accounting policies.
All intragroup assets and liabilities, equity, income, expenses and cash flows relating to transactions between members of the Group are eliminated in full on consolidation.
Allocation of total comprehensive income to non-controlling interestsTotal comprehensive income and expense of subsidiaries is attributed to the owners of the Company and to the non-controlling interests even if this results in the non-controlling interests having a deficit balance (effective from January 1, 2010 onwards).
Changes in the Group’s ownership interests in existing subsidiariesChanges in the Group’s ownership interests in subsidiaries that do not result in the Group losing control over the subsidiaries are accounted for as equity transactions. The carrying amounts of the Group’s interests and the non-controlling interests are adjusted to reflect the changes in their relative interests in the subsidiaries. Any difference between the amount by which the non-controlling interests are adjusted and the fair value of the consideration paid or received is recognised directly in equity and attributed to owners of the Company.
When the Group loses control of a subsidiary, a gain or loss is recognised in profit or loss and is calculated as the difference between (i) the aggregate of the fair value of the consideration received and the fair value of any retained interest and (ii) the previous carrying amount of the assets (including goodwill), and liabilities of the subsidiary and any non-controlling interests. All amounts previously recognised in other comprehensive income in relation to that subsidiary are accounted for as if the Group had directly disposed of the related assets or liabilities of the subsidiary (i.e. reclassified to profit or loss or transferred to another category of equity as specified/permitted by applicable HKFRSs). The fair value of any investment retained in the former subsidiary at the date when control is lost is regarded as the fair value on initial recognition for subsequent accounting under HKAS 39, when applicable, the cost on initial recognition of an investment in an associate or a joint venture.
Business CombinationsAcquisitions of businesses are accounted for using the acquisition method. The consideration transferred in a business combination is measured at fair value, which is calculated as the sum of the acquisition-date fair values of the assets transferred by the Group, liabilities incurred by the Group to the former owners of the acquiree and the equity interests issued by the Group in exchange for control of the acquiree. Acquisition-related costs are generally recognised in profit or loss as incurred.
At the acquisition date, the identifiable assets acquired and the liabilities assumed are recognised at their fair value at the acquisition date, except that:
• deferred tax assets or liabilities and liabilities or assets related to employee benefit arrangements are recognised and measured in accordance with HKAS 12 “Income Taxes” and HKAS 19 “Employee Benefits” respectively;
• liabilities or equity instruments related to share-based payment arrangements of the acquiree or share-based payment arrangements of the Group entered into to replace share-based payment arrangements of the acquiree are measured in accordance with HKFRS 2 “Share-based Payment” at the acquisition date (see the accounting policy below); and
• assets (or disposal groups) that are classified as held for sale in accordance with HKFRS 5 “Non-current Assets Held for Sale and Discontinued Operations” are measured in accordance with that standard.
Notes to the Consolidated Financial StatementsFor the year ended December 31, 2013
78 Techtronic Industries Annual Report 2013
3. Significant Accounting Policies (continued)
Business Combinations (continued)
Goodwill is measured as the excess of the sum of the consideration transferred, the amount of any non-controlling interests in the acquiree, and the fair value of the acquirer’s previously held equity interest in the acquiree (if any) over the net of the acquisition-date amounts of the identifiable assets acquired and the liabilities assumed. If, after re-assessment, the net of the acquisition-date amounts of the identifiable assets acquired and liabilities assumed exceeds the sum of the consideration transferred, the amount of any non-controlling interests in the acquiree and the fair value of the acquirer’s previously held interest in the acquiree (if any), the excess is recognised immediately in profit or loss as a bargain purchase gain.
Non-controlling interests that are present ownership interests and entitle their holders to a proportionate share of the entity’s net assets in the event of liquidation may be initially measured either at fair value or at the non-controlling interests’ proportionate share of the recognised amounts of the acquiree’s identifiable net assets. The choice of measurement basis is made on a transaction-by-transaction basis. Other types of non-controlling interests are measured at their fair value or, when applicable, on the basis specified in another standard.
Where the consideration transferred by the Group in a business combination includes assets or liabilities resulting from a contingent consideration arrangement, the contingent consideration is measured at its acquisition-date fair value and considered as part of the consideration transferred in a business combination. Changes in the fair value of the contingent consideration that qualify as measurement period adjustments are adjusted retrospectively, with the corresponding adjustments made against goodwill. Measurement period adjustments are adjustments that arise from additional information obtained during the “measurement period” (which cannot exceed one year from the acquisition date) about facts and circumstances that existed at the acquisition date.
The subsequent accounting for changes in the fair value of the contingent consideration that do not qualify as measurement period adjustments depends on how the contingent consideration is classified. Contingent consideration that is classified as equity is not remeasured at subsequent reporting dates and its subsequent settlement is accounted for within equity. Contingent consideration that is classified as an asset or a liability is remeasured at subsequent reporting dates in accordance with HKAS 39, or HKAS 37 Provisions, Contingent Liabilities and Contingent Assets, as appropriate, with the corresponding gain or loss being recognised in profit or loss.
GoodwillGoodwill arising on an acquisition of a business is carried at cost less any accumulated impairment losses, if any, and is presented separately in the consolidated statement of financial position.
For the purposes of impairment testing, goodwill is allocated to each of the Group’s cash generating units (or groups of cash generating units) that is expected to benefit from the synergies of the combination.
A cash generating unit to which goodwill has been allocated is tested for impairment annually, or more frequently whenever there is indication that the unit may be impaired. For goodwill arising on an acquisition in a reporting period, the cash generating unit to which goodwill has been allocated is tested for impairment before the end of that reporting period.
If the recoverable amount of the cash generating unit is less than the carrying amount of the cash generating unit, the impairment loss is allocated first to reduce the carrying amount of any goodwill allocated to the unit and then to the other assets of the unit pro rata on the basis of the carrying amount of each asset in the unit. Any impairment loss for goodwill is recognised directly in profit or loss in the consolidated statement of comprehensive income. An impairment loss recognised for goodwill is not reversed in subsequent periods.
On disposal of the relevant cash generating unit, the attributable amount of goodwill is included in the determination of the amount of profit or loss on disposal.

79Techtronic Industries Annual Report 2013
3. Significant Accounting Policies (continued)
Investments in SubsidiariesInvestments in subsidiaries are included in the Company’s statement of financial position at cost less any identified impairment losses. The results of subsidiaries are accounted for by the Company on the basis of dividends received and receivable.
Interests in AssociatesAn associate is an entity over which the Group has significant influence. Significant influence is the power to participate in the financial and operating policy decisions of the investee but is not control or joint control over those policies.
The results and assets and liabilities of associates are incorporated in these consolidated financial statements using the equity method of accounting. Under the equity method, investments in associates are initially recognised in the consolidated statement of financial position at cost and adjusted thereafter to recognise the Group’s share of profit or loss and other comprehensive income of the associates. When the Group’s share of profit or loss of an associate exceeds the Group’s interest in that associate (which includes any long-term interests that, in substance, form part of the Group’s net investment in the associate), the Group discontinues recognising its share of further losses. Additional losses are recognised only to the extent that the Group has incurred legal or constructive obligations or made payments on behalf of that associate.
An investment in an associate is accounted for using the equity method from the date on which the investee becomes an associate. On acquisition of the investment in an associate, any excess of the cost of the investment over the Group’s share of the net fair value of the identifiable assets and liabilities of the investee is recognised as goodwill, which is included within the carrying amount of the investment. Any excess of the Group’s share of the net fair value of the identifiable assets and liabilities over the cost of the investment, after reassessment, is recognised immediately in profit or loss in the period in which the investment is acquired.
The requirements of HKAS 39 are applied to determine whether it is necessary to recognise any impairment loss with respect to the Group’s investment in an associate or a joint venture. When necessary, the entire carrying amount of the investment (including goodwill) is tested for impairment in accordance with HKAS 36 Impairment of Assets as a single asset by comparing its recoverable amount (higher of value in use and fair value less costs of disposal) with its carrying amount. Any impairment loss recognised forms part of the carrying amount of the investment. Any reversal of that impairment loss is recognised in accordance with HKAS 36 to the extent that the recoverable amount of the investment subsequently increases.
The Group discontinues the use of the equity method from the date when the investment ceases to be an associate, or when the investment (or a portion thereof) is classified as held for sale. When the Group retains an interest in the former associate and the retained interest is a financial asset, the Group measures the retained interest at fair value at that date and the fair value is regarded as its fair value on initial recognition in accordance with HKAS 39. The difference between the carrying amount of the associate at the date the equity method was discontinued, and the fair value of any retained interest and any proceeds from disposing of a part interest in the associate is included in the determination of the gain or loss on disposal of the associate. In addition, the Group accounts for all amounts previously recognised in other comprehensive income in relation to that associate on the same basis as would be required if that associate had directly disposed of the related assets or liabilities. Therefore, if a gain or loss previously recognised in other comprehensive income by that associate would be reclassified to profit or loss on the disposal of the related assets or liabilities, the Group reclassifies the gain or loss from equity to profit or loss (as a reclassification adjustment) when the equity method is discontinued.
When the Group reduces its ownership interest in an associate but the Group continues to use the equity method, the Group reclassifies to profit or loss the proportion of the gain or loss that had previously been recognised in other comprehensive income relating to that reduction in ownership interest if that gain or loss would be reclassified to profit or loss on the disposal of the related assets or liabilities.
When a group entity transacts with an associate of the Group (such as a sale or contribution of assets), profits and losses resulting from the transactions with the associate are recognised in the Group’s consolidated financial statements only to the extent of interests in the associate that are not related to the Group.
Notes to the Consolidated Financial StatementsFor the year ended December 31, 2013
80 Techtronic Industries Annual Report 2013
3. Significant Accounting Policies (continued)
Intangible Assets
Intangible assets acquired separatelyIntangible assets acquired separately and with finite useful lives are carried at cost less accumulated amortisation and any accumulated impairment losses. Amortisation of intangible assets with finite useful lives is provided on a straight-line basis over their estimated useful lives. The estimated useful life and amortisation method are reviewed at the end of each reporting period, with the effect of any changes in estimate being accounted for on a prospective basis. Alternatively, intangible assets with indefinite useful lives that are acquired separately are carried at cost less any subsequent accumulated impairment losses (see the accounting policy in respect of impairment losses on tangible and intangible assets below).
An intangible asset is derecognised on disposal, or when no future economic benefits are expected from use or disposal. Gains or losses arising from derecognition of an intangible asset are measured at the difference between the net disposal proceeds and the carrying amount of the asset and are recognised in profit or loss in the period when the asset is derecognised.
Intangible assets acquired in a business combinationIntangible assets acquired in a business combination are recognised separately from goodwill and are initially measured at their fair value at the acquisition date. The cost of such intangible assets is their fair value at the acquisition date.
Subsequent to initial recognition, intangible assets with finite useful lives are carried at cost less accumulated amortisation and any accumulated impairment losses. Amortisation of intangible assets with finite useful lives is provided on a straight-line basis over their estimated useful lives.
Alternatively, intangible assets with indefinite useful lives are carried at cost less any subsequent accumulated impairment losses (see the accounting policy in respect of impairment losses on tangible and intangible assets below).
Research and Development ExpenditureExpenditure on research activities is recognised as an expense in the period in which it is incurred.
An internally-generated intangible asset arising from development (or from the development phase of an internal project) is recognised only if all of the following have been demonstrated:
• the technical feasibility of completing the intangible asset so that it will be available for use or sale;
• the intention to complete the intangible asset and use or sell it;
• the ability to use or sell the intangible asset;
• how the intangible asset will generate probable future economic benefits;
• the availability of adequate technical, financial and other resources to complete the development and to use or sell the intangible asset; and
• the ability to measure reliably the expenditure attributable to the intangible asset during its development.
The amount initially recognised for an internally-generated intangible asset is the sum of the expenditure incurred from the date when the intangible asset first meets the recognition criteria. Where no internally generated intangible asset can be recognised, development expenditure is charged to profit or loss in the period in which it is incurred.
Subsequent to initial recognition, an internally-generated intangible asset is measured at cost less accumulated amortisation and accumulated impairment losses, on the same basis as intangible assets acquired separately.
81Techtronic Industries Annual Report 2013
3. Significant Accounting Policies (continued)
LeasingLeases are classified as finance leases whenever the terms of the lease transfer substantially all the risks and rewards of ownership to the lessee. All other leases are classified as operating leases.
The Group and the Company as lesseeAssets held under finance leases are recognised as assets of the Group and the Company at their fair value at the inception of the lease or, if lower, at the present value of the minimum lease payments. The corresponding liability to the lessor is included in the consolidation statement of financial position as a finance lease obligation.
Lease payments are apportioned between finance charges and a reduction of the lease obligation so as to achieve a constant rate of interest on the remaining balance of the liability. Finance expenses are recognised immediately in profit or loss, unless they are directly attributable to qualifying assets, in which case they are capitalised in accordance with the Group’s policy on borrowing costs (see the accounting policy below).
Operating lease payments are recognised as an expense on a straight-line basis over the term of the relevant lease.
In the event that lease incentives are received to enter into operating leases, such incentives are recognised as a liability. The aggregate benefits of incentives are recognised as a reduction of rental expense over the lease term on a straight-line basis.
Leasehold land and buildingWhen a lease includes both land and building elements, the Group and the Company assess the classification of each element as a finance or an operating lease separately based on the assessment as to whether substantially all the risks and rewards incidental to ownership of each element have been transferred to the Group or the Company, unless it is clear that both elements are operating leases in which case the entire lease is classified as an operating lease. Specifically, the minimum lease payments (including any lump-sum upfront payments) are allocated between the land and the building elements in proportion to the relative fair values of the leasehold interests in the land element and building element of the lease at the inception of the lease.
To the extent the allocation of the lease payments can be made reliably, interest in leasehold land that is accounted for as an operating lease is presented as “lease payments” in the consolidated statement of financial position and is amortised over the lease term on a straight-line basis. When the lease payments cannot be allocated reliably between the land and building elements, the entire lease is generally classified as a finance lease and accounted for as property, plant and equipment, unless it is clear that both elements are operating leases, in which case the entire lease is classified as an operating lease.
Property, Plant and EquipmentProperty, plant and equipment including buildings held for use in the production or supply of goods or services, or for administrative purposes, other than construction in progress, are stated in the consolidated statement of financial position at cost less subsequent accumulated depreciation and accumulated impairment losses.
Depreciation is provided to write off the cost of items of property, plant and equipment, other than freehold land and construction in progress, over their estimated useful lives and after taking into account of their estimated residual value, using the straight-line method. The estimated useful lives, residual values and defined depreciation method are reviewed at the end of each reporting period with the effect of any changes in estimate accounted for on a prospective basis.
Construction in progress includes property, plant and equipment in the course of construction for production or for its own use purposes. Construction in progress is carried at cost, less any recognised impairment loss. Cost includes professional fees capitalised in accordance with the Group’s accounting policy. Construction in progress is classified to the appropriate category of property, plant and equipment when completed and ready for its intended use. Depreciation of these assets, on the same basis as other property, plant and equipment, commences when the assets are ready for their intended use.

Notes to the Consolidated Financial StatementsFor the year ended December 31, 2013
82 Techtronic Industries Annual Report 2013
3. Significant Accounting Policies (continued)
Property, Plant and Equipment (continued)
Assets held under finance leases are depreciated over their expected useful lives on the same basis as owned assets or, where shorter, the term of the relevant lease. However, when there is no reasonable certainty that ownership will be obtained by the end of the lease term, assets are depreciated over the shorter of the lease term and their useful lives.
An item of property, plant and equipment is derecognised upon disposal or when no future economic benefits are expected to arise from the continued use of the asset. Any gain or loss arising on derecognition of the asset (calculated as the difference between the net disposal proceeds and the carrying amount of the item) is included in profit or loss in the period in which the item is derecognised.
Impairment Losses on tangible and intangible assets other than goodwill (see the accounting policy in respect of goodwill above)At the end of the reporting period, the Group and the Company review the carrying amounts of its assets to determine whether there is any indication that those assets have suffered an impairment loss. If any such indication exists, the recoverable amount of the asset is estimated in order to determine the extent of the impairment loss, if any. When it is not possible to estimate the recoverable amount of an individual asset, the Group estimates the recoverable amount of the cash generating unit to which the asset belongs. Where a reasonable and consistent basis of allocation can be identified, corporate assets are also allocated to individual cash generating units, or otherwise they are allocated to the smallest group of cash generating units for which a reasonable and consistent allocation basis can be identified.
Intangible assets with indefinite useful lives and intangible assets not yet available for use are tested for impairment at least annually, and whenever there is an indication that they may be impaired.
The recoverable amount is the higher of fair value less costs to sell and value in use. In assessing value in use, the estimated future cash flows are discounted to their present value using a pre-tax discount rate that reflects current market assessments of the time value of money and the risks specific to the asset for which the estimates of future cash flows have not been adjusted.
If the recoverable amount of an asset (or a cash generating unit) is estimated to be less than its carrying amount, the carrying amount of the asset (or a cash generating unit) is reduced to its recoverable amount. An impairment loss is recognised immediately in profit or loss.
Where an impairment loss subsequently reverses, the carrying amount of the asset or a cash generating unit is increased to the revised estimate of its recoverable amount, but so that the increased carrying amount does not exceed the carrying amount that would have been determined had no impairment loss been recognised for the asset or a cash generating unit in prior years. A reversal of an impairment loss is recognised as income immediately.
Financial InstrumentsFinancial assets and financial liabilities are recognised in the consolidated statement of financial position when a group entity becomes a party to the contractual provisions of the instrument.
Financial assets and financial liabilities are initially measured at fair value. Transaction costs that are directly attributable to the acquisition or issue of financial assets and financial liabilities (other than financial assets and financial liabilities at fair value through profit or loss) are added to or deducted from the fair value of the financial assets or financial liabilities, as appropriate, on initial recognition. Transaction costs directly attributable to the acquisition of financial assets or financial liabilities at fair value through profit or loss are recognised immediately in profit or loss.
83Techtronic Industries Annual Report 2013
3. Significant Accounting Policies (continued)
Financial Instruments (continued)
Financial AssetsThe Group’s and the Company’s financial assets are classified into one of the three categories, including financial assets at fair value through profit or loss (“FVTPL”), loans and receivables and available-for-sale financial assets. The classification depends on the nature and purpose of the financial assets and is determined at the time of initial recognition. All regular way purchases or sales of financial assets are recognised and derecognised on a trade date basis. Regular way purchases or sales are purchases or sales of financial assets that require delivery of assets within the time frame established by regulation or convention in the marketplace.
Effective interest methodThe effective interest method is a method of calculating the amortised cost of a financial asset and of allocating interest income over the relevant period. The effective interest rate is the rate that exactly discounts estimated future cash receipts (including all fees paid or received that form an integral part of the effective interest rate, transaction costs and other premiums or discounts) through the expected life of the financial asset, or, where appropriate, a shorter period to the net carrying amount on initial recognition.
Interest income is recognised on an effective interest basis for debt instruments other than those financial assets classified as at FVTPL, of which interest income is included in net gains or losses.
Financial assets at fair value through profit or lossFinancial assets at FVTPL include financial assets held for trading.
A financial asset is classified as held for trading if:
• it has been acquired principally for the purpose of selling in the near future; or
• it is a part of an identified portfolio of financial instruments that the Group manages together and has a recent actual pattern of short-term profit-taking; or
• it is a derivative that is not designated and effective as a hedging instrument.
Financial assets at FVTPL are measured at fair value, with changes in fair value arising from remeasurement recognised directly in profit or loss in the period in which they arise. The net gain or loss recognised in profit or loss includes any dividend or interest earned on the financial assets.
Loans and receivablesLoans and receivables are non-derivative financial assets with fixed or determinable payments that are not quoted in an active market. Subsequent to initial recognition, loans and receivables (including trade and other receivables, amounts due from associates, bills receivable, trade receivables from an associate, loans to subsidiaries, amounts due from subsidiaries and bank balances, deposits and cash) are carried at amortised cost using the effective interest method, less any identified impairment losses (see accounting policy in respect of impairment of financial assets below).
Notes to the Consolidated Financial StatementsFor the year ended December 31, 2013
84 Techtronic Industries Annual Report 2013
3. Significant Accounting Policies (continued)
Financial Instruments (continued)
Financial Assets (continued)
Available-for-sale financial assetsAvailable-for-sale financial assets are non-derivatives that are either designated or not classified as financial assets at FVTPL, loans and receivables or held-to-maturity investments.
For available-for-sale equity investments that do not have a quoted market price in an active market and whose fair value cannot be reliably measured, they are measured at cost less any identified impairment losses at the end of each reporting period (see accounting policy in respect of impairment of financial assets below).
Impairment of financial assetsFinancial assets, other than those at FVTPL, are assessed for indicators of impairment at the end of each reporting period. Financial assets are impaired where there is objective evidence that, as a result of one or more events that occurred after the initial recognition of the financial asset, the estimated future cash flows of the financial assets have been affected.
For all other financial assets, objective evidence of impairment could include:
• significant financial difficulty of the issuer or counterparty; or
• default or delinquency in interest or principal payments; or
• it becoming probable that the borrower will enter bankruptcy or financial re-organisation.
For certain categories of financial asset, such as trade receivables and trade receivables from an associate, assets that are assessed not to be impaired individually are, in addition, subsequently assessed for impairment on a collective basis. Objective evidence of impairment for a portfolio of receivables could include the Group’s and the Company’s past experience of collecting payments, an increase in the number of delayed payments in the portfolio past the average credit period of 30 to 120 days, or observable changes in national or local economic conditions that correlate with default on receivables.
For financial assets carried at amortised cost, the amount of the impairment loss recognised is the difference between the asset’s carrying amount and the present value of the estimated future cash flows discounted at the financial asset’s original effective interest rate.
For financial assets carried at cost, the amount of the impairment loss is measured as the difference between the asset’s carrying amount and the present value of the estimated future cash flows discounted at the current market rate of return for a similar financial asset. Such impairment loss will not be reversed in subsequent periods.
The carrying amount of the financial asset is reduced by the impairment loss directly for all financial assets with the exception of trade receivables and trade receivables from an associate, where the carrying amount is reduced through the use of an allowance account. Changes in the carrying amount of the allowance account are recognised in profit or loss. When a trade receivable is considered uncollectible, it is written off against the allowance account. Subsequent recoveries of amounts previously written off are credited to profit or loss.
When an available-for-sale financial asset is considered to be impaired, cumulative gains or losses previously recognised in other comprehensive income are reclassified to profit or loss in the period in which the impairment takes place.
85Techtronic Industries Annual Report 2013
3. Significant Accounting Policies (continued)
Financial Instruments (continued)
Financial Assets (continued)
Impairment of financial assets (continued)For financial assets measured at amortised cost, if, in a subsequent period, the amount of an impairment loss decreases and the decrease can be related objectively to an event occurring after the impairment loss was recognised, the previously recognised impairment loss is reversed through profit or loss to the extent that the carrying amount of the asset at the date the impairment is reversed does not exceed what the amortised cost would have been had the impairment not been recognised.
Impairment losses on available-for-sale equity investments will not be reversed through profit or loss in subsequent periods. Any increase in fair value subsequent to impairment loss is recognised directly in other comprehensive income.
Financial liabilities and equityFinancial liabilities and equity instruments issued by a group entity are classified either as financial liabilities or as equity in accordance with the substance of the contractual arrangements entered into and the definitions of a financial liability and an equity instrument.
Equity instrumentAn equity instrument is any contract that evidences a residual interest in the assets of the Group and the Company after deducting all of its liabilities. Equity instruments issued by the Group and the Company are recognised at the proceeds received, net of direct issue costs.
Buy-back of the Company’s own equity instruments is recognised and deducted directly in equity. No gain or loss is recognised in profit or loss on the purchase, sale, issue or cancellation of the Company’s own equity instruments.
Effective interest methodThe effective interest method is a method of calculating the amortised cost of a financial liability and of allocating interest expense over the relevant period. The effective interest rate is the rate that exactly discounts estimated future cash payments (including all fees and points paid or received that form an integral part of the effective interest rate, transaction costs and other premiums or discounts) through the expected life of the financial liability, or, where appropriate, a shorter period, to the net carrying amount on initial recognition.
Interest expense is recognised on an effective interest basis.
Other financial liabilitiesOther financial liabilities (including unsecured borrowings, trade and other payables, bills payable, discounted bills with recourse, bank overdrafts and amounts due to subsidiaries) are subsequently measured at amortised cost, using the effective interest method.
Derivative financial instruments and hedgingDerivatives are initially recognised at fair value at the date when a derivative contract is entered into and are subsequently remeasured to their fair value at the end of the reporting period. The resulting gain or loss is recognised in profit or loss immediately unless the derivative is designated and effective as a hedging instrument, in which event the timing of the recognition in profit or loss depends on the nature of the hedge relationship.
Notes to the Consolidated Financial StatementsFor the year ended December 31, 2013
86 Techtronic Industries Annual Report 2013
3. Significant Accounting Policies (continued)
Financial Instruments (continued)
Hedge accountingThe Group designates certain derivatives as hedges of highly probable forecast transactions for foreign currency exposure (cash flow hedges).
At the inception of the hedging relationship the Group documents the relationship between the hedging instrument and the hedged item, along with its risk management objectives and its strategy for undertaking various hedge transactions. Furthermore, at the inception of the hedge and on an ongoing basis, the Group documents whether the hedging instrument that is used in a hedging relationship is highly effective in offsetting changes in fair values or cash flows of the hedged item.
Cash flow hedgesThe effective portion of changes in the fair value of derivatives that are designated and qualify as cash flow hedges are recognised in other comprehensive income and accumulated in hedging reserve. The gain or loss relating to the ineffective portion is recognised immediately in profit or loss.
Financial guarantee contractsA financial guarantee contract is a contract that requires the issuer to make specified payments to reimburse the holder for a loss it incurs because a specified debtor fails to make payment when due in accordance with the original or modified terms of a debt instrument. A financial guarantee contract issued by the Group and the Company and not designated as at fair value through profit or loss is recognised initially at its fair value less transaction costs that are directly attributable to the issue of the financial guarantee contract. Subsequent to initial recognition, the Group measures the financial guarantee contract at the higher of: (i) the amount of obligation under the contract, as determined in accordance with HKAS 37 Provisions, Contingent Liabilities and Contingent Assets; and (ii) the amount initially recognised less, when appropriate, cumulative amortisation recognised in accordance with the revenue recognition policy.
DerecognitionThe Group and the Company derecognise a financial asset only when the contractual rights to the cash flows from the asset expire, or when it transfers the financial asset and substantially all the risks and rewards of ownership of the asset to another entity. If the Group and the Company neither transfer nor retain substantially all the risks and rewards of ownership and continues to control the transferred asset, the Group and the Company continue to recognise the asset to the extent of its continuing involvement and recognises an associated liability. If the Group and the Company retain substantially all the risks and rewards of ownership of a transferred financial asset, the Group and the Company continue to recognise the financial asset and also recognises a collateralised borrowing for the proceeds received.
On derecognition of a financial asset in its entirety, the difference between the asset’s carrying amount and the sum of the consideration received and receivable and the cumulative gain or loss that had been recognised in other comprehensive income and accumulated in equity is recognised in profit or loss.
On derecognition of a financial asset other than in its entirety, the Group allocates the previous carrying amount of the financial asset between the part it continues to recognise, and the part it no longer recognises on the basis of the relative fair values of those parts on the date of the transfer. The difference between the carrying amount allocated to the part that is no longer recognised and the sum of the consideration received for the part no longer recognised and any cumulative gain or loss allocated to it that had been recognised in other comprehensive income is recognised in profit or loss. A cumulative gain or loss that had been recognised in other comprehensive income is allocated between the part that continues to be recognised and the part that is no longer recognised on the basis of the relative fair values of those parts.
Financial liabilities are derecognised when the obligation specified in the relevant contract is discharged, cancelled or expires. The difference between the carrying amount of the financial liability derecognised and the consideration paid is recognised in profit or loss.

87Techtronic Industries Annual Report 2013
3. Significant Accounting Policies (continued)
ProvisionsProvisions are recognised when the Group and the Company have a present obligation as a result of a past event and it is probable that the Group and the Company will be required to settle that obligation, and a reliable estimate can be made of the amount of the obligation. Provisions are measured at the best estimate of the consideration required to settle the present obligation at the end of the reporting period, taking into account the risks and uncertainties surrounding the obligation. Where a provision is measured using the cash flows estimated to settle the present obligation, its carrying amount is the present value of those cash flows (where the effect of the time value of money is material).
A provision for warranties is recognised at the time the products are sold based on the estimated cost using historical data for the level of repairs and replacements.
A provision for restructuring is recognised in the consolidated statement of financial position on condition that the Group has a detailed formal plan and has raised a valid expectation to those affected that the plan will be carried out, either by starting to implement that plan or by announcing its main features to those affected.
For a provision in relation to employee termination benefits, the liability and expenses are recognised when the Group committed to terminate the employment of an employee or group of employees before their normal retirement date or provide termination benefits as a result of an offer made to encourage voluntary redundancy.
InventoriesInventories are stated at the lower of cost and net realisable value. Cost of inventories is calculated using the first-in, first-out method. Net realisable value represents the estimated selling price for inventories less all estimated costs of completion and costs necessary to make the sales.
Revenue RecognitionTurnover is measured at the fair value of the consideration received or receivable and represents amounts receivable for goods sold by the Group and the Company to outside customers in the normal course of business, less returns and allowances, and commission income and royalty income received.
Turnover from sales of goods is recognised when goods are delivered and title has passed.
Commission income is recognised when services are provided.
Royalty income is recognised on a time proportion basis in accordance with the terms of the relevant agreements.
Interest income from a financial asset is recognised when it is probable that the economic benefits will flow to the Group and the amount of income can be measured reliably. Interest income is accrued on a time basis, by reference to the principal outstanding and at the effective interest rate applicable, which is the rate that discounts the estimated future cash receipts through the expected life of the financial asset to that asset’s net carrying amount on initial recognition.
Dividend income from investments is recognised when the shareholders’ right to receive payment have been established.

Notes to the Consolidated Financial StatementsFor the year ended December 31, 2013
88 Techtronic Industries Annual Report 2013
3. Significant Accounting Policies (continued)
TaxationIncome tax expense represents the sum of the tax currently payable and deferred tax.
The tax currently payable is based on taxable profit for the year. Taxable profit differs from profit before taxation as reported in the consolidated statement of profit or loss and other comprehensive income because it excludes items of income or expense that are taxable or deductible in other years and it further excludes items that are never taxable or deductible. The Group’s and the Company’s liability for current tax is calculated using tax rates that have been enacted or substantively enacted by the end of the reporting period.
Deferred tax is recognised on temporary differences between the carrying amounts of assets and liabilities in the consolidated financial statements and the corresponding tax bases used in the computation of taxable profit. Deferred tax liabilities are generally recognised for all taxable temporary differences. Deferred tax assets are generally recognised for all deductible temporary differences to the extent that it is probable that taxable profits will be available against which deductible temporary differences can be utilised. Such assets and liabilities are not recognised if the temporary difference arises from initial recognition of goodwill or from the initial recognition (other than in a business combination) of other assets and liabilities in a transaction that affects neither the taxable profit nor the accounting profit.
Deferred tax liabilities are recognised for taxable temporary differences associated with investments in subsidiaries and associates, except where the Group is able to control the reversal of the temporary difference and it is probable that the temporary difference will not reverse in the foreseeable future. Deferred tax assets arising from deductible temporary differences associated with such investments and interests are only recognised to the extent that it is probable that there will be sufficient taxable profits against which to utilise the benefits of the temporary differences and they are expected to reverse in the foreseeable future.
The carrying amount of deferred tax assets is reviewed at the end of the reporting period and reduced to the extent that it is no longer probable that sufficient taxable profit will be available to allow all or part of the asset to be recovered.
Deferred tax assets and liabilities are measured at the tax rates that are expected to apply in the period in which the liability is settled or the asset is realised, based on tax rates (and tax laws) that have been enacted or substantively enacted by the end of the reporting period.
The measurement of deferred tax liabilities and assets reflects the tax consequences that would follow from the manner in which the Group and the Company expect, at the end of the reporting period, to recover or settle the carrying amount of its assets and liabilities. Deferred tax is recognised in profit or loss, except when it relates to items that are recognised in other comprehensive income or directly in equity, in which case the deferred tax is also recognised in other comprehensive income or directly in equity respectively.
Current and deferred tax is recognised in profit or loss, except when it relates to items that are recognised in other comprehensive income or directly in equity, in which case, the current and deferred tax are also recognised in other comprehensive income or directly in equity respectively. Where current tax or deferred tax arises from the initial accounting for a business combination, the tax effect is included in the accounting for the business combination.
89Techtronic Industries Annual Report 2013
3. Significant Accounting Policies (continued)
Foreign CurrenciesIn preparing the financial statements of each individual group entity, transactions in currencies other than the functional currency of that entity (foreign currencies) are recorded in its respective functional currency (i.e. the currency of the primary economic environment in which the entity operates) at the rates of exchange prevailing on the dates of the transactions. At the end of each reporting period, monetary items denominated in foreign currencies are retranslated at the exchange rates at that date. Non-monetary items that are measured in terms of historical cost in a foreign currency are not retranslated.
Exchange differences arising on the settlement of monetary items, and on the retranslation of monetary items, are recognised in profit or loss in the period in which they arise, except for exchange differences arising on a monetary item that form part of the Company’s net investment in a foreign operation, in which case, such exchange differences are recognised in other comprehensive income and accumulated in equity and will be reclassified from equity to profit or loss on disposal of the foreign operation.
For the purposes of presenting the consolidated financial statements, the assets and liabilities of the Group’s foreign operations are translated into the presentation currency of the Group (i.e. United States dollars) at the rate of exchange prevailing at the end of each reporting period, and their income and expenses are translated at the average exchange rates for the year. Exchange differences arising, if any, are recognised in other comprehensive income and accumulated in equity under the heading of translation reserve (attributed to non-controlling interests as appropriate).
On the disposal of a foreign operation (i.e. a disposal of the Group’s entire interest in a foreign operation, or a disposal involving loss of control over a subsidiary that includes a foreign operation, or a disposal involving loss of significant influence over an associate that includes a foreign operation), all of the exchange differences accumulated in equity in respect of that operation attributable to the owners of the Company are reclassified to profit or loss. In addition, in relation to a partial disposal of a subsidiary that does not result in the Group losing control over the subsidiary, the proportionate share of accumulated exchange differences are reattributed to non-controlling interests and are not recognised in profit or loss. For all other partial disposals (i.e. partial disposals of associates that do not result in the Group losing significant influence), the proportionate share of the accumulated exchange differences is reclassified to profit or loss.
Goodwill and fair value adjustments on identifiable assets acquired arising on an acquisition of a foreign operation on or after January 1, 2005 are treated as assets and liabilities of that foreign operation and retranslated at the rate of exchange prevailing at the end of the reporting date. Exchange differences arising are recognised in the translation reserve.
Goodwill and fair value adjustments on identifiable assets acquired arising on acquisitions of foreign operations before January 1, 2005 are treated as non-monetary foreign currency items of the acquirer and reported using the historical exchange rate prevailing at the date of the acquisition.
Borrowing CostsBorrowing costs directly attributable to the acquisition, construction or production of qualifying assets, which are assets that necessarily take a substantial period of time to get ready for their intended use or sale, are added to the cost of those assets until such time as the assets are substantially ready for their intended use or sale. Investment income earned on the temporary investment of specific borrowings pending their expenditure on qualifying assets is deducted from the borrowing costs eligible for capitalisation.
All other borrowing costs are recognised in profit or loss in the period in which they are incurred.

Notes to the Consolidated Financial StatementsFor the year ended December 31, 2013
90 Techtronic Industries Annual Report 2013
3. Significant Accounting Policies (continued)
Equity-Settled Share-Based Payment TransactionsThe fair value of services received determined by reference to the fair value of share options granted at the grant date is expensed on a straight-line basis over the vesting period, with a corresponding increase in equity (employee share-based compensation reserve).
At the end of each reporting period, the Group and the Company revise its estimates of the number of options that are expected to ultimately vest. The impact of the revision of the original estimates during the vesting period, such that the cumulative expenses reflecting the revised estimate, is recognised in profit or loss, with a corresponding adjustment to employee share-based compensation reserve.
At the time when the share options are exercised, the amount previously recognised in employee share-based compensation reserve will be transferred to share premium. When the share options are forfeited or are still not exercised at the expiry date, the amount previously recognised in the employee share-based compensation reserve will be transferred to retained profits.
Retirement Benefit SchemesPayments to defined contribution retirement benefit schemes and the Mandatory Provident Fund Scheme are charged as expenses when employees have rendered service entitling them to the contributions.
For defined benefit retirement benefits plans, the cost of providing benefits is determined using the projected unit credit method, with actuarial valuations being carried out at the end of each annual reporting period. Remeasurement, comprising actuarial gains and losses, the effect of the changes to the asset ceiling (if applicable) and the return on plan assets (excluding interest), is reflected immediately in the statement of financial position with a charge or credit recognised in other comprehensive income in the period in which they occur. Remeasurement recognised in other comprehensive income is reflected immediately in retained earnings and will not be reclassified to profit or loss. Past service cost is recognised in profit or loss in the period of a plan amendment. Net interest is calculated by applying the discount rate at the beginning of the period to the net defined benefit liability or asset. Defined benefit costs are categorised as follows:
• service cost (including current service cost, past service cost, as well as gains and losses on curtailments and settlements);
• net interest expense or income; and
• remeasurement.
The retirement benefit obligations recognised in the consolidated statement of financial position represents the actual deficit or surplus in the Group’s defined benefit plans. Any surplus resulting from this calculation is limited to the present value of any economic benefits available in the form of refunds from the plan or reductions in future contributions to the plan.
Government grantsGovernment grants are not recognised until there is reasonable assurance that the Group will comply with the conditions attaching to them and that the grants will be received. Government grants are recognised in profit or loss on a systematic basis over the periods in which the Group recognised as expenses the related costs for which the grants are intended to compensate.
91Techtronic Industries Annual Report 2013
4. Key Sources of Accounting EstimatesIn the application of the Group’s and the Company’s accounting policies, which are described in Note 3, the directors of the Company are required to make judgements, estimates and assumptions about the carrying amounts of assets and liabilities that are not readily apparent from other sources. The estimates and associated assumptions are based on historical experience and other factors that are considered to be relevant. Actual results may differ from these estimates.
The estimates and underlying assumptions are reviewed on an ongoing basis. Revisions to accounting estimates are recognised in the period in which the estimate is revised if the revision affects only that period, or in the period of the revision and future periods if the revision affects both current and future periods.
Key Sources of Estimation UncertaintyThe following are key assumptions concerning the future and other key sources of estimation uncertainty at the end of the reporting period that have a significant risk of causing a material adjustment to the carrying amounts of assets and liabilities within the next financial year.
Estimated Impairment of Goodwill and Intangible Assets with Indefinite Useful LivesDetermining whether goodwill and intangible assets with indefinite useful lives are impaired requires an estimation of the value in use of the cash generating units to which goodwill and intangible assets with indefinite useful lives have been allocated. The value in use calculation requires the Group to estimate the future cash flows expected to arise from the cash generating unit and a suitable discount rate in order to calculate the present value. As at December 31, 2013, the carrying amount of goodwill and intangible assets with indefinite useful lives are approximately USD532,488,000 (2012: USD531,160,000) and approximately USD213,934,000 (2012: USD177,555,000) respectively. Details of the recoverable amount calculation are disclosed in Note 20.
Useful Lives and Estimated Impairment of Deferred Development CostsAs at December 31, 2013, the carrying amount of deferred development costs of the Group and the Company is USD207,977,000 (2012: USD182,571,000) and Nil (2012: USD5,909,000) respectively. The estimation of their useful lives impacts the level of annual amortisation recorded. The estimation of their useful lives reflects the directors’ best estimate of the periods that future economic benefits will be received through the use of the assets. In determining whether the deferred development costs are impaired, the management takes into consideration the anticipated revenues and estimated future cash flows from the underlying projects, and the progress of these projects. When the actual revenues and future cash flows are less than expected, a material loss may arise. Management is confident that the carrying amount of the assets will be recovered in full. This situation will be closely monitored, and adjustments will be made in future periods, if future market activity indicates that such adjustments are appropriate.
Useful Lives and Impairment Assessment of Property, Plant and EquipmentProperty, plant and equipment are stated at cost less accumulated depreciation and identified impairment losses. As at December 31, 2013, the Group’s and the Company’s carrying amount of property, plant and equipment are USD383,949,000 (2012: USD384,154,000) and USD1,431,000 (2012: USD2,122,000) respectively. The estimation of their useful lives impacts the level of annual depreciation expense recorded. The estimated useful life that the Group and the Company place the equipment into production reflects the directors’ estimate of the periods that the Group and the Company intend to derive future economic benefits from the use of the Group’s and the Company’s property, plant and equipment. Property, plant and equipment are evaluated for possible impairment on a specific asset basis or in groups of similar assets, as applicable. This process requires management’s estimate of future cash flows generated by each asset or group of assets. For any instance where this evaluation process indicates impairment, the appropriate assets’ carrying values are written down to the recoverable amount and the amount of the write-down is charged against the results of operations.
Notes to the Consolidated Financial StatementsFor the year ended December 31, 2013
92 Techtronic Industries Annual Report 2013
4. Key Sources of Accounting Estimates (continued)
Income TaxesAs at December 31, 2013, a deferred tax asset of approximately USD39,747,000 (2012: USD53,704,000) in relation to unused tax losses and approximately USD32,860,000 (2012: USD25,242,000) in relation to employee related provisions has been recognised in the Group’s consolidated statement of financial position. The realisability of the deferred tax asset mainly depends on whether sufficient taxable profits, or taxable temporary differences, will be available in the future. In cases where the actual future taxable profits generated are less than expected, a material reversal of the deferred tax assets may arise, which would be recognised in profit or loss for the period in which such a reversal takes place. During the year, deferred tax assets of approximately USD7,913,000 (2012: USD10,109,000) in relation to unused tax losses were utilised.
Estimated Impairment of Trade and Other Receivables, Bills Receivable and Trade Receivables from an AssociateWhen there is objective evidence of an impairment loss, the Group and the Company take into consideration the estimation of future cash flows. The amount of the impairment loss is measured as the difference between the asset’s carrying amount and the present value of estimated future cash flows (excluding future credit losses that have not been incurred) discounted at the financial asset’s original effective interest rate (i.e. the effective interest rate computed at initial recognition). When the actual future cash flows are less than expected, a material impairment loss may arise. As at December 31, 2013, the Group’s and the Company’s carrying amount of trade and other receivables, bills receivable and trade receivables/amounts due from associates is USD828,205,000 (net of allowance for doubtful debts of USD18,168,000) (2012: USD755,337,000 (net of allowance for doubtful debts of USD13,987,000)) and USD20,685,000 (net of allowance for doubtful debts of nil) (2012: USD24,441,000 (net of allowance for doubtful debts of nil)).

93Techtronic Industries Annual Report 2013
5. Segment InformationInformation reported to the executive directors of the Company, being the chief operating decision makers, for the purposes of resources allocation and assessment of segment performance focuses on the types of goods sold.
The principal categories of goods supplied are “Power Equipment” and “Floor Care and Appliances”. The Group’s operating segments under HKFRS 8 are as follows:
1. Power Equipment – sales of power tools, power tool accessories, outdoor products, and outdoor product accessories for consumer, trade, professional and industrial users. The products are available under the MILWAUKEE® , AEG®, RYOBI® and HOMELITE® brands plus original equipment manufacturer (“OEM”) customers.
2. Floor Care and Appliances – sales of floor care products and floor care accessories under the HOOVER®, DIRT DEVIL®, VAX® brand and ORECK® plus OEM customers.
Information regarding the above segments is reported below.
Segment turnover and resultsThe following is an analysis of the Group’s turnover and results by reportable and operating segments for the year under review:
For the year ended December 31, 2013
PowerEquipment
Floor Careand
Appliances Eliminations ConsolidatedUSD’000 USD’000 USD’000 USD’000
Segment turnover External sales 3,143,915 1,155,840 — 4,299,755 Inter-segment sales — 2,384 (2,384) — Total segment turnover 3,143,915 1,158,224 (2,384) 4,299,755
Inter-segment sales are charged at prevailing market rates. Result Segment results before finance costs 261,340 51,740 — 313,080 Finance costs (36,682) Profit before taxation 276,398 Taxation charge (29,036) Profit for the year 247,362
The accounting policies of the operating segments are the same as the Group’s accounting policies described in Note 3. Segment profit represents the profit earned by each segment without allocation of finance costs. This is the measure reported to the executive directors of the Company for the purpose of resources allocation and performance assessment.
No analysis of the Group’s assets and liabilities by operating segment is disclosed as they are not regularly provided to the chief operating decision makers for review.
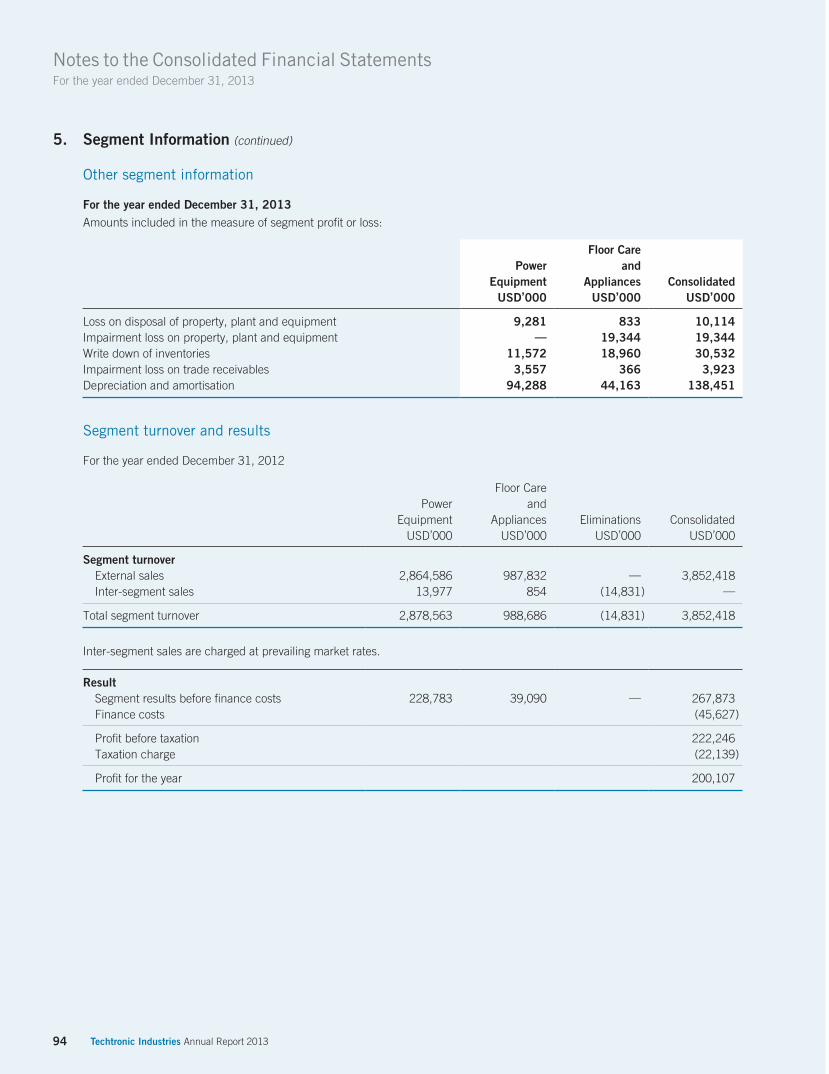
94 Techtronic Industries Annual Report 2013
Notes to the Consolidated Financial StatementsFor the year ended December 31, 2013
5. Segment Information (continued)
Other segment information
For the year ended December 31, 2013Amounts included in the measure of segment profit or loss:
PowerEquipment
Floor Careand
Appliances ConsolidatedUSD’000 USD’000 USD’000
Loss on disposal of property, plant and equipment 9,281 833 10,114Impairment loss on property, plant and equipment — 19,344 19,344Write down of inventories 11,572 18,960 30,532Impairment loss on trade receivables 3,557 366 3,923Depreciation and amortisation 94,288 44,163 138,451
Segment turnover and results
For the year ended December 31, 2012
PowerEquipment
Floor Careand
Appliances Eliminations ConsolidatedUSD’000 USD’000 USD’000 USD’000
Segment turnover External sales 2,864,586 987,832 — 3,852,418 Inter-segment sales 13,977 854 (14,831) — Total segment turnover 2,878,563 988,686 (14,831) 3,852,418
Inter-segment sales are charged at prevailing market rates. Result Segment results before finance costs 228,783 39,090 — 267,873 Finance costs (45,627) Profit before taxation 222,246 Taxation charge (22,139) Profit for the year 200,107

95Techtronic Industries Annual Report 2013
5. Segment Information (continued)
Other segment information
For the year ended December 31, 2012
Amounts included in the measure of segment profit or loss:
PowerEquipment
Floor Careand
Appliances ConsolidatedUSD’000 USD’000 USD’000
Loss on disposal of property, plant and equipment 3,428 964 4,392Write down of inventories 12,354 2,926 15,280Impairment loss on trade receivables 1,773 1,655 3,428Depreciation and amortisation 89,971 39,115 129,086
Turnover from major productsThe following is an analysis of the Group’s turnover from its major products:
2013 2012USD’000 USD’000
Power Equipment 3,143,915 2,864,586Floor Care and Appliances 1,155,840 987,832 Total 4,299,755 3,852,418
Geographical informationThe Group’s turnover from external customers by geographical location, determined based on the location of the customer and information about its non-current assets by geographical location, determined based on the location of the group entity owning the assets are detailed below:
Turnover fromexternal customers Non-Current Assets*
2013 2012 2013 2012USD’000 USD’000 USD’000 USD’000
North America 3,120,251 2,806,909 805,065 775,165Europe 870,119 767,967 93,726 87,962Other countries 309,385 277,542 513,450 487,387 Total 4,299,755 3,852,418 1,412,241 1,350,514
* Non-current assets exclude financial instruments, deferred tax assets and interests in associates.
Information about major customerDuring the years ended December 31, 2013 and 2012, the Group’s largest customer contributed total turnover of USD1,622,819,000 (2012: USD1,459,450,000), of which USD1,568,856,000 (2012: USD1,425,259,000) was under the Power Equipment segment and USD53,963,000 (2012: USD34,191,000) was under the Floor Care and Appliances segment. There is no other customer contributing more than 10% of total turnover.
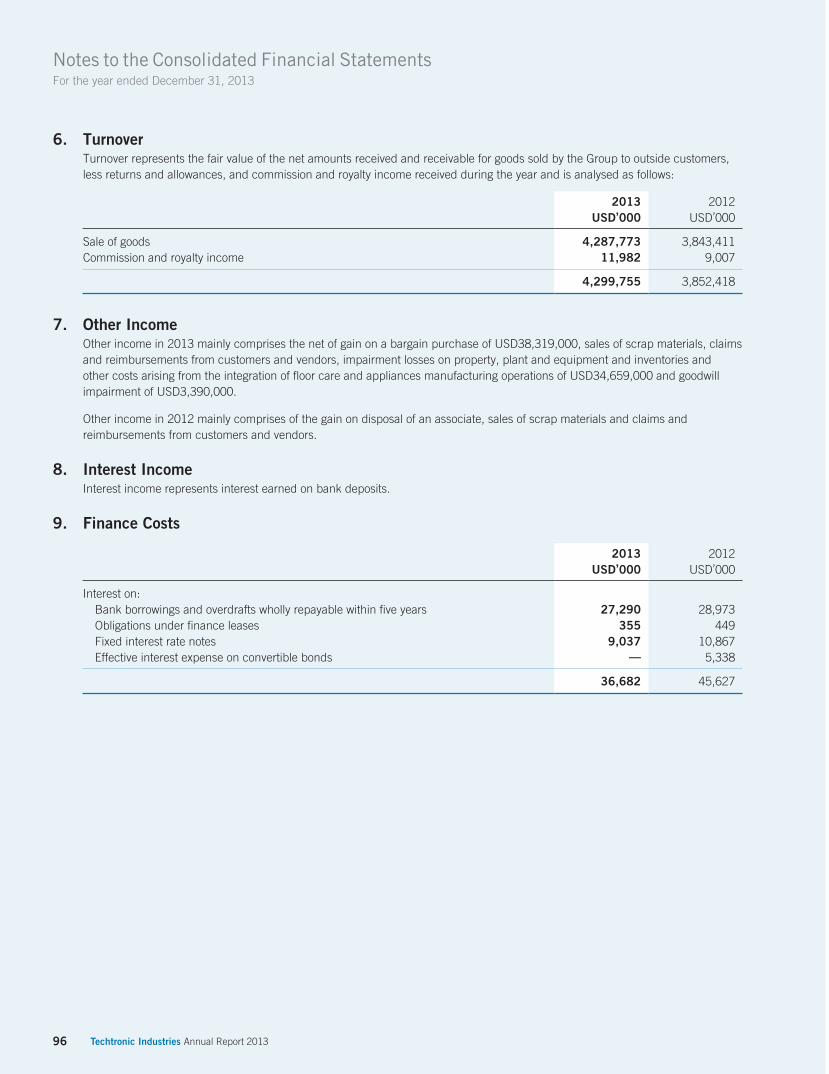
96 Techtronic Industries Annual Report 2013
Notes to the Consolidated Financial StatementsFor the year ended December 31, 2013
6. TurnoverTurnover represents the fair value of the net amounts received and receivable for goods sold by the Group to outside customers, less returns and allowances, and commission and royalty income received during the year and is analysed as follows:
2013 2012USD’000 USD’000
Sale of goods 4,287,773 3,843,411Commission and royalty income 11,982 9,007
4,299,755 3,852,418
7. Other IncomeOther income in 2013 mainly comprises the net of gain on a bargain purchase of USD38,319,000, sales of scrap materials, claims and reimbursements from customers and vendors, impairment losses on property, plant and equipment and inventories and other costs arising from the integration of floor care and appliances manufacturing operations of USD34,659,000 and goodwill impairment of USD3,390,000.
Other income in 2012 mainly comprises of the gain on disposal of an associate, sales of scrap materials and claims and reimbursements from customers and vendors.
8. Interest IncomeInterest income represents interest earned on bank deposits.
9. Finance Costs
2013 2012USD’000 USD’000
Interest on: Bank borrowings and overdrafts wholly repayable within five years 27,290 28,973 Obligations under finance leases 355 449 Fixed interest rate notes 9,037 10,867 Effective interest expense on convertible bonds — 5,338
36,682 45,627

97Techtronic Industries Annual Report 2013
10. Taxation Charge
2013 2012USD’000 USD’000
Current tax: Hong Kong profits tax (909) (440) Underprovision in prior years (3,403) (305)
(4,312) (745) Overseas taxation (16,057) (14,059) Underprovision in prior years (23,512) (13,117)
(39,569) (27,176) Deferred tax (Note 44): Current year 14,845 5,782
(29,036) (22,139)
Hong Kong Profits Tax is calculated at 16.5% of the estimated assessable profit for both years.
Taxation arising in other jurisdictions is calculated at the rates prevailing in the relevant jurisdictions.
Underprovision of income tax in prior periods includes provisions for estimated tax exposures in respect of ongoing tax audits. Given the tax provided, no provision for additional income tax, if any, arising from the ongoing tax audits has been recognised as such amounts cannot be reliably estimated at this stage.
The tax charges for the year are reconciled as follows:
2013 2013 2012 2012USD’000 % USD’000 %
Profit before taxation 276,398 222,246 Tax at Hong Kong Profits Tax rate (45,606) 16.5% (36,671) 16.5%Effect of different tax rates of subsidiaries operating in other jurisdictions 48,259 (17.5%) 36,564 (16.4%)Tax effect of expenses not deductible for tax purposes (7,114) 2.6% (5,474) 2.5%Tax effect of income not taxable for tax purposes 13,846 (5.0%) 7,994 (3.6%)Tax effect of tax losses and deductible temporary differences not recognised (9,099) 3.3% (9,781) 4.4%Underprovision in respect of prior years (26,915) 9.7% (13,422) 6.0%Others (2,407) 0.9% (1,349) 0.6% Tax charge for the year (29,036) 10.5% (22,139) 10.0%
Details of deferred tax are set out in Note 44.
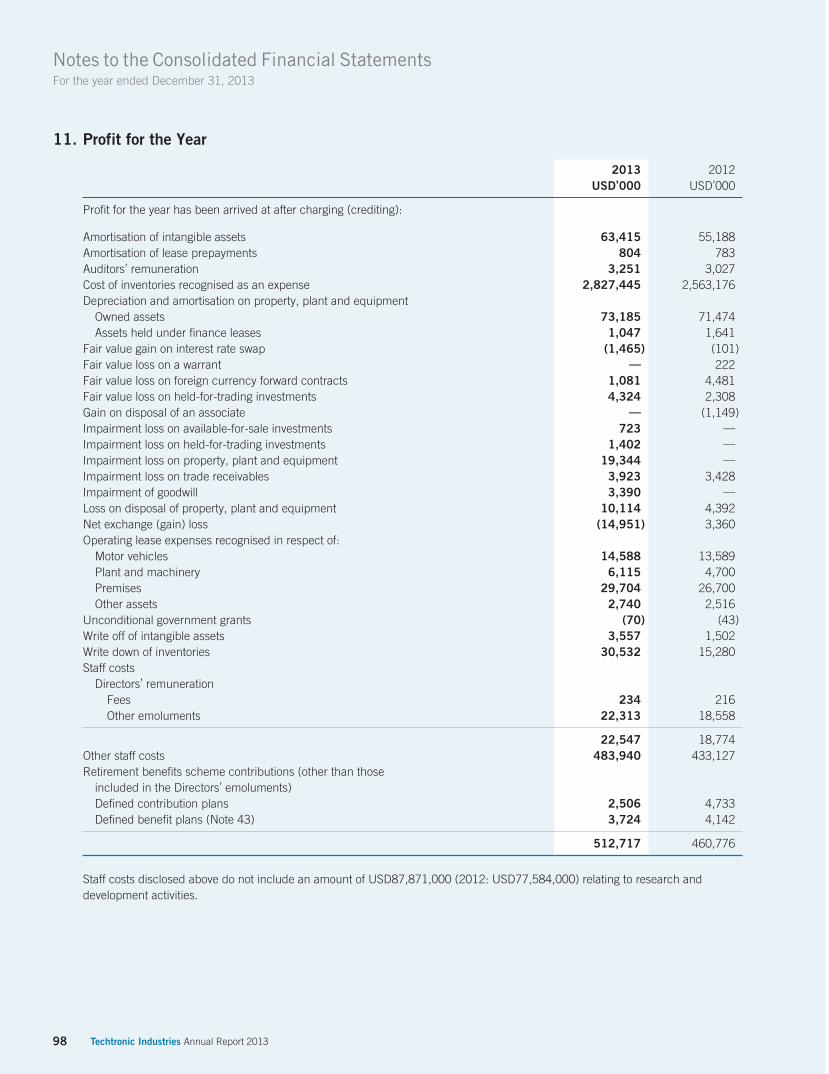
98 Techtronic Industries Annual Report 2013
Notes to the Consolidated Financial StatementsFor the year ended December 31, 2013
11. Profit for the Year
2013 2012USD’000 USD’000
Profit for the year has been arrived at after charging (crediting):
Amortisation of intangible assets 63,415 55,188Amortisation of lease prepayments 804 783Auditors’ remuneration 3,251 3,027Cost of inventories recognised as an expense 2,827,445 2,563,176Depreciation and amortisation on property, plant and equipment Owned assets 73,185 71,474 Assets held under finance leases 1,047 1,641Fair value gain on interest rate swap (1,465) (101)Fair value loss on a warrant — 222Fair value loss on foreign currency forward contracts 1,081 4,481Fair value loss on held-for-trading investments 4,324 2,308Gain on disposal of an associate — (1,149)Impairment loss on available-for-sale investments 723 —Impairment loss on held-for-trading investments 1,402 —Impairment loss on property, plant and equipment 19,344 —Impairment loss on trade receivables 3,923 3,428Impairment of goodwill 3,390 —Loss on disposal of property, plant and equipment 10,114 4,392Net exchange (gain) loss (14,951) 3,360Operating lease expenses recognised in respect of: Motor vehicles 14,588 13,589 Plant and machinery 6,115 4,700 Premises 29,704 26,700 Other assets 2,740 2,516Unconditional government grants (70) (43)Write off of intangible assets 3,557 1,502Write down of inventories 30,532 15,280Staff costs Directors’ remuneration Fees 234 216 Other emoluments 22,313 18,558
22,547 18,774Other staff costs 483,940 433,127Retirement benefits scheme contributions (other than those included in the Directors’ emoluments) Defined contribution plans 2,506 4,733 Defined benefit plans (Note 43) 3,724 4,142
512,717 460,776
Staff costs disclosed above do not include an amount of USD87,871,000 (2012: USD77,584,000) relating to research and development activities.
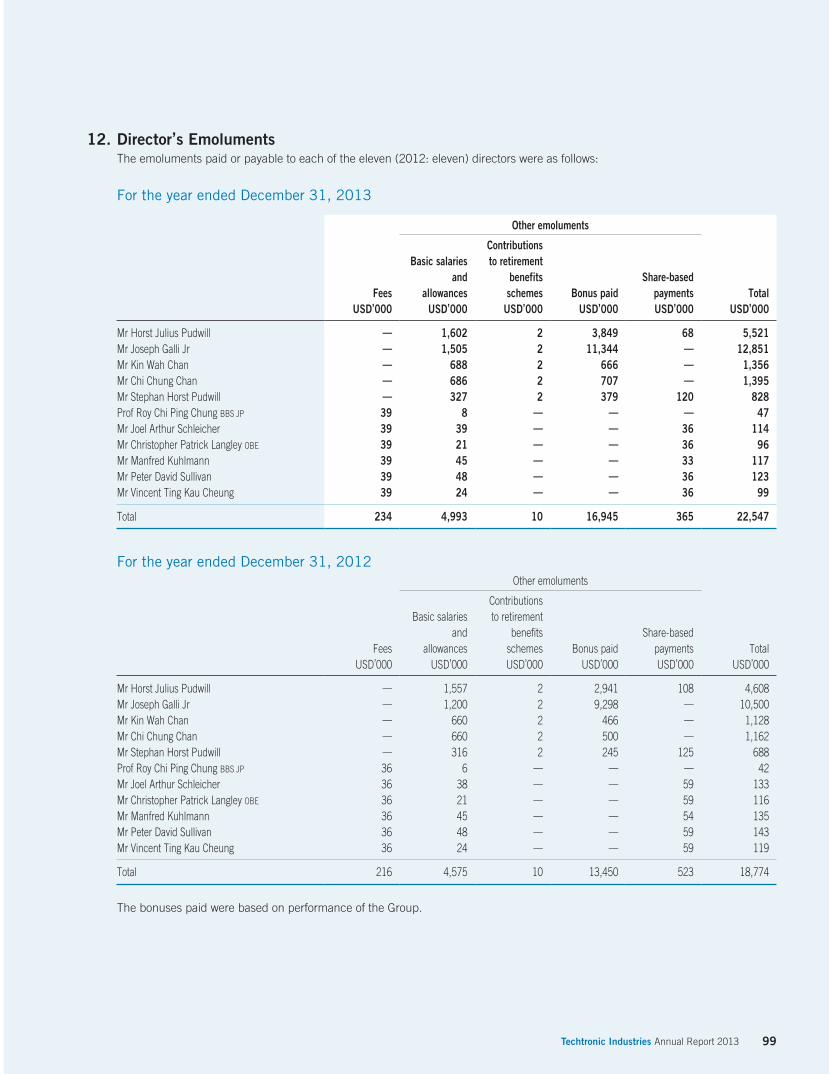
99Techtronic Industries Annual Report 2013
12. Director’s EmolumentsThe emoluments paid or payable to each of the eleven (2012: eleven) directors were as follows:
For the year ended December 31, 2013
Other emoluments
Fees
Basic salariesand
allowances
Contributionsto retirement
benefitsschemes Bonus paid
Share-basedpayments Total
USD’000 USD’000 USD’000 USD’000 USD’000 USD’000 Mr Horst Julius Pudwill — 1,602 2 3,849 68 5,521Mr Joseph Galli Jr — 1,505 2 11,344 — 12,851Mr Kin Wah Chan — 688 2 666 — 1,356Mr Chi Chung Chan — 686 2 707 — 1,395Mr Stephan Horst Pudwill — 327 2 379 120 828Prof Roy Chi Ping Chung BBS JP 39 8 — — — 47Mr Joel Arthur Schleicher 39 39 — — 36 114Mr Christopher Patrick Langley OBE 39 21 — — 36 96Mr Manfred Kuhlmann 39 45 — — 33 117Mr Peter David Sullivan 39 48 — — 36 123Mr Vincent Ting Kau Cheung 39 24 — — 36 99 Total 234 4,993 10 16,945 365 22,547
For the year ended December 31, 2012Other emoluments
Fees
Basic salariesand
allowances
Contributionsto retirement
benefitsschemes Bonus paid
Share-basedpayments Total
USD’000 USD’000 USD’000 USD’000 USD’000 USD’000
Mr Horst Julius Pudwill — 1,557 2 2,941 108 4,608Mr Joseph Galli Jr — 1,200 2 9,298 — 10,500Mr Kin Wah Chan — 660 2 466 — 1,128Mr Chi Chung Chan — 660 2 500 — 1,162Mr Stephan Horst Pudwill — 316 2 245 125 688Prof Roy Chi Ping Chung BBS JP 36 6 — — — 42Mr Joel Arthur Schleicher 36 38 — — 59 133Mr Christopher Patrick Langley OBE 36 21 — — 59 116Mr Manfred Kuhlmann 36 45 — — 54 135Mr Peter David Sullivan 36 48 — — 59 143Mr Vincent Ting Kau Cheung 36 24 — — 59 119 Total 216 4,575 10 13,450 523 18,774
The bonuses paid were based on performance of the Group.

100 Techtronic Industries Annual Report 2013
Notes to the Consolidated Financial StatementsFor the year ended December 31, 2013
13. Employees’ EmolumentsOf the five individuals with the highest emoluments in the Group, four (2012: three) were directors of the Company whose emoluments are included in Note 12 above. The emoluments of the remaining one (2012: two) individual for the year ended December 31, 2013 was as follows:
2013 2012USD’000 USD’000
Basic salaries and allowances 590 1,056Contributions to retirement benefits schemes 9 80Bonus paid 885 1,323Other benefit 28 14Share-based payments — 11
1,512 2,484
The emoluments of this one (2012: two) highest paid individual for the year ended December 31, 2013 was within the following bands:
No. of persons
USD 2013 2012
1,000,001 to 1,500,000 — 21,500,001 to 2,000,000 1 —
During each of the two years ended December 31, 2013 and 2012, no emoluments have been paid by the Group to the five highest paid individuals, including directors, as an inducement to join or upon joining the Group or as compensation for loss of office. No director has waived any emoluments during those years.
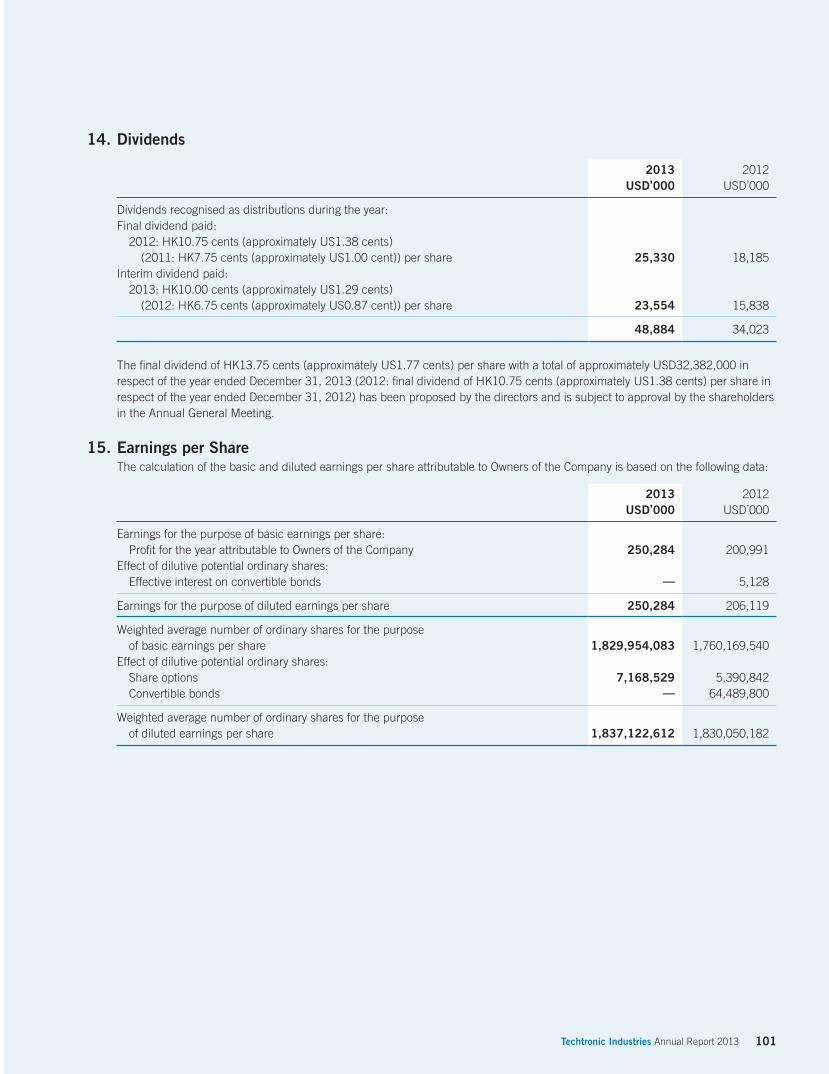
101Techtronic Industries Annual Report 2013
14. Dividends
2013 2012USD’000 USD’000
Dividends recognised as distributions during the year:Final dividend paid: 2012: HK10.75 cents (approximately US1.38 cents) (2011: HK7.75 cents (approximately US1.00 cent)) per share 25,330 18,185Interim dividend paid: 2013: HK10.00 cents (approximately US1.29 cents) (2012: HK6.75 cents (approximately US0.87 cent)) per share 23,554 15,838
48,884 34,023
The final dividend of HK13.75 cents (approximately US1.77 cents) per share with a total of approximately USD32,382,000 in respect of the year ended December 31, 2013 (2012: final dividend of HK10.75 cents (approximately US1.38 cents) per share in respect of the year ended December 31, 2012) has been proposed by the directors and is subject to approval by the shareholders in the Annual General Meeting.
15. Earnings per ShareThe calculation of the basic and diluted earnings per share attributable to Owners of the Company is based on the following data:
2013 2012USD’000 USD’000
Earnings for the purpose of basic earnings per share: Profit for the year attributable to Owners of the Company 250,284 200,991Effect of dilutive potential ordinary shares: Effective interest on convertible bonds — 5,128 Earnings for the purpose of diluted earnings per share 250,284 206,119 Weighted average number of ordinary shares for the purpose of basic earnings per share 1,829,954,083 1,760,169,540Effect of dilutive potential ordinary shares: Share options 7,168,529 5,390,842 Convertible bonds — 64,489,800 Weighted average number of ordinary shares for the purpose of diluted earnings per share 1,837,122,612 1,830,050,182

102 Techtronic Industries Annual Report 2013
Notes to the Consolidated Financial StatementsFor the year ended December 31, 2013
16. Property, Plant and Equipment
Freeholdland andbuildings
outsideHong Kong
(Note)Leasehold
improvements
Officeequipment,
furniture andfixtures
Plant andmachinery
Motorvehicles
Moulds andtooling Vessels
Constructionin progress Total
USD’000 USD’000 USD’000 USD’000 USD’000 USD’000 USD’000 USD’000 USD’000
The GroupCostAt January 1, 2012 142,662 51,966 144,433 196,450 4,674 213,436 2,298 61,574 817,493Currency realignment 912 488 1,448 1,363 5 606 — 260 5,082Additions 45 1,192 7,944 8,549 625 15,681 — 68,928 102,964Disposals (4,897) (473) (4,383) (2,625) (498) (38,532) — (3,707) (55,115)Reclassification 8,723 11,117 5,313 4,247 162 39,265 — (68,827) — At December 31, 2012 147,445 64,290 154,755 207,984 4,968 230,456 2,298 58,228 870,424 Currency realignment 1,142 888 821 1,905 (75) 1,060 — 494 6,235Additions 2,060 1,166 7,635 9,699 493 7,879 — 75,683 104,615Acquisition of businesses — — 95 760 — — — — 855Disposals (12,610) (6,575) (11,711) (19,730) (484) (61,564) — (2,985) (115,659)Impairment (15,362) — (4,056) (23,005) (161) (20,585) — — (63,169)Reclassification 2,061 441 5,994 9,963 464 29,884 — (48,807) — At December 31, 2013 124,736 60,210 153,533 187,576 5,205 187,130 2,298 82,613 803,301 Depreciation and impairmentAt January 1, 2012 39,776 19,161 113,590 120,127 3,375 160,656 726 — 457,411Currency realignment 247 203 948 583 19 236 — — 2,236Provided for the year 5,815 4,022 12,109 16,006 423 34,280 460 — 73,115Eliminated on disposals (2,592) (395) (3,697) (2,279) (439) (37,090) — — (46,492) At December 31, 2012 43,246 22,991 122,950 134,437 3,378 158,082 1,186 — 486,270 Currency realignment 115 187 366 719 (16) 463 — — 1,834Provided for the year 6,699 4,316 12,450 15,425 517 34,365 460 — 74,232Eliminated on disposals (6,904) (5,770) (10,746) (18,787) (344) (56,608) — — (99,159)Impairment (6,020) — (3,541) (17,968) (137) (16,159) — — (43,825) At December 31, 2013 37,136 21,724 121,479 113,826 3,398 120,143 1,646 — 419,352 Carrying amountsAt December 31, 2013 87,600 38,486 32,054 73,750 1,807 66,987 652 82,613 383,949 At December 31, 2012 104,199 41,299 31,805 73,547 1,590 72,374 1,112 58,228 384,154
Note: Buildings with a carrying amount of USD23,474,000 (2012: USD23,599,000) are erected on leasehold land that is presented as lease prepayments on the
consolidated statement of financial position.

103Techtronic Industries Annual Report 2013
16. Property, Plant and Equipment (continued)
Buildingsoutside
Hong Kong Leasehold
improvements
Officeequipment,
furnitureand fixtures
Plant andmachinery
Motorvehicles
Moulds andtooling Total
USD’000 USD’000 USD’000 USD’000 USD’000 USD’000 USD’000
The CompanyCostAt January 1, 2012 3,998 2,908 12,541 3,354 647 5,251 28,699Additions — 139 1,017 — 195 — 1,351Disposals (3,998) (293) (1,252) (164) (96) (408) (6,211) At December 31, 2012 — 2,754 12,306 3,190 746 4,843 23,839 Additions — — 242 — — — 242Disposals — (2,682) (5,438) (3,190) — (3,681) (14,991)Transfer to subsidiaries — — — — — (1,162) (1,162) At December 31, 2013 — 72 7,110 — 746 — 7,928 DepreciationAt January 1, 2012 2,111 2,868 11,044 3,004 647 5,251 24,925Provided for the year 134 33 724 341 16 — 1,248Eliminated on disposals (2,245) (293) (1,250) (164) (96) (408) (4,456) At December 31, 2012 — 2,608 10,518 3,181 567 4,843 21,717 Provided for the year — 46 735 9 49 — 839Eliminated on disposals — (2,614) (5,412) (3,190) — (3,681) (14,897)Transfer to subsidiaries — — — — — (1,162) (1,162) At December 31, 2013 — 40 5,841 — 616 — 6,497 Carrying amountsAt December 31, 2013 — 32 1,269 — 130 — 1,431 At December 31, 2012 — 146 1,788 9 179 — 2,122
The above property, plant and equipment, other than construction in progress, are depreciated on a straight-line basis, at the following rates per annum:
Freehold land NilBuildings 21/5% - 62/3%Leasehold improvements 62/3% - 25%Office equipment, furniture and fixtures 10% - 331/3%Plant and machinery 9% - 33%Motor vehicles 10% - 33%Moulds and tooling 18% - 331/3%Vessels 20%
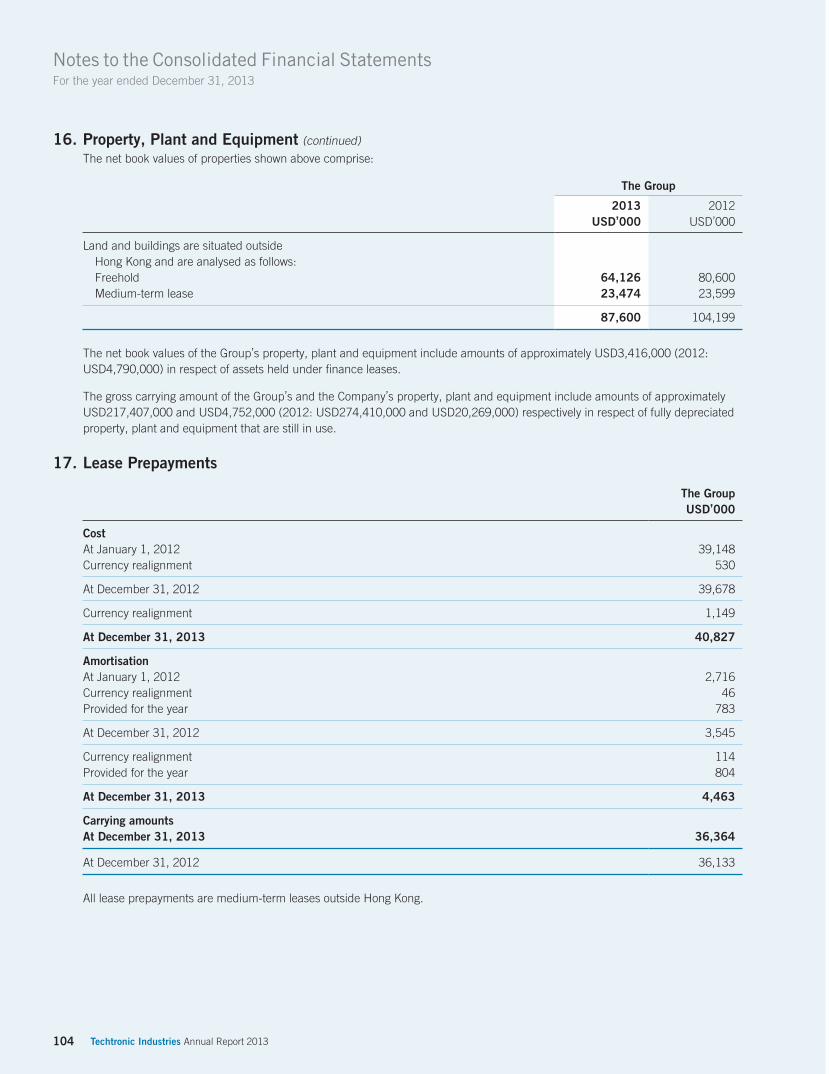
104 Techtronic Industries Annual Report 2013
Notes to the Consolidated Financial StatementsFor the year ended December 31, 2013
16. Property, Plant and Equipment (continued)
The net book values of properties shown above comprise:
The Group 2013 2012
USD’000 USD’000
Land and buildings are situated outside Hong Kong and are analysed as follows: Freehold 64,126 80,600 Medium-term lease 23,474 23,599
87,600 104,199
The net book values of the Group’s property, plant and equipment include amounts of approximately USD3,416,000 (2012: USD4,790,000) in respect of assets held under finance leases.
The gross carrying amount of the Group’s and the Company’s property, plant and equipment include amounts of approximately USD217,407,000 and USD4,752,000 (2012: USD274,410,000 and USD20,269,000) respectively in respect of fully depreciated property, plant and equipment that are still in use.
17. Lease Prepayments
The GroupUSD’000
CostAt January 1, 2012 39,148Currency realignment 530 At December 31, 2012 39,678 Currency realignment 1,149 At December 31, 2013 40,827 AmortisationAt January 1, 2012 2,716Currency realignment 46Provided for the year 783 At December 31, 2012 3,545 Currency realignment 114Provided for the year 804 At December 31, 2013 4,463 Carrying amountsAt December 31, 2013 36,364 At December 31, 2012 36,133
All lease prepayments are medium-term leases outside Hong Kong.

105Techtronic Industries Annual Report 2013
18. Goodwill
The GroupUSD’000
At January 1, 2012 530,856Currency realignment 304 At December 31, 2012 531,160Currency realignment 857Arising on acquisition of a business (Note 45) 3,861Goodwill impairment (3,390) At December 31, 2013 532,488
Particulars regarding impairment testing of goodwill are disclosed in Note 20.
19. Intangible Assets
Deferreddevelopment
costs Patents TrademarksManufacturing
know-how
Retailerand service
relationships
Noncompete
agreement TotalUSD’000 USD’000 USD’000 USD’000 USD’000 USD’000 USD’000
The GroupCostAt January 1, 2012 315,736 43,275 192,370 453 6,500 — 558,334Currency realignment 15 (1) 1 — — — 15Additions 69,631 4,214 3 — — 10,634 84,482Written off in the year (4,175) (25) (10) — — — (4,210) At December 31, 2012 381,207 47,463 192,364 453 6,500 10,634 638,621 Currency realignment 67 — — — — — 67Additions 83,691 5,418 — — — — 89,109Acquisition of businesses — 1,857 36,379 — — — 38,236Written off in the year (12,120) (28) — — — — (12,148) At December 31, 2013 452,845 54,710 228,743 453 6,500 10,634 753,885 AmortisationAt January 1, 2012 153,404 23,905 7,997 453 1,300 — 187,059Currency realignment 18 (1) (2) — — — 15Provided for the year 47,887 4,611 1,124 — 325 1,241 55,188Eliminated on write off (2,673) (25) (10) — — — (2,708) At December 31, 2012 198,636 28,490 9,109 453 1,625 1,241 239,554 Currency realignment 67 — — — — — 67Provided for the year 54,728 5,111 1,124 — 325 2,127 63,415Eliminated on write off (8,563) (28) — — — — (8,591) At December 31, 2013 244,868 33,573 10,233 453 1,950 3,368 294,445 Carrying AmountsAt December 31, 2013 207,977 21,137 218,510 — 4,550 7,266 459,440 At December 31, 2012 182,571 18,973 183,255 — 4,875 9,393 399,067

106 Techtronic Industries Annual Report 2013
Notes to the Consolidated Financial StatementsFor the year ended December 31, 2013
19. Intangible Assets (continued)
Deferreddevelopment
costs Patents TotalUSD’000 USD’000 USD’000
The CompanyCostAt January 1, 2012 70,808 6,700 77,508 At December 31, 2012 and December 31, 2013 70,808 6,700 77,508 AmortisationAt January 1, 2012 56,100 6,698 62,798Provided for the year 8,799 2 8,801 At December 31, 2012 64,899 6,700 71,599 Provided for the year 5,909 — 5,909 At December 31, 2013 70,808 6,700 77,508 Carrying AmountsAt December 31, 2013 — — — At December 31, 2012 5,909 — 5,909
The retailer and service relationships were acquired through business combinations which related to the relationships with retailers and service centres.
Deferred development costs are internally generated.
Included in trademarks of the Group, USD213,934,000 (2012: USD177,555,000) are trademarks with indefinite useful lives as considered by the management of the Group as having an indefinite useful life because they are expected to contribute to net cash inflows indefinitely. The trademarks will not be amortised until their useful lives are determined to be finite. Instead they will be tested for impairment annually and whenever there is an indication that they may be impaired. Particulars of the impairment testing are disclosed in Note 20.
The above intangible assets, other than trademarks with indefinite useful lives, are amortised on a straight-line basis, at the following rates per annum:
Deferred development costs 20% - 331/3%Patents 10% - 25%Trademarks with finite useful lives 62/3% - 10%Retailer and service relationships 5%Non compete agreement 20%

107Techtronic Industries Annual Report 2013
20. Impairment Testing on Goodwill and Intangible Assets with Indefinite Useful Lives As explained in Note 5, the Group uses the types of goods sold for operating segment information. For the purpose of impairment
testing, goodwill and trademarks with indefinite useful lives set out in Notes 18 and 19 have been allocated to five major individual cash generating units (CGUs), including four units in the Power Equipment segment and one unit in the Floor Care and Appliances segment. The carrying amounts of goodwill and trademarks as at December 31, 2013 allocated to these units are as follows:
Goodwill Trademarks 2013 2012 2013 2012
USD’000 USD’000 USD’000 USD’000
Power Equipment – MET 402,424 402,424 115,907 115,907Power Equipment – HCP 7,492 7,492 30,648 30,648Power Equipment – Drebo 25,483 24,626 — —Power Equipment – Baja 9,017 9,017 3,200 3,200Floor Care and Appliances – RAM/Hoover/VAX 75,748 75,748 64,179 27,800Others 12,324 11,853 — —
532,488 531,160 213,934 177,555
During the year ended December 31, 2013, management of the Group determined to impair goodwill which originally generated from a CGU under “Others” amounting to USD3,390,000. No goodwill impairment has been recognised for the year ended December 31, 2012.
The basis of the recoverable amounts of the above CGUs and their major underlying assumptions are summarised below:
Power Equipment - MET (“MET”)The recoverable amount of MET’s goodwill and intangibles has been determined based on a value in use calculation. That calculation uses cash flow projections based on financial budgets approved by management covering a 5-year period and a discount rate of 11.5% (2012: 11.5%) per annum.
Cash flow projections during the budget period for MET are based on management’s estimation of cash inflows/outflows including sales, gross margin, operating expenses and working capital requirements. The assumptions and estimation are based on MET’s past performance, management’s expectations of the market development, the success in new products launched, the success in reducing the working capital requirements and the success of the cost cutting strategy implemented by the Group. Cash flow projections beyond the 5-year period are extrapolated using a steady 3.0% (2012: 3.0%) growth rate. Management believes that any reasonably possible change in any of these assumptions would not cause the carrying amount of MET’s goodwill and intangibles to exceed the recoverable amounts.
Power Equipment – HCP (“HCP”)The recoverable amount of HCP’s goodwill and intangibles has been determined based on a value in use calculation. That calculation uses cash flow projections based on financial budgets approved by management covering a 5-year period, and a discount rate of 12.0% (2012: 12.0%) per annum.
Cash flow projections during the budget period for HCP are based on management’s estimation of cash inflows/outflows including sales, gross margin, operating expenses and working capital requirements. The assumptions and estimation are based on HCP’s past performance, management’s expectations of the market development, the success in new products launched and the success of the cost cutting strategy implemented. Cash flow projections beyond the 5-year period are extrapolated without considering any growth rate. Management believes that any reasonably possible change in any of these assumptions would not cause the carrying amount of HCP’s goodwill and intangibles to exceed the aggregate recoverable amounts.
108 Techtronic Industries Annual Report 2013
Notes to the Consolidated Financial StatementsFor the year ended December 31, 2013
20. Impairment Testing on Goodwill and Intangible Assets with Indefinite Useful Lives (continued)
Power Equipment – Drebo (“Drebo”)The recoverable amount of Drebo’s goodwill has been determined based on a value in use calculation. That calculation uses cash flow projections based on financial budgets approved by management covering a 5-year period, and a discount rate of 11.0% (2012: 11.0%) per annum.
Cash flow projections during the budget period for Drebo are based on management’s estimation of cash inflows/outflows including sales, gross margin, operating expenses and working capital requirements. The assumptions and estimation are based on Drebo’s past performance, management’s expectations of the market development, the success in new products launched and the cost cutting strategies implemented. Cash flow projections beyond the 5-year period are extrapolated without considering any growth rate. Management believes that any reasonably possible change in any of these assumptions would not cause the carrying amount of Drebo’s goodwill to exceed the recoverable amount.
Power Equipment – Baja (“Baja”)The recoverable amount of Baja’s goodwill and intangibles has been determined based on a value in use calculation. That calculation uses cash flow projections based on financial budgets approved by management covering a 5-year period, and a discount rate of 13.0% (2012: 13.0%) per annum.
Cash flow projections during the budget period for Baja are based on management’s estimation of cash inflows/outflows including sales, gross margin, operating expenses and working capital requirements. The assumptions and estimation are based on Baja’s past performance, management’s expectations of the market development and the success of the cost cutting strategy implemented. Cash flow projections beyond the 5-year period are extrapolated using a steady 2.0% (2012: 2.0%) growth rate. Management believes that any reasonably possible change in any of these assumptions would not cause the carrying amount of Baja’s goodwill and intangibles to exceed the aggregate recoverable amounts.
Floor Care and Appliances – RAM/Hoover/VAX (“RAM/Hoover/VAX”)The recoverable amount of RAM/Hoover/VAX has been determined based on a value in use calculation. That calculation uses cash flow projections based on financial budgets approved by management covering a 5-year period, and a discount rate of 15.0% (2012: 15.3%) per annum.
Cash flow projections during the budget period for RAM/Hoover/VAX are based on management’s estimation of cash inflows/outflows including sales, gross margin, operating expenses, capital expenditures and working capital requirements. The assumptions and estimation are based on RAM/Hoover/VAX’s past performance, management’s expectations of the market development, the success in reducing the working capital requirements and the success of the cost cutting strategies implemented. Cash flow projections beyond the 5-year period are extrapolated using a steady 2.0% (2012: nil) growth rate. Management believes that any reasonably possible change in any of these assumptions would not cause the carrying amount of RAM/Hoover/VAX’s goodwill and intangibles to exceed the aggregate recoverable amounts.
21. Investments in Subsidiaries/Loans to Subsidiaries Particulars of the principal subsidiaries of the Company as at December 31, 2013 and December 31, 2012 are set out in Note 52.
Loans to subsidiaries are unsecured, bear fixed interest at 5.275% to 10.150% per annum (2012: 5.275% to 10.150%) and are fully repayable by 2022.
109Techtronic Industries Annual Report 2013
22. Interests in Associates
The Group The Company 2013 2012 2013 2012
USD’000 USD’000 USD’000 USD’000
Unlisted shares, at cost less impairment loss recognised — — — —Share of net assets — — — —Amounts due from associates 15,766 17,724 14,478 16,436
15,766 17,724 14,478 16,436
Particulars of the associates as at December 31, 2013 and December 31, 2012 are set out in Note 53.
The amounts due from associates are unsecured, non-interest bearing and are repayable on demand.
At the end of the reporting period, amongst the associates, the Group held 40.8% of the shares of Gimelli International (Holdings) Limited and its subsidiaries (together the “Gimelli Group companies”). The Group has discontinued recognising its share of the losses of the Gimelli Group companies. The unrecognised share of gain (loss) for the year and cumulatively, extracted from the relevant management accounts of the associates, are USD1,025,000 (2012: (USD831,000)) and (USD5,380,000) (2012: (USD6,405,000)) respectively.
23. Available-for-sale Investments
The Group The Company 2013 2012 2013 2012
USD’000 USD’000 USD’000 USD’000
Unlisted equity securities and club membership debentures, at cost less impairment loss recognised 520 1,270 196 218
As at December 31, 2013, all available-for-sale investments represent investments in unlisted equity securities and club membership debentures. They are measured at cost less impairment at the reporting date because the range of reasonable fair value estimates is so significant that the directors of the Company are of the opinion that their fair values cannot be measured reliably.
24. Inventories
The Group The Company 2013 2012 2013 2012
USD’000 USD’000 USD’000 USD’000
Raw materials 95,186 84,315 — —Work in progress 11,505 12,523 — —Finished goods 777,539 591,738 — 573
884,230 688,576 — 573
110 Techtronic Industries Annual Report 2013
Notes to the Consolidated Financial StatementsFor the year ended December 31, 2013
25. Trade and other Receivables
The Group The Company 2013 2012 2013 2012
USD’000 USD’000 USD’000 USD’000
Trade receivables 770,033 658,929 — —Less: Allowances for doubtful debts (18,168) (13,987) — —
751,865 644,942 — —Other receivables 31,930 43,981 6,207 8,005
783,795 688,923 6,207 8,005
The aged analysis of trade receivables, net of allowances for doubtful debts, presented on the basis of the revenue recognition date, which is usually the invoice date, at the end of the reporting period is as follows:
The Group 2013 2012
USD’000 USD’000
0 to 60 days 625,004 557,15861 to 120 days 95,120 61,899121 days or above 31,741 25,885 Total trade receivables 751,865 644,942
Before accepting any new customer, the Group uses an internal credit scoring system to assess the potential customer’s credit quality and defines credit limits by customer. Limits and scoring attributed to customers are reviewed regularly. Trade receivables that are neither past due nor impaired have the best credit scoring attributable under the internal credit scoring system used by the Group.
Included in the Group’s trade receivable balance are debtors with a carrying amount of USD110,082,000 (2012: USD99,381,000) which are past due at the reporting date for which the Group has not provided for impairment loss. The Group does not hold any collateral over these balances. The average age of these receivables is 96 days (2012: 88 days).
The Group has a policy of allowing credit periods ranging mainly from 30 days to 120 days. Trade receivables that were past due but not provided for impairment loss are related to a number of independent customers that have a good track record with the Group. The management believes that no impairment allowance is necessary in respect of these balances as there has not been a significant change in credit quality of the relevant customers and the balances are still considered fully recoverable.
Ageing of trade receivables which are past due but not impaired
The Group 2013 2012
USD’000 USD’000
1 — 60 days 91,864 77,41661 — 120 days 4,326 10,433121 — 365 days 4,433 4,5871 — 2 years 3,557 3,820Over 2 years 5,902 3,125 Total 110,082 99,381
111Techtronic Industries Annual Report 2013
25. Trade and other Receivables (continued)
Movement in the allowance for doubtful debts
The Group 2013 2012
USD’000 USD’000
Balance at beginning of the year 13,987 14,680Currency realignment 271 258Impairment losses recognised on receivables 3,923 3,428Acquisition of businesses 2,696 —Amounts written off as uncollectible (1,848) (3,701)Amounts recovered during the year (861) (678) Balance at end of the year 18,168 13,987
Included in the allowance for doubtful debts are individually impaired trade receivables amounting to USD18,168,000 (2012: USD13,987,000) which have the worst credit scoring attributable under the internal credit scoring system used by the Group. The Group does not hold any collateral over these balances.
Ageing of impaired trade receivables (by invoice date)
2013 2012USD’000 USD’000
0 - 120 days 2,592 2,474121 - 365 days 8,419 4,6471 - 2 years 5,778 5,575Over 2 years 1,379 1,291 Total 18,168 13,987
Under certain receivables purchase agreements, a percentage in various pools of trade receivables were factored to banks (the “Factored Trade Receivables”). As the Group still retained the risks associated in respect of default payments, the Group continued to recognise the Factored Trade Receivables in the consolidated statement of financial position. At the end of the reporting period, proceeds from the Factored Trade Receivables of approximately USD74,952,000 (2012: USD75,000,000) were recognised as liabilities and included in “Unsecured borrowings – due within one year” in the consolidated statement of financial position.
26. Bills Receivable All the Group’s bills receivable at December 31, 2013 and 2012 are due within 120 days.
27. Amounts Due from/(to) Subsidiaries The amounts are unsecured, interest-free and payable on demand.
28. Trade Receivables from an Associate The trade receivables from an associate were aged less than 120 days and are due within 120 days.
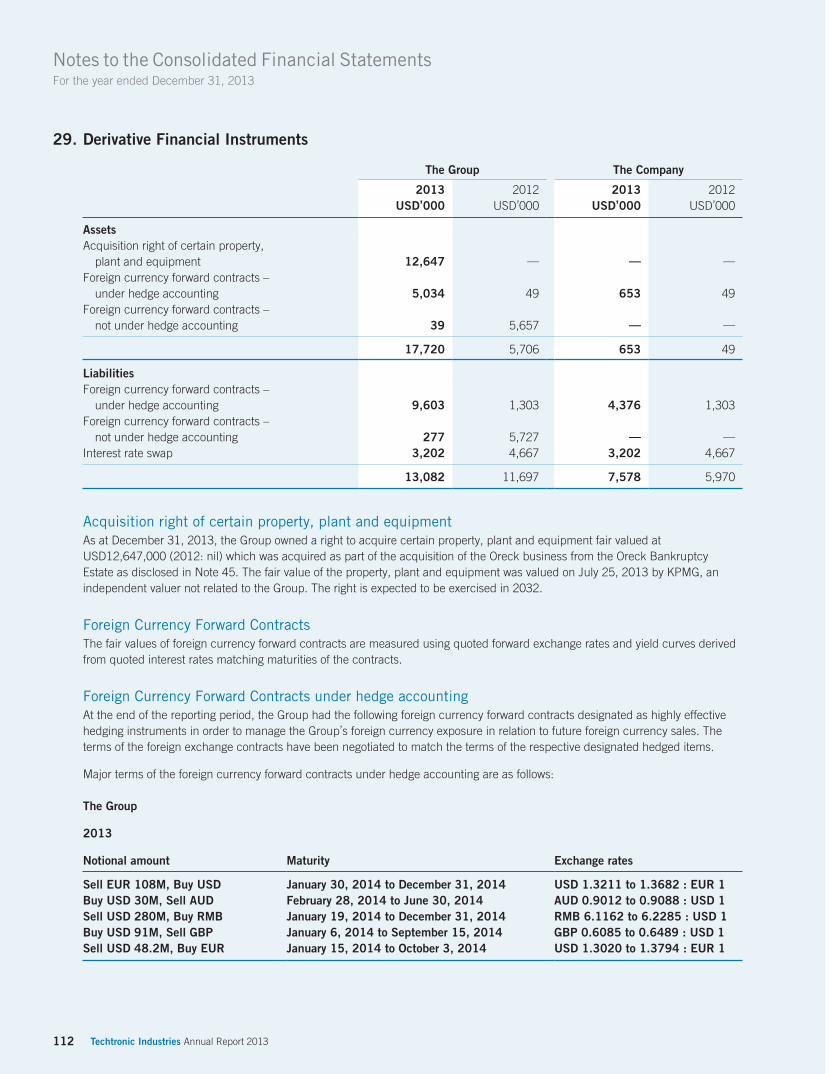
112 Techtronic Industries Annual Report 2013
Notes to the Consolidated Financial StatementsFor the year ended December 31, 2013
29. Derivative Financial Instruments
The Group The Company 2013 2012 2013 2012
USD’000 USD’000 USD’000 USD’000
AssetsAcquisition right of certain property, plant and equipment 12,647 — — —Foreign currency forward contracts – under hedge accounting 5,034 49 653 49Foreign currency forward contracts – not under hedge accounting 39 5,657 — —
17,720 5,706 653 49 LiabilitiesForeign currency forward contracts – under hedge accounting 9,603 1,303 4,376 1,303Foreign currency forward contracts – not under hedge accounting 277 5,727 — —Interest rate swap 3,202 4,667 3,202 4,667
13,082 11,697 7,578 5,970
Acquisition right of certain property, plant and equipmentAs at December 31, 2013, the Group owned a right to acquire certain property, plant and equipment fair valued at USD12,647,000 (2012: nil) which was acquired as part of the acquisition of the Oreck business from the Oreck Bankruptcy Estate as disclosed in Note 45. The fair value of the property, plant and equipment was valued on July 25, 2013 by KPMG, an independent valuer not related to the Group. The right is expected to be exercised in 2032.
Foreign Currency Forward ContractsThe fair values of foreign currency forward contracts are measured using quoted forward exchange rates and yield curves derived from quoted interest rates matching maturities of the contracts.
Foreign Currency Forward Contracts under hedge accountingAt the end of the reporting period, the Group had the following foreign currency forward contracts designated as highly effective hedging instruments in order to manage the Group’s foreign currency exposure in relation to future foreign currency sales. The terms of the foreign exchange contracts have been negotiated to match the terms of the respective designated hedged items.
Major terms of the foreign currency forward contracts under hedge accounting are as follows:
The Group
2013
Notional amount Maturity Exchange rates
Sell EUR 108M, Buy USD January 30, 2014 to December 31, 2014 USD 1.3211 to 1.3682 : EUR 1Buy USD 30M, Sell AUD February 28, 2014 to June 30, 2014 AUD 0.9012 to 0.9088 : USD 1Sell USD 280M, Buy RMB January 19, 2014 to December 31, 2014 RMB 6.1162 to 6.2285 : USD 1Buy USD 91M, Sell GBP January 6, 2014 to September 15, 2014 GBP 0.6085 to 0.6489 : USD 1Sell USD 48.2M, Buy EUR January 15, 2014 to October 3, 2014 USD 1.3020 to 1.3794 : EUR 1
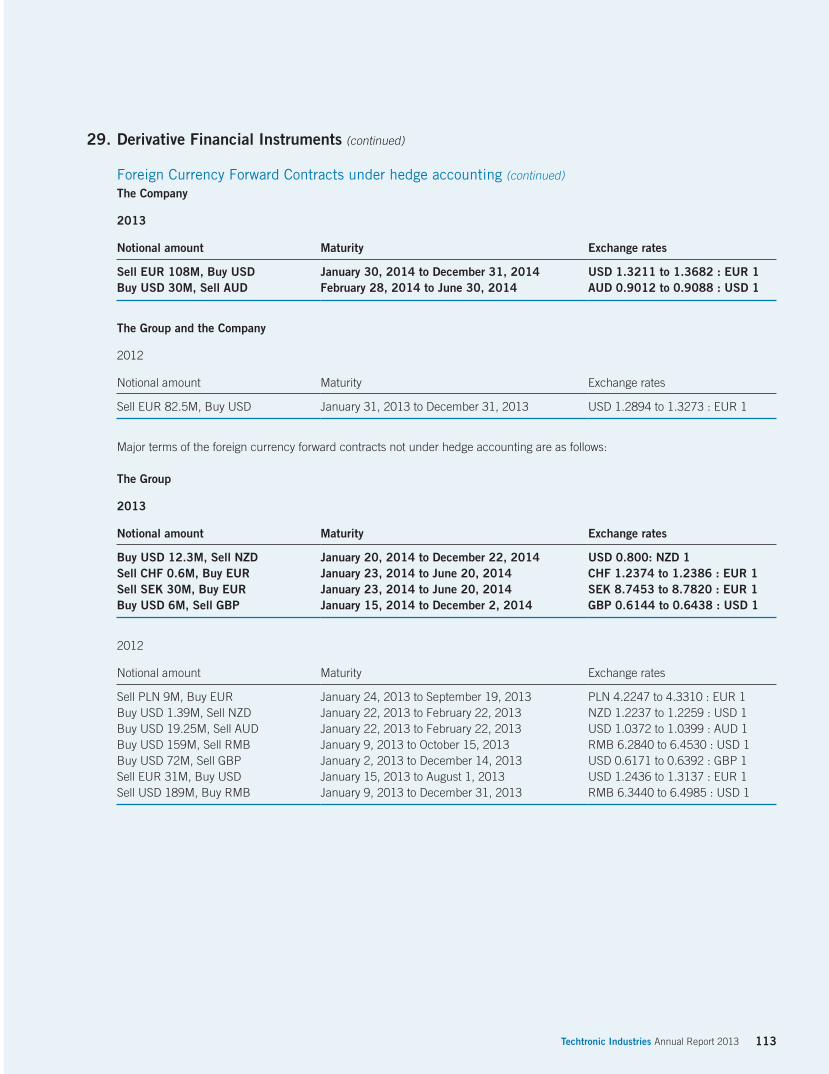
113Techtronic Industries Annual Report 2013
29. Derivative Financial Instruments (continued)
Foreign Currency Forward Contracts under hedge accounting (continued)
The Company
2013
Notional amount Maturity Exchange rates
Sell EUR 108M, Buy USD January 30, 2014 to December 31, 2014 USD 1.3211 to 1.3682 : EUR 1Buy USD 30M, Sell AUD February 28, 2014 to June 30, 2014 AUD 0.9012 to 0.9088 : USD 1
The Group and the Company
2012
Notional amount Maturity Exchange rates
Sell EUR 82.5M, Buy USD January 31, 2013 to December 31, 2013 USD 1.2894 to 1.3273 : EUR 1
Major terms of the foreign currency forward contracts not under hedge accounting are as follows:
The Group
2013
Notional amount Maturity Exchange rates
Buy USD 12.3M, Sell NZD January 20, 2014 to December 22, 2014 USD 0.800: NZD 1Sell CHF 0.6M, Buy EUR January 23, 2014 to June 20, 2014 CHF 1.2374 to 1.2386 : EUR 1Sell SEK 30M, Buy EUR January 23, 2014 to June 20, 2014 SEK 8.7453 to 8.7820 : EUR 1Buy USD 6M, Sell GBP January 15, 2014 to December 2, 2014 GBP 0.6144 to 0.6438 : USD 1
2012
Notional amount Maturity Exchange rates
Sell PLN 9M, Buy EUR January 24, 2013 to September 19, 2013 PLN 4.2247 to 4.3310 : EUR 1Buy USD 1.39M, Sell NZD January 22, 2013 to February 22, 2013 NZD 1.2237 to 1.2259 : USD 1Buy USD 19.25M, Sell AUD January 22, 2013 to February 22, 2013 USD 1.0372 to 1.0399 : AUD 1Buy USD 159M, Sell RMB January 9, 2013 to October 15, 2013 RMB 6.2840 to 6.4530 : USD 1Buy USD 72M, Sell GBP January 2, 2013 to December 14, 2013 USD 0.6171 to 0.6392 : GBP 1Sell EUR 31M, Buy USD January 15, 2013 to August 1, 2013 USD 1.2436 to 1.3137 : EUR 1Sell USD 189M, Buy RMB January 9, 2013 to December 31, 2013 RMB 6.3440 to 6.4985 : USD 1
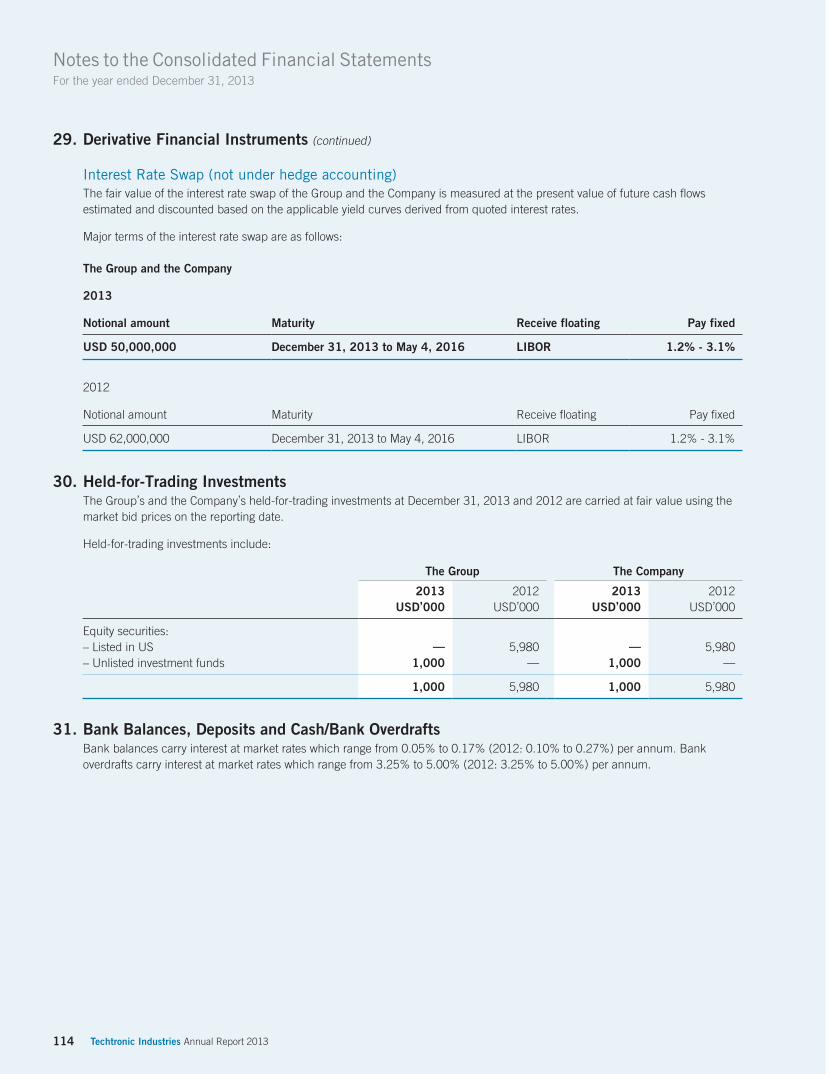
114 Techtronic Industries Annual Report 2013
Notes to the Consolidated Financial StatementsFor the year ended December 31, 2013
29. Derivative Financial Instruments (continued)
Interest Rate Swap (not under hedge accounting)The fair value of the interest rate swap of the Group and the Company is measured at the present value of future cash flows estimated and discounted based on the applicable yield curves derived from quoted interest rates.
Major terms of the interest rate swap are as follows:
The Group and the Company
2013
Notional amount Maturity Receive floating Pay fixed
USD 50,000,000 December 31, 2013 to May 4, 2016 LIBOR 1.2% - 3.1%
2012
Notional amount Maturity Receive floating Pay fixed
USD 62,000,000 December 31, 2013 to May 4, 2016 LIBOR 1.2% - 3.1%
30. Held-for-Trading Investments The Group’s and the Company’s held-for-trading investments at December 31, 2013 and 2012 are carried at fair value using the
market bid prices on the reporting date.
Held-for-trading investments include:
The Group The Company 2013 2012 2013 2012
USD’000 USD’000 USD’000 USD’000
Equity securities:– Listed in US — 5,980 — 5,980– Unlisted investment funds 1,000 — 1,000 —
1,000 5,980 1,000 5,980
31. Bank Balances, Deposits and Cash/Bank Overdrafts Bank balances carry interest at market rates which range from 0.05% to 0.17% (2012: 0.10% to 0.27%) per annum. Bank
overdrafts carry interest at market rates which range from 3.25% to 5.00% (2012: 3.25% to 5.00%) per annum.

115Techtronic Industries Annual Report 2013
32. Trade and other Payables The aged analysis of trade payables presented based on the invoice date at the end of the reporting period is as follows:
The Group The Company 2013 2012 2013 2012
USD’000 USD’000 USD’000 USD’000
0 to 60 days 467,635 309,719 — —61 to 120 days 148,839 80,517 — —121 days or above 29,502 1,557 5 5 Total trade payables 645,976 391,793 5 5Other payables 393,947 318,698 26,398 20,961
1,039,923 710,491 26,403 20,966
The credit period on the purchase of goods ranges from 30 days to 120 days (2012: 30 days to 120 days). The Group has financial risk management policies in place to ensure that all payables are settled within the credit time frame.
33. Bills Payable All the Group’s bills payable at December 31, 2013 and 2012 are due within 120 days.
34. Warranty Provision
The GroupUSD’000
At January 1 ,2012 44,748Currency realignment 356Additional provision in the year 87,872Utilisation of provision (90,581) At December 31, 2012 42,395Currency realignment 94Additional provision in the year 91,118Acquisition of businesses 4,231Utilisation of provision (85,210) At December 31, 2013 52,628
The warranty provision represents management’s best estimate of the Group’s outstanding liabilities on products sold, based on prior experience and industry averages for defective products. It is expected that the majority of this expenditure will be incurred in the next financial year.

Notes to the Consolidated Financial StatementsFor the year ended December 31, 2013
116 Techtronic Industries Annual Report 2013
35. Restructuring Provision
The GroupUSD’000
At January 1, 2012 3,743Currency realignment (14)Utilisation of provision (3,202) At December 31, 2012 527Currency realignment 4Utilisation of provision (531) At December 31, 2013 —
The provision related to the restructuring of the Group’s manufacturing facilities in Germany.
36. Obligations under Finance LeasesIt is the Group’s policy to lease certain of its land and buildings, plant and machinery, fixtures and equipment and motor vehicles under finance leases, with lease terms ranging from 3 years to 20 years. Interest rates underlying all obligations under finance leases are fixed at the respective contract dates ranging from 7.5% to 22.4% (December 31, 2012: 6.7% to 22.4%). No arrangements have been entered into that include contingent rental payments.
The maturity of obligations under finance leases is as follows:
The Group
Minimum lease paymentsPresent value of
minimum lease payments 2013 2012 2013 2012
USD’000 USD’000 USD’000 USD’000
Amounts payable under finance leases: Within one year 1,245 1,518 977 1,154 In more than one year but not more than two years 1,330 1,301 1,137 1,028 In more than two years but not more than three years 785 1,199 663 1,007 In more than three years but not more than four years 298 785 202 663 In more than four years but not more than five years 298 298 218 202 More than five years 1,099 1,397 953 1,171
5,055 6,498 4,150 5,225Less: future finance charges (905) (1,273) — — Present value of lease obligations 4,150 5,225 4,150 5,225 Less: Amount due within one year shown under current liabilities (977) (1,154) Amount due after one year 3,173 4,071
The Group’s obligations under finance leases are secured by charges over the leased assets.
37. Discounted Bills with RecourseBills discounted with banks at an effective interest rate of 1.53% per annum (2012: 1.79% per annum) have maturity profiles of less than 120 days.
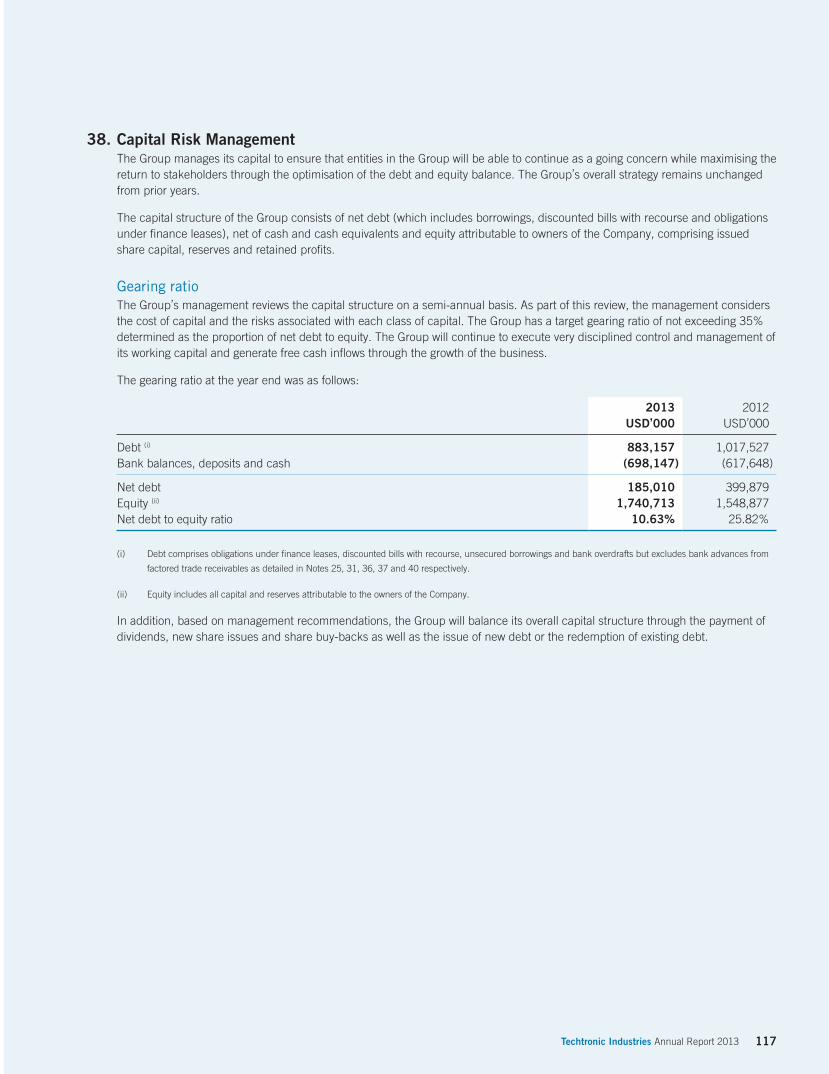
117Techtronic Industries Annual Report 2013
38. Capital Risk Management The Group manages its capital to ensure that entities in the Group will be able to continue as a going concern while maximising the
return to stakeholders through the optimisation of the debt and equity balance. The Group’s overall strategy remains unchanged from prior years.
The capital structure of the Group consists of net debt (which includes borrowings, discounted bills with recourse and obligations under finance leases), net of cash and cash equivalents and equity attributable to owners of the Company, comprising issued share capital, reserves and retained profits.
Gearing ratio The Group’s management reviews the capital structure on a semi-annual basis. As part of this review, the management considers
the cost of capital and the risks associated with each class of capital. The Group has a target gearing ratio of not exceeding 35% determined as the proportion of net debt to equity. The Group will continue to execute very disciplined control and management of its working capital and generate free cash inflows through the growth of the business.
The gearing ratio at the year end was as follows:
2013 2012USD’000 USD’000
Debt (i) 883,157 1,017,527Bank balances, deposits and cash (698,147) (617,648) Net debt 185,010 399,879Equity (ii) 1,740,713 1,548,877Net debt to equity ratio 10.63% 25.82%
(i) Debt comprises obligations under finance leases, discounted bills with recourse, unsecured borrowings and bank overdrafts but excludes bank advances from
factored trade receivables as detailed in Notes 25, 31, 36, 37 and 40 respectively.
(ii) Equity includes all capital and reserves attributable to the owners of the Company.
In addition, based on management recommendations, the Group will balance its overall capital structure through the payment of dividends, new share issues and share buy-backs as well as the issue of new debt or the redemption of existing debt.

Notes to the Consolidated Financial StatementsFor the year ended December 31, 2013
118 Techtronic Industries Annual Report 2013
39. Financial Instruments
39.1 Categories of financial instruments
2013 2012USD’000 USD’000
The GroupFinancial assetsFair value through profit or loss Held-for-trading investments 1,000 5,980 Derivative financial instruments Acquisition right of certain property, plant and equipment 12,647 —Derivative financial instruments – under hedge accounting Foreign currency forward contracts 5,034 49Derivative financial instruments – not under hedge accounting Foreign currency forward contracts 39 5,657
17,720 5,706 Available-for-sale investments 520 1,270 Loans and receivables (including cash and cash equivalents) Trade and other receivables 783,795 688,923 Bills receivable 26,054 48,644 Trade receivables from an associate 2,590 46 Bank balances, deposits and cash 698,147 617,648
1,510,586 1,355,261 Financial liabilitiesDerivative financial instruments – under hedge accounting Foreign currency forward contracts 9,603 1,303Derivative financial instruments – not under hedge accounting Foreign currency forward contracts 277 5,727 Interest rate swap 3,202 4,667
13,082 11,697 Other financial liabilities Trade and other payables 1,039,923 710,491 Bills payable 40,613 39,222 Discounted bills with recourse 116,704 432,633 Unsecured borrowings 829,368 647,582 Bank overdrafts 7,887 7,087
2,034,495 1,837,015
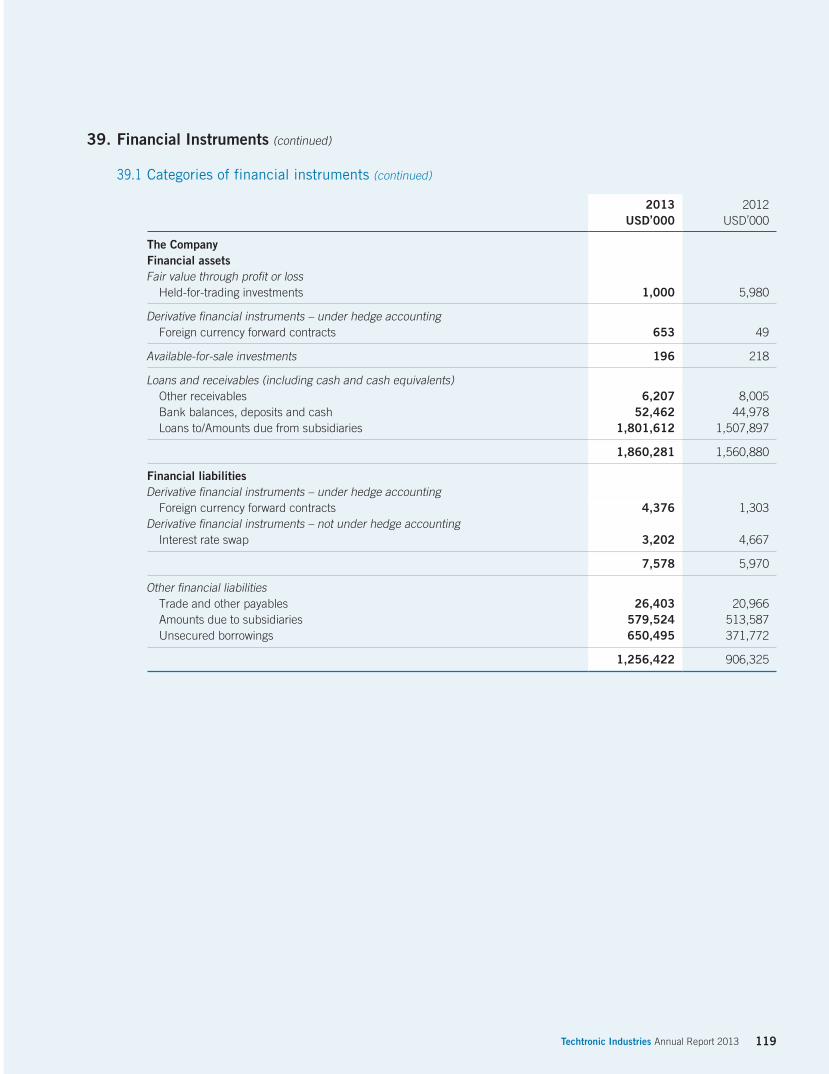
119Techtronic Industries Annual Report 2013
39. Financial Instruments (continued)
39.1 Categories of financial instruments (continued)
2013 2012USD’000 USD’000
The CompanyFinancial assetsFair value through profit or loss Held-for-trading investments 1,000 5,980 Derivative financial instruments – under hedge accounting Foreign currency forward contracts 653 49 Available-for-sale investments 196 218 Loans and receivables (including cash and cash equivalents) Other receivables 6,207 8,005 Bank balances, deposits and cash 52,462 44,978 Loans to/Amounts due from subsidiaries 1,801,612 1,507,897
1,860,281 1,560,880 Financial liabilitiesDerivative financial instruments – under hedge accounting Foreign currency forward contracts 4,376 1,303Derivative financial instruments – not under hedge accounting Interest rate swap 3,202 4,667
7,578 5,970 Other financial liabilities Trade and other payables 26,403 20,966 Amounts due to subsidiaries 579,524 513,587 Unsecured borrowings 650,495 371,772
1,256,422 906,325

Notes to the Consolidated Financial StatementsFor the year ended December 31, 2013
120 Techtronic Industries Annual Report 2013
39. Financial Instruments (continued)
39.2 Financial Risk Management Objectives and PoliciesThe Group’s corporate treasury function provides risk management advice to the business units, co-ordinates access to domestic and international financial markets, monitors and manages the financial risks relating to the operations of the Group through internal risk reports which analyse exposures by degree and magnitude of risks. These financial risks include market risk (including currency risk, interest rate risk and other price risk), credit risk and liquidity risk.
The Group seeks to minimise the effects of these risks by using derivative financial instruments or natural hedges to mitigate these risk exposures. The use of financial derivatives is governed by the Group’s policies approved by the board of directors, which provide written principles on foreign exchange risk, interest rate risk, credit risk, the use of financial derivatives and non-derivative financial instruments, and the investment of excess liquidity. Compliance with policies is reviewed by the internal auditors on a continuous basis. The Group does not enter into or trade derivative financial instruments for speculative purposes.
39.2.1 Foreign Currency Risk ManagementSubsidiaries of the Group have foreign currency sales and purchases, which expose the Group to foreign currency risk. Approximately 24.6% (2012: 24.5%) of the Group’s sales are denominated in currencies other than the functional currency of the group entity making the sale, whilst almost 44.1% (2012: 38.2%) of purchases are denominated in the group entity’s respective functional currency.
The carrying amounts of certain significant foreign currency denominated monetary assets and monetary liabilities at the reporting date are as follows:
Liabilities Assets
2013 2012 2013 2012USD’000 USD’000 USD’000 USD’000
The GroupForeign CurrencyEURO 37,671 31,263 194,941 150,462
Liabilities Assets
2013 2012 2013 2012USD’000 USD’000 USD’000 USD’000
The CompanyForeign CurrencyEURO 23,395 2,485 365,022 344,295
Note: For group entities with their functional currency as the United States dollar, monetary assets and monetary liabilities denominated in Hong Kong
dollars have no material foreign currency risk exposure as the Hong Kong dollar is pegged with the United States dollar.
The Group requires its group entities to use foreign exchange forward contracts to reduce the currency exposure. The foreign exchange forward contracts must be in the same currency as the hedged item. On this basis, the Group has entered into forward contracts in relation to the foreign currency denominated monetary liabilities amounting to USD148,845,000 (2012: USD108,826,000). It is the Group’s policy to negotiate the terms of the hedge derivatives to match the terms of the hedged item to maximise hedge effectiveness (see Note 29 for details).

121Techtronic Industries Annual Report 2013
39. Financial Instruments (continued)
39.2 Financial Risk Management Objectives and Policies (continued)
39.2.1 Foreign Currency Risk Management (continued)
Sensitivity analysisThe Group and the Company are mainly exposed to the effects of rate fluctuations in the EURO to USD.
The following table details the Group’s sensitivity to a 5% increase and decrease in the United States dollar against the EURO without considering the foreign currency forward contracts entered at end of the reporting period. 5% is the sensitivity rate used when reporting foreign currency risk internally to key management personnel and represents management’s assessment of the reasonably possible change in the EURO:USD foreign exchange rate. The sensitivity analysis includes outstanding foreign currency denominated monetary items and excludes the effect of any foreign currency forward contracts held at reporting date. A positive number below indicates an increase in profit for the year where the United States dollar weakens 5% against the EURO.
The Group The Company 2013 2012 2013 2012
USD’000 USD’000 USD’000 USD’000
Impact of EUROProfit for the year (i) 7,037 5,960 15,287 17,091
(i) This is mainly attributable to the exposure outstanding on receivables and payables denominated in EURO at the reporting date.
39.2.2 Interest Rate Risk ManagementThe Group’s and the Company’s cash flow interest rate risk relates primarily to variable-rate borrowing (see Note 40 for details of these borrowings), discounted bills with recourse, bank overdrafts and bank balances and deposits. In relation to these floating-rate borrowings, the Group aims at keeping certain borrowings at fixed rates. In order to achieve this result, the Group enters into interest rate swap contracts to hedge against part of its exposure to potential variability of cash flows arising from changes in floating rates (see Note 29 for details). The management continuously monitors interest rate fluctuations and will consider further hedging interest rate risk should the need arise.
The Group’s and the Company’s exposure to interest rates on financial assets and financial liabilities are detailed in the liquidity risk management section of this note. The Group’s and the Company’s cash flow interest rate risk is mainly concentrated on the fluctuation of London Interbank Offered Rate (“LIBOR”) arising from the Group’s and the Company’s Hong Kong dollar denominated borrowings. In relation to interest bearing bank balances and deposits, the Group considers the interest rate risk is insignificance.
The Group’s fair value interest rate risk related primarily to its fixed-rate bank borrowings (see Note 40 for details of these borrowings). The Company’s fair value interest rate risk related primarily to its loan to subsidiaries (see Note 21).
During the year, the Group obtained new bank borrowings in the amount of USD1,112 million (2012: USD793 million) which are either LIBOR or Hong Kong best lending rates based. The proceeds were used for refinancing the Group’s borrowings including the repayment of fixed interest rate notes of USD39,375,000 and other borrowings.

Notes to the Consolidated Financial StatementsFor the year ended December 31, 2013
122 Techtronic Industries Annual Report 2013
39. Financial Instruments (continued)
39.2 Financial Risk Management Objectives and Policies (continued)
39.2.2 Interest Rate Risk Management (continued)
Sensitivity analysisThe sensitivity analysis below has been determined based on the exposure to interest rates for non-derivative instruments. The analysis is prepared assuming the amount of liability outstanding at the end of the reporting period was outstanding for the whole year without considering the interest rate swaps entered at the end of the reporting period. A 50 basis point increase or decrease in LIBOR is used when reporting interest rate risk internally to key management personnel and represents management’s assessment of the reasonably possible change in interest rates.
If interest rates had been 50 basis points higher/lower and all other variables were held constant, the Group’s profit for the year ended December 31, 2013 would decrease/increase by USD4,293,000 (2012: decrease/increase by USD4,765,000). The Company’s profit for the year ended December 31, 2013 would decrease/increase by USD3,252,000 (2012: decrease/increase by USD1,859,000). This is mainly attributable to the Group’s and the Company’s exposure to interest rates on its variable-rate borrowings.
The Group’s and the Company’s sensitivity to interest rates has decreased and increased during the current period mainly due to the decrease and increase in variable rate debt instruments respectively.
39.2.3 Other Price RiskThe Group and the Company are exposed to price risk through its held-for-trading investments and derivative financial instruments.
Sensitivity analysisThe sensitivity analysis below has been determined based on the exposure to price risks of equity investments held-for-trading measured at fair value at the reporting date.
If the prices of the respective equity instruments had been 10% higher/lower the profit for the year ended December 31, 2013 of the Group and the Company would increase/decrease by USD100,000 (2012: USD598,000) and USD100,000 (2012: USD598,000) as a result of the changes in fair value of held-for-trading investments.
39.2.4 Credit Risk ManagementAs at December 31, 2013, the Group’s and the Company’s maximum exposure to credit risk which will cause a financial loss to the Group and the Company due to failure to discharge an obligation by the counterparties and financial guarantees provided by the Group and the Company is arising from:
• the carrying amount of the respective recognised financial assets as stated in the statements of financial position; and
• the amount of contingent liabilities in relation to financial guarantees issued by the Group and the Company as disclosed in Note 48.

123Techtronic Industries Annual Report 2013
39. Financial Instruments (continued)
39.2 Financial Risk Management Objectives and Policies (continued)
39.2.4 Credit Risk Management (continued)
In order to minimise the credit risk, the management has delegated a team responsible for determination of credit limits, credit approvals and other monitoring procedures to ensure that follow-up action is taken to recover overdue debts. In addition, the Group and the Company review the recoverable amount of each individual trade debt and debt investments at each reporting date to ensure that adequate impairment losses are made for irrecoverable amounts. In this regard, the directors of the Company consider that the Group’s and the Company’s credit risk is significantly reduced.
The credit risk on liquid funds is limited because the counterparties are banks with good reputations and credit ratings.
The Group’s concentration of credit risk by geographical location is mainly in North America, where 62.7% (2012: 65.7%) of the total trade receivables as at December 31, 2013 are located.
The Group has concentration of credit risk at 43.4% (2012: 23.7%) and 57.4% (2012: 36.8%) of the total trade receivables were due from the Group’s largest customer and the five largest customers respectively.
39.2.5 Liquidity Risk Management Ultimate responsibility for liquidity risk management rests with the board of directors which has built an appropriate
liquidity risk management framework for the management of the Group’s short, medium and long-term funding and liquidity management requirements. The Group manages liquidity risk by maintaining adequate reserves, banking facilities and reserve borrowing facilities, by continuously monitoring forecast and actual cash flows and matching the maturity profiles of financial assets and liabilities.
As at December 31, 2013, the Group has available unutilised overdrafts and short and medium term bank loan facilities of approximately USD67 million (2012: USD65 million) and USD1,824 million (2012: USD1,290 million) respectively.
Liquidity tables The following tables detail the Group’s remaining contractual maturity for its non-derivative financial liabilities as well
as non-derivative financial assets which are included in the maturity analysis. For non-derivative financial assets, the tables have been drawn up based on the contractual maturities of the undiscounted cash flow of the financial assets unless specified separately. For non-derivative financial liabilities, the tables reflect the undiscounted cash flow of financial liabilities based on the earliest date on which the Group can be required to pay. The table includes both interest and principal cash flows. To the extent that the interest flows are floating rate, the undiscounted amount is derived from the interest rate curve at the end of the reporting period. The inclusion of information on non-derivative financial assets is necessary in order to understand the Group’s liquidity risk management as the liquidity is managed on a net asset and liability basis.
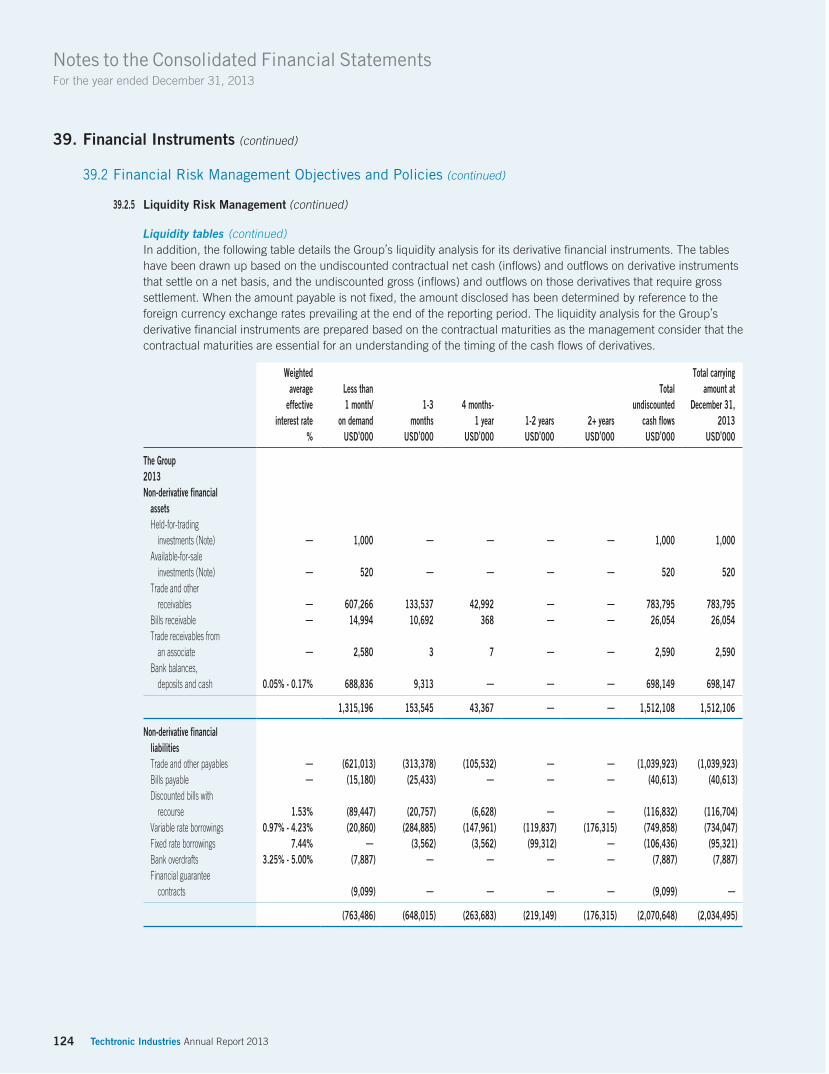
Notes to the Consolidated Financial StatementsFor the year ended December 31, 2013
124 Techtronic Industries Annual Report 2013
39. Financial Instruments (continued)
39.2 Financial Risk Management Objectives and Policies (continued)
39.2.5 Liquidity Risk Management (continued)
Liquidity tables (continued)In addition, the following table details the Group’s liquidity analysis for its derivative financial instruments. The tables have been drawn up based on the undiscounted contractual net cash (inflows) and outflows on derivative instruments that settle on a net basis, and the undiscounted gross (inflows) and outflows on those derivatives that require gross settlement. When the amount payable is not fixed, the amount disclosed has been determined by reference to the foreign currency exchange rates prevailing at the end of the reporting period. The liquidity analysis for the Group’s derivative financial instruments are prepared based on the contractual maturities as the management consider that the contractual maturities are essential for an understanding of the timing of the cash flows of derivatives.
Weighted Total carryingaverage Less than Total amount at
effective 1 month/ 1-3 4 months- undiscounted December 31,interest rate on demand months 1 year 1-2 years 2+ years cash flows 2013
% USD’000 USD’000 USD’000 USD’000 USD’000 USD’000 USD’000 The Group2013Non-derivative financial assets Held-for-trading investments (Note) — 1,000 — — — — 1,000 1,000 Available-for-sale investments (Note) — 520 — — — — 520 520 Trade and other receivables — 607,266 133,537 42,992 — — 783,795 783,795 Bills receivable — 14,994 10,692 368 — — 26,054 26,054 Trade receivables from an associate — 2,580 3 7 — — 2,590 2,590 Bank balances, deposits and cash 0.05% - 0.17% 688,836 9,313 — — — 698,149 698,147
1,315,196 153,545 43,367 — — 1,512,108 1,512,106 Non-derivative financial liabilities Trade and other payables — (621,013) (313,378) (105,532) — — (1,039,923) (1,039,923) Bills payable — (15,180) (25,433) — — — (40,613) (40,613) Discounted bills with recourse 1.53% (89,447) (20,757) (6,628) — — (116,832) (116,704) Variable rate borrowings 0.97% - 4.23% (20,860) (284,885) (147,961) (119,837) (176,315) (749,858) (734,047) Fixed rate borrowings 7.44% — (3,562) (3,562) (99,312) — (106,436) (95,321) Bank overdrafts 3.25% - 5.00% (7,887) — — — — (7,887) (7,887) Financial guarantee contracts (9,099) — — — — (9,099) —
(763,486) (648,015) (263,683) (219,149) (176,315) (2,070,648) (2,034,495)
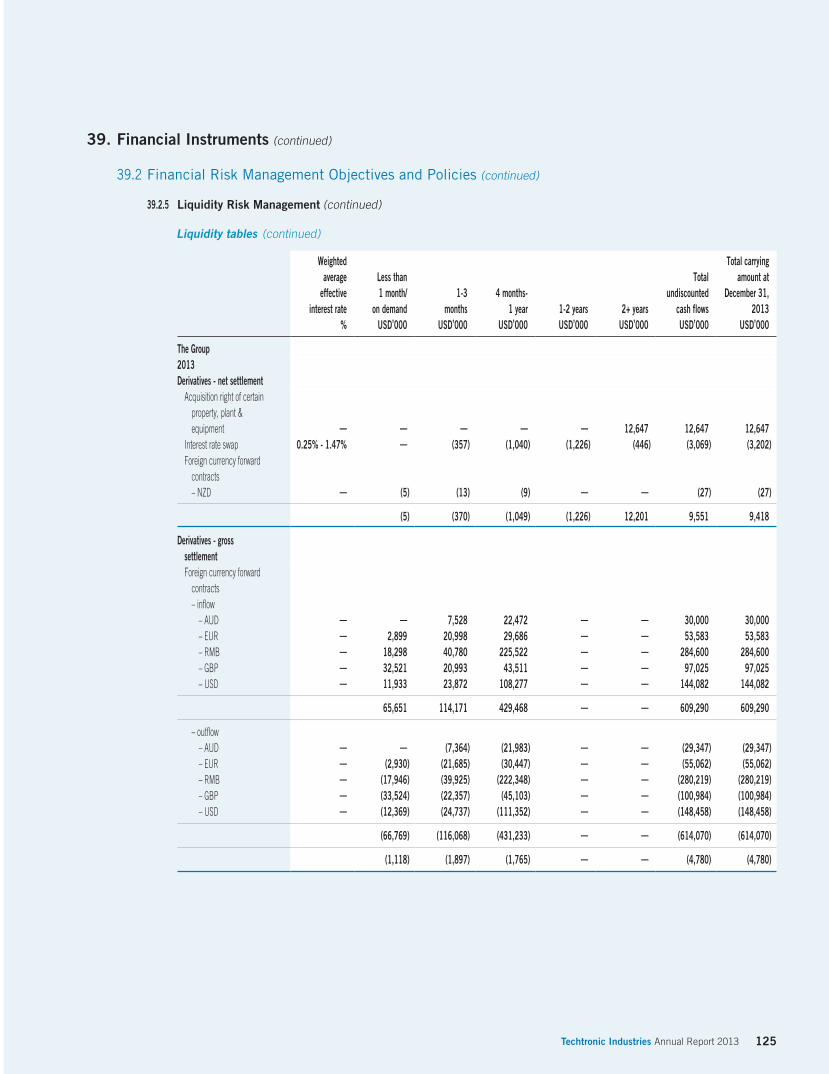
125Techtronic Industries Annual Report 2013
39. Financial Instruments (continued)
39.2 Financial Risk Management Objectives and Policies (continued)
39.2.5 Liquidity Risk Management (continued)
Liquidity tables (continued)
Weighted Total carryingaverage Less than Total amount at
effective 1 month/ 1-3 4 months- undiscounted December 31,interest rate on demand months 1 year 1-2 years 2+ years cash flows 2013
% USD’000 USD’000 USD’000 USD’000 USD’000 USD’000 USD’000 The Group2013Derivatives - net settlement Acquisition right of certain property, plant & equipment — — — — — 12,647 12,647 12,647 Interest rate swap 0.25% - 1.47% — (357) (1,040) (1,226) (446) (3,069) (3,202) Foreign currency forward contracts – NZD — (5) (13) (9) — — (27) (27)
(5) (370) (1,049) (1,226) 12,201 9,551 9,418 Derivatives - gross settlement Foreign currency forward contracts – inflow – AUD — — 7,528 22,472 — — 30,000 30,000 – EUR — 2,899 20,998 29,686 — — 53,583 53,583 – RMB — 18,298 40,780 225,522 — — 284,600 284,600 – GBP — 32,521 20,993 43,511 — — 97,025 97,025 – USD — 11,933 23,872 108,277 — — 144,082 144,082
65,651 114,171 429,468 — — 609,290 609,290 – outflow – AUD — — (7,364) (21,983) — — (29,347) (29,347) – EUR — (2,930) (21,685) (30,447) — — (55,062) (55,062) – RMB — (17,946) (39,925) (222,348) — — (280,219) (280,219) – GBP — (33,524) (22,357) (45,103) — — (100,984) (100,984) – USD — (12,369) (24,737) (111,352) — — (148,458) (148,458)
(66,769) (116,068) (431,233) — — (614,070) (614,070)
(1,118) (1,897) (1,765) — — (4,780) (4,780)

Notes to the Consolidated Financial StatementsFor the year ended December 31, 2013
126 Techtronic Industries Annual Report 2013
39. Financial Instruments (continued)
39.2 Financial Risk Management Objectives and Policies (continued)
39.2.5 Liquidity Risk Management (continued)
Liquidity tables (continued)
Weightedaverageeffective
interest rate
Less than 1 month/
on demand1-3
months4 months-
1 year 1-2 years 2+ years
Totalundiscounted
cash flows
Total carryingamount at
December 31,2012
% USD’000 USD’000 USD’000 USD’000 USD’000 USD’000 USD’000
The Group2012Non-derivative financial assets Held-for-trading investments (Note) — 5,980 — — — — 5,980 5,980 Available-for-sale investments (Note) — 1,270 — — — — 1,270 1,270 Trade and other receivables — 322,801 315,498 50,624 — — 688,923 688,923 Bills receivable — 35,369 12,883 392 — — 48,644 48,644 Trade receivables from an associate — 18 14 14 — — 46 46 Bank balances, deposits and cash 0.10% - 0.27% 525,119 92,548 — — — 617,667 617,648
890,557 420,943 51,030 — — 1,362,530 1,362,511 Non-derivative financial liabilities Trade and other payables — (473,782) (204,800) (31,909) — — (710,491) (710,491) Bills payable — (9,580) (29,508) (134) — — (39,222) (39,222) Discounted bills with recourse 1.79% (160,018) (162,816) (111,598) — — (434,432) (432,633) Variable rate borrowings 1.01% - 4.36% (98,321) (110,793) (48,294) (162,150) (104,738) (524,296) (513,375) Fixed rate borrowings 6.70% - 7.44% — (3,562) (44,256) (7,124) (99,312) (154,254) (134,207) Bank overdrafts 3.25% - 5.00% (7,087) — — — — (7,087) (7,087) Financial guarantee contracts — (12,691) — — — — (12,691) —
(761,479) (511,479) (236,191) (169,274) (204,050) (1,882,473) (1,837,015)

127Techtronic Industries Annual Report 2013
39. Financial Instruments (continued)
39.2 Financial Risk Management Objectives and Policies (continued)
39.2.5 Liquidity Risk Management (continued)
Liquidity tables (continued)
Weightedaverageeffective
interest rate
Less than 1 month/
on demand1-3
months4 months-
1 year 1-2 years 2+ years
Totalundiscounted
cash flows
Total carryingamount at
December 31,2012
% USD’000 USD’000 USD’000 USD’000 USD’000 USD’000 USD’000
Derivatives - net settlement Interest rate swap 0.76% - 2.63% — (491) (1,462) (1,334) (1,745) (5,032) (4,667) Foreign currency forward contracts – RMB — (303) (531) (2,986) — — (3,820) (3,820) – AUD — — 39 — — — 39 39 – NZD — — (10) — — — (10) (10)
(303) (993) (4,448) (1,334) (1,745) (8,823) (8,458) Derivatives - gross settlement Foreign currency forward contracts – inflow – EUR — 2,312 14,621 25,841 — — 42,774 42,774 – RMB — 17,417 34,753 142,449 — — 194,619 194,619 – GBP — 7,750 11,500 52,750 — — 72,000 72,000 – USD — — 29,088 78,483 — — 107,571 107,571
27,479 89,962 299,523 — — 416,964 416,964 – outflow – EUR — (2,355) (15,222) (26,309) — — (43,886) (43,886) – RMB — (17,000) (34,000) (138,000) — — (189,000) (189,000) – GBP — (7,834) (11,804) (53,148) — — (72,786) (72,786) – USD — — (29,680) (79,145) — — (108,825) (108,825)
(27,189) (90,706) (296,602) — — (414,497) (414,497)
290 (744) 2,921 — — 2,467 2,467

Notes to the Consolidated Financial StatementsFor the year ended December 31, 2013
128 Techtronic Industries Annual Report 2013
39. Financial Instruments (continued)
39.2 Financial Risk Management Objectives and Policies (continued)
39.2.5 Liquidity Risk Management (continued)
Liquidity tables (continued)
Weightedaverage
effectiveinterest rate
Less than1 month/
on demand1-3
months4 months-
1 year 1-2 years 2+ years
Totalundiscounted
cash flows
Total carryingamount at
December 31,2013
% USD’000 USD’000 USD’000 USD’000 USD’000 USD’000 USD’000 The Company2013Non-derivative financial assets Held-for-trading investments (Note) — 1,000 — — — — 1,000 1,000 Available-for-sale investments (Note) — 196 — — — — 196 196 Other receivables — 5 — 6,202 — — 6,207 6,207 Bank balances, deposits and cash 0.05% - 0.17% 52,462 — — — — 52,462 52,462 Loan to/Amounts due from subsidiaries (Note) 5.28% - 10.15% 8,551 8,311 1,274,486 49,865 1,312,182 2,653,395 1,801,612
62,214 8,311 1,280,688 49,865 1,312,182 2,713,260 1,861,477 Non-derivative financial liabilities Trade and other payables — (2,519) (4,518) (19,366) — — (26,403) (26,403) Amounts due to subsidiaries — — — (579,524) — — (579,524) (579,524) Unsecured borrowings 1.87% - 2.70% (26,896) (284,574) (61,722) (116,923) (172,657) (662,772) (650,495) Financial guarantee contracts — (128,574) (60,063) (69,217) (38,128) (57,193) (353,175) —
(157,989) (349,155) (729,829) (155,051) (229,850) (1,621,874) (1,256,422)

129Techtronic Industries Annual Report 2013
39. Financial Instruments (continued)
39.2 Financial Risk Management Objectives and Policies (continued)
39.2.5 Liquidity Risk Management (continued)
Liquidity tables (continued)
Weightedaverage
effectiveinterest rate
Less than1 month/
on demand1-3
months4 months-
1 year 1-2 years 2+ years
Totalundiscounted
cash flows
Total carryingamount at
December 31,2013
% USD’000 USD’000 USD’000 USD’000 USD’000 USD’000 USD’000 Derivatives - net settlement Interest rate swap 0.25% - 1.47% — (357) (1,040) (1,226) (446) (3,069) (3,202)
— (357) (1,040) (1,226) (446) (3,069) (3,202) Derivatives - gross settlement Foreign currency forward contracts – inflow – USD — 11,933 23,872 108,277 — — 144,082 144,082 – AUD — — 7,528 22,472 — — 30,000 30,000
11,933 31,400 130,749 — — 174,082 174,082 – outflow – USD — (12,369) (24,737) (111,352) — — (148,458) (148,458) – AUD — — (7,364) (21,983) — — (29,347) (29,347)
(12,369) (32,101) (133,335) — — (177,805) (177,805)
(436) (701) (2,586) — — (3,723) (3,723)

Notes to the Consolidated Financial StatementsFor the year ended December 31, 2013
130 Techtronic Industries Annual Report 2013
39. Financial Instruments (continued)
39.2 Financial Risk Management Objectives and Policies (continued)
39.2.5 Liquidity Risk Management (continued)
Liquidity tables (continued)
Weightedaverageeffective
interest rate
Less than1 month/
on demand1-3
months4 months-
1 year 1-2 years 2+ years
Totalundiscounted
cash flows
Total carryingamount at
December 31,2012
% USD’000 USD’000 USD’000 USD’000 USD’000 USD’000 USD’000
The Company2012Non-derivative financial assets Held-for-trading investments (Note) — 5,980 — — — — 5,980 5,980 Available-for-sale investments (Note) — 218 — — — — 218 218 Trade and other receivables — 100 350 7,555 — — 8,005 8,005 Bank balances, deposits and cash 0.10% - 0.27% 44,978 — — — — 44,978 44,978 Loan to/Amounts due from subsidiaries (Note) 5.28% - 10.15% 4,115 8,231 998,513 49,383 1,340,310 2,400,552 1,507,897
55,391 8,581 1,006,068 49,383 1,340,310 2,459,733 1,567,078 Non-derivative financial liabilities Trade and other payables — (2,308) (3,644) (15,014) — — (20,966) (20,966) Amounts due to subsidiaries — — — (513,587) — — (513,587) (513,587) Unsecured borrowings 1.81% - 2.76% — (73,078) (45,911) (157,876) (103,943) (380,808) (371,772) Financial guarantee contracts — (293,741) (229,079) (149,680) — (94,943) (767,443) —
(296,049) (305,801) (724,192) (157,876) (198,886) (1,682,804) (906,325)
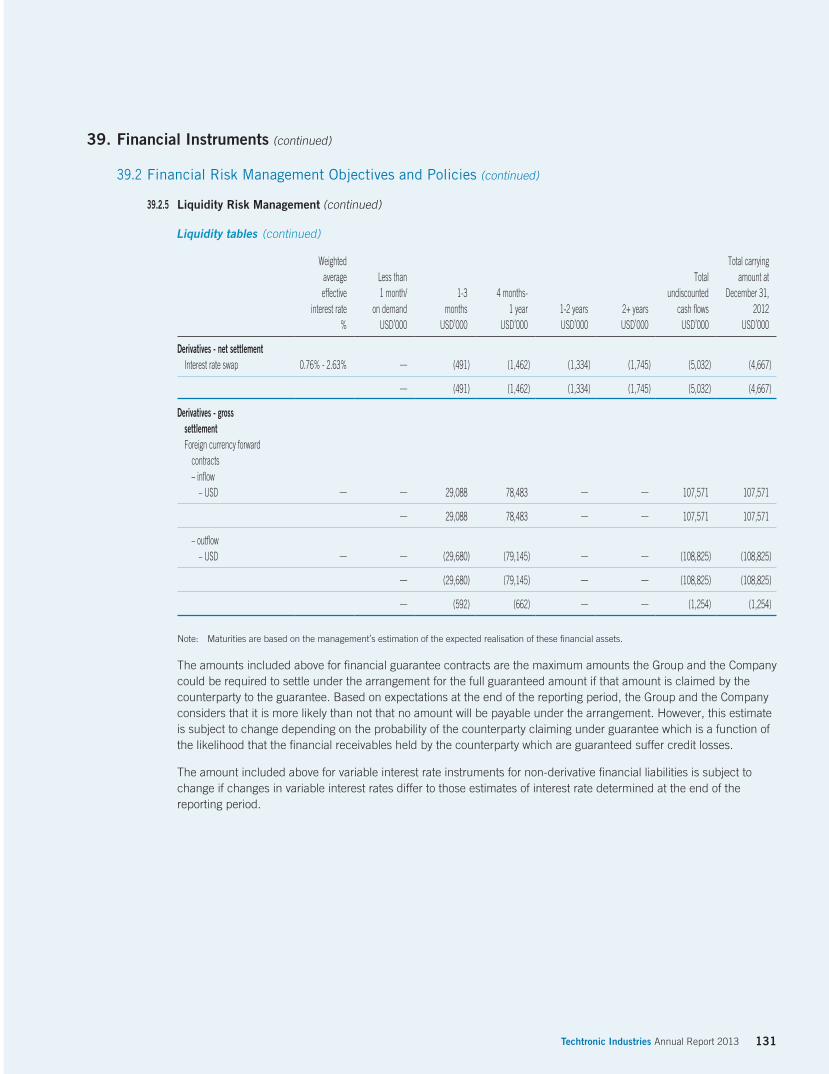
131Techtronic Industries Annual Report 2013
39. Financial Instruments (continued)
39.2 Financial Risk Management Objectives and Policies (continued)
39.2.5 Liquidity Risk Management (continued)
Liquidity tables (continued)
Weightedaverageeffective
interest rate
Less than1 month/
on demand1-3
months4 months-
1 year 1-2 years 2+ years
Totalundiscounted
cash flows
Total carryingamount at
December 31,2012
% USD’000 USD’000 USD’000 USD’000 USD’000 USD’000 USD’000
Derivatives - net settlement Interest rate swap 0.76% - 2.63% — (491) (1,462) (1,334) (1,745) (5,032) (4,667)
— (491) (1,462) (1,334) (1,745) (5,032) (4,667) Derivatives - gross settlement Foreign currency forward contracts – inflow – USD — — 29,088 78,483 — — 107,571 107,571
— 29,088 78,483 — — 107,571 107,571 – outflow – USD — — (29,680) (79,145) — — (108,825) (108,825)
— (29,680) (79,145) — — (108,825) (108,825)
— (592) (662) — — (1,254) (1,254)
Note: Maturities are based on the management’s estimation of the expected realisation of these financial assets.
The amounts included above for financial guarantee contracts are the maximum amounts the Group and the Company could be required to settle under the arrangement for the full guaranteed amount if that amount is claimed by the counterparty to the guarantee. Based on expectations at the end of the reporting period, the Group and the Company considers that it is more likely than not that no amount will be payable under the arrangement. However, this estimate is subject to change depending on the probability of the counterparty claiming under guarantee which is a function of the likelihood that the financial receivables held by the counterparty which are guaranteed suffer credit losses.
The amount included above for variable interest rate instruments for non-derivative financial liabilities is subject to change if changes in variable interest rates differ to those estimates of interest rate determined at the end of the reporting period.

Notes to the Consolidated Financial StatementsFor the year ended December 31, 2013
132 Techtronic Industries Annual Report 2013
39. Financial Instruments (continued)
39.3 Fair ValueThe fair value of financial assets and financial liabilities are determined as follows:
• the fair value of foreign currency forward contracts are measured using quoted forward exchange rates and yield curves derived from quoted interest rates matching the maturities of the contract;
• the fair value of the interest rate swap is measured at the present value of future cash flows estimated and discounted based on the applicable yield curves derived from noted interest rate;
• the fair value of financial assets with standard terms and conditions and traded on active liquid markets are determined with reference to quoted market bid prices; and
• the fair value of other financial assets and financial liabilities (excluding derivative instruments) are determined in accordance with generally accepted pricing models based on discounted cash flow analysis using prices from observable current market transactions.
The fair value of financial assets and financial liabilities carried at amortised cost approximate their carrying amounts.
Fair value measurements recognised in the statement of financial positionFair value of the Group’s financial assets and financial liabilities are measured on a recurring basis:
Some of the Group’s financial assets and financial liabilities are measured at fair value at the end of each reporting period. The following table gives information about how the fair values of these financial assets and financial liabilities are determined (in particular, the valuation technique(s) and inputs used), as well as the level of the fair value hierarchy into which the fair value measurements are categorised (Levels 1 to 3) based on the degree to which the inputs to the fair value measurements is observable.
• Level 1: fair value measurements are those derived from quoted prices (unadjusted) in active markets for identical assets or liabilities;
• Level 2: fair value measurements are those derived from inputs, other than quoted prices included within Level 1, that are observable for the asset or liability, either directly (i.e. as prices) or indirectly (i.e. derived from prices); and
• Level 3: fair value measurements are those derived from valuation techniques that include inputs for the asset or liability that are not based on observable market data (unobservable inputs).
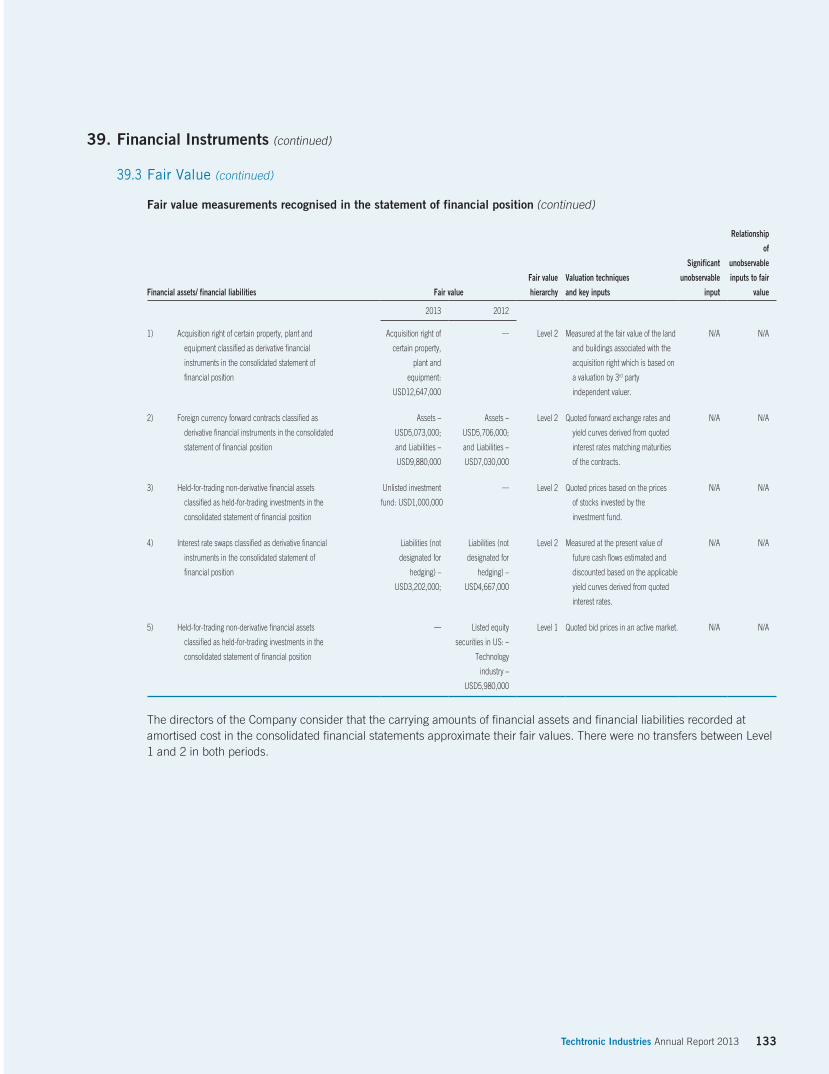
133Techtronic Industries Annual Report 2013
39. Financial Instruments (continued)
39.3 Fair Value (continued)
Fair value measurements recognised in the statement of financial position (continued)
Financial assets/ financial liabilities Fair value
Fair value
hierarchy
Valuation techniques
and key inputs
Significant
unobservable
input
Relationship
of
unobservable
inputs to fair
value 2013 2012
1) Acquisition right of certain property, plant and
equipment classified as derivative financial
instruments in the consolidated statement of
financial position
Acquisition right of
certain property,
plant and
equipment:
USD12,647,000
— Level 2 Measured at the fair value of the land
and buildings associated with the
acquisition right which is based on
a valuation by 3rd party
independent valuer.
N/A N/A
2) Foreign currency forward contracts classified as
derivative financial instruments in the consolidated
statement of financial position
Assets –
USD5,073,000;
and Liabilities –
USD9,880,000
Assets –
USD5,706,000;
and Liabilities –
USD7,030,000
Level 2 Quoted forward exchange rates and
yield curves derived from quoted
interest rates matching maturities
of the contracts.
N/A N/A
3) Held-for-trading non-derivative financial assets
classified as held-for-trading investments in the
consolidated statement of financial position
Unlisted investment
fund: USD1,000,000
— Level 2 Quoted prices based on the prices
of stocks invested by the
investment fund.
N/A N/A
4) Interest rate swaps classified as derivative financial
instruments in the consolidated statement of
financial position
Liabilities (not
designated for
hedging) –
USD3,202,000;
Liabilities (not
designated for
hedging) –
USD4,667,000
Level 2 Measured at the present value of
future cash flows estimated and
discounted based on the applicable
yield curves derived from quoted
interest rates.
N/A N/A
5) Held-for-trading non-derivative financial assets
classified as held-for-trading investments in the
consolidated statement of financial position
— Listed equity
securities in US: –
Technology
industry –
USD5,980,000
Level 1 Quoted bid prices in an active market. N/A N/A
The directors of the Company consider that the carrying amounts of financial assets and financial liabilities recorded at amortised cost in the consolidated financial statements approximate their fair values. There were no transfers between Level 1 and 2 in both periods.

Notes to the Consolidated Financial StatementsFor the year ended December 31, 2013
134 Techtronic Industries Annual Report 2013
39. Financial Instruments (continued)
39.3 Fair Value (continued)
Fair value measurements recognised in the statement of financial position (continued)
Level 1 Level 2 TotalUSD’000 USD’000 USD’000
The Group2013Financial assetsAcquisition right of certain property, plant and equipment — 12,647 12,647Foreign currency forward contracts — 5,073 5,073Held-for-trading investments — 1,000 1,000 Total — 18,720 18,720 Financial liabilitiesForeign currency forward contracts — (9,880) (9,880)Interest rate swap — (3,202) (3,202) Total — (13,082) (13,082) 2012Financial assetsForeign currency forward contracts — 5,706 5,706Held-for-trading investments 5,980 — 5,980 Total 5,980 5,706 11,686 Financial liabilitiesForeign currency forward contracts — (7,030) (7,030)Interest rate swap — (4,667) (4,667) Total — (11,697) (11,697)

135Techtronic Industries Annual Report 2013
39. Financial Instruments (continued)
39.3 Fair Value (continued)
Fair value measurements recognised in the statement of financial position (continued)
Level 1 Level 2 TotalUSD’000 USD’000 USD’000
The Company2013Financial assetsForeign currency forward contracts — 653 653Held-for-trading investments — 1,000 1,000 Total — 1,653 1,653 Financial liabilitiesForeign currency forward contracts — (4,376) (4,376)Interest rate swap — (3,202) (3,202) Total — (7,578) (7,578) 2012Financial assetsForeign currency forward contracts — 49 49Held-for-trading investments 5,980 — 5,980 Total 5,980 49 6,029 Financial liabilitiesForeign currency forward contracts — (1,303) (1,303)Interest rate swap — (4,667) (4,667) Total — (5,970) (5,970)
39.4 Transfer of financial assetsThe following were the Group’s financial assets as at December 31, 2013 that were transferred to banks by discounting or factoring those trade and bills receivables on a full recourse basis. As the Group has not transferred the significant risks and rewards relating to these receivables, it continues to recognise the full carrying amount of the receivables and has recognised the cash received on the transfer as discounted bills with recourse (see Note 37) and unsecured borrowings - due within one year (see Note 40). These financial assets are carried at amortised cost in the Group’s consolidated statement of financial position.
The trade and bills receivable discounted with banks with full recourse at the year end was as follows:
2013 2012USD’000 USD’000
Carrying amount of transferred assets 191,656 507,633Carrying amount of associated liabilities (191,656) (507,633) Net position — —

Notes to the Consolidated Financial StatementsFor the year ended December 31, 2013
136 Techtronic Industries Annual Report 2013
40. Unsecured Borrowings
The Group The Company 2013 2012 2013 2012
USD’000 USD’000 USD’000 USD’000
Trust receipt loans — 1,050 — —Bank advance from factored trade receivables 74,952 75,000 — —Bank loans 659,095 437,325 650,495 371,772 Bank borrowings 734,047 513,375 650,495 371,772Fixed interest rate notes (Note) 95,321 134,207 — — Total borrowings 829,368 647,582 650,495 371,772
The borrowings of the Group and the Company are repayable as follows:
The Group The Company 2013 2012 2013 2012
USD’000 USD’000 USD’000 USD’000
Fixed rateWithin one year — 39,264 — —In more than one year but not more than two years 95,321 — — —In more than two years but not more than five years — 94,943 — —Floating rateWithin one year 454,624 259,626 371,072 118,023In more than one year but not more than two years 113,730 144,785 113,730 144,785In more than two years but not more than five years 165,693 108,964 165,693 108,964
829,368 647,582 650,495 371,772
Less: Amount due within one year shown under current liabilities (454,624) (298,890) (371,072) (118,023) Amount due after one year 374,744 348,692 279,423 253,749
The ranges of effective interest rates (which are also equal to contracted interest rates) on the Group’s borrowings are as follows:
2013 2012
Effective interest rate: Fixed-rate borrowings 7.44% 6.70% to 7.44% Variable-rate borrowings 0.97% to 4.23% 1.01% to 4.36%
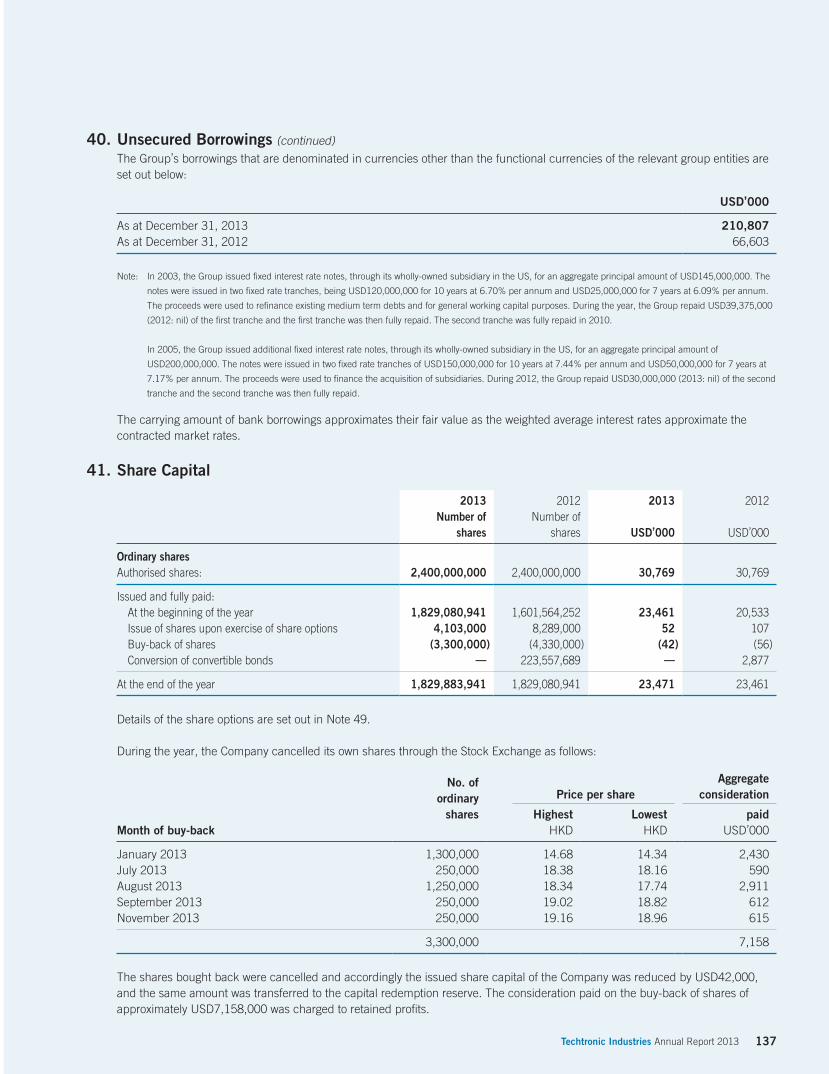
137Techtronic Industries Annual Report 2013
40. Unsecured Borrowings (continued)
The Group’s borrowings that are denominated in currencies other than the functional currencies of the relevant group entities are set out below:
USD’000
As at December 31, 2013 210,807As at December 31, 2012 66,603
Note: In 2003, the Group issued fixed interest rate notes, through its wholly-owned subsidiary in the US, for an aggregate principal amount of USD145,000,000. The
notes were issued in two fixed rate tranches, being USD120,000,000 for 10 years at 6.70% per annum and USD25,000,000 for 7 years at 6.09% per annum.
The proceeds were used to refinance existing medium term debts and for general working capital purposes. During the year, the Group repaid USD39,375,000
(2012: nil) of the first tranche and the first tranche was then fully repaid. The second tranche was fully repaid in 2010.
In 2005, the Group issued additional fixed interest rate notes, through its wholly-owned subsidiary in the US, for an aggregate principal amount of
USD200,000,000. The notes were issued in two fixed rate tranches of USD150,000,000 for 10 years at 7.44% per annum and USD50,000,000 for 7 years at
7.17% per annum. The proceeds were used to finance the acquisition of subsidiaries. During 2012, the Group repaid USD30,000,000 (2013: nil) of the second
tranche and the second tranche was then fully repaid.
The carrying amount of bank borrowings approximates their fair value as the weighted average interest rates approximate the contracted market rates.
41. Share Capital
2013 2012 2013 2012Number of
sharesNumber of
shares USD’000 USD’000
Ordinary sharesAuthorised shares: 2,400,000,000 2,400,000,000 30,769 30,769 Issued and fully paid: At the beginning of the year 1,829,080,941 1,601,564,252 23,461 20,533 Issue of shares upon exercise of share options 4,103,000 8,289,000 52 107 Buy-back of shares (3,300,000) (4,330,000) (42) (56) Conversion of convertible bonds — 223,557,689 — 2,877 At the end of the year 1,829,883,941 1,829,080,941 23,471 23,461
Details of the share options are set out in Note 49.
During the year, the Company cancelled its own shares through the Stock Exchange as follows:
No. ofordinary
shares
Price per shareAggregate
consideration Highest Lowest paid
Month of buy-back HKD HKD USD’000
January 2013 1,300,000 14.68 14.34 2,430July 2013 250,000 18.38 18.16 590August 2013 1,250,000 18.34 17.74 2,911September 2013 250,000 19.02 18.82 612November 2013 250,000 19.16 18.96 615
3,300,000 7,158
The shares bought back were cancelled and accordingly the issued share capital of the Company was reduced by USD42,000, and the same amount was transferred to the capital redemption reserve. The consideration paid on the buy-back of shares of approximately USD7,158,000 was charged to retained profits.

138 Techtronic Industries Annual Report 2013
Notes to the Consolidated Financial StatementsFor the year ended December 31, 2013
42. Reserves
EmployeeCapital Convertible share-based
Share redemption bonds equity compensation Hedging Retainedpremium reserve reserve reserve reserve profits TotalUSD’000 USD’000 USD’000 USD’000 USD’000 USD’000 USD’000
The CompanyAt January 1, 2012 460,372 127 8,833 6,608 — 504,080 980,020Loss for the year — — — — — (17,142) (17,142)Fair value loss on foreign currency forward contracts in hedge accounting — — — — (1,254) — (1,254) Other comprehensive loss for the year — — — — (1,254) — (1,254) Total comprehensive loss for the year — — — — (1,254) (17,142) (18,396) Shares issued at premium on exercise of options 9,388 — — (1,772) — — 7,616Buy-back of shares — 56 — — — (5,653) (5,597)Recognition of equity settled share-based payments — — — 578 — — 578Lapse of share options — — — (2,201) — 2,201 —Conversion of convertible bonds 143,330 — (8,833) — — — 134,497Final dividend - 2011 — — — — — (18,185) (18,185)Interim dividend - 2012 — — — — — (15,838) (15,838) At December 31, 2012 613,090 183 — 3,213 (1,254) 449,463 1,064,695Loss for the year — — — — — (4,715) (4,715)Fair value loss on foreign currency forward contracts in hedge accounting — — — — (2,470) — (2,470) Other comprehensive loss for the year — — — — (2,470) — (2,470) Total comprehensive loss for the year — — — — (2,470) (4,715) (7,185) Shares issued at premium on exercise of options 4,473 — — (840) — — 3,633Buy-back of shares — 42 — — — (7,158) (7,116)Recognition of equity settled share-based payments — — — 366 — — 366Lapse of share options — — — (6) — 6 —Final dividend - 2012 — — — — — (25,330) (25,330)Interim dividend - 2013 — — — — — (23,554) (23,554) At December 31, 2013 617,563 225 — 2,733 (3,724) 388,712 1,005,509
As at December 31, 2013, the Company’s reserves available for distribution to shareholders comprised the retained profits of USD388,712,000 (2012: USD449,463,000).

139Techtronic Industries Annual Report 2013
43. Retirement Benefit Obligations
Defined Contribution Plans:The Company and its subsidiaries operating in Hong Kong have participated in the Mandatory Provident Fund Schemes (“MPF Schemes”) registered under the Mandatory Provident Fund Ordinance since December 2000. The assets of the MPF Schemes are held separately from those of the Group, in funds under the control of trustees. The Group contributes 5% of relevant payroll cost to the MPF Schemes with maximum amount of HKD15,000 (2012: HKD13,750) per employee per annum, which contribution is matched by the employee.
The employees of the Group’s subsidiaries in the PRC are members of a state-managed retirement benefit scheme operated by the PRC government. The subsidiaries are required to contribute a specified percentage of payroll costs to the retirement benefit scheme to fund the benefits. The only obligation of the Group with respect to the retirement benefit scheme is to make the specified contributions.
The Group’s overseas subsidiaries operate a number of defined contribution schemes. Contributions to the defined contribution schemes applicable to each year are made at a certain percentage of the employees’ payroll.
The total expense recognised in profit or loss of USD2,506,000 (2012: USD4,733,000) represents contributions payable to these plans by the Group at rates specified in the rules of the plans.
Defined Benefits Plans:The Group operates several defined benefit plans for qualifying employees of its subsidiaries in Germany and the US, of which these plans cover substantially all remaining employees that are not covered by defined contribution plans. The defined benefit plan is administered by a separate fund that is legally separated from the Group. The board of the pension fund is composed of an equal number of representatives from both employers and (former) employees. The board of the pension fund is required by law and by its articles of association to act in the interest of the fund and of all relevant stakeholders in the scheme, i.e. active employees, inactive employees, retirees, employers. The board of the pension fund is responsible for the investment policy with regard to the assets of the fund. The major defined benefit plans are as follows:
2013 2012USD’000 USD’000
Pension plan obligations (Note i) 95,476 82,588Post-retirement, medical and dental plan obligations (Note ii) 383 602Life and medical insurance plan (Note ii) 1,549 1,861Post-employment benefit plan obligations (Note iii) 7,694 7,862Others 1,194 409
106,296 93,322
Note i: Pension plan obligations
The pension plan obligations are provided in the German operations and includes a plan that pays retirement benefits on service and final pay. In general,
the benefit plans were closed to new members at the end of 1995. Under the plan, the employees are entitled to retirement benefits varying between 10 and
20 per cent of final salary (based on the average of the last three years) on attainment of a retirement age of 65. The most recent actuarial valuations of the
present value of the defined benefit obligations were carried out on October 22, 2013, by BDO Deutsche Warentreuhand Aktiengesellschaft, Germany.
Note ii: Post-retirement, medical and dental plan obligations/ Life and medical insurance plan
Milwaukee Electric Tool Corporation, a subsidiary of the Group in the US, operates unfunded post-retirement, medical benefits, dental and life insurance
plans. The most recent actuarial valuations of the present value of the obligations were carried out on January 7, 2014 by Willis North America, Inc.
Note iii: Post-employment benefit plan obligations
The pension plan obligations are provided by Hoover Inc. for members of IBEW (International Brotherhood of Electrical Workers) Local 1985 employed by
Hoover. The most recent actuarial valuation of the present value of the obligations were carried out on January 17, 2014 by CBIZ Benefits & Insurance
Services.
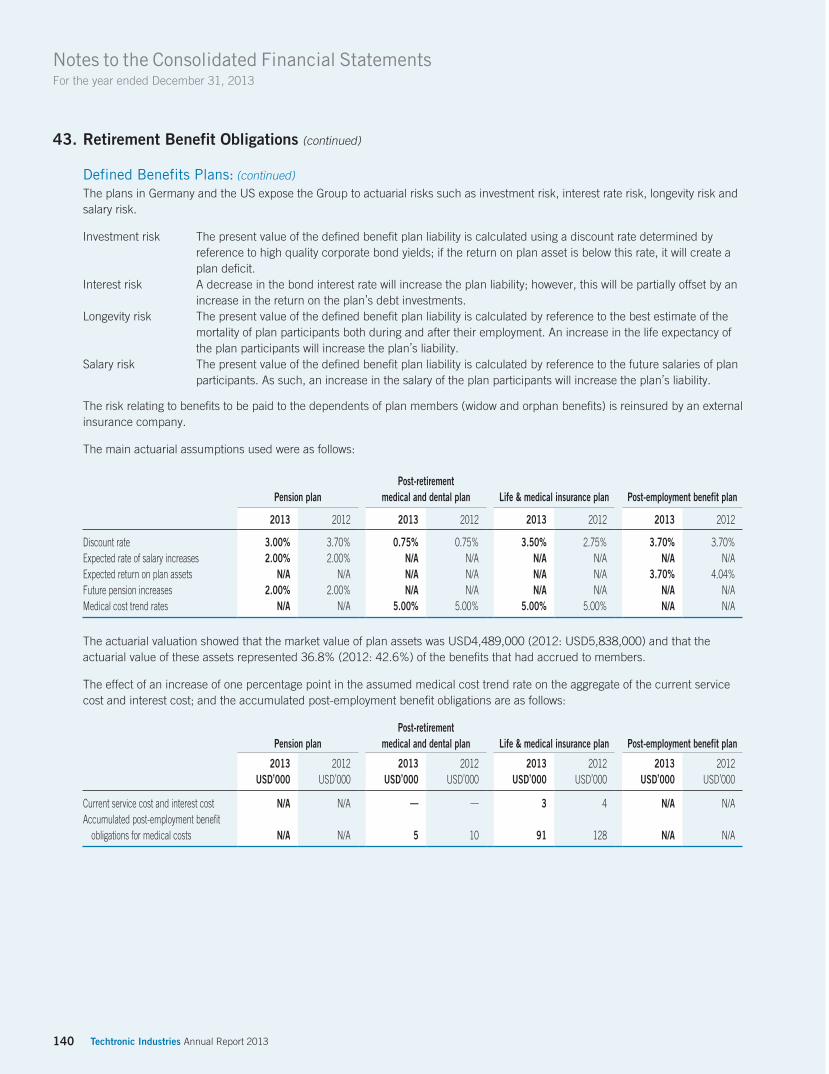
140 Techtronic Industries Annual Report 2013
Notes to the Consolidated Financial StatementsFor the year ended December 31, 2013
43. Retirement Benefit Obligations (continued)
Defined Benefits Plans: (continued)
The plans in Germany and the US expose the Group to actuarial risks such as investment risk, interest rate risk, longevity risk and salary risk.
Investment risk The present value of the defined benefit plan liability is calculated using a discount rate determined by reference to high quality corporate bond yields; if the return on plan asset is below this rate, it will create a plan deficit.
Interest risk A decrease in the bond interest rate will increase the plan liability; however, this will be partially offset by an increase in the return on the plan’s debt investments.
Longevity risk The present value of the defined benefit plan liability is calculated by reference to the best estimate of the mortality of plan participants both during and after their employment. An increase in the life expectancy of the plan participants will increase the plan’s liability.
Salary risk The present value of the defined benefit plan liability is calculated by reference to the future salaries of plan participants. As such, an increase in the salary of the plan participants will increase the plan’s liability.
The risk relating to benefits to be paid to the dependents of plan members (widow and orphan benefits) is reinsured by an external insurance company.
The main actuarial assumptions used were as follows:
Post-retirementPension plan medical and dental plan Life & medical insurance plan Post-employment benefit plan
2013 2012 2013 2012 2013 2012 2013 2012
Discount rate 3.00% 3.70% 0.75% 0.75% 3.50% 2.75% 3.70% 3.70%Expected rate of salary increases 2.00% 2.00% N/A N/A N/A N/A N/A N/AExpected return on plan assets N/A N/A N/A N/A N/A N/A 3.70% 4.04%Future pension increases 2.00% 2.00% N/A N/A N/A N/A N/A N/AMedical cost trend rates N/A N/A 5.00% 5.00% 5.00% 5.00% N/A N/A
The actuarial valuation showed that the market value of plan assets was USD4,489,000 (2012: USD5,838,000) and that the actuarial value of these assets represented 36.8% (2012: 42.6%) of the benefits that had accrued to members.
The effect of an increase of one percentage point in the assumed medical cost trend rate on the aggregate of the current service cost and interest cost; and the accumulated post-employment benefit obligations are as follows:
Post-retirementPension plan medical and dental plan Life & medical insurance plan Post-employment benefit plan
2013 2012 2013 2012 2013 2012 2013 2012USD’000 USD’000 USD’000 USD’000 USD’000 USD’000 USD’000 USD’000
Current service cost and interest cost N/A N/A — — 3 4 N/A N/AAccumulated post-employment benefit obligations for medical costs N/A N/A 5 10 91 128 N/A N/A

141Techtronic Industries Annual Report 2013
43. Retirement Benefit Obligations (continued)
Amounts recognised in comprehensive income in respect of the plans are as follows:
Post-retirementPension plan medical and dental plan Life & medical insurance plan Post-employment benefit plan
2013 2012 2013 2012 2013 2012 2013 2012USD’000 USD’000 USD’000 USD’000 USD’000 USD’000 USD’000 USD’000
Service cost: Current service cost 348 258 — — — — — —Net interest on defined benefit liabilities 3,032 3,534 4 12 49 69 291 269 Components of defined benefit costs recognised in profit or loss 3,380 3,792 4 12 49 69 291 269 Remeasurement on the net defined benefit liability:Actuarial losses (gains) arising from changes in financial assumptions 10,033 9,024 (99) (240) (332) (100) (459) 945 Components of defined benefit costs recognised in other comprehensive income 10,033 9,024 (99) (240) (332) (100) (459) 945 Total 13,413 12,816 (95) (228) (283) (31) (168) 1,214
The charge for the year has been included in staff costs.
The amount included in the consolidated statement of financial position arising from the Group’s obligation in respect of the major plans is as follows:
Post-retirementPension plan medical and dental plan Life & medical insurance plan Post-employment benefit plan
2013 2012 2013 2012 2013 2012 2013 2012USD’000 USD’000 USD’000 USD’000 USD’000 USD’000 USD’000 USD’000
Present value of funded obligations — — — — — — 12,183 13,700Fair value of plan assets — — — — — — (4,489) (5,838)
— — — — — — 7,694 7,862Present value of unfunded obligations 95,476 82,588 383 602 1,549 1,861 — —
95,476 82,588 383 602 1,549 1,861 7,694 7,862

142 Techtronic Industries Annual Report 2013
Notes to the Consolidated Financial StatementsFor the year ended December 31, 2013
43. Retirement Benefit Obligations (continued)
Movements in the present value of the defined benefit obligations in the current year in respect of major plans were as follows:
Post-retirementPension plan medical and dental plan Life & medical insurance plan Post-employment benefit plan
2013 2012 2013 2012 2013 2012 2013 2012USD’000 USD’000 USD’000 USD’000 USD’000 USD’000 USD’000 USD’000
At January 1 82,588 72,989 602 840 1,861 1,940 13,700 14,049Exchange differences 4,203 1,286 — — — — — —Current service cost 348 258 — — — — — —Actuarial losses (gains) 10,033 9,024 (99) (240) (332) (100) (657) 669Interest cost 3,032 3,534 4 12 49 69 482 541Benefit paid (4,728) (4,503) (124) (10) (29) (48) (1,342) (1,559) At December 31 95,476 82,588 383 602 1,549 1,861 12,183 13,700
Movements in the fair value of the plan assets in the current year in respect of certain major plans were as follows:
Post-retirementPension plan medical and dental plan Life & medical insurance plan Post-employment benefit plan
2013 2012 2013 2012 2013 2012 2013 2012USD’000 USD’000 USD’000 USD’000 USD’000 USD’000 USD’000 USD’000
At January 1 N/A N/A N/A N/A N/A N/A 5,838 7,401Exchange differences N/A N/A N/A N/A N/A N/A — —Expected return on plan assets N/A N/A N/A N/A N/A N/A 191 272Actuarial losses N/A N/A N/A N/A N/A N/A (198) (276)Contribution from employer N/A N/A N/A N/A N/A N/A — —Benefit paid N/A N/A N/A N/A N/A N/A (1,342) (1,559) At December 31 N/A N/A N/A N/A N/A N/A 4,489 5,838
The plan assets of the post-employment benefit plan are cash and cash equivalents in a Federated Money Market Fund with an expected return of 3.70% (2012: 4.04%).
The actual return on plan assets was USD198,000 (2012: USD276,000).
Significant actuarial assumptions for the determination of the defined obligation is discount rate, if the discount rate is 100 basis points higher (lower), the effect on defined benefit obligation would be immaterial.
The Group expects to make a contribution of USD4,500,000 (2012: USD2,000,000) to the defined benefit plans during the next financial year.
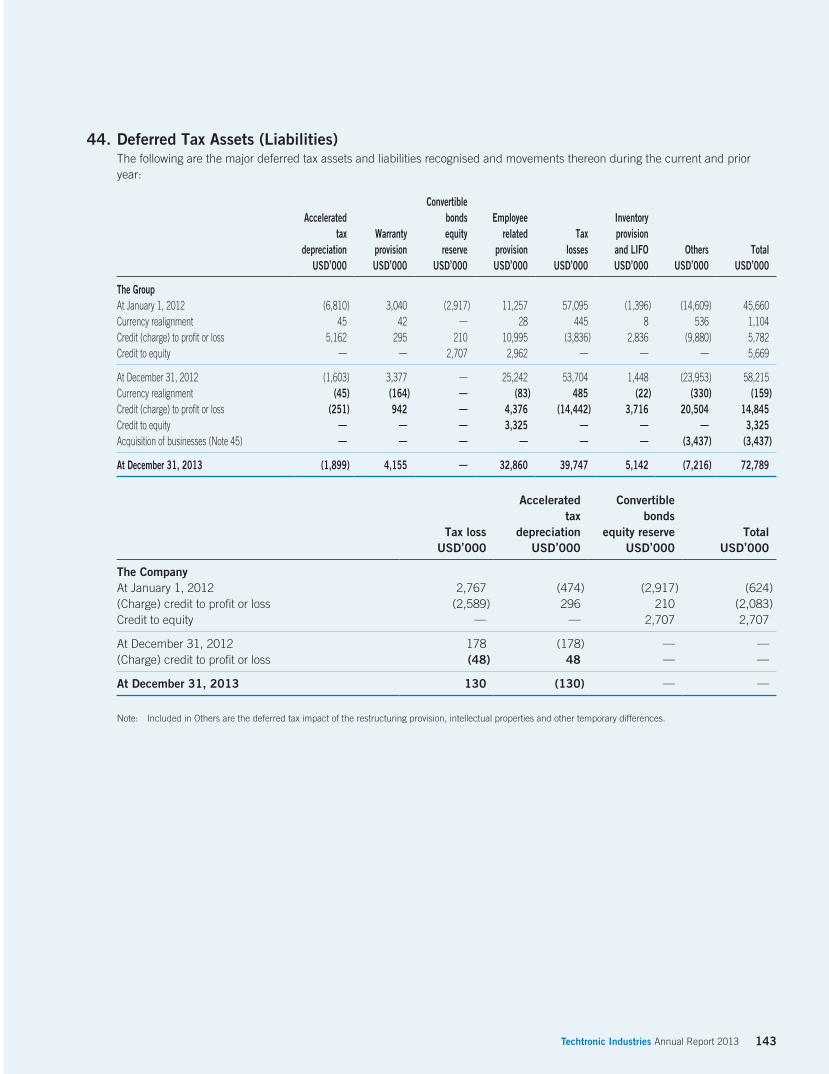
143Techtronic Industries Annual Report 2013
44. Deferred Tax Assets (Liabilities)The following are the major deferred tax assets and liabilities recognised and movements thereon during the current and prior year:
ConvertibleAccelerated bonds Employee Inventory
tax Warranty equity related Tax provisiondepreciation provision reserve provision losses and LIFO Others Total
USD’000 USD’000 USD’000 USD’000 USD’000 USD’000 USD’000 USD’000
The GroupAt January 1, 2012 (6,810) 3,040 (2,917) 11,257 57,095 (1,396) (14,609) 45,660Currency realignment 45 42 — 28 445 8 536 1,104Credit (charge) to profit or loss 5,162 295 210 10,995 (3,836) 2,836 (9,880) 5,782Credit to equity — — 2,707 2,962 — — — 5,669 At December 31, 2012 (1,603) 3,377 — 25,242 53,704 1,448 (23,953) 58,215Currency realignment (45) (164) — (83) 485 (22) (330) (159)Credit (charge) to profit or loss (251) 942 — 4,376 (14,442) 3,716 20,504 14,845Credit to equity — — — 3,325 — — — 3,325Acquisition of businesses (Note 45) — — — — — — (3,437) (3,437) At December 31, 2013 (1,899) 4,155 — 32,860 39,747 5,142 (7,216) 72,789
Accelerated Convertibletax bonds
Tax loss depreciation equity reserve TotalUSD’000 USD’000 USD’000 USD’000
The CompanyAt January 1, 2012 2,767 (474) (2,917) (624)(Charge) credit to profit or loss (2,589) 296 210 (2,083)Credit to equity — — 2,707 2,707 At December 31, 2012 178 (178) — —(Charge) credit to profit or loss (48) 48 — — At December 31, 2013 130 (130) — —
Note: Included in Others are the deferred tax impact of the restructuring provision, intellectual properties and other temporary differences.

144 Techtronic Industries Annual Report 2013
Notes to the Consolidated Financial StatementsFor the year ended December 31, 2013
44. Deferred Tax Assets (Liabilities) (continued)
For the purpose of presentation in the consolidated statement of financial position, certain deferred tax assets and liabilities have been offset. The following is the analysis of the deferred tax balances for financial reporting purposes:
The Group
2013 2012USD’000 USD’000
Deferred tax assets 79,064 73,892Deferred tax liabilities (6,275) (15,677)
72,789 58,215
At the end of the reporting period, the Group has unused tax losses of USD553 million (2012: USD510 million) available for the offset against future taxable profits that carry forward for at least fourteen years. No deferred tax asset has been recognised in respect of tax losses of USD413 million (2012: USD324 million) due to the lack of probable future taxable profits.
45. Acquisition of BusinessesIn July 2013, the Group acquired certain assets, liabilities and business from the Oreck Bankruptcy Estate (“Oreck”) for a total consideration of approximately USD17.2 million. Oreck business was acquired so as to continue the expansion of the Group’s Floor Care and Appliance business. Oreck is engaged in trading of floor care products and is included in Floor Care and Appliances segment.
In October 2013, the Group acquired certain assets and business from Gimelli Laboratories Company Limited (“G Lab”), a related party, for a total consideration of approximately USD4.6 million. G Lab business was acquired so as to create synergy on the Group’s Power Equipment business. G Lab is engaged in manufacture and trading of electrical and dental care products and is included in Power Equipment segment.
Fair valueUSD’000
Net Assets AcquiredProperty, plant and equipment 855Intangible assets 38,236Acquisition right of property, plant and equipment 12,647Deferred tax assets 2,055Inventories 11,383Trade and other receivables, deposits and prepayments 2,859Trade and other payables (1,890)Warranty provision (4,231)Deferred tax liabilities (5,492)Obligation under finance lease – due after one year (141)
56,281Gain on a bargain purchase (38,319)Goodwill arising on acquisition of a business 3,861 Cash consideration paid during the year 21,823 Net cash outflow arising on acquisition: Cash consideration paid during the year 21,823 Net outflow of cash and cash equivalents in respect of the acquisition of businesses 21,823

145Techtronic Industries Annual Report 2013
45. Acquisition of Businesses (continued)
The goodwill arising on acquisition of the G Lab business is attributable to the anticipated profitability of the distribution of the Group’s Power Equipment products in new markets and the anticipated future operating synergies from the combination.
The acquisition of Oreck was a bargain purchase which gave rise to a gain on a bargain purchase of approximately USD38.3 million and this amount had been included in other income.
Acquisition-related costs are insignificant and have been excluded from the consideration transferred and have been recognised as an expense in the current year.
The businesses acquired contributed approximately USD30,096,000 to the Group’s turnover, and approximately USD532,000 increase in the Group’s profit before taxation for the period between the respective dates of acquisition and the reporting date as at December 31, 2013.
The revenue and profit or loss of the acquired businesses for the current reporting period as though the acquisition date for the acquisitions that occurred during the year has been as of the beginning of the annual reporting period is not presented as it was impracticable to obtain various values in various acquiree’s operations prior to the acquisition.
46. Major Non-Cash TransactionsDuring the year ended December 31, 2013, the Group did not enter into finance lease arrangements in respect of assets at the inception of the finance leases (2012: USD536,000).
47. Lease CommitmentsAt the end of the reporting period, the Group and the Company had outstanding commitments under non-cancellable operating leases, which fall due as follows:
The Group The Company
2013 2012 2013 2012USD’000 USD’000 USD’000 USD’000
Within one year 31,635 29,662 780 707In the second to fifth year inclusive 55,989 62,398 — —After five years 26,989 28,707 — —
114,613 120,767 780 707
Operating lease payments represent rentals payable by the Group and the Company for certain of its plant and machinery, motor vehicles, office properties and other assets. Leases are negotiated for a term ranging from 1 year to 17 years.

146 Techtronic Industries Annual Report 2013
Notes to the Consolidated Financial StatementsFor the year ended December 31, 2013
48. Contingent LiabilitiesThe Group The Company
2013 2012 2013 2012USD’000 USD’000 USD’000 USD’000
Guarantees given to banks in respect of credit facilities utilised by associates 9,099 12,691 9,099 12,691
In addition, the Company has given guarantees to banks in respect of general facilities granted to its subsidiaries. The extent of such facilities utilised by the subsidiaries as at December 31, 2013 amounted to USD344,076,000 (2012: USD754,752,000).
49. Share Options
Scheme adopted on May 29, 2007 (“Scheme D”) Following the termination of Scheme C, a new share option scheme was adopted pursuant to a resolution passed on May 29, 2007
for recognition of the contribution to the development and growth of the Group by the eligible persons. This scheme will expire on May 28, 2017. Under Scheme D, the Board of Directors of the Company may grant share options to the following eligible persons (and their wholly owned companies) of the Company, its subsidiaries and any companies in which the Group holds any equity interest, to subscribe for shares in the Company:
(i) employees; or
(ii) Non-executive Directors (including Independent Non-executive Directors or officers); or
(iii) secondees; or
(iv) business partners, agents, consultants; or
(v) suppliers or customers; or
(vi) any person or entity that provides research, development or other technological support; or
(vii) shareholders.
Share options granted must be taken up within 21 days of the date of grant, upon payment of HKD1.00 in cash by way of consideration for the grant thereof. Share options may be exercised at any time, subject to vesting conditions from the date of grant to the tenth anniversary thereof. The subscription price is set at the highest of: the closing price of the shares on the date of offer of the share option; or the average closing price of shares as stated in the daily quotation sheets issued by the Stock Exchange for the five trading days immediately preceding the date of offer; or the nominal value of shares on the date of offer.
The maximum number of shares in respect of which share options may be granted under Scheme D is not permitted to exceed 30.0% of the issued share capital of the Company from time to time or 10.0% of shares in issue as at the adoption date of Scheme D. No person shall be granted an option which exceeds 1.0% of the shares in issue as at the date of offer in any 12-month period up to the date thereof.
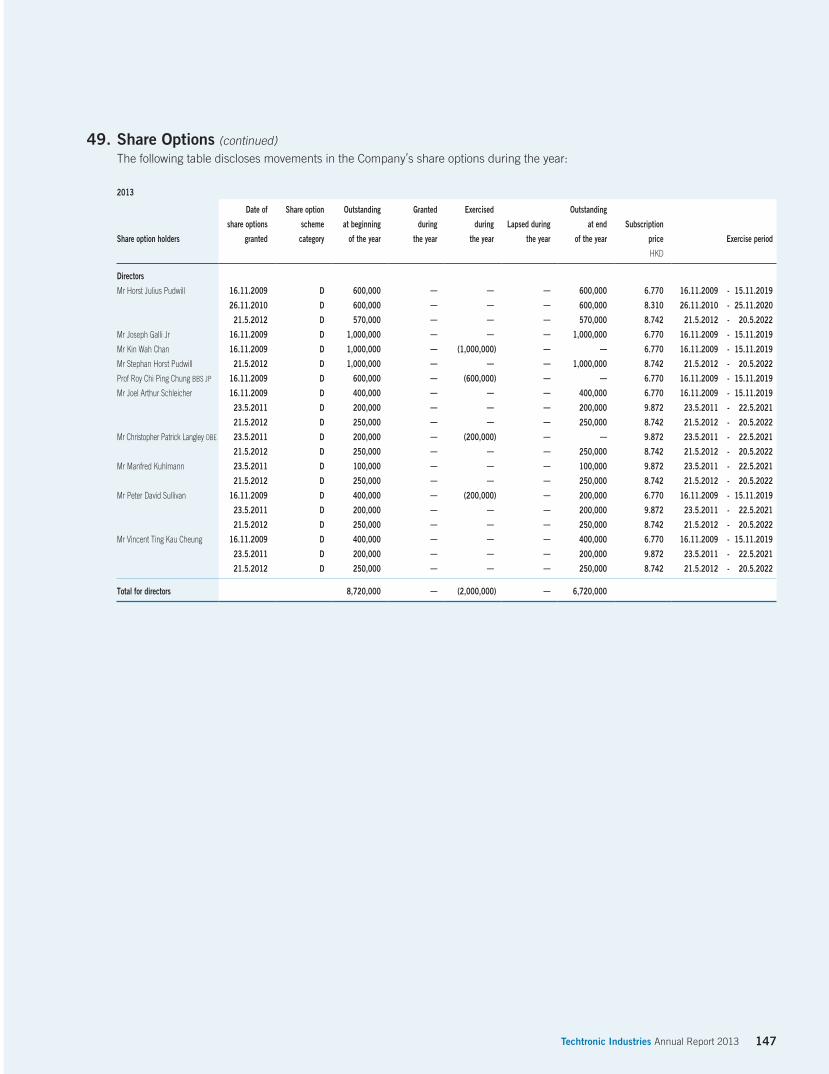
147Techtronic Industries Annual Report 2013
49. Share Options (continued)
The following table discloses movements in the Company’s share options during the year:
2013
Share option holders
Date of
share options
granted
Share option
scheme
category
Outstanding
at beginning
of the year
Granted
during
the year
Exercised
during
the year
Lapsed during
the year
Outstanding
at end
of the year
Subscription
price Exercise period
HKD Directors
Mr Horst Julius Pudwill 16.11.2009 D 600,000 — — — 600,000 6.770 16.11.2009 - 15.11.2019
26.11.2010 D 600,000 — — — 600,000 8.310 26.11.2010 - 25.11.2020
21.5.2012 D 570,000 — — — 570,000 8.742 21.5.2012 - 20.5.2022
Mr Joseph Galli Jr 16.11.2009 D 1,000,000 — — — 1,000,000 6.770 16.11.2009 - 15.11.2019
Mr Kin Wah Chan 16.11.2009 D 1,000,000 — (1,000,000) — — 6.770 16.11.2009 - 15.11.2019
Mr Stephan Horst Pudwill 21.5.2012 D 1,000,000 — — — 1,000,000 8.742 21.5.2012 - 20.5.2022
Prof Roy Chi Ping Chung BBS JP 16.11.2009 D 600,000 — (600,000) — — 6.770 16.11.2009 - 15.11.2019
Mr Joel Arthur Schleicher 16.11.2009 D 400,000 — — — 400,000 6.770 16.11.2009 - 15.11.2019
23.5.2011 D 200,000 — — — 200,000 9.872 23.5.2011 - 22.5.2021
21.5.2012 D 250,000 — — — 250,000 8.742 21.5.2012 - 20.5.2022
Mr Christopher Patrick Langley OBE 23.5.2011 D 200,000 — (200,000) — — 9.872 23.5.2011 - 22.5.2021
21.5.2012 D 250,000 — — — 250,000 8.742 21.5.2012 - 20.5.2022
Mr Manfred Kuhlmann 23.5.2011 D 100,000 — — — 100,000 9.872 23.5.2011 - 22.5.2021
21.5.2012 D 250,000 — — — 250,000 8.742 21.5.2012 - 20.5.2022
Mr Peter David Sullivan 16.11.2009 D 400,000 — (200,000) — 200,000 6.770 16.11.2009 - 15.11.2019
23.5.2011 D 200,000 — — — 200,000 9.872 23.5.2011 - 22.5.2021
21.5.2012 D 250,000 — — — 250,000 8.742 21.5.2012 - 20.5.2022
Mr Vincent Ting Kau Cheung 16.11.2009 D 400,000 — — — 400,000 6.770 16.11.2009 - 15.11.2019
23.5.2011 D 200,000 — — — 200,000 9.872 23.5.2011 - 22.5.2021
21.5.2012 D 250,000 — — — 250,000 8.742 21.5.2012 - 20.5.2022 Total for directors 8,720,000 — (2,000,000) — 6,720,000

148 Techtronic Industries Annual Report 2013
Notes to the Consolidated Financial StatementsFor the year ended December 31, 2013
49. Share Options (continued)
The following table discloses movements in the Company’s share options during the year: (continued)
Share option holders
Date of
share options
granted
Share option
scheme
category
Outstanding
at beginning
of the year
Granted
during
the year
Exercised
during
the year
Lapsed during
the year
Outstanding
at end
of the year
Subscription
price Exercise period
HKD
Employees 24.8.2007 D 1,180,000 — (200,000) — 980,000 8.390 24.8.2007 - 23.8.2017
16.10.2007 D 75,000 — (15,000) — 60,000 8.810 16.10.2007 - 15.10.2017
7.11.2007 D 40,000 — — — 40,000 8.088 7.11.2007 - 6.11.2017
14.1.2008 D 605,000 — (87,000) — 518,000 7.566 14.1.2008 - 13.1.2018
17.4.2008 D 775,000 — (175,000) (25,000) 575,000 7.780 17.4.2008 - 16.4.2018
14.5.2008 D 40,000 — — — 40,000 7.500 14.5.2008 - 13.5.2018
30.5.2008 D 426,000 — (76,000) — 350,000 7.546 30.5.2008 - 29.5.2018
11.9.2008 D 50,000 — (50,000) — — 7.430 11.9.2008 - 10.9.2018
1.12.2008 D 100,000 — (100,000) — — 2.340 1.12.2008 - 30.11.2018
16.11.2009 D 3,570,000 — (1,350,000) — 2,220,000 6.770 16.11.2009 - 15.11.2019
7.12.2009 D 100,000 — — — 100,000 6.790 7.12.2009 - 6.12.2019
21.12.2009 D 50,000 — (50,000) — — 6.350 21.12.2009 - 20.12.2019
28.12.2009 D 30,000 — — — 30,000 6.390 28.12.2009 - 27.12.2019
13.9.2010 D 500,000 — — — 500,000 7.390 13.9.2010 - 12.9.2020
17.1.2011 D 20,000 — — — 20,000 10.436 17.1.2011 - 16.1.2021 Total for employees 7,561,000 — (2,103,000) (25,000) 5,433,000 Total for all categories 16,281,000 — (4,103,000) (25,000) 12,153,000
The following table discloses details of the Company’s share options held by employees (including directors) and movements in such holdings during the year:
Lapsed orOutstanding Granted Exercised cancelled Outstanding at
at January 1, during during during the December 31,Option type 2013 the year the year year 2013 Scheme D 16,281,000 — (4,103,000) (25,000) 12,153,000
16,281,000 — (4,103,000) (25,000) 12,153,000 Exercisable at the end of the year 10,743,000
Lapsed orOutstanding Granted Exercised cancelled Outstanding at
at January 1, during during during the December 31,Option type 2012 the year the year year 2012
Scheme C 5,475,000 — — (5,475,000) —Scheme D 23,730,000 2,820,000 (8,289,000) (1,980,000) 16,281,000
29,205,000 2,820,000 (8,289,000) (7,455,000) 16,281,000 Exercisable at the end of the year 12,951,000

149Techtronic Industries Annual Report 2013
49. Share Options (continued)
Details of the share options held by the directors included in the above table are as follows:
Outstandingat January 1
Grantedduring
the year
Exercisedduring
the year
Lapsedduring
the yearOutstanding atDecember 31
2013 8,720,000 — (2,000,000) — 6,720,000
Outstandingat January 1
Grantedduring
the year
Exercisedduring
the year
Lapsedduring
the yearOutstanding atDecember 31
2012 9,800,000 2,820,000 (2,900,000) (1,000,000) 8,720,000
The following significant assumptions were used to derive the fair values using the Black-Scholes option pricing model:
Date of grant
ExercisepriceHKD
Expectedlife ofshare
options
Expectedvolatilitybased onhistoricalvolatilityof share
prices
Hong KongExchange
FundNotes rate
Expectedannual
dividendyield
For the year ended December 31, 201221.5.2012 8.742 3 years 41% 0.298% 1.5%
The share options are vested in parts over 3 years from the date of grant.
Expected volatility was determined by using the historical volatility of the Company’s share price over the previous 3 years. The expected life used in the model has been adjusted, based on management’s best estimate, for the effects of non-transferability, exercise restrictions and behavioural considerations.
The Black-Scholes option pricing model requires the input of highly subjective assumptions, including the volatility of the share price. Because changes in subjective input assumptions can materially affect the fair value estimate, in the directors’ opinion, the existing model does not necessarily provide a reliable single measure of the fair value of the share options.
The weighted average closing prices of shares immediately before the options grant date during 2012 were HKD8.65.
The closing price of the Company’s shares immediately before date of grant was HKD8.65 in 2012.
The weighted average closing prices of the Company’s shares immediately before various dates during 2013 and 2012 on which the share options were exercised were HKD18.22 and HKD14.12 respectively.
The Group recognised a total expense of USD366,000 for the year ended December 31, 2013 (2012: USD578,000) in relation to share options granted by the Company.
The fair values of the share options granted in 2012 measured at date of grant was HKD2.11 per option.
The Company had 12,153,000 share options outstanding, which represented approximately 0.66% of the issued share capital of the Company as at December 31, 2013. No option was granted and cancelled during the year.

150 Techtronic Industries Annual Report 2013
Notes to the Consolidated Financial StatementsFor the year ended December 31, 2013
50. Capital Commitments
The Group The Company 2013 2012 2013 2012
USD’000 USD’000 USD’000 USD’000
Capital expenditure in respect of the purchase of property, plant and equipment: Contracted for but not provided 17,613 16,669 27 79 Authorised but not contracted for 1,134 1,297 — —
51. Related Party Transactions During the year, the Group entered into the following transactions with its associates, which did not constitute connected
transactions under Chapter 14A of the Listing Rules:
2013 2012USD’000 USD’000
Sales income 4,730 19Equipment charge income — 115Purchases 858 —Acquisition of certain assets and business (Note 45) 4,621 —Tenancy compensation 2,000 —
The remuneration of directors and other members of key management during the year was as follows:
2013 2012USD’000 USD’000
Short-term benefits 34,377 29,424Post-employment benefits 214 190Share-based payments 365 575
34,956 30,189
Details of the balances and transactions with related parties are set out in the statements of financial position and Notes 21, 22, 27, 28 and 48.
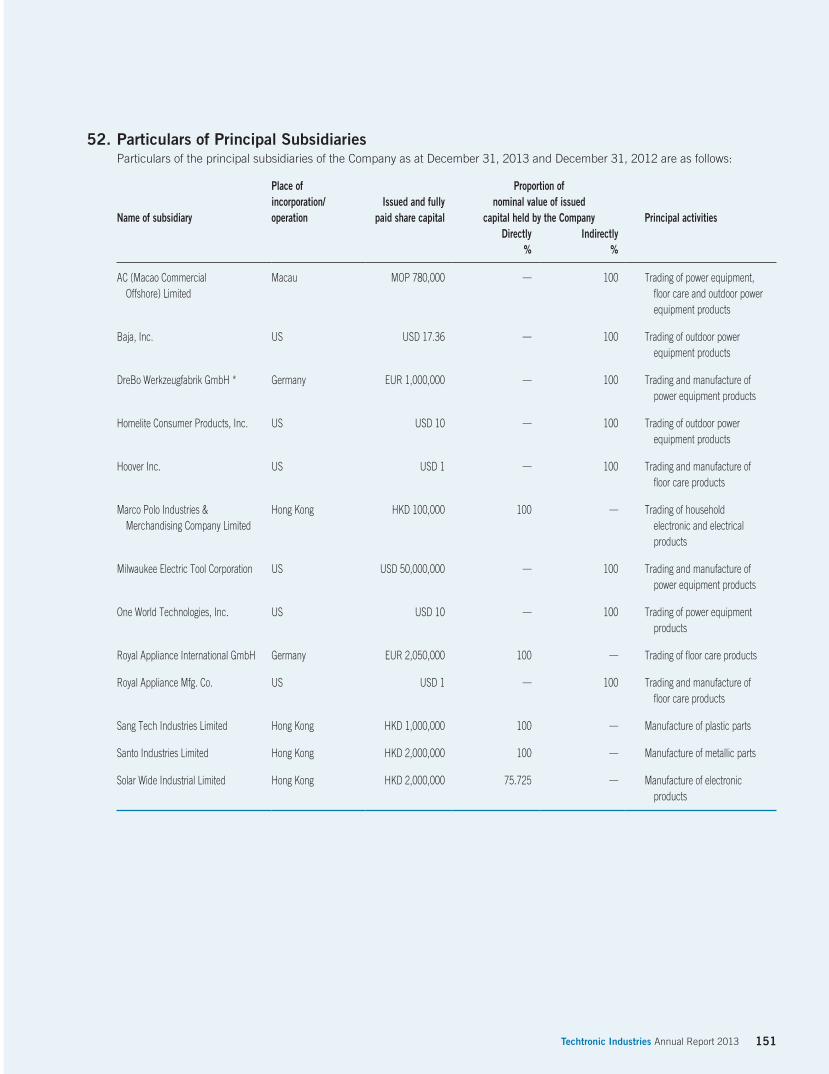
151Techtronic Industries Annual Report 2013
52. Particulars of Principal Subsidiaries Particulars of the principal subsidiaries of the Company as at December 31, 2013 and December 31, 2012 are as follows:
Name of subsidiary
Place ofincorporation/operation
Issued and fullypaid share capital
Proportion ofnominal value of issued
capital held by the Company Principal activitiesDirectly Indirectly
% %
AC (Macao Commercial Macau MOP 780,000 — 100 Trading of power equipment, Offshore) Limited floor care and outdoor power
equipment products
Baja, Inc. US USD 17.36 — 100 Trading of outdoor power equipment products
DreBo Werkzeugfabrik GmbH * Germany EUR 1,000,000 — 100 Trading and manufacture of power equipment products
Homelite Consumer Products, Inc. US USD 10 — 100 Trading of outdoor power equipment products
Hoover Inc. US USD 1 — 100 Trading and manufacture of floor care products
Marco Polo Industries & Merchandising Company Limited
Hong Kong HKD 100,000 100 — Trading of household electronic and electrical products
Milwaukee Electric Tool Corporation US USD 50,000,000 — 100 Trading and manufacture of power equipment products
One World Technologies, Inc. US USD 10 — 100 Trading of power equipment products
Royal Appliance International GmbH Germany EUR 2,050,000 100 — Trading of floor care products
Royal Appliance Mfg. Co. US USD 1 — 100 Trading and manufacture of floor care products
Sang Tech Industries Limited Hong Kong HKD 1,000,000 100 — Manufacture of plastic parts
Santo Industries Limited Hong Kong HKD 2,000,000 100 — Manufacture of metallic parts
Solar Wide Industrial Limited Hong Kong HKD 2,000,000 75.725 — Manufacture of electronic products

152 Techtronic Industries Annual Report 2013
Notes to the Consolidated Financial StatementsFor the year ended December 31, 2013
52. Particulars of Principal Subsidiaries (continued)
Name of subsidiary
Place ofincorporation/operation
Issued and fullypaid share capital
Proportion ofnominal value of issued
capital held by the Company Principal activitiesDirectly Indirectly
% %
Techtronic Floor Care BVI USD 1 100 — Investment and intellectual Technology Limited properties holding
Techtronic Industries PRC USD 47,000,000 — 100 Manufacture of power equipment, (Dongguan) Co. Ltd.# floor care and outdoor
power equipment products
Techtronic Industries (Taiwan) Co. Ltd.
Taiwan NTD 5,000,000 100 — Provision of inspection services
Techtronic Industries (UK) Ltd United Kingdom GBP 4,000,000 — 100 Trading of power equipment products
Techtronic Industries Australia Pty. Limited
Australia AUD 19,400,000 — 100 Trading of power equipment, floor care and outdoor power equipment products
Techtronic Industries Central Europe GmbH*
Germany EUR 25,600 — 100 Trading of power equipment products
Techtronic Industries ELC GmbH* Germany EUR 25,000 — 100 Trading of power equipment products and outdoor power equipment products
Techtronic Industries France SAS France EUR 14,919,832 — 100 Trading of power equipment products
Techtronic Industries GmbH Germany EUR 20,452,500 — 100 Trading and manufacture of power equipment products
Techtronic Industries Korea Limited Korea KRW 1,200,000,000 100 — Trading of power equipment products
Techtronic Industries Mexico, Mexico MXN 50,000 — 100 Trading of power equipment, S.A. de C.V. (Serie I) floor care and outdoor
MXN 53,290,717 power equipment products(Serie II)
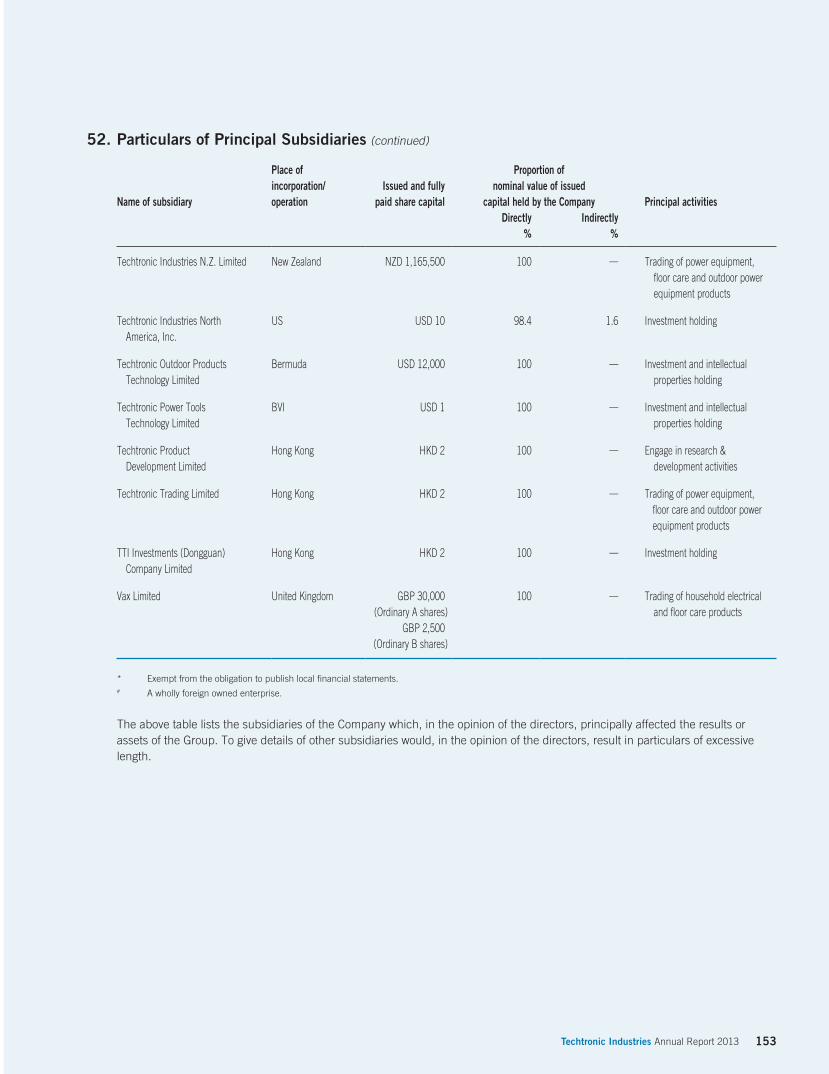
153Techtronic Industries Annual Report 2013
52. Particulars of Principal Subsidiaries (continued)
Name of subsidiary
Place ofincorporation/operation
Issued and fullypaid share capital
Proportion ofnominal value of issued
capital held by the Company Principal activitiesDirectly Indirectly
% %
Techtronic Industries N.Z. Limited New Zealand NZD 1,165,500 100 — Trading of power equipment, floor care and outdoor power equipment products
Techtronic Industries North America, Inc.
US USD 10 98.4 1.6 Investment holding
Techtronic Outdoor Products Bermuda USD 12,000 100 — Investment and intellectual Technology Limited properties holding
Techtronic Power Tools Technology Limited
BVI USD 1 100 — Investment and intellectual properties holding
Techtronic Product Hong Kong HKD 2 100 — Engage in research & Development Limited development activities
Techtronic Trading Limited Hong Kong HKD 2 100 — Trading of power equipment, floor care and outdoor power equipment products
TTI Investments (Dongguan) Company Limited
Hong Kong HKD 2 100 — Investment holding
Vax Limited United Kingdom GBP 30,000 100 — Trading of household electrical(Ordinary A shares) and floor care products
GBP 2,500(Ordinary B shares)
* Exempt from the obligation to publish local financial statements.# A wholly foreign owned enterprise.
The above table lists the subsidiaries of the Company which, in the opinion of the directors, principally affected the results or assets of the Group. To give details of other subsidiaries would, in the opinion of the directors, result in particulars of excessive length.
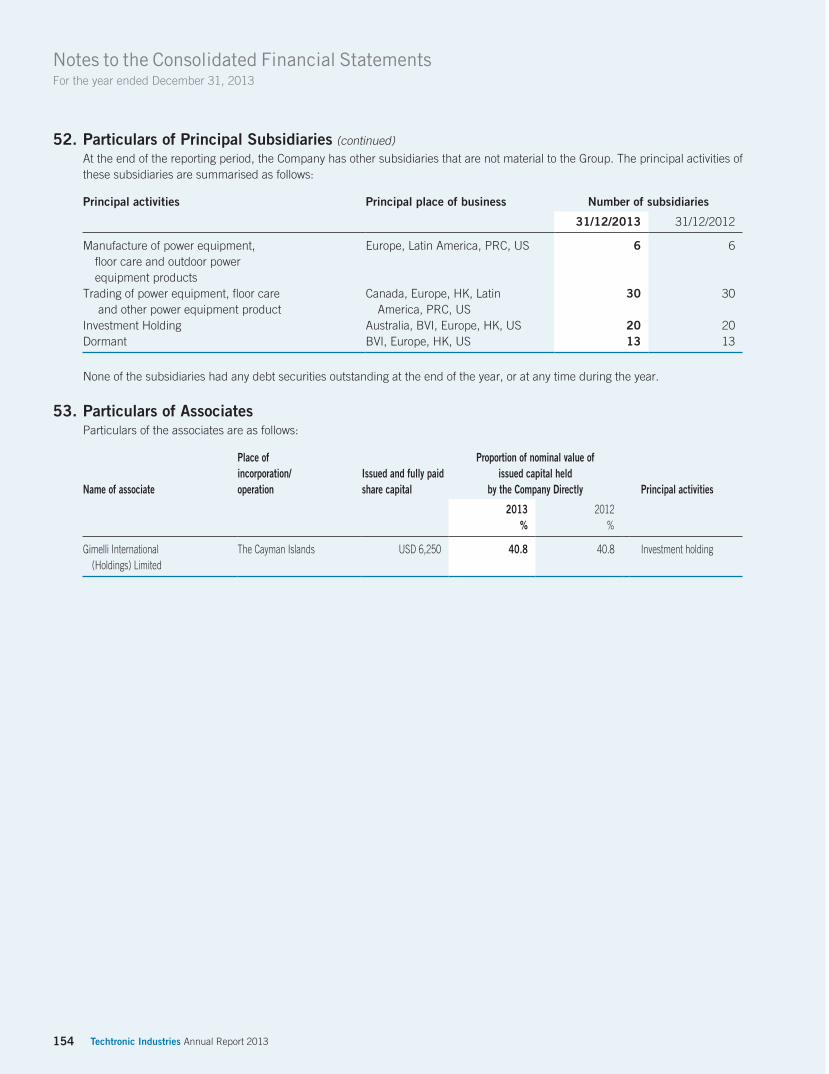
154 Techtronic Industries Annual Report 2013
Notes to the Consolidated Financial StatementsFor the year ended December 31, 2013
52. Particulars of Principal Subsidiaries (continued)
At the end of the reporting period, the Company has other subsidiaries that are not material to the Group. The principal activities of these subsidiaries are summarised as follows:
Principal activities Principal place of business Number of subsidiaries
31/12/2013 31/12/2012
Manufacture of power equipment, Europe, Latin America, PRC, US 6 6 floor care and outdoor power equipment productsTrading of power equipment, floor care Canada, Europe, HK, Latin 30 30 and other power equipment product America, PRC, USInvestment Holding Australia, BVI, Europe, HK, US 20 20Dormant BVI, Europe, HK, US 13 13
None of the subsidiaries had any debt securities outstanding at the end of the year, or at any time during the year.
53. Particulars of Associates Particulars of the associates are as follows:
Name of associate
Place ofincorporation/operation
Issued and fully paid share capital
Proportion of nominal value ofissued capital held
by the Company Directly Principal activities
2013 2012% %
Gimelli International (Holdings) Limited
The Cayman Islands USD 6,250 40.8 40.8 Investment holding

Financial Summary
155Techtronic Industries Annual Report 2013
Results
Year ended December 31,
2009 2010 2011 2012 2013USD’000 USD’000 USD’000 USD’000 USD’000(Restated) (Restated) (Restated)
Turnover 3,074,955 3,382,838 3,667,058 3,852,418 4,299,755 Profit before restructuring, share of results of associates and taxation 57,362 123,165 161,704 222,246 276,398Restructuring costs — (26,653) — — —Share of results of associates (127) (155) (347) — — Profit before taxation 57,235 96,357 161,357 222,246 276,398Taxation (charge) credit 8,036 70 (9,242) (22,139) (29,036) Profit for the year 65,271 96,427 152,115 200,107 247,362 Attributable to: Owners of the Company 65,079 95,556 152,009 200,991 250,284 Non-controlling interests 192 871 106 (884) (2,922) Profit for the year 65,271 96,427 152,115 200,107 247,362 Basic earnings per share (US cents) 4.23 5.97 9.47 11.42 13.68
Assets and LiabilitiesYear ended December 31,
2009 2010 2011 2012 2013USD’000 USD’000 USD’000 USD’000 USD’000
Total assets 3,049,276 3,265,912 3,369,616 3,581,078 4,012,559Total liabilities 1,999,049 2,136,205 2,115,488 2,024,556 2,267,123
1,050,227 1,129,707 1,254,128 1,556,522 1,745,436 Equity attributable to Owners of the Company 1,036,149 1,114,759 1,245,576 1,548,877 1,740,713Non-controlling interests 14,078 14,948 8,552 7,645 4,723
1,050,227 1,129,707 1,254,128 1,556,522 1,745,436
Corporate Information
156 Techtronic Industries Annual Report 2013
Board of Directors
Group Executive DirectorsMr Horst Julius PudwillChairman
Mr Joseph Galli JrChief Executive Officer
Mr Patrick Kin Wah ChanMr Frank Chi Chung ChanMr Stephan Horst Pudwill
Non-executive DirectorProf Roy Chi Ping Chung BBS JP
Independent Non-executive DirectorsMr Joel Arthur SchleicherMr Christopher Patrick Langley OBE
Mr Manfred KuhlmannMr Peter David SullivanMr Vincent Ting Kau Cheung
Financial Calendar 2014March 19 : Announcement of 2013 annual resultsMay 21 : Last day to register for the entitlement to attend and vote at Annual General MeetingMay 22-23 : Book closure period for the entitlement to attend and vote at Annual General MeetingMay 23 : Annual General MeetingMay 28 : Last day to register for 2013 final dividendMay 29-30 : Book closure period for 2013 final dividendJune 27 : Final dividend paymentJune 30 : Six months interim period endDecember 31 : Financial year end
Investor Relations ContactInvestor Relations and CommunicationsTechtronic Industries Co. Ltd.24/F., CDW Building388 Castle Peak RoadTsuen Wan, N.T.Hong Kongemail: [email protected]
Websitewww.ttigroup.comEarnings results, annual/interim reports are available online.
Listing InformationThe Stock Exchange of Hong Kong Limited Ordinary Shares (stock code: 669)ADR Level 1 Programme (symbol: TTNDY)
Share Registrar and Transfer OfficeTricor Secretaries LimitedLevel 22, Hopewell Centre183 Queen’s Road EastHong KongTel: (852) 2980 1888
ADR DepositaryThe Bank of New York
Principal BankersBank of America, N.A.Bank of ChinaThe Hongkong and Shanghai Banking Corporation LimitedStandard Chartered BankCitibank, N.A.The Bank of Tokyo-Mitsubishi UFJ, LTD
SolicitorsVincent T.K. Cheung, Yap & Co.
AuditorDeloitte Touche Tohmatsu
Company SecretaryMs Veronica Ka Po Ng
TrademarksAll trademarks used are intellectual property of their respective owners and are protected under trademark law.
AEG® is a registered trademark and its use is pursuant to a License granted by AB Electrolux (publ).
RYOBI® is a registered trademark and its use is pursuant to a License granted by Ryobi Limited.

www.ttigroup.com
M18 FUEL™ 4-1/2” / 5” Grinder The M18 FUEL™ 4-1/2” / 5” Grinder delivers the power of a corded grinder with up to 2X more run time and up to 10X longer motor life. It supplies maximum sustained power to complete the toughest grinding, surface preparation and cutting applications.
