to fasb or to iasb. that is the question · to fasb or to iasb. that is the question ... accounting...
TRANSCRIPT

International Center for Captive Insurance Education
To FASB or to IASB. That is the Question
Joel Chansky, Principal and Consulting Actuary, Milliman, Inc.Magali Welch, Partner, Johnson Lambert & Co.
Tuesday, March 15th- 3:45pm – 5:00pm
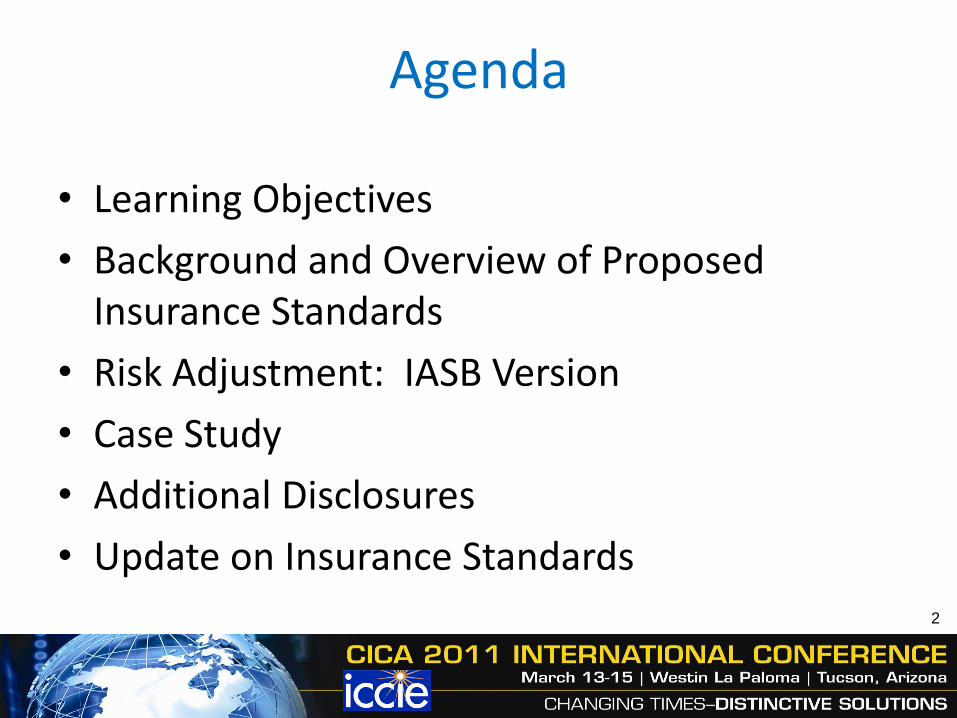
Agenda
• Learning Objectives
• Background and Overview of Proposed Insurance Standards
• Risk Adjustment: IASB Version
• Case Study
• Additional Disclosures
• Update on Insurance Standards
2

Learning Objectives
3

Learning Objectives: Impact on Captive Accounting
• Potential Changes in Generally Accepted Accounting Principles (GAAP) and International Financial Reporting Standards (IFRS)
– Likely to Increase Loss Reserves
– Likely to Lower Surplus
– Will Create More Work for Auditor and Actuary
4

Background and Overview of Proposed Standards
5

Key Players
• IASB. International Accounting Standards Board which issues:
– IFRS – International Financial Reporting Standards
• IFRIC. International Financial Reporting Interpretations Committee, which issues:
– IFRICs – Interpretations of the IFRS
• FASB. Financial Accounting Standards Board
6
7
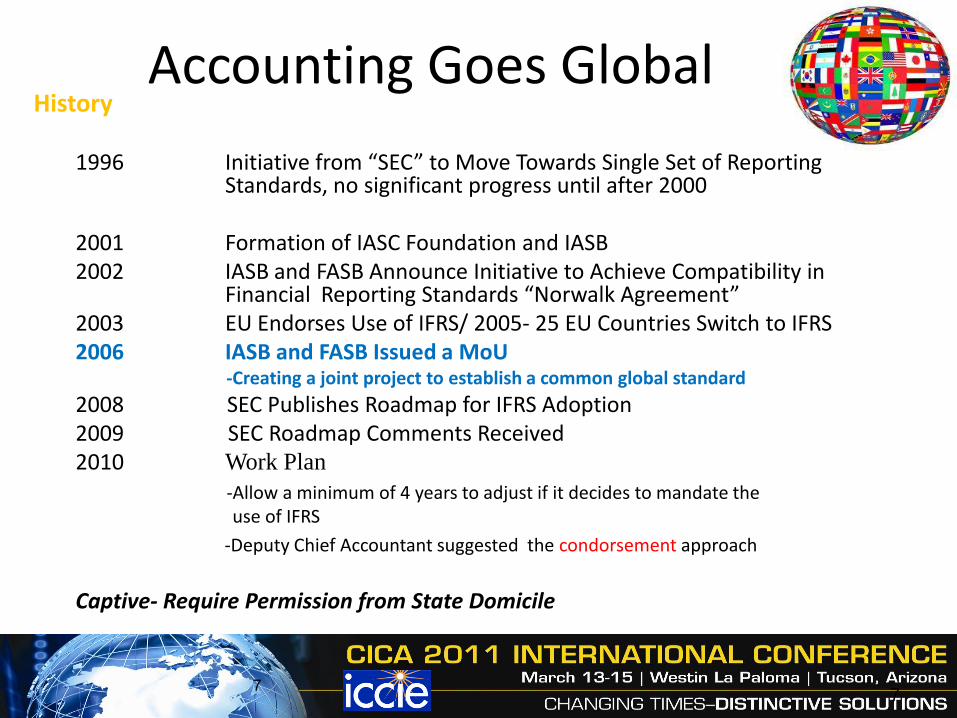
Accounting Goes GlobalHistory
1996 Initiative from “SEC” to Move Towards Single Set of Reporting Standards, no significant progress until after 2000
2001 Formation of IASC Foundation and IASB2002 IASB and FASB Announce Initiative to Achieve Compatibility in
Financial Reporting Standards “Norwalk Agreement”2003 EU Endorses Use of IFRS/ 2005- 25 EU Countries Switch to IFRS2006 IASB and FASB Issued a MoU
-Creating a joint project to establish a common global standard
2008 SEC Publishes Roadmap for IFRS Adoption2009 SEC Roadmap Comments Received2010 Work Plan
-Allow a minimum of 4 years to adjust if it decides to mandate the use of IFRS
-Deputy Chief Accountant suggested the condorsement approach
Captive- Require Permission from State Domicile
7
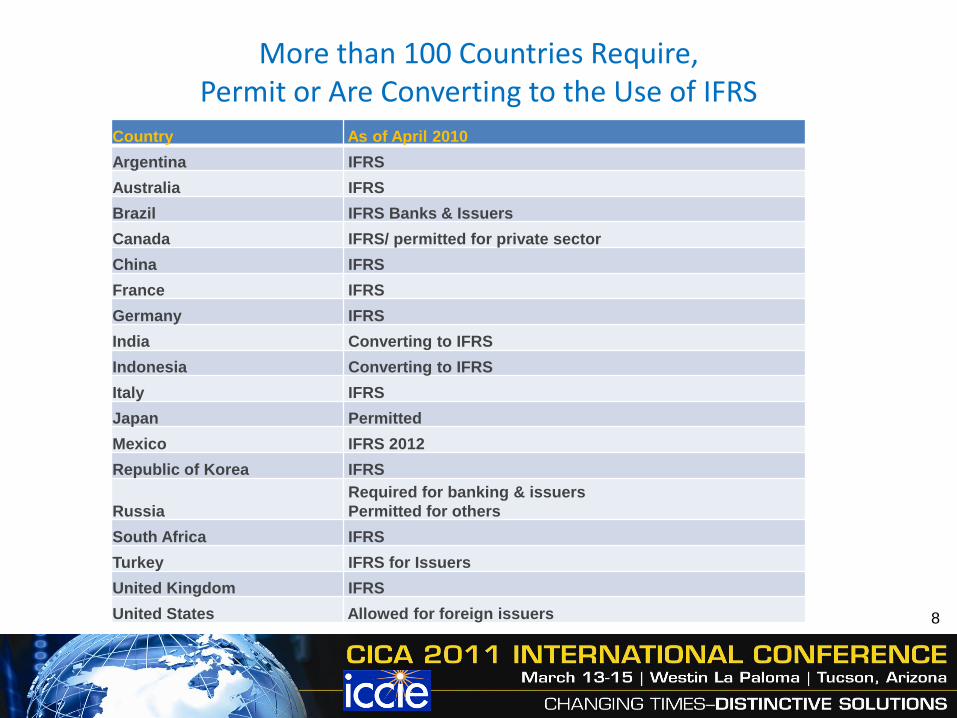
More than 100 Countries Require, Permit or Are Converting to the Use of IFRS
Country As of April 2010
Argentina IFRS
Australia IFRS
Brazil IFRS Banks & Issuers
Canada IFRS/ permitted for private sector
China IFRS
France IFRS
Germany IFRS
India Converting to IFRS
Indonesia Converting to IFRS
Italy IFRS
Japan Permitted
Mexico IFRS 2012
Republic of Korea IFRS
Russia
Required for banking & issuers
Permitted for others
South Africa IFRS
Turkey IFRS for Issuers
United Kingdom IFRS
United States Allowed for foreign issuers 8
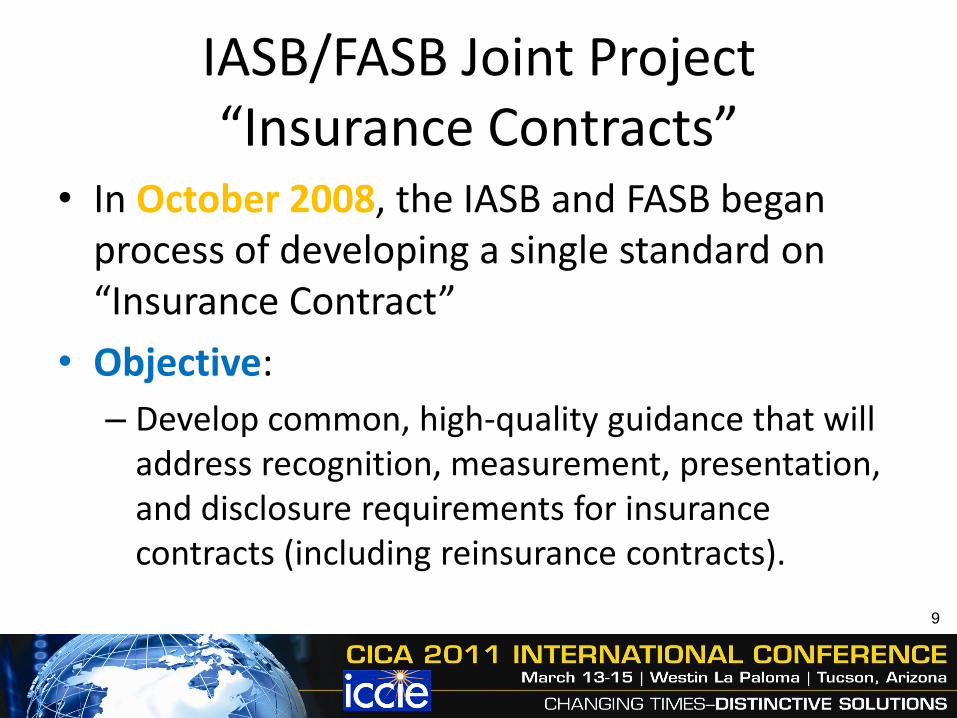
IASB/FASB Joint Project“Insurance Contracts”
• In October 2008, the IASB and FASB began process of developing a single standard on “Insurance Contract”
• Objective:
– Develop common, high-quality guidance that will address recognition, measurement, presentation, and disclosure requirements for insurance contracts (including reinsurance contracts).
9

IASB/FASB Joint Project
• IASB Exposure Draft issued July 2010 (comment period ended November 2010)
• FASB Discussion Paper issued September 2010 (comment period ended December 2010)
10

Insurance Contract
• “A contract under which one party (the insurer) accepts significant insurance risk from another party (the policyholder) by agreeing to compensate the policyholder if a specified uncertain future event (the insured event) adversely affects the policyholder.”
– Current GAAP→ A contract in which an insurance entity unconditionally undertakes a legal obligation to provide specified benefits to specific individuals in return for a fixed consideration or premium.
11
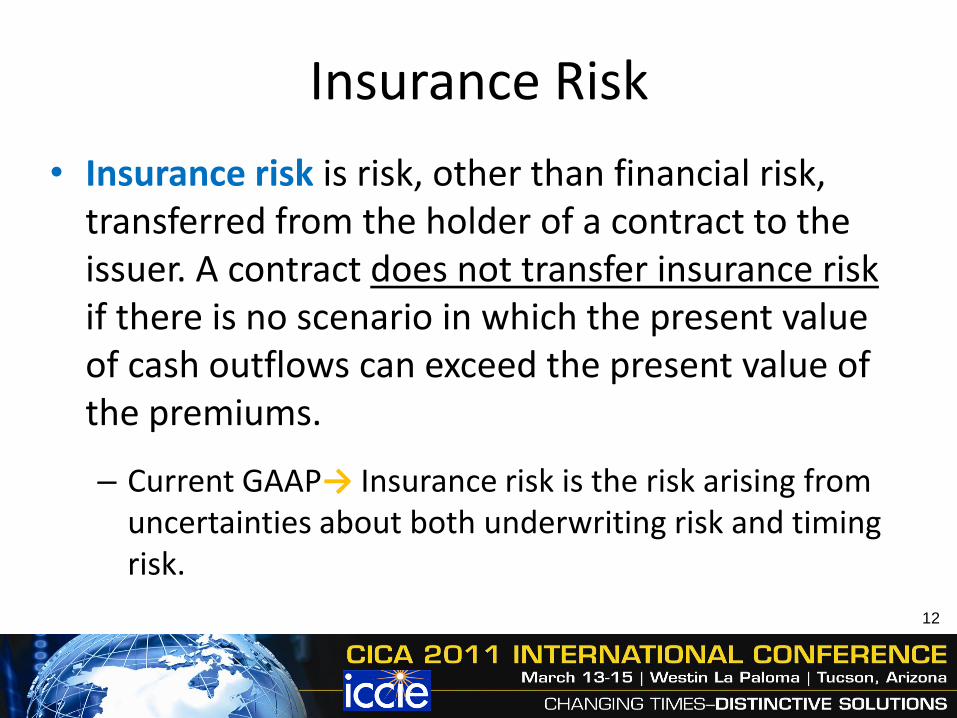
Insurance Risk
• Insurance risk is risk, other than financial risk, transferred from the holder of a contract to the issuer. A contract does not transfer insurance risk if there is no scenario in which the present value of cash outflows can exceed the present value of the premiums.
– Current GAAP→ Insurance risk is the risk arising from uncertainties about both underwriting risk and timing risk.
12
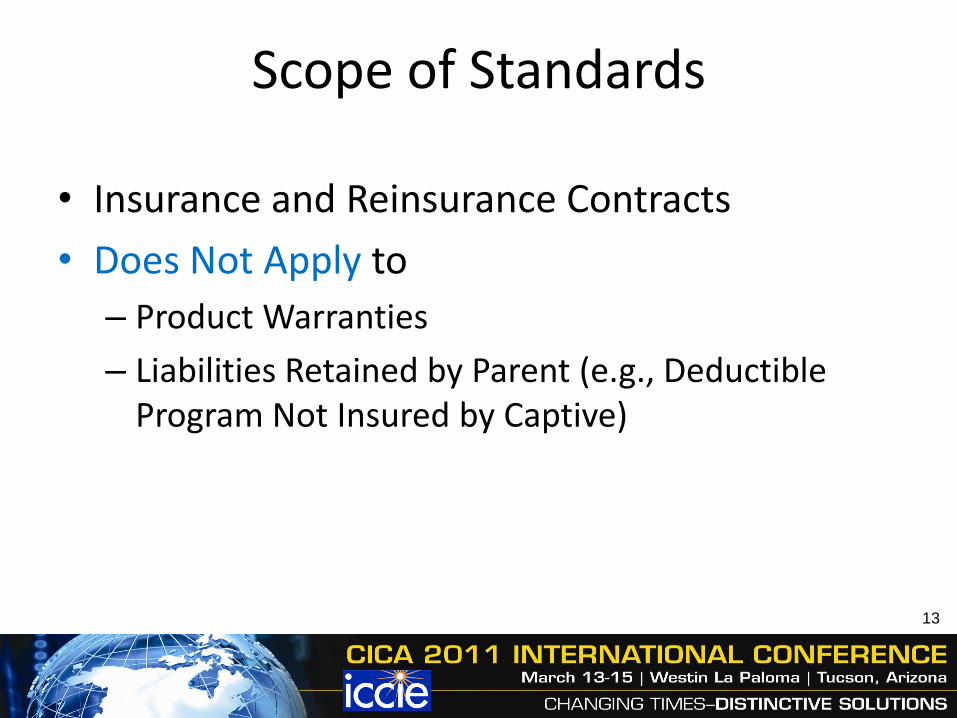
Scope of Standards
• Insurance and Reinsurance Contracts
• Does Not Apply to
– Product Warranties
– Liabilities Retained by Parent (e.g., Deductible Program Not Insured by Captive)
13
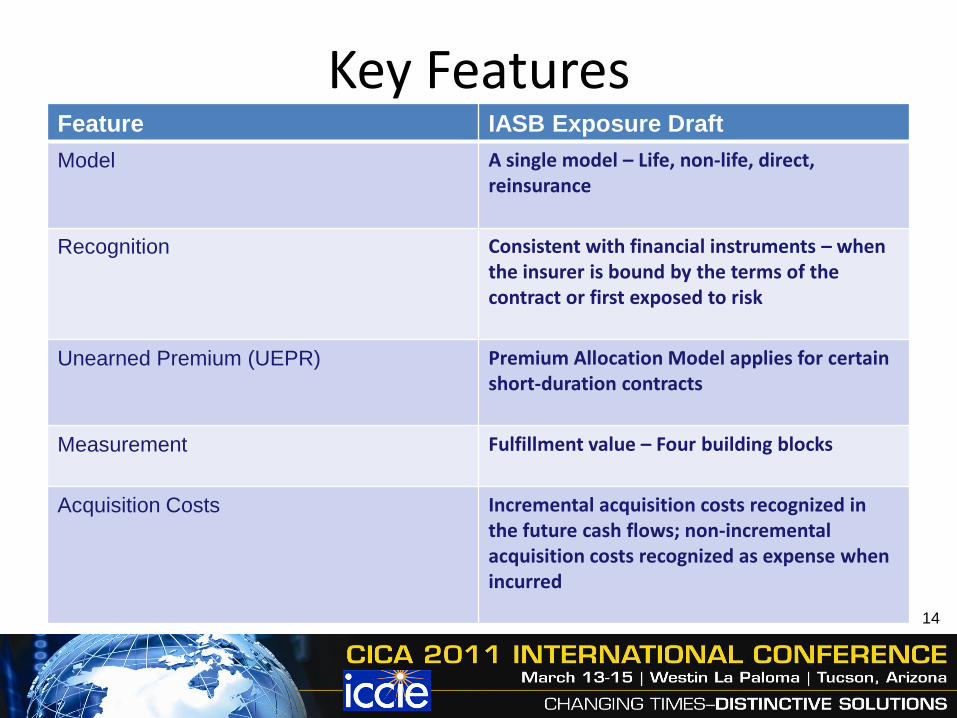
Key FeaturesFeature IASB Exposure Draft
Model A single model – Life, non-life, direct, reinsurance
Recognition Consistent with financial instruments – when the insurer is bound by the terms of the contract or first exposed to risk
Unearned Premium (UEPR) Premium Allocation Model applies for certain short-duration contracts
Measurement Fulfillment value – Four building blocks
Acquisition Costs Incremental acquisition costs recognized in the future cash flows; non-incremental acquisition costs recognized as expense when incurred
14
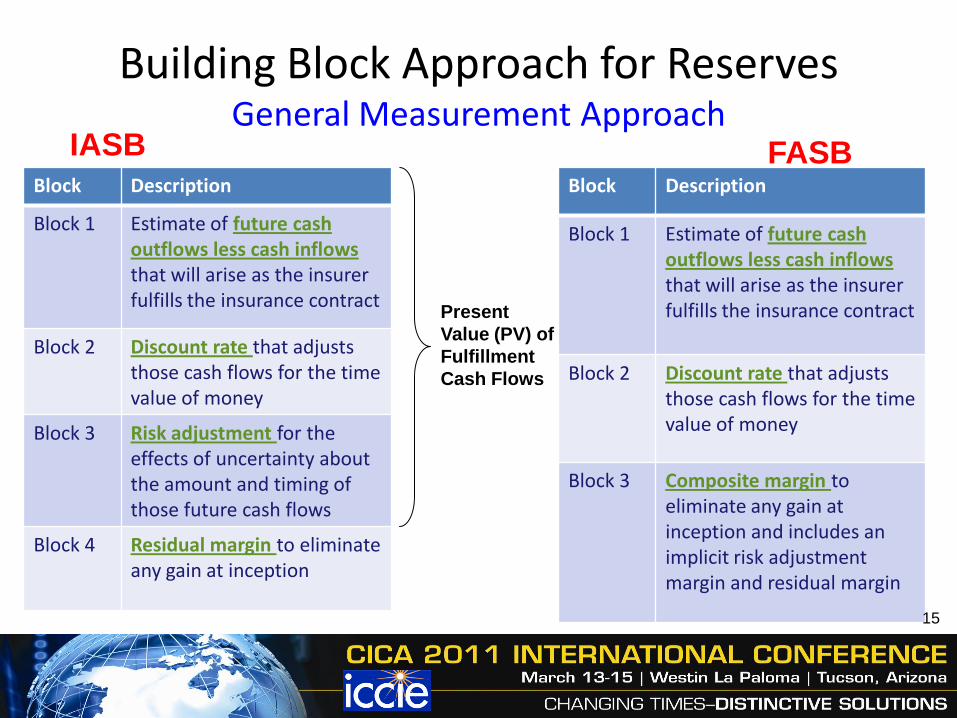
Building Block Approach for ReservesGeneral Measurement Approach
Block Description
Block 1 Estimate of future cash outflows less cash inflows that will arise as the insurer fulfills the insurance contract
Block 2 Discount rate that adjusts those cash flows for the time value of money
Block 3 Risk adjustment for the effects of uncertainty about the amount and timing of those future cash flows
Block 4 Residual margin to eliminate any gain at inception
Block Description
Block 1 Estimate of future cash outflows less cash inflows that will arise as the insurer fulfills the insurance contract
Block 2 Discount rate that adjusts those cash flows for the time value of money
Block 3 Composite margin to eliminate any gain at inception and includes an implicit risk adjustment margin and residual margin
IASB FASB
Present
Value (PV) of
Fulfillment
Cash Flows
15

Building Block Approach for Captives
• Captives Generally Write Short Duration Contracts (Policy Period of 12 Months or Less)
• Under IFRS, Modified Approach Applies to Short Duration Contracts
– Discounted
– With Risk Adjustment
– Without Residual Margin
16

Calculation of Loss ReservesOld Way New Way
Estimated
Undiscounted
Reserves
Sum of
Projected Paid
Loss Cash
Flows
Estimated
Discounted
Reserves
Estimated
Discounted
Reserves
Plus Risk
AdjustmentLess Amount of
Discount
17
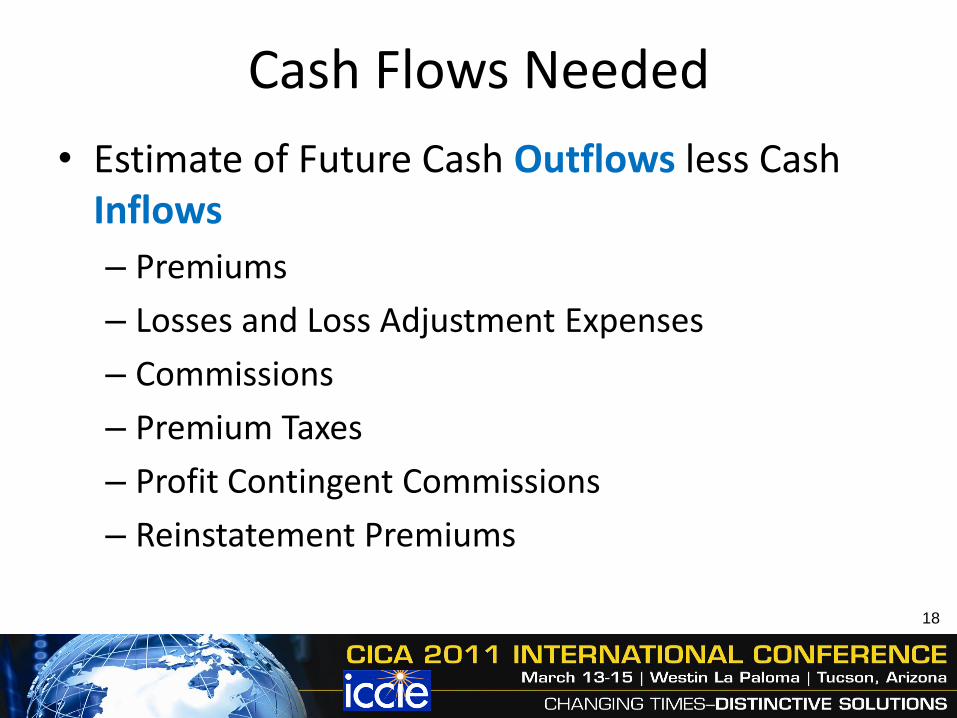
Cash Flows Needed
• Estimate of Future Cash Outflows less Cash Inflows
– Premiums
– Losses and Loss Adjustment Expenses
– Commissions
– Premium Taxes
– Profit Contingent Commissions
– Reinstatement Premiums
18

Reserving Assumptions
• Portfolios of Insurance Contracts
• “Mean” Reserve Estimate
• Discount Rate
• Payment Pattern
• Risk Adjustment
19

Portfolio of Insurance Contracts
Insurance Contracts that are Subject to Broadly Similar Risks and Managed Together as a Single Pool
By similar date of initial recognition of the contract and coverage periods
20

Mean Reserve Estimate
• Estimate Cash Outflows
– Explicit, Unbiased and Probability-Weighted Estimates of Future Paid Losses• Range of scenarios that reflect full range of possible outcomes
• Not to include all scenarios but must incorporate all relevant information
• Not reasonably possible scenarios not expected to be considered
The Mean
21
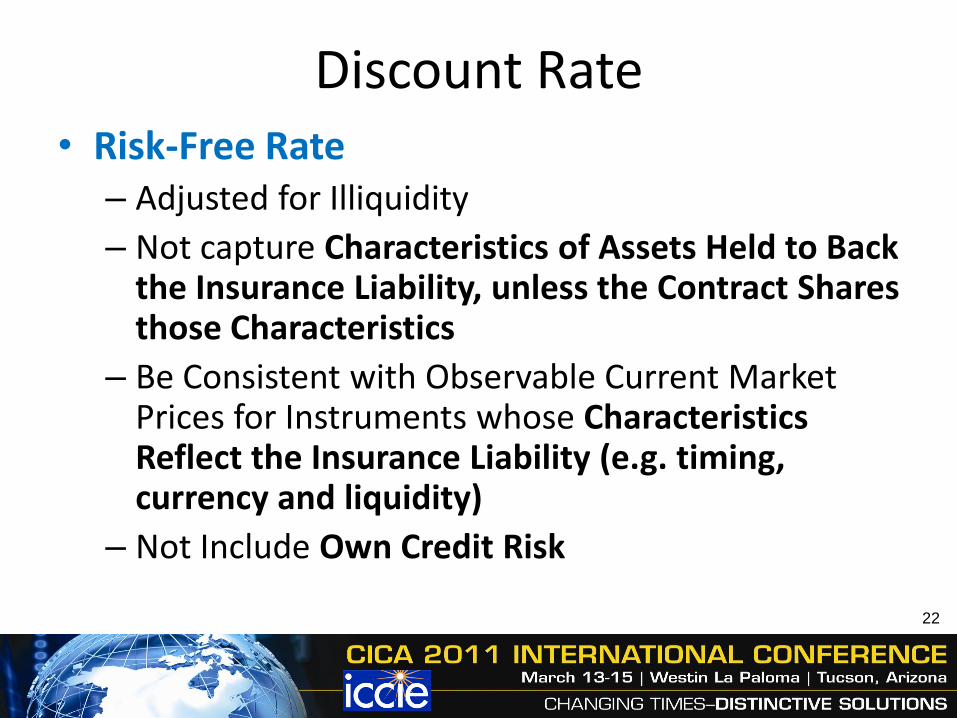
Discount Rate• Risk-Free Rate
– Adjusted for Illiquidity
– Not capture Characteristics of Assets Held to Back the Insurance Liability, unless the Contract Shares those Characteristics
– Be Consistent with Observable Current Market Prices for Instruments whose Characteristics Reflect the Insurance Liability (e.g. timing, currency and liquidity)
– Not Include Own Credit Risk
22

Payment Pattern
• Used to Project Paid Losses (Block 1)
• Discount Paid Losses (Block 2)
• Needed to Compare Actual vs. Expected Paid Losses
23

Risk AdjustmentIASB Version
24
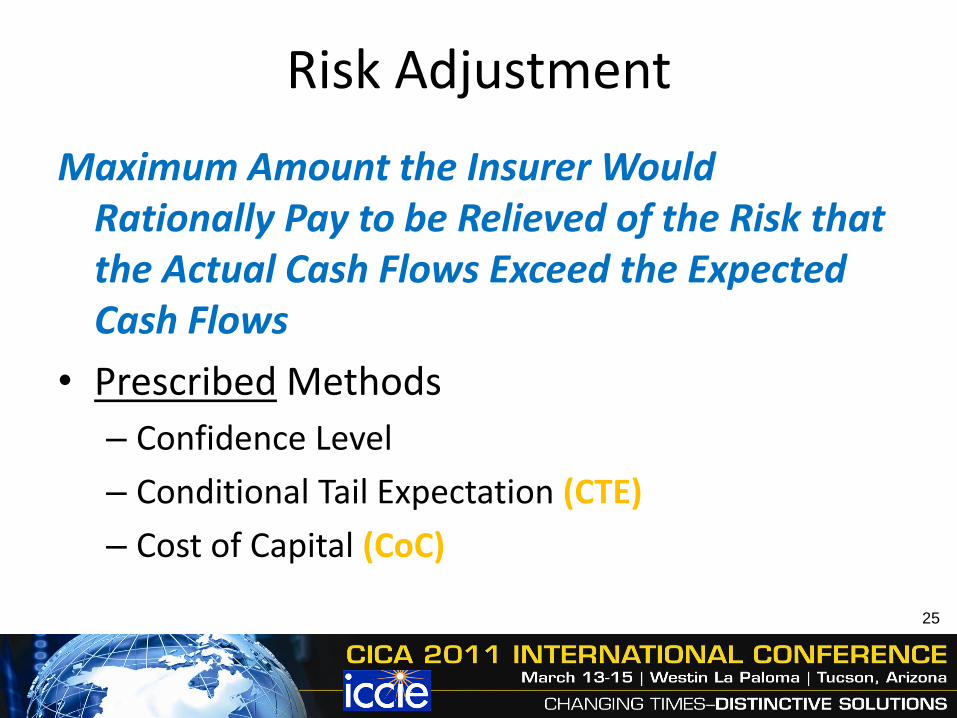
Risk Adjustment
Maximum Amount the Insurer Would Rationally Pay to be Relieved of the Risk that the Actual Cash Flows Exceed the Expected Cash Flows
• Prescribed Methods
– Confidence Level
– Conditional Tail Expectation (CTE)
– Cost of Capital (CoC)
25

Risk Adjustment Example
• Workers Compensation
• $100 Million Annual Expected Losses
– 10-Year Payment Pattern
– Year 1 Expected Paid Losses = $15 Million
– Expected Reserves end of Year 1 = $85 Million
26
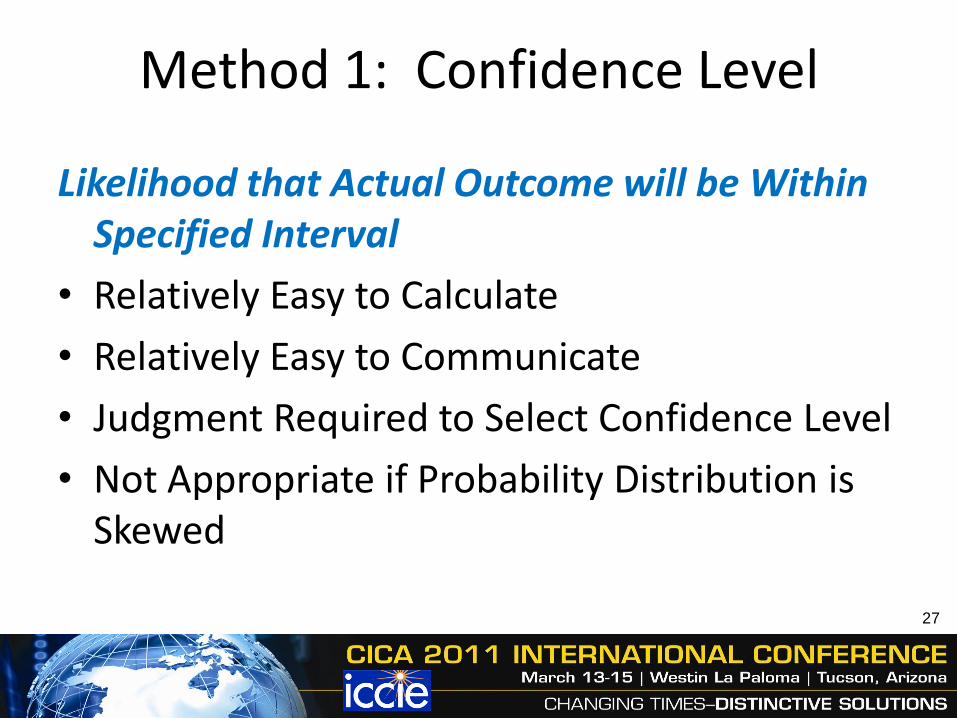
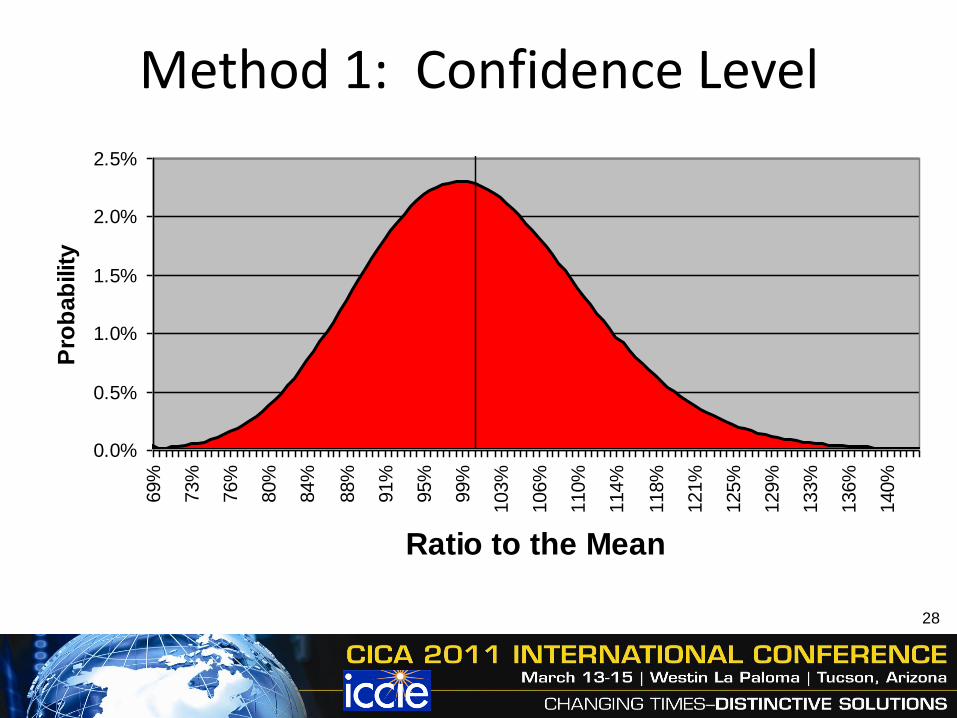
Method 1: Confidence Level
Likelihood that Actual Outcome will be Within Specified Interval
• Relatively Easy to Calculate
• Relatively Easy to Communicate
• Judgment Required to Select Confidence Level
• Not Appropriate if Probability Distribution is Skewed
27
Method 1: Confidence Level
0.0%
0.5%
1.0%
1.5%
2.0%
2.5%69%
73%
76%
80%
84%
88%
91%
95%
99%
103%
106%
110%
114%
118%
121%
125%
129%
133%
136%
140%
Ratio to the Mean
Pro
ba
bilit
y
28
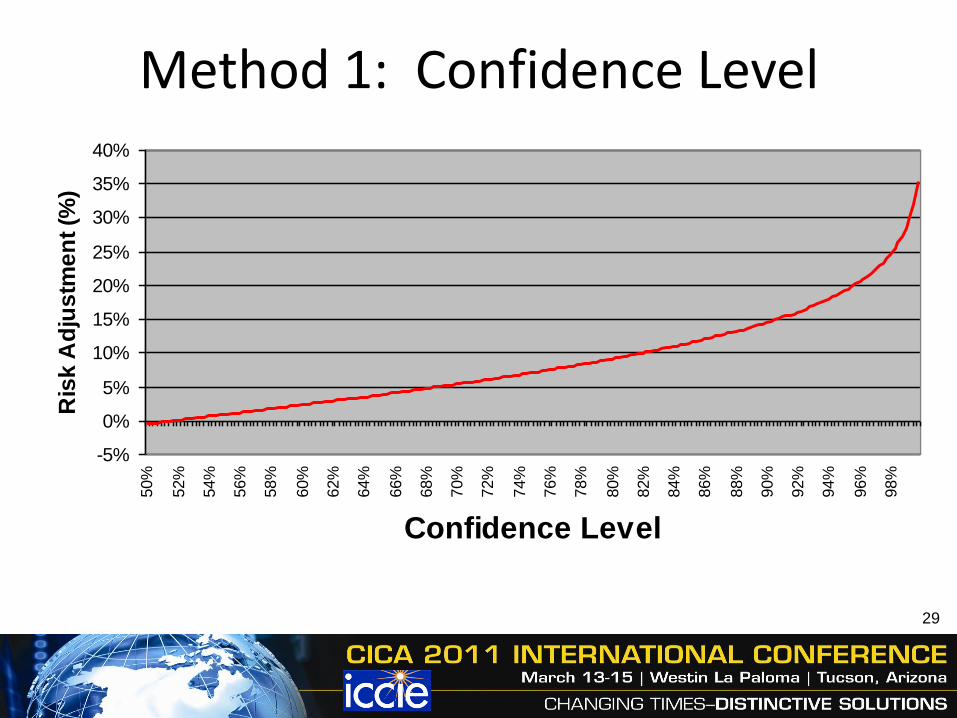
Method 1: Confidence Level
-5%
0%
5%
10%
15%
20%
25%
30%
35%
40%50%
52%
54%
56%
58%
60%
62%
64%
66%
68%
70%
72%
74%
76%
78%
80%
82%
84%
86%
88%
90%
92%
94%
96%
98%
Confidence Level
Ris
k A
dju
stm
en
t (%
)
29

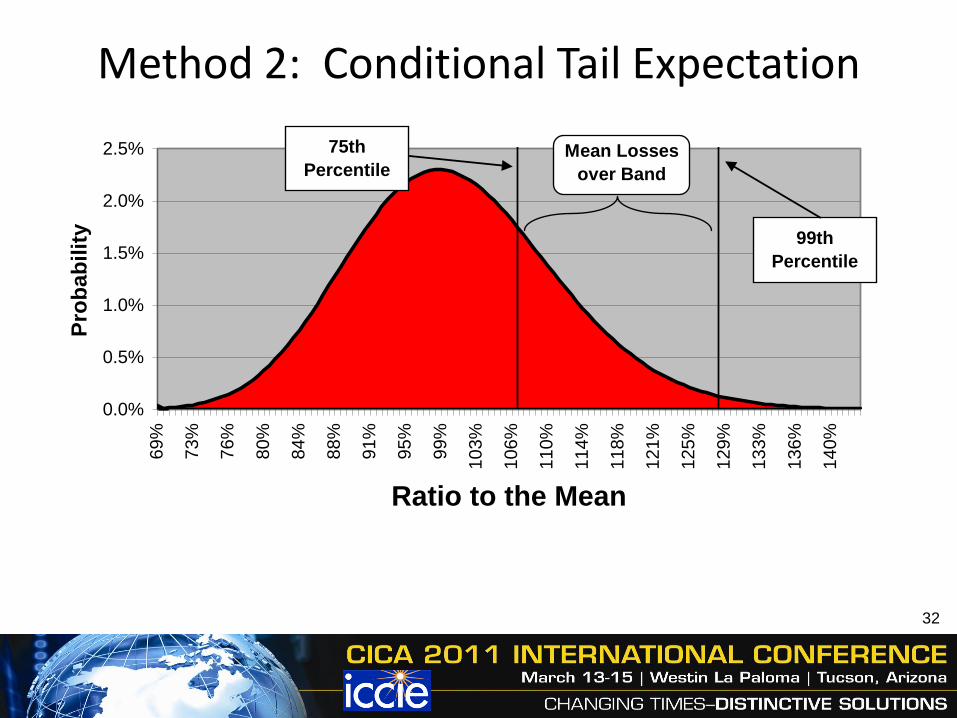
Method 2: Conditional Tail Expectation
Expected Value of Extreme Losses
• Relatively Easy to Calculate
• Little Harder to Communicate
• Appropriate if Probability Distribution is Skewed
• Judgment Required to Select CTE Band
• Difficult to Reliably Estimate Tail of Reserve Distribution
30

Method 2: Conditional Tail Expectation
(1) Select Confidence Level Band
Low End = 75th Percentile 106.9% of Expected Losses
High End = 99th Percentile 128.1% of Expected Losses
(2) Calculate Mean Losses within Band * 113.6% of Expected Losses
* probability-weighted average across CTE band
(3) Risk Adjustment 13.6% of Expected Losses
31
Method 2: Conditional Tail Expectation
0.0%
0.5%
1.0%
1.5%
2.0%
2.5%69%
73%
76%
80%
84%
88%
91%
95%
99%
103%
106%
110%
114%
118%
121%
125%
129%
133%
136%
140%
Ratio to the Mean
Pro
ba
bilit
y
Mean Losses
over Band
75th
Percentile
99th
Percentile
32
Method 3: Cost of Capital
Present Value of Cost of Holding Capital Required to Provide for Targeted Confidence Level of Reserves
• Target Confidence Level Should be High
• Capital Rate Reflects Only Risks Relevant to Insurance Liability
• Appropriate if Probability Distribution is Skewed
33

Method 3: Cost of Capital(1) (2) (3) (4) (5) (6) (7) (8)
Risk (2)x(3) (4)x(5)
Adjustment Discounted Percent
Ending at 99.5th Capital Capital Cost of Cost of of Year 1
Year Reserves Percentile Needed Rate Capital Capital Reserves
1 85 31.9% 27.09 15% 4.06 4.06
2 65 31.9% 20.71 15% 3.11 2.70
3 45 31.9% 14.34 15% 2.15 1.63
4 30 31.9% 9.56 15% 1.43 0.94
5 20 31.9% 6.37 15% 0.96 0.55
6 15 31.9% 4.78 15% 0.72 0.36
7 10 31.9% 3.19 15% 0.48 0.21
8 5 31.9% 1.59 15% 0.24 0.09
9 2 31.9% 0.64 15% 0.10 0.03
10 0 31.9% 0.00 15% 0.00 0.00
Total 13.24 10.57 12.4%
34

Comparison of Methods
0%
5%
10%
15%
20%
25%
30%
35%
40%60%
63%
65%
68%
71%
74%
76%
79%
82%
85%
87%
90%
93%
96%
98%
Confidence Level
Ris
k A
dju
stm
en
t (%
)
CTE Band to 99th
CTE Band to 95th
Confidence Level
Cost of Capital at 15%
35

10% Risk Adjustment Equivalents
0%
5%
10%
15%
20%
25%
30%
35%
40%60%
63%
65%
68%
71%
74%
76%
79%
82%
85%
87%
90%
93%
96%
98%
Confidence Level
Ris
k A
dju
stm
en
t (%
)
CTE Band to 99th
CTE Band to 95th
Confidence Level
Cost of Capital at 15%
36
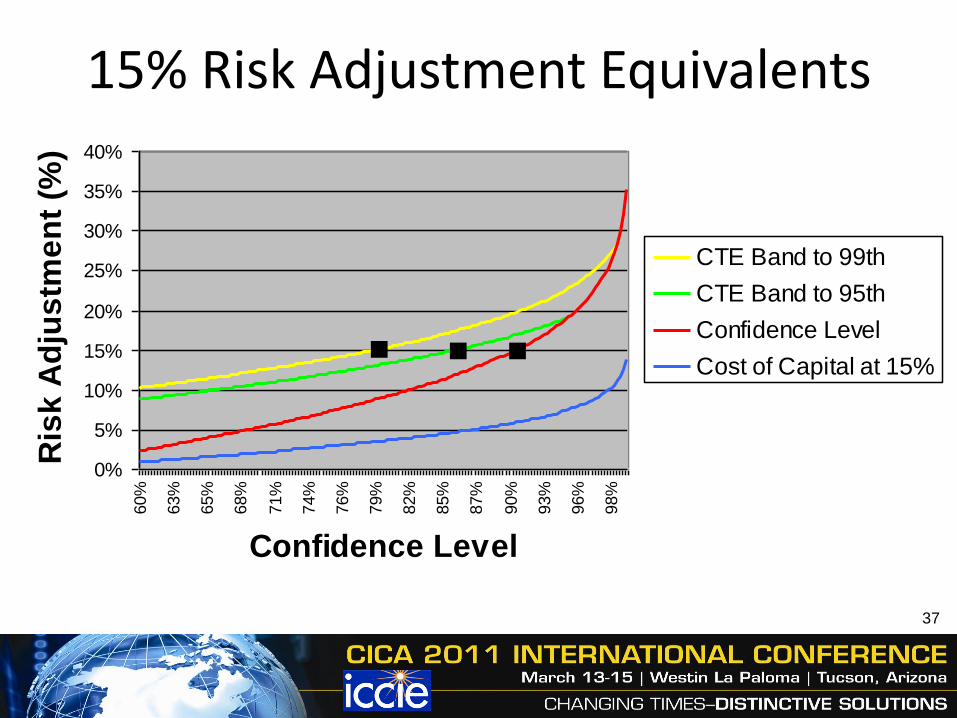
15% Risk Adjustment Equivalents
0%
5%
10%
15%
20%
25%
30%
35%
40%60%
63%
65%
68%
71%
74%
76%
79%
82%
85%
87%
90%
93%
96%
98%
Confidence Level
Ris
k A
dju
stm
en
t (%
)
CTE Band to 99th
CTE Band to 95th
Confidence Level
Cost of Capital at 15%
37

Factors that Increase “Risk Adjustment”
• Low Frequency and High Severity
• Long-Tail Lines of Business
• Wide Probability Distribution
• Uncertainty of Current Estimate and Trend
• Maturity of Policy Year
38

Risk Adjustment Across Portfolios
• IFRS Exposure Draft States Risk Adjustment Shall Not Reflect Diversification Between Portfolios
– Frequent Subject of Comment Letters
39
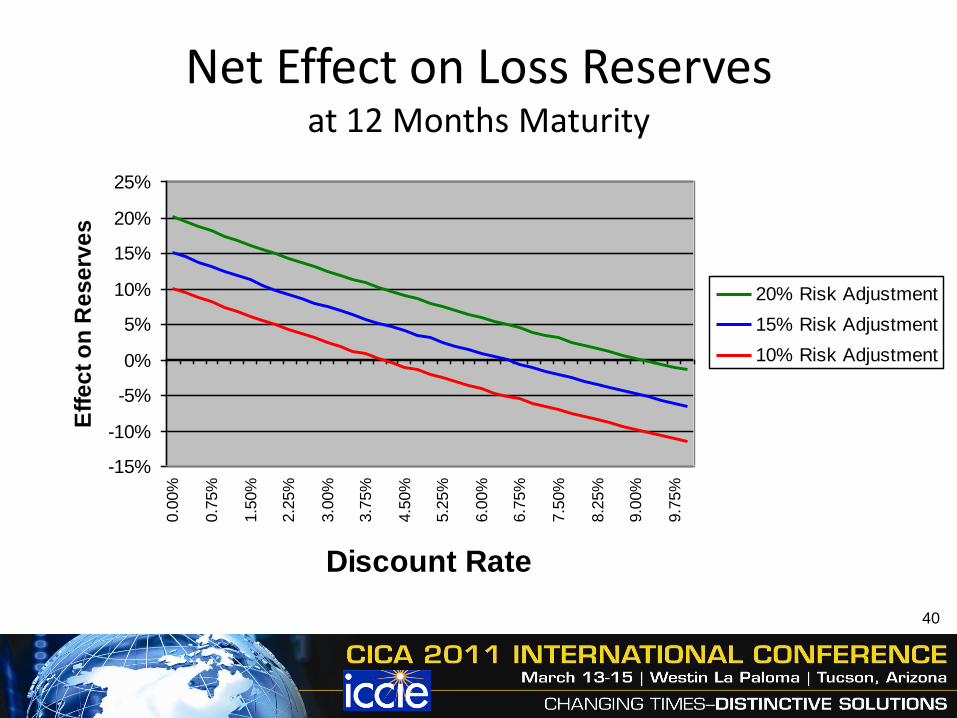
Net Effect on Loss Reservesat 12 Months Maturity
-15%
-10%
-5%
0%
5%
10%
15%
20%
25%0.0
0%
0.7
5%
1.5
0%
2.2
5%
3.0
0%
3.7
5%
4.5
0%
5.2
5%
6.0
0%
6.7
5%
7.5
0%
8.2
5%
9.0
0%
9.7
5%
Discount Rate
Eff
ec
t o
n R
es
erv
es
20% Risk Adjustment
15% Risk Adjustment
10% Risk Adjustment
40

Case Study
41
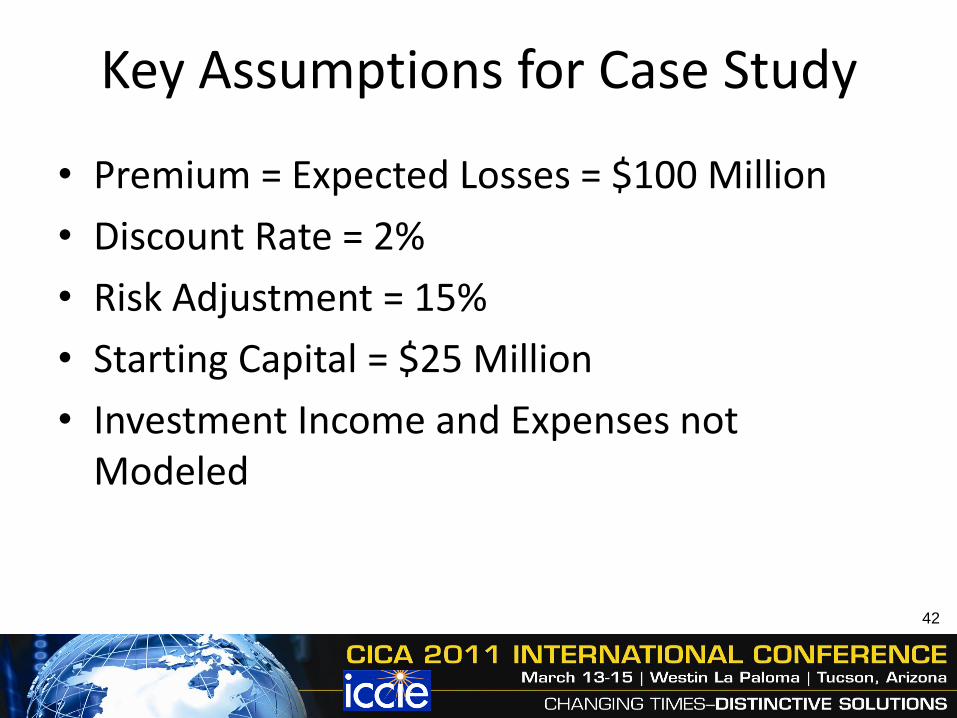
Key Assumptions for Case Study
• Premium = Expected Losses = $100 Million
• Discount Rate = 2%
• Risk Adjustment = 15%
• Starting Capital = $25 Million
• Investment Income and Expenses not Modeled
42

Calculation of Loss ReservesOld Way New Way
Estimated
Undiscounted
Reserves
Sum of
Projected Paid
Loss Cash
Flows
Estimated
Discounted
Reserves
Estimated
Discounted
Reserves
Plus Risk
AdjustmentLess Amount of
Discount
43
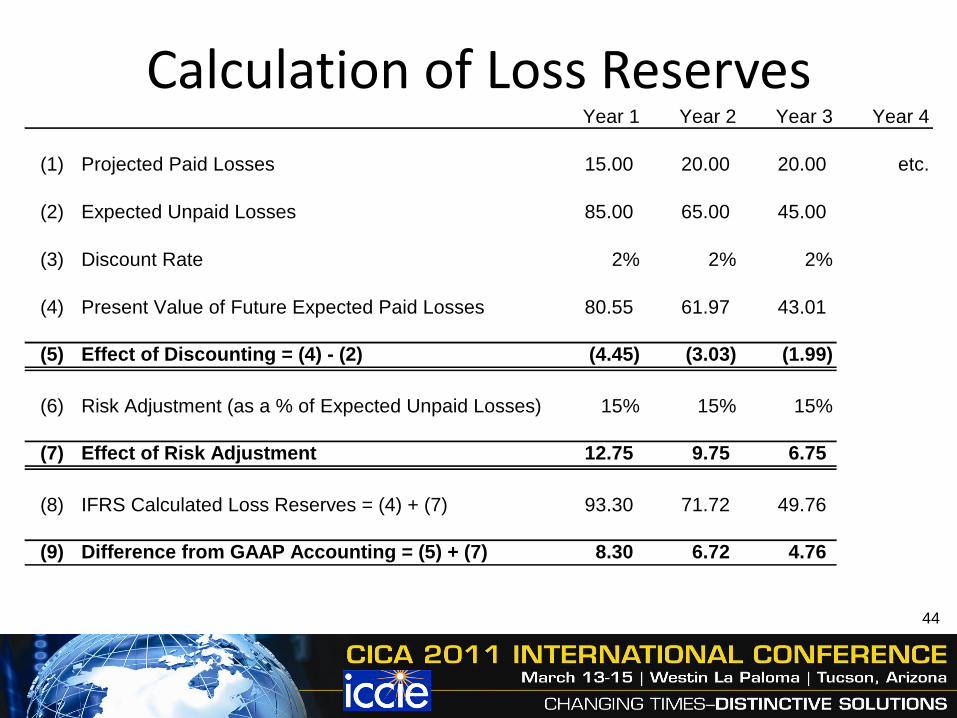
Calculation of Loss ReservesYear 1 Year 2 Year 3 Year 4
(1) Projected Paid Losses 15.00 20.00 20.00 etc.
(2) Expected Unpaid Losses 85.00 65.00 45.00
(3) Discount Rate 2% 2% 2%
(4) Present Value of Future Expected Paid Losses 80.55 61.97 43.01
(5) Effect of Discounting = (4) - (2) (4.45) (3.03) (1.99)
(6) Risk Adjustment (as a % of Expected Unpaid Losses) 15% 15% 15%
(7) Effect of Risk Adjustment 12.75 9.75 6.75
(8) IFRS Calculated Loss Reserves = (4) + (7) 93.30 71.72 49.76
(9) Difference from GAAP Accounting = (5) + (7) 8.30 6.72 4.76
44

Effect on Financial Statements
• Does Not Affect Cash Items
– Paid Losses and Expenses
– Investment Income
• Affects Earned Income
– Loss Reserves
– Underwriting Income
– Net Income
– Surplus
45
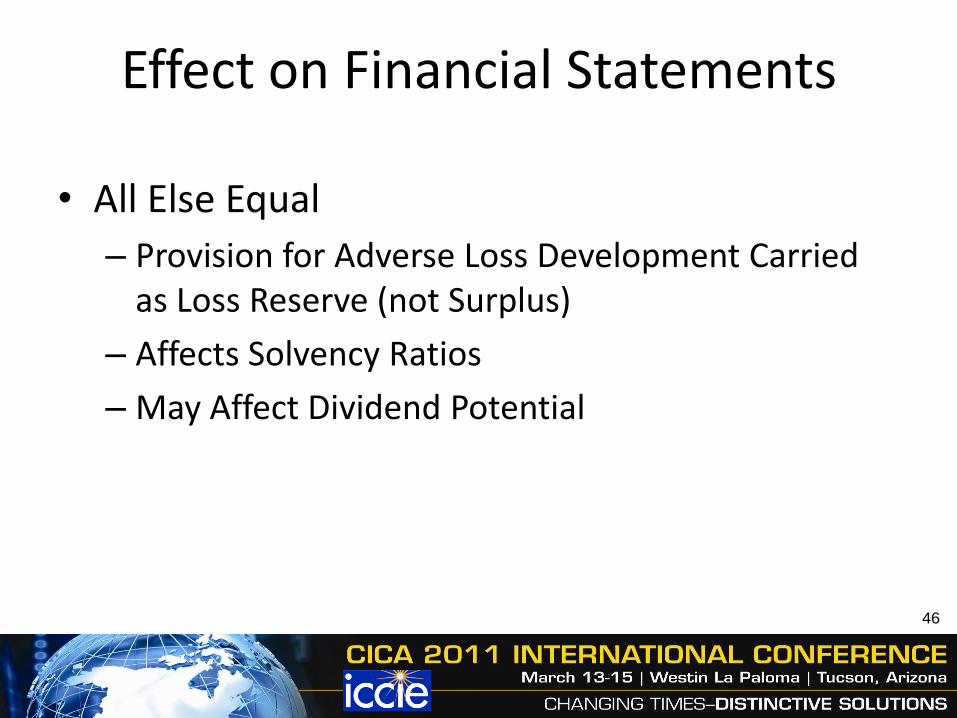
Effect on Financial Statements
• All Else Equal
– Provision for Adverse Loss Development Carried as Loss Reserve (not Surplus)
– Affects Solvency Ratios
– May Affect Dividend Potential
46

Financial StatementsSingle Policy Year
GAAP Basis Yr1 Yr2 Yr3 Yr4 Yr5 Yr6 Yr7 Yr8 Yr9 Yr10
(1) Earned Premium 100 0 0 0 0 0 0 0 0 0
(2) Paid Losses 15 20 20 15 10 5 5 5 3 2
(3) Loss Reserves 85 65 45 30 20 15 10 5 2 0
(4) Incurred Losses 100 0 0 0 0 0 0 0 0 0
(5) Net Income 0 0 0 0 0 0 0 0 0 0
(6) Ending Surplus 25 25 25 25 25 25 25 25 25 25
IFRS Basis Yr1 Yr2 Yr3 Yr4 Yr5 Yr6 Yr7 Yr8 Yr9 Yr10
(1) Earned Premium 100 0 0 0 0 0 0 0 0 0
(2) Paid Losses 15 20 20 15 10 5 5 5 3 2
(3a) Undisc Reserves 85 65 45 30 20 15 10 5 2 0
(3b) Discount Adjustment (4.45) (3.03) (1.99) (1.28) (0.81) (0.47) (0.23) (0.09) (0.02) 0.00
(3c) Risk Adjustment 12.75 9.75 6.75 4.50 3.00 2.25 1.50 0.75 0.30 0.00
(3) Loss Reserves 93.30 71.72 49.76 33.22 22.19 16.78 11.27 5.66 2.28 0.00
(4) Incurred Losses 108.30 (1.59) (1.96) (1.54) (1.03) (0.42) (0.51) (0.60) (0.38) (0.28)
(5) Net Income (8.30) 1.59 1.96 1.54 1.03 0.42 0.51 0.60 0.38 0.28
(6) Ending Surplus 16.70 18.28 20.24 21.78 22.81 23.22 23.73 24.34 24.72 25.00
47

Effect on Financial StatementsSingle Policy Year
Calendar Year Incurred Losses
Change in Change in
Year GAAP Discount Risk Adj IFRS
1 100.00 (4.45) 12.75 108.30
2 0.00 1.41 (3.00) (1.59)
3 0.00 1.04 (3.00) (1.96)
4 0.00 0.71 (2.25) (1.54)
5 0.00 0.47 (1.50) (1.03)
6 0.00 0.33 (0.75) (0.42)
7 0.00 0.24 (0.75) (0.51)
8 0.00 0.15 (0.75) (0.60)
9 0.00 0.07 (0.45) (0.38)
10 0.00 0.02 (0.30) (0.28)
Total 100.00 0.00 0.00 100.00
Loss of $8.30
48
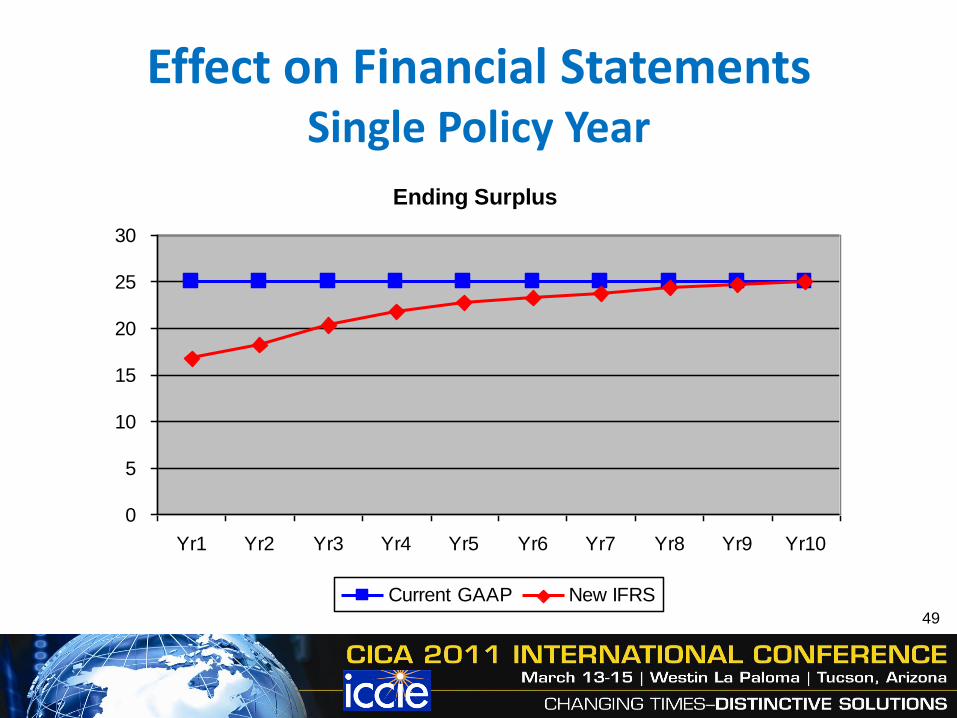
Effect on Financial StatementsSingle Policy Year
Ending Surplus
0
5
10
15
20
25
30
Yr1 Yr2 Yr3 Yr4 Yr5 Yr6 Yr7 Yr8 Yr9 Yr10
Current GAAP New IFRS49
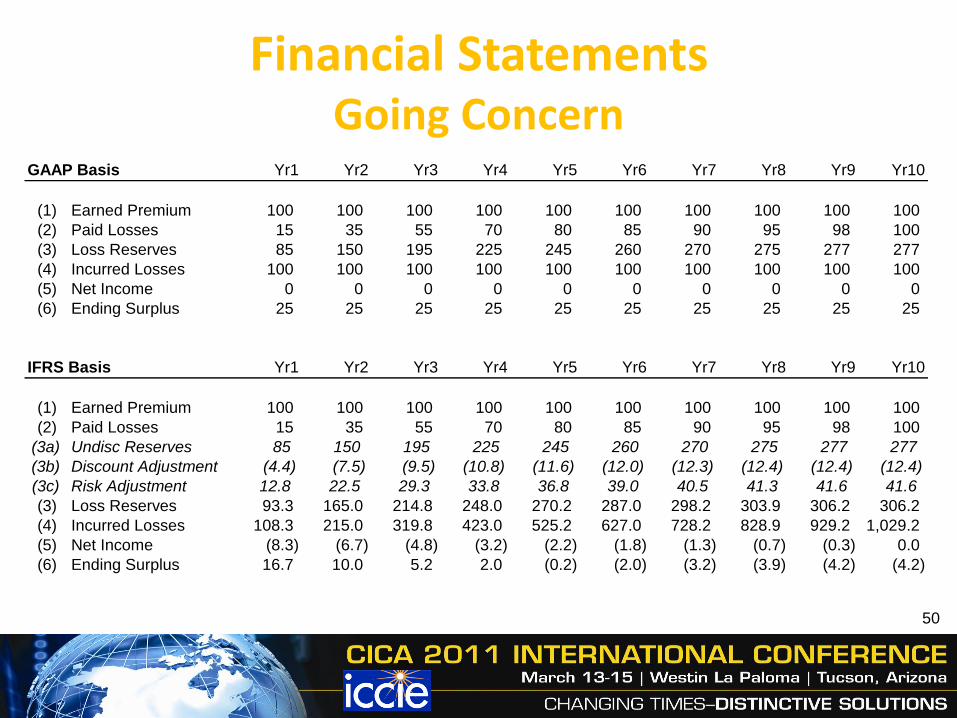
Financial StatementsGoing Concern
GAAP Basis Yr1 Yr2 Yr3 Yr4 Yr5 Yr6 Yr7 Yr8 Yr9 Yr10
(1) Earned Premium 100 100 100 100 100 100 100 100 100 100
(2) Paid Losses 15 35 55 70 80 85 90 95 98 100
(3) Loss Reserves 85 150 195 225 245 260 270 275 277 277
(4) Incurred Losses 100 100 100 100 100 100 100 100 100 100
(5) Net Income 0 0 0 0 0 0 0 0 0 0
(6) Ending Surplus 25 25 25 25 25 25 25 25 25 25
IFRS Basis Yr1 Yr2 Yr3 Yr4 Yr5 Yr6 Yr7 Yr8 Yr9 Yr10
(1) Earned Premium 100 100 100 100 100 100 100 100 100 100
(2) Paid Losses 15 35 55 70 80 85 90 95 98 100
(3a) Undisc Reserves 85 150 195 225 245 260 270 275 277 277
(3b) Discount Adjustment (4.4) (7.5) (9.5) (10.8) (11.6) (12.0) (12.3) (12.4) (12.4) (12.4)
(3c) Risk Adjustment 12.8 22.5 29.3 33.8 36.8 39.0 40.5 41.3 41.6 41.6
(3) Loss Reserves 93.3 165.0 214.8 248.0 270.2 287.0 298.2 303.9 306.2 306.2
(4) Incurred Losses 108.3 215.0 319.8 423.0 525.2 627.0 728.2 828.9 929.2 1,029.2
(5) Net Income (8.3) (6.7) (4.8) (3.2) (2.2) (1.8) (1.3) (0.7) (0.3) 0.0
(6) Ending Surplus 16.7 10.0 5.2 2.0 (0.2) (2.0) (3.2) (3.9) (4.2) (4.2)
50

Effect on Financial StatementsGoing Concern
Calendar Year Incurred Losses
Change in Change in
Year GAAP Discount Risk Adj IFRS
1 100.00 (4.45) 12.75 108.30
2 100.00 (3.03) 9.75 106.72
3 100.00 (1.99) 6.75 104.76
4 100.00 (1.28) 4.50 103.22
5 100.00 (0.81) 3.00 102.19
6 100.00 (0.47) 2.25 101.78
7 100.00 (0.23) 1.50 101.27
8 100.00 (0.09) 0.75 100.66
9 100.00 (0.02) 0.30 100.28
10 100.00 0.00 0.00 100.00
Total 1,000.00 (12.38) 41.55 1,029.1751

Effect on Financial StatementsGoing Concern
Ending Surplus
(10)
(5)
0
5
10
15
20
25
30
Yr1 Yr2 Yr3 Yr4 Yr5 Yr6 Yr7 Yr8 Yr9 Yr10
Current GAAP New IFRS
52
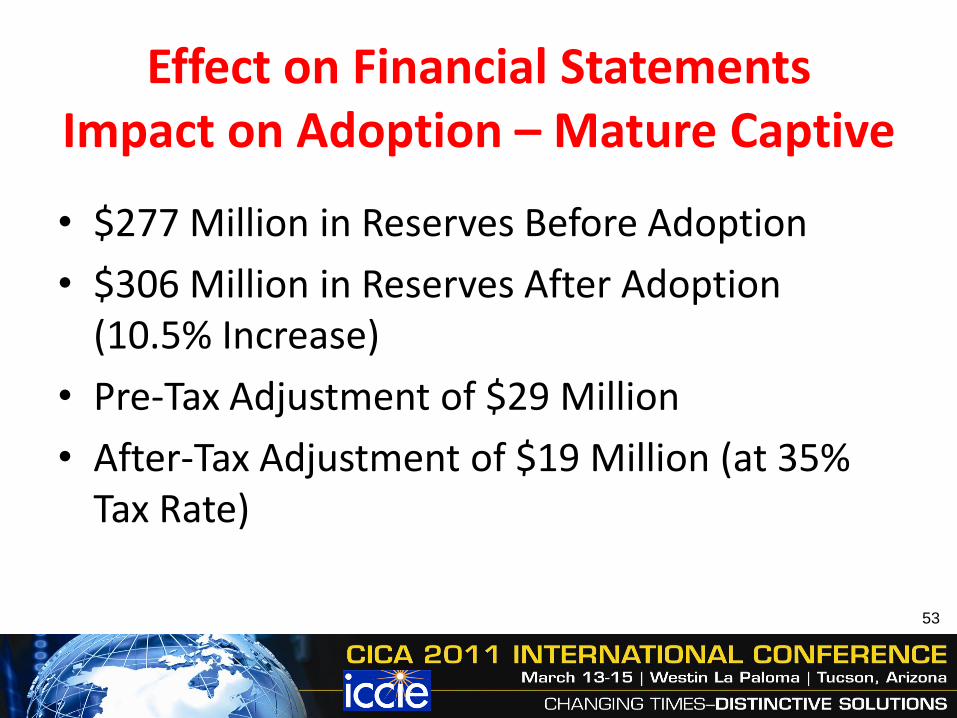
Effect on Financial StatementsImpact on Adoption – Mature Captive
• $277 Million in Reserves Before Adoption
• $306 Million in Reserves After Adoption (10.5% Increase)
• Pre-Tax Adjustment of $29 Million
• After-Tax Adjustment of $19 Million (at 35% Tax Rate)
53

Effect of Discount Rate Changes
• Changes in Discount Rate will Cause Fluctuations in Earned Income
Calendar Year Incurred Losses
90
95
100
105
110
115
Yr1 Yr2 Yr3 Yr4 Yr5 Yr6 Yr7 Yr8 Yr9 Yr10
IFRS at Constant 3.5% Rate IFRS at Actual 2001 to 2010 Rates
54
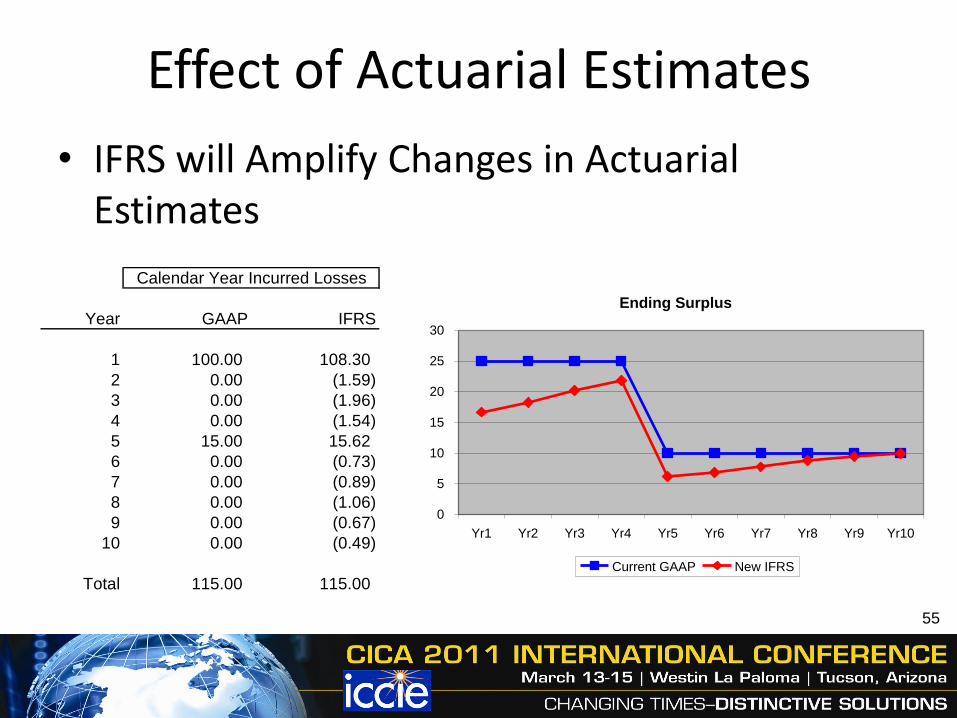
Effect of Actuarial Estimates
• IFRS will Amplify Changes in Actuarial Estimates
Calendar Year Incurred Losses
Year GAAP IFRS
1 100.00 108.30
2 0.00 (1.59)
3 0.00 (1.96)
4 0.00 (1.54)
5 15.00 15.62
6 0.00 (0.73)
7 0.00 (0.89)
8 0.00 (1.06)
9 0.00 (0.67)
10 0.00 (0.49)
Total 115.00 115.00
Ending Surplus
0
5
10
15
20
25
30
Yr1 Yr2 Yr3 Yr4 Yr5 Yr6 Yr7 Yr8 Yr9 Yr10
Current GAAP New IFRS
55

Additional Disclosures
56

Additional Disclosures
• “An Insurer shall Disclose Information About the Nature and Extent of Risks Arising from Insurance Contracts in Sufficient Detail to Help Users of Financial Statements Evaluate the Amount, Timing, and Uncertainty of Future Cash Flows Arising from Insurance Contracts.”
57

Additional Disclosures
• Exposures to Risk and How They Arise
• Objectives and Policies for Managing Risk
• Effect (if any) of Regulatory Framework
• Sensitivity to Insurance Risk in Relation to Effect on Profit/Loss/Equity
• Concentrations of Insurance Risk
• Actual Claims vs. Previous Estimates
58

Additional Disclosures
• Methods Used to Estimate Risk Adjustment
• Process for Estimating Inputs to Methods
• Confidence Level Assumptions
• Discount Rates
• Effect of Changes in Inputs (if Material)
59
Additional Reconciliation Items
• Change in Risk Adjustment
• Experience Adjustments (Actual vs. Expected Losses)
• Changes in Estimates of Cash Flows and Changes in Discount Rates
• Interest on Insurance Contract Liabilities
60

Update on Proposed Standards
61

Recent FASB/IASB Activity• 2011 Boards’ Discussions
– Received Many Comment Letters of Very High Quality (249 IASB/ 49 FASB)
– Comments Similar in Nature
62
62

Recent FASB/IASB ActivityJanuary 2011 Update
– Widespread Agreement that an International Standard was Needed
• Develop a Convergence Standard/Continue Desirable Goal of a Common Accounting Standard
• Time to Come to a Conclusion
• Appropriate Testing of Models
63
63
Recent FASB/IASB ActivityJanuary 2011 Update
• Model
– Generally Supported the Basics of the Building Block Approach
» Supported fulfillment value
» Strong views on discounting and the composite margin versus the risk and residual margins
• Loss of Valuable Information– Ex: premium volume (LT contracts)
64
64

Recent FASB/IASB ActivityJanuary 2011 Update
• Short-Term Contracts– Concerned about the cut-off and issues with reinsurance
contracts
– Difficult calculation for onerous contracts
• Concerns about Profit/Loss Volatility– Locking discount rate for certain contracts at inception
65

Recent FASB/IASB ActivityFebruary/March 2011 Update
• Acquisition Costs– IASB- Portfolio Level
– FASB -Individual Contract Level (successful vs. unsuccessful)
– Direct or Directly Attributable To?
• Discount Rate– Not Required if Effect is Immaterial
– Use of Current Rate (remeasured each reporting period) • Top-down approach
• Bottom-down approach66

Recent FASB/IASB ActivityFebruary-March 2011 Update
• Critical ratios and Benchmarking
• Report of Field Testing
• Timeline
67

Expected Impact on Captives
• More Input Required from Management
• More Work for Auditors and Actuaries
• More Disclosures in Financial Statements
• Delayed Recognition of Income
• Increased Variability of Financial Results
68

Question and Answer
69