to gas or not to gas
TRANSCRIPT

plan.be
Themadag: Volle gas door de energietransitie?
Danielle Devogelaer
Sectorale Directie
To gas or not to gas: that’s the question!
Brussel, 25 mei 2018

plan.be
• Federal Planning Bureau (FPB):
Legal assignments + own initiative + research consortia
House brand: quantitative analyses, energy demand and supply
• Different FPB studies on BE power sector, all with same
conclusion:
Medium term, BE needs gas
• Two recent studies:
• CBA (feb 2017) -> DG Energy
• IA 2030 Framework (may 2018) -> follow-up on BE energy
outlook
Context
2

plan.be
Study 1: the CBA
3
plan.be
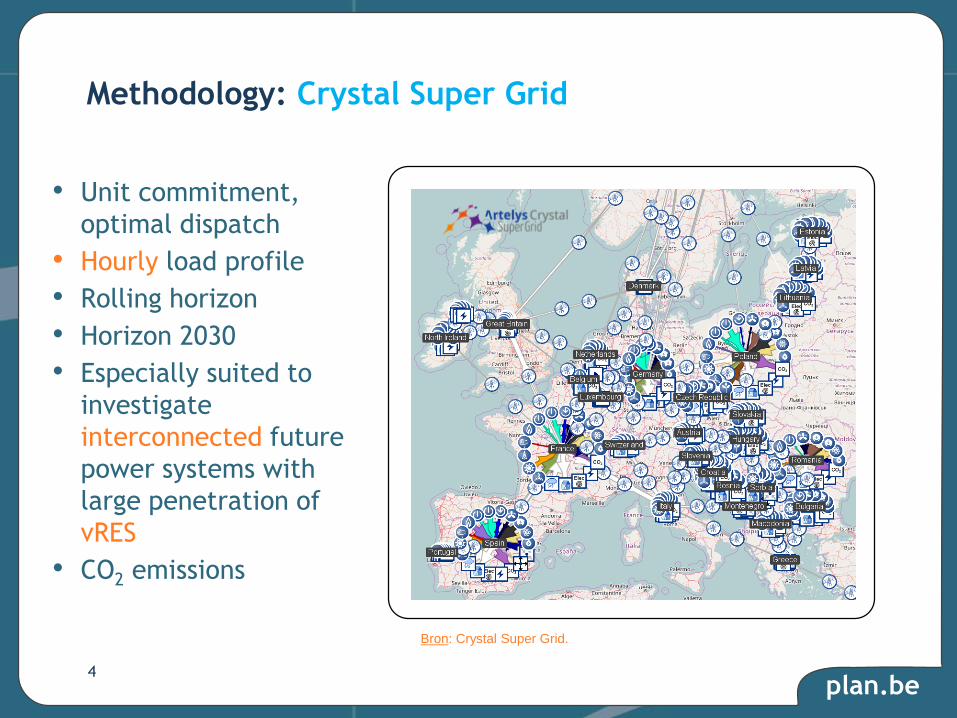
Methodology: Crystal Super Grid
• Unit commitment,
optimal dispatch
• Hourly load profile
• Rolling horizon
• Horizon 2030
• Especially suited to
investigate
interconnected future
power systems with
large penetration of
vRES
• CO2 emissions
4
Bron: Crystal Super Grid.

plan.be
Based on climate context and content of Structural Block (Elia,
2016):
Scenarios
5
MW CCGT OCGT Solar Wind
1 3200 1200 4988 5854
2 2400 500 5556 8129
3 3200 1200 4988 5854
4 2400 500 5556 8129
5 6000 500 5556 8129
CO2 price
Base: 17 €/tCO2
Clima: 57 €/tCO2
Technology choice
1. Base Gas
2. Base Decentral
3. Clima Gas
4. Clima Decentral
5. Clima Decentral & New Gas
Decentral (scen 2, 4, 5) integrates
significant amount of batteries and
EV’s
Source: FPB (2017).

plan.be
Results: Net Imports
• Significant
decrease in Clima
wrt Base
scenarios:
• from 30 TWh to
21 TWh
• Net production
increases, export
increases
• Sensitivity in New
Gas:
Belgium turns into
net exporter (2.1
TWh)
6
0
5
10
15
20
25
30
35
Base Gas BaseDecentral
Clima Gas ClimaDecentral
ClimaDecentraland New
Gas
TW
h
Imports Exports
Source: FPB (2017).
30 TWh 21 TWh
-2.1 TWh

plan.be
Results: CO2 emissions
• Cap and trade -
ETS auction
payments
• Significant
increase in Clima
scenarios
[6.2-8.6] wrt [3.9-
5.6] Mt CO2
Due to higher gas-
based generation
• Clima Decentral &
New Gas
14 Mt CO2
7
0
2
4
6
8
10
12
14
16
Base Gas BaseDecentral
Clima Gas ClimaDecentral
ClimaDecentraland New
Gas
Mt
CO
2
Source: FPB (2017).

plan.be
• Recent evolution (2011-2015): electricity ≠ natural gas
level of deficit, respective shares, volume vs. price effect
• 2027: significant increase in energy trade deficit
x2, triggered by electricity
Results: Electricity and natural gas trade balance
8
-1,2 -1,3 -1,2-0,9 -0,9 -0,9 -0,6
-1,2-0,9
-1,9-0,1
-0,5 -0,5-0,7 -0,8
-2,1-2,0
-1,9-2,0
0,2
-3,5
-3
-2,5
-2
-1,5
-1
-0,5
0
0,5
Base Gas BaseDecentral
Clima Gas ClimaDecentral
ClimaDecentraland New
Gas
2011 2012 2013 2014 2015 2027
B €’14
Natural gas Electricity
Source: FPB (2017).

plan.be
Study 2: the IA
9

plan.be
Impact assessment: Clean energy for all Belgians
10
0
10
20
30
40
50
60
2005 2015 2025 2035T
Wh
Gas-based powergen
Past evolution REFAlt1 Alt2Alt3
0
10
20
30
40
50
60
REF Alt1 Alt2 Alt3
TW
h
RES-based powergen
Hydro Wind onshoreWind offshore SolarBiomass & waste Geothermal
Source: FPB (WP 05-18).

plan.be
Investment outlook in generation capacity
• Investments (‘20-’40)
18-35 GW
• Annual investment
expenditures (‘20-’40)
1.2-1.6 billion EUR <>
0.6 billion EUR in REF
Not including
expenditures for grid
reinforcement
• <> Current
investment climate
• “Wait and see”
11
Hypothesis:
Mandatory wholesale market with MC bidding just
to obtain optimal unit commitment + a perfect
bilateral market of CfD for power supply through
which generators recover capital costs
0
5
10
15
20
25
30
35
40
2020-2030 2020-2040
GW
Generation capacity investments
REF Alt1 Alt2 Alt3
Source: FPB (WP 05-18).

plan.be
Conclusions
12

plan.be
• Investing: how much?
Outlook: 3,4 GW – 4,5 GW – 4,7 GW – 5,8 GW
Electricity studies: 2,9 GW – 3,9 GW – 4,4 GW – 6,5 GW
Gas=needed
• Even in a strongly decentralised future
• ST: balancing, (M)LT: SoS and demand increase
• CO2 emissions
• ETS: reference year 2005
• In 2030 [32,38]% decrease of GHG wrt 2005
• Build now: 25 years part of the system
• Phase out by 2050 (low carbon economy)
• Part of P2G (methane, hydrogen, …)
Full speed ahead for gas?
13

plan.be
• Investments in electricity generation capacity are huge
• “Whatever we do”, but <> current investment climate
• Reflection required on
• how much investments are socially acceptable and desired
• how investments can be triggered
• Trade-off: every upside has a downside
• To gas <> CO2 emissions, energy dependence, …
• Not to gas <> more electricity imports, higher investments, …
14
“Does not concern technology that much, but rather social necessity and
political will” Klaus Shäfer, CEO Uniper, Feb 17, 2017
Full speed ahead for gas? (2)