to implement “lean six sigma” concept in automobile manufacturing – a case study
TRANSCRIPT

International Journal on Recent and Innovation Trends in Computing and Communication ISSN: 2321-8169
Volume: 4 Issue: 4 370 - 408
________________________________________________________________________ _____ _____
370
IJRITCC | April 2016, Available @ http://www.ijritcc.org
_____________________________________________________________________________________
To Implement “Lean Six Sigma” Concept in Automobile Manufacturing – A
Case Study
Dr. .Narendra Mohan Mishra
Dept. of Operations and Information Technology
Institute of Management Technology- CDL
Ghaziabad (U.P), India
[email protected] and [email protected]
Dr. S. M. Karim
Pro. Vice-chancellor,
Aryabhata Knowledge University
Patna, India
1. Abstract With the ever increasing demand of the customer in a highly competitive environment quality perfection is a desirable objective. The purpose
of this paper is to bring the focus on problem solving techniques using Lean Six Sigma methodology and to change the mind set of peoples
within the organization that root cause cannot be established just by thinking and engineering guesses. Six Sigma methodologies help to pin
root causes using simple data collection and analysis technique. This case study will explain the application of various graphical and
statistical tools of problem solving in real life like Pareto, Box Plot, Main effect plot, Interval plot and Binary logistic regression. The study
was conducted at M/S Asahi India Glass an auto glass manufacturer a Tier 1 supplier of Maruti Suzuki India Limited (Largest Car
Manufacturer of India). The major pain area was high rejection in Tempering process i.e. 62158 PPM against the target of 45000 PPM in FY
2013-14. With the scoping tools like tree diagram and Pareto, Product Backlite glass of Swift Dzire (MPG-BCK) was found the major
contributor and characteristics identified for analysis were Curvature NG, Blast Head Breakage, and Roller Imprint. This rejection was being
reported since inception. As a result by this case study after analysis and countermeasures the overall rejection reduced by 40%.
1.1 Keywords Automotive Industry Case study on Quality improvement, Manufacturing Process–Tempered Glass, Customer Satisfaction, Major
management Pain Area and Application of Various Statistical tools.
2. Introduction In today’s competitive market when customer has countless options, Quality at lowest cost has become the emblem of any
organization. From pin to aeroplane, everything demands the maximum Quality at the minimum price. In early 90’s, it was the
producer who was deciding the prices but today the trend has taken a 180˚ turn. Now it’s the customer who is aggressively
deciding the pricing policies. Seeing such a competitive situation, it is the need of the hour to optimally utilize the resources.
Same is the state of affairs with automobile companies around the world. “Providing best quality at the least cost” is the
working principle which can only be achieved by reducing the rejection and reworks within the process. The case study
depicted in this Lean Six Sigma project that was completed at one of the Tier-1 supplier Asahi India Glass (Tempered Back
door Glass).Case study was conducted by one of the MACE counselor and Asahi India team under the championship of Dr.
K.Kumar (Ex Director-MSIL). VT Furnace (I-94) was the newly installed furnace and the unique feature is that it produces
side door as well as back door glass on the same furnace.
VT Furnace (I-94)
Dis
pat
ch t
o C
ust
om
er

International Journal on Recent and Innovation Trends in Computing and Communication ISSN: 2321-8169
Volume: 4 Issue: 4 370 - 408
________________________________________________________________________ _____ _____
371
IJRITCC | April 2016, Available @ http://www.ijritcc.org
_____________________________________________________________________________________
2.1 Project Overview
2.1.1 Problem Statement High rejection at tempering process VT Furnace (I-94) was from inception. Total internal Rejection, at tempering process on
VT Furnace (I-94), is 62158 PPM from Apr`13 to Jan`14 during the Year 2013, against target of 45000 PPM.
2.1.2 Product Detail
2.1.3 Project Scoping:
Tempered Side
door and Back door
Glass
Tempered Glass: Tempered glass is toughened glass used in automotive. Glass is heated from
670 to 720 degree Celsius and toughened with quench air pressure 1600 to 1900mm of aqua after
bending to the desired radius.
Month
6215867087
55489
57232 57222
54467
65134 63349
55321
7563270650
45000
20000
30000
40000
50000
60000
70000
80000
90000
100000
PP
M

International Journal on Recent and Innovation Trends in Computing and Communication ISSN: 2321-8169
Volume: 4 Issue: 4 370 - 408
________________________________________________________________________ _____ _____
372
IJRITCC | April 2016, Available @ http://www.ijritcc.org
_____________________________________________________________________________________
Inference: Rejection in BSH contributes 75% so we select BSH for further analysis.
Project Scoping:
Inference: Swift Dzire (MPG-BCK) contributes the most rejection so we selected this model of glass and it was expected
that similar countermeasures will apply to other model will also reduce the rejection.
Final Scoping:

International Journal on Recent and Innovation Trends in Computing and Communication ISSN: 2321-8169
Volume: 4 Issue: 4 370 - 408
________________________________________________________________________ _____ _____
373
IJRITCC | April 2016, Available @ http://www.ijritcc.org
_____________________________________________________________________________________
Inference: Found the scope from satellite level (Tempering model) to Project level (Particular Defects).
Inference: Curvature, Blast Head Breakage and Roller imprint are top three defects which contributes 41% of total
rejection. So further we will show defect details and target setting.
2.1.4 Problem Definition
Curvature NG: Curvature is gap between glass and gauge. It is measured with the help of taper scale its reading should be
in the range of (3±1.5)mm.
Blast Head Breakage: Glass when breaks into smaller particles during quenching of the glass during high quench pressure
after bending process is called Blast head breakage.
Swift Dzire (MPG-BCK)
Curvature
Mounting
Glass broken into finer
particles during quenching

International Journal on Recent and Innovation Trends in Computing and Communication ISSN: 2321-8169
Volume: 4 Issue: 4 370 - 408
________________________________________________________________________ _____ _____
374
IJRITCC | April 2016, Available @ http://www.ijritcc.org
_____________________________________________________________________________________
Roller Imprint: Deposition of foreign particles on the glass surface transmitted from rollers to glass is called roller imprint.
2.1.5 Target Setting For setting the target we collected the 5 weeks data under the observation of one of the team member and target was set
based on the 5 weeks authentic data as per the guidelines.
Week wise Rejection Trend: Curvature NG
Week wise Rejection Trend: Blast Head Breakage
Week wise Rejection Trend: Roller Imprint
Based on the management
guidelines target was set
aggressively based on average
current PPM level.
Target = 1.44%
Based on the management
guidelines target was set
aggressively based on average
current PPM level.
Target = 0.6%
Based on the management
guidelines target was set
aggressively based on average
current PPM level.
Target = 1.12%
%
%
%

International Journal on Recent and Innovation Trends in Computing and Communication ISSN: 2321-8169
Volume: 4 Issue: 4 370 - 408
________________________________________________________________________ _____ _____
375
IJRITCC | April 2016, Available @ http://www.ijritcc.org
_____________________________________________________________________________________
Objective Statement: To reduce the in house curvature NG defect from 2.88% to 1.44%, Blast Head Breakage defect from 1.2% to 0.6%, Roller
Imprint defect from 2.24% to 1.12% in Swift Dzire (MPG-BCK) by 31st Oct`14.
3.1 Process Flow Diagram:
Before Before Before Target Target Target
Size & Appr.
DISPATCH TO CUSTOMER
OKNG
CULLET TANK
CURVATUEAPPEARANCECROSS CURV.
NG
CULLET TANK
Tempering
Heating Bending Quenching Cooling
Pre-Process
Scoring
Loading
Raw glass
Receiving
Grinding
Centering Printing Drying Cooling
Packing
Printing
Inspection Packing
OK
OK
Size & Appr.
DISPATCH TO CUSTOMER
OKNG
CULLET TANK
CURVATUEAPPEARANCECROSS CURV.
NG
CULLET TANK
CULLET TANK
Tempering
Heating Bending Quenching Cooling
Pre-Process
Scoring
Loading
Raw glass
Receiving
Grinding
Centering Printing Drying Cooling
Packing
Printing
Inspection Packing
OK
OK
Inference: Find out the focused area, from the process flow diagram, and then go for detailed
process map of this focused area.

International Journal on Recent and Innovation Trends in Computing and Communication ISSN: 2321-8169
Volume: 4 Issue: 4 370 - 408
________________________________________________________________________ _____ _____
376
IJRITCC | April 2016, Available @ http://www.ijritcc.org
_____________________________________________________________________________________
Detailed Process Flow of Focused Area:
3.2.1 Input Output Sheet: Input-Output Sheet is a systematic expansion tool which is used for detailed study of process like Input Parameters,
specifications, Output features & specifications. It is supported with Capability analysis and measurement system analysis.
On the basis of CFT inputs I-O Sheet and Cause & Effect diagram was prepared and it was found that total 63 Input factors
may be causing Curvature NG, Blast Head Breakage, and Roller Imprint problems. 7 Nos. Quick Win Opportunities were
identified after process verification. Kaizens were implemented to counter all the quick wins and there was significant
reduction in rejection. For Reference one process is shown.
One process sample is shown below:
Process Step Output Feature (Y) Specification MSA Capability Input(X) C/N Feature SpecificationTest(s) /
Analysis
Bending
Desired Curvature &
Cross Curvature No Curvature NG
Chain Should Rotate
SmoothlyY Roller Speed C High/low As Per Model Specific OK
No Fragmentation NG
As per Std Operating
Cond. PD/T3/FM-31N Gap C Less 0.5 to 1.0 mm Check
No Reflection
Alignment of Mold and
Bending RingN Vaccum C
Pressure
more/LessAs Per Model Specific OK
No Mark on GlassN Female Press C Time slow As Per Model Specific OK
No BreakageN Rubber Nozzle C Nozzle Proper Nozzle Dmage OK
Process Inputs(s)Process Ouputs/Features
FTY=90%
FTY= Total OK Glass C=Controllable factor and N= Non Controllable factor.
Total Receiving
Glass loading on loading
frame
Glass Bending
Gauge
Inspection
ok
Not ok
Cullet tank
Transferring on
conveyor Packing
Receive cut glass
Start
End
NVA
NVA
NVA
SOP PD/T3/JS -01,03,20
SOP PD/T3/JS-04
Appearance
Inspection
Not ok
NVA
SOP PD/T3/JS-06,07
Glass heating
Transferring
on conveyor
VA
Cullet tank
NVA
ok
NVA
SOP PD/T3/FM-77A
SOP QA/T1/JS-03A
SOP QA/T1/JS-04A
SOP QA/T1/JS-05A
Inference of PFD
Total steps: 11 nos.
NVA steps: 6 nos.
(All are Muda type1)
VA steps : 05 nos.VA
Quench of glass
with air
VA
VASOP PD/T3/FM-77A
SOP PD/T3/FM-77A
PD/T3/T3/-09,10,19,72
Glass driving into
heating zone
VA
Glass loading on loading
frame
Glass Bending
Gauge
Inspection
ok
Not ok
Cullet tankCullet tank
Transferring on
conveyor Packing
Receive cut glass
Start
End
NVA
NVA
NVA
SOP PD/T3/JS -01,03,20
SOP PD/T3/JS-04
Appearance
Inspection
Not ok
NVA
SOP PD/T3/JS-06,07
Glass heating
Transferring
on conveyor
VA
Cullet tankCullet tank
NVA
ok
NVA
SOP PD/T3/FM-77A
SOP QA/T1/JS-03A
SOP QA/T1/JS-04A
SOP QA/T1/JS-05A
Inference of PFD
Total steps: 11 nos.
NVA steps: 6 nos.
(All are Muda type1)
VA steps : 05 nos.VA
Quench of glass
with air
VA
VASOP PD/T3/FM-77A
SOP PD/T3/FM-77A
PD/T3/T3/-09,10,19,72
Glass driving into
heating zone
VA

International Journal on Recent and Innovation Trends in Computing and Communication ISSN: 2321-8169
Volume: 4 Issue: 4 370 - 408
________________________________________________________________________ _____ _____
377
IJRITCC | April 2016, Available @ http://www.ijritcc.org
_____________________________________________________________________________________
3.2.2 Identification of improvement scope in Basic condition:
3.3.1 Cause and Effect Diagram: Curvature NG
Inference: Cause and Effect diagram is being made to find out the any left out factors other than Input Output
sheets. The other factors found out to be three for Curvature NG which were not found are being highlighted.

International Journal on Recent and Innovation Trends in Computing and Communication ISSN: 2321-8169
Volume: 4 Issue: 4 370 - 408
________________________________________________________________________ _____ _____
378
IJRITCC | April 2016, Available @ http://www.ijritcc.org
_____________________________________________________________________________________
3.3.2 Cause Effect Diagram: Blast Head Breakage
3.3.3 Cause Effect Diagram: Roller Imprint
Inference: Cause and Effect diagram is being made to find out the any left out factors other than Input Output sheets.
The other factors found out to be Five for Blast Head Breakage which were not found are being highlighted.
Inference: Cause and Effect diagram is being made to find out the any left out factors other than Input Output sheets.
The other factors found out to be three for Roller Imprint which were not found are being highlighted.

International Journal on Recent and Innovation Trends in Computing and Communication ISSN: 2321-8169
Volume: 4 Issue: 4 370 - 408
________________________________________________________________________ _____ _____
379
IJRITCC | April 2016, Available @ http://www.ijritcc.org
_____________________________________________________________________________________
3.4 Cause and Effect Matrix:
Cause & Effect Matrix is used for filtering the input factors based on their relationship with output. A severity no.
is assigned to output on a scale of 1-10 and ranking is assigned to each Input factor based on relationship with
Output. A input criterion is 0 for none, 1 for weak, 3 for moderate and 9 for strong relationship with Output.
Rating is calculated for each factor which is the result of multiplication of Input ranking and Output severity. A
cutoff rating no. limit is decided by the team and factors having the value more than or equal to cutoff no. are
considered for analysis. A cutoff no. limit for rating was decided 91. And 28 factors were filtered among 63 input
factors which were having rating greater than or equal to 91. For Reference sample portion is shown:
Inference: After more funneling by C& E matrix 28 factors remains for analysis.
3.5 Second Level Elimination by PFMEA: A potential cause is that which is having higher degree of relationship with output and higher frequency of occurrence
which is established through PFMEA. This is a secondary filtering tool which is used to identify the factors having
high occurrence and Risk Priority Number. A cut off value of RPN and Occurrence is decided by team.
PFMEA was made by CFT and cut off value of RPN was decided 140 or more. Following 8 input factors were
filtered among 28 factors.
Ranking co relation:-
0=none ,1 = week ,5= moderate ,9 = strong Inference:- Total no. of inputs found 28 for all three Characteristics (Curvature, Blast Head Breakage & Roller imprint)

International Journal on Recent and Innovation Trends in Computing and Communication ISSN: 2321-8169
Volume: 4 Issue: 4 370 - 408
________________________________________________________________________ _____ _____
380
IJRITCC | April 2016, Available @ http://www.ijritcc.org
_____________________________________________________________________________________
1. Main line speed 2. BSH speed 3. Zone Temp 1 4. Zone Temp 2
5. Zone Temp 3 6. Zone Temp4 7.Quench pressure 8. Female press position
The Overall Conclusion drawn from Measure phase was that Graphical and Statistical study required for 8 input
factors having higher degree of relationship with Output established through C&E Matrix and Higher Occurrence &
RPN Level established through PFMEA.
3.6 MSA for Attributes:
Inference: 1. Measurement system is acceptable.
2. No significant difference between and within Inspector`s decision and appraiser with standard was found.
(Assessment agreement is more than 70%).
Within Appraisers
Assessment Agreement
Appraiser # Inspected # Matched Percent 95% CI
Pawan 25 20 80.00 (59.30, 93.17)
Kapil 25 24 96.00 (79.65, 99.90)
Rajendra 25 23 92.00 (73.97, 99.02)
# Matched: Appraiser agrees with him/herself across trials.
Each Appraiser vs Standard
Assessment Agreement
Appraiser # Inspected # Matched Percent 95% CI
Pawan 25 19 76.00 (54.87, 90.64)
Kapil 25 18 72.00 (50.61, 87.93)
Rajendra 25 19 76.00 (54.87, 90.64)
# Matched: Appraiser's assessment across trials agrees with the known standard.

International Journal on Recent and Innovation Trends in Computing and Communication ISSN: 2321-8169
Volume: 4 Issue: 4 370 - 408
________________________________________________________________________ _____ _____
381
IJRITCC | April 2016, Available @ http://www.ijritcc.org
_____________________________________________________________________________________
3.7 Capability Analysis for Curvature:
Inference: CPk is found to be less than 1.33 for point 1 and 3 out of Eight point taken for capability analysis.
So further improvement is required in process to make process more capable.
CP:- 1.02
CPK:-0.97 CP:- 1.17
CPK:-1.09

International Journal on Recent and Innovation Trends in Computing and Communication ISSN: 2321-8169
Volume: 4 Issue: 4 370 - 408
________________________________________________________________________ _____ _____
382
IJRITCC | April 2016, Available @ http://www.ijritcc.org
_____________________________________________________________________________________
CP:- 1.02
CPK:- .99
:-
CP:-1.34
CPK:-1.32
CP:-1.52
CPK:-1.48
:-
CP:-1.52
CPK:-1.48
:-

International Journal on Recent and Innovation Trends in Computing and Communication ISSN: 2321-8169
Volume: 4 Issue: 4 370 - 408
________________________________________________________________________ _____ _____
383
IJRITCC | April 2016, Available @ http://www.ijritcc.org
_____________________________________________________________________________________
4.1 Graphical Analysis:
Data Collection Plan:
Sample part is attached. Please find the appendix
CP:-1.53
CPK:- 1.49
:-
CP:-1.23
CPK:-1.21
:-
1. Sample size = 5 continuous Glass after every 30 minutes. 2. 1380 Glass Data collected.

International Journal on Recent and Innovation Trends in Computing and Communication ISSN: 2321-8169
Volume: 4 Issue: 4 370 - 408
________________________________________________________________________ _____ _____
384
IJRITCC | April 2016, Available @ http://www.ijritcc.org
_____________________________________________________________________________________
Various Graphical tools are used for analysis between discrete & Continuous Xs (Input factors) Vs Discrete &
Continuous Y (Output). A list of graphical tools used for studying the relationship between Xs and Y is shown in
table below. C denotes Continuous and D denote Discrete factors.
A graphical analysis was done as per Table above to see the relationship between different Input factors and Output.
Analysis of Curvature NG, Blast Head Breakage, and Roller Imprint for all the significant factors is shown using
Interval plots below.
OK NG OK NG

International Journal on Recent and Innovation Trends in Computing and Communication ISSN: 2321-8169
Volume: 4 Issue: 4 370 - 408
________________________________________________________________________ _____ _____
385
IJRITCC | April 2016, Available @ http://www.ijritcc.org
_____________________________________________________________________________________
Inference: - Main Line speed found
significant for Curvature NG, Blast Head
Breakage and Roller imprint which can
be further verified by Statistical
Analysis. (Main Line speed is speed
during loading of glass on
conveyor).Unit is mm/s
OK NG OK NG
OK NG

International Journal on Recent and Innovation Trends in Computing and Communication ISSN: 2321-8169
Volume: 4 Issue: 4 370 - 408
________________________________________________________________________ _____ _____
386
IJRITCC | April 2016, Available @ http://www.ijritcc.org
_____________________________________________________________________________________
s
Inference: - BSH speed found
insignificant for Curvature NG, Blast
Head Breakage and Roller imprint which
can be further verified by Statistical
Analysis. (BSH speed is speed during
loading of glass on conveyor).Unit is
mm/s
OK NG OK NG
OK NG

International Journal on Recent and Innovation Trends in Computing and Communication ISSN: 2321-8169
Volume: 4 Issue: 4 370 - 408
________________________________________________________________________ _____ _____
387
IJRITCC | April 2016, Available @ http://www.ijritcc.org
_____________________________________________________________________________________
Inference: - Zone-1 Temp Upper
found significant for Curvature NG
Breakage & Roller Imprint which
can be further verified by Statistical
Analysis. Unit is Degree Celsius.
OK NG OK NG
OK NG

International Journal on Recent and Innovation Trends in Computing and Communication ISSN: 2321-8169
Volume: 4 Issue: 4 370 - 408
________________________________________________________________________ _____ _____
388
IJRITCC | April 2016, Available @ http://www.ijritcc.org
_____________________________________________________________________________________
Inference: - Zone-1 Temp Lower
found significant for Curvature NG
Breakage & Roller Imprint which
can be further verified by Statistical
Analysis. Unit is Degree Celsius.
OK NG OK NG
OK NG

International Journal on Recent and Innovation Trends in Computing and Communication ISSN: 2321-8169
Volume: 4 Issue: 4 370 - 408
________________________________________________________________________ _____ _____
389
IJRITCC | April 2016, Available @ http://www.ijritcc.org
_____________________________________________________________________________________
Inference: - Zone-2 Temp Upper
found insignificant for Curvature NG,
breakage & Roller Imprint which can
be further verified by Statistical
Analysis. Unit is Degree Celsius.
OK NG OK NG
OK NG

International Journal on Recent and Innovation Trends in Computing and Communication ISSN: 2321-8169
Volume: 4 Issue: 4 370 - 408
________________________________________________________________________ _____ _____
390
IJRITCC | April 2016, Available @ http://www.ijritcc.org
_____________________________________________________________________________________
v
Inference: - Zone-2 Temp Lower
found significant for Curvature NG &
Roller Imprint which can be further
verified by Statistical Analysis. Unit is
Degree Celsius.
OK NG OK NG
OK NG

International Journal on Recent and Innovation Trends in Computing and Communication ISSN: 2321-8169
Volume: 4 Issue: 4 370 - 408
________________________________________________________________________ _____ _____
391
IJRITCC | April 2016, Available @ http://www.ijritcc.org
_____________________________________________________________________________________
Inference: - Zone-3 Temp Upper
found insignificant for Curvature NG ,
Breakage & Roller Imprint which can
be further verified by Statistical
Analysis. Unit is Degree Celsius.
OK NG OK NG
OK NG

International Journal on Recent and Innovation Trends in Computing and Communication ISSN: 2321-8169
Volume: 4 Issue: 4 370 - 408
________________________________________________________________________ _____ _____
392
IJRITCC | April 2016, Available @ http://www.ijritcc.org
_____________________________________________________________________________________
Inference: - Zone-3 Temp Lower
found significant for Curvature NG &
Roller Imprint which can be further
verified by Statistical Analysis. Unit is
Degree Celsius.
OK NG OK NG
OK NG

International Journal on Recent and Innovation Trends in Computing and Communication ISSN: 2321-8169
Volume: 4 Issue: 4 370 - 408
________________________________________________________________________ _____ _____
393
IJRITCC | April 2016, Available @ http://www.ijritcc.org
_____________________________________________________________________________________
Inference: - Zone-4 Temp Upper
found significant for Curvature NG
which can be further verified by
Statistical Analysis. Unit is Degree
Celsius.
OK NG OK NG
OK NG

International Journal on Recent and Innovation Trends in Computing and Communication ISSN: 2321-8169
Volume: 4 Issue: 4 370 - 408
________________________________________________________________________ _____ _____
394
IJRITCC | April 2016, Available @ http://www.ijritcc.org
_____________________________________________________________________________________
Inference: - Zone-4 Temp Lower found
significant for Curvature NG which can be
further verified by Statistical Analysis. Unit
is Degree Celsius.
OK NG OK NG
OK NG

International Journal on Recent and Innovation Trends in Computing and Communication ISSN: 2321-8169
Volume: 4 Issue: 4 370 - 408
________________________________________________________________________ _____ _____
395
IJRITCC | April 2016, Available @ http://www.ijritcc.org
_____________________________________________________________________________________
Inference: Aspirator Upper is found to
be non significant for Curvature NG,
Blast Head Breakage, Roller Imprint.
OK NG OK NG
OK NG

International Journal on Recent and Innovation Trends in Computing and Communication ISSN: 2321-8169
Volume: 4 Issue: 4 370 - 408
________________________________________________________________________ _____ _____
396
IJRITCC | April 2016, Available @ http://www.ijritcc.org
_____________________________________________________________________________________
Conclusion: Graphical Analysis
Inference: Female Press Postion is
found to be non significant for
Curvature NG, Blast Head Breakage,
Roller Imprint.
OK NG

International Journal on Recent and Innovation Trends in Computing and Communication ISSN: 2321-8169
Volume: 4 Issue: 4 370 - 408
________________________________________________________________________ _____ _____
397
IJRITCC | April 2016, Available @ http://www.ijritcc.org
_____________________________________________________________________________________
4.2 Statistical Analysis With the help of Graphical analysis we get the feeling that which input factors may be significant but based on graphical
analysis only we can not conclude that which input factors are significant. With the help of statistical analysis we can
conclude that which parameters are significantly affecting the Output. Binary Logistics regression is used as the output is
Discrete (NG/OK) and input is Continuous. An example of Binary Logistic Regression for Curvature NG with Main Line
Speed is shown below.
Binary Logistic Regression: curvature versus Main line Speed
Method
Link function Logit
Rows used 680
Response Information
Variable Value Count
curvature 1 19 (Event)
0 661
Total 680
Deviance Table
Source DF Adj Dev Adj Mean Chi-Square P-Value
Regression 1 4.949 4.9494 4.95 0.026
Main line Speed 1 4.949 4.9494 4.95 0.026
Error 678 168.466 0.2485
Total 679 173.415
Binary Logistic Regression: Roller imprint versus Main line Speed
Method
Link function Logit
Rows used 680
Response Information
Variable Value Count
Roller Imprint 1 17 (Event)
0 663
Total 680
Deviance Table
Source DF Adj Dev Adj Mean Chi-Square P-Value
Regression 1 11.72 11.7163 11.72 0.001
Main line Speed 1 11.72 11.7163 11.72 0.001
Error 678 147.28 0.2172
Total 679 158.99
Inference: Main
Line speed is
found to be
significant for
Curvature NG as
P value is equal
to .05
Inference: Main
Line speed is
found to be
significant for
Roller Imprint as
P value is equal
to .05

International Journal on Recent and Innovation Trends in Computing and Communication ISSN: 2321-8169
Volume: 4 Issue: 4 370 - 408
________________________________________________________________________ _____ _____
398
IJRITCC | April 2016, Available @ http://www.ijritcc.org
_____________________________________________________________________________________
Binary Logistic Regression: curvature versus Temp act. Zone 3 lower
Method
Link function Logit
Rows used 680
Response Information
Variable Value Count
curvature 1 19 (Event)
0 661
Total 680
Deviance Table
Source DF Adj Dev Adj Mean Chi-Square P-Value
Regression 1 7.123 7.1232 7.12 0.008
Temp act. Zone 3 lower 1 7.123 7.1232 7.12 0.008
Error 678 166.292 0.2453
Total 679 173.415
Binary Logistic Regression: Roller imprint versus Temp act. Zone 3 lower
Method
Link function Logit
Rows used 680
Response Information
Variable Value Count
Roller imprint 1 17 (Event)
0 663
Total 680
Deviance Table
Source DF Adj Dev Adj Mean Chi-Square P-Value
Regression 1 5.647 5.6472 5.65 0.017
Temp act. Zone 3 lower 1 5.647 5.6472 5.65 0.017
Error 678 153.346 0.2262
Total 679 158.993
Inference: Zone
3Loower is found
to be significant
for Curvature NG
as P value is less
than .05
Inference: Zone
3Loower is found
to be significant
for Roller Imprint
as P value is less
than .05

International Journal on Recent and Innovation Trends in Computing and Communication ISSN: 2321-8169
Volume: 4 Issue: 4 370 - 408
________________________________________________________________________ _____ _____
399
IJRITCC | April 2016, Available @ http://www.ijritcc.org
_____________________________________________________________________________________
Binary Logistic Regression: curvature versus Temp act. Zone 4 upper
Method
Link function Logit
Rows used 680
Response Information
Variable Value Count
curvature 1 19 (Event)
0 661
Total 680
Deviance Table
Source DF Adj Dev Adj Mean Chi-Square P-Value
Regression 1 6.134 6.1340 6.13 0.013
Temp act. Zone 4 upper 1 6.134 6.1340 6.13 0.013
Error 678 167.281 0.2467
Total 679 173.415
Binary Logistic Regression: curvature versus Temp act. Zone 4 lower
Method
Link function Logit
Rows used 680
Response Information
Variable Value Count
curvature 1 19 (Event)
0 661
Total 680
Deviance Table
Source DF Adj Dev Adj Mean Chi-Square P-Value
Regression 1 11.83 11.8302 11.83 0.001
Temp act. Zone 4 lower 1 11.83 11.8302 11.83 0.001
Error 678 161.58 0.2383
Total 679 173.41
Similarly all the critical Xs were checked for relationship with Curvature NG, Blast Head Breakage, and Roller Imprint and the
results are tabulated below.
Inference: Zone
4Upper is found
to be significant
for Curvature NG
as P value is less
than .05
Inference: Zone 4
Lower is found to
be significant for
Curvature NG as
P value is less
than .05

International Journal on Recent and Innovation Trends in Computing and Communication ISSN: 2321-8169
Volume: 4 Issue: 4 370 - 408
________________________________________________________________________ _____ _____
400
IJRITCC | April 2016, Available @ http://www.ijritcc.org
_____________________________________________________________________________________
Conclusion: Statistical Analysis
Main Line speed
Zone Temp 2 Lower
Zone Temp 3 Lower
Zone Temp4 Upper
Zone Temp4 Lower
5 Design of Experiments
In DOE the significant factors found after statistical analysis are kept at different levels, then process is run at that setting as
per design and Output Record are resulted in DOE sheet.
5.1 DOE Factors and Levels:
DOE Data Collection:
DOE FACTORS
Levels
Main Line Speed
mm/s
Zone Temp-2
Lower C
Zone Temp-3
Lower C
Zone Temp-4
Upper C
Zone Temp-4
Lower C
(A) (B) (C) (D) ()
Low(-1) 103 655 680 705 710
High(+1) 107 665 690 715 720
Product:- Swift Dzire (MPG-BCK) Glass
Team Leader:- Mayank Kumar Process:- VT Furnace (I-94) Tempering process
Problem Statement:- Curvature NG, Blast Head Breakage & Roller Imprint in Swift Dzire (MPG-BCK) Glass
Response 1:- Curvature NG Type:- Continuous Unit Of measure:- %
Response 2:- Blast Head Breakage Type:- Continuous Unit Of measure:- %
DOE planning sheet
Type:- Continuous Unit of measure:- % Response 3:- Roller Imprint

International Journal on Recent and Innovation Trends in Computing and Communication ISSN: 2321-8169
Volume: 4 Issue: 4 370 - 408
________________________________________________________________________ _____ _____
401
IJRITCC | April 2016, Available @ http://www.ijritcc.org
_____________________________________________________________________________________
Factorial designs allow for the simultaneous study of the effects that several factors may have on a process. When performing
an experiment, varying the levels of the factors simultaneously rather than one at a time is efficient in terms of time and cost,
and also allows for the study of interactions between the factors. Interactions are the driving force in many processes. Without
the use of factorial experiments, important interactions may remain undetected.
Therefore, for 4 factors at 2 level each, factorial design was created and experiment was conducted taking 500 Glass
on each Run for total 16 runs.
5.1.1 Analysis of Variance for Curvature NG:
No. of Factors :- 5
Total Run :- 16
Block :- 2
Resolution:- V Design:- ½ Fraction

International Journal on Recent and Innovation Trends in Computing and Communication ISSN: 2321-8169
Volume: 4 Issue: 4 370 - 408
________________________________________________________________________ _____ _____
402
IJRITCC | April 2016, Available @ http://www.ijritcc.org
_____________________________________________________________________________________
5.1.2 Analysis of Variance for Blast Head Breakage:
Curvature NG = 0.7344+0.2281*Main line speed+0.3219*Zone-3 Lower
-0.2719*Zone-4 Upper*Zone-4 Lower

International Journal on Recent and Innovation Trends in Computing and Communication ISSN: 2321-8169
Volume: 4 Issue: 4 370 - 408
________________________________________________________________________ _____ _____
403
IJRITCC | April 2016, Available @ http://www.ijritcc.org
_____________________________________________________________________________________
5.1.3 Analysis of Variance for Roller Imprint:
B/H Breakage = 0.0656+0.0656*Main line Speed+0.0656*Zone-2 lower*Zone-4 Lower
+0.0656*Zone-3 Lower*Zone-4 lower

International Journal on Recent and Innovation Trends in Computing and Communication ISSN: 2321-8169
Volume: 4 Issue: 4 370 - 408
________________________________________________________________________ _____ _____
404
IJRITCC | April 2016, Available @ http://www.ijritcc.org
_____________________________________________________________________________________
Roller Imprint = 0.5161-0.2281*Main line speed-0.1781*Main line speed*Zone-3 Lower

International Journal on Recent and Innovation Trends in Computing and Communication ISSN: 2321-8169
Volume: 4 Issue: 4 370 - 408
________________________________________________________________________ _____ _____
405
IJRITCC | April 2016, Available @ http://www.ijritcc.org
_____________________________________________________________________________________
Response Optimiser: DOE
After analyzing the experimental data total three factors and their interactions were found significant among four
input factors. Using the Minitab optimization of the process was done and a Model Y = f(Xs) was establish for all
three Outputs Curvature NG, Blast Head Breakage, and Roller Imprint individually as well as for total rejection. The
DOE optimized revised settings are 105 mm.sec for Main Line Speed, 655˚C for Zone Temp 2 Lower, 680˚C for
Zone Temp 3Lower, and 705˚C for Zone Temp 4 Upper & 710 for Zone Temp Lower.
5.2 Confirmatory Test A confirmatory run was taken by setting the optimized parameters.

International Journal on Recent and Innovation Trends in Computing and Communication ISSN: 2321-8169
Volume: 4 Issue: 4 370 - 408
________________________________________________________________________ _____ _____
406
IJRITCC | April 2016, Available @ http://www.ijritcc.org
_____________________________________________________________________________________
6.1 Standardization a) Process parameters Zone 2, Zone3, Zone4 Temperature and Main Line Speed revised and standardized with other
Parameters.
b) Training to all concern for the revision made in standard operating conditions regarding changes which has taken place
in parameters.
6.2 Control Further we require to control the Main Line speed, Zone Temperatures (heating condition) Quench pressure to control the
Curvature NG, Blast Head Breakage and Roller Imprint in Swift Dzire (MPG-BCK).
Recommended actions:-
Updated Process Condition.
Control Methods
o Updated FMEA :- FMEA updated & reduced RPN no calculated on basis of severity occurrence
and detection value
o Check sheet: - Check sheet for controlling the press gap and monitoring the process parameters
implemented.
o Formal Control Plan on basis of FMEA activities decided & revised the control plan according to
the activity & desired frequency
o Poka Yoke: - Press gap standardized to improve the drop style of the glass.
6.3 Results
6.3.1 Curvature NG : Target Vs. Achievement
Avg. (Before) Target Achieved
2.88
1.44
0.29
Curvature NG (%)
Before Rejection %age :- 2.88 % After Rejection %age :- 0.29 % %age improvement - 89.9 %
International Journal on Recent and Innovation Trends in Computing and Communication ISSN: 2321-8169
Volume: 4 Issue: 4 370 - 408
________________________________________________________________________ _____ _____
407
IJRITCC | April 2016, Available @ http://www.ijritcc.org
_____________________________________________________________________________________
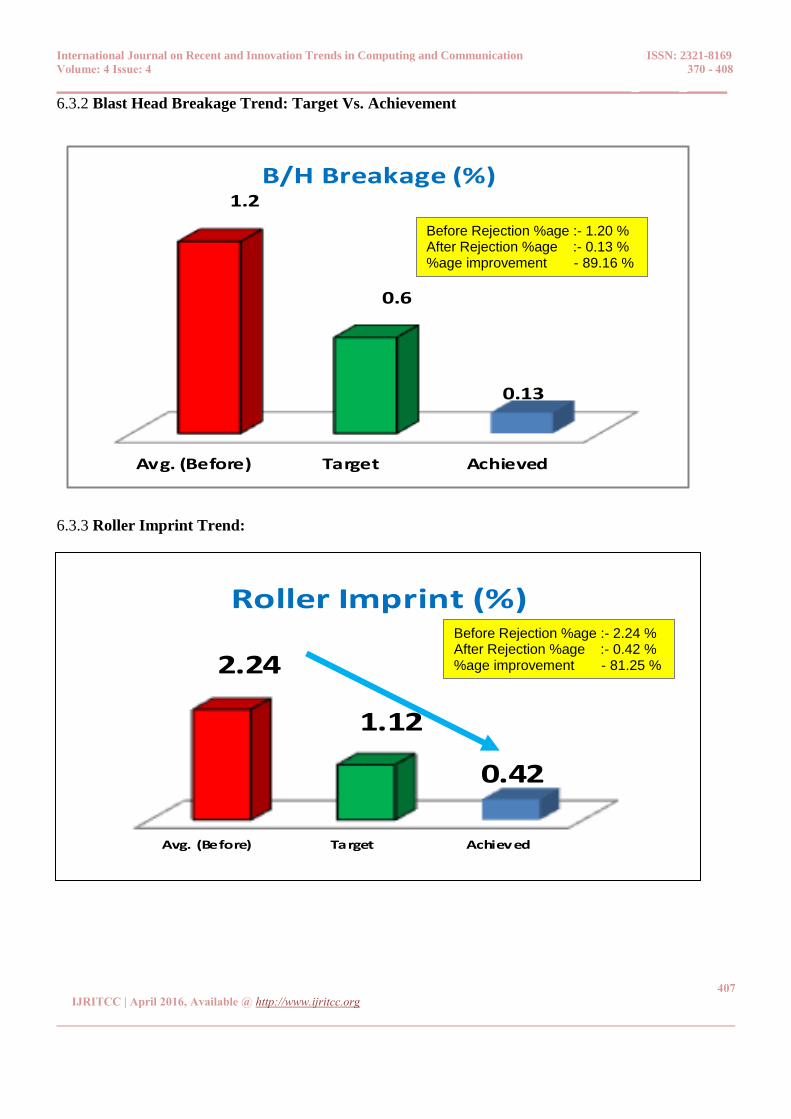
6.3.2 Blast Head Breakage Trend: Target Vs. Achievement
6.3.3 Roller Imprint Trend:
Avg. (Before) Target Achieved
2.24
1.12
0.42
Roller Imprint (%)
Avg. (Before) Target Achieved
1.2
0.6
0.13
B/H Breakage (%)
Before Rejection %age :- 2.24 % After Rejection %age :- 0.42 % %age improvement - 81.25 %
Before Rejection %age :- 1.20 % After Rejection %age :- 0.13 % %age improvement - 89.16 %

International Journal on Recent and Innovation Trends in Computing and Communication ISSN: 2321-8169
Volume: 4 Issue: 4 370 - 408
________________________________________________________________________ _____ _____
408
IJRITCC | April 2016, Available @ http://www.ijritcc.org
_____________________________________________________________________________________
6.3.4 Swift Dzire (MPG-BCK) Trend Overall:
6.4 Conclusion
6.4.1 Gains from the study Curvature NG of Swift Dzire (MPG-BCK) reduced from 2.88% to 0.29%.
Blast Head Breakage of Swift Dzire (MPG-BCK) reduced from 1.20% to 0.13%.
Roller Imprint of Swift Dzire (MPG-BCK) reduced from 2.24% to 0.42% .
Yield of Swift Dzire (MPG-BCK) increased from 87.13% to 95.54%.
Overall PPM of Swift Dzire (MPG-BCK) reduced from 6.21% to 4.5% PPM.
6.4.2 Scope of horizontal deployment
Horizontal deployment to be done in following products of Maruti Suzuki India Limited vehicles.
1. Wagon R (MYS-BCK)
2. New Alto (ME3-BCK)
3. Alto K10 (MYG-BCK)
The Case study presented is related to Application of Statistical techniques to resolve Quality problem in automotive industry.
This study covers the study of process capability, yield and high impact problems like Curvature NG, Blast Head Breakage &
Roller Imprint using various statistical tools. It can be concluded from the study that chronic problems can be resolved using
statistical techniques. Understanding of the problem and data collection is very important parts for successfully resolving the
chronic Issues. Hence Yield can be improved by resolving the quality problems.
References: 1. Levin Rubin, “Statistics for Managers” (2008), Pearson Prentice Hall, Seventh Edition
2. Journal – Indian Institution of Industrial Engineering
3. AIAG Manual, Failure Mode Effect Analysis” (2008), Fourth Edition
85.29
84.34
88.02 88.31
88.07
88.1287.02
85.9586.47
86.98
90.41
92.30
93.09
94.2995.34 95.18
96.6995.70
96.80
75
77
79
81
83
85
87
89
91
93
95
97
99
Yie
ld %
Avg: 87.13% Avg: 91.41
Avg: 95.54%
Bet
ter
Month
Before
After
Improvement
After Basic
Improvement