to the families and children affected by spina bifida
TRANSCRIPT

1
ATTENTION AND SELF-CONCEPT IN ADOLESCENTS WITH SPINA BIFIDA
By
ANDREW S. PRESTON
A DISSERTATION PRESENTED TO THE GRADUATE SCHOOL OF THE UNIVERSITY OF FLORIDA IN PARTIAL FULFILLMENT
OF THE REQUIREMENTS FOR THE DEGREE OF DOCTOR OF PHILOSOPHY
UNIVERSITY OF FLORIDA
2007

2
© 2007 Andrew S. Preston

3
To the families and children affected by spina bifida.

4
ACKNOWLEDGEMENTS
I would like to thank all of the people who have contributed to this project. First and
foremost, I would like to thank my wife, daughter, and parents for their love and support
throughout my graduate training. Dr. Eileen Fennell deserves my sincerest gratitude for
mentoring my clinical neuropsychology graduate training as well as guidance in professional life
and on this project. Dr. Shelley Heaton deserves my gratitude for her tutelage throughout my
graduate career as well as assistance with resources and guidance during this project. I would
like to thank Rosellen Dedlow for her dedication to this project and willingness to help me every
time I faced a new challenge in recruitment. Dr. Siraj Siddiqui deserves my thanks for his
assistance with this project. I would like to thank my other committee members, Drs. Jim
Johnson, Regina Bussing, and Fonda Eyler, for their assistance throughout the many phases of
this project. Finally, I would like to thank my fellow lab mates and research assistants for their
assistance and dedication to this project.

5
TABLE OF CONTENTS page
ACKNOWLEDGEMENTS.............................................................................................................4
LIST OF TABLES...........................................................................................................................7
ABSTRACT.....................................................................................................................................8
CHAPTER
1 INTRODUCTION ..................................................................................................................10
General Background ...............................................................................................................10 Attention: Definitions and Neuroanatomical Substrates .......................................................11 Definitions of Self-Concept and Relationship with Attention................................................12 Spina Bifida ............................................................................................................................16
Physical Complications in Spina Bifida ..........................................................................16 Neuroanatomical Sequelae in Spina Bifida.....................................................................18 Intellectual and achievement performance ......................................................................20 Visual-motor and visual-constructional abilities.............................................................21 Language .........................................................................................................................21 Memory and learning ......................................................................................................22 Attention and executive functions in SB/H .....................................................................23 Self-Concept and SB/H ...................................................................................................24
The Current Study...................................................................................................................27 Hypotheses..............................................................................................................................28
Specific Aim 1.................................................................................................................28 Specific Aim 2.................................................................................................................29 Specific Aim 3.................................................................................................................29
2 MATERIALS AND METHODS ...........................................................................................30
Participants .............................................................................................................................30 Measures .................................................................................................................................31
Demographic Information ...............................................................................................31 Screening Measures.........................................................................................................31
Peabody Picture Vocabulary Test- Third Edition (PPVT-III) .................................31 Wechsler Individual Achievement Test, Second Edition (WIAT-II): Word
Reading subtest.....................................................................................................32 Evaluation of Attention: Parent-report ............................................................................33
Behavior Assessment System for Children – Parent Rating Scales: 12–18 or 6–11 (BASC: PRS-A) or (BASC: PRS-C) ...............................................................33
Neuropsychological Measures of Attention ....................................................................34 Test of Everyday Attention for Children (TEA-Ch) ................................................34 Delis-Kaplan Executive Function System (D-KEFS): Trailmaking Test ................35
Self-Concept ....................................................................................................................36

6
Multi-Dimensional Self-Concept Scale (MSCS) .....................................................36 Mood................................................................................................................................37
Revised Children’s Manifest Anxiety Scale (RCMAS)...........................................37 Children’s Depression Inventory (CDI) ...................................................................37 Behavior Assessment System for Children – Self-Report Scales: 8–11 or 12–
18 (BASC: SRP-C) or (BASC: SRP-A) ...............................................................38 Procedure ................................................................................................................................39
3 RESULTS...............................................................................................................................42
Data Analysis..........................................................................................................................42 Demographics .........................................................................................................................42 Statistical Analyses.................................................................................................................44
Hypothesis 1 ....................................................................................................................44 Comparison of attentional performance without controls for motor demands ........44 Comparison of attentional performance with controls for motor demands .............45
Hypothesis 2 ....................................................................................................................46 Hypothesis 3 ....................................................................................................................47 Additional Calculations and Exploratory Analyses ........................................................47
Differences in mood .................................................................................................47 Differences in Behavior Problems ...........................................................................48 Age differences ........................................................................................................49 Gender differences ...................................................................................................50 Effect of hydrocephalus ...........................................................................................50 Effect of ADHD .......................................................................................................51
4 DISCUSSION.........................................................................................................................62
Overview.................................................................................................................................62 Attentional Differences Between Groups...............................................................................63 Differences in Self-Concept ...................................................................................................66 Relationship Between Attention and Self-Concept ................................................................68 Additional Results ..................................................................................................................70 Limitations..............................................................................................................................72
5 FUTURE WORK....................................................................................................................75
LIST OF REFERENCES...............................................................................................................78
BIOGRAPHICAL SKETCH .........................................................................................................90

7
LIST OF TABLES
Table page 3-1 Demographic Characteristics of SB and Healthy Control groups .....................................53
3-2 Variables Used in Primary Analyses .................................................................................54
3-3 Mean Group Scores on Attentional Measures with no Motor Control Correction............55
3-4 Mean Group Scores on Attentional Measures with Motor Control Corrections ...............56
3-5 Mean Group Scores on Self-Concept Domains .................................................................57
3-6 Correlations between Tests of Attention and Self-Concept for the Total Sample (Controls and Spina Bifida) ...............................................................................................58
3-7 Group Mean Scores on Mood Symptom Scales ................................................................59
3-8 Age Differences on Self-Concept domains within Spina Bifida group.............................60
3-9 Gender Differences on Self-Concept domains within Spina Bifida group........................61

8
Abstract of Dissertation Presented to the Graduate School of the University of Florida in Partial Fulfillment of the Requirements for the Degree of Doctor of Philosophy
ATTENTION AND SELF-CONCEPT IN ADOLESCENTS WITH SPINA BIFIDA
By
ANDREW S. PRESTON
August, 2007
Chair: Eileen B. Fennell Major: Psychology
Spina bifida is a neural tube defect that occurs in approximately 1 to 2 of every 2,000 live
births in the United States and causes numerous physical and cognitive deficits. Due to
improved medical treatments and high rates of long-term survival, health care providers are
learning more about issues of adolescence and later adulthood. The current study compared
young adolescents with spina bifida to healthy controls on measures of attention and self-
concept. The current study is unique because it examined attentional performance while
controlling for motor demands. Additionally, no studies to date have assessed the relationship
between cognitive deficits and self-concept in this population. This study hypothesized that
children with spina bifida would perform significantly lower on tests of selective attention,
attentional control, sustained attention, and parent-reported attention, even after controlling for
motor demands. A second hypothesis was that children with spina bifida would have less
positive self-concept on academic performance, social relationships, and physical appearance. In
addition, it was hypothesized that there would be significant relationships between performance
on attentional tests and self-concept. Results demonstrated that after controlling for motor
demands, adolescents with spina bifida performed worse than healthy controls on tests of

9
sustained and selective attention, but not attentional switching. Additionally, parents rated
adolescents with spina bifida as having more attentional problems than healthy controls.
Adolescents with spina bifida reported significantly lower social, academic, and physical self-
concepts. However, the hypothesized potential role of attentional problems in report of self-
concept was not supported. These findings support prior research suggesting that adolescents
with spina bifida have greater attentional deficits and lower self-concept. Future studies should
continue to explore the potential relationship between attention and self-concept, including
exploration of related constructs, such as self-awareness.

10
CHAPTER 1 INTRODUCTION
General Background
Numerous studies have demonstrated a variety of physical and cognitive deficits related to
spina bifida and comorbid hydrocephalus, including weakness or paralysis of the legs, poor
bladder/bowel control, poor fine and gross motor skills, poor language content, visual-motor
deficits, and visual-spatial deficits (Hetherington and Dennis, 1999; Barnes and Dennis, 1998;
Fletcher, Brookshire et al., 1995). Additionally, studies indicate that children with spina bifida
and hydrocephalus have learning deficits, encoding and retrieval deficits, and deficits in attention
and executive functions (Fletcher, Brookshire et al., 1995; Jacobs, 2001; Scott, 1998; Yeates
1995). However, many previous studies of attention are confounded by motor demands within
the tests. In addition, many studies suggest that self-concept and mood are poor in children with
spina bifida, but these studies have been inconsistent and have not attempted to analyze the
impact of cognitive functioning on self-concept. Since attention and executive functions are
likely to impact academic, social, and other areas of an adolescent’s life, it is critical to take these
abilities into consideration when researching self-concept in adolescents with spina bifida. My
study addressed two limitations in previous literature.
To address the confounds of motor skills on attentional tasks used in prior studies, tests
were used that either had limited motor demands or were able to factor out this motor component
for a purer assessment of attention. It was hypothesized that adolescents with spina bifida would
perform more poorly on cognitive tests of attention and executive functioning than healthy
adolescents, even after factoring out the motor component. It was predicted that adolescents
with spina bifida would perform more poorly than healthy controls on measures of selective
attention, sustained attention, and attentional control/switching, even when motor demands are

11
minimized or factored out of the measure. Consistent with some prior research, it was
hypothesized that adolescents with spina bifida would have lower self-concepts in the academic,
social, and physical domains. It was also predicted that increases in attentional performance
would correlate with more positive self-concept in areas that benefit from attentional abilities,
specifically academic, social, and competence domains. The competing hypothesis was that
poorer cognitive performance would predict more positive self-concept more broadly. Although
this seems counter-intuitive, some studies have suggested that children with more severe
disabilities experience less stress and are better adjusted than children with mild or moderate
disabilities. A discussion of neuroanatomical, cognitive, and physical sequelae of spina bifida
follows. A discussion of attention, self-concept, and the relationship between cognitive
functions and self-concept is included.
Attention: Definitions and Neuroanatomical Substrates
Although there are numerous models of attention, the current study used Mirsky’s (1989,
1991) definition of attention as a construct with three components: sustained attention, selective
attention, and shifting attention/attentional control. Sustained attention is the ability to
concentrate or stay on-task, specifically when a task is long and/or provides little stimulation.
Selective attention is defined as focusing attention on a target in the presence of distracters.
Finally, shifting attention/ attentional control is the ability to adapt to a changing response set.
There are numerous studies attempting to localize these various attentional components.
Although most studies demonstrate significant interconnections between areas responsible for
these components of attention, some specific brain regions have been implicated. Sustained
attention is theorized to be mediated by the prefrontal cortex (Cohen, Malloy, & Jenkins, 1999;
Cohen, 1993; Mirsky, 1989; Goldman-Rakic, 1988; Luria, 1966). This theory is supported by
both imaging studies and studies of patients with frontal lobe lesions. The caudate also appears

12
to play a role as a gateway between the thalamus and the cortex (van Zomeren and Brouwer,
1994; Mirsky, 1989; Hassler, 1978).
Most studies of selective attention rely on visual stimuli, which are processed primarily by
the posterior parietal cortex (Cohen and O’Donnell, 1993; Mirsky, 1989; Mesulam, 1985). In
addition, the pulvinar nucleus of the thalamus appears to play a role in ignoring irrelevant
information (LaBerge, 1995; Posner, Petersen, Fox, & Raichle, 1988), the superior colliculus is
responsible for eye movement while scanning (Posner et al., 1988), and the posterior temporal
cortex integrates sensory information and attends to specific features of stimuli (Mirsky, 1989).
Finally, split-brain experiments suggest that the corpus callosum integrates information between
hemispheres during selective attention tasks (Luck, Hillyard, Mangun, and Gazzinaga, 1994).
Shifting attention has been studied less than sustained or selective attention, but appears to
overlap structurally with both sustained and selective attention, involving the prefrontal cortex,
posterior parietal cortex, pulvinar, and superior colliculus (Cohen et al., 1999; Petersen, Fox,
Mintur, Posner, and Raichle, 1989; Posner et al., 1988).
Definitions of Self-Concept and Relationship with Attention
As with the construct of attention, there are numerous models of self-concept. The
proposed study will use a model proposed by Shavelson (1976), which defined self-concept on
seven features. These features were used to design the Multi-dimensional Self-Concept Scale
(MSCS) (Bracken, 1992) and are as follows:
• Organization – self-concept is developed in an organized way through evaluation of themselves through past behaviors and experiences.
• Multi-faceted nature – self-concept is not unidimensional although there may be
overlap between contexts. • Hierarchical dimensionality – a generalized self-concept exists at the center of the
multiple dimensions, with other concepts equal to one another.

13
• Stability – as a learned behavioral response pattern, self-concept is stable for well-learned behaviors. It changes only gradually as it accumulates new information from the environment and roles change within the environment.
• Developmental characteristics – self-concept becomes increasingly differentiated
with age and experiences in different domains. • Evaluative underpinnings – Individuals automatically evaluate their actions and
outcomes in the moment based on personal perspective and others perspectives. Evaluations are based on standards that change as children become older.
• Differentiality – self-concept is related to other domains but is also distinct.
In short, self-concept develops as an individual evaluates: a) how they behaved in a certain
situation and b) how others responded to that behavior. If the behavior and feedback is
consistent over time, the individual internalizes these behaviors as part of their “self.”
As children develop, self-concept changes. Specifically, there is greater differentiation of
self-concept with age (Crain & Bracken, 1994), and these different domains appear to be
influenced by the environment (Cauce, 1987; Guay, Marsh, & Boivin, 2003). There is some
disagreement whether differentiation continues through adolescence (Crain & Bracken, 1994) or
reaches adult levels by preadolescence (Marsh, 1989). A number of studies have examined
changes in self-concept as children progress from preadolescence through late adolescence.
Results to date are somewhat inconsistent across studies. Within academic and social domains,
some research has found that children experience increases in self-concept as they progress from
grades 3–6 (Cole et al., 2001), followed by a drop in the transition to middle school (Cole et al.,
2001; Wigfield, Eccles, Iver, Reuman, & Midgley, 1991), and then an increase to previous levels
and stabilization in grades 8–11 (Cole, 2001). However, other studies report that children
experience higher levels of self-concept in 7th grade followed by a drop in grades 8–9 and an
increase in grades 10–11 and into young adulthood (Marsh, 1989). Other studies have found
increases in some areas with age, such as social skills, and decreases in others, such as school

14
competence (Shapka & Keating, 2005). Still others found no relationship between age and self-
concept as children progress from grades 5–12 (Crain & Bracken, 1994).
The development of self-concept, as described above, involves one’s behavior in various
environments and feedback from that environment, which modifies those behaviors and
gradually establishes how someone perceives themselves in that environment (Bracken, 1992).
As such, it requires attention to one’s behavior, the specific environment, and the responses their
behavior evokes in other people. It is expected that deficits in attention would affect self-concept
development. In fact, Barkley’s (1992) model of ADHD proposes that poor attentional
functioning is related to poor social perspective taking, response to feedback, self-questioning,
and reflection, all of which could affect self-concept. This theory is supported by a number of
studies. Although some studies have found lower self-concept in children with ADHD or
hyperactive symptoms (Barber, Grubbs, & Cottrell, 2005; Dumas & Pelletier, 1999), other
studies have shown that children with ADHD have comparable self-concepts to healthy controls,
not only in scholastic competence but also in general self-worth (Wilson & Marcotte, 1996;
Bussing, Zima, & Perwien, 2000; Hoza, Pelham, Milich, Pillow, & McBride, 1993).
Other research has shown that children with ADHD overestimate their self-perceptions
compared to healthy controls relative to parent and teacher ratings in multiple domains, most in
domains of greatest deficit (Hoza et al.2004, Hoza, Pelham, Dobbs, Owens, & Pillow, 2002).
Additionally, a study by Owens & Hoza (2003) found that more severe ADHD-
hyperactive/impulsive symptoms, but not inattention, were related to greater overestimates in
scholastic competence. These deficits appear to be related to poor ability to evaluate their own
performance, as demonstrated by the fact that children with ADHD were less accurate in judging
their performance on specific tasks in a study by Hoza, Pelham, Waschbusch, Kipp, and Owens

15
(2001). A study by Milich, Licht, Murphy, & Pelham (1989) found that children’s estimates of
performance on a continuous performance test (CPT) improved while taking stimulant
medication compared to estimates on placebo, suggesting that inaccurate estimates of
performance are due to poor attention. However, it is also possible that these overestimates
serve as a self-protective factor. Ohan & Johnston (2002) found that estimates of social
performance in boys with ADHD decreased with positive feedback. Academic self-concept
improved with positive feedback, however. Importantly, difficulties with self-concept may
result in poor levels of social competence due to poor attention to other’s feedback. Common
social difficulties in ADHD include difficulty keeping friends, annoying and intrusive behavior,
and difficulty encoding and responding to social cues (Semrud-Clikeman et al., 2000; Matthys et
al., 1999; Landau et al., 1997; Landau et al., 1991).
Neurological studies have provided further evidence that attentional systems are involved
in the development of self-concept. Loss of insight and sense of self have been linked to the
extent of frontal lobe damage in patients with frontal-temporal dementia (Mendez & Shapira,
2002), schizophrenia (Laroi et al., 2002), and Capgras Syndrome (Feinberg & Keenan, 2005).
Imaging studies in healthy adults have also demonstrated that the frontal cortex is active during
self-referential thinking (Kelly et al., 2002) and support the theory that frontal lobes are
important for self-awareness, self-monitoring, and insight (Shallice, 1982; Shimamura, 1995; &
Stuss & Benson, 1986). Additionally, a number of imaging studies suggest that a sense of self is
subserved by a network between prefrontal and parietal regions (Gusnard, 2005). For example,
PET and fMRI studies have shown functional connectivity between prefrontal and/or anterior
cingulate with parietal and/or posterior cingulate regions during retrieval of episodic memory
(Schmidt et al., 2002; Krause et al., 1999), resting state consciousness (Gusnard & Raichle,

16
2001; Kjaer & Lou, 2000), and during reflection of own personality traits (Johnson et al., 2002;
Kjaer, Nowak, & Lou, 2001).
Spina Bifida
Spina bifida is a neural tube defect that affects approximately 1 to 2 of every 2,000 live
births in the United Stated (Varni & Wallander, 1988). Spina bifida occurs early in the gestation
process when the neural tube fails to close properly, leaving an opening in the spinal column that
is covered by a fluid filled sac. As a result, spina bifida can occur at any level of the spinal
column, with higher lesions typically resulting in more severe impairment (Elias & Hobbs,
1998). Forms of spina bifida include myelomeningocele (meninges and spinal cord collapse into
fluid-filled sac), meningocele (only meninges collapse into sac), or spina bifida occulta (neither
meninges nor cord collapse into sac). Additionally, approximately 80–90% of children with
spina bifida experience hydrocephalus due to malformation of the cerebellar vermis, aqueductal
stenosis, or herniation of the cerebellar vermis through the foramen magnum. These
malformations block the 4th ventricle from properly draining cerebrospinal fluid, thus causing
build-up of the fluid and pressure to the brain. Hydrocephalus can be progressive or become
arrested and is typically treated with a ventricular shunt early in infancy to drain the excess fluid.
If left untreated, hydrocephalus can cause permanent damage, including irreversible mental
retardation or death. Although shunts are highly successful in reducing the severity of
hydrocephalus, children with hydrocephalus may still experience physical and cognitive
impairments after the shunt is implanted.
Physical Complications in Spina Bifida
The physical presentation of spina bifida is diverse due to the various subtypes (occulta,
meningocele, myelomeningocele) and levels of the lesion on the spinal cord. In general, occulta
is the least severe, often with no symptoms, and myelomeningocele is the most severe. Lesions

17
higher in the spinal column (cervical, thoracic, lumbar, or sacral) typically affect spinal cord
functions below the level of the lesion. Additionally, hydrocephalus, shunts, and other
malformations may increase the number of complications.
Although the specific profile of children with spina bifida varies, one common physical
impairment is leg weakness or paralysis, often requiring leg braces or a wheelchair (Elias &
Hobbs, 1998). Other lower motor impairments include club feet, hip dislocation, poor posture
due to spine curvature, muscle contracture, loss of sensation, and other gait abnormalities (Elias
& Hobbs, 1998; Baron, Fennell, & Voeller, 1995; Hetherington & Dennis, 1999). The upper
limbs may also be impaired due to upper level lesions and/or hydrocephalus. Hetherington and
Dennis (1999) found children with hydrocephalus to have poorer persistent motor control,
dexterity, and strength in their upper limbs compared to healthy controls. Eye movements may
also be impaired due to pressure on the cranial nerves and other abnormalities, resulting in ocular
palsies, astigmatism, and visual perceptual deficits (Lollar, 1993).
In addition to motor impairments, children with spina bifida experience numerous physical
impairments due to reduced innervation of the lower body. For example, many children with
spina bifida experience difficulty emptying the bowel and bladder. This may result in
incontinence, constipation, urinary tract infection, and possibly renal damage if infections are
untreated (Elias & Hobbs, 1998). Children may also experience skin infections due to poor
sensation or injury to a limb with diminished sensation.
Finally, numerous complications can contribute to further physical impairments. Shunt
malfunction, for example, can cause vomiting, irritability, headache, and sunsetting of the eyes
(Elias & Hobbs, 1998), as well as increases in infection and cognitive problems. The Arnold-
Chiari II malformation, sometimes associated with spina bifida, occurs when the skull fuses

18
prematurely and pushes the brainstem and cerebellum through the foramen magnum, causing
swallowing difficulties, sleep apnea, and upper extremity weakness (Elias & Hobbs, 1998).
Neuroanatomical Sequelae in Spina Bifida
Due to the high comorbidity rate between spina bifida and hydrocephalus, it is difficult to
differentiate their unique effects. Hydrocephalus affects brain development due to enlargement
of the lateral ventricles which increases pressure on neural tissue, particularly in the
periventricular cortex (including the temporal lobes) and white matter proximal to the ventricles.
This pressure can result in hypoxia effects on white matter pathways, altered architecture and
brain structure, disrupted myelination, thinner cortex, and maldevelopment of specific brain
structures (Barkovich, 1992; Del Bigio, 1993; Dennis et al., 1981; Fletcher, 2000). For
example, the corpus callosum may be abnormal, stretched, or torn. In some cases, the corpus
callosum may be missing, most often in the splenium or rostrum (Barkovich, 1992). Other white
matter, including other periventricular pathways, optic pathways, subcortical white matter, and
fimbria/fornix projections to the hippocampus may also be damaged by stretching or hypoxic
ischemic injuries.
In addition to white matter changes, hydrocephalus can cause changes to brain structures.
Brain mass is often reduced and cortical mantle may be thinned in all areas of the cortex,
although posterior regions are affected more (Fletcher, 2000; Del Bigio, 1993). The
hippocampus may also undergo vacuolization and degeneration (Del Bigio, 1993).
Subcortically, the diencephalon is often compressed and the membrane of the caudate and
thalamus may be disrupted. Finally, the architecture of the brain may be disrupted by microgyri
and polygyri that are comorbid developmental abnormalities (Fletcher, 2000; Del Bigio, 1993).
Blood flow and transportation of neurotransmitters and waste are also disrupted as a result
of hydrocephalus. Blood vessels are reduced in the frontal lobes and capillaries are reduced in

19
the corpus callosum (Del Bigio, 1993). A study by Shirane et al.(1992) found that the frontal,
parietal, and visual association areas surrounding the periventricular areas were hypoperfused in
4 infants with hydrocephalus. Additionally, the extracelluar spaces in the periventricular region
may be blocked due to edema, preventing the normal transfer of neurotransmitters and waste
(Del Bigio, 1993).
Although it is difficult to separate spina bifida and hydrocephalus, there are certain
characteristics that are more prominent in spina bifida with hydrocephalus than other forms of
hydrocephalus, including cerebellar deformation, cerebellar tonsil herniation, elongation of the
pons and medulla, stretching of the cerebral aqueduct and 4th ventricle, and fusing or stretching
of the inferior and superior colliculi due to “beaking” of the tectum (Fletcher 2000).
Fortunately, shunting procedures may reduce or reverse some of the damage discussed
above. Shunting procedures done soon after birth can reduce ventricle size and edema and may
allow for remyelinization and return to normal for arteries.
A number of studies have demonstrated the link between neuroanatomical damage and
cognitive functioning. Fletcher et al.(1992) analyzed MRI images in children with
hydrocephalus and found a correlation between a larger right lateral ventricle and poorer
performance on nonverbal tasks. A smaller corpus callosum also correlated with poorer
nonverbal performance. In a second study, Fletcher (1996) reported that the size of the corpus
callosum correlated with both nonverbal performance and motor performance. Del Bigio (2002)
reported that larger ventricles in rats were also associated with worse motor performance.
Cognitive Profiles in Spina Bifida
Children with spina bifida and hydrocephalus (SB/H) may exhibit a number of
neurobehavioral problems, many of which are improved but remain at least somewhat impaired

20
after shunting. These include poor fine and gross motor skills, poor language content, visual-
motor deficits and visual-spatial deficits, learning deficits, and encoding and retrieval deficits
(Hetherington and Dennis, 1999; Barnes and Dennis, 1998; Fletcher, Brookshire et al., 1995).
Intellectual and achievement performance
Early research on SB/H suggested that children with cortical mantle less than 2.8 cm thick
were very likely to have an IQ below 80 (Young, 1973). As shunts and shunt placement
improved (including placing shunts in the right side rather than the left), the number of shunt
failures and revisions decreased, resulting in improved prognosis for cognitive functioning.
Some research suggests that children with spina bifida and hydrocephalus may demonstrate IQs
in the low average to average range (Willis, 1993). Still, most research indicates that children
with SB/H have statistically lower IQ scores than healthy controls (Appleton, 1994; Brewer,
2001; Willis, 1990). Many of these studies support the theory that children with SB/H have
greater impairment in performance IQ (PIQ) with relatively intact verbal IQ (VIQ) (Riddle,
2005; Fletcher, 1992; Shaffer, 1985), even on tasks without motor demands (Fletcher, 1992).
This discrepancy was explored further by Yeates, (2003), who reported that 50% of children with
spina bifida in his study sample met criteria for nonverbal learning disability. However, many
studies have not found a discrepancy between VIQ and PIQ, but report that both are lower than
the comparison group or below normative means (Jacobs, 2001; Holler et al., 1995; Friedrich,
1991; Wills, 1990).
Studies of achievement generally suggest that children with SB/H perform poorly on
arithmetic or mathematical tasks (Dennis & Barnes, 2002; Jacobs, 2001; Friedrich, 1991; Wills,
1990; Shaffer, 1985). Performance on reading and spelling has been less consistent, with some
studies finding deficits in reading but not spelling (Jacobs, 2001), others finding deficits in

21
spelling but not reading (Shaffer, 1985), and still others finding deficits in both areas (Tew &
Laurence, 1975).
Visual-motor and visual-constructional abilities
As discussed previously, it is well-established that children with SB/H have motor deficits,
including eye movements. Studies consistently report that children with SB/H perform poorly on
visual-motor or visual-constructional tasks such as visual pursuit, drawing, and mazes (Dennis,
2002; Holler et al., 1995; Friedrich, 1991; Wills, 1990). On motor-free tasks, findings suggest
preservation of basic visual perception on simple tasks such as face recognition and simple visual
discrimination (Fletcher, Brookshire, et al., 1995; Dennis 2002) but impairments on more
complex tasks such as figure-ground distinction, spatial memory, form consistency, and line
orientation (Dennis, 2002; Fletcher, Brookshire et al., 1995). Furthermore, research
demonstrates that the degree of visual-perceptual difficulties is related to the size of the right
lateral ventricle (Fletcher, Bohan, et al., 1992).
Language
Although basic language skills such as grammar and comprehension in children with SB/H
are typically intact (Horn et al., 1985; Schwartz, 1974; Parsons, 1968) a number of recent studies
suggest that children with SB/H experience a number of language-related impairments including
hyperverbal behavior (Dennis & Jacennik, 1994; Wills, 1993; Tew & Laurence, 1979), which
consists of irrelevant information or less cohesive and less meaningful content (Barnes &
Dennis, 1998; Dennis & Jacennik, 1994; Wills, 1993), inappropriate verbalization or social
disinhibition (Wills, 1993), poor comprehension for figures of speech, inferences, or other more
complex language (Barnes & Dennis, 1998; Wills, 1993), and poor descriptions or explanations
of stories (Barnes & Dennis, 1998; Wills, 1993). Furthermore, children with SB/H have slower
response speed on timed word finding or word fluency tasks (Barnes, 2004; Huber-Okrainec,

22
2002; Jacobs, 2001;Holler et al., 1995; Fletcher, 1995; Wills, 1993). Additionally, Huber-
Okrainec et al.(2002) found that children with SB/H had numerous motor speech deficits,
including speech rate impairments, dysarthria for prosody and articulation, and dysfluency in
speech, suggesting that language problems are compounded by motor deficits.
Memory and learning
Only a small number of studies have addressed memory functions in children with SB/H.
The studies that have been conducted can be divided by the material (verbal or nonverbal) and
the process involved (learning, encoding/recognition, retrieval/recall). To date, findings
suggest that children with SB/H learn verbal information at a slower rate and recall less verbal
information after a delay than healthy controls (Jacobs, 2001; Scott, 1998; Yeates 1995; Cull &
Wyke, 1984), although this deficit may only occur when children must apply their own structure
or semantic strategy to the information. For example, Cull & Wyke (1984) found deficits on
memory for word lists but not story recall. Additionally, some studies suggest that encoding or
recognition is intact for verbal information (Yeates, 1995), whereas others suggest it is impaired
(Scott, 1998). With visual material, studies are also less consistent. Scott (1998) found
differences on nonverbal memory for both recall and recognition, but Cull & Wyke (1984) did
not find these differences after matching for IQ. Jacobs (2001) reported that the SB/H group
approached significant differences from healthy controls on visual learning tasks. Finally, a
study by Mammarella (2003) found that children’s working memory was not worse on memory
for spatial positions of blocks and matrix designs, but was worse for memory of objects.
Mammarella (2003) suggested that children’s memory was better in active processing tasks.
However, this finding is not supported by other studies that have found intact memory for objects
(Cull & Wyke, 1984).

23
Attention and executive functions in SB/H
To date, a number of studies have suggested that children with SB/H have deficits in
attentional tasks. For example, children with SB/H have been found to participate in less goal-
directed behavior than healthy children (Landry, 1990), to perform worse on vocabulary tasks
when distracting stimuli are present (Horn, 1985), and to be verbose (Barnes & Dennis, 1998;
Baron & Fennell, 1995). Parent report studies show that over 30% of parents endorse high levels
of attentional problems for their children with SB/H, mostly related to inattention (Burmeister,
2005; Davidovitch, 1999). Furthermore, parent ratings on the Behavior Rating Inventory of
Executive Function (BRIEF) demonstrated greater concerns regarding executive functions
compared to controls (Burmeister, 2005), including the ability to initiate, plan, and monitor their
behavior (Mahone, 2002). Importantly, these problems were reported despite adequate (average
to low average) verbal intellectual functioning.
A number of studies have assessed attention with neuropsychological tests. The most
consistent result has been a deficit in selective attention, which was found on tasks such as the
Trailmaking test parts A and B (Snow, 1999; Loss, 1998), Coding on the WISC-III (Loss, 1998),
the Stroop test (Fletcher et al., 1996), and visual orienting (Brewer et al., 2001). These findings
are consistent with neuroanatomical studies that indicate damage to posterior cortex, and the
superior colliculus which are implicated in selective attention. In further support of a selective
attention deficit, Dennis et al.(2005a) demonstrated that children with spina bifida were slower
orienting to a visual stimulus after a cue, which was associated with structural abnormalities
(tectal beaking). In a second study by Dennis (2005b), children with spina bifida demonstrated
neglect of the right side which corresponded to corpus callosum damage and superior visual field
deficits in line bisection tasks which corresponded to right posterior and midbrain damage.

24
Whereas selective attention deficits are well supported, findings are less consistent for
other areas of attention. Dennis et al. (2005a) found that children with spina bifida were slower
to disengage from an invalid cue, suggesting that attentional switching or shift was impaired.
Poor performance on the Trails B could also be interpreted as difficulty with attentional
switching (Loss, 1998; Snow, 1999). Studies by Snow (1999), Loss et al. (1998), and Fletcher
(1996) also found that children with spina bifida were worse than healthy controls on a test of
attentional switching, the Wisconsin Card Sorting Test (WCST). Additionally, Loss (1998) and
Brewer (2001) found that children with spina bifida were worse on a test of sustained attention,
the Continuous Performance Test (CPT). However, a study by Lollar (1990) did not find
significant differences between children with hydrocephalus (many with spina bifida) and
normal controls on a CPT, suggesting that children with spina bifida do not have deficits in
sustained attention.
One limitation of the current literature is that many tests of attention have a motor
component such as reaction time, which could confound the results in this population since it is
clear that children with spina bifida have deficits in fine and gross motor skills as well visual
motor speed. Fletcher et al. (1996) suggested that the selective attention deficits the authors
found were largely due to slower motor performance. Additionally, many of the measures used
to assess attention are often different and may be used to assess broader functions such as
problem-solving, as is the case with the WCST. Clearly, there are important confounds and a
lack of consensus in the selection and interpretation of measures used to assess attentional
function in children with SB/H.
Self-Concept and SB/H
To date, a number of studies have examined mood and self-concept in children with SB/H,
with varying results. Although a number of studies suggest that children with SB/H have poorer
25
self-concept and higher rates of depression (Appleton, 1997; Dorner, 1976), others report no
differences in self-concept or mood compared to healthy same-age peers (Holmbeck, 2003;
Edwards-Beckett, 1995; Landry, 1993). Additionally, many studies report that children with
SB/H have positive self-concept related to general topics such as global self-worth or hope for
the future, but report greater concerns for specific issues (Buran, 2004; Appleton, 1994; Fletcher
1995). Some common issues that are concerning to children and adolescents with spina bifida
include: physical appearance, physical competence, social acceptance, academic performance,
job competence, and romantic relationships.
Social support appears to be the most significant protective factor for positive self-concept
in children with SB/H. Parents often rate psychosocial functioning as a significant concern
(Hommeyer, 1999; Donders, 1992; Wallander, 1989; Lavigne, 1988). In child or adolescent self-
report studies, support by peers and family, age appropriate treatment by parents, and low family
conflict are positive predictors of positive self-concept (Antle, 2004; Wolman, 1994; Murch,
1989; Kolin, 1971). Furthermore, children with SB/H whose families encourage more
independence and age appropriate social activities are more likely to have more positive long-
term outcomes regarding occupations, community involvement, and social activities in young
adulthood (Loomis, 1997). Unfortunately, studies have consistently shown that children and
adolescents with SB/H are more dependent on parents, have fewer household responsibilities, are
more immature socially, and have fewer or more limited social interactions with peers (Buran,
2004; Holmbeck, 2003; Buran, 2001; Monsen, 1992; Blum, 1991). With the exception of one
study that suggested children had more distress with greater independence, it seems that age
appropriate permissiveness by parents and encouragement for social interaction are protective
factors for self-concept in children with SB/H.

26
Interestingly, several parent and self-report studies have not found a consistent relationship
between severity of physical impairment and parental stress or self-esteem in children or
adolescents with spina bifida (Antle, 2004; Sawin, Brei, Buran, & Fasteneau, 2002; Wallander,
1998; Landry, 1993; Donders, 1992; McAndrew, 1979; Kolin, 1971). In fact, some studies
found higher ratings of self-concept with greater physical impairment and greater stress and
mood disorders with less severe disability (Padua et al., 2004; Padua et al., 2002; Minchom et al.,
1995; Holmbeck et al., 1995). Of course, some studies have demonstrated a connection between
poorer self-rated mood or psychosocial maladjustment and increased severity (Zurmhole, 2001;
Hommeyer, 1999; MacBriar, 1983), as well as poorer Quality of Life ratings with increased
severity (Shoenmakers, Uiterwaal, Gulmans, Gooskens, & Helders, 2005), but severity is clearly
not a consistent predictor of self-concept or distress.
Based on these findings, it is unclear what role attention plays in the development of self-
concept in children with spina bifida. It is possible that poor attention could disrupt numerous
aspects of life, including social, academic, and occupational situations, thereby resulting in
lowered self-concept due to poor outcomes in these areas. In a study by Warschusky (2003),
poor social problem-solving was correlated with poor performance on the WCST, a test that
requires attentional switching and monitoring responses. However, as discussed previously,
attentional deficits may reduce insight or awareness into negative feedback, thereby not
decreasing self-concept. If individuals are unable to accurately judge their abilities or social
feedback from others in a given arena, they may also not be negatively affected by this feedback.
Given the fact that children with spina bifida have been shown to have poor attention and given
the neurological impact of SB/H on the parietal lobes and blood supply to the frontal lobes, it is
27
possible that children with SB/H experience similar deficits in self-concept as children with
ADHD and other neurological disorders described above.
The Current Study
The current study will compare young adolescents with spina bifida to healthy controls on
measures of attention and self-concept. This study was unique in a number of ways. First, it
assessed attention and executive functioning with the Tests of Everyday Attention in Children
(TEA-Ch) and the Trailmaking Test from the Delis-Kaplan Executive Function System (D-
KEFS). These measures are unique because they control for motor demands that may confound
performance. Additionally, the subtests of the TEA-Ch assess each domain of attention
(sustained, selective, attentional switching) individually, minimizing confounds or overlap
between these domains. The current study assessed selective attention with the TEA-Ch Sky
Search. Sustained attention was measured with the TEA-Ch Score! subtest. Finally, attentional
control/switching was measured with the TEA-Ch Opposite Worlds vs. Same Worlds score and
the Number-Letter Switching vs. Motor score on the D-KEFS Trailmaking test. In order to
further strengthen the design, parent-rating scales of attention were included from the Behavior
Assessment System for Children (BASC) to measure attention more generally.
Second, the studies that have examined self-concept in children with spina bifida have
reported inconsistent results, and few studies have specifically compared young adolescents with
spina bifida to healthy controls. The current study attempted to resolve some questions about
these children by using a normal control comparison group, an age range that focuses on young
adolescents (ages 10 –16) whose self-concept is likely more developed than that of younger
children, and by using the Multi-Dimensional Self-Concept Scale (MSCS), a measure that
provides a total score and six domains of self-concept, including: Social, Competence, Affect,
Academic, Family, and Physical domains. Based on previous research, it was expected that

28
there would be differences on social, academic, and physical domains. Previous research
suggests that family self-concept will not significantly differ between groups. It was not
expected that there would be differences on the more general competence scale, since children
with spina bifida do not report lower self-concept on more general topics. The expected results
for the affect domain was unclear; whereas some research suggests that affect is worse, other
studies do not.
Third, although studies have individually examined attention in children with SB/H and
self-concept in children with SB/H, past research has not analyzed the impact attention has on
self-concept. It is likely that attention has a significant general impact on self-concept and mood,
specifically related to those domains that would benefit from good attentional skills, including
self-concept for academic performance, social skills, and general competence. This study
attempted to provide a better understanding about how attention affects self-concept as well as
inform treatment recommendations to improve attention and self-concept in children and
adolescents with spina bifida.
Hypotheses
Specific Aim 1
Compare performance on attentional tasks and parent rating scales of attention among
children with spina bifida and healthy controls. It was predicted that children with spina bifida
would perform worse than controls on tasks of selective attention, sustained attention, and
attentional switching. It was also predicted that parent-reported general attention would be lower
in children with spina bifida compared to healthy controls.

29
Specific Aim 2
Compare self-concept in children with spina bifida to healthy controls. It was predicted
that self-concept would be lower in children with spina bifida than healthy controls, specifically
in academic, social, and physical domains.
Specific Aim 3
Determine relationship between self-concept and attention in children with spina bifida
and healthy controls. It was predicted that poor attentional performance would be correlated
with lower self-concept in children with spina bifida, because the attentional deficits are likely to
negatively impact areas of life that influence self-concept, specifically social relationships,
academic performance, and competence.
30
CHAPTER 2 MATERIALS AND METHODS
Participants
The final sample of participants included 13 children diagnosed with any spina bifida
myelomeningocele or meningocele and 17 healthy controls. Only children between the ages of
10–16 were asked to participate. The upper age limit was chosen based on the available
normative data for the proposed neuropsychological measures.
Children were included in the spina bifida group if they had been previously diagnosed
with spina bifida myelomeningocele or spina bifida meningocele, as defined by the Spina Bifida
Association of America (SBAA) and diagnosed by a physician. Healthy controls were required
to have no significant medical or psychiatric diagnosis. All participants were required to be
between the ages of 10–16.
Participants with a verbal IQ less than 80 on the Peabody Picture Vocabulary Test, Third
Edition (PPVT-III) were excluded from the study in order to ensure that children did not meet
criteria for mental retardation, a potential confound. Additionally, in order to ensure that
participants could read and comprehend self-report questionnaire items on the self-concept and
mood measures, children with a standard score below 70 for their age (–2.0 Standard Deviations
below the average range) as demonstrated on the Wechsler Individual Achievement Test-II:
Word Reading subtest were excluded from the study. Children were also excluded if they were
diagnosed with comorbid medical or psychiatric conditions that confounded the results, as
determined by study investigators. Participants in the Spina Bifida group were not excluded due
to comorbid learning disabilities, or attention deficit hyperactivity disorder. Participants with
these diagnoses were not excluded because the difficulties in attention and learning were
diagnosed after the diagnosis of spina bifida and may have resulted from the neurological effects

31
of spina bifida. Within the current group, 3 participants had been diagnosed with ADHD (2
Predominantly Inattentive, 1 Combined-Type) and 2 were diagnosed with an unspecified
Learning Disability, 1 of whom also had ADHD.
Measures
Demographic Information
All parents of participants completed a short demographic questionnaire (see Appendix
A). The questionnaire provided basic demographic data such as age, sex, and race/ethnicity of
the child. Information was also collected on medical/psychological history, including previous
diagnoses, hospitalizations, surgeries, etc. Additionally, educational history was collected,
including current grade, whether the child repeated or skipped grades, difficulties in school, and
whether the child was in mainstream or special education classes. Finally, information about
activities and social relationships was collected.
For children with spina bifida, information was collected from parents and health care
providers regarding level and type of spina bifida, presence of hydrocephalus, and additional
medical conditions secondary to spina bifida or hydrocephalus. Additionally, parents were asked
about the child’s mobility, incontinence, self-care, and other concerns related to independence
and quality of life.
Screening Measures
Peabody Picture Vocabulary Test- Third Edition (PPVT-III)
The PPVT-III is a screener for verbal ability consisting of 204 test items divided into 17
sets of 12 that are progressively more difficult. The child is presented with four black-and-white
drawings and is asked to choose which picture best represents the meaning of a word read aloud
by the examiner. The test produces age-based norms for children and adults age 2.5–90. Scores
are converted into standard scores with a mean of 100 and a standard deviation of 15. As

32
indicated, children with standard scores below 80 were excluded from the study due to concerns
about developmental delays or comorbid mental retardation.
The PPVT-III was standardized on 2,725 examinees aged 2-1/2 through 90 years, tested at
268 sites nationwide. The PPVT-III has excellent test-retest reliability (coefficients range from
.91–.94). Internal reliability is also good, with alpha coefficients ranging from .92–.98.
Convergent validity correlations with other measures of oral language range from .63–.83.
Correlations with measures of cognitive ability, such as the WISC-III, are also acceptable. The
correlations between the WISC-III verbal IQ and PPVT-III is .91, with WISC-III performance
IQ is .82, and with WISC-III full scale IQ is .82.
Wechsler Individual Achievement Test, Second Edition (WIAT-II): Word Reading subtest
This is a screening test for reading level. Children are instructed to read a list of words of
increasing difficulty until a baseline and ceiling are established. This test produces age and
grade-based norms for ages 4-adult. Raw scores are converted into standard scores with a mean
of 100 and a standard deviation of 15. As indicated, children with standard scores below 70
were excluded from the study due to concerns about their ability to complete self-report
questionnaires of self-concept and mood.
The WIAT-II age-based standardization sample included 2,950 participants ranging from
age 4 years, 0 months to 19 years, 11 months. The sample was divided into two groups: ages 4–
14:11 and 15–19:11. There were 2,400 participants in the 4–14:11 group and 550 in the 15–
19:11 group. 1,806 of the participants were female, 1,477 were male. The number of
participants from different racial and ethnic groups was based on racial/ethnic group proportions
of students in the U.S. Test-retest reliability is high, with coefficients ranging from .97–.99.
Word Reading correlates highly with Basic Reading scores on the WIAT-II (coefficient = .88),
the WRAT-3 (coefficient = .73), and other reading measures. Additionally, the WIAT-II

33
correlates with teacher grades in reading at a .40 level and children with learning disabilities in
reading perform significantly worse than matched controls, making it an acceptable screening
tool (The Psychological Corporation, 2001).
Evaluation of Attention: Parent-report
Behavior Assessment System for Children – Parent Rating Scales: 12–18 or 6–11 (BASC: PRS-A) or (BASC: PRS-C)
This is a broadband, multi-dimensional parent-report measure of child behaviors on 130
items using a Likert scale. The measure was created to aid in clinical diagnosis of disorders that
are first apparent in childhood and adolescence. Parents rate their child’s behavior on four
composite scores: Externalizing Problems (scales: Aggression, Hyperactivity, Conduct),
Internalizing Problems (scales: Anxiety, Depression, Somatization), School Problems (scales:
Attention, Learning Problems), and Adaptive Skills (scales: Adaptability, Leadership, Social
Skills, Study Skills). Composite scores and scores for individual scales are available. This
measure is standardized by gender. Scores are converted into standard scores with a mean of
100 and standard deviation of 15.
The BASC: PRS was standardized in three age groups: 4–5, 6–11, and 12–18. The 6–11
age group included 2,084 children, whereas the 12-18 age group included 1,090 children.
Within the 6–11 age group, 51% were male and 49% were female. Within the 12–18 age group,
42% were male and 58% were female. Substantial numbers of minority children were included
at all age levels, and samples of children were taken throughout 157 sites in the U.S. and Canada.
Internal reliability of composites ranged from .85 –.93. Internal reliability for individual scales
ranged from .58–.89 across scales. The attention scale’s internal reliability ranged from .73–.83.
Test-retest reliability of composites ranged from .71–.94. The attention scale specifically ranged
from .78–.92. Interrater reliability for composites ranged from .53 –.76, with the attention scale

34
ranging from .56–.73. Test items were created with the help of teachers, parents, psychologists,
and other references, and scales were based on factor analyses. Additionally, BASC scales
correlate highly with scores on other test measures such as the Achenbach Child Behavior
Checklist (Achenbach & Edelbrock, 1983), and the Personality Inventory for Children- Revised
(PIC-R) (Lachar, 1982).
Neuropsychological Measures of Attention
Test of Everyday Attention for Children (TEA-Ch)
The TEA-Ch is a test of three domains of attention: Selective attention (finding a target
among distracters), sustained attention (maintaining attention over time), and attentional control/
switching (shifting attention as needed). Of the 9 subtests available, three subtests were selected
for inclusion in evaluation of attention for study subjects. Sky Search is a selective attention task
that requires the child to find target spaceships among distracters. Children are presented with a
practice sheet and then given a large sheet with target spaceships and distracters. Children are
scored for accuracy and speed, and there is a motor control task that consists of a sheet of only
target ships. This allows the examiner to account for confounds of motor speed. Score! is a
sustained attention task in which children must count the number of sounds they hear on a tape
recording over time. Children are scored on accuracy in this task. Opposite Worlds is an
attentional switching/control task in which children must say ‘1’ when they see a ‘2’ and vice
versa. This tests the ability to inhibit the prepotent response and switch to the correct response.
Children are scored on speed for this test. Raw scores are converted to scaled scores, with a
mean of 10 and standard deviation of 3.
The TEA-Ch is standardized for ages 6–16. The normative sample consisted of 293
Australian children between the ages of 6–16. Test-retest correlation coefficients were .75–.80
for Sky Search variables, .76 for Score!, and .85 for Opposite Worlds. Validity of the separate

35
attentional domains was supported with a structural equation model of the normative sample and
demonstrated that Sky Search, Score!, and Opposite Worlds fit into distinct domains with other
TEA-Ch tests of selective attention, sustained attention, and attentional control/switching,
respectively. Convergent validity with other measures of attention, such as the Stroop,
Trailmaking Test, and Matching Familiar Figures Test was high. Additionally, the TEA-Ch
subtests used in this study were not significantly related to performance on the WISC-III
measures of Vocabulary, Similarities, Block Design, or Object Assembly, suggesting that
performance on the TEA-Ch requires attentional systems distinct from intellectual ability.
Furthermore, TEA-Ch subtests did not show strong relationships to the WRAT Reading subtest.
There were no significant relationships between WRAT reading and TEA-Ch Sky Search and
Opposite Worlds. A small but significant relationship between WRAT reading and TEA-Ch
Score! performance was found at the .18 level. Additionally, children with documented
attentional problems, such as ADHD, have been found to perform more poorly on TEA-Ch
subtests than healthy controls (Manly, Anderson, Robertson, Nimmo-Smith, 1999) and clinical
controls (Heaton et. al, 2001).
Delis-Kaplan Executive Function System (D-KEFS): Trailmaking Test
This test is a variation of the traditional trailmaking test designed to evaluate executive
functions and processing speed. In each test, children are instructed to quickly draw a line from
one dot to another in a specified order. The D-KEFS Trailmaking test includes five conditions:
line cancellation (draw a line through a target number), letter sequencing (connect letters in
alphabetical order), number sequencing (connect numbers in order), letter-number sequencing
(switch between numbers and letters), and a motor task (connect along a dotted line). The test is
designed so that letter-number sequencing, which requires cognitive flexibility, can be compared
to other tasks of basic motor speed or visual scanning. This allows the examiner to account for

36
possible motor or visual scanning confounds. The test is standardized for ages 8–89. Raw
scores are converted to scaled scores with a mean of 10 and a standard deviation of 3.
The D-KEFS was standardized with 1750 children and adults, including 75 10-year-olds,
75 11-year-olds, 100 children for each year between 12–15, and 175 children between 16–19.
The male to female ratio is roughly 50–50 and proportions of the sample of racial/ethnic groups
were stratified to approximate the 2000 U.S. Census population estimates. Additionally, the
proportion of the sample is approximately 25% per region of the U.S., including the North
Central, North East, South, and West. The Trailmaking Test specifically has good internal
consistency (between .57–.79 across ages 10–6). Test-retest reliability varies from .20 for
Condition 4 (Switching) to .82 for Condition 5 (Motor speed).
Self-Concept
Multi-Dimensional Self-Concept Scale (MSCS)
This is a child self-report of self-concept. Self-concept is measured on six 25-item scales
representing differing aspects of self-concept: physical appearance/ability, social relationships,
family relationships, academic performance, affect, and general competence. A total score is
also derived. Children answer questions on a Likert 4-point scale. This scale is standardized for
ages 9–19.
The MSCS scales were standardized on 2,501 children between grades 5–12 and ages 9–
19, although the majority of children were from ages 10–17. The test was administered at 17
locations in the South, West, North Central, and Northeastern United States. The sample was
selected to represent the demographic characteristics of the U.S. population based on the 1990
U.S. Census. The internal consistency of the MSCS as high, with coefficients ranging from .97–
.99 for the total score and .85–.97 for individual scales. Test-retest reliability after four weeks
was also high, with coefficients of .90 for the total score and ranging from .73–.81 for the

37
individual scales. Content validity was demonstrated by review of literature of past self-concept
scales. Concurrent validity was good between the MSCS and Piers-Harris Children’s Self-
Concept Scale (Piers, 1984) as well as the Coopersmith Self-Esteem Inventory (Coopersmith,
1984), with coefficients ranging from .44–.85 between theoretically similar scales. Additionally,
the test authors report that children with previously documented low self-esteem have been
shown to score lower on the MSCS than children without such a designation.
Mood
Revised Children’s Manifest Anxiety Scale (RCMAS)
This is a self-report instrument designed to measure anxiety in children aged 6–19. It
consists of 37 yes/no questions. The scales include a Total Anxiety scale, a Lie Scale,
Physiological Anxiety, Worry-Oversensitivity, and Social Concerns/Concentration. Children
read each statement and circle “yes” or “no” depending on how well the statement describes
them.
This measure was standardized on 4,972 children between the ages of 6–19. The sample
including 44% white males, 44% white females, 5.8% black males, and 6% black females. The
sample was collected over 13 states in the U.S. in all major geographic regions. Internal
consistency for each age level ranged from .42–.87. Test-retest reliability for Total Anxiety was
.68 for children tested 9 months apart. Additionally, the Total Anxiety score was found to
correlate with other measures of trait anxiety at a .67 level.
Children’s Depression Inventory (CDI)
The CDI is a self-report measure of depressive symptoms for children age 7–17. It
includes 27 items in which the child reads three statements and selects the statement that is most
representative of their thoughts or behaviors in the past two weeks. It includes a Total Score and

38
five subscales: Negative Mood, Interpersonal Problems, Ineffectiveness, Anhedonia, and
Negative Self-Esteem.
The CDI was standardized with 1266 students from Florida grades 2–8. The sample
included 592 males and 674 females. 77% of the sample was white and 23% were from other
minority groups. Internal consistency demonstrated that coefficients ranged from .71–.89, and
test-retest reliability estimates were acceptable over time.
Behavior Assessment System for Children – Self-Report Scales: 8–11 or 12–18 (BASC: SRP-C) or (BASC: SRP-A)
In order to assess mood difficulties, participants completed the Behavior Assessment
System for Children – Self-Report of Personality: 12–18 or 8–11 (BASC: SRP-A) or (BASC:
SRP-C) (Reynolds and Kamphaus, 1992). This is a broadband, multi-dimensional self-report
measure of child behaviors using a True/False response choice. The measure was created to aid
in clinical diagnosis of disorders that are first apparent in childhood and adolescence.
Participants’ ratings of behavior result in three composite scores: Clinical Maladjustment (scales:
Anxiety, Atypicality, Locus of Control, Social Stress, and Somatization), School Maladjustment
(scales: Attitude to School, Attitude to Teachers, and Sensation Seeking), and Personal
Adjustment (scales: Relations with Parents, Interpersonal Relations, Self-Esteem, and Self-
Reliance). Additionally, there is an “Other Problems” composite that consists of “Depression”
and “Sense of Inadequacy” scales. Composite scores and scores for individual scales are
available. This measure is standardized by gender. Scores are converted into standard scores
with a mean of 100 and standard deviation of 15.
The BASC: SRP was standardized in two age groups: 8–11 and 12–18. The 8–11 age
group included 2,728 children, whereas the 12–18 age group included 2,393 children. Within
the 8–11 age group, 50% were male and 50% were female. Within the 12–18 age group, 46%

39
were male and 54% were female. Substantial numbers of minority children were included at all
age levels, and samples of children were taken throughout 157 sites in the U.S. and Canada.
Internal reliability of composites ranged from high .80 to mid .90s. Internal reliability for
individual scales ranged from the .70s to the .80s across scales. Test-retest reliability of
composites and individual scales ranged from the .70s to the mid .80s. Test items were created
with the help of teachers, parents, psychologists, and other references, and scales were based on
factor analyses. Additionally, BASC scales correlate highly with scores on other test measures
such as the Achenbach Child Behavior Checklist-Youth Self-Report (Achenbach & Edelbrock,
1983).
Procedure
Children with spina bifida were recruited in one of three ways: during a routine visit to the
spina bifida clinic at the Shands Medical Plaza in Gainesville, Florida, via phone contact by their
treating nurse, Rosellen Dedlow, or via flyers sent to Spina Bifida Association in Jacksonville,
Florida, the Spina Bifida Association in Orlando, Florida, and Shriner’s Hospital in Tampa,
Florida. After a patient expressed interest to their physician or responded to an investigation
flyer, parents of potential participants who met inclusion/exclusion criteria were consented and
participants were assented.
The initial spina bifida sample included 19 participants. Approximately 18 children were
approached by their treating physician at the spina bifida clinic and 13 children agreed to
participate. Approximately 6 children were contacted via a phone call by Rosellen Dedlow and
3 agreed to participate. Finally, 3 children agreed to participate in response to flyers. It is unclear
how many families were provided flyers since these were provided by the directors of the
associations, although it is estimated that the participation rate from flyers was low, probably
below 5-10%.

40
Of the 19 participants recruited for the spina bifida group, 13 were included in the final
analyses. Two participants with spina bifida initially consented to the study but then declined
the study when asked to schedule a date to complete the testing. Two participants with spina
bifida were removed from the final group because they did not meet the cut-off score inclusion
criteria on the WIAT-II word reading component of the screening. One participant was removed
because they did not meet the cut-off score inclusion criteria on the PPVT-II. One participant
was removed when the study design was adjusted from ages 9–16 to 10–16 to more accurately
reflect the young adolescent age group.
Our healthy control group consisted of 17 participants. Sixteen of the healthy controls were
recruited via flyers posted at Shands Hospital in Gainesville, Florida, local day care centers, and
local pediatric clinics, although it is unclear how many people saw the flyers. One healthy
control was identified and recruited because they were the sibling of a participant with spina
bifida. None of the healthy controls were removed from the final sample.
Participants in both groups completed a brief neuropsychological test battery that lasted
approximately 20 minutes and consisted of the Peabody Picture Vocabulary Test- Third Edition
(PPVT-III) (Dunn & Dunn, 1997) and the Wechsler Individual Achievement Test, Second
Edition (WIAT-II) – Word Reading subtest (The Psychological Corporation, 2001). Participants
who met performance requirements on the screener completed the study test battery either during
their regular visit to the Spina Bifida Clinic or at a later date in the UF/Shands Psychology
Clinic, in the UF/Shands Pediatric Neuropsychology Lab, or at the participant’s home. Eileen B.
Fennell, PhD., a licensed clinical psychologist, supervised and was available for further
instruction during testing.

41
The test battery consisted of one visit and lasted approximately 90 minutes for each child.
Participants first completed the TEA-Ch subtests and the D-KEFS Trailmaking test. After
completing these tests, participants completed the MSCS questionnaire, the CDI, and the
RCMAS. Due to changes in the protocol, a small number of children also completed the
Behavior Assessment System for Children, Self-report (BASC-SRP). Parents completed the
Demographic Questionnaire and the Behavior Assessment System for Children – Parent Rating
Scales (BASC: PRS). After completing the test battery, participants received $10.00 for their
participation.

42
CHAPTER 3 RESULTS
Data Analysis
For all statistical tests, the level of significance was set at α = 0.05. All statistical tests
were performed using the SPSS statistical analysis package. Among the final 30 participants,
there were no missing data points for screening measures, neuropsychological tests, parent-report
measures, or the MSCS, CDI, and RCMAS. However, only 14 participants completed the
BASC-SRP due to changes in the protocol. Raw scores were converted to Standard Scores, T-
scores, or Scaled Scores for statistical analyses. All dependent variables were evaluated for
evidence of symmetry in its distribution by using a test of skewness. A cut-off point of 2.0 was
applied to the test of skewness as an indication for normality. Based on these criteria, all
dependent variables were normally distributed. Therefore, no further normalization calculations
were necessary.
Demographics
Demographic variables between groups were compared using ANOVAs and Chi-square
analyses. A comparison of the two groups’ demographic information is presented in Table 3-1.
The mean age of the Spina Bifida group was 13 years, 0 months (range 10 years, 0 months to 16
years, 9 months). The mean age of the Healthy Control group was 12 years, 8 months (range 10
years, 3 months to 15 years, 10 months). The mean grade of the Spina Bifida group was 6th
(range 3rd to 11th). The Healthy Control group was also in 6th grade on average (range 4th to
10th). The Spina Bifida group consisted of 8 males and 5 females. The Healthy Control group
consisted of 8 males and 9 females. Within the Spina Bifida group, 7 of the participants
described themselves as Caucasian, 4 as African-American, 1 as Hispanic, and 1 as Asian-
American. Within the Healthy Control group, 16 of the participants described themselves as

43
Caucasian and 1 described their ethnicity as ‘other.’ Between-groups ANOVAs did not reveal
any significant differences between the groups on age or grade. Chi-square analyses revealed no
significant difference between groups in male: female ratio. However, Chi-square analyses
revealed that the Spina Bifida group had a significantly higher proportion of participants from
minority groups than the Healthy Control group.
In addition to the demographics reported above, medical data specific to the Spina Bifida
group was collected. Within the Spina Bifida group, 12 of the participants were diagnosed with
myelomeningocele and 1 was diagnosed with meningocele. Eight of the participants in the Spina
Bifida group had been diagnosed with hydrocephalus. Eleven of the participants in the Spina
Bifida group were diagnosed with spina bifida at the lumbar level, 1 at the thoracic level, and 1
at the sacral level. In terms of mobility, 6 were wheelchair bound, 5 used an assistive device,
and 2 required no assistance. In terms of incontinence, 2 required assistance, 9 were able to
self-catheterize, and 2 were not incontinent.
Scores on the screening measures including the Peabody Picture Vocabulary Test, Third
Edition (PPVT-III) and the Wechsler Individual Achievement Test, Second Edition (WIAT-II)
were also compared between the two groups (see Table 3-1). The mean score on the PPVT-III of
the Spina Bifida group was significantly lower than the mean score of the Healthy Control group
(t (28) = 15.146, p < .001). Although the two groups differed significantly on this measure, this
variable was not entered into further analyses as a covariate because this test was used primarily
to exclude children who were suspected of comorbid developmental delay or mental retardation
rather than a test of intellectual ability per se. Additionally, previous research suggests that
Verbal IQ is not related to performance on the TEA-Ch (Manly, Anderson, Robertson, Nimmo-
Smith, 1999). The mean score on the WIAT-II Word Reading subtest of the Spina Bifida group

44
was also significantly lower than the mean score of the Healthy Control group (t (28) = 26.227, p
< .001). The WIAT-II Word Reading scores were not used as a covariate in further analyses
because this test was used as a screener to ensure that children could read questionnaire items.
Additionally, children with learning disabilities were not excluded from the Spina Bifida group
since these difficulties may be related to the spina bifida diagnosis. As noted previously, two
participants were excluded from the study because they did not meet the reading requirement
necessary to complete the questionnaire.
Statistical Analyses
A summary of the primary hypotheses and analyses is depicted in Table 3-2.
Hypothesis 1
Comparison of attentional performance without controls for motor demands
In order to test whether children with spina bifida perform more poorly on attentional tests,
an Independent-Samples T-Test, with two levels of the independent variable (Spina Bifida vs.
Healthy Control group) was employed. Initially the five dependent variables were the TEA-Ch
Sky Search time per target score (Selective Attention), TEA-Ch Score! number correct
(Sustained Attention), the TEA-Ch Opposite Worlds timing score (Attentional
Control/Switching), the D-KEFS Number/Letter Switching timing score (Attentional
Control/Switching), and the BASC-PRS Attentional Problems score. Attentional performance
on tests of selective attention without controlling for motor demands were initially counted to
determine whether attentional difficulties existed in these areas as had been reported in previous
studies that did not have controls for visual-motor integration or eye movement, such as the
Trailmaking test A and B, WISC-III Coding, and Stroop tests (Snow, 1999; Loss, 1998; Fletcher
et al., 1996). Similarly, performance on tests of attentional control/switching without motor
controls was initially counted in order to determine whether deficits in attentional

45
control/switching are apparent when motor demands are not considered. Since the sustained
attention score was an auditory task without a visual or motor component, the same variable was
used in both the initial and “motor-control” calculations. Similarly, the same parent-rating
variable was used in both calculations. The Independent Samples T-Test revealed significant
differences on all five variables at the p < .001 level. The means for the Spina Bifida group were
also in the clinically significant range for each variable, whereas they were in the average range
for each variable in the Healthy Control group. Effect sizes were large and were calculated with
Cohen’s d (Cohen, 1988) with the pooled standard deviation used for between-group
comparisons (Rosnow & Rosenthal, 1996). A summary of these findings is depicted in Table
3-3.
Comparison of attentional performance with controls for motor demands
In order to test whether children with spina bifida perform more poorly on attentional tests,
even after motor demands are removed or controlled, an Independent-Samples T-Test, was
employed with the same independent variables (Spina Bifida group vs. Healthy Control group).
However, the five dependent variables were adjusted for motor demands when necessary.
Specifically, the TEA-Ch Sky Search attention score was used rather than the time per target.
The attention score is calculated by subtracting the time per target during the visual search task
from the time per target during a motor control task that has targets with no distracters.
Additionally, potential motor confounds from the TEA-Ch Opposite Worlds task were reduced
by calculating the difference between the scaled score on the Opposite Worlds task and the
scaled score for the Same Worlds task, which requires children to simply read numbers without
the switching component. Finally, the D-KEFS Number/Letter Switching score was replaced
with the Number/Letter Switching vs. Motor score. This score compares the time taken on the
attentional switching task with a task that only requires a child to connect circles along a dotted

46
line. As noted previously, no changes were made in the calculations for the TEA-Ch Score! test
and the BASC-PRS Attention Problems scale, since these did not have visual-motor demands.
The Independent Samples T-Test revealed significant differences on the TEA-Ch Sky Search
attention variable at the p < .05 level, although the Spina Bifida group was no longer in the
clinically significant range. Before calculating the difference scores for the two attentional
switching variables, Independent Samples T-Tests were calculated between the groups for the
TEA-Ch Same Worlds and D-KEFS Motor Speed scores. Significant differences were found
between the groups on both measures at the p < .001 level. No significant differences were
found between the groups on TEA-Ch Opposite Worlds vs. Same Worlds or the D-KEFS
Number/Letter Switching vs. Motor variables. Effect sizes were large for all variables except D-
KEFS Number/Letter Switching vs. Motor, which were medium, and TEA-Ch Opposite Worlds
vs. Same Worlds, which were small. These findings suggest that the Spina Bifida group was
generally slower than the Healthy Control group and did not experience a significant decrement
with the additional demands of attentional switching. Means and effect sizes are depicted in
Table 3-4.
Hypothesis 2
In order to test whether children with spina bifida had different self-concepts than healthy
controls, an Independent-Samples T-Test, with two levels of the independent variable (Spina
Bifida group vs. Healthy Control group) was employed. The dependent variables were the
Social, Competence, Affect, Academic, Family, and Competence domains from the Multi-
Dimensional Self-Concept Scale (MSCS). The Independent Samples T-Test revealed significant
differences on the MSCS Social, Affect, Academic, and Physical domains at the p < .05 level.
No differences were found between groups on the Family or Competence domains. The domain
scores were generally in the low average or lower end of the average range. Additionally, large

47
effect sizes were found on all variables except Family and Competence domains, which were
medium. Means and effect sizes are depicted in Table 3-5.
Hypothesis 3
In order to test whether there were significant relationships between performance on
attentional tests and self-concept, a Pearson correlation was computed with the attentional and
self-concept variables. Results demonstrated that there was a significant negative relationship
between BASC-PRS scores and a number of self-concept variables; specifically Social, Affect,
and Physical domains. There were no other significant relationships between any of the
attentional variables and any of the self-concept variables. Within domains, however, TEA-Ch
Score was significantly positively correlated with the TEA-Ch Sky Search! variable and
significantly negatively correlated with the BASC- PRS Attention Problems score. Similarly,
each of the MSCS domains was significantly correlated with each other. Unfortunately,
correlations could not be conducted with the Spina Bifida group alone due to small sample size.
Correlations are depicted in Table 3-6.
Additional Calculations and Exploratory Analyses
Differences in mood
In addition to the primary analyses, the Spina Bifida and Healthy Control groups were
compared on measures of mood. These measures were not included in the primary analyses
which focused on self-concept rather than mood per se. Clearly, self-concept and mood are
related, but since the MSCS already includes a broad measure of mood, these additional mood
measures were included in the secondary analyses so that the primary comparison of self-concept
and the relationship between self-concept and attention were not too heavily weighted or affected
by differences in mood. In order to test whether children with spina bifida had different levels
of mood problems than healthy controls, an Independent-Samples T-Test, with two levels of the
48
independent variable (Spina Bifida vs. Healthy Control group) was employed. The dependent
variables were the total score from the Child Depression Inventory (CDI), the total score from
the Revised Children’s Manifest Anxiety Scale (RCMAS), and the Anxiety and Depression
scales of the Behavior Assessment System for Children – Parent Rating Scales (BASC-PRS).
The Independent Samples T-Test revealed significant differences on the CDI and BASC-PRS
Anxiety and Depression scales at the p < .05 or greater level. The groups did not differ on the
RCMAS scale with a p-value of .07. Additionally, the effect sizes were large for all variables
except for the RCMAS, which was in the medium range. Finally, only the BASC-PRS
Depression Scale was in the clinically elevated range.
In order to further explore the relationship between self-concept and mood, a Pearson
correlation was computed with the MSCS Total Score and each of the mood variables listed
above. A significant negative correlation (higher self-concept, lower depression or anxiety) was
found between MSCS Total Self-Concept and the CDI, RCMAS, and BASC-PRS: Depression
scale. Means, effect sizes, and correlation with the MSCS are depicted in Table 3-7.
In addition to the mood measures reported above, group differences on the BASC-SRP for
the Depression, Anxiety, Self-esteem, and Social Stress scales were calculated. There were 7
children with spina bifida and 7 healthy controls who completed the BASC-SRP. Independent
Samples T-Tests revealed a significant difference for the Depression scale (t = 2.82, p < .05).
Effect sizes were large for the Depression scale (ES = 1.54) and Self-esteem (ES = .95), medium
for Social Stress (ES = .78), and small for Anxiety (ES = .15).
Differences in Behavior Problems
In order to determine whether the groups differed in other areas of behavior problems, an
Independent-Samples T-Test, with two levels of the independent variable (Spina Bifida vs.
Healthy Control group) was employed. The dependent variables were the BASC-PRS

49
Hyperactivity, Aggression, and Conduct Problems scores. The Independent Samples T-Test did
not reveal significant differences any of these scales at the p < .05 level. Additionally, neither
the spina bifida group nor the healthy control group were clinically elevated on any of these
scales.
Age differences
In order to determine whether there were any changes in self-concept with age, a linear
regression analysis was employed with age-in-years as the dependent variable and the self-
concept domains as the predictor variables. The self-concept domains did not predict a
significant amount of variance in this analysis (F (6, 23) = .85, p = NS, R² = .18). Since the
sample size was small for a regression analysis approach, the age effects were also compared by
dividing the sample into two age groups: ages 10–12 and ages 13–16. In the total group, there
were 18 participants in the 10–12 group and 12 in the 13–16 year-old group. In order to test
whether younger children had different self-concepts than older children, an Independent-
Samples T-Test, with two levels of the independent variable (young vs. older adolescents) was
employed. The dependent variables were the domains from the MSCS. The Independent
Samples T-Test did not reveal any significant differences with any variables. Additionally, the
effect sizes were small for each variable.
In order to determine whether children with spina bifida experienced unique age effects
related to reported self-concept, a second Independent-Samples T-Test with only the 13 children
with spina bifida was computed. Seven participants were in the young child group age 6 were in
the older child group. The Independent Samples T-Test did not reveal any significant
differences with any variables. However, effect sizes were large for all domains except the
Academic domain, which had a medium effect size, and the Physical domain, which had a small
effect size. In each case, the children in the older age group reported higher self-concepts than

50
younger children. Additionally, the younger children reported self-concepts in the low average
range whereas older children reported average ranges except for the Physical domain which was
low average in both groups. Means and effect sizes are depicted in Table 3-8.
Gender differences
In order to examine gender differences in self-concept, an Independent-Samples T-Test,
with two levels of the independent variable (males vs. females) was employed. The dependent
variables were the domains from the MSCS. The Independent Samples T-Test revealed a
significant difference on the Competence domain (t = 2.97, p < .05), with females having
significantly higher ratings than males. The other variables were not significantly different
between groups. Additionally, the effect size was large for the Competence variable (ES = 1.12)
and medium for the other variables, ranging from .58 to .74.
In order to determine whether there were unique gender effects on self-concept in the
Spina Bifida group, a second Independent-Samples T-Test with only children from the Spina
Bifida group was calculated. There were 8 males and 5 females in the analysis. The
Independent Samples T-Test revealed a significant difference on the Competence domain (t =
2.23, p < .05), with females having significantly higher ratings than males. The other variables
were not significantly different between groups. However, large effect sizes were found for the
Competence, Academic, and Physical domains, with higher scores for females than males.
Additionally, males’ self-concepts were in the low average range whereas females were in the
average range. Means and effect sizes are depicted in Table 3-9.
Effect of hydrocephalus
In order to determine differences between the children with and without hydrocephalus in
the Spina Bifida group, two levels of the independent variable (children with spina bifida with
and without hydrocephalus) were employed. The dependent variables were the attentional and

51
self-concept variables used in the primary analyses. There were 8 children with hydrocephalus
and 5 children without hydrocephalus used in these analyses. The Independent Samples T-Test
revealed a significant difference only on the TEA-Ch Opposite Worlds vs. Same Worlds score (t
= 2.32, p < .05), with children without hydrocephalus showing greater decrement between the
Opposite Worlds and Same Worlds variables than children with hydrocephalus. This finding is
likely due to the fact that the group with hydrocephalus completed both the Same Worlds and
Opposite Worlds tasks slowly, although differences between the groups on these variables was
not significant. Additionally the other variables were not significantly different between groups.
Within the self-concept domains, the effect sizes ranged from small (Social domain = .17,
Academic = .24, Physical domain = .29, Competence domain = .36), medium (Affect domain =
.50), to large (Family domain = 1.13). Additionally, the hydrocephalus group generally rated
their self-concept in the low average range whereas the non-hydrocephalus group rated their self-
concept in the average range. Within the attention variables, effect sizes were small for D-KEFS
Number/Letter Switching vs. Motor (ES = .01), Sky Search attention score (ES = .20), and
BASC-PRS Attention score (ES = .43). Effect sizes were large for Score! (ES = .92) and
Opposite Worlds vs. Same Worlds (ES = 1.24). Additionally, both groups were clinically
significant on the BASC-PRS Attention score and the Number/letter switching vs. Motor score.
Only the hydrocephalus group was clinically elevated on the Score! subtest.
Effect of ADHD
In order to address concerns that the group differences in attention and self-concept were
due to a comorbid ADHD-diagnosis in 3 participants in the Spina Bifida group, an Independent-
samples t-test was run with these 3 participants removed. Therefore there were 10 children with
spina bifida and 17 healthy controls. The Independent Samples T-Test revealed that significant
differences remained between the groups on the TEA-Ch Score variable (t = 3.47, p < .01) as

52
well as the Parent-reported BASC-PRS Attention domain (t = 3.07, p < .01). The TEA-Ch Sky
Search Attention score was no longer significant (t = 1.88, p = .07), although this appeared to be
due to reduced statistical power with the smaller sample, since the actual change in scaled scores
without the ADHD participants was nominal (scaled score = 8.4 with ADHD participants, 8.8
without ADHD participants). Within the self-concept domains, the groups remained different in
the Social (t = 2.1, p <.05), Affect (t = 2.1, p <.05), Academic (t = 2.5, p < .05), and Physical (t
= 2.9, p < .05) domains but not in the Competence (t = 1.1, p = NS) or Family (t = 1.4, p = NS)
domains.

53
Table 3-1: Demographic Characteristics of SB and Healthy Control groups
Variable Spina Bifida (N=13)
Healthy Control (N=17)
Test Statistic p-value
Age (months) 156.77 (25.92)
152.24 (18.15) .321 NS
Grade
6.46 (2.18)
6.88
(1.45) .401 NS
Gender (# males) 8 8 .432 NS
Ethnicity (# Caucasian) 7 16 10.172 .038
PPVT-II Standard Score 100.08 (15.59)
117.11 (8.05)
15.151 .001
WIAT-II Standard Score 91.31 (13.97)
113.18 (9.42) 26.231 .001
Note. Values are presented as mean (SD) unless otherwise noted. 1 F-value 2 X2-value

54
Table 3-2: Variables Used in Primary Analyses Hypothesis Statistical Test IV / Predictor Dependent Variables
1 Independent Samples T-Test
Group (Spina Bifida vs. Healthy Control)
Selective: TEA-Ch Sky Search attention score Sustained: TEA-Ch Score! total correct score Control/Switching: TEA-Ch Opposite Worlds vs. Same Worlds, D-KEFS Number- Letter Switching vs. Motor score General Attention: BASC-PRS Attention Problems scale
2 Independent Samples T-Test
Group (Spina Bifida vs. Healthy Control)
MSCS domains: Social, Competence, Affect, Academic, Family, Physical scores
3 Correlation Scores on Selective, Sustained, and Control/Switching
MSCS domains: Social, Competence, Affect, Academic, Family, Physical scores

55
Table 3-3: Mean Group Scores on Attentional Measures with no Motor Control Correction
Domain Variable Spina Bifida (N=13)
Healthy Control (N=17) P –value
Effect Size
Selective Attention Sky Search Time per Target
6.85* (2.88)
9.94 (1.14) .001
1.54
Sustained Attention Score! number correct 7.00* (3.03)
11.18 (2.48) .001
1.59
Attentional Control/Switching
Opposite Worlds timing score
4.69* (3.12)
9.41 (2.53) .001
1.75
D-KEFS Number/Letter Switching
5.62* (4.15)
10.59 (3.24) .001
1.41
General Attention BASC-PRS Attention Problems
67.08* (12.44)
50.94 (9.63) .001
1.53
Note: * indicates rating that is clinically elevated

56
Table 3-4: Mean Group Scores on Attentional Measures with Motor Control Corrections
Domain Variable Spina Bifida (N=13)
Healthy Control (N=17) P –value
Effect Size
Selective Attention Sky Search Attention Score
8.38 (3.71)
10.41 (1.12) .041
.81
Sustained Attention Score! number correct 7.00* (3.03)
11.18 (2.48) .001
1.59
Attentional Control/Switching
Opposite Worlds vs. Same Worlds
-0.15 (1.21)
-0.18 (2.07) NS
.02
D-KEFS Number/Letter Switching vs. Motor
6.62* (3.07)
7.94 (2.61) NS
.49
General Attention BASC-PRS Attention Problems
67.08* (12.44)
50.94 (9.63) .001
1.53
Note: * indicates rating that is clinically elevated

57
Table 3-5: Mean Group Scores on Self-Concept Domains
Domain Spina Bifida (N=13)
Healthy Control (N=17) P –value
Effect Size
Social 89.92* (22.99)
105.71 (12.41) .023
.92
Competence 91.46 (26.39)
101.82 (15.46) NS
.51
Affect 92.62 (22.84)
108.29 (13.23) .025
.90
Academic 91.54 (21.92)
111.24 (10.69) .003
1.24
Family
93.00 (15.08)
102.12 (11.93) NS
.71
Physical 86.92* (18.62)
105.71 (13.69) .004
1.22
Note: * indicates rating that is low average or below

58
Table 3-6: Correlations between Tests of Attention and Self-Concept for the Total Sample (Controls and Spina Bifida)
Note: * indicates significant values at the p <. 05 level. ** indicates significant values at the p <.01 level.
Sky Search
Score Opp. Wlds
N-L switch vs.
motor
BASC Attn
MSCS Social
MSCS Comp
MSCS Affect
MSCS Academic
MSCS Family
MSCS Physical
Sky Search 1
Score .524* 1
Opposite Worlds vs. Same World
.086 -.177 1
D-KEFS Switching vs. motor
-.213 .217 .196 1
BASC Attention -.169 -.481** .008 -.111 1
MSCS Social .003 .321 -.154 .082 -.446*
1
MSCS Competence .040 .260 -.153 .047 -.228 .807** 1
MSCS Affect .146 .327 -.165 -.008 -.429* .786** .816** 1
MSCS Academic
.137 .318 -.159 .081 -.350 .676** .616** .413* 1
MSCS Family .130 .089 -.046 .024 -.335 .502** .409* .527** .399* 1
MSCS Physical .165 .218 .122 -.077 -.460* .649** .645** .757** .548** .427* 1

59
Table 3-7: Group Mean Scores on Mood Symptom Scales
Scale
Respondent
Spina Bifida (N=13)
Healthy Control (N=17) P –value
Effect Size
Correlation with
MSCS
CDI
Child 51.54 (11.59)
41.47 (4.14) .002
1.27
-.71
RCMAS
Child 50.92
(11.99) 43.65 (9.10) NS
.72
-.64
BASC-PRS Depression
Parent 60.00*
(18.40) 44.65 (7.72) .004
1.18
-.53
BASC-PRS Anxiety
Parent 58.38
(13.28) 47.42 (9.75) .014
1.00
-.32
Note: * indicates rating that is clinically elevated

60
Table 3-8: Age Differences on Self-Concept domains within Spina Bifida group
Domain Age 10-12 (N =7)
Age 13-16 (N = 6) P –value
Effect Size
Social 79.14* (21.81)
102.50 (18.58) NS
1.24
Competence 80.86* (22.58)
103.83 (26.81) NS
1.02
Affect 85.00* (21.51)
101.50 (22.83) NS
.81
Academic 84.86* (17.74)
99.33 (25.29) NS
.73
Family
87.57* (14.43)
99.33 (14.36) NS
.88
Physical 85.57* (25.60)
88.50* (6.35) NS
.16
Note: * indicates rating that is low average or below
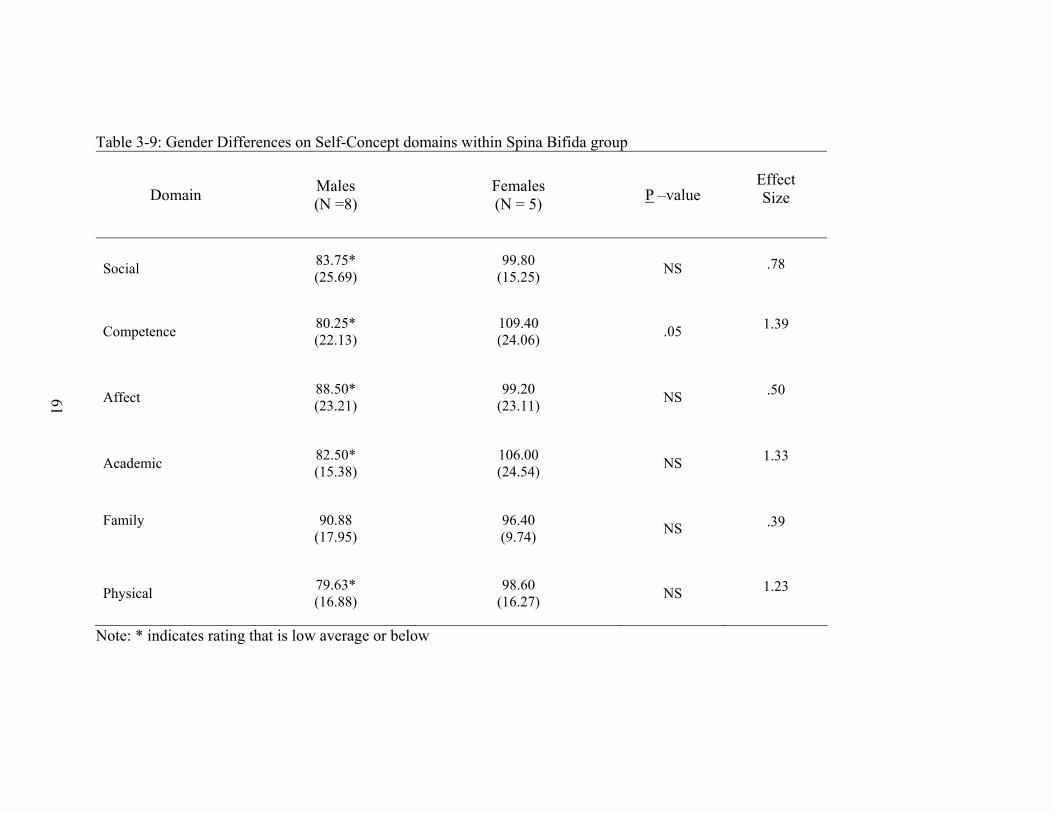
61
Table 3-9: Gender Differences on Self-Concept domains within Spina Bifida group
Domain Males (N =8)
Females (N = 5) P –value
Effect Size
Social 83.75* (25.69)
99.80 (15.25) NS
.78
Competence 80.25* (22.13)
109.40 (24.06) .05
1.39
Affect 88.50* (23.21)
99.20 (23.11) NS
.50
Academic 82.50* (15.38)
106.00 (24.54) NS
1.33
Family
90.88 (17.95)
96.40 (9.74) NS
.39
Physical 79.63* (16.88)
98.60 (16.27) NS
1.23
Note: * indicates rating that is low average or below

62
CHAPTER 4 DISCUSSION
Overview
The current study was designed to examine the attentional performance of adolescents with
spina bifida compared to healthy controls. Whereas previous studies have found attentional
deficits in children with spina bifida (Snow, 1999; Loss, 1998; Brewer et al., 2001; Fletcher et
al., 1996), this study was unique in that it controlled or accounted for potential motor confounds,
examined multiple domains of attention individually, and focused on young adolescents.
Furthermore, the TEA-Ch allowed examination of multiple domains of attention with
comparable psychometric properties, since the subtests of the TEA-Ch are part of the same
battery and were standardized together.
Additionally, differences in self-concept were examined between adolescents with spina
bifida and healthy controls. Previous studies have been inconsistent but suggest that children
with spina bifida have lower self-concept in some areas, specifically physical, social, and
academic self-concept (Appleton, 1994; Appleton, 1997; Dorner, 1976; Buran, 2004; Fletcher
1995). The current study attempted to add to this literature by comparing children in multiple
domains of self-concept, focusing on young adolescents rather than children of all ages, and
using healthy controls as a comparison group to determine whether aspects of self-concept are
unique to people with spina bifida.
Finally, the relationship between attention and self-concept were examined within these
groups. Previous literature suggests links between attention and the ‘self,’ including:
overestimation of self-perceptions in children with ADHD compared to healthy controls (Hoza et
al., 2004, Hoza, Pelham, Dobbs, Owens, & Pillow, 2002), loss of insight related to frontal lobe
lesions and related disorders (Mendez & Shapira, 2002; Laroi et al., 2002; Feinberg & Keenan,

63
2005), frontal lobe activity during self-referential thinking and self-awareness (Kelly et al., 2002;
Shallice, 1982; Shimamura, 1995; & Stuss & Benson, 1986), theories that attention is a
necessary function in the detection and response to feedback (Barkley, 1992), and theories that
attention is needed to organize and integrate numerous pieces of information from one’s
experiences and feedback from others in order to create a cohesive sense of self (Bracken, 1992).
To date, no studies have specifically examined the relationship between attentional tests and self-
concept reports.
Attentional Differences Between Groups
As expected, children with spina bifida performed worse than healthy controls on a test of
visual selective attention. These findings are consistent with prior research demonstrating that
children with spina bifida performed worse on Trailmaking Tests (Snow, 1999; Loss, 1998),
coding on the WISC-III (Loss, 1998), and visual orienting (Brewer et al., 2001). However,
unlike previous research, the present study was able to demonstrate that the differences in
selective attention existed even after the motor component of the test was factored out of the
performance. Given the fact that the condition of spina bifida results in significant
abnormalities to areas that are important for visual attention, including the parietal lobe and
superior colliculus as well as posterior corpus callosum, optic pathways, and cerebellum (Cohen
and O’Donnell, 1993; Mirsky, 1989; Mesulam, 1985; Posner et al., 1988; Luck, Hillyard,
Mangum, and Gazzinaga, 1994; Barkovich, 1992; Fletcher- 2000, Del Bigio 1993; Fletcher
2000), these findings are consistent with underlying anatomical pathology.
Additionally, children with spina bifida performed worse than healthy controls on a test of
auditory sustained attention that had no motor component, further supporting the hypothesis that
the attentional problems in children with spina bifida are not solely due to motor slowing. These
findings are supported by previous literature showing that children with spina bifida perform

64
worse on CPTs (Loss, 1998, Brewer, 2001), although other research has suggested that there are
no differences between children with spina bifida and controls on the CPT (Lollar, 1990). As
noted above, one strength of the current study is that motor confounds, which may explain some
of the inconsistent findings in past research, were reduced or removed in the current study.
Whereas the deficits in selective attention can be attributed to posterior abnormalities, deficits in
sustained attention are generally thought to be related to more frontally mediated systems. There
is some evidence that blood flow to the frontal lobes is reduced in children with spina bifida (Del
Bigio, 1993; Shirane et al., 1992) and that frontal lobes are thinned, although to lesser degree
than posterior regions (Fletcher, 2000; Del Bigio 1993). Additionally, membranes around the
caudate may be disrupted (Del Bigio, 1993). Finally, it is likely that frontal lobe functions are
affected indirectly by disrupted white matter connections cortically and subcortically, which are
necessary for effective communication between frontal lobes and other areas of the brain
(Barkovich, 1992; Del Bigio, 1993; Dennis et al., 1981; Fletcher, 2000).
Interestingly, differences in attentional control/switching were highly significant when
motor confounds were not taken into consideration but were no longer significant when motor
confounds were removed from the calculation of performance. Previous literature has suggested
that children with spina bifida experience deficits in attentional control/switching, including the
time taken to shift from invalid cues (Dennis 2005a) and performance on Trailmaking Part B
(Loss, 1998; Snow 1999). Although each of these tests has a motor component that could have
confounded previous studies, studies by Snow (1999), Loss et al., (1998), and Fletcher (1996)
have also reported that children with spina bifida were worse than healthy controls on the
Wisconsin Card Sorting Test (WCST), which requires attentional switching but does not include
a motor speed component. At this time, it is unclear why the study’s results were not significant

65
in this domain. The most parsimonious explanation is that children with spina bifida are simply
slower, regardless of demands on attentional switching. Whereas attentional switching may be
burdensome to someone who works quickly, the burden may be reduced when someone
completes tasks more slowly. Another possibility is that attentional control/switching is a
complex cognitive function that consists of more than one component. For example, on the
WCST, the demands on attentional switching are not related to speed but rather the ability to
effectively inhibit one response set and switch to a different response set. These demands are
very different from tests such as the Opposite Worlds or the Trailmaking test, where the rules are
clear but there is a high demand on speed and inhibition of other responses. A second possible
explanation is that the WCST involves many different cognitive functions other than attentional
switching, including abstract reasoning, working memory to remember and implement feedback,
and implementation of strategy based on feedback.
Finally, parent rated attention was significantly worse in the Spina Bifida group compared
to healthy controls. These findings demonstrated that the neuropsychological tests given were at
least generally supported by real observed problems in attention in daily life and are supported
by previous research demonstrating parent-reported deficits in inattention, poor executive
functions, less goal-directed behaviors, distractibility, and verbosity (Landry, 1990; Horn, 1985;
Burmeister, 2005; Davidovitch, 1999; Mahone, 2002).
Taken together, these findings demonstrate that children with spina bifida experience
significant attentional deficits in multiple domains, and these deficits appear to negatively impact
their daily life. These difficulties are not completely accounted for by motor difficulties in
selective and sustained attention, although deficits in attentional switching appear to be related
primarily to poor motor speed and motor control. However, whereas this distinction may be

66
important in order to better understand and treat children with spina bifida, it is impossible to
parse out motor demands from most real-world situations that require attentional shifting or
control. Therefore, attentional shifting and control are significant problems for children with
spina bifida and should be addressed accordingly.
Differences in Self-Concept
As predicted, children with spina bifida reported poorer self-concept in social, academic,
and physical domains. This finding is consistent with past research (Buran, 2004; Appleton,
1994; Fletcher 1995). Affect was also significantly lower in children with spina bifida, a finding
that has been supported by some previous studies (Appleton, 1997; Dorner, 1976) but not others
(Holmbeck, 2003; Edwards-Beckett, 1995; Landry, 1993). Additionally, no differences were
found between the groups for ratings of family relationships or a more general competence
domain, although this lack of differences appeared to be due to variations in the Healthy Control
group rather than higher self-concept in the Spina Bifida group. These results suggest that
children with spina bifida define themselves as having worse social relationships, less academic
success, fewer physical abilities or worse appearance, and greater mood problems than healthy
controls. Given the number of physical and cognitive problems that are reported in children with
spina bifida, it is likely that these lower ratings are based at least somewhat on experiences and
feedback from others. For example, children with spina bifida actually do have greater physical
difficulties than their healthy peers. Similarly, given the cognitive deficits experienced in spina
bifida, these children likely have real academic problems.
These results show that children with spina bifida are aware of their deficits and are
negatively affected by them. Initially, it was suggested that children with spina bifida might
actually have better self-concepts than healthy adolescents due to a lack of awareness about
personal difficulties. If children with spina bifida did not process and incorporate feedback from

67
their experiences into their self-concept in the same way that self-concept develops in healthy
children, they could have higher, or inflated self-concepts compared to healthy controls who are
aware of their own strengths and weaknesses. Furthermore, this possibility was supported by
evidence that children with more severe conditions of spina bifida have better ratings of mood
and stress (Padua et al., 2004; Padua et al., 2002; Minchom et al., 1995; Holmbeck et al., 1995).
Additionally, a number of studies show that children with ADHD have greater positive distortion
in their self-concept and performance estimates (Hoza et al., 2004; Hoza et al., 2002; Owens &
Hoza, 2003; Hoza, et al., 2001). However, the current results demonstrate that rather than
creating a protective effect due to poor awareness of their shortcomings, it seems that
adolescents with spina bifida are aware of their difficulties and incorporate them into their sense
of self.
It is also important to note that although adolescents with spina bifida reported lower self-
concepts, their scores were generally in the lower end of the average range. This suggests that
self-concept is negatively impacted but that there is also a degree of resiliency among these
adolescents that prevents even lower self-concepts from developing. This finding is promising
because it suggests that protective factors exist. If these factors were identified, they could be
used in treatments to further improve self-concept.
The current study adds to previous literature because it specifically focused on young
adolescents with spina bifida, whereas many other studies include both adolescents and young
children. Of the past studies that have focused on adolescent populations, many did not have a
Healthy Control group, an important variable since adolescence is a challenging stage of
development and self-concept undergoes natural increases and decreases.

68
Based on the current results, self-concept is clearly an area that requires attention when
treating adolescents with spina bifida. Self-concept likely affects many areas important for
healthy adjustment into adulthood, including mood, motivation, and confidence which in turn are
likely to impact later independence, as well as perseverance and willingness to face challenges in
medical care, academic performance, occupational settings, and relationships. Clearly,
adolescence is an important stage in development of self-concept, likely impacts later adjustment
in adulthood, and should be considered as an important component of any treatment plan for
adolescents with spina bifida. In addition, poorer ratings of self-concept should not always be
dismissed as low confidence or poor self-esteem, but may reflect accurate estimations of ability.
In this way, self-concept ratings may alert providers and families to weaknesses recognized by
the child and thus allow for a more effective treatment plan that focuses on specific concerns.
For example, low ratings in academic performance may result in increased support at school, or
low ratings on social skills may alert parents to involve their child in more socially rewarding
events or social skills training classes. Finally, instead of focusing solely on areas that are worse
in children with spina bifida, it is important to recognize areas that could serve protective roles.
For example, previous research suggests that family relationships and the attitudes of parents
have significant impact on later independence (Antle, 2004; Wolman, 1994; Murch, 1989; Kolin,
1971; Loomis, 1997). Therefore, these areas should not be overlooked and may provide valuable
tools for improving self-concept in other areas.
Relationship Between Attention and Self-Concept
Statistical analyses did not find a significant relationship between performance on
attentional measures and self-concept. The current study predicted that poorer attentional
performance would be related to poorer self-concept, particularly in areas that attentional
demands were high or where attention would be a valuable asset, including academic, social, and

69
competence domains. A competing hypothesis, as discussed above, was that greater deficits in
attention would lead to reduced awareness of personal shortcomings and thereby result in an
inflated self-concept or inverse relationship between attentional deficits and self-concept.
Unfortunately, the small sample size limited the ability to make conclusive statements about
these results, since the lack of a relationship may have been related to low statistical power.
Additionally, the small sample size prevented analysis of the Spina Bifida Group alone, which
may have more directly addressed the hypothesis. However, it is promising that within the
domains, each of the self-concept domains correlated with each other, as did some of the
attentional measures, suggesting that the statistical power was sufficient for at least some
predictable relationships. It is also important to note that parent ratings of Attentional Problems
on the BASC-PRS were negatively correlated with the social, physical, and affect domains of
self-concept. These findings suggest that a potential relationship exists between attention and
self-concept that is not measured with the neuropsychological tests used in the current study, and
lends promise to the theory that attention and self-concept are related such that attentional
difficulties negatively impact self-concept.
An additional explanation for the lack of relationship between attentional performance and
self-concept is that the type of attention studied is not necessarily related to the type of attention
required for development of self-concept. Instead of sustaining, selecting, and switching
attention, it may be that there is a stronger relationship between self-concept and other cognitive
functions related to attention, such as awareness. Awareness is required in order to respond to
and incorporate feedback, but this was not addressed during the current study. Past research
suggests that awareness of self is related to both frontal and parietal lobe functions (Gusnard,
2005; Schmidt et al., 2002; Krause et al., 1999; Johnson et al., 2002; Kjaer, Nowak, & Lou,

70
2001) and may be reduced in children with ADHD, as evidenced by inaccurate estimates of
performance as well as discrepancies between estimates of self-concept by children with ADHD
and ratings of by teachers or parents (Hoza et al., 2004; Hoza et al., 2002; Owens & Hoza, 2003;
Hoza, et al., 2001). Future studies may address awareness of performance more accurately by
having children with spina bifida rate and predict their performance on various tests.
Additionally, it is possible that other cognitive functions such as memory, use of language, and
processing speed impact development of self-concept. At any rate, it is important to recognize
that there are many cognitive functions, both within the domain of attention and in other domains
that are likely to impact the development of self-concept.
Additional Results
In addition to the primary hypotheses, the effect of hydrocephalus was examined within
the Spina Bifida group and found that the children without hydrocephalus had a greater
decrement between the TEA-Ch Opposite Worlds vs. Same Worlds calculation than those with
hydrocephalus. This finding is likely due to the fact that the group with hydrocephalus
completed both tasks slowly. Within the self-concept variables, there were no significant
differences although there was a large effect size difference on the Family domain, with the
hydrocephalus group rating lower family self-concept. Additionally, no other variables were
significant between the hydrocephalus conditions for other self-concept or attentional variables
and sample size was small, suggesting that any findings should be interpreted with caution.
Furthermore, given the fact that previous studies suggest that the presence of hydrocephalus is a
significant factor to cognitive performance in multiple areas including attention (Iddon, Morgan,
Loveday, Sahakian, & Pickard, 2004; Verhoef, Post, van Asbeck, Gooskens, & Prevo, 2004), it
is likely that the lack of significant differences is related to the small sample size.

71
In addition to the effects of hydrocephalus, mood differences were compared between the
Spina Bifida and Healthy Control groups as well as age and gender effects of self-concept. As
expected, the Spina Bifida group reported more symptoms of depression and parents of children
with spina bifida reported higher levels of depression and anxiety. Additionally, there were
significant correlations between self-concept and mood, suggesting that symptoms of anxiety and
depression decreased with increases in self-concept. However, it is important to note that these
scores were not clinically elevated, suggesting that differences existed but were not so severe as
to meet diagnostic criteria for depression or anxiety. Although it is not surprising that mood and
self-concept are related, it is important to recognize the relationship between these two areas
when developing treatment plans, since addressing either self-concept or mood may help
improve the other.
Although the small sample size limited the power of statistical analyses, the current study
found large or medium effect sizes on each of the self-concept domains except Physical self-
concept. As children with spina bifida aged from 10–12 years-old to 13–16, their self-concept
improved from low levels to average levels. This finding is promising and further research
should be conducted to determine whether the finding is replicated in a larger sample and to
explore what variables contribute to these improvements.
Finally, the current results found that females in both healthy control and Spina Bifida
groups had higher self-concept, specifically in the Competence domain, but also in other
domains including Academic and Physical self-concept. These findings were somewhat
surprising, given previous research that suggests that older girls have lower self-concept and
higher self-reported psychological problems (Appleton et al., 1997; Appleton et al., 1994;
Zurmhole et al., 1998). A study by Antle et al., (2004) did not find gender differences in self-
72
concept. As noted above, the small sample size limits the generalizability of the current findings
and prevented any age by gender comparisons. However, if replicated with a larger sample,
these findings may suggest that females do not always have lower self-concepts and may have
strengths in certain areas. Additionally, a replication with a larger sample suggests that gender is
an important factor in the development of self-concept in adolescents with spina bifida.
Limitations
Although the study had numerous strengths, a number of limitations should be addressed.
First, although there was sufficient power to find group differences on attentional performance
and self-concept, the sample size was relatively small and limited the ability to make conclusive
assessments of other questions, including the relationship between attention and self-concept and
the effects of age and gender. For example, one objective of the current study was to determine
whether there was a relationship between attention and self-concept in children with spina bifida.
Since the sample size was limited, the current study compared the relationship between attention
and self-concept within the entire sample. Thus, a lack of significant differences may be due to
the performance of healthy controls rather than children with spina bifida. Additionally, other
important relationships, such as the relationship between age and gender, could not be studied
with the current sample size. Similarly, it would be helpful to look at age effects more linearly
rather than separating groups based on an arbitrary cutoff, but the sample size did not provide
enough power to make these calculations.
Second, children with spina bifida are very diverse in their presentation, severity, and
complications. The current study did not separate children with spina bifida based on type of
spina bifida (myelomeningocele vs. meningocele), lesion level, infection rates, shunt revisions,
mobility, or other medical complications. In order to effectively address the hypothesis that
greater disease severity would lead to worse attentional performance and lower self-concept, it is

73
necessary to compare children within the Spina Bifida Group with different levels of severity.
However, the current sample size was too small for this calculation. One possible confound, the
comorbid ADHD diagnosis, was addressed by demonstrating that the spina bifida group
performed significantly lower than healthy controls on sustained attention and parent-reported
attention even after children with ADHD were removed from the Spina Bifida Group. Although
selective attention differences were no longer significant after removing children with ADHD
from the Spina Bifida Group, this was likely due to statistical limitations (i.e. sample size) since
the selective attention score in the Spina Bifida Group did not substantially change.
Unfortunately, other findings such as the effects of hydrocephalus were limited due to the small
sample sizes of the groups. Therefore, when applying these results to individual cases any
conclusions that are taken from this study must be considered within the context of the multiple
other variables that could impact cognition and self-concept.
Third, the current study did not thoroughly evaluate the presence of other comorbid
disorders that could potentially confound the results. Some concerns were addressed by
demonstrating that the groups did not differ on parent-reported behaviors, including
hyperactivity, conduct problems, or aggression. However, future research should more
thoroughly assess other cognitive and behavioral problems that could confound the results.
Finally, although the groups did not differ in age, grade, or gender ratio, the group
differences on the PPVT-II and the WIAT-II reading score are a significant limitation of the
current study. Although previous research suggests that verbal IQ is not related to attentional
tests, specifically the TEA-Ch, (Manly, Anderson, Robertson, Nimmo-Smith, 1999), it is ideal to
have two groups that are equal on all measures except for the test variables in order to reduce
confounding results. Similarly, the fact that the Spina Bifida group had a greater percentage of

74
children from different ethnicities could potentially confound the results and should be corrected
in future studies.

75
CHAPTER 5 FUTURE WORK
In order to further understand the nature of attentional deficits and self-concept
development in adolescents with spina bifida, future studies should focus on the relationship
between attention and other cognitive functions and self-concept development. Although the
current results did not find a relationship between performance on attentional measures and self-
concept, a number of relationships between parent-rated attention and self-concept suggest that
poorer attention leads to lower self-concept and is a promising result for future research. Other
than attentional performance per se, a number of approaches could examine the effects of
reduced awareness and self-concept. For example, future research should examine the
relationship between awareness, or metacognition, and self-concept, by studying the relationship
between estimates of performance on specific tasks and self-concept ratings by children with
spina bifida. Additionally, studies should compare self-reported self-concept, behavior, and
performance ratings between adolescents, parents, teachers, and peers to determine whether there
is greater discrepancy or variability in the self-reports of adolescents with spina bifida compared
to healthy controls. A large amount of discrepancy between self-reported abilities and ratings by
others would suggest that adolescents with spina bifida have a less accurate appraisal of
themselves. It is important to understand whether adolescents with spina bifida have inaccurate
appraisals of themselves in order to develop an effective treatment plan. Treatment goals may
include attempts to improve awareness of difficulties so that children with spina bifida seek
assistance when needed. For example, children could seek assistance in academics, self-care,
and other areas if they were able to recognize difficulties in these areas. It is important to also be
aware that some inaccurate estimations may not be helpful to address in treatment. For example,
overestimates in physical attributes may be protective and not helpful to address.

76
Future studies should also continue to explore factors that predict successful transition into
later adolescence and adulthood. It is interesting that even though the Spina Bifida group had
statistically lower self-concept and mood, their scores were generally in the lower end of the
average range and not clinically significant. This finding suggests a certain level of resiliency in
adolescents with spina bifida that should be examined in order to develop methods to further
improve self-concept. Longitudinal studies that follow children through adolescence and later
adulthood may be able to determine which factors predict successful or unsuccessful outcomes,
including protective and risk factors that could be addressed by parents and health care
professionals.
Additionally, more research is needed to determine the impact of self-concept on other
variables, such as mood, behavior problems, social relationships, and academic or occupational
success. Although it is logical that self-concept impacts these areas, little research has directly
studied the relationship between self-concept and other domains of functioning. Therefore, more
conclusive evidence is needed.
It is also important to note that children in the spina bifida group demonstrated a large
amount of variability in their reported self-concept. This is not surprising given the varied
presentation of this disease and suggests that future research should attempt to determine which
factors lead to higher or lower self-concept. Furthermore, it may be the case that children with
lower self-concept fit a different attentional profile than those with higher self-concept. In other
words, it is unclear whether the relationship between attention and self-concept is the same for
children with higher self-concept as it is for those with lower self-concept. The current study
was unable to explore these questions but future research should explore the possibility that
different cognitive and emotional/self-concept profiles exist within the spina bifida population.

77
Future research should expand the current research to other disorders that are known to
have impairments in cognition or low self-concept, such as children with ADHD, chronic
disorders, and mood disorders. If important relationships exist between attention and self-
concept, it is possible that these relationships apply more generally to other disorders.
Finally, future research should focus on developing effective treatment strategies to
improve self-concept. If attention is related to self-concept, one approach may include
improving attention with medication or behavior management techniques. Additionally,
treatment approaches may include positive social experiences, additional academic supports, and
medical management training to increase independence and confidence in these children. A
handful of studies have reported positive improvements in self-concept after interventions that
included lessons in social skills for children with assorted externalizing and internalizing
problems, (Haney & Durlak, 1998), and social empowerment treatment for preadolescent
children with ADHD (Frame, Kelly, & Bayley, 2003), and a group therapy program that focused
on communication and cooperation among healthy adolescents (Gaigordobil, 2004). These are
promising developments and future research should continue to focus on effective treatments that
help children with spina bifida successfully transition into adulthood.

78
LIST OF REFERENCES
Achenbach, T.M. & Edelbrock, C.S. (1983). Manual for the Child Behavior Checklist and Revised Child Behavior Profile. Burlington, VT. Department of Psychiatry, University of Vermont.
Antle, B.J. (2004). Factors associated with self-worth in young people with physical
disabilities. Health & Social Work, 29, 3, 167-175. Appleton, P.L., Minchom, P.E., Ellis, N.C., Elliot, C.E., Boll, V., & Jones, P. (1994). The self-
concept of young people with spina bifida: a population-based study. Developmental Medicine and Child Neurology, 36, 198-215.
Appleton, P.L., Ellis, N.C., Minchom, P.E., Lawson, V., Boll, V., & Jones, P. (1997). Depressive symptoms and self-concept in young people with spina bifida. Journal of Pediatric Psychology, 22, 5, 707-722.
Barber, S., Grubbs, L., & Cottrell, B. (2005). Self-perception in children with attention deficit/hyperactivity disorder. Journal of Pediatric Nursing, 20, 4, 235-245.
Barkley, R.A. (1997). Behavioral inhibition, sustained attention, and executive functions:
constructing a unifying theory of ADHD. Psychological Bulletin, 121, 65-94. Barkovich, A.J. & Edwards, M.S. (1992). Applications of neuroimaging in hydrocephalus.
Pediatric Neurosurgery, 18, 2, 65-83. Barnes, M., Dennis, M., & Hetherington, R. (2004). Reading and writing skills in young adults
with spina bifida and hydrocephalus. Journal of the International Neuropsychological Society, 10, 655-663.
Barnes, M.A. & Dennis, M. (1998). Discourse after early-onset hydrocephalus: core deficits in
children of average intelligence. Brain and Language, 61, 309-334. Baron, I.S., Fennell, E.B., & Voeller, K.K.S. (1995). Hydrocephalus and myelomenigocele. In:
Pediatric Neuropsychology in the Medical Setting. Baron, I.S., Fennell, E.B., & Voeller, K.K.S. (Eds.): Oxford University Press, New York. 221-240.
Blum, R.W., Resnick, M.D., Nelson, R., & St. Germaine, A. (1991). Family and peer issues
among adolescents with spina bifida and cerebral palsy. Pediatrics, 88, 280-285. Bracken, B.A. (1992). Examiner's manual for the Multidimensional Self-Concept Scale. Austin,
TX: Pro-Ed. Brewer, V., Fletcher, J.M., & Hiscock, M. (2001) Attentional skills in children with
hydrocephalus versus children with attention deficit/hyperactivity disorder. Neuropsychology, 15, 2, 185-98.
79
Buran C.F., Sawin K.J., Brei T.J., & Fastenau P.S. (2004). Adolescents with myelomeningocele: activities, beliefs, expectations, and perceptions. Developmental Medicine & Child Neurology, 46, 4, 244-52.
Burmeister, R., Hannay, H.J., Copeland, K., Fletcher, J.M., Boudousquie, A., & Dennis, M.
(2005). Attention problems and executive functions in children with spina bifida and hydrocephalus. Child Neuropsychology, 11, 265-283.
Bussing, R., Zima, B.T., & Perwien, A.R. (2000). Self-esteem in special education children
with ADHD: relationship to disorder characteristics and medication use. Journal of the American Academy of Child and Adolescent Psychiatry, 39, 10, 1260-1270.
Cauce, A.M. (1987). School and peer competence in early adolescence: a test of domain-specific
self-perceived competence. Developmental Psychology, 23, 2, 287-291.
Cohen, R.A., Malloy, P.F., & Jenkins, M.A. (1998). Disorders of attention. In: Clinical Neuropsychology: A Pocket Handbook for Assessment. Snyder, P.J., Nussbaum, P.D (Eds.). Washington, DC, US: American Psychological Association, 1998. 541-572.
Cohen, R.A. (1993). Toward an integrated neuropsychological framework of attention. The Neuropsychology of Attention. New York: Plenum Press, 459-481.
Cohen, J. (1977). Statistical power analysis for the behavioral sciences, revised edition.
Orlando: Academic Press, Inc. Cole, D.A., Maxwell, S.E., Martin, J.M., Peeke, L.G., Seroczynski, A.D., Tram, J.M., Hoffman,
K.B., Ruiz, M.D., & Jacquez, F., Maschman. (2001). The development of multiple domains of child and adolescent self-concept: a cohort sequential longitudinal design. Child Development, 72, 6, 1723-1746.
Coopersmith, S. (1984). SEI: Self-esteem inventories. Palo Alto, California: Consulting
Psychologists Press. Crain, M.R. & Bracken, B.A. (1994). Age, race and gender differences in child and adolescent
self-concept: evidence from a behavioral acquisition, context-dependent model. School Psychology Review, 23, 3, 496-512.
Cull, C. & Wyke, M.A. (1984). Memory function of children with spina bifida and shunted
hydrocephalus. Developmental Medicine & Child Neurology, 26, 177-183. Davidovitch, M., Manning-Courtney, P., Hartmann, L.A., Watson, J., Lutkenhoff, M., &
Oppenheimer, S. The prevalence of attentional problems and the effect of methylphenidate in children with myelomeningocele. Pediatric Rehabilitation, 3, 1, 29-35.
Del Bigio, M.R. (1993). Neuropathological changes caused by hydrocephalus. Acta
Neuropatologica, 85, 573-585.

80
Del Bigio, M.R., Wilson, M.J., & Enno, T. (2002). Chronic hydrocephalus in rats and humans: white matter loss and behavior changes. Annals of Neurology, 53, 337-346.
Delis, D.C., Kaplan, E., & Kramer, J.H. (2001). Delis Kaplan Executive Function System (D-
KEFS). The Psychological Corporation: San Antonio, TX. Dennis M., Fitz, C.R., Netley, C.T., Sugar, J., Harwood-Nash, D.C., Hendrick, E.B., Hoffman,
H.J., & Humphreys, R.P. (1981). The intelligence of hydrocephalic children. Archives of Neurology, 38, 10, 607-615.
Dennis, M., & Barnes, M. (2002). Math and numeracy in young adults with spina bifida and
hydrocephalus. Developmental Neuropsychology, 21, 2, 141-155. Dennis, M.D., Fletcher, J.M., Rogers, T., Hetherington, R., & Francis, D.J. (2001). Object-based
and action-based visual perception in children with spina bifida and hydrocephalus. Journal of the International Neuropsychological Society, 8, 95-106.
Dennis, M.D., Edelstein, K., Copeland, K., Frederick, J., Francis, D.J., Hetherington, R., Blaser,
S.E., Kramer, L.A., Drake, J.M., Brandt, M.E., & Fletcher, J.M. (2005a). Covert orienting to exogenous and endogenous cues in children with spina bifida. Neuropsychologia, 43, 976-987.
Dennis, M., Edelstein, K., Frederick, J., Copeland, K., Francis, D., Blaser, S.E., Kramer, L.A.,
Drake, J.M., Brandt, M., Hetherington, R., & Fletcher, J.M. (2005b). Peripersonal spatial attention in children with spina bifida: associations between horizontal and vertical line bisection and congenital malformations of the corpus callosum, midbrain, and posterior cortex. Neuropsychologia, 43, 14, 2000-2010.
Dennis, M., Jacennik, B., & Barnes, M.A. (1994). The content of narrative discourse in children
and adolescents after early-onset hydrocephalus and in normally developing age peers. Brain and Language, 46, 129-165.
Dorner, S. (1976). Adolescents with spina bifida. How they see their situation. Archives of
Disabled Child, 51, 6, 439-444. Donders, J., Rourke, B.P., & Canady, A.I. (1992). Emotional adjustment of children with
hydrocephalus and of their parents. Journal of Child Neurology, 7, 375-380. Dumas, D. & Pelletier, L. (1999). A study of self-perception in hyperactive children. The
American Journal of Maternal/Child Nursing, 24, 1, 12-19. Dunn, L.M. & Dunn, L.M. (1997). Peabody Picture Vocabulary Test - Third Edition.
Bloomington, MN: Pearson Assessments. Edwards-Beckett, J. (1995). Parental expectations and child’s self-concept in spina bifida.
Children’s Health Care, 24, 4, 257-267.

81
Elias, R.E. & Hobbs, N. (1998). Spina bifida: sorting out the complexities of care.
Contemporary Pediatrics, 15, 4, 156-171. Feinberg, T.E. & Keenan, J.P. (2005). Where in the brain is the self? Consciousness and
Cognition, 14, 661-678. Fletcher, JM., Dennis, M., & Northrup, H. (2000). Hydrocephalus. In, Pediatric
Neuropsychology: Research, Theory, and Practice. Yeates K.O., Ris, M.D., & Taylor, H.G. (Eds.): The Guilford Press, New York. 25-46.
Fletcher, J.M., Bohan, T.P., Brandt, M.E., Brookshire, B.L., Beaver, S.R., Francis, D.J.,
Davidson, K.C., Thompson, N.M., & Miner, M.E. (1992). Cerebral white matter and cognition in hydrocephalic children. Archives of Neurology, 49, 8, 818-824.
Fletcher, J.M., Brookshire, B.L., Landry, S.H., Bohan, T.P., Davidson, K.C., Francis, D.J.,
Thompson, N.M., & Miner, M.E. (1995). Behavioral adjustment of children with hydrocephalus: relationships with etiology, neurological, and family status. Journal of Pediatric Psychology, 20, 1, 109-125.
Fletcher, J.M., Bohan, T.P., Brandt, M.E., Kramer, L.A., Brookshire, B.L., Thorstad, K., Davidson, K.C., Francis, D.J., Mccauley, S.R., & Baumgarner, J.E. (1996). Morphometric evaluation of the hydrocephalic brain: relationships with cognitive development. Child’s Nervous System, 12, 192-199.
Fletcher, J.M., Brookshire, B.L., Landry, S.H., Bohan, T.P., Davidson, K.C., Francis, D.J.,
Levin, H.S., Brandt M.E., Kramer, L.A., & Morris, R. (1996). Attentional skills and executive functions in children with early hydrocephalus. Developmental Neuropsychology, 12, 1, 53-76
Frame, K., Kelly, L., & Bayley, E. (2003). Increasing perceptions of self-worth in
preadolescents diagnosed with ADHD. Journal of Nursing Scholarship, 35, 3, 225-229. Friedrich, W.N., Lovejoy, M.C., Shaffer, J., & Shurtleff, D.B. (1991). Cognitive abilities and
achievement status of children with myelomeningocele: a contemporary sample. Journal of Pediatric Psychology, 16, 4, 423-428.
Gaigordobil, M. (2004). Effects of a psychological intervention on factors of emotional
development during adolescence. European Journal of Psychological Assessment, 20, 1, 66-80.
Goldman-Rakic, P.S. (1988). Topography of cognition: parallel distributed networks in primate
association cortex. Annual Review of Neuroscience, 11, 137-156.

82
Guay, F., Marsh, H.W., & Boivin, M. (2003). Academic self-concept and academic achievement: developmental perspectives on their causal ordering. Journal of Educational Psychology, 95, 1, 124-136.
Gusnard, D.A. (2005). Being a self: considerations from functional imaging. Consciousness
and Cognition, 14, 679-697. Gusnard, D.A., & Raichle, M.E. (2001). Searching for a baseline: functional imaging and the
resting human brain. National Review of Neuroscience, 2, 685-694. Haney, P. & Durlak, J.A. (1998). Changing self-esteem in children and adolescents: a meta-
analytic review. Journal of Clinical Child Psychology, 27, 4, 423-433. Hassler, R. (1978). Striatal control of locomotion, intentional actions and of integrating and
perceptive activity. Journal of the Neurological Sciences, 36, 2, 187-224. Hetherington, R. & Dennis, M. (1999). Motor function profile in children with early onset
hydrocephalus. Developmental Neuropsychology, 15, 1, 25-51 Holler, K.A., Fennell, E.B., Crosson, B., Boggs, S.R., & Mickle, J.P. (1995).
Neuropsychological and adaptive functioning in younger versus older children shunted for early hydrocephalus. Child Neuropsychology, 1, 1, 63-73.
Holmbeck, G.N., Westhoven, V.C., Phillips, W.S., Bowers, R., Gruse, C., Nikolopoulos, T.,
Totura, C.M.W., & Davison, K. (2003). A multi-method, multi-informant, and multidimensional perspective on psychosocial adjustment in preadolescents with spina bifida. Journal of Consulting and Clinical Psychology, 71, 4, 782-796.
Holmbeck, G.N. & Faier-Routman, J. (1995). Spinal lesion level, shunt status, family
relationships, and psychosocial adjustment in children and adolescents with spina bifida myelomeningocele. Journal of Pediatric Psychology, 20, 6, 817-832.
Hommeyer, J.S., Holmbeck, G.N., Wills, K.E., & Coers, S. (1999). Condition severity and
psychosocial functioning in pre-adolescents with spina bifida: disentangling proximal functional status and distal adjustment outcomes. Journal of Pediatric Psychology, 24, 6, 499-509.
Horn, D.G., Lorch, E.P., & Culatta, B. (1985). Distractibility and vocabulary deficits in children
with spina bifida and hydrocephalus. Developmental Medicine & Child Neurology, 27, 713-720.
Hoza, B., Gerdes, A.C., Hinshaw, S.P., Arnold, L.E., Pelham, W.E., Molina, B.S.G., Abikoff,
H.B., Epstein, J.N., Greenhill, L.L., Hechtman, L., Odbert, C., Swanson, J.M., & Wigal, T. (2004). Self-perceptions of competence in children with ADHD and comparison children. Journal of Consulting and Clinical Psychology, 72, 3, 382-391.

83
Hoza, B., Pelham, W.E., Dobbs, J., Owens, J.S., & Pillow, D.R. (2002). Do boys with attention-deficit/hyperactivity disorder have positive illusory self-concepts? Journal of Abnormal Psychology, 111, 2, 268-278.
Hoza, B., Pelham, W.E., Waschbusch, D.A., Kipp, H., & Owens, J.S. (2001). Academic task
persistence of normally achieving ADHD and control boys: performance, self-evaluations, and attributions. Journal of Abnormal Psychology, 69, 2, 271-283.
Hoza, B., Pelham, W.E., Milich, R., Pillow, D., & Mcbride, K. (1993). The self-perceptions and
attributions of attention deficit hyperactivity disordered and nonreferred boys. Journal of Abnormal Child Psychology, 21, 3, 271-286.
Huber-Okrainec, J., Dennis, M., Brettschneider, J., & Spiegler, B.J. (2002). Neuromotor speech
deficits in children and adults with spina bifida and hydrocephalus. Brain and Language, 80, 592-602.
Iddon, J.L., Morgan, D.J.R., Loveday, C., Sahakian, B.J., & Pickard, J.D. (2004).
Neuropsychological profile of young adults with spina bifida with or without hydrocephalus. Journal of Neurology Neurosurgery and Psychiatry, 75, 1112-1118.
Jacobs, R., Northam, E., & Anderson, V. (2001). Cognitive outcome with myelomeningocele
and perinatal hydrocephalus: a longitudinal perspective. Journal of Developmental & Physical Disabilities, 13, 4, 389-405.
Johnson, S.C., Baxter, L.C., Wilder, L.S., Pipe, J.G., Heiserman, J.E., & Prigatano, G.P. (2002).
Neural correlates of self-reflection. Brain, 125, 1808-1814. Kelley, W.M., Macrae, C.N., Wyland, C.L., Caglar, S., Inati, S., & Heatherton, T.F. (2002).
Finding the self? An event-related fMRI study. Journal of Cognitive Neuroscience, 14, 5, 785-794.
Kjaer, T.W., Nowak, M., & Lou, H.C. (2002). Reflective self-awareness and conscious states:
PET evidence for a common midline parietofrontal core. Neuroimage, 17, 1080-1086. Kjaer, T.W., & Lou, H.C. (2000). Interaction between precuneus and dorsolateral prefrontal
cortex may play a unitary role in consciousness. A principal component analysis of Rcbf. Consciousness and Cognition, 9, 859.
Kolin, I.S., Scherzer, A.L, New, B., & Garfield, M. (1971). Studies of the school-age child with
meningomyelocele: social and emotional adaptation. Journal of Pediatrics, 78, 6, 1013-1019. Kovacs, M. (1992). Children’s DepressionInventory (CDI). Maria Kovacs and Multi-Health
Systems Inc.: North Tonawanda, NY

84
Krause, B.J., Horwitz, B., Taylor, J.G., Schmidt, D., Mottaghy, F.M., Herzog, H., Halsband, U., and Muller-Gartner, H.W. (1999). Network analysis in episodic encoding and retrieval of word-pair associates: A PET study. European Journal of Neuroscience, 11, 3293–3301.
Laberge, D. (1995). Computational and anatomical models of selective attention in object
identification. In: The Cognitive Neurosciences. Gazzaniga, M.S. (Ed.). The MIT Press: Cambridge, MA, US. 649-663.
Lachar, D., Gadowski, C.L., & Snyder, D.K. (1982). Broad-band dimensions of
psychopathology: Factor scales for the Personality Inventory for Children. Journal of Consulting and Clinical Psychology, 50, 634-642.
Landau, S., & Moore, L.A. (1991). Social skill deficits in children with attention-deficit hyperactivity
disorder. School Psychology Review, 20, 2, 235-251. Landau, S., Milich, R., Diener, M. (1998). Peer relations of children with attention-deficit hyperactivity
disorder. Reading & Writing Quarterly: Overcoming Learning Difficulties, 14, 1, 83-105. Landry, S.H., Copeland, D., Lee, A.L., & Robinson, S. (1990). Goal-directed behavior in
children with spina bifida. Developmental and Behavioral Pediatrics, 11, 6, 306-311. Landry, S.H., Robinson, S.S., Copeland, D., & Garner, P.W. (1993). Goal-directed behavior and
perception of self-competence in children with spina bifida. Journal of Pediatric Psychology, 18, 3, 389-396.
Laroi, F., Fannemel, M., Ronneberg, U., Flekkoy, K., Opjordsmoen, S., Dullerud, R., &
Haakonsen, M. (2000). Unawareness of illness in chronic schizophrenia and its relationship to structural brain measures and neuropsychological tests. Psychiatry Research, 100, 49-58.
Lavigne, J.V., Nolan, D., & Mclone, D.G. (1988). Temperament, coping, and psychological
adjustment in young children with myelomeningocele. Journal of Pediatric Psychology, 13, 3, 363-378.
Loss, N., Yeates, K.O., & Enrile, B.G. (1998). Attention in children with myelomeningocele.
Child Neuropsychology, 4, 1, 7-20. Lollar, D.L. (1993). Educational issues among children with spina bifida. Spina Bifida
Spotlight: Spina Bifida Association of America, 1-4. Loomis, J.W., Javornisky, J.G., Monahan, J.J., Burke, G., & Lindsay, A. (1997). Relations
between family environment and adjustment outcomes in young adults with spina bifida. Developmental Medicine and Child Neurology, 39, 9, 620-627.
Luck, S.J., Hillyard, S.A., Mangun, G.R., & Gasszniga, M.S. (1994). Independent attentional
scanning in the separated hemispheres of split-brain patients. Journal of Cognitive Neuroscience, 6, 1, 84-91.

85
Luria, A.R. (1966). Human brain and psychological processes. New York: Harper and Row. Macbriar, B.R. (1983). Self-concept of preadolescent and adolescent children with a
meningomyelocele. Issues in Comprehensive Pediatric Nursing, 6, 1, 1-11. Mahone, E.M., Zabei, T.A., Levey, E., Verda, M., & Kinsman, S. (2002). Parent and self-report
ratings of executive function in adolescents with myelomeningocele and hydrocephalus. Child Neuropsychology, 8, 4, 258-270.
Mammarella, N., Cornoldi, C., & Donadello, E. (2003). Visual but not spatial working memory
deficit in children with spina bifida. Brain and Cognition, 53, 311-314. Manly, T., Robertson, I.H., Anderson, V. & Nimmo-Smith, I. (1999). TEA-Ch: The Test of
Everyday Attention for Children manual. Bury St. Edmunds, England, Thames Valley Test Company Limited.
Marsh, H.W. (1989). Age and sex effects in multiple dimensions of self-concept:
preadolescence to early adolescence. Journal of Educational Pscyhology, 81, 3, 417-430. Matthys, W., Cuperus, J.M., & Van Engeland, H. (1999). Deficient social problem-solving in
boys with ODD/CD, with ADHD, and with both disorders. Journal of the American Academy of Child and Adolescent Psychiatry, 38, 3, 311-321.
McAndrew, I. (1979). Adolescents and young people with spina bifida. Developmental Medicine
and Child Neurology, 21, 5, 619-629. Mendez, M.F., & Shapira, J.S. (2005). Loss of insight and functional neuroimaging in
frontotemporal dementia. The Journal of Neuropsychiatry and Clinical Neurosciences, 17, 413-416.
Mesulam, M. (1985). Principles of behavioral neurology. Philadelphia: F.A. Davis. Milich, R., Licht, B.G., Murphy, D.A., & Pelham, W.E. (1989). Attention-deficit hyperactivity
disordered boys' evaluations of and attributions for task performance on medication versus placebo. Journal of Abnormal Psychology, 98, 3, 280-284.
Minchom, P.E., Ellis, N.C., Appleton, P.L., Lawson, V., Boll, V., Jones, P., & Elliot, C.E.
(1995). Impact of functional severity on self concept in young people with spina bifida. Archives of Disease in Childhood, 73, 48-52.
Mirsky, A.F., Anthony, B.J., Duncan, C.C., Ahearn, M.B., & Kellam, S.G. (1991). Analysis of
the elements of attention: a neuropsychological approach. Neuropsychology Review, 2, 2, 109-145.

86
Mirsky, A.F. (1989). The neuropsychology of attention. elements of a complex cehavior. In: Integrating theory and practice in clinical neuropsychology. Perecman E, (Ed.). Hillsdale, NJ: Erlbaum. 75–91.
Monsen, R.B. (1992). Autonomy, coping, and self-care agency in healthy adolescents and in
adolescents with spina bifida. Journal of Pediatric Nursing, 7, 1, 9-13. Murch, R.L., & Cohen, L.H. (1989). Relationships among life stress, perceived family
environment, and the psychological distress of spina bifida adolescents. Journal of Pediatric Psychology, 14, 2, 193-214.
Owens, J.A., & Hoza, B. (2003). The role of inattention and hyperactivity/impulsivity in the
positive illusory bias. Journal of Consulting and Clinical Psychology, 71. 4, 680–691. Ohan, J.L. & Johnston, C. (2002). Are the performance overestimates given by boys with
ADHD self-protective? Journal of Clinical Child Psychology, 31, 2, 230-241. Padua, L., Rendeli, C., Ausili, E., Aprile, I., Caliandro, P., Tonali, P., & Salvaggio, E. (2004).
Relationship between the clinical-neurophysiologic pattern, disability, and quality of life in adolescents with spina bifida. Journal of Child Neurology, 19, 952-957.
Padua, L., Rendeli, C., Rabini, A., Girardi, E., Tonali, P., & Salvaggio, E. (2002). Health-related
quality of life and disability in young patients with spina bifida. Archives of Physical Medicine and Rehabilitation, 83, 1384-1388.
Parsons, J.G. (1968). An investigation into the verbal facility of hydrocephalic children, with
special reference to vocabulary, morphology, and fluency. Developmental Medicine and Child Neurology, Suppl 16, 109.
Petersen, S.E., Robinson, D.L., & Morris, J.D. (1987). Contributions of the pulvinar to visual spatial
attention. Neuropsychologia, 25, 1-A, 97-105.
Piers, E.V. (1984). Piers-Harris Children's Self-Concept Scale. Los Angeles, CA: Western Psychological Services.
Posner, M.I., Petersen, S.E., Fox, P.T., & Raichle, M.E. (1988). Localization of cognitive
operations in the human brain. Science, 240, 4859, 1627-1631. Reynolds, C.R. & Kamphaus, R.W. (1992). The Behavior Assessment System for Children,
Parent Rating Scales (BASC-PRS). Circle Pines, MN: American Guidance Service (AGS), Inc.
Reynolds, C. R. & Kamphaus, R. W. (1992). The Behavior Assessment System for Children, Self-
Report of Personality (BASC-SRP). Circle Pines, MN: American Guidance Service (AGS), Inc.

87
Reynolds, C.R. & Richmond, B.O. (1978) “What I think and feel: a revised measure of children’s manifest anxiety”, Journal of Abnormal Psychology, 6, 2, 271-280.
Riddle, R., Morton, A., Sampson, J.D., Vachha, R., & Adams, R. (2005). Performance on the
NEPSY among children with spina bifida. Archives of Clinical Neuropsychology, 20, 243-248.
Rosnow, R.L. & Rosenthal, R. (2003). Effect sizes for experimenting psychologists. Canadian Journal of Experimental
Psychology, 57, 3, 221-237. Sawin, K.J., Brei, T.J., Buran, C.F., & Fasteneau, P.S. (2002). Factors associated with quality of
life in adolescents with spina bifida. Journal of Holistic Nursing, 20, 3, 279-304. Schwartz, E.R. (1974). Characteristics of speech and language development in the child with
myelomeningocele and hydrocephalus. Journal of Speech & Hearing Disorders, 39, 4, 465-468. Schoenmakers, M.A.G.C., Uiterwaal, C.S.P.M., Gulmans, V.A.M., Gooskens, R.H.J.M., &
Helders, P.J.M. (2005). Determinants of functional independence and quality of life in children with spina bifida. Clinical Rehabilitation, 19, 677-685.
Schmidt, D., Krause, B. J., Mottaghy, F.M., Halsband, U., Herzog, H., Tellmann, L., & Muller-
Gartner, H.W.(2002). Brain systems engaged in encoding and retrieval of word-pair associates independent of their imagery content or presentation modalities. Neuropsychologia, 20: 457-470.
Scott, M.A., Fletcher, J.M., Brookshire, B.L., Davidson, K.C., Landry, S.H., Bohan, T.C.,
Kramer, L.A., & Brandt, M.E. (1998). Memory functions in children with early hydrocephalus. Neuropsychology, 12, 4, 578-589.
Semrud-Clikeman, M. & Schafer, V. (2000). Social and emotional competence in children with ADHD and/or
learning disabilities. Journal of Psychotherapy in Independent Practice, 1, 4, 3-19. Shaffer, J., Friedrich, W.N., Shurtleff, D.B., & Wolf, L. (1985). Cognitive and achievement
status of children with myelomeningocele. Journal of Pediatric Psychology, 10, 3, 325-336. Shallice, T. (1982). Specific impairments of planning. Philosophical Transactions of the Royal
Society of London, Series B, 298, 199–209. Shapka, J.D. & Keating, D.P. (2005). Structure and change in self-concept during adolescence.
Canadian Journal of Behavioural Science, 37, 2, 83-96. Shavelson, R.J., Hubner, J.J., & Stanton, G.C. (1976). Self-concept: validation of construct
interpretations. Review of Educational Research, 46, 407-441. Shimamura, A.P. (1995). Memory and the prefrontal cortex. Annals of the New York Academy of
Sciences, 769, 151–159.

88
Shirane, R., Sato, S., Sato, K., Kameyama, M., Ogawa, A., Yoshimoto, T., Hatazawa, J., & Ito, M. (1992). Cerebral blood flow and oxygen metabolism in infants with hydrocephalus. Child’s Nervous System, 8, 118-123.
Snow, JH. (1999). Executive processes for children with spina bifida. Children’s Health Care,
28, 3, 241-253. Stuss, D.T. & Benson, D.F. (1986). The frontal lobes. New York: Raven Press. Wheeler, M.A., Stuss, D.T., & Tulving, E. (1995). Towards a theory of episodic memory. The
frontal lobes and autonoetic consciousness. Psychological Bulletin, 121, 331–354. Tabassam, W. & Grainger, J. (2002). Self-concept, attributional style and self-efficacy beliefs
of students with learning disabilities with and without attention deficit hyperactivity disorder. Learning Disability Quarterly, 25, 141-151.
Tew, B. & Laurence, K.M. (1979). Differences in reading achievement between spina bifida
children attending normal schools and those attending special schools. Child: care, health, and development, 4, 5, 317-326.
Tew, B. & Laurence, K.M. (1975). The effects of hydrocephalus on intelligence, visual
perception and school attainment. Developmental Medicine and Child Neurology, 17, Suppl 35, 129-134.
The Psychological Corporation (2001). Wechsler Individual Achievement Test- Second Edition
(WIAT-II): San Antonio, TX. Van Zomeren, A.H. & Brouwer, W.H. (1994). Clinical neuropsychology of attention. Oxford University Press: New
York, NY, US. Varni, J.W. & Wallander, J.L. (1988). Pediatric chronic disabilities: hemophilia and spina bifida
as examples. In: Handbook of Pediatric Psychology. Routh, D.K. (Ed.). Guilford Press: New York, NY , US.
Verhoef, M., Post, M.W.M., Van Asbeck, F.W.A., Gooskens, R.H.J.M., & Prevo, A.J.H. (2004).
Secondary impairments in young adults with spina bifida. Developmental Medicine & Child Neurology, 46, 420-427.
Wallander, J.L. & Varni, J.W. (1998). Effects of pediatric chronic physical disorders on child
and family adjustment. Journal of Child Psychology and Psychiatry, 39, 1, 29-46. Wallander, J.L., Feldman, W.S., & Varni, J.W. (1989). Physical status and psychosocial
adjustment in children with spina bifida. Journal of Pediatric Psychology, 14, 1, 89-102. Warschausky, S., Argento, A.G., Hurvitz, E., & Berg, M. (2003). Neuropsychological status and
social problem solving in children with congenital or acquired brain dysfunction. Rehabilitation Psychology, 48, 4, 250-254.

89
Wigfield, A,. Eccles, J.S., Iver, D.M, Reuman, D.A., & Midgley, C. (1991). Transitions during
early adolescence: changes in children's domain-specific self-perceptions and general self-esteem across the transition to junior high school. Developmental Psychology, 27, 4, 552-565.
Willis, K.E. (1993). Neuropsychological functioning in children with spina bifida and/or
hydrocephalus. Journal of Clinical Child Psychology, 22, 2, 247-265. Willis, K.E., Holmbeck, G.N., Dillon, K., & Mclone, D.G. (1990). Intelligence and achievement
in children with myelomeningocele. Journal of Pediatric Psychology, 15, 2, 161-176. Wilson, J.W. & Marcotte, A.C. (1996). Psychosocial adjustment and education outcome in
adolescents with a childhood diagnosis of attention deficit disorder. Journal of the American Academy of Child and Adolescent Psychiatry, 35, 5, 579-587.
Wolman, C., & Basco, D.E. (1994). Factors influencing self-esteem and self-consciousness in
adolescents with spina bifida. Journal of Adolescent Health, 15, 7, 543-548. Yeates, K.O., Enrile, B.G., Loss, N., & Blumenstein, E. (1995). Verbal learning and memory in
children with myelomeningocele. Journal of Pediatric Psychology, 20, 6, 801-815. Yeates, K.O., Loss, N., Colvin, A.N., & Enrile, B.G. (2003). Do children with
myelomeningocele and hydrocephalus display nonverbal learning disabilities? An empirical approach to classification. Journal of the International Neuropsychological Society, 9, 653-662.
Young, H.F., Nulsen, F.E., Weiss, M.H., & Thomas, P. (1973). The relationship of intelligence
and cerebral mantle in treated infantile hydrocephalus. Pediatrics, 52, 1, 38-44. Zurmohle, U., Homann, T., Schroeter, C., Rothgerber, H., Hommel, G., & Ermert, J.A. (2001).
Psychosocial adjustment of children with spina bifida. Journal of Child Neurology, 13, 64-70.
90
BIOGRAPHICAL SKETCH
Andrew S. Preston was raised in Lockport, NY by his parents, Tarrell and Susan Preston.
He is the oldest of three children, one brother and one sister. He graduated from Lockport High
School in 1995. He then went to Davidson College in North Carolina, where he earned a B.A. in
Psychology with a concentration in Neuroscience. In 2001 he enrolled in the University of
Florida’s doctoral program in Clinical and Health Psychology. His primary area of study is
neuropsychology with a focus on pediatric populations. Following completion of graduate
studies at the University of Florida, he completed a predoctoral internship in the Clinical
Neuropsychology Track at the Brown University School of Medicine. He is currently pursuing a
postdoctoral fellowship in clinical neuropsychology with a continued focus on pediatric
populations.