to what extent can defining graphic/written text relations
TRANSCRIPT
To What Extent Can Defining Graphic/Written Text
Relations Support The Teaching of Reading
Comprehension in Multi-Modal Texts?
By
Peter Mc Donald
A dissertation submitted to the School of Humanities
of the University of Birmingham in part fulfillment
of the requirements for the degree of
Master of Arts in Teaching English as a Foreign or Second Language
This dissertation consists of approximately 13, 500 words
Supervisor: Ian Walkinshaw
Centre for English Language Studies
Department of English
University of Birmingham
Edgbaston, Birmingham B15 2TT
United Kingdom
March 2009

Acknowledgements
I would like to thank Ian Walkinshaw for all his help and support in writing this
dissertation. I would like to thank my students for taking part in the experiment so
enthusiastically.
Contents
Part 1 Introduction 1 1.1 New Literacies and Graphic/Written Text Relations 1
1.2 The Role of a Definition of Graphic/Written Text Relations 2
1.3 SFG and Defining Graphic/Written Text Relations 3
1.4 SFG Principles Used in this Study 4
1.5 Graphic/Written Text Relations and their Effects on Reading Comprehension 5
1.6 The Goals of this Study 6
1.7 Hypothesis 7
1.8 Organization of the Study 7
Part 2 Literature Review 9 2.1 Defining Graphic/Written Text Relations to Support Multi-Modal Reading
Comprehension 9
2.2 Reading Comprehension Research 11
2.3.1 Applying the SFG Model to the Multi-Modal Classroom 14
2.3.2 The Principles of an SFG Approach to Visual Design 14
2.3.3 The Compositional Function: 15
2.3.3.1 Framing 15
2.3.3.2 Information Value 16
2.3.3.3 Salience 17
2.3.4 The Representational Content 18
2.3.4.1 Narrative Images 18
2.3.4.2 Concept Images 18
2.3.4.3 Classifying Narrative and Concept Images 18
2.3.5 The Interactive Content 19
2.3.5.1 Offer Images 20
2.3.5.2 Demand Images 20
2.3.5.3 Classifying Offer and Demand Images 21
2.3.6 Classifying Images Into Types: Narrative Offer Images and Concept Demand
Images 21
Part 3 A Definition of Graphic/Written Text Relations that Can Be Used to Support Reading
Comprehension 22 3.1 Introduction 22
3.2.1 Concurrence in Narrative Offer Panels 22
3.2.2 Complementation in Narrative/Offer Panels 23
3.2.3 Complementation vs. Concurrence in Narrative Offer Panels 24
3.3.1 Complementation in Demand/Concept Pictures 24
3.4 The Theoretical Model for Defining Graphic/Written Text Relations in Support of
Reading Comprehension 25
Part 4 Defining the Graphic/Written Text Relations in the Macbeth Text 27 4.1 Introduction 27
4.2 Determining Panel Types in the Macbeth Text 27
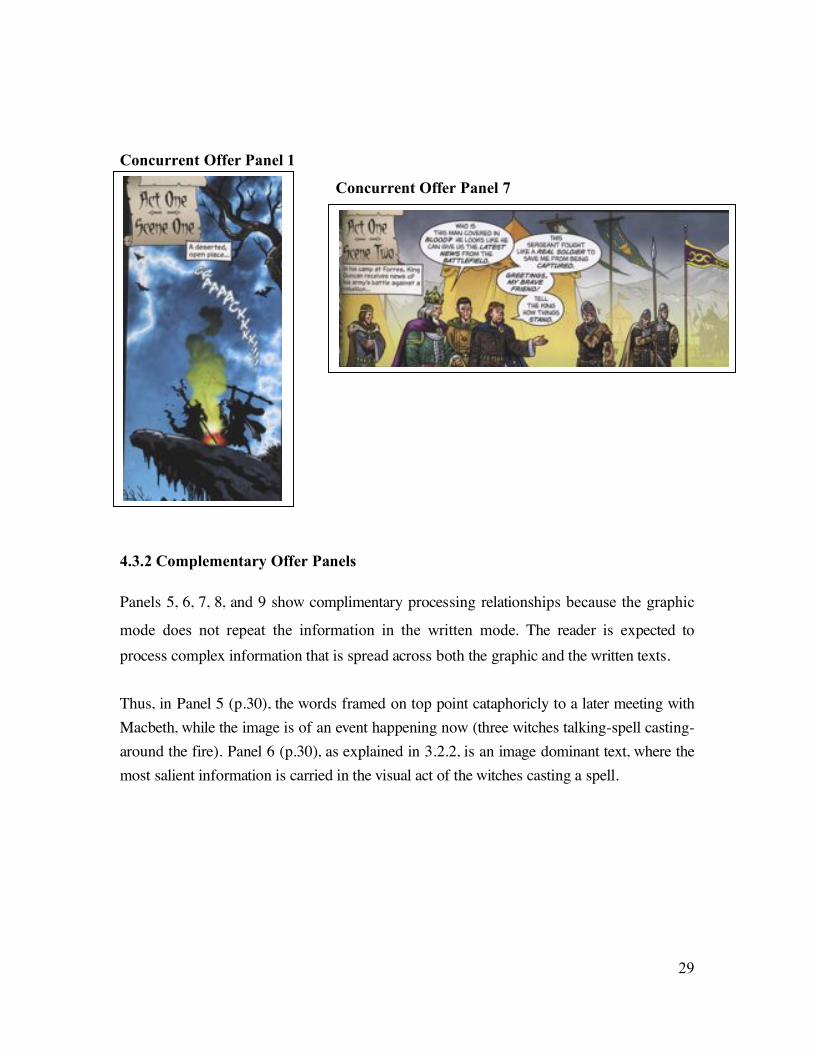
4.3.1 Concurrent Offer Panels 28
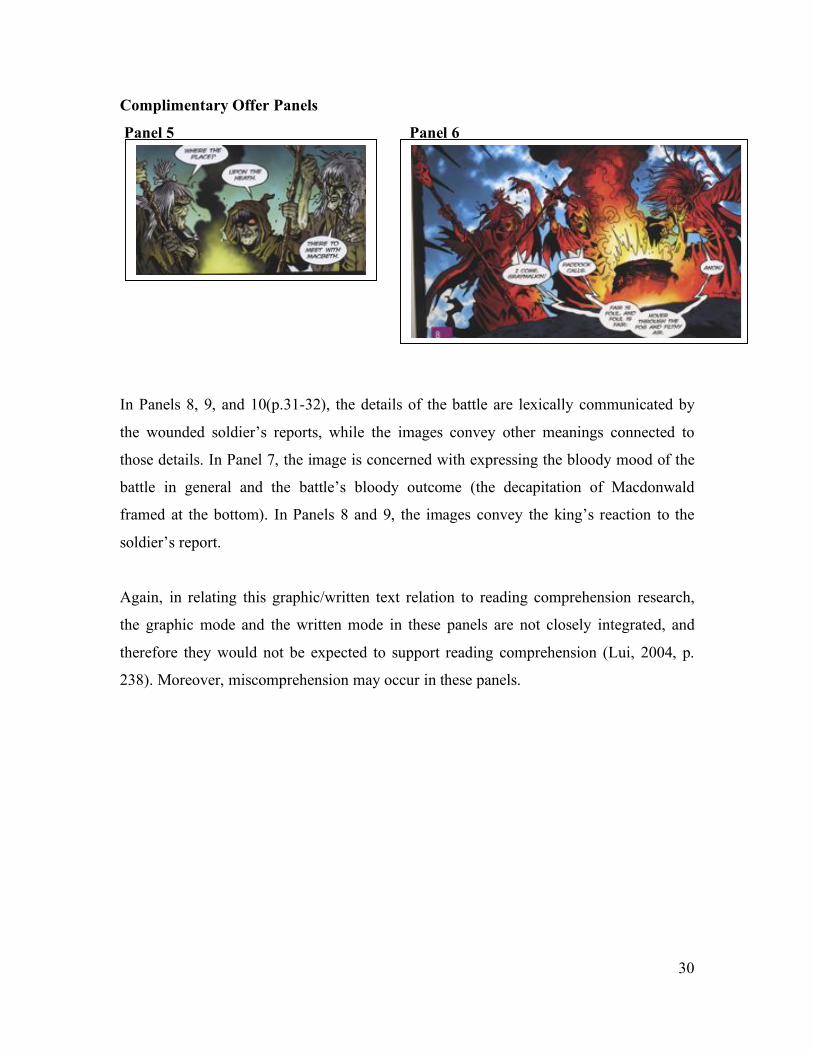
4.3.2 Complementary Offer Panels 29
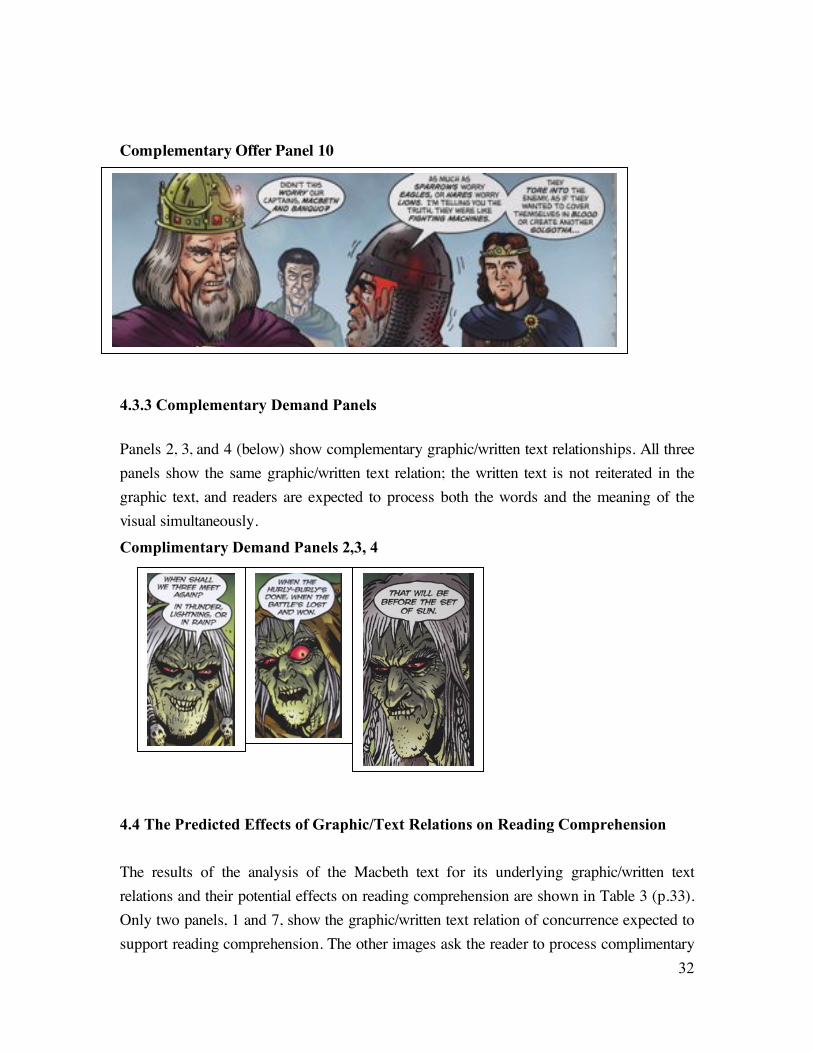
4.3.3 Complementary Demand Panels 32
4.4 The Predicted Effects of Graphic/Text Relations on Reading Comprehension 32
4.5 Classifying the Panels as Information Units 33
4.6 Applying the Theoretical Model to the Hypothesis 34
Part 5 Methodology 36 5.1 Introduction 36
5.2 Participants 36
5.3.1 Data Collection 36
5.3.2 Modifying Immediate Recall Protocols 37
5.3.3 Student Feedback Sheets 38
5.4 Procedure 39
5.5 Piloting the Study 40
Part 6 Results and Discussion 41 6.1 Introduction 41
6.2 Results 41
6.3 Discussion Of Complementary Offer Panels 3,4,6,7,8 43
6.4 Discussion Of Complementary Demand Panel 2 47
6.5 Discussion Of Complementary Offer Panels 1 and 5 48
Part 7 Conclusions 50 7.1 To What Extent Was The Definition of Graphic/Written Text Relations
Successful? 50
7.2 Limitations to the Definition 51
Appendixes 53 Appendix 1 Macbeth Graphic Text 53
Appendix 2 Macbeth Written Text 56
Appendix 3 Student Feedback Sheet Group A 58
Appendix 4 Student Feedback Sheet Group B 63
References 69
Abstract
Due to the increasing number of image-based multi-modal texts used in the English
Language Teaching (ELT) classrooms, teaching reading comprehension is becoming a
growing challenge. Research suggests that defining the underlining graphic/written text
relations that constitute image based multi-modal texts can help teachers meet that
challenge. However, this area is under researched. This dissertation will propose a
theoretical model of graphic/written text relations that can support reading
comprehension in ELT classrooms. In order to create the model it will align two areas of
research, systemic functional grammar and second language reading comprehension
research. It then demonstrates how the model can be applied to an authentic multi-modal
text to predict the effects the text will have on students reading comprehension. The study
tests the predictions in a classroom context and discusses to what extent the model was
successful. It also discuss the extent to which a definition graphic/written text relations is
practical in an ELT classroom context. It suggests that further research into a more
comprehensive definition of graphic/written text relations is an appropriate goal for ELT.
1
Part 1 Introduction
1.1 New Literacies and Graphic/Written Text Relations
The term “new literacies” refers to the underlying changes in social practices (Kist, 2005,
p. 5-6) that have made society and therefore modern classrooms, if they are to remain
relevant (Lankshear and Knobel 2006), more likely to utilize texts that incorporate multi-
modal text relations to send their message. The most obvious example of this change in
literacy is screen-based digital texts (computers, mobile phones, and iPods), where the
traditional linear structure of reading left to write on a page is challenged by a visual
hyperactive reading path that follows the rules of visual design as well as the rules of
written language (Kress, 2003, pp. 35-60).
A less obvious example of this change can be seen in the traditional written text itself.
Written texts can be defined as multi-modal texts because they are made comprehensible
by visual design, that is, letters, punctuation marks, and indents (Baldry and Thibault,
2005). Moreover, written texts, like most things in life, have always undergone change.
However, in a modern digital society where the means of production are shifting and
writers are now taking on many of the publication tasks once considered specialized,
written texts are using far more visual features-bullet points, excel tables, and pictures-
than they have 50 years ago (Kress, 2003, pp. 16-34). The final area of changing literacy,
which is in the kind of text researched in this study, is in the pedagogical acceptance of
popular media texts. Here, texts that may not have been considered useful in the
classroom 30 years ago (e.g., comic books and computer games,) are now being
recommended as essential to the modern curriculum (Coiro, 2008; Black, 2008).
Therefore, in a society dominated by the printed word, defining linguistic relations (from
the traditional grammar of Latin and Greek to the more modern approaches such as
Consciousness Raising) has always played a role in education. Thus, in a society where
the “hegemony” (Stein, 2004, p. 95) of the printed page is being replaced by texts that
2
incorporate graphics, defining written/graphic text relations must play an educational
role. Hence, researchers and practitioners are calling for an increased understanding of
graphic/written text relations, a visual “grammar” (Kress and Van Leeuwen, 2006), or a
“multi-modal meta-language” (Unsworth, 2008). Indeed, in a Teaching English to
Speakers of Other Languages (TESOL) context, a need for a “multi-modal
communicative competence” has been suggested (Royce, 2002).
Yet, while a practical definition of graphic/written text relations may be pedagogically
beneficial, at the moment, there is no accepted comprehensive definition of it that can be
applied to the classroom (Fei, 2004, p. 222). However, the goal of this study is not to
create a comprehensive definition of graphic/written text relations. Rather, it will attempt
to create a definition of graphic/written text relations that can be applied to one area of
the English as Foreign Language (EFL) classroom, which is multi-modal reading
comprehension. However, before the details of the study are explained, the next section
will look first into the proposed role a definition of graphic/written text relations can have
in the classroom.
1.2 The Role of a Definition of Graphic/Written Text Relations
The role of a definition of graphic/written text relations is to aid the processing of multi-
modal texts for teachers and students. For many researchers and practitioners, (Unsworth
2008; Kress and Van Leeuwen, 2006; Luke, 2003), multi-modal text processing is seen as
more complex, and it makes multi-modal texts far harder for readers to comprehend than
has been accounted for in existing educational research. Multi-modal texts can be seen as
complex because they combine at least two modal systems to create their meaning (Kress
and Van Leeuwen, 2006). They combine graphic text modality, where visual elements
are placed in pictures according to spatial rules of design, and a written text modality,
where words are placed in sentences according to linguistic rules (Kress and Van
Leeuwen, 2006, pp. 16-44). Therefore, reading multi-modal texts can be challenging for
teachers and students as it requires “parallel processing” (Luke, 2003, p. 399), processing
graphic and written messages simultaneously to make one overall meaning.
3
Thus, semiotic research suggests that in order to read a multi-modal text effectively, the
reader must initially and perhaps unconsciously decode two semiotic systems: the spatial
system of design to decode the images and the linear system of the writing to decode the
words. The reader then must interpret how the two systems combine to make one overall
meaning (Royce, 2002). Therefore, although multi-modal texts may have simple ways of
presenting information, the underlying relationships may be complex. Unsworth, (2008,
p. 378), points out the effect of “naturalization” where these complex underlying semiotic
relationships can be hidden by the writers to create cohesive texts. Indeed, in an EFL
context, processing multi-modal texts can be seen as extremely complex because learners
not only have to process the graphic and written modes, but they also have to translate
them into their own language.
Therefore, the role of a definition of graphic/written text relations in modern literacy
classroom is to enable teachers and students to decode these naturalized semiotic
relationships in a meaningful way that can be applied to particular teaching contexts
(Unsworth, 2008). It has been suggested that the Systemic Functional Grammar (SFG)
can offer a theoretical modal that can support this process.
1.3 SFG and Defining Graphic/Written Text Relations
The SFG model can support the processing of multi-modal texts because it can be used to
decode the underlying complexity of semiotic relationships (Fei, 2004, pp. 221-222).
Thus, the SFG model can decode multi-modal texts because it can separate and analyze
the interrelated modes that make up the text. The graphic system and the written system
can be separated and examined for their individual functions or for their combined
functions. However, more research is needed to determine how the SFG model can be
applied to education in general (Unsworth, 2008) and EFL classrooms in particular
(Royce, 2002, p. 19).
4
The goal of this research is to apply the SFG model to the EFL context of multi-modal
reading comprehension. To do this, two areas of research will be aligned. First is the
SFG grammar research, which suggests that the graphic/written text relations that make
up multi-modal texts can be defined and that those definitions are applicable to teaching.
Second is the EFL research, which also suggests that graphic/written text relations can be
defined. The SFG grammar research will be explained next to be followed by the EFL
research.
1.4 SFG Principles Used in this Study
To create the definition of graphic/written text relations used in this study, two areas of
systemic research will be focused on. The first area is Kress and Van Leeuwen’s (2006)
SFG model. This model classifies image-based multi-modal texts into two contrasting
types: images that offer information to a viewer or images that create an emotional
response from a viewer. The second area is semiotic research, which has applied Kress
and Van Leeuwen’s original model to multi-modal texts in order to define graphic/written
text relations, as summarized by Unsworth (2008). These researchers examined how
graphic text combines with the written text to communicate the overall meaning of the
multi-modal text to the reader. As combinations of graphic/written text relations can be
wide ranging and complex, (see Unsworth, 2008 for a full treatment), this study will
focus on two definitions. First is concurrence, where, as illustrated in Section 4, the
graphic text and the written text combine to send very similar messages. Second is
complementation, which is also illustrated in Section 4, where the graphic text and the
written text combine to send messages that, while closely related, do not repeat each
other but rather augment each other to communicate the overall message of the text to the
reader.
The goal of this study then is to investigate to what extent the image classifications
identified by Kress and Van Leeuwen, and the graphic/written text relations summarized
by Unsworth (2008) can be applied to EFL reading comprehension research. The next
section will examine EFL research.
5
1.5 Graphic/Written Text Relations and their Effects on Reading Comprehension
This study will focus on Luis’s 2004 study which suggests that the graphic/written text
relations contained in multi-modal texts can have four effects on reading comprehension
(Lui, 2004, pp. 235-239). The first effect is support. Multi-modal texts can support
comprehension when the graphic text repeats the same information as the written text, for
example, a graphic/written text relationship of “reiteration” (Lui, 2004, p. 237). Support
occurs in this type of graphic/written relationship when the students’ proficiency level is
just below the level of the written text. Here, students can use the images to infer the
meaning of the words. The second effect is redundancy. Graphic texts can create
redundancy when, again, there is a graphic/written text relationship of reiteration.
However, here the students’ proficiency level is above the level of the written text; thus,
they do not need the graphic text to infer the meaning of the words. Therefore, the
students do not use the graphic text.
The third effect is incomprehension. Multi-modal texts can create incomprehension when
there is no relationship of reiteration between the written text and the graphic text. Here,
rather than reiterating each other, the graphic text and the written text contain closely
related information that augment each other in some way. Incomprehension occurs in this
type of graphic/written text relation when the students’ proficiency is lower than the
words in the text. The lack of textual integration means students cannot use the graphic
text to infer the meaning of the words, making them unable to understand the text.
The fourth effect is miscomprehension. Miscomprehension occurs, again, when rather
than the graphic text reiterating the information in the written text, it augments it in some
way. Likewise, the students’ proficiency level is lower than the written text. However,
here the students make the wrong assumption about the graphic/written text relationship.
They assume that the graphic text does reiterate the information in the written text, that
is, that the graphic text can support the words. However, the lack of harmony between the
written text clues and the graphic text clues creates processing difficulties. The students
6
then make the wrong inferences about the text. Thus, the graphic text hinders the
comprehension of the written text.
While Lui’s 2004 study shows that different types of graphic/written text relations
produce different effects on reading comprehension, it offers no detailed definition of the
graphic/written text relations that create, support, or inhibit reading comprehension. This
study will attempt to build on Lui’s 2004 study by offering such a definition. Moreover,
this study will attempt to use the aforementioned systemic research to create this detailed
definition of graphic/written text relations.
1.6 The Goals of this Study
This study suggests that the graphic/written text relations of reiteration in Lui’s research
can be directly related to the graphic/written text relations of concurrence outlined above.
Moreover, the more complex relationships that produce, inhibit, or hinder reading
comprehension can be directly related to the graphic/written text relations of
complementation outlined above.
Therefore, by aligning these two areas of research, a model of graphic/written text
relations can be created that is directly applicable to teaching reading comprehension in
EFL classrooms. This study will use the principles of SFG, as identified by Kress and
Van Leeuwen (2006) and Unsworth (2008), to define two things: the graphic/written text
relations of concurrence that may, as this study suggests, support reading comprehension
or cause redundancy, and the graphic/written text relations of complementation that may,
as this study suggests, produce incomprehension or miscomprehension.
Once these relationships are identified, the second stage is to test the validity of the
theoretical model in the classroom by measuring whether these predicted reading
comprehension relationships actually occur in a group of second language (L2) learners.
The actual research questions are as follows:
7
1) To what extent can the systemic principles of graphic/written text relations be used to
predict the effects a multi-modal text will have on L2 students reading comprehension?
2) What effects does presenting students with a written text supported by graphics have
on L2 students’ reading comprehension?
1.7 Hypothesis
It is hypothesized that the principles of SFG can be effectively used to efficiently
categorize two types of multi-modal texts. Furthermore, these categorizations can be used
to predict the effects the two text types will have on reading comprehension.
• Texts that support reading comprehension because the graphic texts repeat the
written texts’ meaning in concurrent relationships
• Texts that do not support reading comprehension because the graphic texts and
written texts work together to create a complimentary meaning
Therefore, students who read texts that display concurrent relationships may be expected
to show higher level of comprehension than those who read texts that display
complementary relationships. However, if the students' proficiency is higher than the
written text, the images may cause redundancy, as the students will not need the images to
compensate for any linguistic deficiencies. Moreover, students who read texts that
incorporate complementary relationships should show signs of incomprehension or
miscomprehension.
1.8 Organization of the Study
This study will have seven parts. Part 2 or the literature review will focus on why
defining graphic/written text relations is considered beneficial to the classroom and
research into the effects of graphic/written text relations on reading comprehension.
8
Moreover, it will discuss SFG’s usefulness as a model for defining graphic written text
relations and introduce the key SFG principles that can be used to classify image-based
texts. Part 3 will create a theoretical definition of graphic/written text relations that can
predict students’ potential reading comprehension from the research introduced in Parts 1
and 2. This definition will attempt to predict the effects graphic/written texts relations
will have on students’ reading comprehension. Part 4 will apply that definition to an
authentic graphic-based text to predict the effects the text will have on students’ reading
comprehension. Part 5 will explain the methodology used to test the definition in the
classroom, and Part 6 will discuss the findings. Part 7 will offer the final conclusion.
9
Part 2 Literature Review
2.1 Defining Graphic/Written Text Relations to Support Multi-Modal Reading
Comprehension
In the teaching of reading comprehension for written texts, standard classroom activities
(textual comparisons, assessments, and so on) are possible as the underlying textual
relationships in written texts can be expressed explicitly. Thus, the various methods of
linguistic description that already exist for written texts assist the teaching of those texts
in the classroom. At the moment, however, in multi-modal texts, teachers and students
have no agreed upon pedagogical system to talk about multi-modal texts. Therefore,
defining graphic/written text relations clearly for teachers and students should help them
talk about multi-modal relationships explicitly in the classroom. Being able to talk about
multi-modal relationships should, in turn, assist the teaching of multi-modal texts. For
example, the ability to explicitly articulate multi-modal relationships can make possible
textual comparisons between different multi-modal texts, examination of
writers/illustrators choices in textual constructions, assessment of the effectiveness of
those textual choices, and so on (Unsworth, 2008, p. 378).
Indeed, Royce (2002, p. 201) pointed out that the inability to talk about multi-modal texts
accurately in the classroom may account for the negative attitude (as observed by Kress,
2004, p. 30; Gravett, 2004, p. 12) towards multi-modal texts that still exist in the society
and in the classroom. This negativity is disturbing because, as pointed out in the
introduction, multi-modal texts are becoming increasingly prevalent in the modern
classroom. The ability to define graphic/written text relations accurately may help to
foster positive and more informed attitudes towards multi-modal texts.
For example, comic books have been recommended to facilitate the development of
literacy (Day and Bamford, 1998; Gorman, 2003) and language learning (Cary, 2005;
Norton and Vanderheyden, 2004), and to increase students’ awareness in popular culture
10
(Bhatia, 2006; Norton and Vanderheyden, 2004). However, Bhatia pointed out that
teachers still believe in the “compensatory hypothesis,” in which the only function of
comic books is to “fill the deficiency gap left by the verbal component” (Bhatia, 2006, p.
281). As mentioned in the introduction, Lui s research (2004) indicated that the effect of
compensatory hypothesis can indeed be observed in multi-modal texts. However, it is
only one effect and it only occurs, as it is suggested, with certain graphic/written text
relationships and with students of a particular proficiency level. Moreover, as will be
explained in the next section, other more complicated effects can be observed with
different graphic/written text relations and different student proficiency levels. By
defining graphic/written text relations accurately, teachers can evaluate which part of the
graphic text will compensate the verbal component and which parts of the text will
require more complicated multi-modal processing. Overall, this should improve the
standing of multi-modal texts in the classroom.
Moreover, as pointed out in the introduction, complicated semiotic relationships are often
hidden or “naturalized” (Unsworth, 2008, p 378) in texts to create a cohesive whole. An
example of this is in the teaching of news stories or advertisements. According to
Unsworth (2008, p. 388), graphic/written text relations are often manipulated in news
stories to reinforce negative or positive messages. This is the effect of foregrounding in
which, for example, negative images of participants can be chosen to directly support
negative written texts. More subtly, complex graphic/written text relations can also be
used to send subliminal messages to the readers. Therefore, unveiling these hidden
relationships can improve teachers’ and students’ ability to read texts critically.
While classrooms increasingly use multi-modal texts (textbooks, web pages, maps,
instructions, and others), little work has been done to determine how effectively they
employ underlying multi-modal relationships (Kress, 2004, p. 7). Accurately defining
graphic written text relations can help teachers make more informed decisions about the
type of texts created or chosen as classroom materials (Lui, 2004, p. 239; Stenglin and
Iedema, 2001, pp. 195-208). For example, graphic text relations that have a positive
effect on reading comprehension can help students process linguistic information.
11
However, graphic/written text relations that create incomprehension or
miscomprehension can de-motivate students (Lui, 2004, p. 239). Thus, graphic/written
text relations are important to better inform teachers and students about the multi-modal
materials they are already using.
The ability to accurately define graphic/written text relations can therefore potentially
support reading comprehension in EFL classrooms. The extent to which graphic/written
text relations can practically support reading comprehension in the classroom depends
upon two things. First is to what extent can graphic/written text relations be accurately
and efficiently defined. This will be discussed in Section 2.3. Second is to what extent
can the effects graphic/written text relations have on reading comprehension be
accurately measured. This will be discussed next.
2.2 Reading Comprehension Research
Research has shown (as summarized in Lui, 2004, p. 226) that presenting students with
visual representations of words can help them overcome comprehension-processing
difficulties (Gyselinck and Tardieu, 1999). Indeed, using images to support reading
comprehension is common in many classrooms. The learning system often used to
explain the positive effects multi-modal texts have on comprehension is Paivio’s dual
coding theory (Leu, 2004, p. 752). Dual coding theory suggests that the mind has two
separate processing systems: the linguistic system and the visual system (Sadoski and
Paivio, 2001 pp. 42-66). Presenting students with a written text accompanied by graphics,
as opposed to just written text alone, allows readers to activate and integrate both the
visual and the linguistic systems, and this interconnection helps readers generate
inferences about the text (Sadoski and Paivio, 2001, pp.117-136).
However, as stated in the introduction, Lui’s 2004 study found that images only support
the written text when the image and the written text send very similar messages.
Moreover, Lui (2004, p. 237) suggests Marcus, Cooper, and Sweller’s (1996) mental
model theory as an alternative explanation to dual coding theory. This theory suggests
12
that graphic information is relatively easy to understand because it is concise information.
Here, the illustrator has realized and imagined a mental picture for the readers. On the
other hand, written information demands more cognitive processing than graphic
information because readers must make their own mental model of the words. Therefore,
if a graphic text and a written text repeat the same message, the reader’s cognitive load is
reduced, as the graphic/text has already realized (imagined) the words for the reader. This
can account for graphic texts supporting comprehension in lower proficiency students. It
can also account for the graphic/written texts creating redundancy; if the words are easy
for the students, they do not need the mental picture to help them realize the words (Lui,
2004, pp. 236-237).
Additionally, the mental modal theory also accounts for incomprehension. Here, as
explained in the introduction, the graphic/written text relations are not directly
interconnected, that is, the graphic text does not reiterate the message of the written text.
Thus, comprehension is not supported. The mental model theory can help explain these
findings, as in this type of graphic/written text relation students cannot use the image to
mentally realize the word. They have to rely on linguistic knowledge alone, which, at
their level of proficiency, is insufficient (Lui, 2004, p. 237).
To explain the effect of miscomprehension, Lui suggested Schmidt’s noticing theory
(1990). According to this theory, readers continually analyze and compare what they
notice during reading. In a multi-modal text, if the graphic and written texts are
interconnected, this noticing will support reading comprehension. However, if the
graphic and written texts are not closely integrated, the noticing effect may be negative.
Students may assume that the graphic and written texts are integrated and may make the
wrong inferences about the text, which will “hinder” reading comprehension (Lui, 2004,
p. 239).
Moreover, the effects of incomprehension and miscomprehension can be supported by
the schema theory, which suggests that comprehension is a mixture of incoming
information being matched to the readers’ expectations (Cook, 1989, pp. 68-75). When
13
the schema is activated, readers create their own concepts of what is happening in the text
as they read it. If the incoming data do not match the their expectations, they will reject
the data. Thus, in multi-modal texts this process can become complex because readers
need to match the incoming data from the different modes, for example, the written and
the visual, to their own textual expectations. This process is of course more complicated
for L2 learners because they have the additional cognitive load of translating the texts.
Multi-modal texts in L2 environments require translation, matching the graphic with the
written text, and then further matching with the learners’ own developing schema (Wolf,
1987, p. 313). Thus, multi-modal texts, where there is little direct integration between the
modes, are likely to create incomprehension. It is of course possible that the learners may
believe that the incoming data do match their own textual perceptions, which can cause
miscomprehension.
Finally, dual coding theory is a universal theory of cognition, (Sadoski and Paivio 2001),
while other theories (mental modeling theory and noticing schema) are not, which
suggests that they can co-exist. Thus, it would seem that mental modeling and the schema
can better account for the complexities of multi-modal processing than the universal dual
coding model. More research is needed to determine what actually occurs when L2
students are faced with the task of processing multi-modal texts (Lui, 2004). This is
addressed in the second research question of “What are the effects of multi-modal texts
on L2 comprehension?” However, while Lui’s study clearly suggests the possible effects
multi-modal texts will have on reading comprehension, as stated in the introduction, no
detailed examples of graphic/written text relations were given in the study. Furthermore,
as outlined in the introduction, semiotic research suggests that graphic/written text
relations can be complex. Therefore, how can teachers or students recognize the
graphic/written text relations of integration or non-integration described in the study on
multi-modal texts?
The first research question of “Can the principles of SFG be used to create an accurate
definition of these graphic/written text relations?” is intended to address this need. The
SFG model used as the foundation for the definition will be examined next.
14
2.3.1 Applying the SFG Model to the Multi-Modal Classroom
The SFG model can be effectively used to analyze multi-modal texts (O’ Halloran, 2004),
and it has been applied successfully to pedagogical contexts (Unsworth, 2001; Baldry and
Talbot, 2005). However, more research is needed to determine how it can be applied to
the classroom (Unsworth, 2008) and in particular, as pointed out above, in EFL contexts
(Royce, 2002). Creating a definition of graphic/written text relations for the classroom
can be problematic. Image-based texts have been proven to be difficult to define
efficiently because how an image is interpreted can theoretically be very broad (Fei,
2004, p. 222; Prosser, 1998, pp. 97-112). Moreover, applying SFG to multi-modal texts
requires a meta-language that can appear complex and difficult unless the readers are
familiar with it (Jewitt and Oyama, 2001, p. 154). Finally, the benefit of grammar in
written/spoken language has been the source of much debate in EFL (Brown, 2001, p.
391). Similar debates can be expected in an attempt to create a multi-modal grammar.
Consequently, the definition of graphic/written text relations in this paper, which will be
outlined next, needs to address these problems. Therefore, it needs to be explainable in
relatively simple terms, needs to be practically applicable to teaching contexts, and
should reflect modern approaches to the teaching of the formal rules of language
learning.
2.3.2 The Principles of an SFG Approach to Visual Design
The theoretical foundation for defining graphic text relations is Halliday’s “trinocular”
(Halliday and Matthiessen, 2004, p. 31) perspective on language, which analyzes
written/spoken texts using three meta-functions: textual, experiential, and interpersonal.
Kress and Van Leeuwen (1996, 2006) applied this model to image-based texts to produce
the three related meta-functions as follows:
• the compositional function (related to the textual function)
15
• the representational function (related to the experiental function)
• the interactive function (related to the interpersonal function)
The following sections will explain each function.
2.3.3 The Compositional Function:
The “compositional meta-function” is related to the textual meta-function in written
analysis (Jewitt and Oyama, 2001, pp. 147-151). Consequently, just as the placement of
clauses in a written text determines the importance of the information placed within the
clause (Halliday and Matthiessen, 2004: p. 64; Fries, 1994, p. 230), so too does the
placement of elements in a picture determine the visual importance of the elements.
Kress and Van Leeuwen (2006, p. 177) identified the three elements of framing, salience,
and information value (explained below), which can be combined in different ways to create
different "meaning potentials" in visuals. Meaning potential means the intended effect of
words and images have on the receiver of the information. How the information is actually
received will depend on the receiver’s ability to interpret it (Halliday and Matthiessen, 2004,
p. 26: Kress and Van Leeuwen, 1999, p. 379).
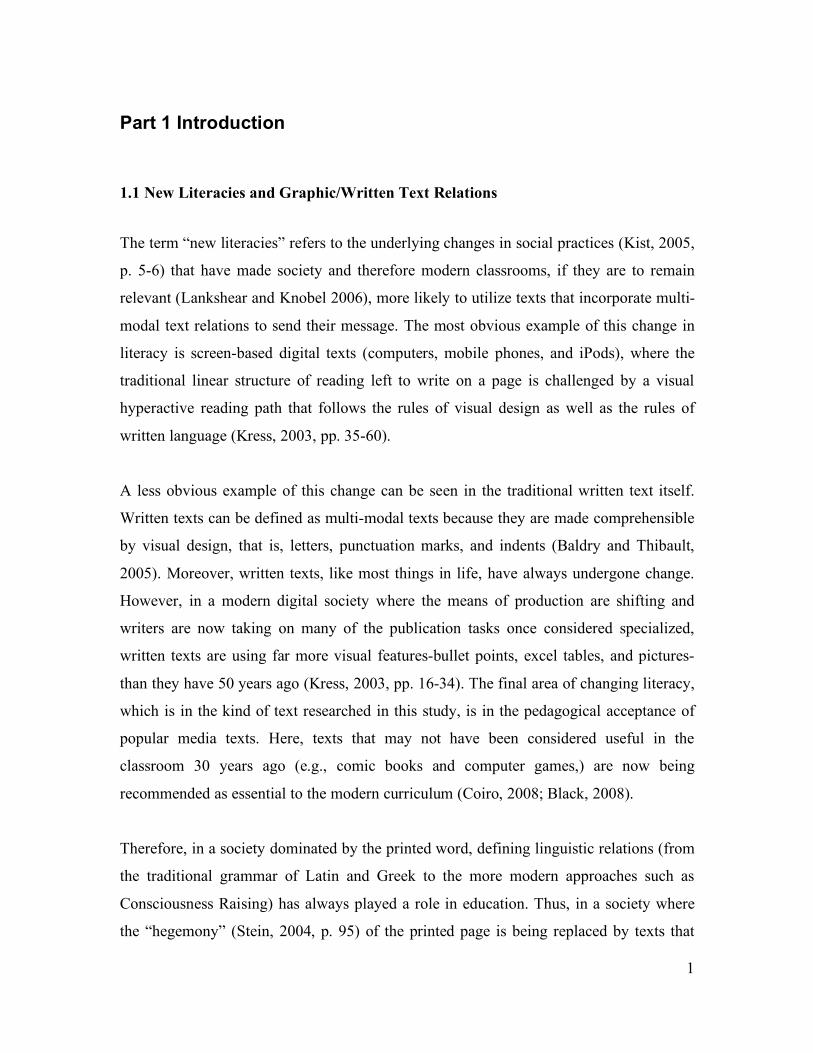
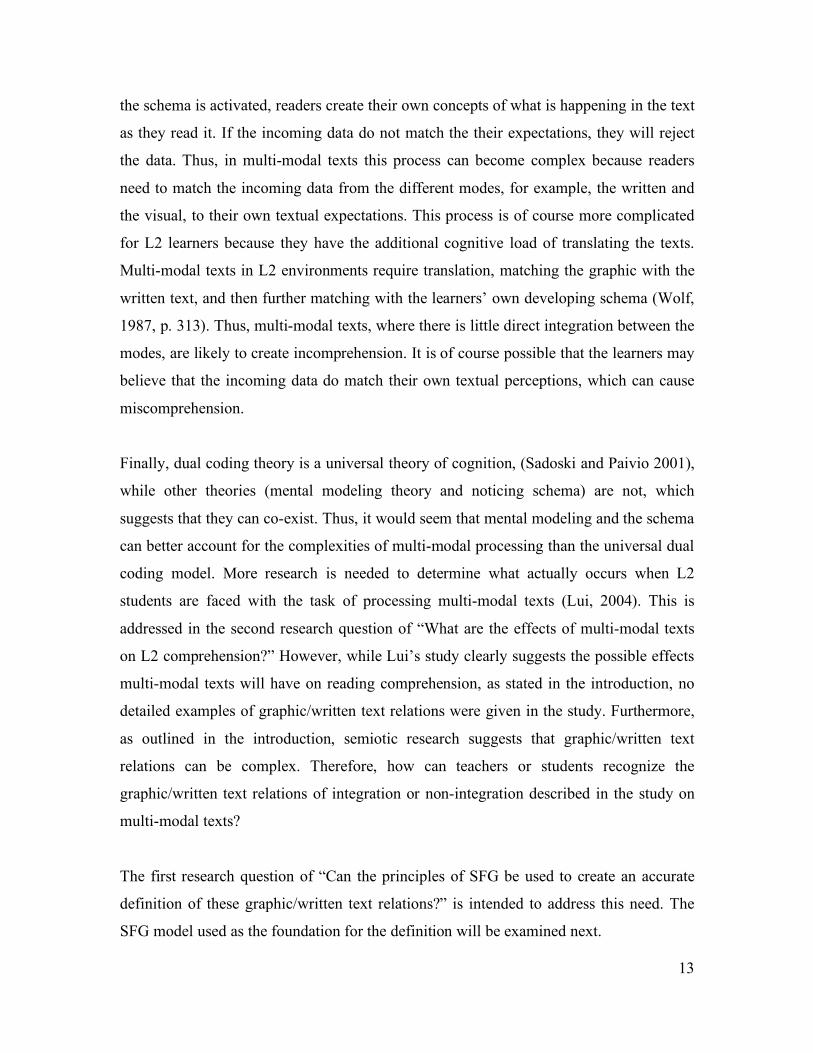
2.3.3.1 Framing
Framing refers to how elements are connected or disconnected through framelines. For
example, in Figure 1 below, the king and his attendants, who are receiving news from the
battlefield, are joined shoulder to shoulder in one frameline, while the wounded soldier,
who is the deliverer of the news, is disconnected from the receivers by the yellow
framing of the tent. The written text is separated from the visual text by framelines.
Thus, the parchment scroll text box, which orientates readers to their place in the play, is
disconnected from the simple text box, which orientates readers to the setting of the
scene. It is significant, for this study, that the image is composed in a way that allows the
written text to repeat the information in visual text. This is the relationship of
16
concurrence, introduced in section 1.4, and it will be examined in more detail in parts 3
and 4.
Figure 1- Framing
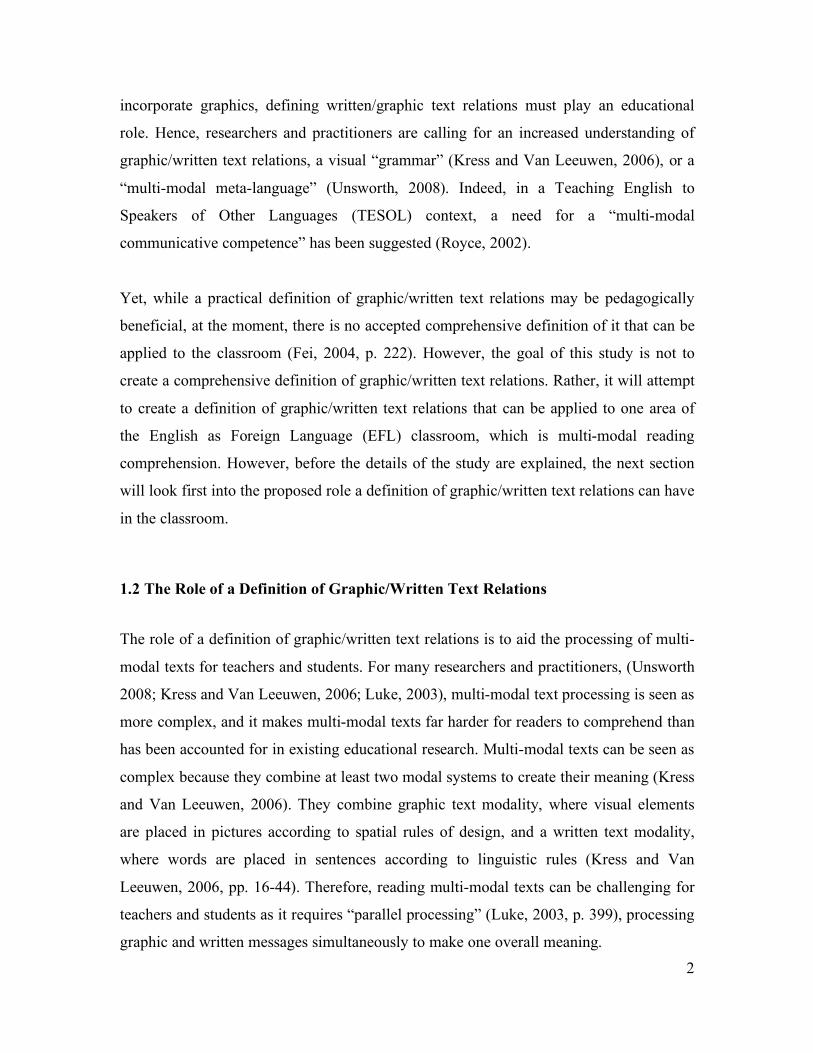
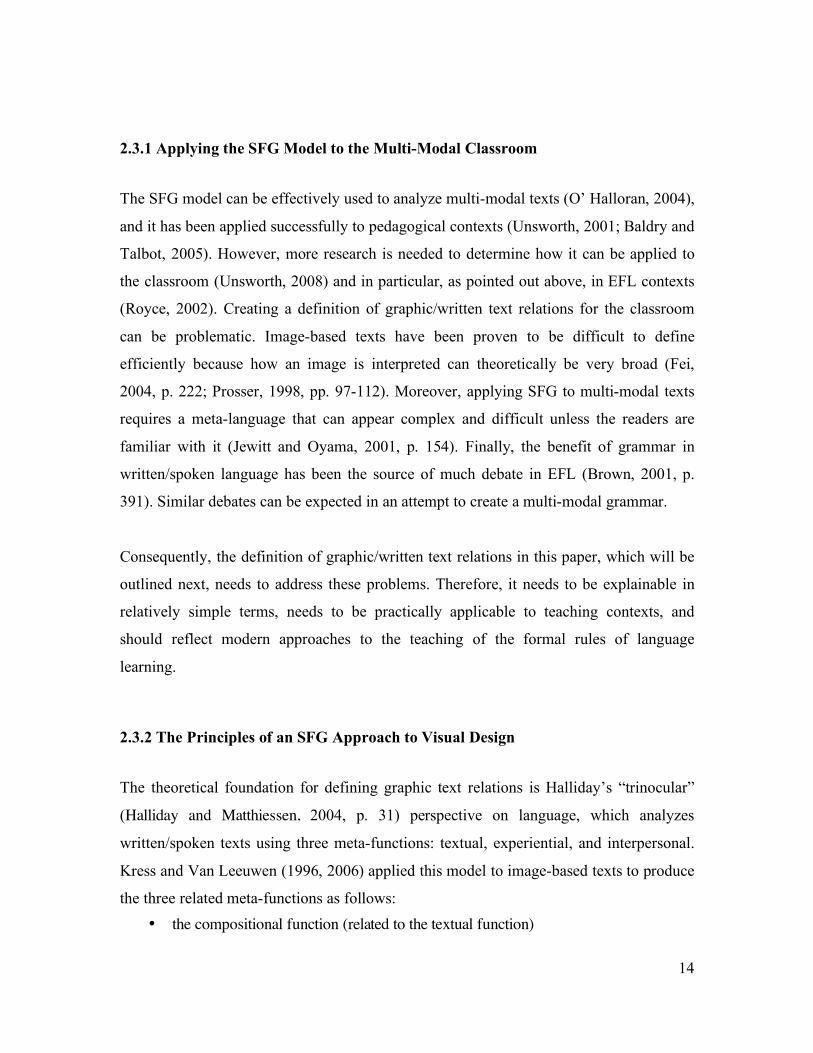
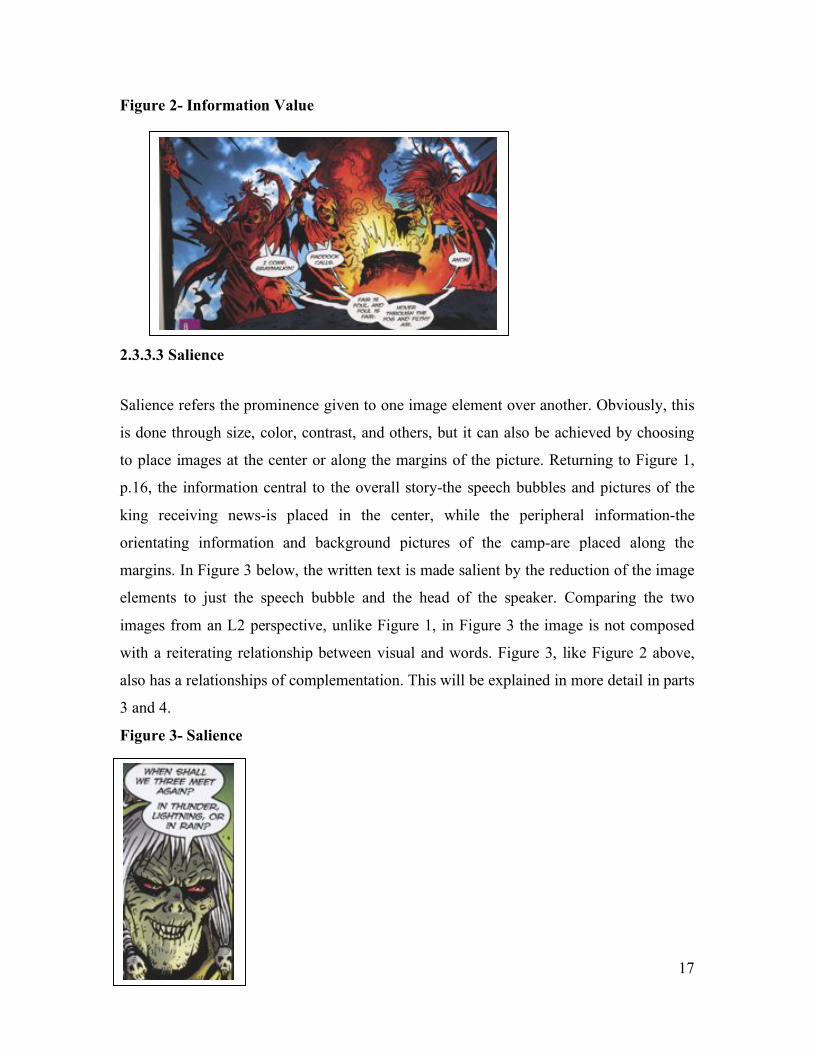
2.3.3.2 Information Value
The decision to place elements on top or at the bottom of an image gives them a certain
value (Jewitt and Oyama, 2001, p. 196). In Figure 2 (below), the placement of information
on top of the picture carries the "ideal" information, which is the more general content of the
message. The placement of information beneath the image carries the "real" information,
more specifically, the practical information (Kress and Van Leeuwen, 2006, pp.186-193).
This meaning potential can be observed historically. In Christian art, for example, religious
paintings depict the "divine" of the sky contrasted with the ground of man. It can also be
observed in day-to-day life. An example is in car advertisements where the "ideal" image of
the car is placed on top while the "real" factual information, which supplies details about the
car, is placed at the bottom (Kress and Van Leeuwen, 2006, pp.186-193).
In Figure 2 below, the image follows the same pattern as the car advertisement described
above, describing a graphic text-based image. Here, the main idea the image is trying to
convey (the "ideal information") is carried in the upper placed graphic text (the picture of
witches engaged in the powerful act of casting a spell), while the lower placed written text
carries the details (the actual words of the spell which are incomprehensible unless you
understand witchcraft). From an L2 perspective this image is not composed in a way that the
graphic text repeats the main idea of the visual text. Rather the modes augment each other.
This is the relationship of complementation, introduced in 1.4, and will be discussed in more
detail in parts 3 and 4.
17
Figure 2- Information Value
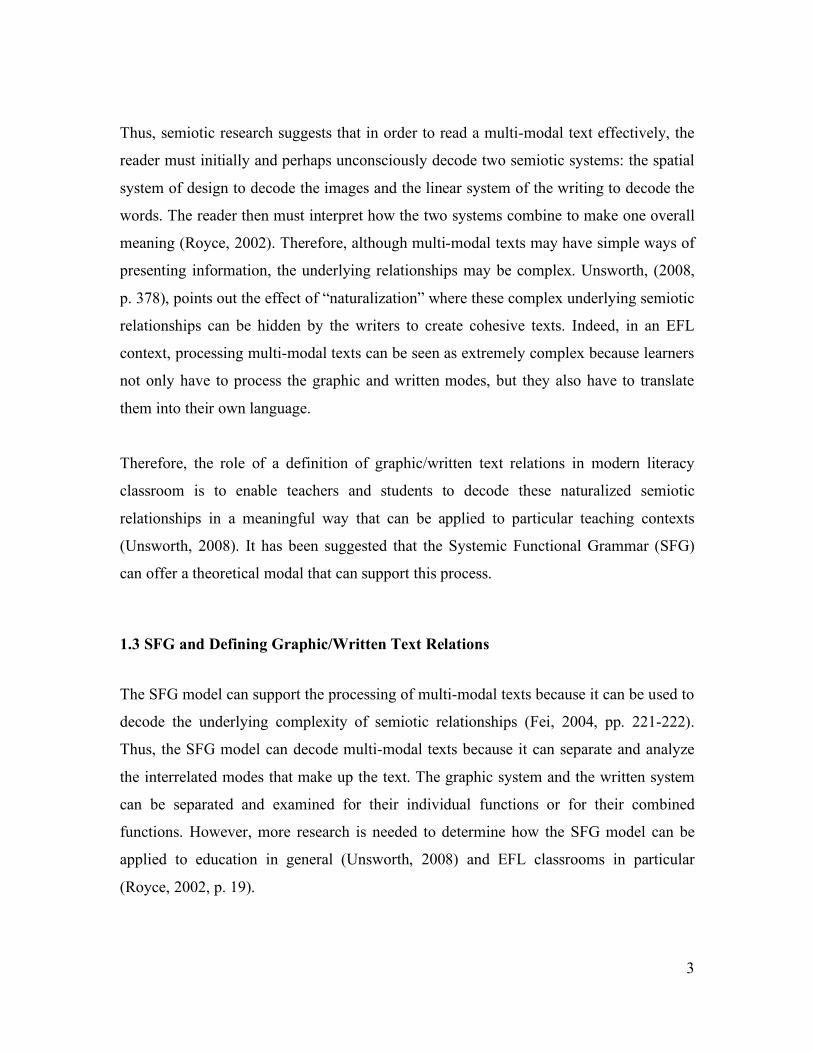
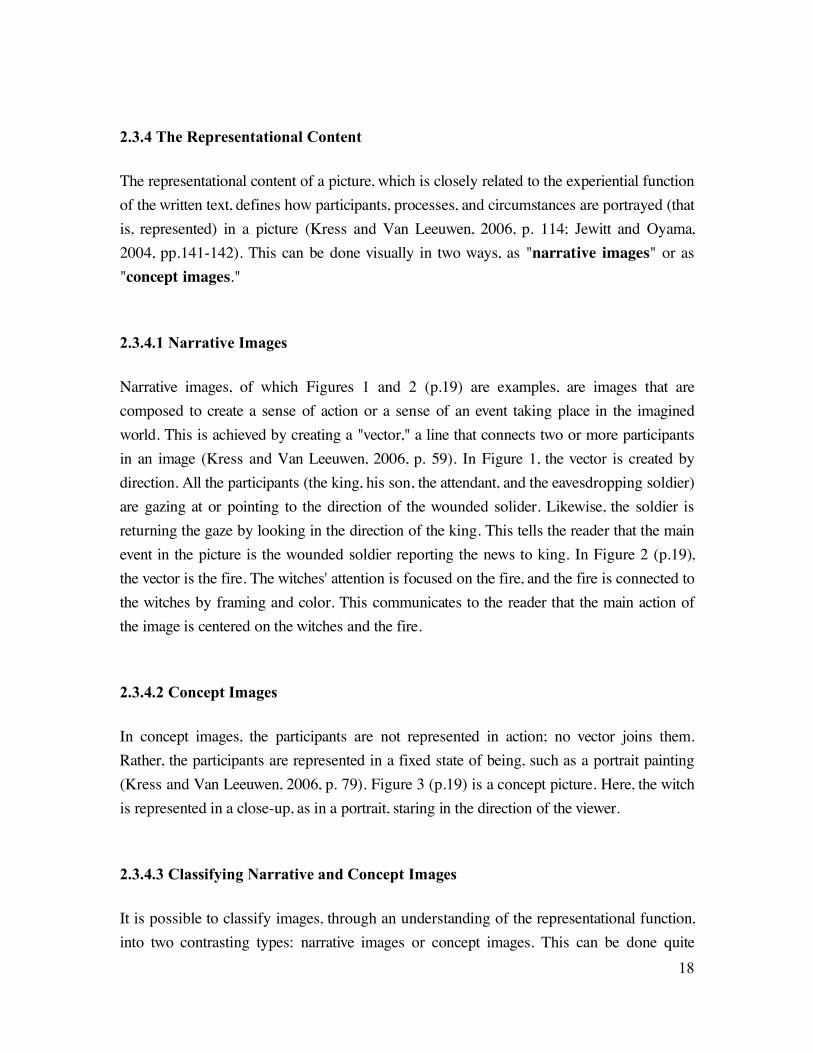
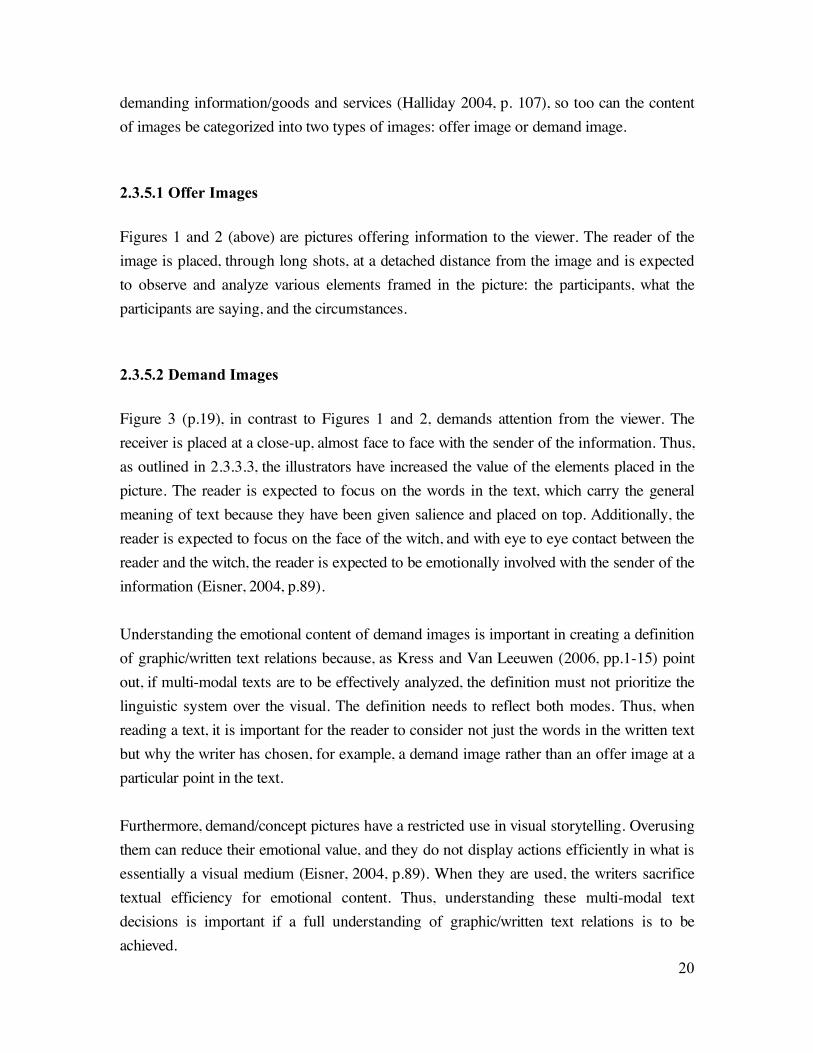
2.3.3.3 Salience
Salience refers the prominence given to one image element over another. Obviously, this
is done through size, color, contrast, and others, but it can also be achieved by choosing
to place images at the center or along the margins of the picture. Returning to Figure 1,
p.16, the information central to the overall story-the speech bubbles and pictures of the
king receiving news-is placed in the center, while the peripheral information-the
orientating information and background pictures of the camp-are placed along the
margins. In Figure 3 below, the written text is made salient by the reduction of the image
elements to just the speech bubble and the head of the speaker. Comparing the two
images from an L2 perspective, unlike Figure 1, in Figure 3 the image is not composed
with a reiterating relationship between visual and words. Figure 3, like Figure 2 above,
also has a relationships of complementation. This will be explained in more detail in parts
3 and 4.
Figure 3- Salience
18
2.3.4 The Representational Content
The representational content of a picture, which is closely related to the experiential function
of the written text, defines how participants, processes, and circumstances are portrayed (that
is, represented) in a picture (Kress and Van Leeuwen, 2006, p. 114; Jewitt and Oyama,
2004, pp.141-142). This can be done visually in two ways, as "narrative images" or as
"concept images."
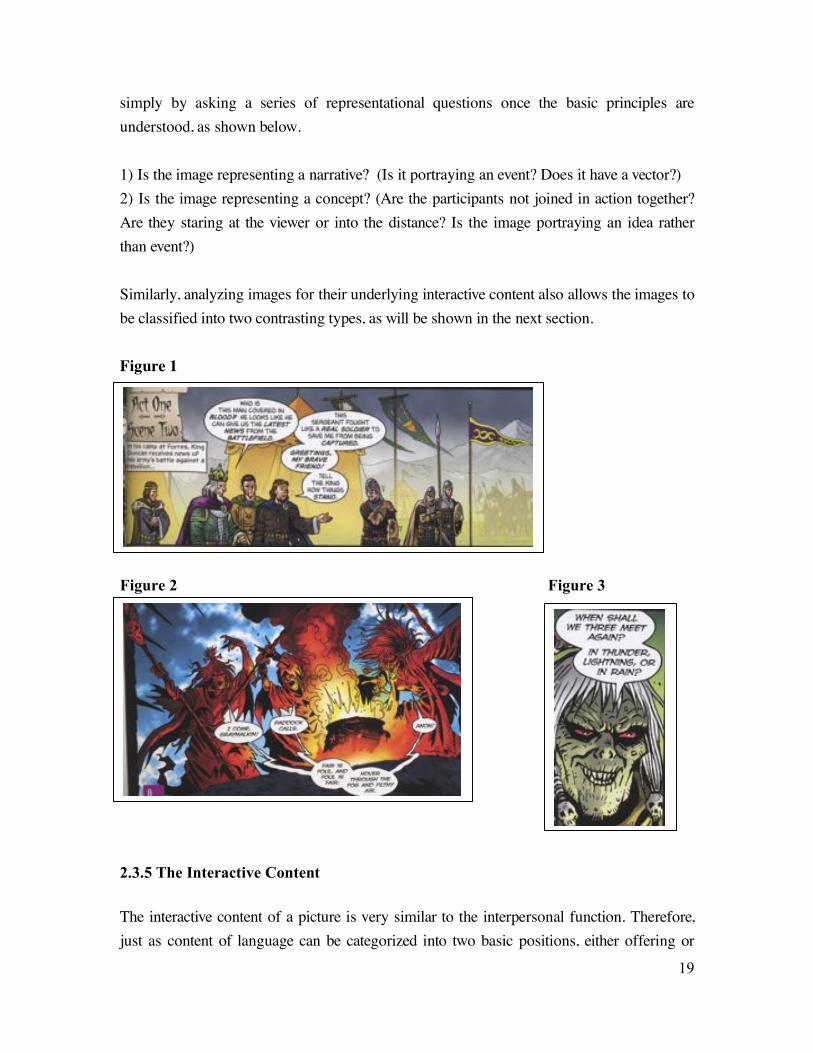
2.3.4.1 Narrative Images
Narrative images, of which Figures 1 and 2 (p.19) are examples, are images that are
composed to create a sense of action or a sense of an event taking place in the imagined
world. This is achieved by creating a "vector," a line that connects two or more participants
in an image (Kress and Van Leeuwen, 2006, p. 59). In Figure 1, the vector is created by
direction. All the participants (the king, his son, the attendant, and the eavesdropping soldier)
are gazing at or pointing to the direction of the wounded solider. Likewise, the soldier is
returning the gaze by looking in the direction of the king. This tells the reader that the main
event in the picture is the wounded soldier reporting the news to king. In Figure 2 (p.19),
the vector is the fire. The witches' attention is focused on the fire, and the fire is connected to
the witches by framing and color. This communicates to the reader that the main action of
the image is centered on the witches and the fire.
2.3.4.2 Concept Images
In concept images, the participants are not represented in action; no vector joins them.
Rather, the participants are represented in a fixed state of being, such as a portrait painting
(Kress and Van Leeuwen, 2006, p. 79). Figure 3 (p.19) is a concept picture. Here, the witch
is represented in a close-up, as in a portrait, staring in the direction of the viewer.
2.3.4.3 Classifying Narrative and Concept Images
It is possible to classify images, through an understanding of the representational function,
into two contrasting types: narrative images or concept images. This can be done quite
19
simply by asking a series of representational questions once the basic principles are
understood, as shown below.
1) Is the image representing a narrative? (Is it portraying an event? Does it have a vector?)
2) Is the image representing a concept? (Are the participants not joined in action together?
Are they staring at the viewer or into the distance? Is the image portraying an idea rather
than event?)
Similarly, analyzing images for their underlying interactive content also allows the images to
be classified into two contrasting types, as will be shown in the next section.
Figure 1
Figure 2 Figure 3
2.3.5 The Interactive Content
The interactive content of a picture is very similar to the interpersonal function. Therefore,
just as content of language can be categorized into two basic positions, either offering or
20
demanding information/goods and services (Halliday 2004, p. 107), so too can the content
of images be categorized into two types of images: offer image or demand image.
2.3.5.1 Offer Images
Figures 1 and 2 (above) are pictures offering information to the viewer. The reader of the
image is placed, through long shots, at a detached distance from the image and is expected
to observe and analyze various elements framed in the picture: the participants, what the
participants are saying, and the circumstances.
2.3.5.2 Demand Images
Figure 3 (p.19), in contrast to Figures 1 and 2, demands attention from the viewer. The
receiver is placed at a close-up, almost face to face with the sender of the information. Thus,
as outlined in 2.3.3.3, the illustrators have increased the value of the elements placed in the
picture. The reader is expected to focus on the words in the text, which carry the general
meaning of text because they have been given salience and placed on top. Additionally, the
reader is expected to focus on the face of the witch, and with eye to eye contact between the
reader and the witch, the reader is expected to be emotionally involved with the sender of the
information (Eisner, 2004, p.89).
Understanding the emotional content of demand images is important in creating a definition
of graphic/written text relations because, as Kress and Van Leeuwen (2006, pp.1-15) point
out, if multi-modal texts are to be effectively analyzed, the definition must not prioritize the
linguistic system over the visual. The definition needs to reflect both modes. Thus, when
reading a text, it is important for the reader to consider not just the words in the written text
but why the writer has chosen, for example, a demand image rather than an offer image at a
particular point in the text.
Furthermore, demand/concept pictures have a restricted use in visual storytelling. Overusing
them can reduce their emotional value, and they do not display actions efficiently in what is
essentially a visual medium (Eisner, 2004, p.89). When they are used, the writers sacrifice
textual efficiency for emotional content. Thus, understanding these multi-modal text
decisions is important if a full understanding of graphic/written text relations is to be
achieved.
21
2.3.5.3 Classifying Offer and Demand Images
Again, it is possible to classify images, through an understanding of the interactive function,
into two types: offer and demand. This can be done quite simply by asking a series of
interactive questions once the basic principles are understood, as shown below.
1) Is the image interacting with the viewer by offering information to the viewer?
2) Is the picture interacting with the viewer by demanding attention from the viewer?
2.3.6 Classifying Images Into Types: Narrative Offer Images and Concept Demand
Images
Kress and Van Leeuwen’s model for visual analysis can be used to classify images into two
contrasting types: narrative offer pictures and concept demand pictures. Figures 1 and 2
(p.19) are narrative offer pictures, wherein the illustrators offer narrative information to the
viewers. On the other hand, Figure 3 (p.19) is a demand concept picture. The illustrators
present an idea, not an action, and they demand an emotional response from the viewer.
Part 3, next, will show how this classification of images into two contrasting types can be
applied to the definitions of graphic/written relations, as outlined by Unsworth (2008),
(introduced p.4, and part 2.3.3). Furthermore, it will relate these semiotic definitions of
graphic/written text relations to the relationships of support, redundancy, incomprehension,
and miscomprehension, (introduced on p. 5 and part 2.2).
22
Part 3 A Definition of Graphic/Written Text Relations that Can Be Used to Support Reading Comprehension
3.1 Introduction
Aligning the definitions of graphic/written text relations in systemics with EFL reading
comprehension research can, this paper asserts, create a model of graphic/written text
relations that can be used to predict the potential effects a text will have on reading
comprehension, which is the goal of the first research question, (p.6-7). This section will
explain the model. Section 2 will examine graphic/written text relations in the narrative offer
panels; Section 3 will examine graphic/written text relations in the demand concept panels;
and Section 4 will summarize the theoretical model.
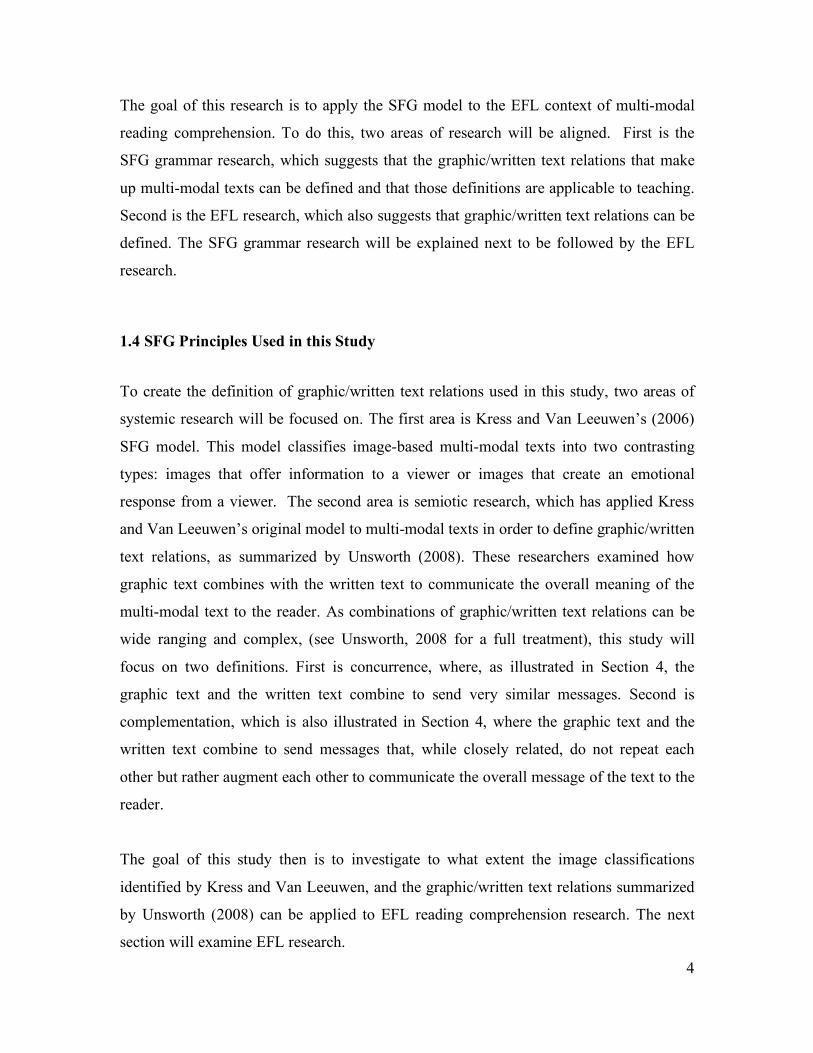
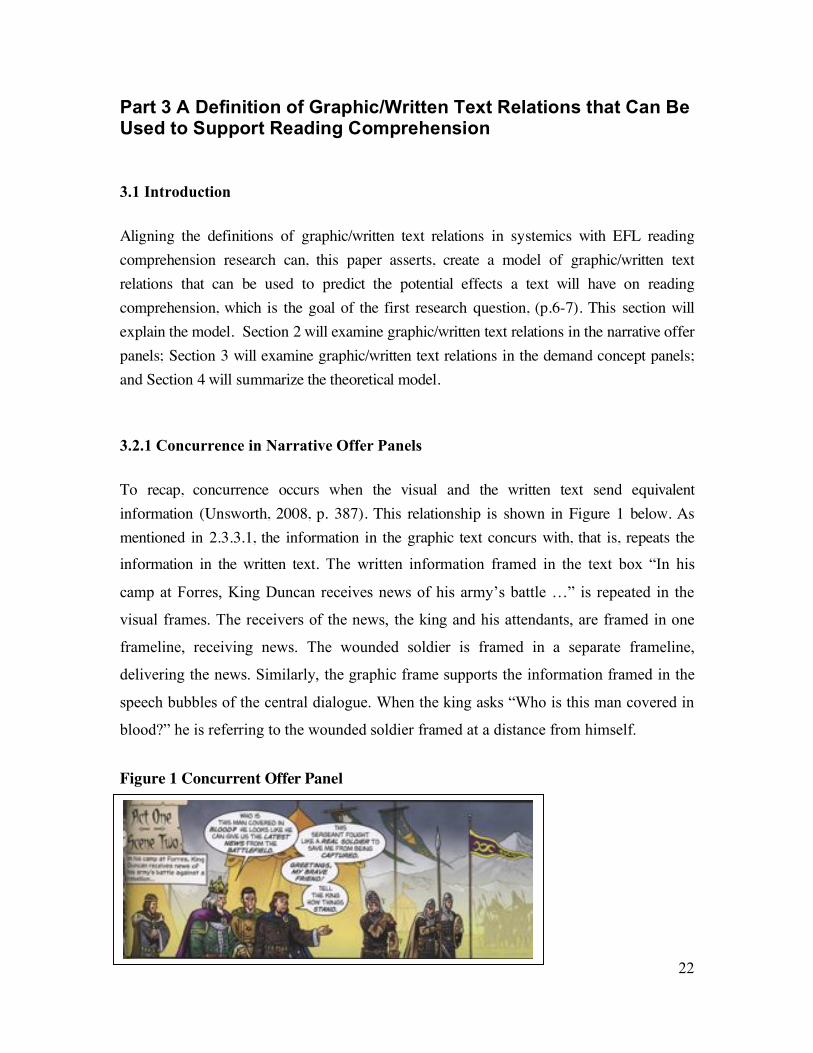
3.2.1 Concurrence in Narrative Offer Panels
To recap, concurrence occurs when the visual and the written text send equivalent
information (Unsworth, 2008, p. 387). This relationship is shown in Figure 1 below. As
mentioned in 2.3.3.1, the information in the graphic text concurs with, that is, repeats the
information in the written text. The written information framed in the text box “In his
camp at Forres, King Duncan receives news of his army’s battle …” is repeated in the
visual frames. The receivers of the news, the king and his attendants, are framed in one
frameline, receiving news. The wounded soldier is framed in a separate frameline,
delivering the news. Similarly, the graphic frame supports the information framed in the
speech bubbles of the central dialogue. When the king asks “Who is this man covered in
blood?” he is referring to the wounded soldier framed at a distance from himself.
Figure 1 Concurrent Offer Panel
23
This type of panel, with a reiteration of the key linguistic items in the visual, is expected
to support reading comprehension (Lui, 2004, p. 237). The graphic text and the written
text compensate each other in making the overall message comprehensible to the reader.
However, while this panel has the potential to support reading comprehension, the images
may also be redundant for L2 learners because they may not need the images to support
the words. For this paper, this type of panel will be called Concurrent Offer Panels
(CCOP).
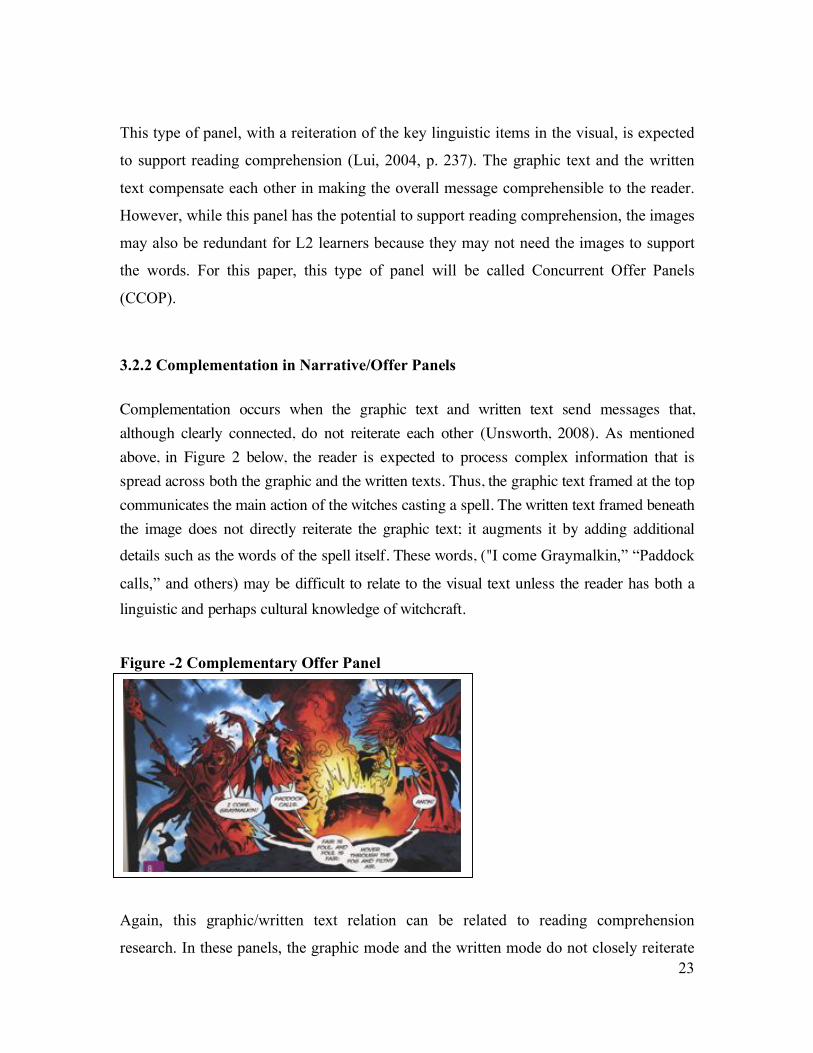
3.2.2 Complementation in Narrative/Offer Panels
Complementation occurs when the graphic text and written text send messages that,
although clearly connected, do not reiterate each other (Unsworth, 2008). As mentioned
above, in Figure 2 below, the reader is expected to process complex information that is
spread across both the graphic and the written texts. Thus, the graphic text framed at the top
communicates the main action of the witches casting a spell. The written text framed beneath
the image does not directly reiterate the graphic text; it augments it by adding additional
details such as the words of the spell itself. These words, ("I come Graymalkin,” “Paddock
calls,” and others) may be difficult to relate to the visual text unless the reader has both a
linguistic and perhaps cultural knowledge of witchcraft.
Figure -2 Complementary Offer Panel
Again, this graphic/written text relation can be related to reading comprehension
research. In these panels, the graphic mode and the written mode do not closely reiterate
24
the same message. Therefore, they are not expected to support reading comprehension
(Lui, 2004, p. 238). Incomprehension or miscomprehension may occur with these types
of panels. For this paper, these panels will be called Complementary Offer Panels.
3.2.3 Complementation vs. Concurrence in Narrative Offer Panels
It can be generalized that there are two kinds of graphic/written text relations in narrative
offer panels: concurrence and complementation. It is important to note that in an authentic
text rather than a teacher created text, the writers are obviously not concerned with using
images to create linguistic support for their readers. Therefore, concurrence in narrative
offer panels is used for textual reasons. Here, perhaps it is used to efficiently set the scene
for the readers at a key orientating point in the text.
From an L2 reading comprehension perspective, this graphic/written text relation in narrative
offer panels cannot be expected to dominate authentic texts. The majority of the texts are
prospective, as they point forward (Moon, 2000, p. 53). Repeating key information in
concurrent relationships creates redundancy in texts (Unsworth, 2008, p. 387). Thus, it is
often used in children’s books where repetition of ideas can be supportive for young
learners. However, it may be of limited use to more mature readers, as readers would
become bored if the story repeated itself all the time. Indeed, complementary offer panels
may be more likely used in graphic narrative texts because they can communicate more
information and move the text forward as well. If concurrent graphic/written text relations
are limited in certain narrative texts, for example, in graphic novels, reading those texts may
be very difficult for L2 students because they cannot rely on the images to repeat the key
linguistic items.
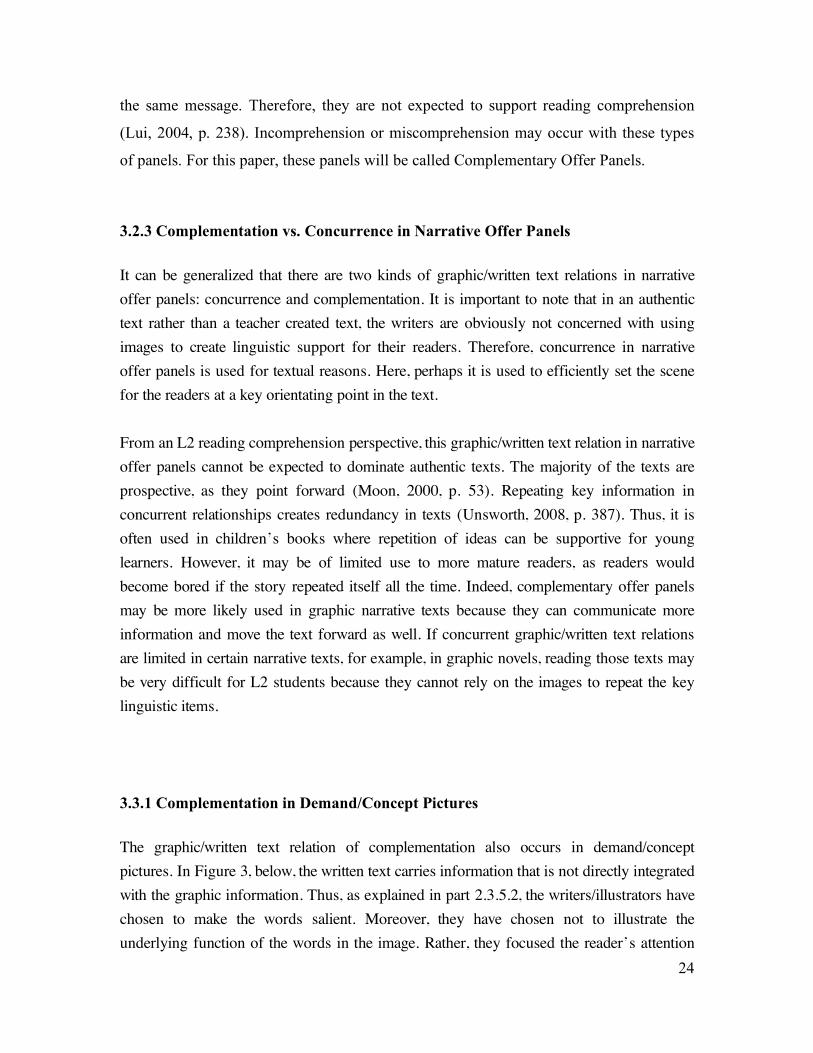
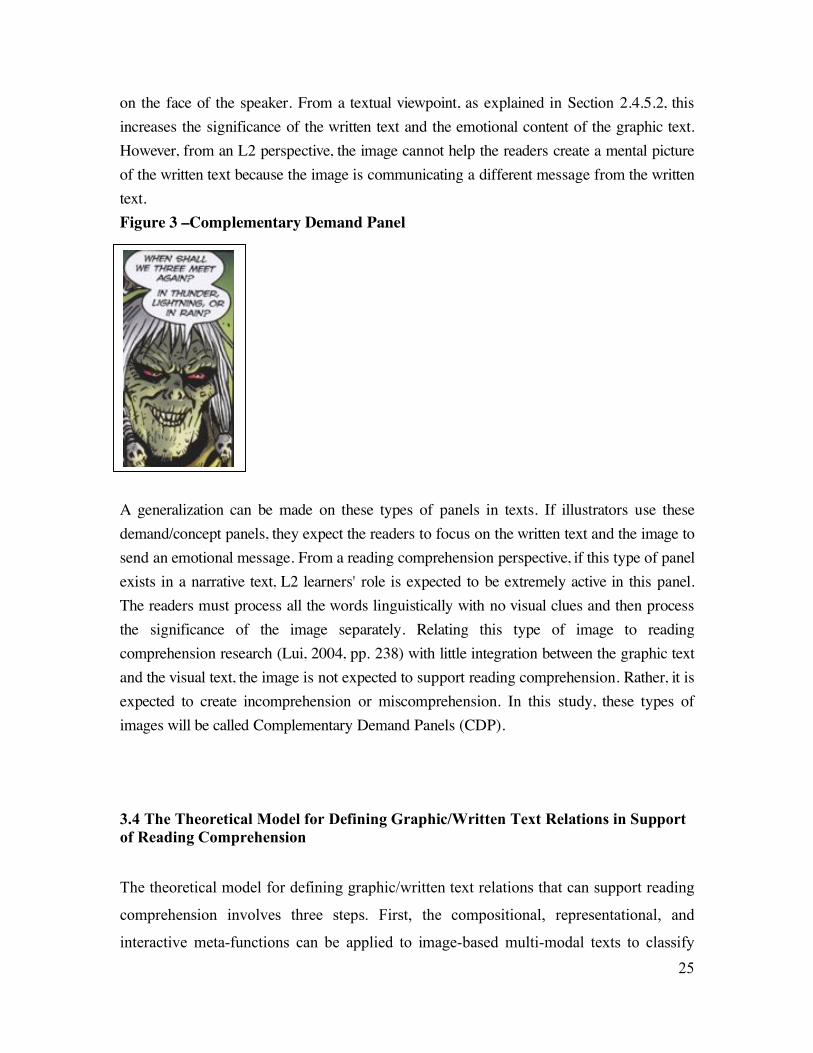
3.3.1 Complementation in Demand/Concept Pictures
The graphic/written text relation of complementation also occurs in demand/concept
pictures. In Figure 3, below, the written text carries information that is not directly integrated
with the graphic information. Thus, as explained in part 2.3.5.2, the writers/illustrators have
chosen to make the words salient. Moreover, they have chosen not to illustrate the
underlying function of the words in the image. Rather, they focused the reader’s attention
25
on the face of the speaker. From a textual viewpoint, as explained in Section 2.4.5.2, this
increases the significance of the written text and the emotional content of the graphic text.
However, from an L2 perspective, the image cannot help the readers create a mental picture
of the written text because the image is communicating a different message from the written
text.
Figure 3 –Complementary Demand Panel
A generalization can be made on these types of panels in texts. If illustrators use these
demand/concept panels, they expect the readers to focus on the written text and the image to
send an emotional message. From a reading comprehension perspective, if this type of panel
exists in a narrative text, L2 learners' role is expected to be extremely active in this panel.
The readers must process all the words linguistically with no visual clues and then process
the significance of the image separately. Relating this type of image to reading
comprehension research (Lui, 2004, pp. 238) with little integration between the graphic text
and the visual text, the image is not expected to support reading comprehension. Rather, it is
expected to create incomprehension or miscomprehension. In this study, these types of
images will be called Complementary Demand Panels (CDP).
3.4 The Theoretical Model for Defining Graphic/Written Text Relations in Support
of Reading Comprehension
The theoretical model for defining graphic/written text relations that can support reading
comprehension involves three steps. First, the compositional, representational, and
interactive meta-functions can be applied to image-based multi-modal texts to classify
26
two types: demand/concept images and narrative/offer images. Second, graphic/written
text relations of concurrence or complementation can be applied to the image types to
subdivide the images into three: Complementary Demand Images, Complementary Offer
Images, and Concurrent Offer Images. Third, the reading comprehension research
findings can be applied to the image classifications to predict their potential effects on
reading comprehension. Thus, complementary demand images and complementary offer
images are not expected to support reading comprehension because the graphic text and
the written text are not closely integrated. Concurrent Offer Images are expected to
support reading comprehension because they are closely integrated.
Theoretically, at least in this reading context, to a large extent it is possible to create a
model of graphic/written text relations that can be used to predict the potential effects a text
will have on reading comprehension, which was goal of research question 1, (pp.6-7). Thus,
the principles of SFG can be used to define graphic written text relations. Moreover, the
definitions of graphic/written text relations can be related to reading comprehension
research to assess student’s potential comprehension. Parts 4, 5 and 6 of this paper will
test the validity of the model in a classroom context. Part 4 will apply the model to an
authentic text, “Macbeth: The Graphic Novel” (McDonald et al., 2008), to analyze the
texts underlying graphic/written text relations and predict their potential effects on
reading comprehension. Part 5 will explain the methodology used to test those
predictions in the classroom. Part 6 will discuss the findings.
27
Part 4 Defining the Graphic/Written Text Relations in the Macbeth Text
4.1 Introduction
Part 4 will analyze an authentic text (a text not produced for the TESOL classroom)
excerpt, “Macbeth: The Graphic Novel’s” (McDonald et al., 2008) Act 1 scenes 1 and
2(shown in Appendix 1), for its graphic/written text relations and their effects on reading
comprehension. Section 2 will classify the text into narrative offer or demand/concept
images. Section 3 will examine the graphic/written text relations in the images.
Furthermore, it will use those definitions to predict the effects the images have on reading
comprehension. Section 4 will summarize the findings. To test the validity of the findings
in the classroom, the images will be re-classified as information units, which will be
explained in Section 5. Finally, after applying the theoretical model to Macbeth, the
original research hypothesis, as outlined in 1.7, can be restated. This restatement will be
discussed in Section 6, which outlines the predicted effects each image will have on
students reading comprehension.
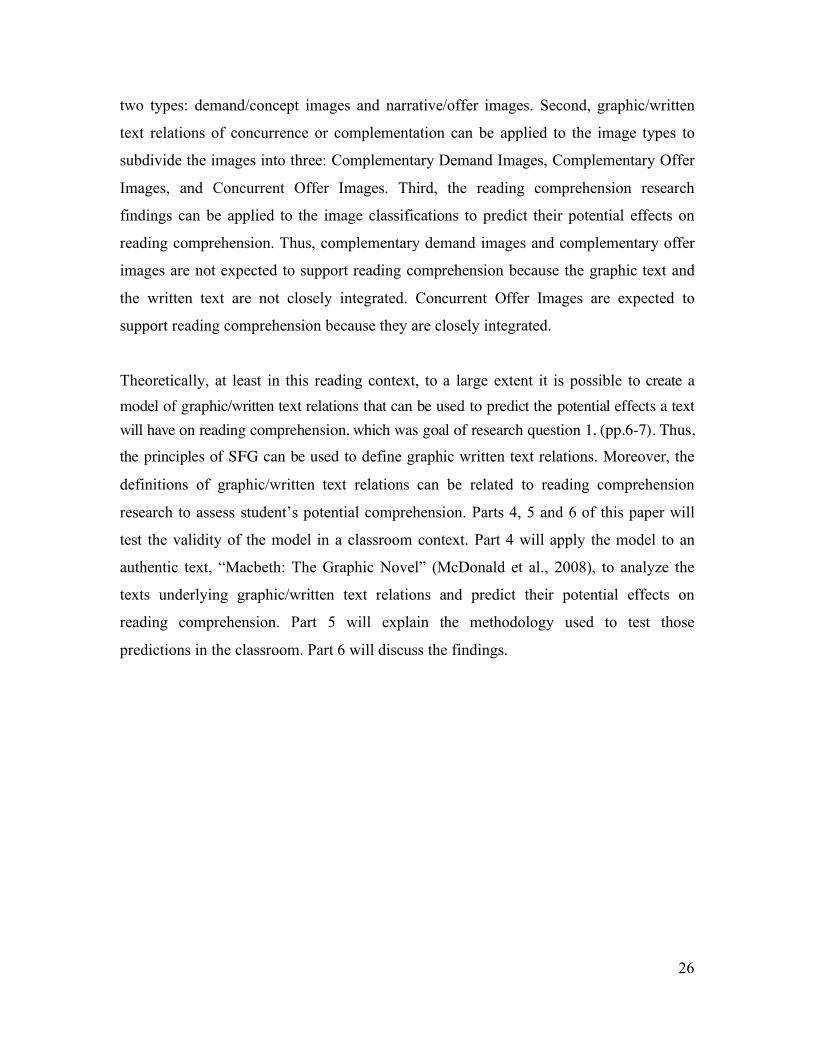
4.2 Determining Panel Types in the Macbeth Text
Applying the compositional, representational and interactive functions to the Macbeth text,
using the system of question (summarized in Table 2p.28) classified the 10 panels into two
types: Narrative Offer Panels and Concept Demand Panels (summarized in Table 1 p.28).
As shown in the table, the majority of the panels are narrative offer panels, while concept
demand panels constitute only 3 of the 10 panels.
Having determined the image types, Section 3 will show how the image types are analyzed
for their underlying graphic/written text relations and how those relations may potentially
affect reading comprehension.
28
Table 1. Image Types in the Macbeth Text
Image Type 1 Image Type 2
Narrative/
Offer
Concept/
Demand
Panels 1,5,6,7,
8,9,10
Panels 2,3,4
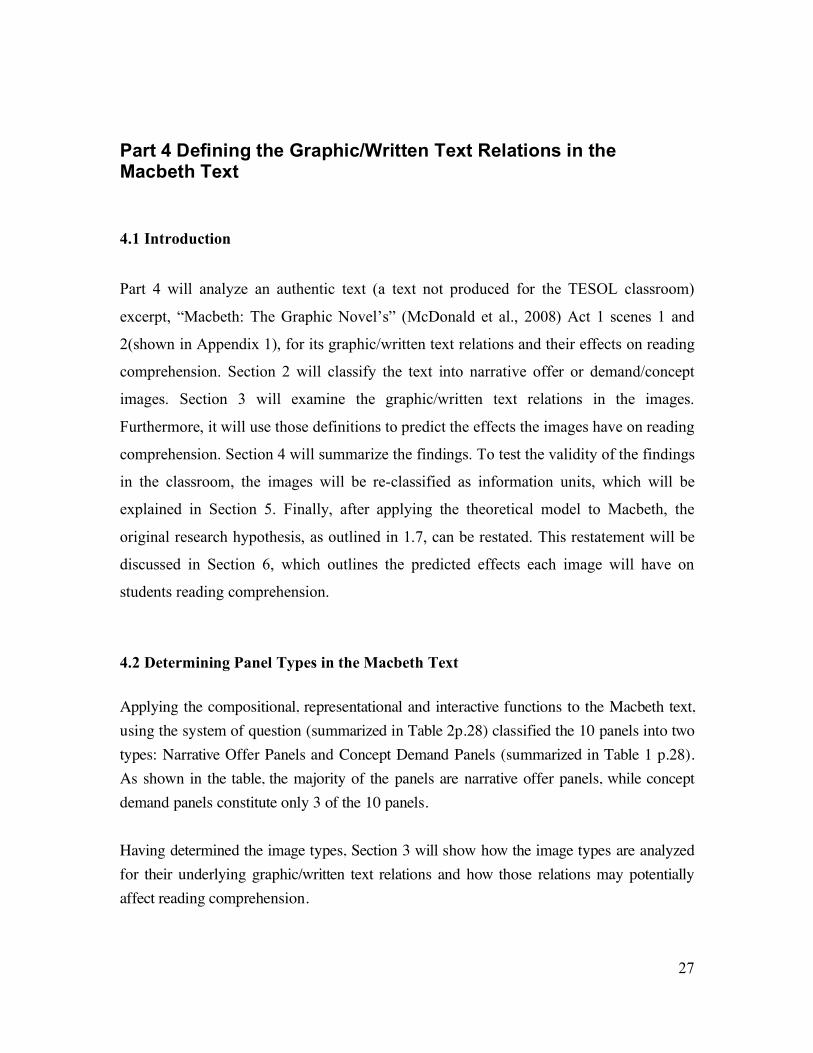
Table 2. Determining Image Functions in Texts
The Representational Function The Interactive Function
What is the image representing? What is the image asking the
reader to do ? Is the image representing a narrative? Is the image offering information
to the viewer? Is the image representing a concept? Is the image demanding attention
from the viewer?
4.3.1 Concurrent Offer Panels
Concurrence occurs in Panel 7 below (p.29), as explained in 3.2.1 as Figure 1, where the
information in the graphic text concurs with, that is, repeats the information in the written
text. Panel 1 (p.29) also shows a strong relationship of concurrence because the image
clearly depicts the words in the written text, which is the description of the location.
Therefore, as stated in part 3, both these images are expected to support reading
comprehension. However, the images in the text may also be redundant from an L2
perspective if students do not need the words to understand the images.
29
Concurrent Offer Panel 1
Concurrent Offer Panel 7
4.3.2 Complementary Offer Panels
Panels 5, 6, 7, 8, and 9 show complimentary processing relationships because the graphic
mode does not repeat the information in the written mode. The reader is expected to
process complex information that is spread across both the graphic and the written texts.
Thus, in Panel 5 (p.30), the words framed on top point cataphoricly to a later meeting with
Macbeth, while the image is of an event happening now (three witches talking-spell casting-
around the fire). Panel 6 (p.30), as explained in 3.2.2, is an image dominant text, where the
most salient information is carried in the visual act of the witches casting a spell.
30
Complimentary Offer Panels
Panel 5 Panel 6
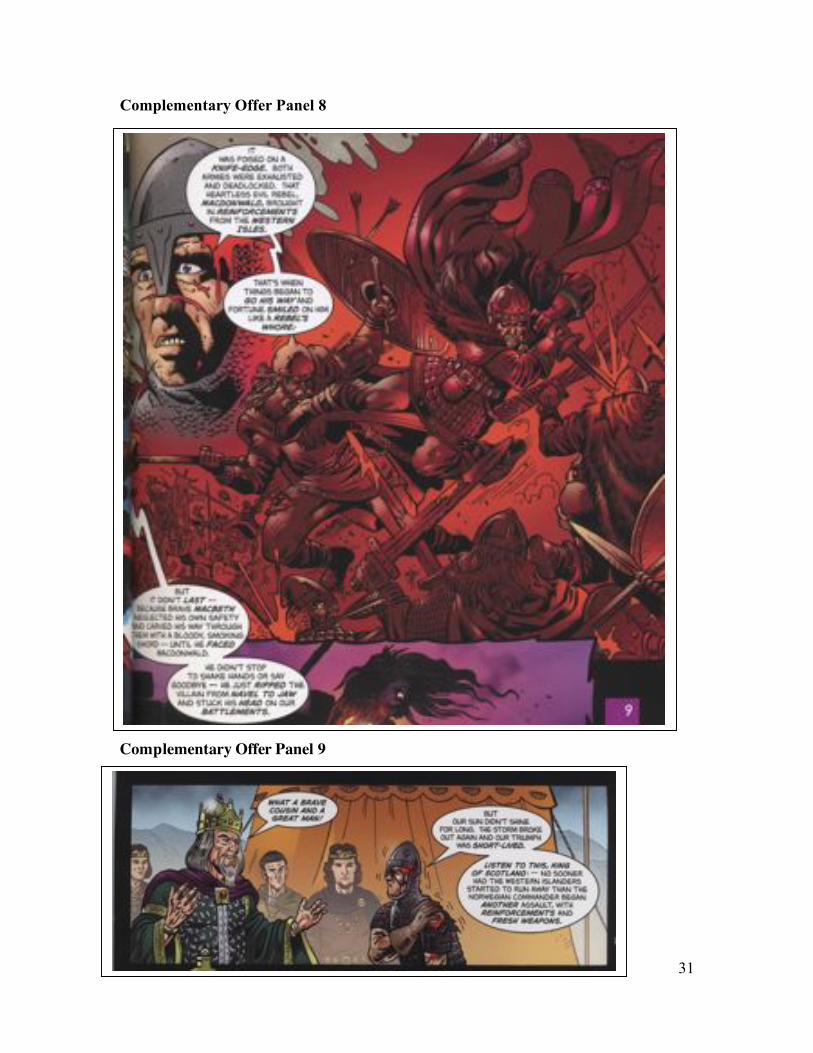
In Panels 8, 9, and 10(p.31-32), the details of the battle are lexically communicated by
the wounded soldier’s reports, while the images convey other meanings connected to
those details. In Panel 7, the image is concerned with expressing the bloody mood of the
battle in general and the battle’s bloody outcome (the decapitation of Macdonwald
framed at the bottom). In Panels 8 and 9, the images convey the king’s reaction to the
soldier’s report.
Again, in relating this graphic/written text relation to reading comprehension research,
the graphic mode and the written mode in these panels are not closely integrated, and
therefore they would not be expected to support reading comprehension (Lui, 2004, p.
238). Moreover, miscomprehension may occur in these panels.
31
Complementary Offer Panel 8
Complementary Offer Panel 9
32
Complementary Offer Panel 10
4.3.3 Complementary Demand Panels
Panels 2, 3, and 4 (below) show complementary graphic/written text relationships. All three
panels show the same graphic/written text relation; the written text is not reiterated in the
graphic text, and readers are expected to process both the words and the meaning of the
visual simultaneously.
Complimentary Demand Panels 2,3, 4
anels 2 3 4
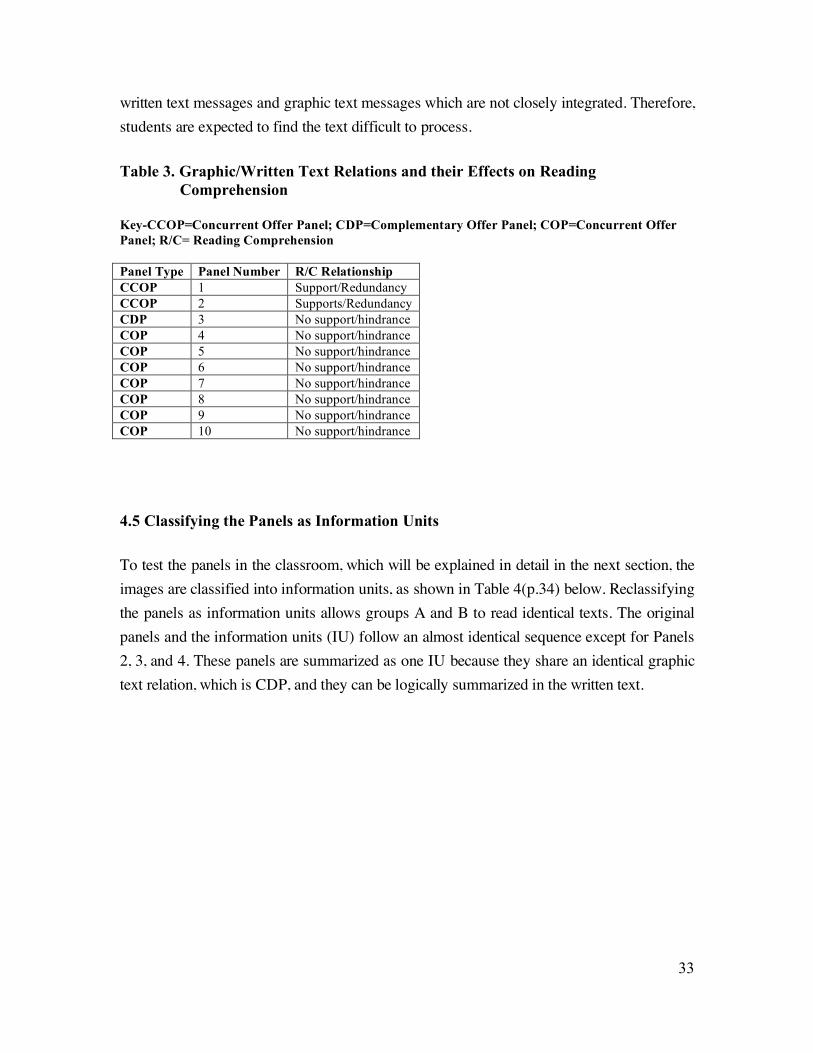
4.4 The Predicted Effects of Graphic/Text Relations on Reading Comprehension
The results of the analysis of the Macbeth text for its underlying graphic/written text
relations and their potential effects on reading comprehension are shown in Table 3 (p.33).
Only two panels, 1 and 7, show the graphic/written text relation of concurrence expected to
support reading comprehension. The other images ask the reader to process complimentary
33
written text messages and graphic text messages which are not closely integrated. Therefore,
students are expected to find the text difficult to process.
Table 3. Graphic/Written Text Relations and their Effects on Reading
Comprehension
Key-CCOP=Concurrent Offer Panel; CDP=Complementary Offer Panel; COP=Concurrent Offer
Panel; R/C= Reading Comprehension
Panel Type Panel Number R/C Relationship
CCOP 1 Support/Redundancy
CCOP 2 Supports/Redundancy
CDP 3 No support/hindrance
COP 4 No support/hindrance
COP 5 No support/hindrance
COP 6 No support/hindrance
COP 7 No support/hindrance
COP 8 No support/hindrance
COP 9 No support/hindrance
COP 10 No support/hindrance
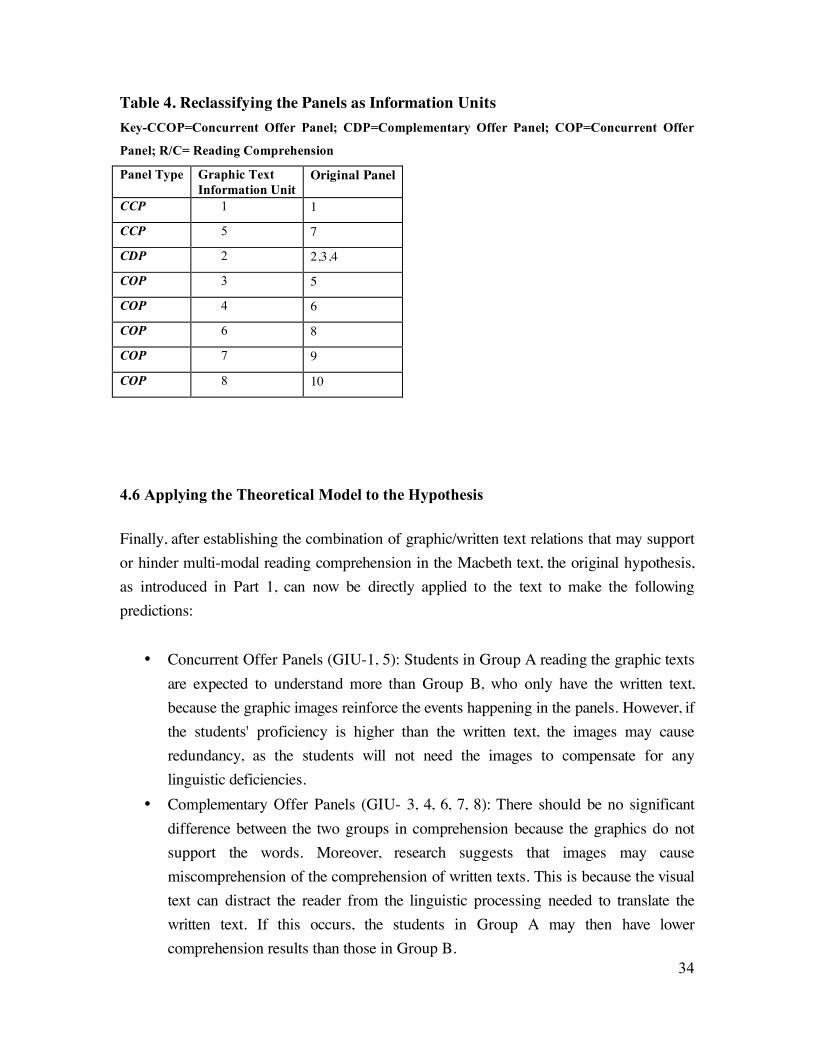
4.5 Classifying the Panels as Information Units
To test the panels in the classroom, which will be explained in detail in the next section, the
images are classified into information units, as shown in Table 4(p.34) below. Reclassifying
the panels as information units allows groups A and B to read identical texts. The original
panels and the information units (IU) follow an almost identical sequence except for Panels
2, 3, and 4. These panels are summarized as one IU because they share an identical graphic
text relation, which is CDP, and they can be logically summarized in the written text.
34
Table 4. Reclassifying the Panels as Information Units
Key-CCOP=Concurrent Offer Panel; CDP=Complementary Offer Panel; COP=Concurrent Offer
Panel; R/C= Reading Comprehension
Panel Type Graphic Text
Information Unit Original Panel
CCP 1 1
CCP 5 7
CDP 2 2,3,4
COP 3 5
COP 4 6
COP 6 8
COP 7 9
COP 8 10
4.6 Applying the Theoretical Model to the Hypothesis
Finally, after establishing the combination of graphic/written text relations that may support
or hinder multi-modal reading comprehension in the Macbeth text, the original hypothesis,
as introduced in Part 1, can now be directly applied to the text to make the following
predictions:
• Concurrent Offer Panels (GIU-1, 5): Students in Group A reading the graphic texts
are expected to understand more than Group B, who only have the written text,
because the graphic images reinforce the events happening in the panels. However, if
the students' proficiency is higher than the written text, the images may cause
redundancy, as the students will not need the images to compensate for any
linguistic deficiencies.
• Complementary Offer Panels (GIU- 3, 4, 6, 7, 8): There should be no significant
difference between the two groups in comprehension because the graphics do not
support the words. Moreover, research suggests that images may cause
miscomprehension of the comprehension of written texts. This is because the visual
text can distract the reader from the linguistic processing needed to translate the
written text. If this occurs, the students in Group A may then have lower
comprehension results than those in Group B.

35
• Complimentary Demand Panels (GIU-2): The graphic text does not support the
written text; thus, there should be no expected difference in comprehension
between the two groups. Again miscomprehension may occur.
36
Part 5 Methodology
5.1 Introduction
The classroom research was based on Lui’s 2004 study which focused on testing a
teacher-created comic strip with a large group of students at different proficiency levels.
Lui recommended that future research should be based on smaller classroom-based
studies using different genres and different research instruments (Lui, 2004, pp.239). The
goal of this current research is to repeat Lui’s study using an authentic graphic text in a
classroom situation with a modified research instrument. Section 2 will explain the
participants, Section 3 the data-collection, Section 4 the procedures, and Section 5 the
piloting of the study.
5.2 Participants
The participants were intermediate Japanese university students aged between 18 and 22
years. Their level was decided by a university placement test taken during their first
year, and all the students had followed the same compulsory first year English program.
As second year students, they studied an elective English program. The students were all
members of my authentic reading class and had all been introduced to a variety of
authentic texts
5.3.1 Data Collection
Data collection was based on immediate recall protocols (IRPs) used in Lui’s 2004 study.
IRPs offer advantages over other methods (e.g., comprehension questions, true/false
questions, etc.) because they avoid the problem of “interrelatedness” (Bernhardt, 1983,
pp.27-28). Interrelatedness refers to how the information in a research instrument repeats
37
key information from the passage and, therefore, gives extra linguistic clues. For
example, in a comprehension question, skilled readers can relate key words in the
question to key words in the passage, a common test-taking strategy. In this type of study,
which measures the effects of visual information compared to linguistic information,
these key words may have given extra linguistic clues to the readers.
5.3.2 Modifying Immediate Recall Protocols
Immediate recall protocols were modified for this experiment. The goal of this study is to
measure the effect graphic/written text relations had on reading comprehension in nine
different panels. Therefore, it was important to measure the effect of the graphic/written
text relation at each stage of the reading process (e.g., panel 1, panel 2, etc.). However,
immediate recall protocols are traditionally used to measure comprehension after students
have read the whole text. In Lui’s study, for example, students were given one written
text with a comic script and asked to recall key events from the whole passage after they
had read it. However, in this study, asking students to recall nine panels, essentially nine
different texts, would, it was felt, overwhelm the students and not give insights into the
effect the graphic/written text relation was having on reading comprehension in each
panel. Therefore, in this study, students were asked to summarize in writing the nine texts
separately, as they read them.
Moreover, IRPs traditionally summarize the key textual information into units and then
assigns a numerical rank to each piece of information, for instance, 1 for the least
significant information, 4 for the most significant (Bernhardt, 1983, Lui, 2004, pp. 234).
However, again, the goal of this research is to find the effects graphic/written text
relations were having on each stage of the reading process. Creating overall numerical
ranking scores would not, it was felt, give detailed insights into the effects each
graphic/written text relation was having in each panel. Therefore, students were asked to
write their responses and the rater (1 rater, the writer) read each response individually.
Reading the responses individually allowed both quantitative and qualitative data to be
collected.
38
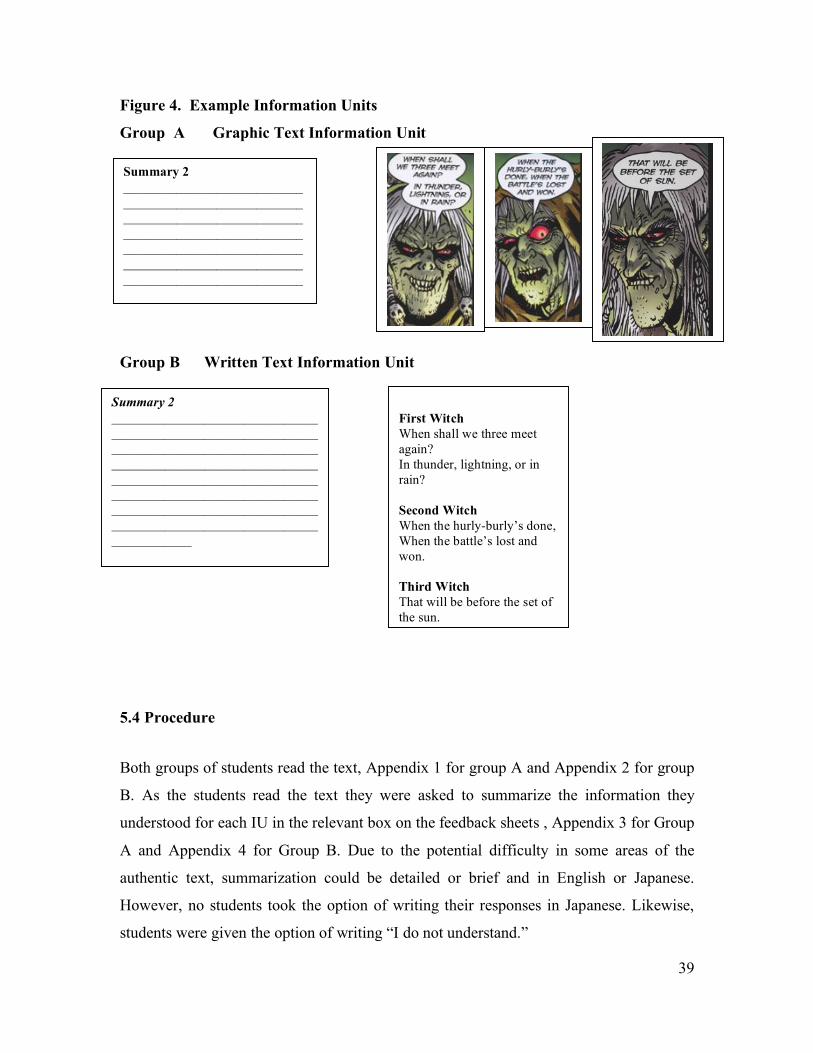
The quantitative data compared how many students understood the “gist” of what was
happening in each panel. A score of understanding the gist was given if the students
could summarize the basic function of each text. For example, in Fig. 4 below, a
student’s response of “The witches are talking about meeting Macbeth later” would be
given a score of understanding the gist. Giving an overall rating for general gist in this
way would allow the difference in the comprehension of the nine panels to be compared
numerically. The qualitative data examined the student’s responses for details that the
numerical scores might not indicate. For example, in Fig. 4, qualitative data could
ascertain whether or not the students confined themselves to explaining the linguistic
text, the visual texts, or both.
5.3.3 Student Feedback Sheets
Student feedback sheets were created to collect the data (see example p.39 and in
Appendices 3 and 4). The feedback sheets divided the texts into a series of Information
Units: Graphic Text Information Units (GIU) for group A based on comic book panels
and Written Text Information Units (WIU) for group B. The sheets were divided into
IUs’ rather than panels or chunks of written text to ensure both groups of students had
identical written information at each stage of the summary process.
39
Figure 4. Example Information Units
Group A Graphic Text Information Unit
Group B Written Text Information Unit
5.4 Procedure
Both groups of students read the text, Appendix 1 for group A and Appendix 2 for group
B. As the students read the text they were asked to summarize the information they
understood for each IU in the relevant box on the feedback sheets , Appendix 3 for Group
A and Appendix 4 for Group B. Due to the potential difficulty in some areas of the
authentic text, summarization could be detailed or brief and in English or Japanese.
However, no students took the option of writing their responses in Japanese. Likewise,
students were given the option of writing “I do not understand.”
Summary 2
_______________________________
_______________________________
_______________________________
_______________________________
_______________________________
_______________________________
_______________________________
_______________________________
____________
First Witch
When shall we three meet
again?
In thunder, lightning, or in
rain?
Second Witch
When the hurly-burly’s done,
When the battle’s lost and
won.
Third Witch
That will be before the set of
the sun.
Summary 2
___________________________
___________________________
___________________________
___________________________
___________________________
___________________________
___________________________
___________________________
___________________________
___________________________
___________________________
___________________________
___________________________
___________________________
___________________________
___________________________
____
40
5.5 Piloting the Study
The study was piloted on 12 intermediate Japanese university students aged 18-22. The
research instruments were shown to be effective with minor modifications to the layout
of the feedback sheets.
41
Part 6 Results and Discussion
6.1 Introduction
This chapter has 5 sections. Section 2 will summarize the quantitative results using
Tables 5(p.42), 6(p.42), and 7(p.43). Sections 3, 4 and 5 will discuss the quantitative and
qualitative results in detail. Thus, section 3 will discuss complementary offer panels;
section 4 complementary demand panels; section 5 concurrent offer panels.
6.2 Results
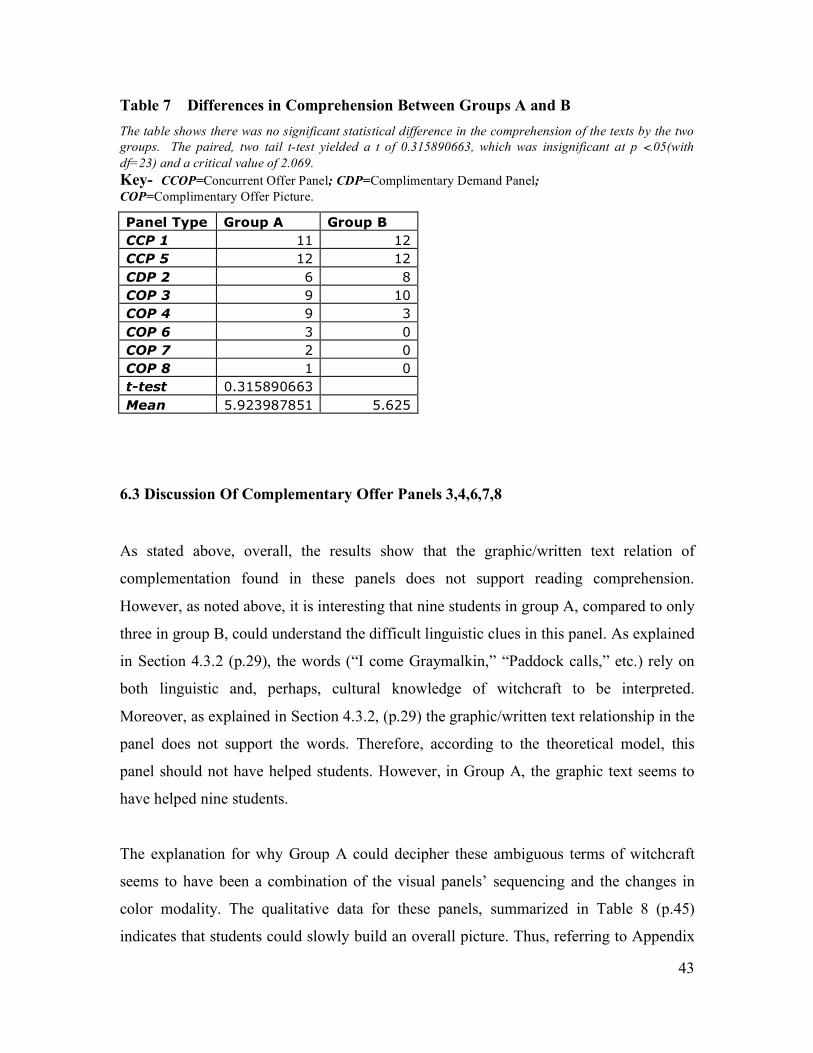
The results for the t-test (see Table 7p.43) show that there was no significant statistical
difference in reading comprehension between the two groups. As predicted in the
theoretical model of graphic/written text relations, Complementary Demand Panels
(Table 5/6: CDP 2, Group A=6, Group B=8) did not support reading comprehension for
Group A. In fact, it is interesting to note that fewer students understood the text in Group
A than in Group B. Similarly, Complementary Offer Panels (COP) did not support
reading comprehension. COP 6 (Table 5/6: Group A=3, Group B=O), COP 7 (Table 5/6:
Group A=2, Group B=0), and COP 8 (Table 5/6: Group A=1, Group B=0) show no
support. However, the results for Complementary Offer Picture 4 (Table 5/6: Group A=9,
Group B=3), although not statistically significant, are interesting because despite the
predicted effect of incomprehension or miscomprehension, nine students were able to
understand the text in group A with only three understanding it in Group B (see Table
5/6). This will be examined in more detail in the qualitative data. Overall, this supports
the hypothesis proposed in Section 1.7, which states that complementary graphic/written
text relations will not support reading comprehension.
In Concurrent Offer Panels, again, there was no significant difference between the two
groups (Table 5/6: CCOP 1, Group A=11, Group B=12, CCOP 5, Group A=12, Group
B= 12). However, these results cannot provide insights into the level of support offered
by concurrent graphic/written text relations. In both groups, students’ comprehension was
high. This suggests that their proficiency level was not below the level of the written text.
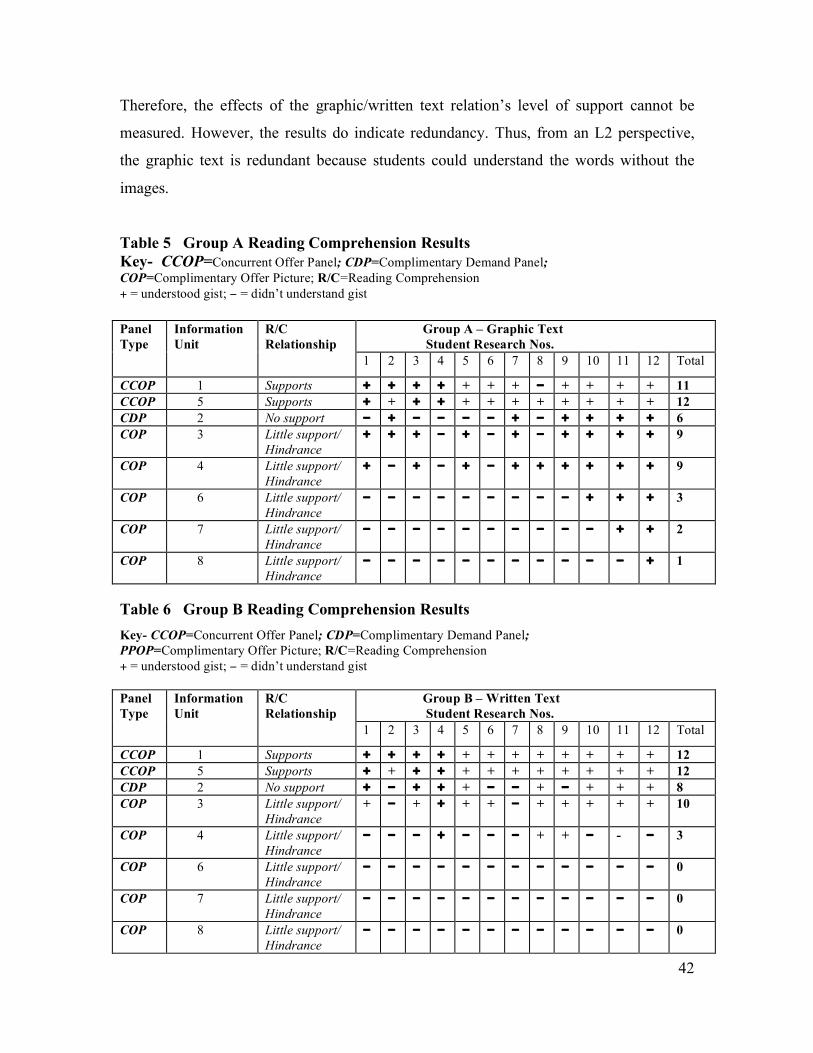
42
Therefore, the effects of the graphic/written text relation’s level of support cannot be
measured. However, the results do indicate redundancy. Thus, from an L2 perspective,
the graphic text is redundant because students could understand the words without the
images.
Table 5 Group A Reading Comprehension Results
Key- CCOP=Concurrent Offer Panel; CDP=Complimentary Demand Panel;
COP=Complimentary Offer Picture; R/C=Reading Comprehension
+ = understood gist; ! = didn’t understand gist
Group A – Graphic Text
Student Research Nos.
Panel
Type
Information
Unit
R/C
Relationship
1 2 3 4 5 6 7 8 9 10 11 12 Total
CCOP 1 Supports + + + + + + + ! + + + + 11
CCOP 5 Supports + + + + + + + + + + + + 12
CDP 2 No support ! + ! ! ! ! + ! + + + + 6
COP 3 Little support/
Hindrance
+ + + ! + ! + ! + + + + 9
COP 4 Little support/
Hindrance
+ ! + ! + ! + + + + + + 9
COP 6 Little support/
Hindrance
! ! ! ! ! ! ! ! ! + + + 3
COP 7 Little support/
Hindrance
! ! ! ! ! ! ! ! ! ! + + 2
COP 8 Little support/
Hindrance
! ! ! ! ! ! ! ! ! ! ! + 1
Table 6 Group B Reading Comprehension Results
Key- CCOP=Concurrent Offer Panel; CDP=Complimentary Demand Panel;
PPOP=Complimentary Offer Picture; R/C=Reading Comprehension
+ = understood gist; ! = didn’t understand gist
Group B – Written Text
Student Research Nos.
Panel
Type
Information
Unit
R/C
Relationship
1 2 3 4 5 6 7 8 9 10 11 12 Total
CCOP 1 Supports + + + + + + + + + + + + 12
CCOP 5 Supports + + + + + + + + + + + + 12
CDP 2 No support + ! + + + ! ! + ! + + + 8
COP 3 Little support/
Hindrance
+ ! + + + + ! + + + + + 10
COP 4 Little support/
Hindrance
! ! ! + ! ! ! + + ! - ! 3
COP 6 Little support/
Hindrance
! ! ! ! ! ! ! ! ! ! ! ! 0
COP 7 Little support/
Hindrance
! ! ! ! ! ! ! ! ! ! ! ! 0
COP 8 Little support/
Hindrance
! ! ! ! ! ! ! ! ! ! ! ! 0
43
Table 7 Differences in Comprehension Between Groups A and B
The table shows there was no significant statistical difference in the comprehension of the texts by the two
groups. The paired, two tail t-test yielded a t of 0.315890663, which was insignificant at p <.05(with
df=23) and a critical value of 2.069.
Key- CCOP=Concurrent Offer Panel; CDP=Complimentary Demand Panel;
COP=Complimentary Offer Picture.
Panel Type Group A Group B
CCP 1 11 12
CCP 5 12 12
CDP 2 6 8
COP 3 9 10
COP 4 9 3
COP 6 3 0
COP 7 2 0
COP 8 1 0
t-test 0.315890663
Mean 5.923987851 5.625
6.3 Discussion Of Complementary Offer Panels 3,4,6,7,8
As stated above, overall, the results show that the graphic/written text relation of
complementation found in these panels does not support reading comprehension.
However, as noted above, it is interesting that nine students in group A, compared to only
three in group B, could understand the difficult linguistic clues in this panel. As explained
in Section 4.3.2 (p.29), the words (“I come Graymalkin,” “Paddock calls,” etc.) rely on
both linguistic and, perhaps, cultural knowledge of witchcraft to be interpreted.
Moreover, as explained in Section 4.3.2, (p.29) the graphic/written text relationship in the
panel does not support the words. Therefore, according to the theoretical model, this
panel should not have helped students. However, in Group A, the graphic text seems to
have helped nine students.
The explanation for why Group A could decipher these ambiguous terms of witchcraft
seems to have been a combination of the visual panels’ sequencing and the changes in
color modality. The qualitative data for these panels, summarized in Table 8 (p.45)
indicates that students could slowly build an overall picture. Thus, referring to Appendix
44
1, students could read the setting of the scene offer picture (panel 1) through the detail
giving demand pictures (panels 2, 3, 4) to the final climatic—in the words of one student,
“It’s magic impact” (S3 Table 8)—offer pictures (panels 4, 5). Moreover, the color
modality of the panels change, as noted by the students, from the neutrality of greens and
browns to the drama of red as the spell is being cast (S7, S8, S10, S12; see Table 8
below).
Thus, the qualitative feedback suggests that comprehending multi-modal texts does not
simply depend on graphic/written text relations alone. It supports the contention that
other factors, such as the juxtaposition of images (McCloud, 1993, pp. 2-8) or color
modality (Kress and Van Leeuwen, 2006 pp. 160-174), must also be drawn into any
model of how multi-modal texts organize information to make meaning. Moreover, an
explanation for the positive effect of visuals could be found in the schema theory. As
explained in Section 2.2 (p.11), schema theory suggests that incoming data must be
matched to readers’ expectations for comprehension to occur. For the nine Group A
students, the juxtaposition of the images and the color modality may have assisted in how
they interpreted and matched the incoming data with their own expectations. This is an
area for future research.
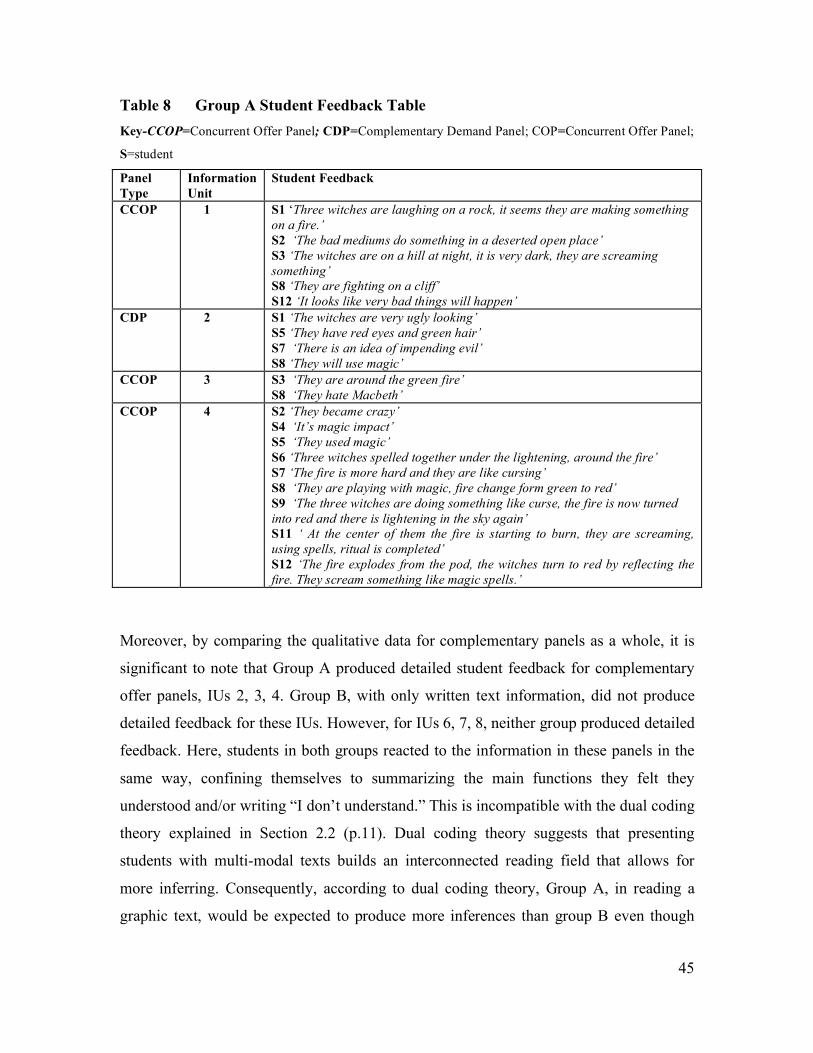
45
Table 8 Group A Student Feedback Table
Key-CCOP=Concurrent Offer Panel; CDP=Complementary Demand Panel; COP=Concurrent Offer Panel;
S=student
Panel
Type
Information
Unit
Student Feedback
CCOP 1 S1 ‘Three witches are laughing on a rock, it seems they are making something
on a fire.’
S2 ‘The bad mediums do something in a deserted open place’
S3 ‘The witches are on a hill at night, it is very dark, they are screaming
something’
S8 ‘They are fighting on a cliff’
S12 ‘It looks like very bad things will happen’
CDP 2 S1 ‘The witches are very ugly looking’
S5 ‘They have red eyes and green hair’
S7 ‘There is an idea of impending evil’
S8 ‘They will use magic’
CCOP 3 S3 ‘They are around the green fire’
S8 ‘They hate Macbeth’
CCOP 4 S2 ‘They became crazy’
S4 ‘It’s magic impact’
S5 ‘They used magic’
S6 ‘Three witches spelled together under the lightening, around the fire’
S7 ‘The fire is more hard and they are like cursing’
S8 ‘They are playing with magic, fire change form green to red’
S9 ‘The three witches are doing something like curse, the fire is now turned
into red and there is lightening in the sky again’
S11 ‘ At the center of them the fire is starting to burn, they are screaming,
using spells, ritual is completed’
S12 ‘The fire explodes from the pod, the witches turn to red by reflecting the
fire. They scream something like magic spells.’
Moreover, by comparing the qualitative data for complementary panels as a whole, it is
significant to note that Group A produced detailed student feedback for complementary
offer panels, IUs 2, 3, 4. Group B, with only written text information, did not produce
detailed feedback for these IUs. However, for IUs 6, 7, 8, neither group produced detailed
feedback. Here, students in both groups reacted to the information in these panels in the
same way, confining themselves to summarizing the main functions they felt they
understood and/or writing “I don’t understand.” This is incompatible with the dual coding
theory explained in Section 2.2 (p.11). Dual coding theory suggests that presenting
students with multi-modal texts builds an interconnected reading field that allows for
more inferring. Consequently, according to dual coding theory, Group A, in reading a
graphic text, would be expected to produce more inferences than group B even though
46
they may not be able to understand the entire text. However, as explained above, this
effect of increased inferring was not indicated by the student’s responses.
While the result may have been encouraged by the research instrument, which clearly
offers writing “I don’t understand” as an option, students also had the option of writing in
Japanese. Therefore, it may indicate that once students became aware of the
graphic/written text relationship in Complementary Offer Panels 6, 7, and 8 (i.e., that the
picture would not support linguistic information), they dismissed the whole text. This
suggests that the complementary parallel processing relationship can overload the
students, which results in them not attempting to read the text in detail. Again, this can be
supported by the schema theory. Here, the students were unable to match the incoming
information with their own conceptions, thus they rejected the information. Moreover,
mental modeling theory, explained in 2.2(p.11), can also account for this. Thus, unlike
dual processing theory, schema and mental modeling theories are not universal.
Therefore, the two effects can co-exist. Thus, schema and dual modeling are not
incompatible as an explanation for miscomprehension. Here students, unable to create a
mental model of the words in the text, could not build an appropriate schema and did not
attempt to infer the meaning of the words.
Therefore, while the qualitative data supported the effect of incomprehension occurring,
it did not support miscomprehension. Lui suggests that miscomprehension occurs due to
“noticing” (Schmidt, 1990, quoted in Lui, 2004, pp.237). Noticing, as explained in
Section 2.2(p.11), suggests that, rather than the images supporting reading
comprehension, in complementary relationships, the image distracts students’ attention
from complex language. This is understandable if the image is, as occurs in
complementary relations, sending a connected but fundamentally different message.
However, in these panels, the only indication of hindrance seems to have been due to a
failure in lexical processing. Thus, complementary offer panel 7 student 8 (Group A) and
student 1 (Group B) both lexically misinterpreted the “idea of a storm” for the actual
weather.
47
An explanation for the lack of miscomprehension could be found in the degrees of
complementary and concurrent relations in the images. Unsworth suggests that
graphic/written text relation are not fixed, rather the extent to which written or graphic
texts concur or complement each other can vary (Unsworth, 2008, pp. 387-397). A
common example of this would be in visual instructions that accompany the assembling
of household objects (e.g., installing a personal computer). Stenglin and Iedema (2001,
pp. 199-201) show that instructions mix graphic/written text relations of both
concurrence and complementation. However, complementary offer panels 3, 4, 6, 7, and
8 have strong relationships of complementation, as shown in Section 4. Therefore, the
effects of different images, that mix concurrence and complementation in more complex
ways, should be researched.
6.4 Discussion Of Complementary Demand Panel 2
Clearly, with no significant statistical difference between the groups (Group A=6, Group
B=8), the lexical signaling of the words was at least as efficient as the visual realization
of the words. Interestingly, hindrance was evident for two students, S1 and S5 (see Table
8p.45), where they described the images in detail but did not attempt to decipher the
words. This is important because it would seem that, while the students did not
comprehend the linguistic meaning, they did become involved in the visual meaning, that
is, the panel demanded their attention (see Section 3.3.1). Thus, for these two students,
the effect of noticing can be observed. The students seemed to have noticed the images
and, consequently, did not focus on the difficult lexical processing needed to translate the
words. However, while the students were distracted from the words in this panel, overall,
the results may not have been negative. Instead, as was explained for the concurrence
panels above (COP 4 above), the sequencing of images from panels 1-4 seems to have
had an overall positive effect on reading comprehension. Thus, as shown in Table
8(p.45), students 1 and 5 understood the gist of complementary panels 3 and 4. This
supports the discussion for complementary offer panel 4 that both hindrance and
48
juxtaposition of images must be accounted for in a comprehensive definition of
graphic/written text relations.
6.5 Discussion Of Complementary Offer Panels 1 and 5
The results seem to support Lui’s findings (2004) that whether graphic/written text
relations produce support or redundancy is closely linked to proficiency. Here, almost all
the students (Table 4/5: CCOP 1, Group A=11, Group B=12, CCOP 5, Group A=12,
Group B=12) understood the relatively straightforward orientating information.
Therefore, as stated in 6.2 (p. 41), for Group A the repetition of the key content of the
written text in the representational content of the graphic text may well have been
redundant. Thus, if Group B understood the text without images, then there is no reason
to assume Group A could not. Indeed, Unsworth (2008, pp.387) points out that
redundancy is common in concurrent multi-modal relationships. Thus, as explained in
Section 3.2.3, this relationship is common and helpful in children’s books where readers
need reiteration but not so common in graphic novels. This suggests that reading comic
books, despite the reputation they may have of only fulfilling only the “compensatory
hypothesis”, explained in section 2.2 (p.11), may be very difficult for learners to read.
Also, perhaps more research needs to be done on the uses of concurrence in an EFL
context where redundancy of this kind may not always be needed. For example, many
textbooks may be using concurrent relationships were they are not needed. Moreover,
redundancy may have a negative effect on language acquisition because it prevents
students from filling in the linguistic content of the visual text. More research needs to be
done to determine at what proficiency level a relationship of concurrence causes
redundancy, as was indicated by this research, or support, which may be indicated by
repeating this part of the experiment with less proficient learners.
Finally, research suggests that, just as the proficiency level of students seems to influence
the effect of graphic/written text relations, other factors need to be considered as well.
Indeed, efficient multi-modal processing may depend on learner types; research suggests
that field-independent learners may be more apt with deciphering complex multi-modal
49
texts than field-dependent learners (Leu, 2000, p.753). Moreover, how visual texts are
interpreted may be culturally influenced (Jewitt and Oyama, 2001, pp. 154). This is
related to the information value. Thus, as explained in Section 2.3.3.2 (p16), the
placement of elements in images gives them a certain value. The value given to these
elements, for example, the use of the top of a picture carrying the ideal information being
associated to the divining of the sky (p.16), may not be universal. Thus, images may be
interpreted differently in different cultures. More research needs to be done in these
areas.
50
Part 7 Conclusions
7.1 To What Extent Was The Definition of Graphic/Written Text Relations
Successful?
The definition of graphic/written text relations was largely successful. The definition
could predict the effect multi-modal texts would have on reading comprehension. Thus,
in the relationships defined as concurrence, where the images might have supported
reading comprehension, the graphic text made no positive contribution to reading
because, at this level of proficiency, the students could understand the written text
without the images. In the relationships defined as complementation, where the graphic
text added to or augmented the information given in the written text, rather than repeating
it, the graphic/written text relation did not support reading comprehension because the
students could not use the images to infer the meaning of the words.
Additionally, the research suggests that the graphic/written text relations of concurrence
or complementation may not cause miscomprehension. Overall, the images did not
interfere with the written text. Thus, as the results for complementary panels show, (see
p.42) students seemed to be able to recognize that the graphic/written text relation were
not reiterating the same ideas and, therefore, did not attempt to use them to decipher the
text.
Therefore, this study supports the hypothesis (outlined in section 1.7) that SFG can be
effectively used to support reading comprehension in the EFL classroom. The principles
of a visual approach to systemics (the compositional, representational, and interactive
functions) can efficiently be applied to images to define two distinct types: demand and
offer images. Thus, through a series of simple questions (see p.28) the panels of the
Macbeth text could be analyzed and related to the classifications outlined in Kress and
Van Leeuwen’s (2006) model (see parts 3 and 4). Further, the effects these types of
images will have on reading comprehension could be ascertained. As shown in Part 4, the
51
research findings on reading comprehension could be related to systemic definitions of
graphic/written text relations.
Therefore, overall, the hypotheses, (p.7), that state concurrence may support reading
comprehension or cause redundancy while complementation may cause incomprehension
were supported. However, it was hypothesized (p.7) that complementation may cause
incomprehension which, as stated above, was not supported by this study. More research
is needed in this area. Moreover, the underlying complexities of graphic/written text
relations were also indicated by the study, which suggests that there are limitations to the
model that deserve further investigation. These will be examined next.
7.2 Limitations to the Definition
This discussion suggests that a comprehensive model of graphic written text relations
needs to include the effects of juxtaposition of images. The juxtaposition of images in a
sequence may change how the reader interprets that image. This supports Royce’s (2002)
study that suggests textual cohesion, as applied to written texts by Halliday and Hanson
(1976), is applicable to multi-modal relations. Moreover, a comprehensive model of
graphic/written text relations needs to include the effects of different and more complex
graphic/written text relations (as described by Unsworth, 2008) than the two included in
this study.
In addition, this study was limited to Japanese learners at one proficiency level. A
comprehensive pedagogical model of graphic/written relations in multi-modal texts needs
to examine the effects of graphic/written text relations on different types of learners.
Therefore, further investigation is needed into the effects of complementary and
concurrent relations on different proficiency levels, field dependent vs. field independent
learners, and learners from different cultural backgrounds.
In general, these limitations to the study suggest graphic/written text relations might be
dependent upon usage. Thus, the placement of an image in the context of a text will
52
change the meaning of that particular image. Moreover, how images are interpreted when
they are used might not be universal. These limitations, however, are not usual in
language learning, be it a written language, visual, or a mixture of both. For example,
corpus approaches to grammar suggest that grammatical structures vary enormously
when actual usage is examined (Sinclair 1991) and that consideration of learner types is
an integral part of communicative teaching (Nunan, 1999).
Therefore, creating a comprehensive definition of graphic/written text relations can be
closely linked to much of the existing research on language learning. Indeed, pedagogical
approaches already exist, such as data-driven learning (Johns, 1994) or consciousness-
raising (Rutherford, 1987), where language, to account for the communicative
complexities of language learning, is observed in use and students are taught the skill of
hypothesizing about how the language is used in that particular situation.
Such an approach could be applied to the model outlined in parts 3/4, where teachers and
students use the underlying principles of SFG to create a hypothesis or rules of thumb
about the graphic/written text relations found in multi-modal texts, which can then be
adjusted to suit any complexities that emerge as the text is further analyzed. Therefore,
this paper supports the suggestions outlined in the introduction that defining
graphic/written text relations is important for the classroom. Indeed, a definition of multi-
modal relations, as part of a general grammar of multi-modality (Unsworth, 2008), would
be a practical aid in supporting the teaching of reading comprehension of multi-modal
texts in the new literacy environments of the modern EFL classroom.
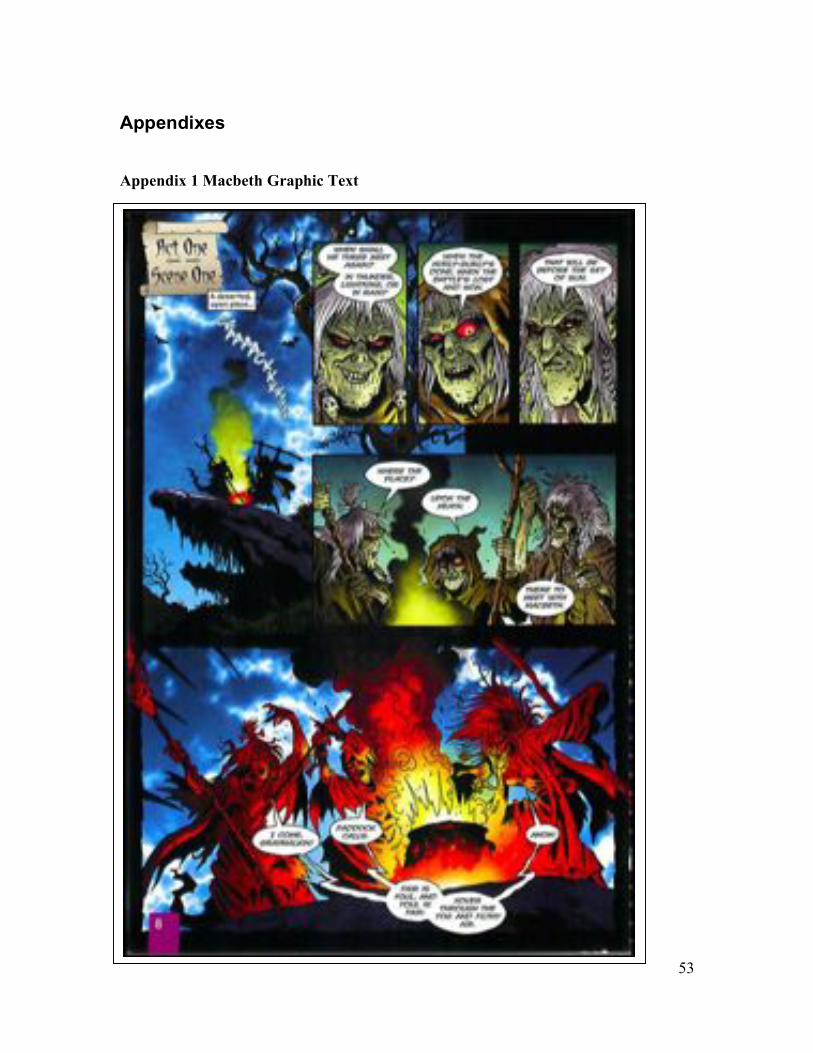
53
Appendixes
Appendix 1 Macbeth Graphic Text
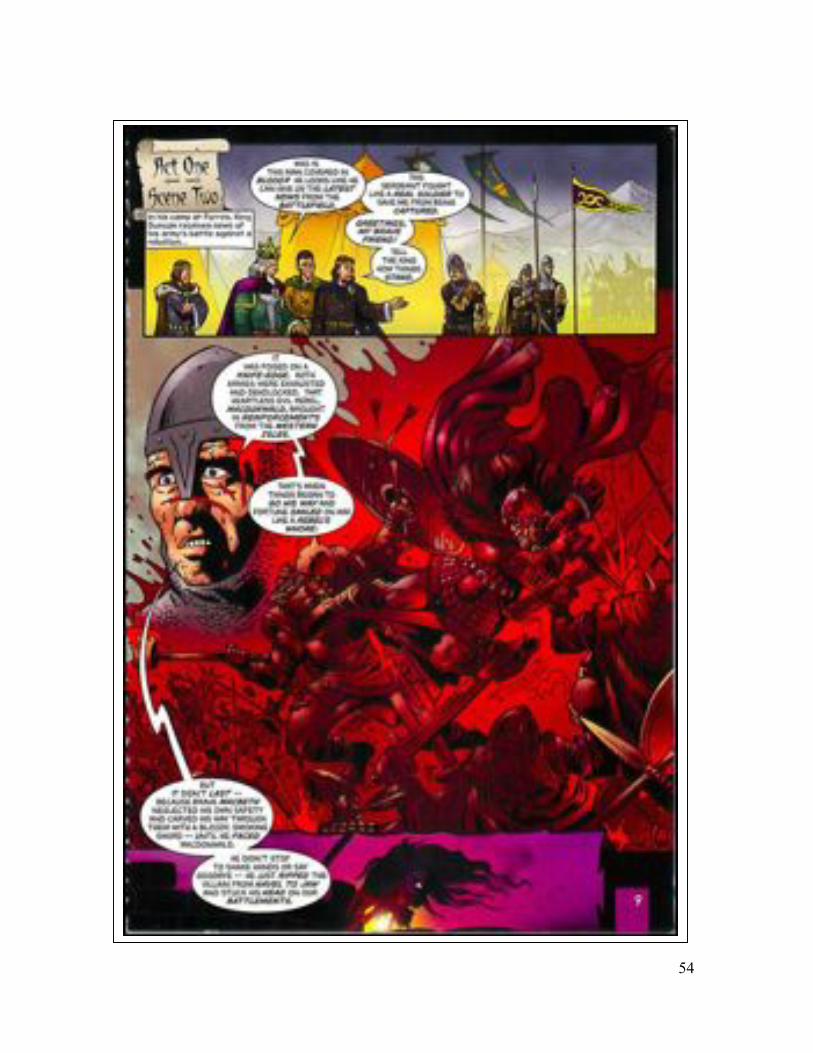
54
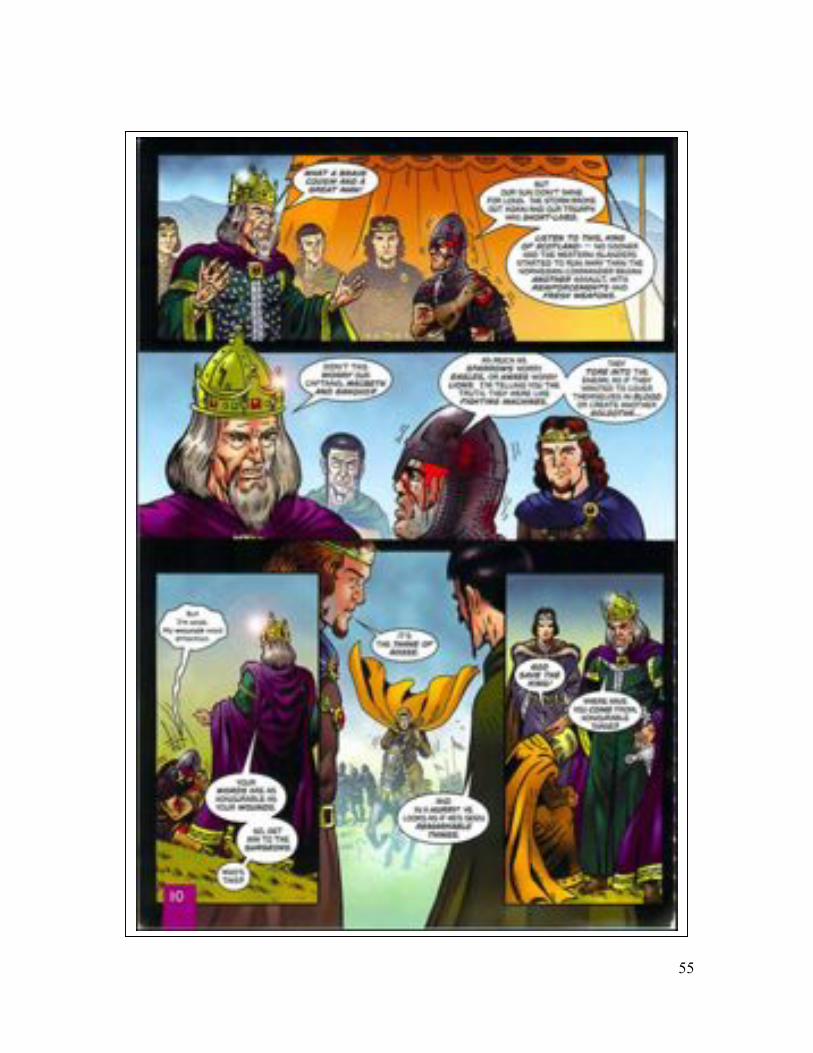
55
56
Appendix 2 Macbeth Written Text
Macbeth Act 1 scene 1/2(Plain Text Version)
Location- A deserted open place
1.1 Thunder lightening. Enter three witches.
First Witch
When shall we three meet again?
In the thunder lightening or in rain?
Second Witch
When the hurly-burly’s done,
When the battle is lost and won.
Third Witch
That will be before the set of the sun.
First Witch
Where the place?
Second Witch
Upon the heath
Third Witch
There to meet with Macbeth.
First Witch
I come, Grimalkin
Second Witch
Paddock calls
Third Witch
Anon
All Witches
Fair is foul and foul is fair,
Hover through the fog and filthy air.
Exit
1.2 At his camp at Forres, King Duncan receives news of his army’s battle against a rebellion. King
Duncan, Malcolm, Donalbain, Lennox, with attendants meeting a bleeding Captain.
King Duncan
Who is this man covered on blood? He looks like he can give us the latest news from the battlefields.
Malcolm
This sergeant fought like a real soldier to save me from being captured.
Greetings my brave friend!
Tell the king how things stand.
Captain
It was poised on a knife-edge. Both armies were exhausted and deadlocked,
that heartless evil rebel, MacDonwald, brought in reinforcements from the western Isles.
That is when things began to go his way and fortune smiled on him like a rebel whore.
57
But it did not last because brave Macbeth neglected his safety and carved his way through them with a
bloody smoking sword-
until he faced MacDonwald.
He didn’t stop to shake hands or say goodbye-
he just ripped the villain from navel to jaw and stuck his head on our battlements.
King Duncan
What a brave cousin and great man.
Captain
But our sun didn’t shine for long. The storm broke out again and our triumph was short lived.
Listen to this song, king of Scotland-
No sooner had the Western Islanders ran away than the Norwegian commander began another assault, with
reinforcements and fresh weapons.
King Duncan
Didn’t this worry our captains Macbeth and Banguo?
Captain
As much as sparrows worry eagles or hares worry loins. I’m telling you the truth they were like fighting
machines.
They tore into the enemy as if they wanted to cover themselves in blood or create another Golgotha..
But I am weak my wounds need attention.
King Duncan
Your words are as honorable as your wounds. Go get him to the surgeons.
Group B – Macbeth Act 1 scene 1/2 (Plain Text Illustrated Version) –same text as A but has illustrations.
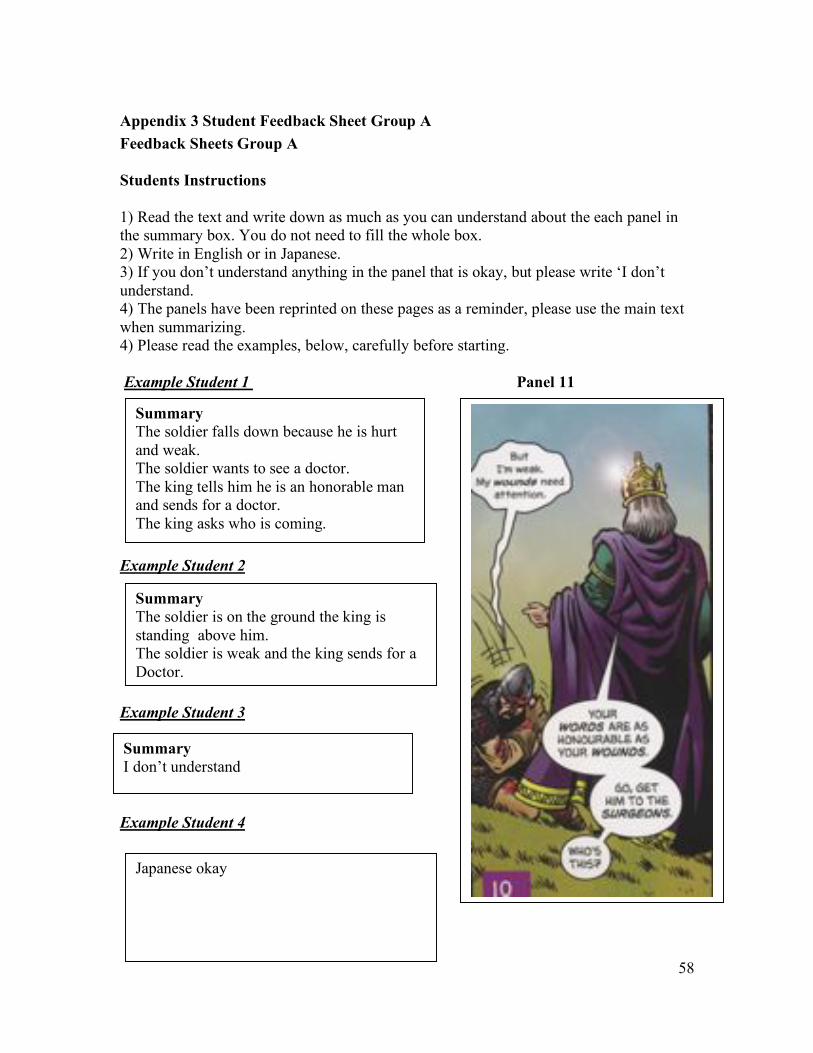
58
Appendix 3 Student Feedback Sheet Group A
Feedback Sheets Group A
Students Instructions
1) Read the text and write down as much as you can understand about the each panel in
the summary box. You do not need to fill the whole box.
2) Write in English or in Japanese.
3) If you don’t understand anything in the panel that is okay, but please write ‘I don’t
understand.
4) The panels have been reprinted on these pages as a reminder, please use the main text
when summarizing.
4) Please read the examples, below, carefully before starting.
Example Student 1 Panel 11
Example Student 2
Example Student 3
Example Student 4
Summary
The soldier falls down because he is hurt
and weak.
The soldier wants to see a doctor.
The king tells him he is an honorable man
and sends for a doctor.
The king asks who is coming.
Summary
The soldier is on the ground the king is
standing above him.
The soldier is weak and the king sends for a
Doctor.
Summary
I don’t understand
Japanese okay
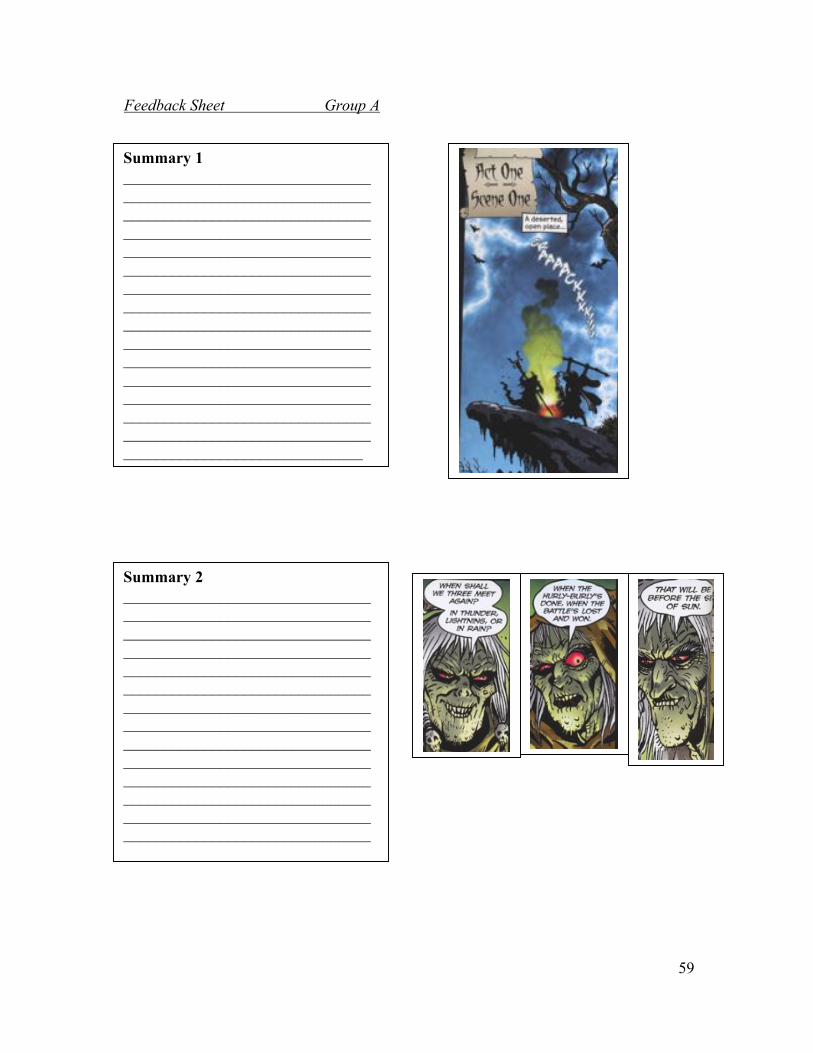
59
Feedback Sheet Group A
Summary 1
_______________________________
_______________________________
_______________________________
_______________________________
_______________________________
_______________________________
_______________________________
_______________________________
_______________________________
_______________________________
_______________________________
_______________________________
_______________________________
_______________________________
_______________________________
______________________________
Summary 2
_______________________________
_______________________________
_______________________________
_______________________________
_______________________________
_______________________________
_______________________________
_______________________________
_______________________________
_______________________________
_______________________________
_______________________________
_______________________________
_______________________________
__
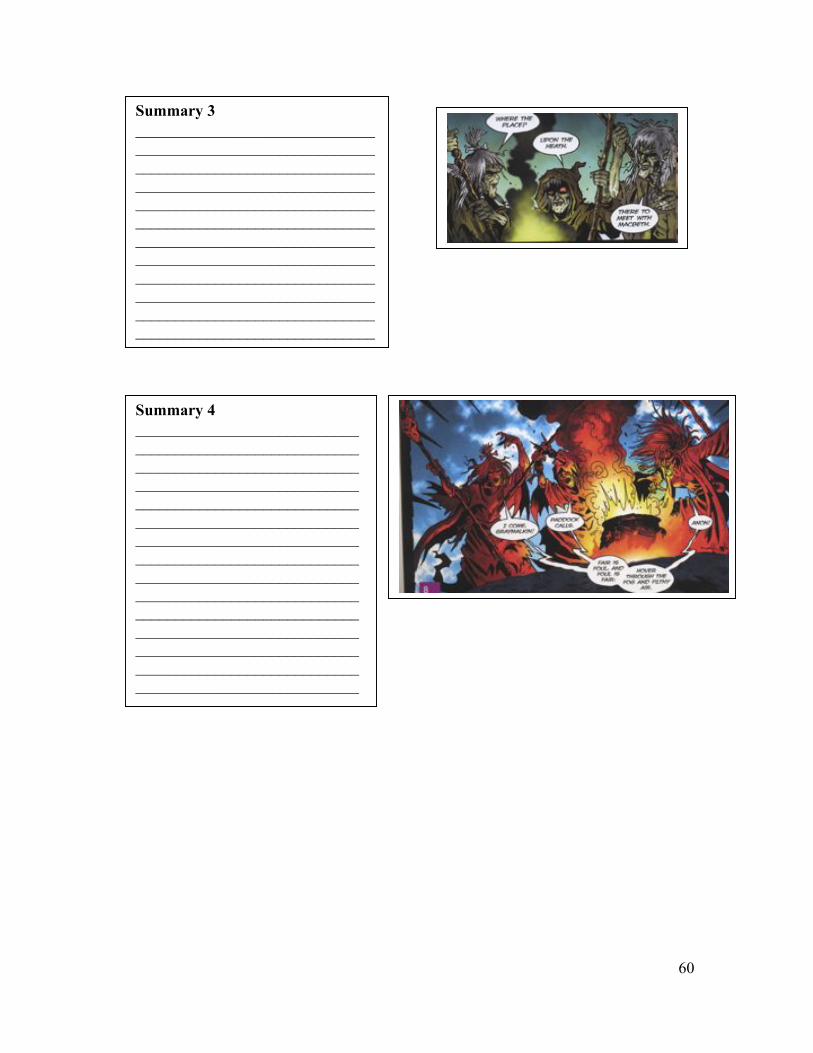
60
Summary 3
______________________________
______________________________
______________________________
______________________________
______________________________
______________________________
______________________________
______________________________
______________________________
______________________________
______________________________
______________________________
__
Summary 4
____________________________
____________________________
____________________________
____________________________
____________________________
____________________________
____________________________
____________________________
____________________________
____________________________
____________________________
____________________________
____________________________
____________________________
____________________________
__
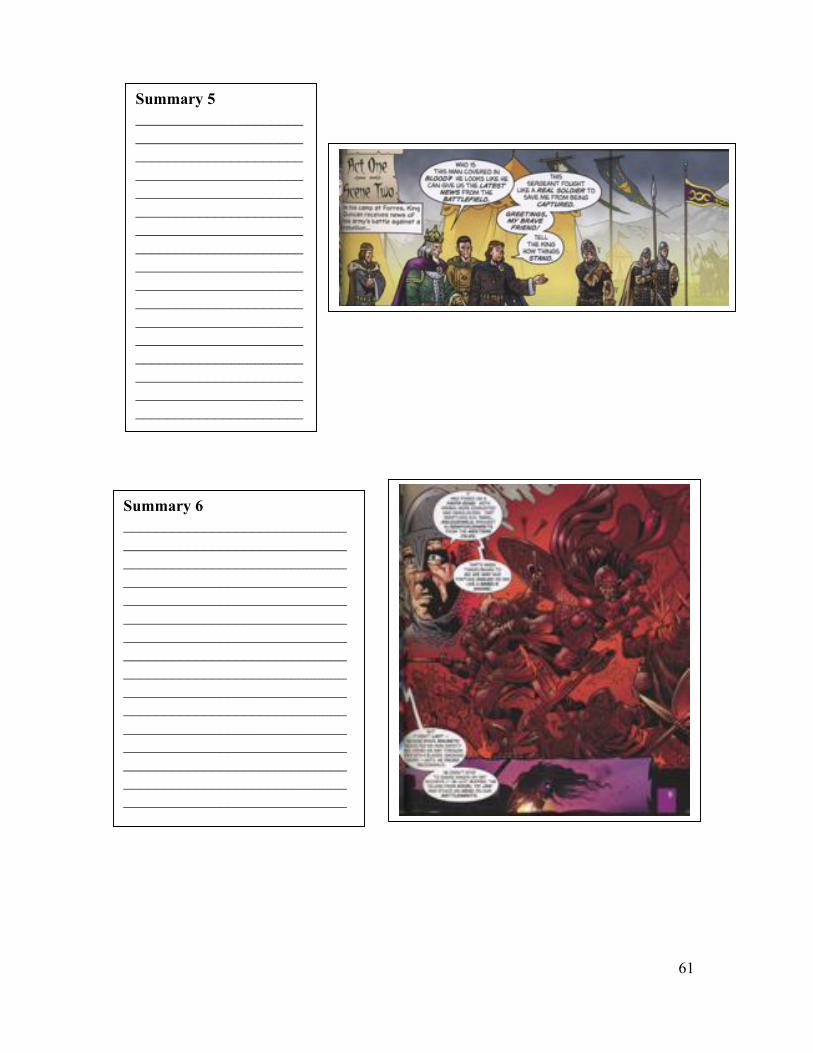
61
Summary 5
_____________________
_____________________
_____________________
_____________________
_____________________
_____________________
_____________________
_____________________
_____________________
_____________________
_____________________
_____________________
_____________________
_____________________
_____________________
_____________________
_____________________
_
Summary 6
____________________________
____________________________
____________________________
____________________________
____________________________
____________________________
____________________________
____________________________
____________________________
____________________________
____________________________
____________________________
____________________________
____________________________
____________________________
____________________________
____
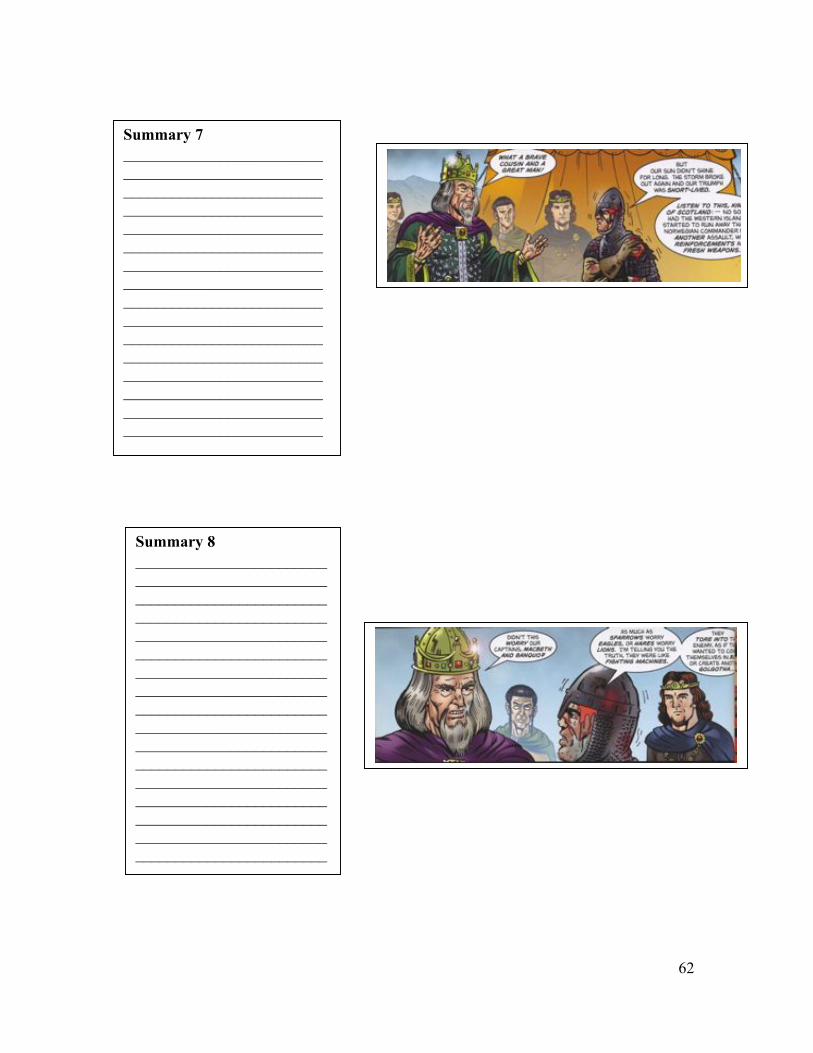
62
Summary 7
_________________________
_________________________
_________________________
_________________________
_________________________
_________________________
_________________________
_________________________
_________________________
_________________________
_________________________
_________________________
_________________________
_________________________
_________________________
_________________________
Summary 8
________________________
________________________
________________________
________________________
________________________
________________________
________________________
________________________
________________________
________________________
________________________
________________________
________________________
________________________
________________________
________________________
________________________
________________________
________________________
___
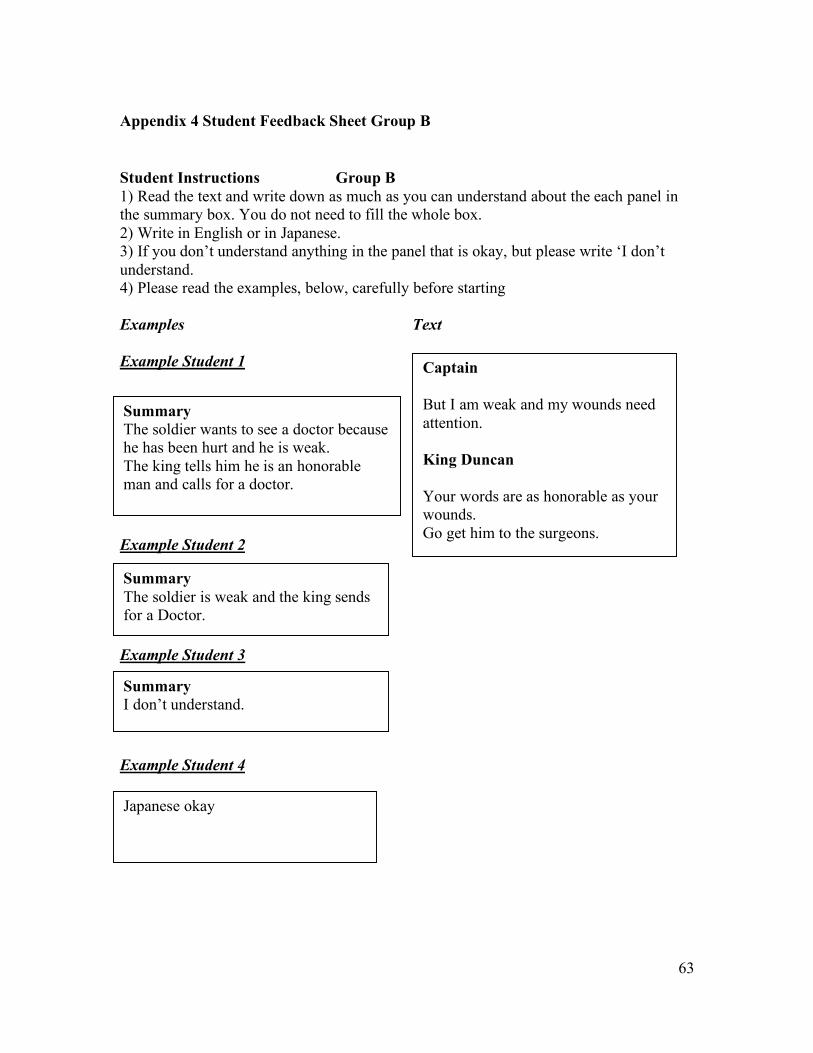
63
Appendix 4 Student Feedback Sheet Group B
Student Instructions Group B
1) Read the text and write down as much as you can understand about the each panel in
the summary box. You do not need to fill the whole box.
2) Write in English or in Japanese.
3) If you don’t understand anything in the panel that is okay, but please write ‘I don’t
understand.
4) Please read the examples, below, carefully before starting
Examples Text
Example Student 1
Example Student 2
Example Student 3
Example Student 4
Captain
But I am weak and my wounds need
attention.
King Duncan
Your words are as honorable as your
wounds.
Go get him to the surgeons.
Summary
The soldier wants to see a doctor because
he has been hurt and he is weak.
The king tells him he is an honorable
man and calls for a doctor.
Summary
The soldier is weak and the king sends
for a Doctor.
Summary
I don’t understand.
Japanese okay
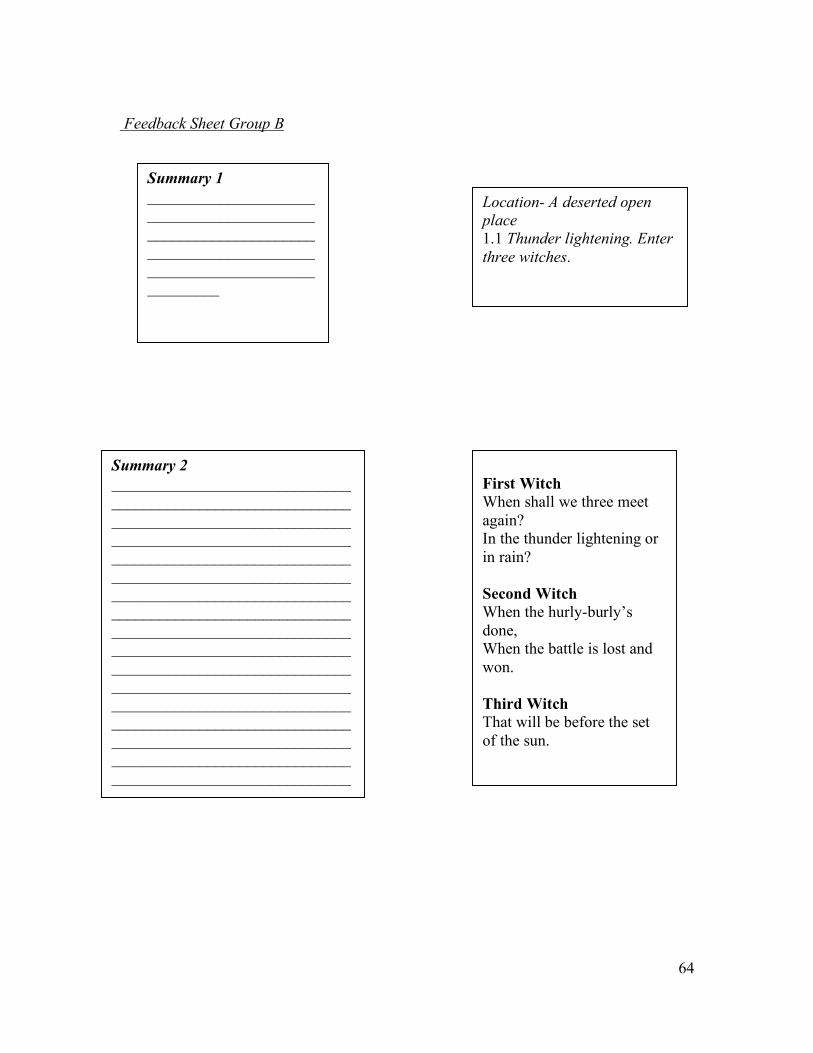
64
Feedback Sheet Group B
Summary 1
_____________________
_____________________
_____________________
_____________________
_____________________
_________
Location- A deserted open
place
1.1 Thunder lightening. Enter
three witches.
Summary 2
______________________________
______________________________
______________________________
______________________________
______________________________
______________________________
______________________________
______________________________
______________________________
______________________________
______________________________
______________________________
______________________________
______________________________
______________________________
______________________________
______________________________
First Witch
When shall we three meet
again?
In the thunder lightening or
in rain?
Second Witch
When the hurly-burly’s
done,
When the battle is lost and
won.
Third Witch
That will be before the set
of the sun.

65
Summary 3
_________________________________
_________________________________
_________________________________
_________________________________
_________________________________
_________________________________
_________________________________
_________________________________
_________________________________
_________________________________
_________________________________
_________________________________
_________________________________
_________________________________
_________________________________
_________________________________
_________________________________
First Witch
Where the place?
Second Witch
Upon the heath
Third Witch
There to meet with
Macbeth.
Summary 4
_________________________________
_________________________________
_________________________________
_________________________________
_________________________________
_________________________________
_________________________________
_________________________________
_________________________________
_________________________________
_________________________________
_________________________________
_________________________________
_________________________________
_________________________________
_________________________________
_________________________________
First Witch
I come, Grimalkin
Second Witch
Paddock calls
Third Witch
Anon
All Witches
Fair is foul and foul is fair,
Hover through the fog and
filthy air.

66
Summary 5
__________________________________
__________________________________
__________________________________
__________________________________
__________________________________
__________________________________
__________________________________
__________________________________
__________________________________
__________________________________
__________________________________
__________________________________
__________________________________
__________________________________
__________________________________
__________________________________
__________________________________
__________________________________
__________________________________
__________________________________
__________________________________
__________________________________
__________________________________
__________________________________
__________________________________
_________________________________
1.2 At his camp at Forres, King
Duncan receives news of his
army’s battle against a rebellion.
King Duncan, Malcolm,
Donalbain, Lennox, with
attendants meeting a bleeding
Captain.
King Duncan
Who is this man covered in
blood? He looks like he can give
us the latest news from the
battlefields.
Malcolm
This sergeant fought like a real
soldier to save me from being
captured.
Greetings my brave friend!
Tell the king how things stand.
Summary 6
__________________________________
__________________________________
__________________________________
__________________________________
__________________________________
__________________________________
__________________________________
__________________________________
__________________________________
__________________________________
__________________________________
__________________________________
__________________________________
__________________________________
__________________________________
__________________________________
__________________________________
__________________________________
__________________________________
__________________________________
__________________________________
__________________________________
__________________________________
__________________________________
__________________________________
_________________________________
Captain
It was poised on a knife-edge.
Both armies were exhausted and
deadlocked,
that heartless evil rebel,
MacDonwald, brought in
reinforcements from the western
Isles.
That is when things began to go
his way and fortune smiled on
him like a rebel whore.
But it did not last because brave
Macbeth neglected his safety and
carved his way through them
with a bloody smoking sword-
until he faced MacDonwald.
He didn’t stop to shake hands or
say goodbye-
he just ripped the villain from
navel to jaw and stuck his head
on our battlements.

67
Summary 7
____________________________________
____________________________________
____________________________________
____________________________________
____________________________________
____________________________________
____________________________________
____________________________________
____________________________________
____________________________________
____________________________________
____________________________________
____________________________________
____________________________________
____________________________________
____________________________________
____________________________________
____________________________________
____________________________________
____________________________________
____________________________________
____________________________________
____________________________________
____________________________________
___________________
King Duncan
What a brave cousin and great
man.
Captain
But our sun didn’t shine for long.
The storm broke out again and
our triumph was short lived.
Listen to this song, king of
Scotland-
No sooner had the Western
Islanders ran away than the
Norwegian commander began
another assault, with
reinforcements and fresh
weapons.
Summary 8
____________________________________
____________________________________
____________________________________
____________________________________
____________________________________
____________________________________
____________________________________
____________________________________
____________________________________
____________________________________
____________________________________
____________________________________
____________________________________
____________________________________
____________________________________
____________________________________
____________________________________
____________________________________
____________________________________
____________________________________
____________________________________
____________________________________
____________________________________
____________________________________
___________________
King Duncan
Didn’t this worry our captains
Macbeth and Banguo?
Captain
As much as sparrows worry
eagles or hares worry lions. I’m
telling you the truth they were
like fighting machines.
They tore into the enemy as if
they wanted to cover themselves
in blood or create another
Golgotha.

68
Summary 9
____________________________________
____________________________________
____________________________________
____________________________________
____________________________________
____________________________________
____________________________________
____________________________________
____________________________________
____________________________________
____________________________________
____________________________________
____________________________________
____________________________________
____________________________________
____________________________________
____________________________________
____________________________________
____________________________________
____________________________________
____________________________________
____________________________________
____________________________________
____________________________________
___________________
Captain
But I am weak my wounds need
attention.
King Duncan
Your words are as honorable as
your wounds. Go get him to the
surgeons.
69
References
Baldry, P. and Thibault, P. (2005) Multi-Modal Transcription and Text Analysis
London: Equinox
Bernhardt, B. (1983). ‘Testing Foreign Language Reading Comprehension: The
Immediate Recall Protocols. In Teaching German, Vol, 16, No. 1 (spring 1983),
pp.27-33
Bhatia, T.K. (2006). ‘Super-heroes to Super Languages: American Popular Culture
Through South Asian Comics’. In World Englishes, 25/2, pp. 279-297.
Black, R.W. (2008) ‘Just Don’t Call Them Cartoons: The New Literacies Spaces of
Animee , Manga and Fan Fiction’ In Handbook of Research into New Literacies.
New York: Erlbaum. pp. 583- 605.
Brown, H. (2000) Principles of Language Learning and Teaching: Longman
Coiro, J., Knobel, M., Lankshear, C. and Leu, D.J. (2008) ‘Central Issues in New
Literacies and New Literacies Research’, In Coiro, J. et al (eds). Handbook of
Research into New Literacies. New York: Erlbaum. pp. 1-21.
Cook, G. (1989) Discourse : OUP
Cary, S. (2005) Going Graphic: Comics at Work in the Multilingual Classroom.
Portsmouth: Heinemann.
Day, R.R. and Bamford. (1998) Extensive Reading in the Second Language
Classroom. New York: Cambridge University Press.
Fei, V.L. (2004) ‘Developing an Integrative Multi-Semiotic Model’ In O’ Halloran,
Multimodal Discourse Analysis. London: Continuum. pp.220-247.
Fries, P.H. (1994) ‘On Theme Rheme and Discourse Goals’ In Coulthard, M. (ed).
Advances In Written Text Analysis. New York: Routledge. pp.229- 249.
Eisner, W. (2004) Comics and Sequential Art. Florida:Poorhouse Press.
Gyselinck, V. and Tardieu (1999) The Role of Illustrations in Text Comprehension’ In
Van Oostendorp, H. and Goldman, R. The Construction of Mental Images
During Reading. New Jersey: Erlbaum.
Gorman, M. (2003) Getting Graphic: Using Graphic Novels to Promote Literacy
with Preteens and Teens. Ohio:Linworth
70
Gravett, P.(2004) Manga : Sixty Years of Japanese Comics: Laurence King
Halliday, M.A.K. and Matthiessen, C.M.I.M. (2004) An Introduction to Functional
Grammar: London: Hodder and Arnold.
Halliday and Hanson, (1976) Cohesion: CUP
Jewitt, C. and Oyama, R. (2001) ‘Visual Meaning a Social Semiotic Approach’ In Van
Leeuwen, T. and Jewitt, C.A. (Ed). Handbook of Visual Analysis: Wiltshire: Sage.
pp. 134-156.
Johns, T (1994) ‘From Printout to Handout-Grammar and Vocabulary Teaching in the
Context of Data-Driven Learning’ In Odlin, T. Perspectives on
Pedagogical Grammar’ CUP.
Kress , G (2003 ) Literacy in the New Media Age: Oxon: Routledge
Kress, G. and Van Leeuwen, T. (2006) Reading Images : London : Routledge
Kress, G and Van Leeuwen, T. (1999) ‘Representation and Interaction: Designing the
Position of the Viewer.’ In Jaworski, A. and Coupland, N. (Eds) The Discourse
Reader. New York: Routledge. pp. 377-404.
Kist, W. (2005) New Literacies in Action: New York: Teachers College Press.
Lankshear , C. and Knobel , M. (2006) New Literacies : Everyday Practice and
Classroom Learning: Berkshire: McGraw-Hill Education.
Leu,D.J. (2000) ‘Literacy and Technology: Deictic Consequence for Literacy Education
in an Information Age’ In Kamil, M. et al (Ed). Handbook of Reading Research
Volume 3: New Jersey: Erlbaum
Liu, J. (2004) ‘Effects of Comic Strips on L2 Learners Reading Comprehension’ TESOL
Quarterly. 38/2.
Luke, C. ‘Connectivity, Multimodality and Interdisciplinarity’ In Reading Research
Quarterly , Vol.38, No.3, (Jul-Sep, 2003)
Marcus, N.Cooper, M. and Sweller, J.(1996) ‘Understanding Instructions’ In Journal of
Educational Psychology, 88, 49-63.
McCloud. S. (1994) Understanding Comics: The Invisible Art. New York: Harper
Collins.
Mc Donald, J. Haward, J. Dobbin, N. Erskine, G. (2008) Macbeth: The Graphic Novel.
Bristol: Classical Comics Ltd
71
Moon, R. (2000) ‘Cohesion’ In Coulthard et al. Written Discourse. CELS: Birmingham
Norton, B. and Vanderheyden, K. (2004) ‘Comic Book Culture and Second Language
Learners’ In Norton, B. and Toohey, K. Critical Pedagogies and Language
Learning. Cambridge : CUP. pp. 201-221.
Nunan (1999) Second Language Teaching and Learning Massachusetts: Heinle and
Heinle
Prosser, J. (1998) Image Based Research : Oxon: Routledge.
Rutherford, W .E. (1987) Second Language Grammar and Teaching. New York:
Pearson Education.
Royce, T. (2002) ‘ Multi-modality in the TESOL Classroom’ In TESOL Quarterly. Vol.
36,No.2, Summer 2002.
Sadoski and Paivio (2001) Imagery and Text: New Jersey : Erlbaum
Stenglin, M. and Iedema, R. (2001) ‘How to Analyse Visual Images: A Guide for TESOL
Teachers’ In Burns, A. and Coffin, C. Analyzing English in a Global Context:
London: Routledge
Stein, P. (2004). ‘Representation, Rights and Resources: Multimodal Pedagogies in the
Language and Literacy Classroom’ In Norton, B. and Toohey, K. Critical
Pedagogies and Language Learning. Cambridge: CUP. pp. 95- 115.
Sinclair, J. (1991) Corpus, Concordance and Collocation: Oxford: OUP.
Unsworth, L. (2008) ‘Multiliteracies and Metalanguage: Describing Image Text
Relations as a Resource for Negotiating Multimodal Texts’ In Coiro, J. et al
(eds). Handbook of Research into New Literacies. New York: Erlbaum.
pp. 377-407.
Unsworth, L. (2001) Teaching Multiliteracies Across the Curriculum : Buckingham:
OUP
Van Leeuwen, T. (2008) Discourse and Practice: Oxford: OUP.
Wolf, D. (1987) ‘Some Assumptions About Second Language Text Comprehension’ In
SSLA, 9, 307-326.