todd ronald prokop - worcester polytechnic institute … ronald prokop a thesis submitted to the...
TRANSCRIPT

INACTIVATION OF E. COLI IN A FLOW THROUGH
SONICATION SYSTEM
By
Todd Ronald Prokop
A Thesis
Submitted to the Faculty
of the
WORCESTER POLYTECHNIC INSTITUTE
in partial fulfillment of the requirements for the
Degree of Master of Science
in
Environmental Engineering
by
Todd Ronald Prokop
May 2008
APPROVED:
Dr. Jeanine D. Plummer, Major Advisor
Dr. John Bergendahl, Advisor

ii
Abstract
Drinking water sources are vulnerable to a broad range of contaminant threats. Recent
U.S. legislation has focused on protecting public health from pathogens while also
managing disinfection byproducts (DBPs) and organic contaminants. Chlorine is known
to react with organic matter to form DBPs, thus alternative disinfection schemes are
desirable. The goal of our research was to evaluate synergistic inactivation of E. coli
with chlorine and sonication in a flow through system. Laboratory experiments were
conducted to determine the impact of chlorine dose (0 to 1 mg/L), cavitation intensity (90
to 150 watts) and contact time (0 to 16 minutes) on inactivation. Tests were conducted
with a probe system and a flow through cavitation device. Results showed that
sonication alone was ineffective for the conditions tested. Sonication applied
simultaneously with chlorine did not improve inactivation compared to each disinfectant
alone.

iii
Acknowledgements
Thank you to Prof. Jeanine D. Plummer, major and thesis advisor, Prof. John Bergendahl,
who served on the committee for this thesis, Kushal Talukdar (formerly of Harris
Acoustic Products, Inc.), William Pozzo (of Harris Acoustic Products, Inc.), and
Giovanni Widmer (of Tufts University Cummings School of Veterinary Medicine)
This research would not have been possible without funding from the US Department of
Agriculture and direct help from Harris Acoustic Products, Inc, of East Walpole, MA.
Any opinions, findings, and conclusions or recommendations expressed in this material
are those of the author and do not necessarily reflect the views of the USDA or Harris.
Work at Tufts University was assisted by Eric London and Ruben Bonilla, who were
graduate research assistants that Tufts University Cummings School of Veterinary
Medicine at the time this work was conducted.

iv
Table of Contents
Abstract _________________________________________________________________________________________ ii
Acknowledgements __________________________________________________________________________ iii
List of Figures _________________________________________________________________________________ vii
List of Tables _________________________________________________________________________________ viii
1 Introduction ______________________________________________________________________________ 1
1.1 Statement of Problem _________________________________________________________________ 1
1.2 Objectives _______________________________________________________________________________ 3
1.3 Scope of Research _____________________________________________________________________ 3
1.4 Overview of Thesis ____________________________________________________________________ 4
2 Literature Review _______________________________________________________________________ 6
2.1 Drinking Water Regulations _________________________________________________________ 6
2.1.1 Safe Drinking Water Act ______________________________________________________________________ 7
2.1.1.1 1986 Amendments to SDWA __________________________________________________________ 7
2.1.1.2 1996 Amendments to SDWA __________________________________________________________ 8
2.1.2 Surface Water Treatment Rule ______________________________________________________________ 8
2.1.2.1 Interim Enhanced Surface Water Treatment Rule ___________________________________ 9
2.1.2.2 Long Term 1 Enhanced Surface Water Treatment Rule ____________________________ 10
2.1.2.3 Long Term 2 Enhanced Surface Water Treatment Rule ____________________________ 10
2.1.3 Groundwater Regulations ___________________________________________________________________ 11
2.1.4 Regulations for All Public Water Systems _________________________________________________ 11
2.1.4.1 Total Coliform Rule ___________________________________________________________________ 11
2.1.4.2 Stage 1 Disinfectants and Disinfection By-Products Rule __________________________ 12
2.1.4.3 Stage 2 Disinfectants and Disinfection By-Products Rule __________________________ 13
2.1.5 Regulation Summary ________________________________________________________________________ 14
2.2 Disinfection ___________________________________________________________________________ 14
2.2.1 Chlorine ______________________________________________________________________________________ 15
2.2.2 Chloramines __________________________________________________________________________________ 16
2.2.3 Ozone _________________________________________________________________________________________ 17
2.2.4 Ultraviolet Radiation ________________________________________________________________________ 18

v
2.3 Sonication _____________________________________________________________________________ 19
2.3.1 Sonication Alone _____________________________________________________________________________ 19
2.3.2 Sonication with Ozone ______________________________________________________________________ 21
2.3.3 Sonication with Ultraviolet Light ___________________________________________________________ 23
2.3.4 Sonication with Chlorine ____________________________________________________________________ 23
2.3.5 Sonication Summary ________________________________________________________________________ 27
3 Methods _________________________________________________________________________________ 28
3.1 Experimental Design ________________________________________________________________ 28
3.2 Experimental Procedures __________________________________________________________ 33
3.2.1 E. coli Preparation ___________________________________________________________________________ 33
3.2.2 Experiments with Probe Sonication System _______________________________________________ 35
3.2.2.1 Chlorine Only Experiments ___________________________________________________________ 35
3.2.2.2 Sonication Only and Combined Sonication/Chlorination __________________________ 36
3.2.3 Experiments with Flow-through Sonication System ______________________________________ 37
3.3 Analytical Methods __________________________________________________________________ 38
3.3.1 Introduction __________________________________________________________________________________ 38
3.3.2 E. coli Rehydration ___________________________________________________________________________ 39
3.3.3 Enumeration of E. coli _______________________________________________________________________ 39
3.3.3.1 Dilution Series _________________________________________________________________________ 40
3.3.3.2 Pour Plates _____________________________________________________________________________ 40
3.3.4 Chlorine ______________________________________________________________________________________ 41
3.3.5 Free and Total Chlorine Concentrations ___________________________________________________ 42
3.3.5.1 Free Chlorine Calibration Curve _____________________________________________________ 42
3.3.5.2 Residual Free Chlorine Measurement Using DPD Colorimetric Method __________ 43
3.3.5.3 Residual Total Chlorine Measurement Using DPD Colorimetric Method _________ 44
3.3.5.4 Determination of Chlorine Stock Concentration ____________________________________ 44
3.3.6 Reagents and Glasswares ___________________________________________________________________ 45
3.3.6.1 Tryptic Soy Broth _____________________________________________________________________ 45
3.3.6.2 Tryptic Soy Agar _______________________________________________________________________ 46
3.3.6.3 Phosphate Buffered Saline ____________________________________________________________ 46
3.3.6.4 Chlorine Demand Free Phosphate Buffered Saline _________________________________ 47
3.3.7 Chlorine Demand Free E-pure ______________________________________________________________ 47
3.3.7.1 Chlorine Demand Free Glassware and Tubing ______________________________________ 48
3.3.7.2 Dilution Tubes _________________________________________________________________________ 48
3.3.7.3 Sodium Thiosulphate _________________________________________________________________ 48

vi
3.3.7.4 DPD Indicator Solution _______________________________________________________________ 49
3.3.7.5 DPD buffer solution ___________________________________________________________________ 49
3.3.7.6 Standard Ferrous Ammonium Sulfate (FAS) Titrant _______________________________ 49
4 Results ___________________________________________________________________________________ 51
4.1 Probe System _________________________________________________________________________ 51
4.2 Cavitation System without Circulation ___________________________________________ 54
4.3 Cavitation Chamber System with Circulation ___________________________________ 56
4.4 Comparison of Cavitation Systems ________________________________________________ 57
5 Recommendations _____________________________________________________________________ 59
Works Cited ___________________________________________________________________________________ 61
Appendicies ___________________________________________________________________________________ 63
Appendix 1: Results for Experiments Conducted at WPI ______________________________ 64
Appendix 2: Experiments Conducted at Tufts with Tufts E. coli ______________________ 65
Appendix 3: Experiments Conducted at Tufts with WPI E. coli _______________________ 66

vii
List of Figures
Figure 2-1: Inactivation on E. coli and fecal streptococci by sonication (Blume, Martinez
and Uwe 2002) ........................................................................................................... 21
Figure 2-2: Chlorine inactivation of E. coli with pre- and simultaneous sonication at 20
kHz (Duckhouse, et al. 2004)..................................................................................... 25
Figure 2-3: Chlorine inactivation of E. coli with pre- and simultaneous sonication for 1
minute (Duckhouse, et al. 2004) ................................................................................ 26
Figure 3-1: Misonix probe sonication system .................................................................. 29
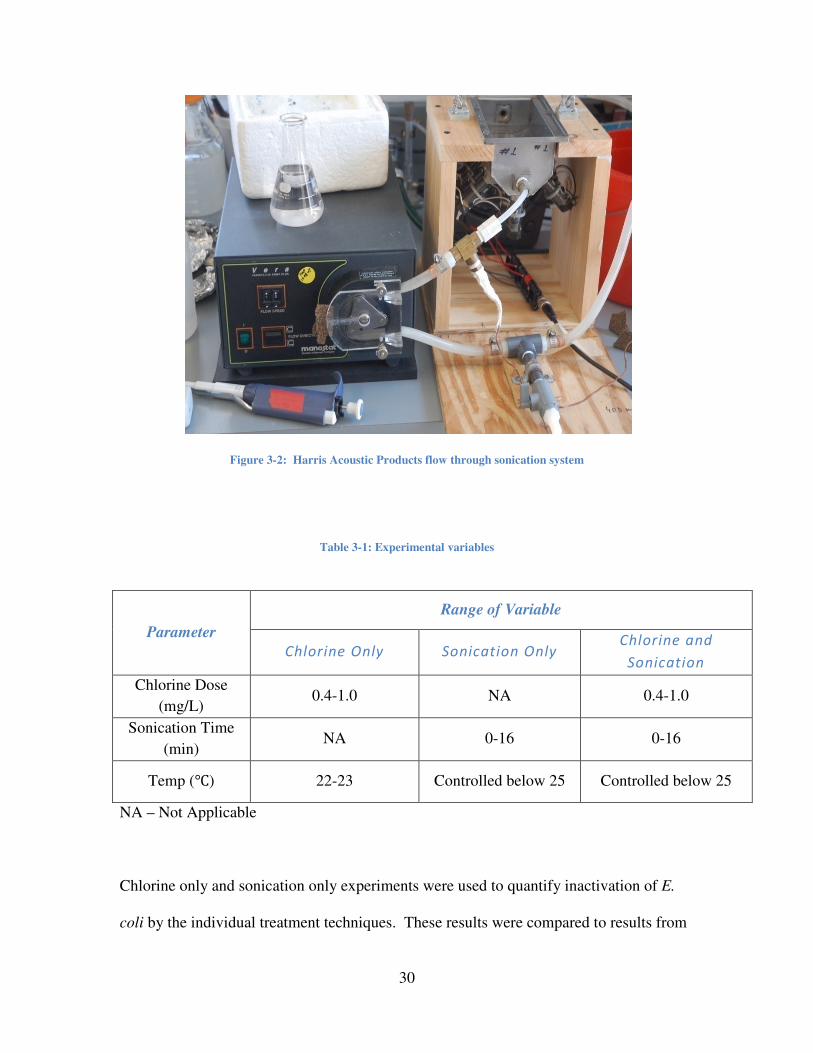
Figure 3-2: Harris Acoustic Products flow through sonication system ........................... 30
Figure 4-1: Log inactivation of E. coli with probe sonication system (performed at Tufts)
.................................................................................................................................... 52
Figure 4-2: Log Inactivation of E. coli with Probe Sonication System (performed at
WPI) ........................................................................................................................... 54
Figure 4-3: Log inactivation of E. coli with cavitation chamber system (performed at
Tufts) .......................................................................................................................... 55
Figure 4-4: Log inactivation of E. coli with cavitation system (performed at WPI) ....... 56
Figure 4-5: Log inactivation of E. coli with circulating cavitation system (preformed at
WPI) ........................................................................................................................... 57

viii
List of Tables
Table 2-1: Stage 1 DBPR MCLs and MCLGs (U.S. EPA 1998) .................................... 13
Table 3-1: Experimental variables .................................................................................... 30
Table 3-2: Treatment and circulation times in flow through system ............................... 32
Table 4-1: Chlorine-only comparison .............................................................................. 58
Table 4-2: Chlorination plus sonication comparison ....................................................... 58

1
1 Introduction
1.1 Statement of Problem
Drinking water sources in the United States are vulnerable to contamination from point
sources (e.g. wastewater treatment plants) and non-point sources (e.g. agricultural
discharges). As a result of these waste inputs, pathogenic microorganisms that can cause
adverse health effects on human beings may be found in drinking water sources. It is
therefore important to disinfect waters intended for drinking to prevent negative public
health effects.
Chlorine is the most widely used disinfectant for drinking in the United States because it
is a strong disinfectant and is also cost effective and easy to apply. With proper dosing,
chlorine is effective at inactivating most microorganisms present in water supplies.
Chlorine also leaves a disinfectant residual which helps to minimize microbial growth or
contamination effects in the water distribution system. However, the disinfection
effectiveness of chlorine decreases when microorganisms are protected from chlorine
contact by attachment to other organisms or particulate matter. Also, some organisms,
such as Giardia lamblia and Cryptosporidium parvum, are resistant to chlorine
disinfection.
Another issue with chlorine disinfection is the formation of potentially carcinogenic
disinfection by-products (DBPs) when free chlorine reacts with natural organic matter.
Trihalomethanes (THMs) and haloacetic acids (HAAs) are two groups of DBPs formed

2
from chlorine disinfection. These by-products are regulated by the U.S. Environmental
Protection Agency (U.S. EPA) under the several DBP Rules which have become more
stringent in recent years.
Some alternative disinfectants of interests include ozone disinfection, UV irradiation,
chloramination, or the application of multiple disinfectants. Ozone is a strong oxidant
which produces fewer DBPs than chlorine, but must be generated on-site. UV irradiation
is effective for inactivation of Giardia lamblia and Cryptosporidium parvum, but
expensive to retrofit in large plants. Chloramines are a weaker disinfectant than free
chlorine. They are commonly used as a secondary disinfectant because they decay
slowly and provide adequate protection in distribution systems. Sonication, applied alone
or as a synergistic disinfectant, is an alternative that has not received yet sufficient
analysis to consider use in a full scale flow through system.
Sonication is the application of ultrasonic waves to water. Sonication may inactivate
microorganisms by fluid shear caused by velocity gradients in cavitation, but it also
causes breakup of flocs of bacteria that may make disinfection easier. This research aims
at investigating the germicidal effects of sonication and combined sonication and
chlorination on E. coli in a custom made bench-scale flow through cavitation system.
The objective is to provide data on the feasibility of using a similar design at a larger
scale in a treatment plant in the future.

3
1.2 Objectives
The main goal of this research was to demonstrate inactivation by sonication in a flow-
through system compared to a batch reactor. Synergy between chlorine and sonication,
which has been demonstrated in batch reactors, might allow a treatment plant to use less
chlorine to achieve the same amount of inactivation if similar synergy could be achieved
in full-scale, flow through systems. In order to achieve the goals, the following tasks
were completed:
1) determine the effects of chlorine alone on the inactivation of E. coli in both static
and flow through systems;
2) determine the inactivation of E. coli by sonication alone in both static and flow
through systems; and
3) determine the combined effect of simultaneous sonication and chlorination in both
static and flow through systems.
1.3 Scope of Research
The sonication experiments were conducted in two laboratories using a sonication probe
and a custom designed flow through sonication chamber. All experiments were well
controlled in the laboratory and were conducted at a starting temperature of
approximately 22oC. Phosphate buffered saline was used as the water matrix throughout
the entire experimental plan. E. coli was enumerated before and after disinfection using
pour plate and/or spread plate techniques to determine the inactivation achieved by
sonication.

4
To study the effects of sonication alone, E. coli suspensions were subjected to
disinfection with either an ultrasonic probe or flow through system. Power-to-volume
ratios of 180 W/L to 300 W/L were used, as were sonication times up to 16 minutes.
Temperature was monitored and controlled if necessary. The inactivation of E. coli was
also studied by chlorine disinfection. This was to allow comparison of inactivation with
a single disinfectant to inactivation in the combined disinfection experiments. Various
chlorine dosages were tested, ranging from 0.4 mg/L to 1.0 mg/L with chlorine contact
times up to 16 minutes. Combined application of sonication and chlorination
experiments were performed to study the possible synergistic effects of sonication. The
disinfectants were applied simultaneously. The experiments were conducted with the
same variables and parameters as the single inactivation method experiments, and
variables were the same to allow comparison.
1.4 Overview of Thesis
Due to the production of undesired halogenated DBPs as a result of chlorination,
increasingly stringent Disinfectant and Disinfection By-products Rules, and limitations of
some of the disinfection alternatives, there is a desire to discover another disinfection
method to reduce DBPs while maintaining disinfection effectiveness. Limited research
has been conducted on the effects of sonication on drinking water in a flow-through
system. Therefore, the results of this research will provide an overview of ultrasound as
a disinfectant, whether it is applied alone or combined with chlorine, and if less chlorine
can be used to achieve the same amount of E. coli inactivation in a flow through system.

5
Followed by this introduction chapter is the literature review, which provides details on
current drinking water regulations, various disinfectants, ultrasound, and prior sonication
studies. The methods chapter immediately following describes the exact practices and
procedures used in the study. Then, the results of the experiments are presented and
analyzed. This report ends with recommendations for further study.

6
2 Literature Review
Drinking waters in the United States are regulated by the U.S. Environmental Protection
Agency (U.S. EPA), which requires different levels of treatment based on water quality
and source. Surface water sources must be filtered and disinfected, while groundwater
sources generally require less treatment because of the protection afforded by the aquifer
system the water has passed through. The majority of treatment plants use chlorine for
disinfection; however, chlorine has several limitations as some pathogens are resistant to
chlorine and chlorine reacts to form potentially carcinogenic disinfection by-products
(DBPs). Therefore, alternative methods of disinfection are of interest to the drinking
water community.
This chapter introduces relevant drinking water regulations, current disinfection methods,
and a potential alternative disinfection option: sonication.
2.1 Drinking Water Regulations
The U.S. EPA was formed in December of 1970, after being established by President
Nixon, and is responsible for regulating drinking water quality. The framework for these
regulations is provided through the Safe Drinking Water Act (SDWA), which was first
published in 1975. Specific regulations are provided for monitoring and treatment of
surface waters and groundwaters as discussed below.

7
2.1.1 Safe Drinking Water Act
The Safe Drinking Water Act (SDWA) of 1975 was the first widespread drinking water
regulation implemented in the United States. The SDWA required the U.S. EPA to
establish the National Interim Primary Drinking Water Regulations (NIPDWRs). These
regulations were to contain maximum contaminant levels (MCLs) for a specific set of
contaminants known to exist at the time and commonly found in drinking waters. MCLs
are set to protect public health based on the prevalence and effects of that contaminant
while also considering the cost and availability of treatment for each contaminant. MCLs
are enforceable standards that must be met by water providers. The SDWA also
mandated that the U.S. EPA establish monitoring practices for treatment plants. Finally,
the SDWA contained the mandate that the U.S. EPA evaluate the feasibility and success
of the NIPDWRs and create the National Primary Drinking Water Regulations
(NPDWRs). The NPDWRs are permanent standards that fully take into account cost-
benefit analysis and public comment for determining contaminant limits.
2.1.1.1 1986 Amendments to SDWA
In 1986, the SDWA was amended in an effort to continue to update drinking water
standards in the U.S. The amendments required the EPA to establish 83 MCLs within
three years and to establish no less than 25 new MCLs every three years following. Also
required was the establishment of maximum contaminant level goals (MCLGs). MCLGs
take into account only human health effects, instead of being a balance of achievability,
cost and human health effects. MCLGs are non-enforceable ideals that the U.S. EPA
wishes to work toward.

8
2.1.1.2 1996 Amendments to SDWA
The 1996 amendments to SDWA established the current system that EPA uses to create
MCLs. First, contaminant effects are fully considered in an attempt to establish the level
at which contaminants are harmful to human health. Next, the proposed standards are
published and public comments are accepted on the prospective regulations. Only after
input from the public and professionals in the water industry are the MCLs established.
New standards were mandated for arsenic and radon, and public water systems were
required to annually distribute consumer confidence reports (CCRs) to all households
receiving municipal water. CCRs provide details on the previous year’s testing and water
quality results and other relevant data about the water being delivered to consumers.
2.1.2 Surface Water Treatment Rule
The Surface Water Treatment Rule (SWTR) was established in 1989. It was effective as
of December 31, 1990 (U.S. EPA 1989a). This rule applies to all municipal water
providers that use surface water as a water source. The U.S. EPA set the maximum
contaminant level goal (MCLG) to be zero for Giardia lamblia, viruses, and Legionella
(U.S. EPA 1989a). Under the SWTR, all water systems that use surface water sources
are required to provide filtration and disinfection. A treatment plant may avoid filtration
by complying with several criteria set up by the U.S. EPA, and these criteria include the
quality of source water, protection of the watershed, and the ability to meet all
disinfection requirements. The Surface Water Treatment Rule also requires 99.9% (3 log)
inactivation or removal of Giardia lamblia cysts and 99.99% (4 log) inactivation or

9
removal of viruses. In addition, disinfection residuals have to be maintained and
monitored above a certain concentration in the water distribution system. The SWTR
also established requirements for turbidity, and required monitoring of this parameter.
For systems that practice conventional or direct filtration, turbidity measurements are
required to be less than 0.5 Nephelometric Turbidity Units (NTU) in at least 95% of
samples taken monthly and must not exceed 5 NTU as a maximum (U.S. EPA 1989a).
Also established was a series of “credits” for practices other than inactivation that
provide removal of regulated pathogens. These credits were a straightforward way of
calculating the actual log-inactivation required by disinfection.
2.1.2.1 Interim Enhanced Surface Water Treatment Rule
In 1998, the Interim Enhanced Surface Water Treatment Rule (IESWTR) was
promulgated to improve control of Cryptosporidium in surface waters. Cryptosporidium
had emerged as pathogen especially resistant to chlorine disinfection. In 1993, an
outbreak of Cryptosporidium in Milwaukee, Wisconsin, left over 100 people dead and
over 1 million sick. While the source of the pathogen was never officially identified, an
extensive rain event in the area created high turbidity levels in the raw water. This
resulted in suboptimal coagulation although the plant was meeting current U. S. EPA
requirements (MWH 2005). Based on concerns with Cryptosporidium, the IESWTR
required a 2-log reduction in Cryptosporidium. The rule also required more specific
monitoring of each filter in a treatment system to make sure all water was being treated
adequately, rather than monitoring just the blended water after filtration. The maximum
effluent turbidity from conventional and direct filtration was set at 0.3 NTU in a

10
minimum of 95% of samples taken each month, and the maximum allowable turbidity
was set at 1 NTU (U.S. EPA 1998a). This regulation applied only to surface water
systems serving more than 10,000 people (U.S. EPA 1998a).
2.1.2.2 Long Term 1 Enhanced Surface Water Treatment Rule
The Long Term 1 Enhanced Surface Water Treatment Rule (LT1) was published in 2002.
The rule mandated that all surface water systems, including those serving less than
10,000 people, comply with the terms of IESWTR (U.S. EPA 2002).
2.1.2.3 Long Term 2 Enhanced Surface Water Treatment Rule
The Long Term 2 Enhanced Surface Water Treatment Rule (LT2), similarly to IESWTR
and LT1, was established to further control Cryptosporidium in drinking water. In order
to protect against possible future outbreaks, the LT2 requires monitoring of source waters
for Cryptosporidium. Based on levels detected, systems may be required to meet higher
levels of inactivation and removal than the LT1 previously required. Through the LT2,
the U.S. EPA established a “toolbox” of options for controlling Cryptosporidium,
including protecting the source water area, improving filtering, and adding UV or ozone
disinfection. For smaller systems, however, many of these options are prohibited by
monetary limitations (U.S. EPA 2006b).

11
2.1.3 Groundwater Regulations
The final Groundwater Rule was published in 2006. The rule requires sanitary surveys to
identify systems and areas which are influenced by surface water or have other
questionable sources, and can therefore contain more pollutants or microorganisms than
typical groundwaters. Systems that were deemed to be at risk are required to provide 4-
log inactivation of viruses (U.S. EPA 2006a).
2.1.4 Regulations for All Public Water Systems
In addition to the rules above that apply specifically to municipal water systems using
either a surface or groundwater source, there are is a significant set of U.S. EPA
regulations that apply to all drinking waters, regardless of source.
2.1.4.1 Total Coliform Rule
The Total Coliform Rule was published in final form in late 1989 and became effective in
at the end of 1990. The rule requires that all water systems sample for coliforms based
on the population they serve. For example, systems which serve fewer than 1000 people
may test once a month, systems with 50,000 or more customers test 60 times per month
and those with at least 2.5 million customers test at least 420 times per month (U.S. EPA
1989b). Coliforms are not pathogenic organisms, but their presence in water indicates
that other pathogenic organisms may be present (MWH 2005). Because disease
outbreaks have occurred with very low levels of coliforms detected (MWH 2005), the
U.S. EPA set the MCLG for total coliforms at 0, and set a legally binding limit of
positive coliforms in less than 5% of samples taken (U.S. EPA 1989b).

12
2.1.4.2 Stage 1 Disinfectants and Disinfection By-Products Rule
Disinfection by-products (DBPs) are potentially carcinogenic compounds created when
disinfection chemicals react with natural organic matter present in source waters. In
order to protect the public from disinfection by-products, the U.S. EPA established the
Stage 1 Disinfectants and Disinfection By-Products (Stage 1 DBP Rule) in 1998. The rule
only applied to surface water systems and groundwater systems found to be under the
direct influence of surface water, because these sources typically contain enough organic
matter to cause DBP production (MWH 2005). Larger systems (10,000 or more served)
were required to become compliant by January 1, 2002. Systems serving fewer than
10,000 people and groundwater systems under the influence of surface waters must
comply with the Stage 1 DBPR requirements by January 1, 2004. The rule established
the maximum residual disinfectant level goals (MRDLGs) and the maximum residual
disinfectant levels (MRDLs) for chlorine, chloramine, and chlorine dioxide (U.S. EPA
1998b).
Also included in the Stage 1 D/DBP Rule are a set of maximum contaminant level goals
(MCLGs) and maximum contaminant levels (MCLs) to limit the production of
disinfection by-products, such as total trihalomethanes (TTHMs), five haloacetic acid
compounds (HAA5), chlorite, and bromate (U.S. EPA 1989b). TTHMs include
chloroform, bromodichloromethane, dibromochloromethane, and bromoform. An MCL
was set for HAA5 (monochloroacetic acid, dichloroacetic acid, trichloroacetic acid,
monobromoacetic acid, and dibromoacetic acid), while MCLGs are provided for

13
dichloroacetic acid and trichloroacetic acid. Both the MCLGs and the MCLs are listed in
Table 2-1. It should be noted that the regulation allowed averaging of DBPs measured at
different locations in the distribution system to occur. If DBP levels were high in one area
of a distribution system, the system could remain in compliance if other areas were low
enough that the average values were in compliance.
Table 2-1: Stage 1 DBPR MCLs and MCLGs (U.S. EPA 1998)
Disinfection by-products MCL (mg/L) MCLG (mg/L)
Total trihalomethanes (TTHM) 0.080 Not applicable
Chloroform 0
Bromodichloromethane 0
Dibromochloromethane 0.06
Bromoform 0
Haloacetic acids (five) (HAA5) 0.060 Not applicable
Dichloroacetic acid 0
Trichloroacetic acid 0.3
Chlorite 1.0 0.8
Bromate 0.010 0
In an effort to further control DBPs, the U.S. EPA also regulated organics in water. This
part of the rule requires some municipal systems to remove a higher percentage of total
organic carbon depending on the source water concentration of TOC and alkalinity. The
U.S. EPA did not specify how this removal needed to be accomplished.
2.1.4.3 Stage 2 Disinfectants and Disinfection By-Products Rule
The Stage 2 Disinfectants and Disinfection By-Products Rule built on the standards and
goals outlined in the Stage 1 D/DBP Rule. While the MCLs did not change, the manner
in which DBP concentrations were measured and calculated became stricter. First,

14
sample locations had to be established at points in the distribution system where DBP
levels were highest. Second, running annual averages (RAAs) for the entire system were
no longer adequate for compliance. Instead, RAAs for each sample location were
required for compliance. The new regulations make compliance more difficult for public
water systems, as small areas of high DBP concentrations can be caused by features in
distribution systems such as low flow areas and dead ends (U.S. EPA 1998b).
2.1.5 Regulation Summary
Compliance with the above regulations can be difficult for water systems because the
methods for solving problems under the regulations sometimes conflict. For instance,
with systems using chlorine for disinfection, DBPs are lowered (to comply with the Stage
2 D/DBP Rule) most easily by reducing chlorine concentration. However, inactivation
required by the LT2 is achieved most easily by adding more chlorine. Because of these
conflicts that exist, there is interest in finding alternative disinfectants that would allow
compliance with all regulations (MWH 2005).
2.2 Disinfection
Chlorine is the most common disinfectant used in the United States, with over 90 percent
of current U.S. water supplies using it as all or part of their disinfection process (NDWC
1996), but other methods, such as ozone and UV light are also used. Chlorine
disinfection can be achieved with gaseous chlorine, sodium hypochlorite, and calcium
hypochlorite. Other disinfectants used in the United States include chlorine dioxide,

15
ozone and UV light. The following sections discuss the application and effectiveness of
each of these disinfectants.
2.2.1 Chlorine
Chlorine is the most widely used disinfectant in the U.S. In 1908, the Jersey City Water
Works began the first use of chlorine as a large scale disinfectant in the United States
(NDWC 1996). Today, a large percentage of treatment plants use chlorine for primary or
secondary disinfection (MWH 2005).
Chlorine is economical, and there is significant operator experience with chlorine
chemicals, making it an attractive option for disinfection. Chlorine effectively inactivates
a wide variety of waterborne pathogens (HDR Engineering 2001). It also removes some
unpleasant tastes and odors from surface waters with high algal concentrations and it
reduces coloration due to organic compounds in water (NDWC 1996). It is somewhat
effective against viruses (including inactivations over 2 log), and Giardia (when
inactivations of less than 2 log are necessary), but not as effective against
Cryptosporidium or Giardia when more than 2 log inactivation is necessary (HDR
Engineering 2001). Lastly, chlorine remains in the water in residual concentrations, for
secondary disinfection in the distribution system. However, chlorine also has drawbacks.
First, chlorine reacts with organic compounds in water to form carcinogenic disinfection
byproducts, including THMs and HAAs as described in Section 2.1.4.2. Second, the safe
transport and storage of certain types of chlorine, especially chlorine gas, prior to
treatment can present problems. Lastly, some pathogens are resistant to chlorine

16
disinfection. These include Cryptosporidium parvum and Giardia lamblia, which require
high doses (greater than 5.0 mg/L) of chlorine for inactivation.
Chlorine can be applied to drinking water in three ways: gaseous chlorine, sodium
hypochlorite, and calcium hypochlorite. Chlorine gas reacts in water to form free Cl2 and
hypochlorus acid (HOCl), as shown in Reaction 1. Sodium hypochlorite forms
hypochlorus acid when added to water, as shown in Reaction 2. Calcium hypochlorate
dissolved in water also produces HOCl, as shown in Reaction 3. Additonally, HOCl
undergoes acid-base reactions to form hypochlorite ion, as shown in Reaction 4. This
reaction will not proceed at all at a pH of 6.5 or less, and it will proceed fully at 8.5 or
more. Because hypochlorus acid is a far superior disinfectant, chlorination is
substantially more effective at a lower pH (MWH 2005).
−+++→+ ClHHOClOHgCl 22 )( (Reaction 1)
−+++→+ OHNaHOClOHNaOCl 2 (Reaction 2)
−+++→+ OHCaHOClOHOClCa 222)( 2
22 (Reaction 3)
−++↔ OClHHOCl (Reaction 4)
2.2.2 Chloramines
Chloramines are compounds that are formed when ammonia reacts with dissolved
chlorine. Chloromines can take three forms: mono (Reaction 7) and di (Reaction 8)
chloramines and nitrogen trichloride (Reaction 9). Reactions 5 through 9 show how
chloramines are formed.

17
��� + ��� → ���� + �� + �� (Reaction 5)
���� ↔ ��� + �� (Reaction 6)
��� + ���� → ����� + ��� (Reaction 7)
����� + ���� → ����� + ��� (Reaction 8)
����� + ���� → ����� + ��� (Reaction 9)
Chloramines were found to be effective as a secondary disinfectant because they are
more stable than chlorine and remain in the distribution systems longer. However,
chloromines are weaker than chlorine and would require large contact times or doses for
primary disinfection (U.S. EPA 1999). Chloramines are as much as 100 times less
effective than chlorine at low pHs, so they are rarely used as a primary disinfectant
(MWH 2005).
When compared to free chlorine or chlorine dioxide, chloramines form fewer DBPs
because they do not react as easily with organic compounds found in source water.
Additionally, chloramines must be produced at the point of use, requiring more operator
training and skill to use (U.S. EPA 1999). Another consideration is that significant safety
procedures are necessary for facilities using chloramines because toxic gas is created
when chlorine and ammonia are allowed to mix (HDR Engineering 2001).
2.2.3 Ozone
Ozone is one of the strongest oxidants available for use in water treatment. It is usually
generated on-site, through an energy intensive process that converts pure oxygen gas to

18
ozone as shown in Reaction 10. The resulting gas is bubbled through the treated water in
a contact tank that maximizes contact time (HDR Engineering 2001). After the gas
passes through water in the treatment plant, it must go through an ozone destructor so that
ozone is not released into the atmosphere (MWH 2005).
32 23 OO → (Reaction 10)
One notable advantage of ozone is that because it is generated on-site, the need for
transportation and storage of large amounts of a toxic substance is mitigated. Ozone
produces fewer THMs and HAAs than traditional chlorine methods. However, it does
produce some of the same DBPs produced by chlorine (aldehydes) and some unique to
ozone treatment, such as bromate ( ���, which is regulated under the Stage 1 D/DBP
rule), aldoketoacids and carboxylic acids (MWH 2005). Ozone is acceptable for
inactivations of viruses, Giardia, and Cryptosporidium over a 2 log kill. It may be used
in both small and large treatment systems, but does require very skilled operators because
the gas must be generated, used and destroyed onsite(HDR Engineering 2001).
2.2.4 Ultraviolet Radiation
Ultraviolet radiation (UV) is a non-chemical method of disinfection. UV inactivates
microorganisms though a unique process: organisms absorb the radiation and a
photochemical reaction that occurs damages vital components of the cells, leaving them
either dead or unable to reproduce. In addition to its effectiveness, one of the most
attractive attributes of UV treatment is that it does not produce any known DBPs.

19
Earlier research in the 1990’s indicated that UV was ineffective against certain
microorganisms, especially Cryptosporidium parvum and Giardia lamblia. However, it
was later determined that the methods used to determine the viability were inadequate.
Subsequently, Bukhari et al. (2000) showed that UV is very effective against
Cryptosporidium parvum, and Shin et al. (2000) showed that low pressure UV systems
are very effective for inactivation of Giardia lambia at cost effective dosages. However,
it can be expensive to retrofit large water treatment systems with UV because of the
significant construction costs involved (MWH 2005). The operator skill required for UV
systems medium (HDR Engineering 2001).
2.3 Sonication
Sonication is the process of applying sound waves at ultrasonic frequencies to water in an
effort to inactivate microorganisms in that water. Sonication has been evaluated as a
sole disinfectant, and also in conjunction with other disinfectants to enhance inactivation.
2.3.1 Sonication Alone
Several hypotheses exist for the inactivation mechanisms of sonication. Blume et al
(2002) hypothesized that inactivation is a combination of shear forces caused by velocity
gradients, breakdown of cell walls, and increasing vulnerability of pathogens by breaking
up flocs or breaking microorganisms off particles to which they have attached.
Additionally, free radicals and hydrogen peroxide produced when cells are exposed to
sonication are potentially “cytotoxic and mutagenic” (Riesz and Misik 1999).

20
Clasen and Sobatta (1994) evaluated the inactivation of the microorganisms
Artemiasalina and Cyclops nauplii by sonication applied at 22 kHz. Artemiasalina and C.
nauplii concentrations were reduced by 40 to 60% in four seconds, and significantly more
kill was observed as time was increased. The authors also showed that, because “from 20
kHz onwards the cavitation threshold increases with the transmitted frequency,”
application of ultrasound close to the 20 kHz frequency was most effective in causing
cavitation.
Blume et al. (2002) evaluated ultrasound for inactivation of both E. coli and fecal
streptococci organisms in wastewater. 0.9 and 2.9 log inactivation was achieved for E.
coli and fecal streptococci, respectively. However, very long treatment times and high
treatment intensities were required to accomplish this (see Figure 2-1). Therefore, this
study demonstrated that sonication alone is not adequate as a solitary disinfectant from an
economical standpoint (Blume, Martinez and Uwe 2002).
More recently, the inactivation of the protozoan pathogen Cryptosporidium parvum and
Giardia lablia by sonication has been studied (Graczyk, et al. 2008). Ultrasound
disintegration treatment was carried out on sewage sludge for 10 to 20 minutes. The
concentration of Cryptosporidium oocysts were reduced from 13.5 oocysts/g to non-
detectable levels for all treatment conditions tested, except for 10 minutes at 8 mm.
Giardia cysts were reduced from 27.3 cysts/g to non-detectable levels for the higher
amplitudes.

21
Figure 2-1: Inactivation on E. coli and fecal streptococci by sonication (Blume, Martinez and Uwe 2002)
2.3.2 Sonication with Ozone
The addition of sonication to ozonation creates a significant synergistic effect in the
inactivation of microorganisms. Burleson et al. (1975) demonstrated a synergistic effect
with combined sonication and ozonation for the inactivation of several microorganisms,
including multiple viruses and bacteria. Four scenarios were evaluated: ozone treatment
alone, sonication alone, simultaneous sonication and ozone treatment, and sonication
with oxygenation (to demonstrate the synergistic effect was due to ozone, not just
aeration). All tests were conducted with the microorganisms suspended in phosphate
buffer solution (PBS) and also secondary effluent. Sonication and sonication with
oxygenation showed no significant inactivation with treatment times up to 10 minutes.

22
When suspended in PBS, all types of bacteria tested were completely inactivated when
exposed to ozone contact or simultaneous application of ozone and ultrasound for 15
minutes. Longer contacts times were necessary when bacteria were suspended in
secondary effluent which the authors noted was more representative of real-world
applications. A synergistic effect was noted for combined treatment. (Burleson, Murray
and Pollard 1975)
Additional studies on E. coli inactivation have confirmed the synergistic effects of
combined ozone and sonication. Dahi et al. (1976) quantified the inactivation of E. coli
for three treatment scenarios: ozone alone, sonication followed by ozone treatment, and
simultaneous ozone treatment with sonication. A sonic probe system was used with an
output power of 160 W and an ultrasonic wave frequency of 20 kHz. Experiments were
conducted in three different media: (1) redistilled water (treated with potassium
permanganate, made isotonic and buffered with phosphate), (2) sterilized secondary
effluent from a wastewater treatment plant, (3) diluted sterilized secondary effluent. The
disinfection time was held constant. Results show that ozone treatment alone provided
the least inactivation of E. coli. Sonication pretreatment with ozonation directly after
was more effective at disinfecting E. coli than simultaneous application of ozone and
ultrasound. Both combined treatment scenarios were more effective than sonication or
ozonation alone. It was shown that ultrasonic waves enhanced microbial inactivation
with ozone and also chemical oxidation processes caused by the free radicals generated
from the decomposition of ozone. When the aeration constant (KLa) was calculated from
the experimental data, it showed an increase of 15 – 45% after sonication. While

23
inactivation still could be enhanced through the mechanical pathways discussed in
Section 2.3.1, the implication of this data is that inactivation was also aided by the
enhancement of the ozone transfer to liquid.
2.3.3 Sonication with Ultraviolet Light
Sonication is shown to have similar synergistic effects when applied in conjunction with
ultraviolet light. Data in UV studies show that long contact times are necessary for
inactivation through sonication only, and that these contact times make sonication
ineffective alone (Blume, Martinez and Uwe 2002). However, because of the marked
effect that particle size has on UV treatment, treatment of wastewater with sonication
combined with UV treatment shows an 0.8 to 1.2 order of magnitude increase in
inactivation of microorganisms when compared to treatment by UV light alone (Blume,
Martinez and Uwe 2002). In addition, the use of combined UV and ultrasound increased
the overall inactivation for a given amount of energy, thereby allowing for equal
disinfection at a lower cost (Blume, Martinez and Uwe 2002).
2.3.4 Sonication with Chlorine
The most important and relevant effects to the research presented here is the advantages
of using combined chlorine disinfection and sonication. As discussed above, recent
regulations pose a challenge for drinking water treatment plants that rely on chlorine
because of mandates to increase disinfection (when source water is poor) and
simultaneously reduce DBP levels. Sonication may serve to alleviate these issues as

24
combined treatment with sonication and chlorine improves inactivation compared to the
additive effects of the individual disinfectants.
Duckhouse et al. (2004), studied the inactivation of E. coli treated with simultaneous
sonication and chlorination (using sodium hypochlorite) and pre-treatment with
sonication before a period of chlorination. All experiments were conducted at 20℃. The
article lacks information on exact chlorine dose and focuses on the comparisons shown
between the different applications of sonication and chlorination. Sonication dose
information is included in the article, and two scenarios were used: 1.22 watts of power
applied at 850 kHz for a total intensity of 0.029 watts per square centimeter, and 22.34
watts applied at 20 kHz for a total intensity of 16.92 watts per square centimeter
(Duckhouse, et al. 2004).
Figure 2-2 shows results of E. coli inactivation using a 20 kHz frequency. The control
case (chlorine only) resulted in 2.5 log inactivation of E. coli with a 5 minute contact
time. Pretreatment with sonication was ineffective in reducing inactivation levels to 1-
log kill for 1 minute presonication and 1.7 log kill for 5 minute presonication.
Simultaneous treatment showed enhanced inactivation. A five-minute simultaneous
treatment resulted in 4.5 log reduction of E. coli, about 1.5 log better than the chlorine
alone. A one-minute pretreatment showed nearly 5.0 log reduction overall, an increase of
4.5 log over chlorine alone (Duckhouse, et al. 2004).

25
Figure 2-2: Chlorine inactivation of E. coli with pre- and simultaneous sonication at 20 kHz (Duckhouse, et al.
2004)
Combined sonication and chlorination was also studied at 850 kHz (see Figure 2-3).
Results were dissimilar to the results at 20 kHz. At 850 kHz, simultaneous treatment
resulted in poorer inactivation of E. coli compared to chlorine alone. In contrast,
pretreatment with 850 kHz sonication showed similar inactivation levels to 20 kHz
simultaneous sonication.
While inactivation results are quite similar for one minute of simultaneous treatment at
20 kHz and one minute of pre-treatment at 850 kHz, the viability of both of these options
is quite different. The power applied in both situations was not the same: only 1.22
watts were used at 850 kHz and 22.43 watts were applied at 20 kHz. Given this
information, Duckhouse et al. concluded that the best option for sonication was one-
minute pretreatment at 850 kHz.

26
Figure 2-3: Chlorine inactivation of E. coli with pre- and simultaneous sonication for 1 minute (Duckhouse, et
al. 2004)
Earlier work by Phull et al. (1997) had also demonstrated a synergistic effect between
sonication and chlorination. E. coli suspended in both saline solution and raw stream
water were used for comparison in their experiments. After 5 minutes of treatment time,
1 mg/L chlorine inactivated 43% of the bacteria in the stream water and sonication alone
inactivated 19% of the same bacteria. When sonication was applied followed by
chlorination, 86% inactivation of bacteria was achieved. After 20 minutes, 100%
inactivation of bacteria was achieved with the application of combined sonication and
chlorination. Their research also indicated that increasing the sonication power from 12
watts/cm2 squared to 21 watts/cm
2 increased the bacterial kill by 40% for a 5 minute
treatment time in the presence of chlorine. Frequency also affected the percent
inactivation of bacteria. Using the same amount of power, they concluded that higher

27
ultrasonic wave frequency (800 kHz) was more effective than low frequency (25 kHz).
With 1 minute of sonication followed by 5 minutes chlorine contact time and under the
same sonication power, 75% of the bacteria survived after treatment at 25 kHz while only
20% survived at 800 kHz. These data suggested that sonication followed by chlorination
is a better choice than chlorination followed by sonication, because the latter scenario
causes a degassing effect, leading to lower chlorine concentrations (Phull, et al. 1997).
2.3.5 Sonication Summary
Preliminary research has demonstrated the possible synergistic effects of sonication and
chlorination. For application to full-scale water treatment plants, a flow through
sonication system is needed. The bench scale setup built for this project is the next step
in developing sonication technology for use in drinking water treatment. The results of
this research are of interest to the water treatment community because the need exists for
alternative disinfection schemes that allow for adequate disinfection to comply the LT2
Rule while also lowering the levels of DBPs in finished waters. This research was
undertaken to further evaluate sonication due to limited research on sonication as a
potential alternative disinfectant.

28
3 Methods
The goals of this research were to determine the inactivation of E. coli by sonication
alone and by the combination of sonication and chlorination in a bench-scale flow
through cavitation system. A series of experiments were designed and conducted to
achieve these goals. This chapter begins with an overview of the experimental plan for
evaluating inactivation of E. coli. This is followed by the experimental procedures and
finally, the analytical methods.
3.1 Experimental Design
Two sonication systems were used in the research: a probe system and a flow through
system. The probe system was a Misonix system, which is shown in Figure 3-1. Prior
research had demonstrated the effectiveness of the probe system in conjunction with low
dose chlorination for the inactivation of E. coli and MS2 coliphage (Plummer and Long
2005). Thus, this system was used as a comparison to the newly designed flow through
system.
The flow through cavitation system, shown in Figure 3-2, was designed and constructed
by Harris Acoustics Products Corporation, East Walpole, Massachusetts. The sonication
chamber consisted of a stainless-steel sonication chamber with 12 transducers mounted
on the underside. A peristaltic pump circulated the test water through the system, which
included sterile, chlorine demand free Tygon 3603 tubing and a custom copper heat-
exchanging coil, which was placed in an ice bath to control temperature. Temperature

29
was monitored via a temperature probe mounted in the circulation system just after the
sonication chamber.
Figure 3-1: Misonix probe sonication system
The disinfection experiments conducted in this research consisted of four major
categories: chlorination alone, sonication alone, the combination of chlorination and
sonication, and control experiments. The disinfectants for the combined chlorination and
sonication experiments were applied simultaneously. For experiments with extended
sonication times, the temperature was controlled via the cooling coil to prevent the
confounding impacts of heating on the inactivation of E. coli. All experiments were
conducted in phosphate buffered saline (PBS) with a known starting concentration of E.
coli. Table 3-1 summarizes all experiment parameters used in this research.
30
Figure 3-2: Harris Acoustic Products flow through sonication system
Table 3-1: Experimental variables
Parameter
Range of Variable
Chlorine Only Sonication Only Chlorine and
Sonication
Chlorine Dose
(mg/L) 0.4-1.0 NA 0.4-1.0
Sonication Time
(min) NA 0-16 0-16
Temp (℃) 22-23 Controlled below 25 Controlled below 25
NA – Not Applicable
Chlorine only and sonication only experiments were used to quantify inactivation of E.
coli by the individual treatment techniques. These results were compared to results from

31
simultaneous chlorination and sonication experiments to determine if a synergistic effect
occurred. Control experiments provided a baseline comparison to demonstrate any other
pathways in the system that may cause removal or inactivation of microorganisms.
Based on preliminary experiments, chlorine doses of 0.4 to 1 mg/L were chosen.
Chlorine doses greater than 1 mg/L inactivated E. coli to undetectable counts; lower
chlorine doses did not provide any significant inactivation. Based on these
considerations, a chlorine dose of 0.6 mg/L was determined to be the most suitable
concentration among the tested doses.
For sonication, contact times of up to 16 minutes were tested with samples taken at
several intervals during exposure. For the probe system, treatment times were equal to
actual times. For the flow through system, the volume of the cavitation chamber was 400
mL and approximately 100 mL of the sample was contained in the tubing and coil.
Water in the tubing and coil is not exposed to sonication. Therefore, circulation times
were longer than the treatment times to account for the time spent in the tubing and coil.
Table 3-2 shows the actual circulation times used in the experiments, and the
corresponding treatment times achieved. In the results section, times are presented as
treatment times.
Control and chlorine only experiments were conducted at room temperature. For
experiments with the probe system, experiments were started at room temperature (22oC)
and monitored through treatment. For experiments with the flow through system,

32
temperature was controlled to between 20oC and 25
oC by immersing the copper coil in an
ice bath.
Table 3-2: Treatment and circulation times in flow through system
Actual Circulation
Time (min:sec)
Treatment Time in
Chamber (min:sec)
1:16 1:00
2:32 2:00
5:04 4:00
10:08 8:00
20:16 16:00
A portion of the experiments were conducted at Worcester Polytechnic Institute (WPI) in
Worcester, Massachusetts, and a portion at Tufts University Cummings School of
Veterinary Medicine (Tufts) in North Grafton, Massachusetts. All experiments at WPI
used E. coli as the test organism. Experiments at Tufts were conducted with E. coli,
Cryptosporidium parvum and Bacillus subtilis. This thesis is focused on E. coli results,
using data from both university laboratories.

33
3.2 Experimental Procedures
This section describes in detail the preparations and procedures for all experiments. First,
preparation of E. coli is discussed. Then, methods for chlorination alone, sonication
alone, and combined sonication and chlorination experiments with the probe system are
provided. Control experiments are discussed, and lastly, the methods for the flow
through system are detailed.
3.2.1 E. coli Preparation
For each experiment performed, E. coli was grown in nutrient broth, centrifuged to
decant the broth, and resuspended in phosphate buffered saline (PBS) or chlorine demand
free (CDF) PBS. Then, a certain volume of the resuspended E. coli was added to the
experimental water (CDF PBS) to obtain the desired starting concentration of 3 x
107cfu/mL.
Two days prior to experimentation, two sterile 125-mL Erlenmeyer culture flasks, each
containing 50 mL of tryptic soy broth, were transferred from the refrigerator to the
incubator and incubated at 35oC overnight. One day prior to the experiment, E. coli from
the frozen stock culture was transferred to culture flasks using a wire loop. The
inoculated flask was then put on a rotating platform in the incubator at 35oC, shaking at a
constant rate of 100 revolutions per minute (rpm). The inoculated flask with E. coli was
allowed to grow in the incubator overnight for 16 – 18 hours.
34
On the day of an experiment, the E. coli culture was centrifuged to remove the broth.
First, the centrifuge (Marathon 21000R, Fisher Scientific, Pittsburgh, PA) was cooled
down to 4oC. Then, one of the culture flasks was taken out of the incubator. The 50 mL
in the flask was split into two autoclaved centrifuge tubes (Oakridge 50 mL centrifuge
tubes 3119-0050 PPCO, Nalge Company, Rochester, NY). The two tubes were then
centrifuged at 3,650 rpm for 20 minutes at 4oC.
After twenty minutes, the broth in one of the tubes was decanted, leaving behind only the
pellet of E. coli at the bottom of the tube. The pellet was resuspended in a dilution bottle
containing 25 mL of 0.01 M CDF PBS. A small volume of the CDF PBS was poured
into the centrifuge tube and shaken until the pellet was completely dissolved. The
solution was then poured back into the dilution bottle. The resuspended E. coli was
either used immediately or stored in the refrigerator for up to three hours until use.
According to the results from trial experiments, the resuspended E. coli solution had an
approximate concentration of 4 x 10⁹cfu/mL.
To perform an experiment, a certain volume of resuspended E. coli was spiked into the
test water (CDF PBS) to achieve the desired initial concentration of E. coli (3 x
107cfu/mL). The volume of resuspended E. coli added to the test water was determined
by Equation 11:
������������� ∗ ������������� = ����� ����� ∗ ����� ����� (Equation 11)

35
In this equation, Cresuspension = 4 x 10⁹
cfu/mL, Ctest water = 3 x 10⁷ cfu/mL, and the volume
of the test water varied for different experimental conditions. For experiments with the
probe system, the test water was prepared in an autoclaved, CDF media bottle. 1 mL of
test water was withdrawn from the media for a pre-disinfection E. coli count. For
experiments with the flow through system, the test water was poured into the cavitation
chamber. Then, the appropriate volume of resuspended E. coli was added to the
cavitation chamber. The system was allowed to circulate for 90 seconds to ensure mixing
and 1 mL of test water was withdrawn from the center of the cavitation chamber for pre-
disinfection E. coli counts. The test water was then ready for disinfection experiments.
3.2.2 Experiments with Probe Sonication System
3.2.2.1 Chlorine Only Experiments
For each experiment performed, a CDF sterile 1-L media bottle containing 500 mL
0.01M CDF PBS (test water) was allowed to reach room temperature. Then, 3.75 mL of
the resuspended E. coli was spiked into the test water. The bottle was gently inverted to
mix, then 1 mL was withdrawn and transferred to a sterile dilution test tube containing 9
mL 0.01M PBS. The test tube was immediately placed in the refrigerator and was used
to determine the pre-disinfection E. coli concentration.
Chlorine was applied to the sterile CDF media bottle. The volume of chlorine stock
solution added was calculated via Equation 12:
�� !��"# ∗ �� !��"# = ����� ����� ∗ ����� ����� (Equation 12)

36
In this equation, Ctest water ranged from 0.4 to 1.0 mg/L and Vtest water was 500 mL. After
chlorine was added to achieve the desired dose, the bottle was gently inverted to mix.
During the reaction period, 1 mL of test water was removed at specified intervals to
determine the E. coli concentration. The 1 mL samples of test water were immediately
quenched after sampling by adding a specified amount of sodium thiosulfate (Na2S2O3)
solution. Upon quenching, the post-disinfection water samples were transferred to
dilution tubes and put in the refrigerator for post-disinfection E. coli enumeration.
3.2.2.2 Sonication Only and Combined Sonication/Chlorination
A probe-type sonicator (Sonicator 3000, Misonix Inc., Farmingdale, NY) was used for
sonication only experiments and combined disinfectants experiments (sonication plus
chlorination) as a comparison to the flow through system. The sonicator was set to the
highest output power intensity of 10.0, which resulted in a power output of approximately
90 W. This power output along with the volume of test water was used to determine the
power-to-volume ratio. Using a 500 mL sample, the power-to-volume ratio tested was
180 W/L. The ultrasonic frequency was constant at 20 kHz and could not be altered.
Since sonication only experiments did not involve chlorine, the PBS and glassware used
in these experiments were sterile but did not have to be chlorine demand free. CDF
materials were used for combined sonication and chlorination experiments.
All sonication only experiments started at room temperature (22 – 23oC). For the
experiments, 3.75 mL of resuspended E. coli was spiked into a 1 L media bottle
containing 500 mL of sterile 0.01 M PBS. Prior to disinfection, 1 mL was removed to
37
determine the pre-disinfection E. coli concentration. Then, the test water was transferred
to a 600 mL autoclaved beaker (Kimax #14000). The sonication probe was placed at the
center of the beaker and approximately 1 inch below the water surface. The sonicator
was started and the output power shown on the screen of the generator was monitored.
At each specified time interval, temperature was recorded, followed by the removal of 1
mL of solution for post-disinfection E. coli enumeration. Sodium thiosulfate was added
to the post-disinfection samples. Although the sonication only samples did not have
chlorine, this step was performed to ensure consistency in sample processing. For
sonication and chlorination experiments, the same procedures were used as sonication
only experiments with one exception: chlorine was dosed into the beaker at the same
time that the sonication was started.
3.2.3 Experiments with Flow-through Sonication System
A sonication system as described in Section 3.1 was used to evaluate the germicidal
effectiveness of a flow through cavitation device. The system operated at 25 ± 6% kHz
and provided up to 150 W of power output, and these parameters were fully adjustable.
Prior to an experiment, the cavitation system was washed twice with sterile distilled
water. To wash the system, approximately 500 mL of distilled water was poured into the
chamber, circulated with the pump at high speed for 60 seconds, and then drained via the
access port in between the pump and the coil. This step was repeated twice. The
chamber with the transducers was then sprayed with a 50% ethanol solution and allowed
to dry. Then, 500 mL of 0.01 M CDF PBS was added to the chamber and the pump

38
turned on to fill the tubing. The chlorine concentration of the test water was measured
after 90 seconds of circulation to ensure no residual chlorine was present. The
appropriate volume of resuspended E. coli was added to achieve the starting
concentration and the water was circulated for an additional 90 seconds to ensure a
uniform distribution of E. coli. A 1 mL sample was then taken from the center of the
chamber for pre-disinfection counts.
Next, the appropriate treatment was started: no treatment for the control experiments, or
the addition of chlorine and/or the start of sonication for the disinfection experiments. At
the times listed in Table 3-2, 1 mL samples were taken from the center of the chamber for
post-disinfection enumeration of E. coli. All samples were quenched with sodium
thiosulfate. Temperature and power output were monitored for all experiments, and
temperature was controlled as stated in Section 3.1.
3.3 Analytical Methods
3.3.1 Introduction
Aseptic techniques were applied throughout all experiments, which included the
culturing, transfer, disinfection, and enumeration of E. coli. This was done to prevent
contamination of samples by other microorganisms. During all transfers, aseptic
conditions were maintained by working in a clean bench and flaming all open containers.
All work spaces used in disinfection and enumeration processes were sterilized by
spraying with 50% ethanol. In addition, the thermometer and the sonication probe were
wiped with 50% ethanol. All glassware, plasticware, and metalware were also sterile.
Glassware was sterilized by autoclaving (Sterilmatic Sterilizer, Market Forge Industries
39
Inc., Everett, MA). Pre-sterilized plasticware, including petri dishes and serological
pipettes of various sizes were purchased. Finally, all culture media, enumeration media,
and chemical reagents were sterilized by use of the same autoclave.
3.3.2 E. coli Rehydration
The E. coli culture was purchased in dehydrated form from the American Type Culture
Collection (ATCC #11775). The dehydrated pellet of E. coli was received in a vial.
First, the cap of the vial was opened by using a flamed tweezer. Second, 1 mL of tryptic
soy broth (TSB) from an autoclaved test tube that contained 5 – 6 mL TSB was pipetted
into the vial to rehydrate the E. coli pellet. Then, the rehydrated contents were poured
from the vial back into the test tube, and the test tube was incubated at 35oC for 48 hours.
During the incubation period, 10 mL of 40% glycerol by volume was prepared by
combining 4 mL of glycerol and 6 mL of E-pure water. The glycerol was then
autoclaved. After the 48-hour incubation, the E. coli culture was transferred into a series
of sterilized microcentrifuge tubes. Each tube consisted of 0.5 mL of the E. coli culture
and 0.5 mL of 40% glycerol. The 12 microcentrifuge tubes were labeled as EC1 - EC12.
All of the vials tubes were frozen in –70oC alcohol, and then in a –70
oC freezer. The vial
labeled EC7 was used for this research.
3.3.3 Enumeration of E. coli
In the experiments performed at WPI, the pour plate method was used to determine the E.
coli concentration before and after disinfection. The samples were diluted to appropriate
concentrations before plating so as to give countable numbers of E. coli colonies on each
plate. At least 3 different dilutions were plated for each sample, with two replicates for

40
each dilution. A negative control, which consisted of PBS only without E. coli, was
plated for each sample, and agar only controls were plated for each bottle of agar. For
the experiments performed at Tufts University, the spread plate method was used (details
not provided).
3.3.3.1 Dilution Series
Dilution series were prepared in test tubes with closures. Each test tube contained 9 mL
of 0.01 M PBS. They were autoclaved before use. When 1 mL of undiluted sample was
introduced into the first tube, the concentration of the first tube became 10-1
(diluted by
10 times compared to the original concentration). When 1 mL of sample from the 10-1
tube was transferred to another tube that contained 9 mL of 0.01 M PBS, the
concentration of the second became 10-2
. The diluting process was continued until the
desired dilution had been reached.
3.3.3.2 Pour Plates
The procedures for pour plating are described in Standard Methods 9215B (APHA, et al.
2005). After the pre- and post-disinfection dilution series were completed, 1 mL of
sample from each appropriate dilution was pipetted into a 100-mm petri dish. Two
replicate plates were prepared for each dilution plus one negative control for each
experiment. The most diluted plates were placed in the back of the laminar flow hood
and the most concentrated in the front. Approximately 10 – 12 mL of liquid tryptic soy
agar at 47oC was pipetted directly onto the 1-mL sample such that the sample was evenly

41
distributed. The petri dish was covered and mixed in a figure eight motion. Then the
cover was opened slightly and the agar was allowed to solidify for 5 minutes. All pour
plates were incubated upside down at 35oC for 22 - 24 hours and were counted after the
incubation period was over. The ideal range of counts per plate was between 30 and 300.
The dilution with counts in the ideal range was used to determine the E. coli
concentration. If no dilution was in the ideal range, countable plates were used or the
experiment was repeated. Log reductions of E. coli for all post disinfection scenarios
were calculated.
3.3.4 Chlorine
Chlorine used in this research was NaOCl purchased from the Fisher Scientific, with a
concentration of approximately 6% by weight (60 mg/mL). The bottle of chlorine was
wrapped with aluminum foil so as to block out light that would cause it to decompose.
To prevent contamination of the reagent bottle, approximately 35 mL of chlorine stock
was poured into a 40-mL glass vial wrapped with aluminum foil for everyday use.
Chlorine in the vial was used and refilled if needed. Since the concentration of chlorine
stock applied in the disinfection experiments was small, it was difficult to measure the
small volume to be added to the test water. Therefore, chlorine stock solutions of
approximately 50 mg/L and 500 mg/L were prepared and used as needed to achieve
desired chlorine concentrations in the test water. All of the chlorine vials and bottles
were stored in the refrigerator at 4oC.

42
3.3.5 Free and Total Chlorine Concentrations
All glassware used to determine the concentration of both free and total chlorine, such as
125 mL Erlenmeyer flasks, 100 mL volumetric flasks, and test tubes, was chlorine
demand free. This was done to ensure the chlorine applied would not be consumed by
organic matter attached to the glass. CDF glassware was prepared by soaking glassware
in a 100 mg/L chlorine bath. Just before use, the glassware was rinsed 3 times with E-
pure water to remove any chlorine remaining on the glass.
3.3.5.1 Free Chlorine Calibration Curve
A free chlorine calibration curve was used to relate chlorine concentrations to absorbance
values measured from a spectrophotometer. Standard Methods 4500-Cl G was used to
measure both free and total chlorine residuals using the DPD colorimetric method
(APHA, et al. 2005). The preparation of a free chlorine calibration curve involved the
use of spectrophotometer and titration. The spectrophotometer was set to wavelength of
515 nm. Five Erlenmeyer flasks and five volumetric flasks were taken out of the 100
mg/L chlorine bath and rinsed three times with E-pure water. The volumetric flasks were
filled up to the graduation line with CDF E-pure and labeled #1 through 5. A magnetic
stir bar was put into each of the Erlenmeyer flasks, followed by adding 5 mL of DPD
buffer solution and then 5 mL of DPD indicator solution. By use of a 10-µL syringe
dedicated for chlorine transfers (Hamilton Series 600/700 Fixed Needle Microliter
Syringe, Hamilton Company, Reno, Nevada), 2 µL of chlorine stock was transferred into
the volumetric flask. The chlorine solution was immediately poured into the Erlenmeyer
flask containing DPD buffer and indicator solutions and mixed. The solution turned

43
pink. A 10-mm spectrophotometer cell was rinsed with the solution and filled with
solution again, then it was placed in the spectrophotometer (Cary 50 Scan, Varian
Australia Pty Ltd., Mulgrave, Victoria, Australia) for an absorbance reading.
Immediately after the absorbance value was obtained, the solution in the cell was poured
back into the Erlenmeyer flask. The Erlenmeyer flask was placed on a magnetic stirrer
and then titrated against the FAS solution until the pink color just disappeared as
described in Method 4500-Cl F of Standard Methods (APHA, et al. 2005). The burette
readings before and after titration were recorded and the volume of FAS used was
determined.
The above processes were repeated for additions of 3, 4, and 5 µL of chlorine to the
volumetric flasks. For the first volumetric flask, no chlorine was added and only the
absorbance reading was taken for this blank solution. The volume of FAS consumed
during each titration was used to determine the initial chlorine concentrations in the
volumetric flasks. Using Microsoft Excel, a calibration curve was produced by plotting
the chlorine concentration in the volumetric flasks (mg/L) on the y-axis and absorbance
values (1/cm) on the x-axis. Both the equation and the R2 value were obtained.
3.3.5.2 Residual Free Chlorine Measurement Using DPD Colorimetric Method
For selected experiments that involved chlorine during disinfection, the free chlorine
residual concentration was measured, before and after quenching. The DPD colorimetric
method #4500-Cl G in Standard Methods was used to perform this test (APHA, et al.

44
2005). Test tubes were taken out of the 100 mg/L chlorine bath and rinsed thoroughly
with E-pure water three times. Then, 0.5 mL DPD buffer solution, 0.5 mL DPD
indicator, and 10 mL of sample were added to a test tube in this order. The tube was then
gently shaken. The solution in the tube was poured into a Varian 10-mm rectangular cell,
rinsed with that solution, and filled again. The cell was placed into the
spectrophotometer and the absorbance value was taken. The concentration of free
chlorine residual was calculated from the equation of the free chlorine calibration curve.
3.3.5.3 Residual Total Chlorine Measurement Using DPD Colorimetric Method
In addition to free chlorine residual concentration, the total chlorine residual
concentration was also measured for selected experiments that applied chlorine as a
disinfectant, before and after quenching. The method of measuring total chlorine residual
was the same as the procedure for measuring free chlorine residuals with the addition of
0.1001 g KI to every CDF test tube prior to the introduction of DPD buffer and DPD
indicator solutions.
3.3.5.4 Determination of Chlorine Stock Concentration
The free chlorine concentration of the 500 mg/L and 50 mg/L chlorine stock solutions
were checked prior to starting an experiment. This was to verify the concentration of the
stock that would be applied to disinfection and to determine the exact amount of chlorine
stock to add in order to provide the desired chlorine concentration in the test water. To
determine the concentration of the 500 mg/L chlorine stock, 1 mL of the chlorine stock
was added to a CDF volumetric flask using a pipette and brought up to 100 mL with CDF

45
E-pure water. As described previously, this solution was then poured into an Erlenmeyer
flask with DPD buffer, DPD indicator, and a stir bar. The solution was titrated with FAS.
The free chlorine concentration of the solution is equal (in mg/L) to the volume of FAS
used (in mL) with this method. The results were then multiplied by 100 to account for
dilution. The same procedure was followed for the 50 mg/L solution, but 10 mL of stock
was added and brought up to 100 mL, and the results were multiplied by 10 instead of
100. These procedures of diluting the stock solution prior to titration were done to ensure
the volume of FAS used was in the appropriate range (less than 5 mL) per Standard
Methods.
3.3.6 Reagents and Glasswares
3.3.6.1 Tryptic Soy Broth
Tryptic soy broth (TSB) was a nutrient broth for culturing E. coli. It was prepared as
indicated by the manufacturer by dissolving the dehydrated tryptic soy broth powder
(DF0370-17-3, Becton, Dickinson and Company, Sparks, MD) in E-pure water, in the
ratio of 30 g of powder to 1 L of water. Fifty mL of TSB was placed into each 125-mL
culture flask with metal closures. The culture flasks containing TSB were autoclaved for
15 minutes at 121oC and stored in the refrigerator at 4
oC for up to 2 weeks. The evening
before E. coli inoculation, 2 flasks were transferred from the refrigerator to the 35oC
incubator.

46
3.3.6.2 Tryptic Soy Agar
Tryptic soy agar (TSA) was a medium for E. coli enumeration before and after
disinfection. First, TSB was prepared according to the procedures described in Section
3.3.6.1. Second, 15 g of the dehydrated TSA powder (BactoTM
Agar 214010, Dickinson
and Company, Sparks, MD) was added to each liter of TSB. Third, the agar was brought
to boil and then autoclaved for 20 – 30 minutes at 121oC, depending on the volume of
agar being sterilized. The TSA was kept in the media bottles with screw caps and stored
in the refrigerator at 4oC for up to 3 months.
To prepare pour plates, the TSA was autoclaved again for 15 minutes and kept warm at a
47oC in water bath. The agar was used within 3 hours for pour plating.
3.3.6.3 Phosphate Buffered Saline
The 0.1 M PBS stock was prepared by dissolving 80 g NaCl, 2.0 g KH2PO4, 2.0 g KCl,
and 11.56 g anhydrous Na2HPO4 in E-pure water. The solution was brought up to 1 L in
a volumetric flask and stirred using a magnetic stir bar until all solids were completely
dissolved. The pH of the PBS was checked to verify that it was between pH 7.2 – 7.4. If
not, the pH was adjusted to this range using 0.1 M HCl or 0.1 M NaOH. The 0.1 M PBS
stock was autoclaved and stored in media bottles at room temperature.
The 0.1 M PBS stock was diluted 10 times for use as the test water and in dilution tubes
by combining 1 part of 0.1 M PBS with 9 parts of E-pure water. The pH of the resulting
0.01 M PBS was checked to verify it was in the range of 7.2 - 7.4. The 0.01 M PBS was

47
then divided into various containers, such as media bottles and dilution tubes, and then
autoclaved. If they were not used immediately, they were stored in the refrigerator at 4oC
for up to 3 months.
3.3.6.4 Chlorine Demand Free Phosphate Buffered Saline
Chlorine demand free (CDF) PBS was used in chlorination only and sonication plus
chlorination experiments to ensure all of the chlorine applied was used for disinfection
purposes and not on the reaction of chlorine with other constituents in the water. CDF
PBS was made by chlorinating 0.01 M PBS with 5 mg/L chlorine for 24 hours in the dark
with constant stirring and then dechlorinating by immersing a Pen-Ray UV Pen (34-
0007-01 Lamp 8W germicidal 254 nm G8T5/S, UVP, Upland, CA) into the solution for
24 hours. Total chlorine residual was measured using the DPD colorimetric method. If
the 0.01 M PBS was free from chlorine, it was then autoclaved and stored tightly capped
in the refrigerator at 4oC. If chlorine remained, the solution was irradiated with the UV
pen for another 12 to 24 hours.
3.3.7 Chlorine Demand Free E-pure
Chlorine demand free E-pure water was used to generate results for free and total
chlorine calibration curves. It was also used to check the concentration of the 10%
chlorine stock prior to performing an experiment. The methods of making CDF E-pure
were exactly the same as the methods for CDF PBS, except that E-pure water was used
instead of 0.01 M PBS. The CDF E-pure water did not need to be autoclaved but was
stored in the refrigerator at 4oC.

48
3.3.7.1 Chlorine Demand Free Glassware and Tubing
Chlorine demand free glassware was prepared by soaking glassware, such as Erlenmeyer
flasks, volumetric flasks, test tubes, milk bottles, and BOD bottles, in a 100 mg/L
chlorine bath made from bleach. The glassware were taken out of the chlorine bath just
before use and rinsed thoroughly at least 5 times with E-pure water. If necessary, the
glassware was then autoclaved. CDF tubing was prepared in the same manner. The
tubing was used as part of the flow through sonication system.
3.3.7.2 Dilution Tubes
Dilution tubes were used in the pre- and post-disinfection dilution series. Each dilution
tube consisted of 9 mL of 0.01 M PBS with a metal closure on the tube. The tubes were
placed in a test tube rack and autoclaved for 15 minutes at 121oC. They were stored in
the refrigerator at 4oC until use, with a maximum storage time of approximately 2 weeks.
3.3.7.3 Sodium Thiosulphate
Sodium thiosulfate (Na2S2O3) was used for quenching chlorine so that exact chlorine
disinfection time could be achieved. According to Method 9060A in the Standard
Methods (APHA, et al. 2005), 0.1 mL of a 3% Na2S2O3 neutralizes up to 5 mg/L of
residual chlorine. A 3% solution can be prepared by dissolving 3 g of Na2S2O3 in 100
mL of E-pure water. Since Na2S2O3•5H2O was used, 4.7069 g was needed to make a 3%

49
solution. The solution was then autoclaved before use. Sufficient sodium thiosulfate was
used to quench all chlorine as outlined by Standard Methods.
3.3.7.4 DPD Indicator Solution
DPD indicator solution was used to measure free and total chlorine concentrations. It
was purchased from a manufacturer (DPD Solution APHA, LabChemInc., Pittsburgh,
PA). The shelf life of the DPD indicator solution was 2 months.
3.3.7.5 DPD buffer solution
DPD buffer solution was used in conjunction with DPD indicator solution for free
chlorine measurements and total chlorine measurements. With reference to Method
4500-Cl F in the Standard Methods (APHA, et al 2005), the solution was prepared by
dissolving 24 g of anhydrous Na2HPO4 and 46 g of anhydrous KH2PO4 in E-pure water.
Then it was combined with 100 mL E-pure water in which 800 mg of disodium
ethylenediaminetetrascetatedihydrate (EDTA) was dissolved. The entire solution was
diluted to a total volume of 1 L with E-pure water. The DPD buffer solution was stored
in the refrigerator at 4oC for up to 3 months.
3.3.7.6 Standard Ferrous Ammonium Sulfate (FAS) Titrant
The FAS solution served as a titrant to determine free and total chlorine concentrations
using the titrimetric method. According to Method 4500-Cl F in the Standard Methods
(APHA, et al 2005), FAS titrant was made by dissolving 1.106 g of

50
Fe(NH4)2(SO2)4•6H2O in E-pure water that already contained 1 mL of 1 + 3 H2SO4. The
mixture was diluted up to 1 L with freshly boiled and cooled E-pure water. The FAS
solution was stored in the refrigerator at 4oC for up to 1 month.

51
4 Results
Chapter four presents the results obtained from experiments conducted to determine the
sole and synergistic effects of sonication on the inactivation of E. coli. The chapter is
divided into three sections. First, experiments conducted with the WPI Misonix probe
system are presented. Next, experiments conducted in the Harris Acoustics Products
Corporation cavitation chamber without circulation are shown. Finally, experiments
conducted in the cavitation chamber with circulation are presented. Full experimental
results are provided in Appendix A of this thesis.
4.1 Probe System
Initial experiments were performed with the Misonix probe system with testing
conducted at Tufts Univeristy. In order to determine if the vessel in which sonication
was performed impacted results, experiments were conducted in a 500 mL glass beacker
and in the Harris cavitation chamber (with no tubing or circulation and using the probe
for cavitation rather than the transducers). Temperature was monitored but not controlled
in all experiments. The starting temperature ranged from 21 to 23oC, and the temperature
after 4 minutes never exceeded 25oC. Thus, temperature was not a factor in E. coli
inactivation.
The results for the probe system experiments performed at Tufts University are shown in
Figure 4-1. The sonication probe was operated at 90 W, providing 180 W/L of power to
500 mL samples of experimental water. Experiments were conducted with sonication
only, sonication plus chlorine, and chlorine only, using 0.6 mg/L chlorine for all tests

52
with chlorine. Control experiments were also conducted with no treatment. The control
experiment (no treatment) indicated no significant change in E. coli concentration over
the 4 minute experiment time (log change less than 0.1 log). Chlorine at 0.6 mg/L
resulted in a 1.04 to 1.22 log reduction in E. coli concentration with 1 to 4 minutes of
contact time. Sonication alone was not effective in inactivating E. coli. Sonication
performed in the beaker produced similar results to the control sample, while sonication
in the cavitation chamber reduced E. coli only 0.21 to 0.37 log with a 1 to 4 minute
contact time. Simultaneous sonication and chlorination was less effective than chlorine
alone. For example, combined treatment in the chamber resulted in 0.28 log reduction of
E. coli after 4 minutes, compared to 1.22 log reduction by chlorine alone with the same
contact time.
Figure 4-1: Log inactivation of E. coli with probe sonication system (performed at Tufts)
-0.40
-0.20
0.00
0.20
0.40
0.60
0.80
1.00
1.20
1.40
0 1 2 4
Lo
g I
na
cti
va
tio
n
Time (minutes)
Control (no treatment)
Chlorine Only - Chamber
Sonic Only - Chamber
Sonic Only - Beaker
Sonic + Cl - Chamber
Sonic + Cl - Beaker
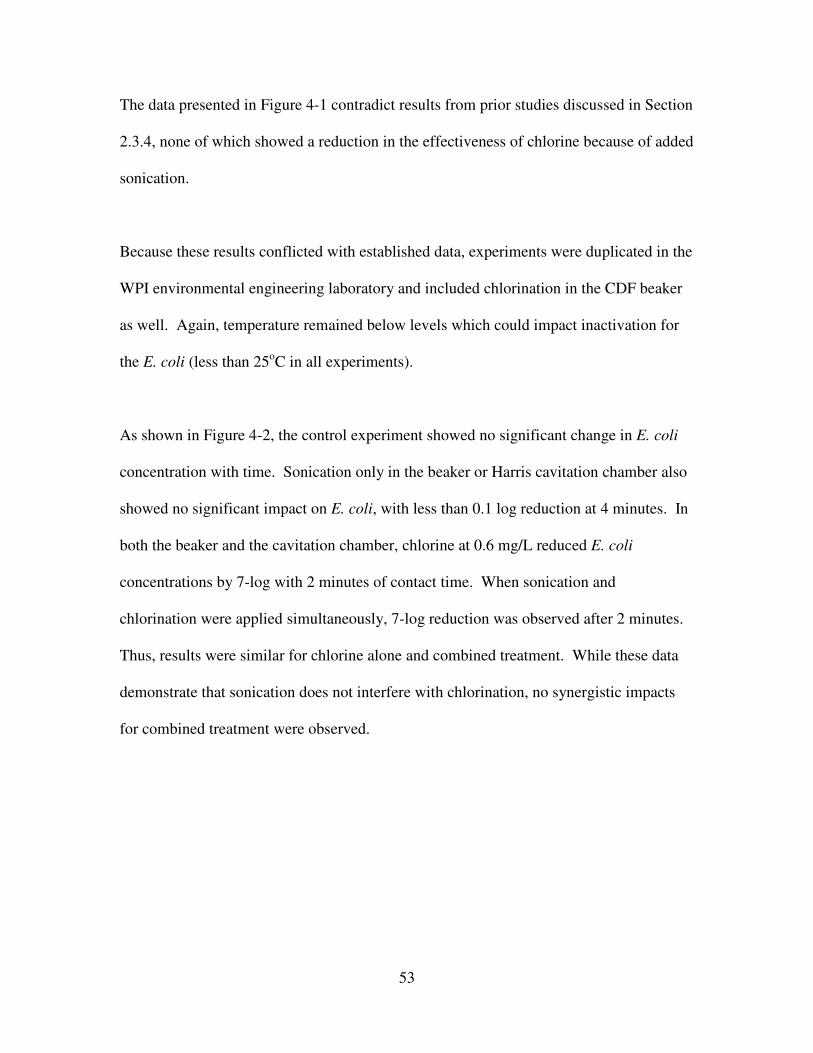
53
The data presented in Figure 4-1 contradict results from prior studies discussed in Section
2.3.4, none of which showed a reduction in the effectiveness of chlorine because of added
sonication.
Because these results conflicted with established data, experiments were duplicated in the
WPI environmental engineering laboratory and included chlorination in the CDF beaker
as well. Again, temperature remained below levels which could impact inactivation for
the E. coli (less than 25oC in all experiments).
As shown in Figure 4-2, the control experiment showed no significant change in E. coli
concentration with time. Sonication only in the beaker or Harris cavitation chamber also
showed no significant impact on E. coli, with less than 0.1 log reduction at 4 minutes. In
both the beaker and the cavitation chamber, chlorine at 0.6 mg/L reduced E. coli
concentrations by 7-log with 2 minutes of contact time. When sonication and
chlorination were applied simultaneously, 7-log reduction was observed after 2 minutes.
Thus, results were similar for chlorine alone and combined treatment. While these data
demonstrate that sonication does not interfere with chlorination, no synergistic impacts
for combined treatment were observed.

54
Figure 4-2: Log Inactivation of E. coli with Probe Sonication System (performed at WPI)
4.2 Cavitation System without Circulation
The next phase of experiments evaluated the effectiveness of the Harris Acoustic
Products, Inc., cavitation system. This section presents results from experiments
conducted in the cavitation chamber but without tubing or the cooling coil connected.
The objective was to quantify inactivation by the transducers without potentially
confounding influences introduced by circulation. Experiments were conducted both at
WPI and at Tufts University. Temperature was below 25oC for all experiments.
Cavitation was performed at 25 ± 6% kHz and up to 150 W of power output, with a
power to volume ratio of 0.3 W/cm2.
-1
0
1
2
3
4
5
6
7
8
0 1 2 4
Lo
g I
na
cti
va
tio
n
Time (minutes)
Control (no treatment)
Chlorine Only - Chamber
Chlorine Only - Beaker
Sonic Only - Chamber
Sonic Only - Beaker
Sonic + Cl - Chamber
Sonic + Cl - Beaker

55
The first set of experiments with the cavitation chamber-based sonication system were
performed at Tufts University. Results are shown in Figure 4-3. The control treatment
and sonication alone both showed negligible inactivation effects on the E. coli (less than
0.2 log reduction at 4 minutes). Chlorine applied at 0.6 mg/L resulted in 0.81 to 1.22 log
inactivation with 1 to 4 minute contact time. However, this inactivation is six orders of
magnitude less than the same treatment tested in the first phase of the experiment using
the WPI probe system. The chlorine only results should be comparable for the two
phases of experimentation. As seen in earlier results, combined treatment provided
similar inactivation to treatment with chlorine alone.
Figure 4-3: Log inactivation of E. coli with cavitation chamber system (performed at Tufts)
This set of experiments was repeated at WPI and the results are shown in Figure 4-4.
Results are congruent with the WPI test results from the probe-based system given in
-0.20
0.00
0.20
0.40
0.60
0.80
1.00
1.20
1.40
0 1 2 4
Lo
g I
na
cti
va
tio
n
Time (minutes)
Control (no treatment)
Chlorine Only
Sonic Only
Sonic + Cl

56
Section 4.1. Sonication only and no treatment both had negligible effects on the E. coli.
Chlorination showed substantial log reduction, 5.2 to 7.2 log, during the tests. Sonication
and chlorination together resulted in 4.6 to 5.6 log reduction of E. coli.
Figure 4-4: Log inactivation of E. coli with cavitation system (performed at WPI)
4.3 Cavitation Chamber System with Circulation
The Harris cavitation system was tested in flow through mode, as described in Chapter 3.
Initial experiments (data not presented) indicated that the tubing exerted a chlorine
demand. Thereafter, the tubing was autoclaved and chlorine demand free to reduce this
impact as much as possible. As in the second phase of experiments, the cavitation system
was operated at 25 ± 6% kHz and provided up to 150 W of power output, providing 0.3
W/cm2. Experimental water was circulated through the tubing and cooling coil, and
treatment times adjusted to account for the time spent out of the cavitation chamber.
-1
0
1
2
3
4
5
6
7
8
0 1 2 4
Lo
g I
na
cti
va
tio
n
Time (minutes)
Control (no treatment)
Chlorine Only
Sonic Only
Sonic + Cl

57
Results are shown in Figure 4-5. As shown previously, the control experiment and
sonication only had no notable effect on the inactivation of E. coli. Chlorination reduced
E. coli by 4.5, 3.7 and 3.6 log at 1, 2 and 4 minutes, respectively. Similarly, combined
sonication and chlorination resulted in 4.4, 3.5 and 3.1 log inactivation of E. coli for the
three treatment times. These results are consistent with prior phases of research, showing
similar effectiveness of chlorine only and sonication and chlorine combined. However,
the actually log reductions in the flow through system were 1.2 to 2.5 log less than in
non-circulating trials.
Figure 4-5: Log inactivation of E. coli with circulating cavitation system (preformed at WPI)
4.4 Comparison of Cavitation Systems
Tables 4-1 and 4-2 provide a comparison of chlorination and chlorination plus sonication
effectiveness as cavitation systems were changed. Both tables demonstrate a significant
-1
0
1
2
3
4
5
0 1 2 4
Lo
g I
na
cti
va
tio
n
Time (minutes)
Control (no treatment)
Chlorine Only
Sonic Only
Sonic + Cl

58
decline in inactivation in the cavitation system when circulation is occurring (as much as
2-log less with chlorine only, and nearly 3-log less with combined treatment).
Additionally, both tables show that the effectiveness of treatment is not changed
significantly (less than 0.5 log) when the reaction vessel is changed from the beaker to
the cavitation chamber.
Table 4-1: Chlorine-only comparison
Chlorine
(mg/L) Sonicator Sonic Vessel
% reduction log reduction
1 min 2 min 4 min 0 1 2 4
0.6 - Beaker 100 100 100 0 6.54 7.24 5.24
0.6 - Chamber - Static 100 100 100 0 6.69 7.09 7.09
0.6 - Chamber -
Circulation
100 99.98 99.97 0 4.56 3.65 3.56
Table 4-2: Chlorination plus sonication comparison
Chlorine
(mg/L) Sonicator Sonic Vessel
% reduction log reduction
1 min 2 min 4 min 0 1 2 4
0.6 WPI Beaker 100 100 100 0 7.21 7.21 7.21
0.6 WPI Chamber - Static 99.94 100 100 0 3.21 7.47 6.94
0.6 Harris Chamber -
Circulation
100 99.96 99.92 0 4.37 3.44 3.08

59
5 Recommendations
More research is required if synergistic disinfection with sonication and chlorine is to be
considered for application in a water treatment system. Because of the limited time and
resources for this study, the following additional work is not feasible for completion as
part of the data presented here, but has emerged as necessary because of the research
results.
i. A sonication system should be designed that allows more flexibility and better
control of experimental parameters. The system should include:
a. Adjustable power output to at least 200W.
b. Adjustable frequency of sonication (more than +/- 6%) so that multiple
frequencies can be examined
c. Removable components which contact experimental water. Specifically,
any part of the apparatus which will contact experimental water should be
chlorine demand free, and autoclaved.
d. The ability to examine true flow through (point to point) treatment, rather
than just circulation, to better emulate conditions in a treatment plant.
ii. The power required to run the sonication equipment should be monitored at all
times in order to fully evaluate the economic feasibility of using a sonication
system to achieve synergistic disinfection.
iii. The increase in temperature caused by sonication should be monitored at all times
in order to fully evaluate the feasibility of using the sonication system in a

60
drinking water treatment system, where water cannot be provided at raised
temperatures to consumers.

61
Works Cited
AWWA. The Quest for Pure Water: The History of Water Purification form the Earliest
Records to the Twentieth Century. Denver, CO: AWWA, 1981.
Blume, Torben, Ingrid Martinez, and Neis Uwe. "Wastewater Disinfection Using
Ultrasound and UV Light." TU Hamburg-Harburg Reports on Sanitary
Engineering 35 (2002).
Burleson, Gary R., T. M. Murray, and Morris Pollard. "Inactivation of Viruses and
Bacteria by Ozone, With and Without Sonication." Applied Microbiology 29, no.
3 (1975): 340-344.
Clasen, J., and R. Sobotta. "Inactivation of Microorganisms by Ultrasound." Water
Supply 12 (1994): 243-251.
Dahi, E. "Physicochemical Aspects of Disinfection of Water by Means of Ultrasound and
Ozone ." Water Research 10 (1976): 677-684.
Duckhouse, H, T.J. Mason, S.S. Phull, and J.P. Lorimer. "The Effect of Sonication on
Microbial Disinfection using Hypochlorite." Ultrasonics Sonochemistry 11
(2004): 173-176.
Graczyk, Thaddeus K., et al. "Occurrence of Cryptosporidium and Giardia in sewage
sludge and solid waste landfill leachate and quantitative comparative analysis of
sanitization treatments on pathogen inactivation." Environmental Research 106,
no. 1 (January 2008): 27-33.
HDR Engineering. Handbook of Public Water Systems. Omaha, NE: Wiley, 2001.
Inez, Hua, and John E. Thompson. "Inactivation of Escherichia Coli by Sonication at
Discrete Ultrasonic Frequencies." Water Research 34, no. 15 (2000): 3888-3893.
MWH. Water Treatment: Principles and Design. Edited by John C. Crittenden, R.
Rhodes Trussel, David W. Hand, Kerry J. Howe and George Tchobanglous.
Hoboken: Wiley, 2005.
NDWC. "History of Water Treatment and Waterbourne Diseases." On Tap, 1996.
Phull, S. S., A. P. Newman, J. P. Lorimer, B. Pollet, and T. J. Mason. "The development
and evaluation of ultrasound in the biocidal treatment of water." Ultrasonics
Sonochemistry 4 (1997): 157-164.

62
Riesz, Peter, and Vladimir Misik. "EPR characterization of free radical intermediates
formed during ultrasound exposure of cell culture media." Free Radical Biology
and Medicine 26, no. 7-8 (April 1999): 936-943.
U.S. EPA. "Chloramine: Alternative Disinfectants and Oxidants Guidance Manual." US
EPA Office of Water. April 1999.
http://www.epa.gov/safewater/mdbp/pdf/alter/cover_al.pdf (accessed January 16,
2008).
U.S. EPA. "Filtration, Disinfection, Turbidity, Giardia lamblia, Viruses, Legionella, and
Heterotrophic Bacteria, Final Rule." Federal Register 54, no. 124 (1989a): 27486.
U.S. EPA. "Imterim Enhanced Surface Water Treatment, Final Rule." Federal Register
63, no. 241 (1998a): 69478-69521.
U.S. EPA. "National Primary Drinking Water Regulations: Disnfectants and Disnfection
Byproducts." Federal Register 63, no. 241 (1998b): 69389-69476.
U.S. EPA. "National Primary Drinking Water Regulations: Ground Water Rule." Federal
Register 71, no. 216 (2006a): 65574-65660.
U.S. EPA. "National Primary Drinking Water Regulations: Long Term 1 Enhanced
Surface Water Treatment Rule." Federal Register 67, no. 9 (2002): 1811-1844.
U.S. EPA. "National Primary Drinking Water Regulations: Long Term 2 Enhanced
Surface Water Treatment Rule." 71, no. 3 (January 2006b): 653-702.
U.S. EPA. "National Priority Drinking Water Regulations: Total Coliforms." Federal
Register 54, no. 124 (1989b): 27544-27568.
U.S. EPA. The History of Drinking Water Treatment. Office of Water, United States
Environmental Protection Agency, US EPA, 2000.

63
Appendicies

64
Appendix 1: Results for Experiments Conducted at WPI
Exp. Chlorine Sonicator Sonic
Vessel
% reduction log reduction
( mg/L) 1 min 2 min 4 min 0 1 2 4
A - WPI
Probe
Beaker 28.43 -82.74 -10.15 0 0.15 -0.26 -0.04
0 0.37 0 0.07
B 0.6 - Beaker 100 100 100 0 6.54 7.24 5.24
0 1.4 1.4 1.4
C 0.6 WPI
Probe
Beaker 100 100 100 0 7.21 7.21 7.21
0 6 6 6
D - - Trough –
no tubing
12.18 24.68 -38.78 0 0.06 0.12 -0.14
E - WPI
Probe
Trough –
no tubing
-
161.43
-3.59 -11.66 0 -0.42 -0.02 -0.05
F 0.6 - Trough –
no tubing
100 100 100 0 6.69 7.09 7.09
G 0.6 WPI
Probe
Trough –
no tubing
99.94 100 100 0 3.21 7.47 6.94
H - Harris Trough -
no circ
21.67 16.39 37.22 0 0.11 0.08 0.2
0 0.3 0.18 0.21
I 0.6 Harris Trough -
no circ
100 100 99.97 0 5.11 4.75 3.6
0 5.52 5.4 4.52
J - Harris Trough -
circulation
4.98 5.98 28.57 0 0.02 0.03 0.15
0 0.39 0.46 0.44
K 0.6 Harris Trough -
circulation
100 99.96 99.92 0 4.37 3.44 3.08
0 5.18 4.08 3.85
L 0.6 - Trough -
circulation
100 99.98 99.97 0 4.56 3.65 3.56
0 5.82 5.6 4.77
M - - Trough -
circulation
-3.21 -5 -7.5 0 -0.01 -0.02 -0.03
0 -0.12 0.24 0.24
When two lines of data are presented, the first line represents data from WPI
enumeration, the second line represents Tufts enumeration.

65
Appendix 2: Experiments Conducted at Tufts with Tufts E. coli
Exp Cl2 Sonic Sonic Vessel Time Raw Counts Time = 0 Ave % log
# (mg/L) (W) (kHz) (min) 1.00E-
03 1.00E-
03 count Conc reduction reduction
II-53 na na na Trough 0 36 30 3.30E+04 3.30E+04 0.00 0.00
1 33 20 3.30E+04 2.65E+04 19.70 0.10
2 28 39 3.30E+04 3.35E+04 -1.52 -0.01
4 25 49 3.30E+04 3.70E+04 -12.12 -0.05
II-52 0.6 na na Trough 0 43 32 3.75E+04 3.75E+04 0.00 0.00
1 55 52 3.75E+04 5.35E+04 -42.67 -0.15
2 44 50 3.75E+04 4.70E+04 -25.33 -0.10
4 72 81 3.75E+04 7.65E+04 -104.00 -0.31
II-58 0.6 na na Beaker 0 44 50 4.70E+04 4.70E+04 0.00 0.00
1 24 52 4.70E+04 3.80E+04 19.15 0.09
2 42 36 4.70E+04 3.90E+04 17.02 0.08
4 20 67 4.70E+04 4.35E+04 7.45 0.03
II-54 na 90 Harris in trough 0 4 60 3.20E+04 3.20E+04 0.00 0.00
1 31 48 3.20E+04 3.95E+04 -23.44 -0.09
2 44 44 3.20E+04 4.40E+04 -37.50 -0.14
4 25 56 3.20E+04 4.05E+04 -26.56 -0.10
II-51 na 90 WPI in trough 0 79 84 8.15E+04 8.15E+04 0.00 0.00
1 37 68 8.15E+04 5.25E+04 35.58 0.19
2 46 68 8.15E+04 5.70E+04 30.06 0.16
4 25 22 8.15E+04 2.35E+04 71.17 0.54
II-57 na 90 WPI in beaker 0 72 50 6.10E+04 6.10E+04 0.00 0.00
1 96 56 6.10E+04 7.60E+04 -24.59 -0.10
2 60 52 6.10E+04 5.60E+04 8.20 0.04
4 37 42 6.10E+04 3.95E+04 35.25 0.19
II-50 0.6 90 Harris in trough 0 59 98 7.85E+04 7.85E+04 0.00 0.00
1 41 41 7.85E+04 4.10E+04 47.77 0.28
2 24 42 7.85E+04 3.30E+04 57.96 0.38
4 14 39 7.85E+04 2.65E+04 66.24 0.47
II-55 0.6 90 WPI in trough 0 96 94 9.50E+04 9.50E+04 0.00 0.00
1 68 44 9.50E+04 5.60E+04 41.05 0.23
2 25 21 9.50E+04 2.30E+04 75.79 0.62
4 16 13 9.50E+04 1.45E+04 84.74 0.82
II-56 0.6 90 WPI in beaker 0 40 48 4.40E+04 4.40E+04 0.00 0.00
1 62 60 4.40E+04 6.10E+04 -38.64 -0.14
2 44 50 4.40E+04 4.70E+04 -6.82 -0.03
4 36 22 4.40E+04 2.90E+04 34.09 0.18

66
Appendix 3: Experiments Conducted at Tufts with WPI E. coli
Exp Cl2 Sonic Sonic Vessel Time Raw Counts Time = 0 Ave % log
# (mg/L) (W) (kHz) (min) 1.00E-
03 1.00E-
03 count Conc reduction reduction
II-67 na na na Trough 0 56 40 4.80E+04 4.80E+04 0.00 0.00
1 70 40 4.80E+04 5.50E+04 -14.58 -0.06
2 60 64 4.80E+04 6.20E+04 -29.17 -0.11
4 80 40 4.80E+04 6.00E+04 -25.00 -0.10
II-66 0.6 na na Trough 0 58 60 5.90E+04 5.90E+04 0.00 0.00
1 6 1 5.90E+04 3.50E+03 94.07 1.23
2 13 5 5.90E+04 9.00E+03 84.75 0.82
4 4 8 5.90E+04 6.00E+03 89.83 0.99
II-59 0.6 na na Beaker 0 256 280 2.68E+05 2.68E+05 0.00 0.00
1 26 5 2.68E+05 1.55E+04 94.22 1.24
2 24 24 2.68E+05 2.40E+04 91.04 1.05
4 22 18 2.68E+05 2.00E+04 92.54 1.13
II-65 na 90 Harris in trough 0 88 60 7.40E+04 7.40E+04 0.00 0.00
1 100 64 7.40E+04 8.20E+04 -10.81 -0.04
2 78 45 7.40E+04 6.15E+04 16.89 0.08
4 52 56 7.40E+04 5.40E+04 27.03 0.14
II-64 na 90 WPI in trough 0 180 300 2.40E+05 2.40E+05 0.00 0.00
1 36 250 2.40E+05 1.43E+05 40.42 0.22
2 32 250 2.40E+05 1.41E+05 41.25 0.23
4 26 190 2.40E+05 1.08E+05 55.00 0.35
II-60 na 90 WPI in beaker 0 200 144 1.72E+05 1.72E+05 0.00 0.00
1 200 120 1.72E+05 1.60E+05 6.98 0.03
2 300 260 1.72E+05 2.80E+05 -62.79 -0.21
4 300 110 1.72E+05 2.05E+05 -19.19 -0.08
II-63 0.6 90 Harris in trough 0 200 200 2.00E+05 2.00E+05 0.00 0.00
1 21 21 2.00E+05 2.10E+04 89.50 0.98
2 24 27 2.00E+05 2.55E+04 87.25 0.89
4 16 7 2.00E+05 1.15E+04 94.25 1.24
II-62 0.6 90 WPI in trough 0 360 390 3.75E+05 3.75E+05 0.00 0.00
1 200 200 3.75E+05 2.00E+05 46.67 0.27
2 150 200 3.75E+05 1.75E+05 53.33 0.33
4 280 108 3.75E+05 1.94E+05 48.27 0.29
II-61 0.6 90 WPI in beaker 0 108 250 1.79E+05 1.79E+05 0.00 0.00
1 96 96 1.79E+05 9.60E+04 46.37 0.27
2 86 101 1.79E+05 9.35E+04 47.77 0.28
4 48 84 1.79E+05 6.60E+04 63.13 0.43