tokai-to-kamioka (t2k) long baseline neutrino oscillation...
TRANSCRIPT
April 28, 2006
Tokai-to-Kamioka (T2K) Long BaselineNeutrino Oscillation Experiment Proposal

Executive SummaryIn this document, we propose to construct a neutrino beam facility, using the fast extracted proton
beam from J-PARC proton synchrotron in Tokai and to perform a long baseline neutrino oscillationexperiment, using existing Super-Kamiokande detector (T2K experiment). This experiment is aninternational collaboration of Japan, Canada, France, Italy, Korea, Poland, Russia, Spain, UK andUSA. Budget request of each country has been submitted to each financial agency.
This proposal is the first stage of the physics program. The feasibility of the future neutrinoprogram depends on the results of this first stage, especially on the result of νμ → νe search.
The goal of the T2K experiment
We request total integrated beam power larger than 0.75 MW x 15000h at any proton energiesbetween 30 and 50 GeV. Since one year run with full beam power will probe physics by unprecedentedsensitivities, it is possible that new finding occur any time. Even if we do not see new phenomena,every yearly run will produce meaningful upper limit. Thus it is critical to increase the beam poweras soon as possible after commissioning of accelerator complex. The experiment has three main welldefined goals.
1. The discovery of νμ → νe
A factor of 20 improvement in sensitivity over the present upper limit is possible. The goal isto extend the search down to sin2 2θ13 � 2 sin2 2θμe > 0.008. The νe appearance measurementis important for two reasons.
• The mixing angle θ13 is the last of the mixing angles in three neutrino scheme. We alreadyknow that other two mixing are large. One of the most interesting question is whether thethird mixing angle is at same order of magnitude or small by many order of magnitudes.The observation of νμ → νe in the first stage of the experiment prove that θ13 is notextremely small, so that a future CP violation search become practical.
• This is an appearance channel and has a sub-leading oscillation of νμ involving Δm213.
The new developments in solar and reactor neutrino experiments indicate that νμ willoscillate to νe with a rather large mixing angle and Δm2
12. This oscillation can competewith the one with a mass squared difference of Δm2
13. The former oscillation is suppressedby a small Δm2 and the latter is suppressed by the small mixing angle, θ13. Hence, thetwo processes can compete. This is one of the necessary conditions for a CP violationeffect to be observable.
2. The precision measurements of oscillation parameters in νμ disappearanceObservation of the oscillation minimum, a 1% measurement (about the same precision as Cab-bibo angle in quark sector) of the mixing angle and a 3% measurement of Δm2 (δ(Δm2
23) =10−4 eV2 and δ(sin2 2θ23) = 0.01), may show the mixing of second and third generation neu-trinos to be consistent with maximal at 1% accuracy. This may impose a constraint on thequark-lepton unification in the future.
3. Search for sterile components in νμ disappearance by detecting the neutral-current eventsIf a non-zero sterile component is found, the physics of fermions will need modification toaccommodate extra member(s) of leptons.
Feature of the T2K experiment
Needless to say, it is important to look for unexpected phenomena as well with new sensitivity.The neutrino beam has been designed with emphasis on the neutrino energy determination and on theflavor identification, taking into account the characteristics of Super-Kamiokande detector.
2

• The far detectorT2K will use the world largest water Cherenkov detector, Super-Kamiokande (SK), as the fardetector. Super-Kamiokande has excellent energy resolution and e/μ identification capability inlow energy neutrino reactions, backed by about twenty years of experience of water Cherenkovdetector.
• The neutrino beam energyThe maximum sensitivity of the oscillation parameters can be achieved by tuning the neutrinobeam energy to the oscillation maximum. The oscillation maximum will occur at a neutrinoenergy, Eν , less than 1 GeV for the 295 km baseline with Δm2 ∼ 3 × 10⁻³eV 2. This neutrinoenergy is well matched to the detector capability.
• Eν reconstructionThe charged current interaction is dominated by the quasi-elastic interaction (CCQE) below1 GeV. This enable us to make a precision determination of the neutrino energy of both νμ andνe. The energy can be calculated by a formula:
Eν =mNEl − m2
l /2
mN − El + plcosθl, (1)
where mN and ml are the masses of the neutron and lepton (=e or μ), El, pl and θl are theenergy, momentum, and angle of the lepton relative to the neutrino beam, respectively.
• Off-axis beamThe precision of the measurements are limited mainly due to the background events fromhigh-energy components. The inelastic reactions of high-energy neutrinos constitute the back-grounds to neutrino energy measurements with the CCQE. In addition, the inelastic reactionsproduce π0s that are the main background for νe appearance search. The experiment will usean off-axis beam to accomplish the highest possible intensity of low energy neutrinos with onlya small high-energy tail in the spectrum.
• Start up of the experimentSK has been in operation for many years and the relevant software already exists. The intensityof the low energy neutrino beam is proportional to the proton beam power and does not requirea specific proton energy in the initial operation of the accelerator. The experiment will be ableto accommodate any reasonable start-up scenario of the accelerator, and can produce physicsresults in a short time after initial operation.
3

Japan
KEKY. Ajima, O. Araoka, Y. Fujii, K. Hayashi, N. Higashi, A. K. Ichikawa, T. Ishida, T. Ishii,K. Kasami, N. Kimura, T. Kobayashi, S. Koike, Y. Makida, T. Nakadaira, T. Nakamoto,K. Nakamura, K. Nishikawa∗, T. Ogitsu, H. Ohhata, T. Okamura, Y. Oyama, K. Sasaki,K. Sakashita, T. Sekiguchi, S. Suzuki, M. Tada, K. Tanaka, M. Tanaka, A. Terashima, T. Tomaru,T. Tsukamoto, Y. Yamada, H. Yamaoka
ICRR, University of TokyoT. Abe, Y. Hayato, Y. Itow, J. Kameda, Y. Koshio, M. Miura, S. Moriyama, M. Nakahata,Y. Obayashi, H. Sekiya, M. Shiozawa, Y. Suzuki, A .Takeda, Y. Takeuchi
RCCN, University of TokyoI. Higuchi, T. Kajita, K. Kaneyuki, S. Nakayama, K. Okumura, C. Saji
Hiroshima UniversityT. Takahashi
Kobe UniversityS. Aoki, T. Hara, A. Suzuki
Kyoto UniversityT. Nakaya, H. Tanaka, M. Yokoyama
Tohoku UniversityT. Hasegawa
University of TokyoT. Abe, H. Aihara, M. Iwasaki, H. Kakuno, N. Hastings
Canada
TRIUMFP. Amaudruz, M. Barnes, E. Blackmore, S. Chen, H. Coombes, J. Doornbos, W. Faszer,P. Gumplinger, R. Helmer, R. Henderson, I. Kato, P. Kitching, A. Konaka, L. Kurchaninov,G. Marshall, J. Macdonald, A. Miller, K. Olchanski, R. Openshaw, J.M. Poutissou, R. Poutissou,F. Retiere, P. Vincent, G. Wait, S. Yen,
University of AlbertaJ.P. Archambault, J. McDonald, M.G Vincter
University of British ColumbiaM. Bryant, J. Coulombe, C. Hearty, S. Oser, J. Wendland
University of ReginaT. Mathie, R. Tacik
University of TorontoJ. Martin
University of VictoriaP. Birney, A. Dowling, K. Fransham, C. Hansen, D. Karlen, R. Langstaff, M. Lenckowski,P. Poffenberger, M. Roney
York UniversityS. Bhadra
∗ T2K Contact person: Koichiro Nishikawa, Email address : [email protected]
4

France
CEA SACLAY - DSM/DAPNIA - Service de Physique des particulesJ. Argyriades, P. Baron, J. Bouchez, D. Calvet, Ch. Cavata, P. Colas, E. Delagnes, A. Delbart,F. Druillole, M. Fechner, A. Giganon, Y. Giomataris, J. Mallet, J.-Ph. Mols, L. Mosca,F. Pierre, A. Sarrat, M. Zito
LPNHE-IN2P3 ParisJ. Dumarchez
Italy
INFN - Sezione di BariM.G. Catanesi, E. Radicioni
INFN - University of NapoliG. De Rosa, V. Palladino
INFN - University of PadovaM. Mezzetto, M. Laveder
INFN - University of RomaU. Dore, C. Gargiulo, P.F. Loverre, L. Ludovici, C. Mariani
University of LjubljanaT. Podobnik
Unversity of Naples Federico II G. De Rosa
Korea
Chonnam Naitonal UniversityJ.Y. Kim, I.T. Lim
Dongshin UniversityM.Y. Pac
Kyungpook National UniversityW. Kim, V. Batourine
Kangwon UniversityS.K. Nam
KyungSang National UniversityI.G. Park
Sejong UniversityY.D. Kim
Seoul National UniversityS. Choi, E.J. Jeon, K.K. Joo, S.B. KimSungKyunKwan UniversityY.I. Choi, C.W. Park
Yonsei UniversityY. Kwon
Gyeongsang National UniversityI.G. Park
5

Poland
Warsaw UniversityD. Kielczewska
Russia
Institute for Nuclear Research RASA.V. Butkevich, M. Khabibullin, A. Khotjantsev, Yu.G. Kudenko, B. Lubsandorjiev, V.A. Matveev,S.P. Mikheyev, O. Mineev, Y. Mussienko, N. Yershov
ITEPM. Danilov, V. Balagura
Spain
University of BarcelonaJ.L. Alcaraz, S. Andringa, X. Espinal, E. Fernandez, F. Sanchez, T. Lux
University of ValenciaJ. Burguet, J. Catala, A. Cervera-Villanueva, E. Couce, P.N Garijo, J.J. Gomez-Cadenas,P. Novella, M. Sorel, A. Tornero
Switzerland
ETH/ZurichA. RubbiaUniversity of GenevaA. Blondel, P. Bene, A. Cervera, D. Ferrere, F. Masciocchi, E. Perrin, R. Schroeter
UK
Imperial College LondonS. Boyd, P. Dornan, G. Hall, M. Raymond, I. Taylor, Y. Uchida, A. Vacheret,F. van Schalkwyk, D.L. Wark
Lancaster UniversityI. Bertram, L. Kormos, P. Ratoff
University of LiverpoolC. Chavez, J. Fry, R. Gamet, D. Payne, P. Sutcliffe, C. Touramanis
Queen Mary Westfield College LondonF.Di Lodovico, C.M. Cormack, R.A. Owen, A. Poll, C. Williams
Rutherford Appleton laboratoryA. Belias, J. Butterworth, S. Canfer, C. Densham, R. Edgecock, M. French, R. Halsall, J. Hirst,P. Loveredge, T.C. Nicholls, D. Morrow, G.F. Pearce, A. Weber, M. Woodward
University of SheffieldC.N. Booth, S.L. Cartwright, R. French, E.V. Korolkova, M.L. Navin, L.F. Thompson
University of WarwickJ. Back, G.J. Barker, R. Bridgland, P.F. Harrison, A. Lovejoy, B. Morgan,A. Sheffield, J.A. Thornby
6
USA
Argonne National LaboratoryM. Goodman
Boston UniversityE. Kearns, M.D. Litos, J.L. Stone, L.R. Sulak
Brookheaven National LaboratoryM. Goldhaber, M. Harrison, P. Wanderer
University of California, Berkeley and Lawrence Berkeley National LaboratoryK. M. Heeger, Kam-Biu Luk
University of California, IrvineD. Casper, J.A. Dunmore, W.R. Kropp, S. Mine, C.G. Regis, C. Simon, M.B. Smy, H.W. Sobel,M.R. Vagins
University of ColoradoR.H. Nelson, J.B. Spitz, E. Zimmerman
Duke UniversityK. Scholberg, N. Tanimoto, C.W. Walter
California State University Dominguez HillsK. Ganezer, J. Hill, W. Keig
University of HawaiiJ.G. Learned, S. Matsuno
Los Alamos National LaboratoryT.J. Haines
Louisiana State UniversityS.A Dazeley, T.M. Goon, R. Gould, S. Hatakeyama, T. Kutter, W.J. Metcalf,K. McBryde, R. Svoboda
The University of PennsylvaniaE.W. Beier
The University of RochesterA. Bodek, R. Bradford, H. Budd, J. Chvojka, R. Flight, S. Manly, K. McFarland, J. Park,W. Sakumoto, J. Steinman, M. Zielinski
The State University of New York at Stony BrookC.K. Jung, K. Kobayashi, G. Lopez, C. McGrew, A. Sarrat, L.P. Trung, L. Whitehead,C. Yanagisawa
University of WashingtonE. Berns, R. Gran, R.J. Wilkes
7
Contents
1 Physics Motivation 91.1 The Current Situation in Neutrino Oscillation Physics . . . . . . . . . . . . . . . . . 91.2 Future Progress in Neutrino Oscillation Physics . . . . . . . . . . . . . . . . . . . . 111.3 The T2K Long Baseline Experiment . . . . . . . . . . . . . . . . . . . . . . . . . . 121.4 T2K physics goals . . . . . . . . . . . . . . . . . . . . . . . . . . . . . . . . . . . . 141.5 Comparison of the primary proton beam energy . . . . . . . . . . . . . . . . . . . . 19
2 Neutrino Beam 202.1 Overview of the neutrino beamline . . . . . . . . . . . . . . . . . . . . . . . . . . . 202.2 Normal conducting magnet . . . . . . . . . . . . . . . . . . . . . . . . . . . . . . . 242.3 Superconducting combined magnet system . . . . . . . . . . . . . . . . . . . . . . . 252.4 Primary Proton Beam Monitors . . . . . . . . . . . . . . . . . . . . . . . . . . . . . 272.5 Vacuum System . . . . . . . . . . . . . . . . . . . . . . . . . . . . . . . . . . . . . 302.6 Target . . . . . . . . . . . . . . . . . . . . . . . . . . . . . . . . . . . . . . . . . . 312.7 Horn . . . . . . . . . . . . . . . . . . . . . . . . . . . . . . . . . . . . . . . . . . . 322.8 Target station . . . . . . . . . . . . . . . . . . . . . . . . . . . . . . . . . . . . . . 342.9 Decay volume . . . . . . . . . . . . . . . . . . . . . . . . . . . . . . . . . . . . . . 362.10 Beam Dump - Hadron Absorber . . . . . . . . . . . . . . . . . . . . . . . . . . . . 372.11 The muon monitor(MUMON) . . . . . . . . . . . . . . . . . . . . . . . . . . . . . 38
3 Near Detector ND280 403.1 Overview of the ND280 Near Detector . . . . . . . . . . . . . . . . . . . . . . . . . 403.2 Neutrino experimental hall . . . . . . . . . . . . . . . . . . . . . . . . . . . . . . . 423.3 The on-axis neutrino monitor (N-GRID) . . . . . . . . . . . . . . . . . . . . . . . . 443.4 Magnet . . . . . . . . . . . . . . . . . . . . . . . . . . . . . . . . . . . . . . . . . 443.5 TPC . . . . . . . . . . . . . . . . . . . . . . . . . . . . . . . . . . . . . . . . . . . 473.6 FGD . . . . . . . . . . . . . . . . . . . . . . . . . . . . . . . . . . . . . . . . . . . 493.7 P0D . . . . . . . . . . . . . . . . . . . . . . . . . . . . . . . . . . . . . . . . . . . 503.8 ECAL . . . . . . . . . . . . . . . . . . . . . . . . . . . . . . . . . . . . . . . . . . 513.9 SMRD . . . . . . . . . . . . . . . . . . . . . . . . . . . . . . . . . . . . . . . . . . 523.10 Photo Sensor . . . . . . . . . . . . . . . . . . . . . . . . . . . . . . . . . . . . . . 55
4 Commissioning 584.1 Neutrino beam commissioning . . . . . . . . . . . . . . . . . . . . . . . . . . . . . 584.2 ND280 commissioning . . . . . . . . . . . . . . . . . . . . . . . . . . . . . . . . . 59
5 Expected Foreign Contributions 605.1 Expected contributions to the neutrino beam line from abroad . . . . . . . . . . . . . 605.2 Estimated cost for ND280 and expected contributions . . . . . . . . . . . . . . . . . 61
8

Chapter 1
Physics Motivation
1.1 The Current Situation in Neutrino Oscillation Physics
Over the last 7 years neutrino physics has crossed a threshold in its basic understanding of the fun-damental nature of neutrinos. Initial indications of an anomaly in the solar neutrino flux from thepioneering experiments of Ray Davis and his collaborators [1], and from the Kamiokande experi-ment [2]. Then these results were supported by measurements of the low-energy solar neutrino fluxesby the SAGE [3] and GALLEX [4] experiments. While the solar neutrino anomaly was under inves-tigation, the Super-Kamiokande (SK) experiment showed a zenith-angle dependent suppression ofνμ flux (atmospheric neutrino flux, arising from cosmic ray interactions with the atmosphere) whichindicated that neutrinos have mass [5]. Recently the SNO [6] experiment has demonstrated that thesolar neutrino anomaly is caused by neutrinos changing flavor, which was shown to be consistentwith neutrino oscillations by the recent results from the KamLAND experiment [7]. Most recently re-sults from the K2K long-baseline neutrino oscillation experiment [8] have shown that the atmosphericneutrino anomaly observed by Super-Kamiokande appears in experiments with a controlled neutrinobeam as well. It has been established that the neutrino does oscillate and two Δm2’s exist.
Neutrino oscillations arise quite naturally in a neutrino mixing model which is described by aunitary 3x3 matrix (Maki-Nakagawa-Sakata [9] (MNS) matrix) that is defined by a product of threerotation matrices with three angles (θ12, θ23, and θ13) and a complex phase (δ) as in the Cabibbo-Kobayashi-Maskawa matrix [10].
⎛⎝ νe
νμ
ντ
⎞⎠ =
⎡⎣Uαi
⎤⎦
⎛⎝ ν1
ν2
ν3
⎞⎠ , (1.1)
U =
⎛⎝ 1 0 0
0 C23 S23
0 −S23 C23
⎞⎠
⎛⎝ C13 0 S13e
−iδ
0 1 0−S13e
iδ 0 C13
⎞⎠
⎛⎝ C12 S12 0
−S12 C12 00 0 1
⎞⎠ , (1.2)
where α = e, μ, τ are the flavor indices, i=1, 2, 3 are the indices of the mass eigenstates, Sij
(Cij) stands for sin θij (cos θij). Neutrinos are produced as flavor eigenstates and each component ofmass eigenstate gets a different phase after traveling a certain distance. The detection of neutrinos bycharged current interactions projects these new states back onto flavor eigenstates.
For the simplest case, where only two of the mass states dominate the oscillations, the familiarformula which governs the appearance of one flavor, say νe, in an initially pure beam of another flavor,say νμ, can be derived:
P (νμ → νe) = sin2 2θ sin2
(1.27Δm2L
E
)(1.3)
where θ is whichever of the angles is contributing to this particular mixing, L is the distance from thesource to the detector, E is the energy of the neutrino, and Δm2 = m2
j − m2i is the difference in the
9
θ2tan
)2 e
V-5
(10
2 mΔ
5
10
15
20
0 0.2 0.4 0.6 0.8 1
68% CL
95% CL
99.73% CL
(b)
sin22θ
Δm2 (
eV2 )
Zenith angle analysis
L/E analysis
0.8 0.85 0.9 0.95 1.00.0
1.0
2.0
3.0
4.0
5.0
× 10-3
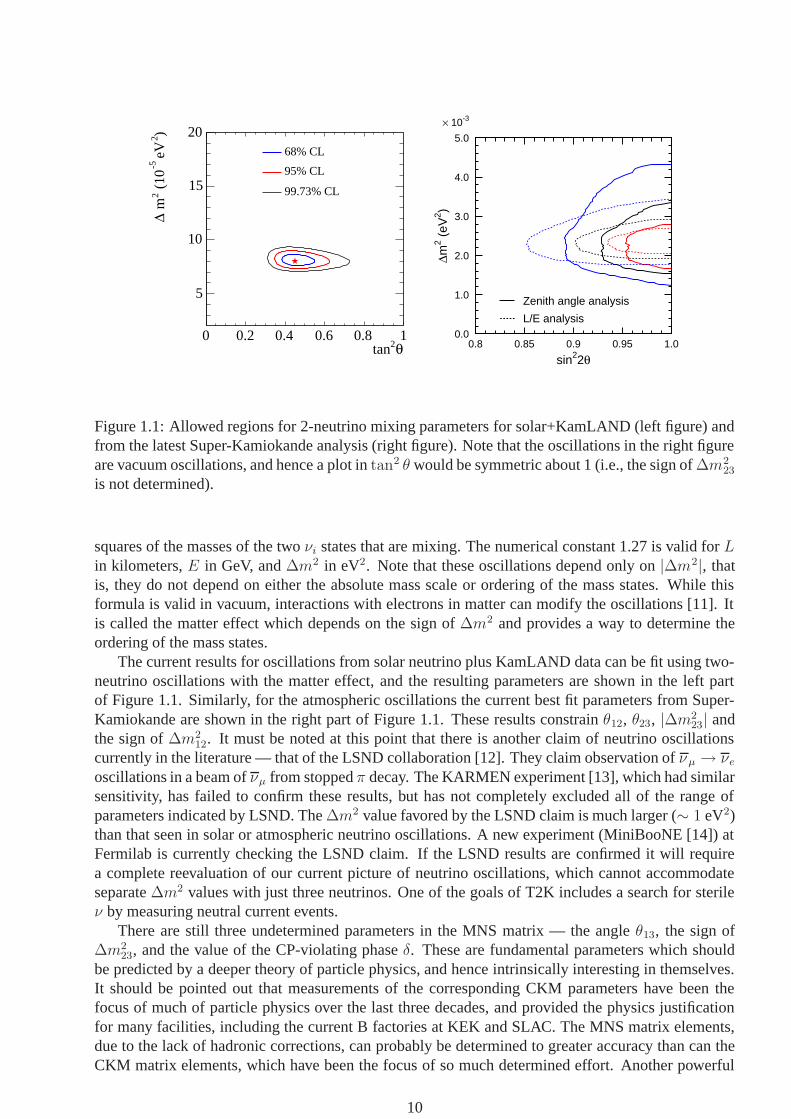
Figure 1.1: Allowed regions for 2-neutrino mixing parameters for solar+KamLAND (left figure) andfrom the latest Super-Kamiokande analysis (right figure). Note that the oscillations in the right figureare vacuum oscillations, and hence a plot in tan2 θ would be symmetric about 1 (i.e., the sign of Δm2
23
is not determined).
squares of the masses of the two νi states that are mixing. The numerical constant 1.27 is valid for Lin kilometers, E in GeV, and Δm2 in eV2. Note that these oscillations depend only on |Δm2|, thatis, they do not depend on either the absolute mass scale or ordering of the mass states. While thisformula is valid in vacuum, interactions with electrons in matter can modify the oscillations [11]. Itis called the matter effect which depends on the sign of Δm2 and provides a way to determine theordering of the mass states.
The current results for oscillations from solar neutrino plus KamLAND data can be fit using two-neutrino oscillations with the matter effect, and the resulting parameters are shown in the left partof Figure 1.1. Similarly, for the atmospheric oscillations the current best fit parameters from Super-Kamiokande are shown in the right part of Figure 1.1. These results constrain θ12, θ23, |Δm2
23| andthe sign of Δm2
12. It must be noted at this point that there is another claim of neutrino oscillationscurrently in the literature — that of the LSND collaboration [12]. They claim observation of νμ → νe
oscillations in a beam of νμ from stopped π decay. The KARMEN experiment [13], which had similarsensitivity, has failed to confirm these results, but has not completely excluded all of the range ofparameters indicated by LSND. The Δm2 value favored by the LSND claim is much larger (∼ 1 eV2)than that seen in solar or atmospheric neutrino oscillations. A new experiment (MiniBooNE [14]) atFermilab is currently checking the LSND claim. If the LSND results are confirmed it will requirea complete reevaluation of our current picture of neutrino oscillations, which cannot accommodateseparate Δm2 values with just three neutrinos. One of the goals of T2K includes a search for sterileν by measuring neutral current events.
There are still three undetermined parameters in the MNS matrix — the angle θ13, the sign ofΔm2
23, and the value of the CP-violating phase δ. These are fundamental parameters which shouldbe predicted by a deeper theory of particle physics, and hence intrinsically interesting in themselves.It should be pointed out that measurements of the corresponding CKM parameters have been thefocus of much of particle physics over the last three decades, and provided the physics justificationfor many facilities, including the current B factories at KEK and SLAC. The MNS matrix elements,due to the lack of hadronic corrections, can probably be determined to greater accuracy than can theCKM matrix elements, which have been the focus of so much determined effort. Another powerful
10
10-3
10-2
10-1
100
sin2θ13
10-3
10-2
10-1
Δm2 31
[eV
2 ]
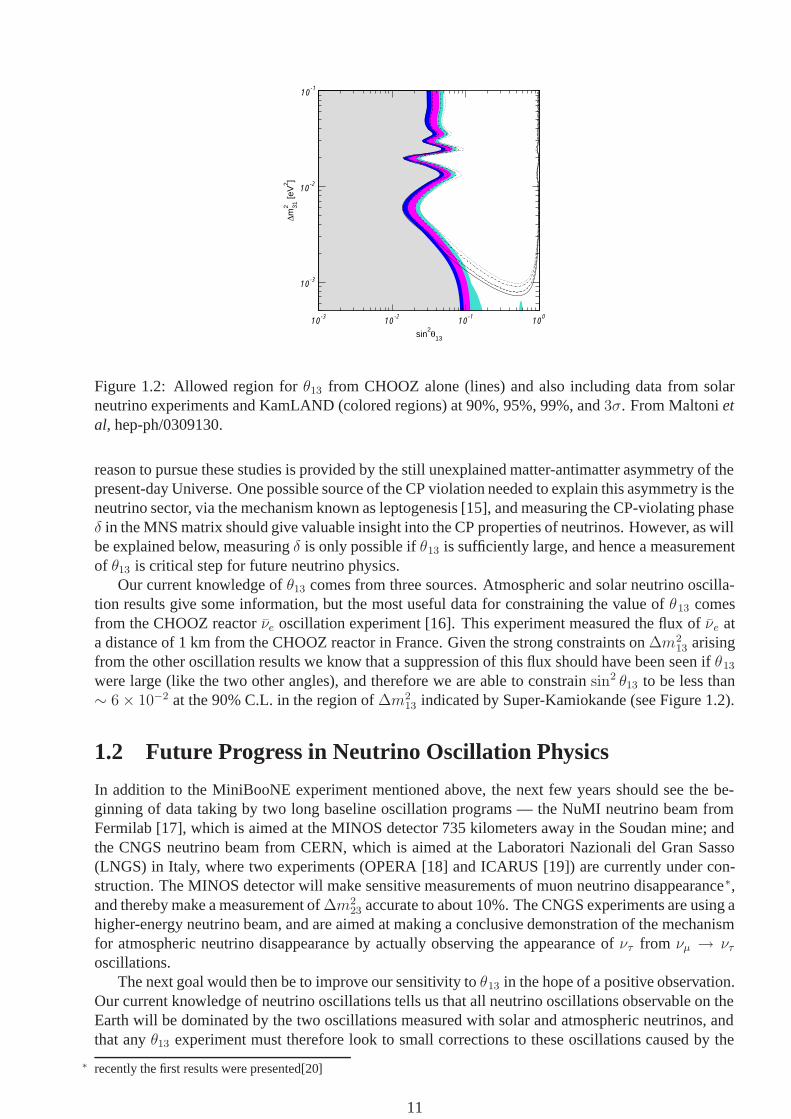
Figure 1.2: Allowed region for θ13 from CHOOZ alone (lines) and also including data from solarneutrino experiments and KamLAND (colored regions) at 90%, 95%, 99%, and 3σ. From Maltoni etal, hep-ph/0309130.
reason to pursue these studies is provided by the still unexplained matter-antimatter asymmetry of thepresent-day Universe. One possible source of the CP violation needed to explain this asymmetry is theneutrino sector, via the mechanism known as leptogenesis [15], and measuring the CP-violating phaseδ in the MNS matrix should give valuable insight into the CP properties of neutrinos. However, as willbe explained below, measuring δ is only possible if θ13 is sufficiently large, and hence a measurementof θ13 is critical step for future neutrino physics.
Our current knowledge of θ13 comes from three sources. Atmospheric and solar neutrino oscilla-tion results give some information, but the most useful data for constraining the value of θ13 comesfrom the CHOOZ reactor νe oscillation experiment [16]. This experiment measured the flux of νe ata distance of 1 km from the CHOOZ reactor in France. Given the strong constraints on Δm2
13 arisingfrom the other oscillation results we know that a suppression of this flux should have been seen if θ13
were large (like the two other angles), and therefore we are able to constrain sin2 θ13 to be less than∼ 6 × 10⁻² at the 90% C.L. in the region of Δm2
13 indicated by Super-Kamiokande (see Figure 1.2).
1.2 Future Progress in Neutrino Oscillation Physics
In addition to the MiniBooNE experiment mentioned above, the next few years should see the be-ginning of data taking by two long baseline oscillation programs — the NuMI neutrino beam fromFermilab [17], which is aimed at the MINOS detector 735 kilometers away in the Soudan mine; andthe CNGS neutrino beam from CERN, which is aimed at the Laboratori Nazionali del Gran Sasso(LNGS) in Italy, where two experiments (OPERA [18] and ICARUS [19]) are currently under con-struction. The MINOS detector will make sensitive measurements of muon neutrino disappearance∗,and thereby make a measurement of Δm2
23 accurate to about 10%. The CNGS experiments are using ahigher-energy neutrino beam, and are aimed at making a conclusive demonstration of the mechanismfor atmospheric neutrino disappearance by actually observing the appearance of ντ from νμ → ντ
oscillations.The next goal would then be to improve our sensitivity to θ13 in the hope of a positive observation.
Our current knowledge of neutrino oscillations tells us that all neutrino oscillations observable on theEarth will be dominated by the two oscillations measured with solar and atmospheric neutrinos, andthat any θ13 experiment must therefore look to small corrections to these oscillations caused by the
∗ recently the first results were presented[20]
11

sub-dominant effects which are all that θ13 will give rise to (given that we already know that θ13 issmall). To understand these sub-dominant effects we need to go beyond the 2-neutrino formula shownabove and look at the oscillation formula taking into account the full 3-neutrino mixing matrix:
P (νμ → νe) = 4C213S
213S
223 sin2 Φ31 ×
(1 + 2a
Δm231
(1 − 2S213)
)+ 8C2
13S12S13S23(C12C23 cos δ − S12S13S23) cos Φ32 · sin Φ31 · sin Φ21
− 8C213C12C23S12S13S23 sin δ · sin Φ32 · sin Φ31 · sin Φ21
+ 4S212C
213 (C2
12C223 + S2
12S223S
213 − 2C12C23S12S23S13 cos δ) sin2 Φ21
− 8C213S
213S
223 (1 − 2S2
13)aL4Eν
cos Φ32 · sin Φ31. (1.4)
Here, Φij ≡ Δm2ijL/4E. This expression is complex, and even this is only an approximation (the
matter effects come in through the terms multiplied by the parameter a, which depends upon theelectron density, fundamental constants and mass differences, and in this formula the matter effectsare calculated in the approximation of constant density). Analyzing the predictions of this formulais currently rather difficult, as it contains three unknown quantities (δ, θ13, and the sign of Δm2
23,which comes into the matter effect parameter a), as well as all the other oscillation constants, whichof course have uncertainties in their measured values. However given the already known limits on theparameters it is possible to produce an approximate form of this formula that makes the point of theT2K experiment a little easier to explain:
P (νμ → νe) ≈ sin2 2θ13 sin2 2θ23 sin2 Δ
± α sin 2θ13 sin δ cos θ13 sin 2θ12 sin 2θ23 sin3 Δ
− α sin 2θ13 cos δ cos θ13 sin 2θ12 sin 2θ23 cos Δ sin 2Δ
+ α2 cos2 θ23 sin2 2θ12 sin2 Δ
where α ≡ Δm221/Δm2
31 and Δ = Δm231L/4E. The existing limits from joint fits to the solar,
KamLAND, and Super-K atmospheric data show that α ≈ 3 × 10⁻². CHOOZ + solar neutrino datashows that sin2 2θ13 <∼ 0.2, and of course the value of δ is completely unknown. For the valueswhich will be used in the T2K experiment all the other terms in this expansion are ∼ 1. It shouldalso be noted that this expansion sets the matter terms to zero, however for T2K that is an excellentapproximation. Looking at the approximate formula, the only term that doesn’t depend on θ13 isthe last one (which is in fact the approximate form for the oscillations that KamLAND sees), butthis depends on α2 and is therefore unobservable in T2K. For values of sin 2θ13 within an order ofmagnitude of its current upper limit, the first term dominates, which describes a relatively simpleoscillatory appearance of νe in νμ beam.
That then suggests the proper target for future experiments. Firstly, we need to improve our sen-sitivity to θ13 by at least an order of magnitude, and hopefully more. The MINOS and the CNGSexperiments should produce some improvement in our sensitivity, but certainly not an order of mag-nitude. At the same time measuring θ23 and Δm2
23 with greater precision is interesting in its own right(in particular, the deviation of θ23 from π/4 is a matter of great interest to model builders) as wellas being a necessary for extracting the values of the so-far unmeasured parameters from oscillationmeasurements.
1.3 The T2K Long Baseline Experiment
The first phase of the T2K experiment is therefore aimed at three main goals — the more accuratedetermination of the “atmospheric” parameters θ23 and Δm2
23, a measurement of θ13 with more than anorder of magnitude sensitivity than any previous experiments, and a search for νμ → ντ component.The project is based on adding a beam line (of which more detail is described in the chapter 2) to
12

Target St ation
To Super-Kamiokande
ND280
Decay Pipe
Figure 1.3: Overview of the J-PARC facility.
redirect the proton beam from the 50 GeV synchrotron currently under construction at the new J-PARC facility (Figure 1.3) in Tokai, Japan [21] to produce an intense neutrino beam. The high powerof the J-PARC proton beam, 0.75 MW in Phase-I, will produce the most intense neutrino beam everbuilt. We request total integrated beam power larger than 0.75 MW x 15000h at any proton energiesbetween 30 and 50 GeV. Operation of 0.75 MW with 50GeV beam energy can deliver 1021 POT with3000h run time. We assume 1021 POT with 40GeV beam energy for the studies shown in this proposal.Since the lower energy operation of accelerator with the same beam power 0.75 MW can deliver moreneutrinos as described in the subsection 1.5, the results in this document are conservative.
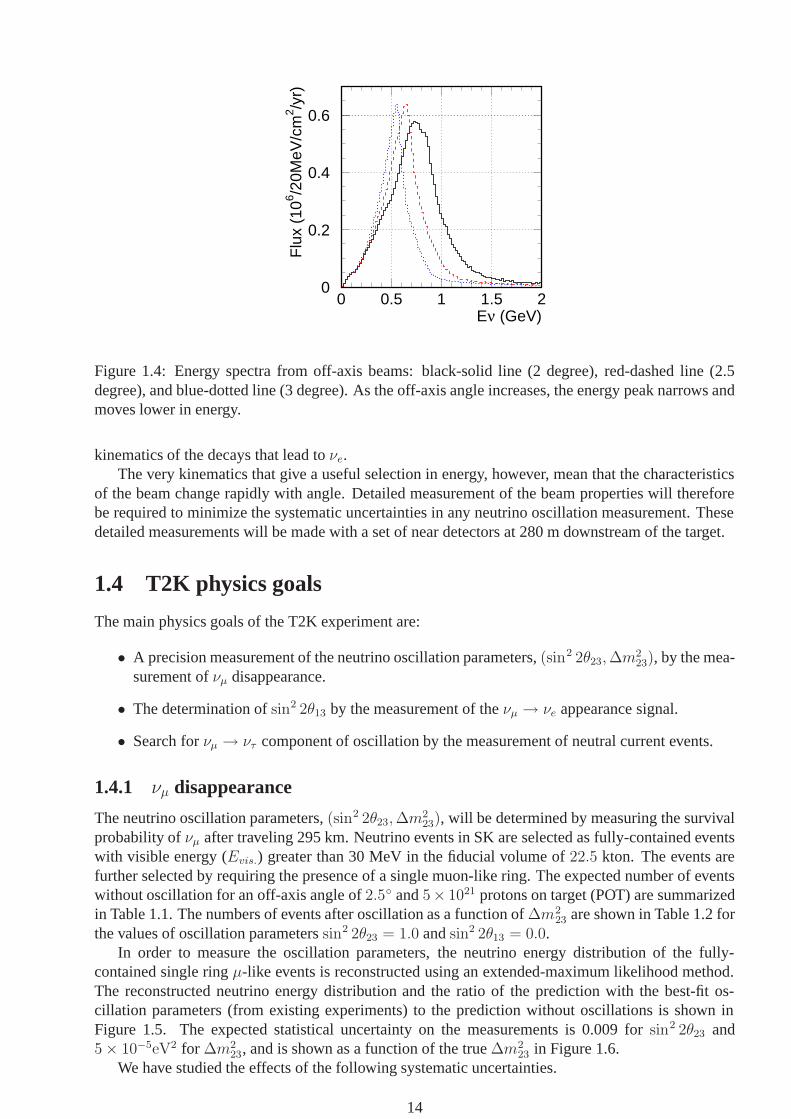
A set of detectors are located 280 m from the pion production target to characterize the neutrinobeam. This beam then propagates underground for 295 km to the Super-Kamiokande (SK) detec-tor [22] in western Japan, which is well suited for distinguishing νμ and νe in the neutrino beamby looking at Cherenkov radiation from μ’s and e’s produced by charged-current interactions in its50 kton water target. A key element of the design of the T2K facility is that the neutrino beam isdirected so that the beam axis actually misses Super-Kamiokande ( off-axis neutrino beams ). This,rather surprisingly, actually results in a considerable improvement in the quality of the beam for the νe
appearance experiment. This arises from the kinematics of π decay, which result in an enhancementin the neutrino flux produced over a very narrow range of energies which depend on the exact off-axisangle (see Figure 1.4). By selecting the correct angle, this narrow peak can be near on the oscilla-tion maximum at the far detector, SK. This has three major advantages over a conventional on-axisbeam. Firstly, the off-axis neutrino flux at the desired energy (near the oscillation maximum) is actu-ally higher than on-axis. Secondly, there are fewer high-energy neutrinos, which do not contribute tothe appearance signal but do contribute to its backgrounds, in particular through the neutral-currentproduction of π0’s (which decay to produce two γ’s, which can sometimes be mistaken for the singleelectron characteristic of a charged-current interaction with a νe). Thirdly, the background due to theintrinsic contamination of the beam by νe is actually less at the off-axis position due to the different
13
0
0.2
0.4
0.6
0 0.5 1 1.5 2Eν (GeV)
Flu
x (1
06 /20M
eV/c
m2 /y
r)
Figure 1.4: Energy spectra from off-axis beams: black-solid line (2 degree), red-dashed line (2.5degree), and blue-dotted line (3 degree). As the off-axis angle increases, the energy peak narrows andmoves lower in energy.
kinematics of the decays that lead to νe.The very kinematics that give a useful selection in energy, however, mean that the characteristics
of the beam change rapidly with angle. Detailed measurement of the beam properties will thereforebe required to minimize the systematic uncertainties in any neutrino oscillation measurement. Thesedetailed measurements will be made with a set of near detectors at 280 m downstream of the target.
1.4 T2K physics goals
The main physics goals of the T2K experiment are:
• A precision measurement of the neutrino oscillation parameters, (sin2 2θ23, Δm223), by the mea-
surement of νμ disappearance.
• The determination of sin2 2θ13 by the measurement of the νμ → νe appearance signal.
• Search for νμ → ντ component of oscillation by the measurement of neutral current events.
1.4.1 νμ disappearance
The neutrino oscillation parameters, (sin2 2θ23, Δm223), will be determined by measuring the survival
probability of νμ after traveling 295 km. Neutrino events in SK are selected as fully-contained eventswith visible energy (Evis.) greater than 30 MeV in the fiducial volume of 22.5 kton. The events arefurther selected by requiring the presence of a single muon-like ring. The expected number of eventswithout oscillation for an off-axis angle of 2.5◦ and 5× 10²¹ protons on target (POT) are summarizedin Table 1.1. The numbers of events after oscillation as a function of Δm2
23 are shown in Table 1.2 forthe values of oscillation parameters sin2 2θ23 = 1.0 and sin2 2θ13 = 0.0.
In order to measure the oscillation parameters, the neutrino energy distribution of the fully-contained single ring μ-like events is reconstructed using an extended-maximum likelihood method.The reconstructed neutrino energy distribution and the ratio of the prediction with the best-fit os-cillation parameters (from existing experiments) to the prediction without oscillations is shown inFigure 1.5. The expected statistical uncertainty on the measurements is 0.009 for sin2 2θ23 and5 × 10−5eV2 for Δm2
23, and is shown as a function of the true Δm223 in Figure 1.6.
We have studied the effects of the following systematic uncertainties.
14

CC-QE CC-nonQE NC All νμ
Generated in FV 4,114 3,737 3,149 11,000(1) FCFV 3,885 3,011 1,369 8,265(2) Evis. ≥ 30 MeV 3,788 2,820 945 7,553(3) Single ring μ-like 3,620 1,089 96 4,805
Table 1.1: The expected number of neutrino events for 5 × 10²¹ POT for νμ disappearance analysiswithout oscillation. CC-QE refers to charged current quasi-elastic events and CC-nonQE to othercharged current events, while NC refers to neutral current events.
Δm2 (eV2) CC-QE CC-nonQE NC All νμ
No oscillation 3,620 1,089 96 4,8052.0 × 10−3 933 607 96 1,6362.3 × 10−3 723 525 96 1,3442.7 × 10−3 681 446 96 1,2233.0 × 10−3 800 414 96 1,310
Table 1.2: The expected number of neutrino events for 5 × 10²¹ POT for νμ disappearance analysiswith neutrino oscillation for different values of Δm2
23 with sin2 2θ23 = 1.0 and sin2 2θ13 = 0.0.
0
25
50
75
100
0 0.5 1 1.5 2
ALLCHAN 1223.
Eνrec (GeV)
(/50
MeV
/22.
5kt/5
yr)
10-1
1
0 0.5 1 1.5 2Eνrec (GeV)
ratio
Figure 1.5: (Left) The reconstructed neutrino energy distribution with predicted for the best-fit os-cillation parameters (sin2 2θ23, Δm2
23) = (1.0, 2.7 × 10⁻³eV2). The hatched area shows the non-QEcomponent. (Right) The ratio of the reconstructed neutrino energy distribution with oscillation to onewithout oscillation.
15

10-3
10-2
10-1
1 2 3 4Δm2 (x10-3 eV2)
sin2 2
θ stat.error
10-5
10-4
10-3
1 2 3 4Δm2 (x10-3 eV2)
Δm2stat.error
Figure 1.6: The statistical uncertainty of the oscillation parameters as a function of true Δm223. The
value of sin2 2θ23 is assumed to be one.
1. The uncertainty in the predicted number of the fully-contained single ring μ-like events. Weconsider 10 % uncertainty (Red curve).
2. The uncertainty in the non-QE/QE ratio. We consider 20 % uncertainty (Green).
3. The uncertainty in the energy scale. We consider 4 % uncertainty (Blue).
4. The uncertainty in the spectrum shape (Pink). We multiply a weighting factor 1+0.2(1−Eν)+const. to neutrino spectrum. This change roughly represents the difference of spectra predictedby MARS and FLUKA hadron production models.
5. The uncertainty in the spectrum width (Lightblue). We consider 10% uncertainty.
Figure 1.7 shows the effect of the systematic errors. In order to keep the systematic uncertaintiesbelow the statistical error, the uncertainties should be less than about 5 % for the predicted number ofevents, 2 % for the energy scale, and 5-10 % for the non-QE/QE ratio, 10% for the spectrum width.The spectrum shape uncertainty should be less than the difference of the hadron production modelsMARS and FLUKA.
-0.04
-0.02
0
0.02
0.04
1.5 2 2.5 3Δm2 (x10 -3 eV 2)
(sin
2 2 )
-10
-5
0
5
10
1.5 2 2.5 3Δm2 (x10 -3 eV 2)
( Δ m
2 ) (x1
0-5
eV
2 )
Figure 1.7: Effects of systematic uncertainties on determination of oscillation parameters (OA2.5deg).Red curve: the effect when flux is changed by 10%, Green: nonQE/QE ratio changed by 20%, Blue:energy scale changed by 4%, Pink: spectrum shape (see text), Lightblue: width of spectrum changedby 10%. The dashed curve indicate 1σ statistical error.
16

νμCC BG νμNC BG beam νe BG νeCC signalFully-contained, Evis ≥100MeV 2215 847 184 2431 ring e-like, no decay-e 12 156 71 1870.35≤ Erec.
ν ≤0.85GeV 1.8 47 21 146e/π0 separations 0.7 9 13 103
Table 1.3: The number of events selected by the νe appearance analysis, as predicted by NEUT MonteCarlo for 5 × 10²¹ POT exposure. For the calculation of oscillated νe, Δm2 = 2.5 × 10⁻³eV2 andsin2 2θ13 = 0.1 are assumed.
1.4.2 νe appearance
The νe selection cuts are based on the SK-1 atmospheric neutrino analysis. Events are required to befully contained within the 22.5kton fiducial volume, have visible energy (Evis) greater than 100MeV,a single electron like (e-like) ring, and no decay electrons. The electron identification eliminatesthe most muon background events, and the decay electron cut further reduces events from inelasticcharged current (CC) processes associated with π0 production. The dominant source of backgroundevents (see Table 1.3) at this stage is single π0 production in neutral current (NC) interactions. Thebackgrounds can be further reduced by requiring the reconstructed neutrino energy to be around theoscillation maximum: 0.35 GeV ≤ E rec.
ν ≤ 0.85GeV.The remaining background from π0 is further reduced with specific “e/π0 separation” cuts. The
π0 background has a steep forward peak towards the neutrino direction due to coherent π0 production.Thus events in the extreme forward direction (cos θνe ≥ 0.9) are rejected. Then events with only onehigh-energy gamma detected in the asymmetric decay of the π0 are the dominant background. Inorder to find the hidden lower-energy gamma ring, the photomultiplier hit pattern, including scatteredlight, is fit under the hypothesis of two gamma rings. The energy and direction of each gamma ringare reconstructed, and the invariant mass of two rings is calculated. The π0 background is furthersuppressed by rejecting events with the mass at around the π0 mass (mrec.
2γ ≥ 100MeV/c2). Thesefurther “e/π0’ separation’ cuts significantly reduce the π0 background. The background level due toNC-π0 is expected to be comparable to the predicted background from intrinsic νe in the beam.
Table 1.3 summarizes the number of events after the event selections for 5 × 10²¹ POT exposureat Δm2 = 2.5 × 10⁻³eV2 and sin2 2θ13 = 0.1.
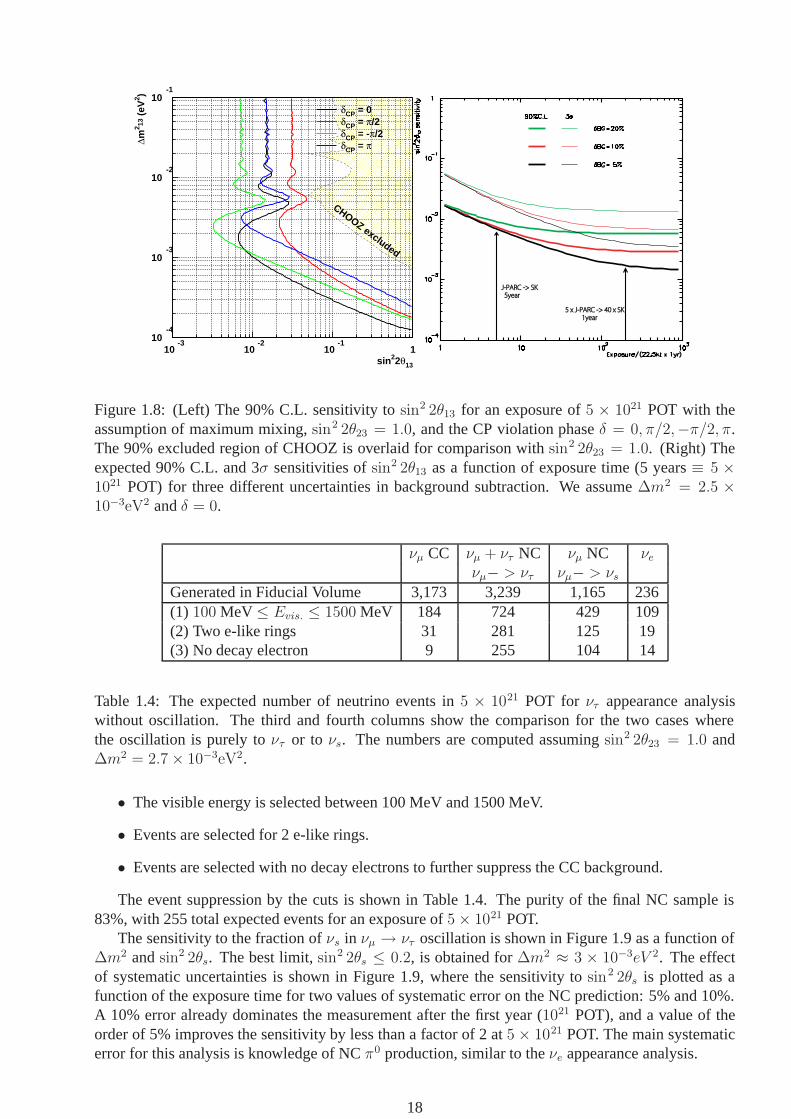
As a sensitivity, we calculate the 90% upper limit for an experiment that observes the expectedbackground rate. Figure 1.8 shows the 90% C.L. νe sensitivity for 5 × 10²¹ POT exposure and forsin2 2θ23 = 1 and δ = 0, π/2,−π/2, π, assuming a 10% systematic uncertainty in the backgroundsubtraction. The sensitivity is sin2 2θ13 = 0.008 at 90% C.L. for Δm2 ∼ 2.5 × 10⁻³eV2. Thisrepresents an order of magnitude improvement over the CHOOZ limit.
Figure 1.8 shows the 90% C.L. and 3σ νe sensitivities as a function of the exposure time forΔm2 = 2.5 × 10⁻³eV2 for systematic uncertainties in the background subtraction of 5%, 10%, and20%. This graph suggests the target for the near detectors of a 10% uncertainty in the background inthe first phase (5 × 10²¹ POT = SK×5years ).
1.4.3 ντ versus νsterile analysis
The analysis of ντ appearance has been performed by the Super-Kamiokande collaboration [24]. Thismeasurement disfavors a pure νμ → νsterile solution to the atmospheric neutrino anomaly. The searchfor νμ → νsterile with small mixing angle is still an interesting topic that can be addressed by the T2Kexperiment. The analysis method is based on the neutral current measurement in the SK detector, aclear signature of which is single π0 production. The analysis is performed in a similar way to theprevious ones:
• 22.5 kton fiducial volume cut is applied.
17
10-4
10-3
10-2
10-1
10-3
10-2
10-1
1sin22θ13
Δm2 13
(eV
2 )
CHOOZ excluded
δCP = 0δCP = π/2δCP = -π/2δCP = π
J-PARC -> SKJ-PARC -> SK 5year 5year
5 x J-PARC -> 40 x SK5 x J-PARC -> 40 x SK 1year 1year
Figure 1.8: (Left) The 90% C.L. sensitivity to sin2 2θ13 for an exposure of 5 × 10²¹ POT with theassumption of maximum mixing, sin2 2θ23 = 1.0, and the CP violation phase δ = 0, π/2,−π/2, π.The 90% excluded region of CHOOZ is overlaid for comparison with sin2 2θ23 = 1.0. (Right) Theexpected 90% C.L. and 3σ sensitivities of sin2 2θ13 as a function of exposure time (5 years ≡ 5 ×10²¹ POT) for three different uncertainties in background subtraction. We assume Δm2 = 2.5 ×10⁻³eV2 and δ = 0.
νμ CC νμ + ντ NC νμ NC νe
νμ− > ντ νμ− > νs
Generated in Fiducial Volume 3,173 3,239 1,165 236(1) 100 MeV ≤ Evis. ≤ 1500 MeV 184 724 429 109(2) Two e-like rings 31 281 125 19(3) No decay electron 9 255 104 14
Table 1.4: The expected number of neutrino events in 5 × 10²¹ POT for ντ appearance analysiswithout oscillation. The third and fourth columns show the comparison for the two cases wherethe oscillation is purely to ντ or to νs. The numbers are computed assuming sin2 2θ23 = 1.0 andΔm2 = 2.7 × 10⁻³eV2.
• The visible energy is selected between 100 MeV and 1500 MeV.
• Events are selected for 2 e-like rings.
• Events are selected with no decay electrons to further suppress the CC background.
The event suppression by the cuts is shown in Table 1.4. The purity of the final NC sample is83%, with 255 total expected events for an exposure of 5 × 10²¹ POT.
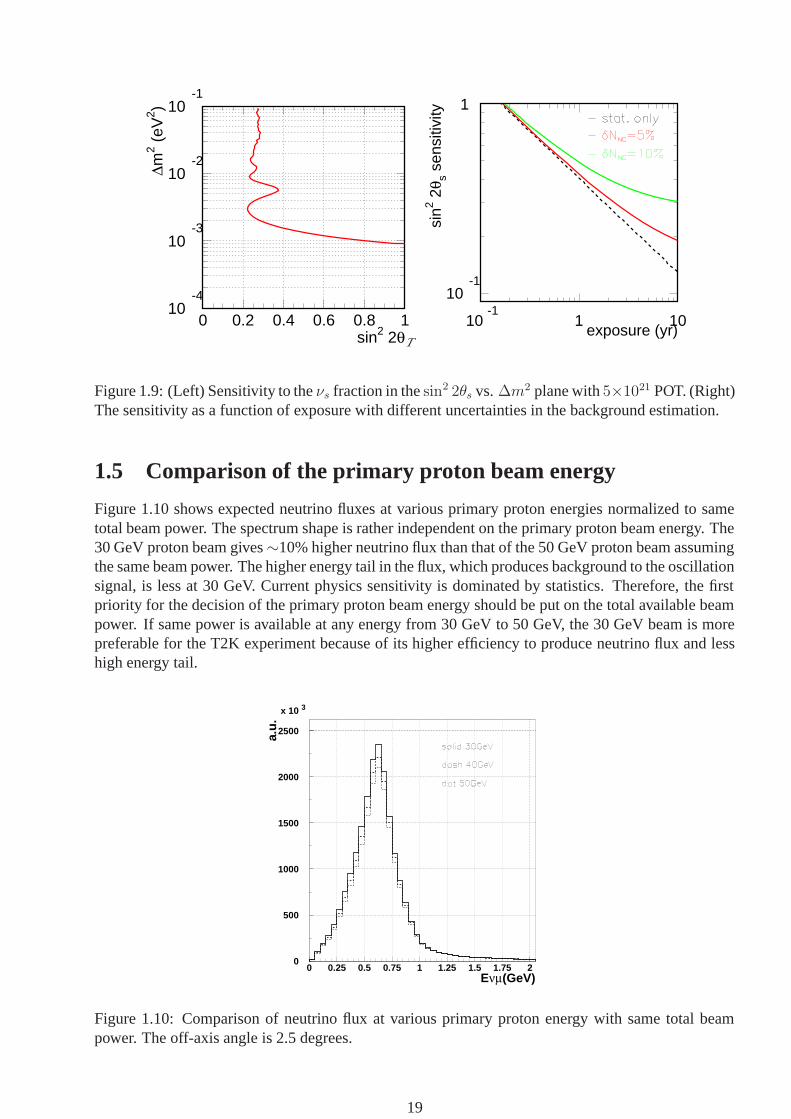
The sensitivity to the fraction of νs in νμ → ντ oscillation is shown in Figure 1.9 as a function ofΔm2 and sin2 2θs. The best limit, sin2 2θs ≤ 0.2, is obtained for Δm2 ≈ 3 × 10⁻³eV 2. The effectof systematic uncertainties is shown in Figure 1.9, where the sensitivity to sin2 2θs is plotted as afunction of the exposure time for two values of systematic error on the NC prediction: 5% and 10%.A 10% error already dominates the measurement after the first year (1021 POT), and a value of theorder of 5% improves the sensitivity by less than a factor of 2 at 5 × 10²¹ POT. The main systematicerror for this analysis is knowledge of NC π0 production, similar to the νe appearance analysis.
18
10-4
10-3
10-2
10-1
0 0.2 0.4 0.6 0.8 1sin2 2θ
Δm2 (
eV2 )
s
10-1
1
10-1
1 10exposure (yr)
sin2 2
θ s se
nsiti
vity
Figure 1.9: (Left) Sensitivity to the νs fraction in the sin2 2θs vs. Δm2 plane with 5×10²¹ POT. (Right)The sensitivity as a function of exposure with different uncertainties in the background estimation.
1.5 Comparison of the primary proton beam energy
Figure 1.10 shows expected neutrino fluxes at various primary proton energies normalized to sametotal beam power. The spectrum shape is rather independent on the primary proton beam energy. The30 GeV proton beam gives ∼10% higher neutrino flux than that of the 50 GeV proton beam assumingthe same beam power. The higher energy tail in the flux, which produces background to the oscillationsignal, is less at 30 GeV. Current physics sensitivity is dominated by statistics. Therefore, the firstpriority for the decision of the primary proton beam energy should be put on the total available beampower. If same power is available at any energy from 30 GeV to 50 GeV, the 30 GeV beam is morepreferable for the T2K experiment because of its higher efficiency to produce neutrino flux and lesshigh energy tail.
0
500
1000
1500
2000
2500
x 10 3
0 0.25 0.5 0.75 1 1.25 1.5 1.75 2Eνμ(GeV)
a.u
.
Figure 1.10: Comparison of neutrino flux at various primary proton energy with same total beampower. The off-axis angle is 2.5 degrees.
19

Chapter 2
Neutrino Beam
In this chapter, the neutrino beam line is described. After an overview, status and schedule of eachcomponent is reported.
2.1 Overview of the neutrino beamline
2.1.1 Neutrino beam production
A neutrino beam at J-PARC is produced with “conventional method” where pions produced by hittingprotons on target decay into νμ and muons. The πs are focused by toroidal magnets called the elec-tromagnetic horns and injected into a volume where they decay in flight (decay volume). The beamis almost pure νμ. The sign of νμ or νμ can be selected by flipping the polarity of the horns.
In the T2K experiment, in order to maximize the sensitivity by making high intensity lowenergy narrow band beam tuned at oscillation maximum, off-axis (OA) scheme is adopted for the firsttime[23].
Recent results from the SK [5], K2K [8] and MINOS [20] experiments point at Δm223 = 2 ∼
3 × 10⁻³ eV2. At this parameter, the oscillation maximum is at around the neutrino energy of500 ∼ 700 MeV at the SK; i.e., 295 km away from the source. In addition, the high energy neu-trinos (�1 GeV) do not only contribute to the measurement of the oscillation but become backgroundsources for low energy neutrinos via the neutral current interaction or the inelastic scattering. As thesephysics condition prefers the high intensity narrow band low energy neutrino beam, we use the OAscheme as a solutions to meet the requirement.
Target
Horns Decay Volume
Far detector
(SK)
Proton
beam
OA (OA angle)
Figure 2.1: Schematic of the Off-axis beam
In on-axis beam, the neutrino detector is placed on the same axis as the one to which protonbeam, the target, the electromagnetic horn and the decay volume are aligned. In this case we getbroad neutrino energy spectrum (the Wide Band Beam:WBB) as is used in the K2K experiment. Thedetector is placed at a few degree (OA angle) off from the beam axis in the OA beam as shown in Fig.2.1. The kinematics of pion decay for the on-axis and the OA beam is illustrated in Fig. 2.2. Theneutrino energy is proportional to the energy of the parent π meson when the OA angle is 0 (WBB),
20

E�(GeV)0 2 4 6 8 10
E�(G
eV
)
0
1
2
3
Figure 2.2: Kinematics of the Off-axis beam
while it is almost independent of the π meson energy with non-zero OA angle. Since pions in a widemomentum range contribute to narrow energy range of neutrino, a narrow intense neutrino beam isobtained.
2.1.2 Expected beam
Expected neutrino properties are estimated with the MC simulation in which the geometry of neutrinoproduction equipments are coded. The expected number of total and CC interactions in 22.5 ktonfiducial volume of SK is 2,300events/yr and 1,700events/yr, respectively, at 2.5degree off-axis in thecase of no oscillation with 30 GeV, 0.75 MW, 3000 hr/yr operation. Expected energy spectra at SKare plotted in Fig. 2.3. Peaks of the energy spectra are at 780 MeV and 600 MeV for 2 and 2.5degree off-axis, respectively. Contamination of νe in the νμ beam is ∼ 0.4% at the peak energy of νμ
spectrum.
104
105
106
107
(b)
0 2 4 6 8
νμ
0 2 4 6 8102
103
104(c) νe
Eν (GeV) Eν (GeV)
Φμν (a
.u.)
Φeν (a
.u.)
0
2000
4000
6000
8000
10000x 103
0 0.5 1.0 1.5 2Eν (GeV)
Φμν
(50M
eV
/cm
2/5
yr) Solid: OA2.5deg
Dash : OA2deg(a)
Figure 2.3: Expected neutrino spectra. (a)Energy spectra of νµ fluxes for different off-axis angle with 30 GeV, 0.75 MW,3,000 hr/yr operation. (b) νµ flux. Solid is total and dashed line is contribution from Kaon decay. (c) ν e flux. Solid anddashed lines are total and contribution from Kaon, respectively.
2.1.3 Overview
The layout of neutrino facility in J-PARC is illustrated in 2.4. The neutrino beam line consists of:
• Primary proton beam line,
• Target station,
• Decay volume/pipe,
21

Preparation
Section
Arc
Sec
tion
Fin
al F
ocusin
g
Section
Pri
mary
Beam
line
Neutrino Utility
Building No.1 (NU1)
50G
eV
Synchro
tron
Neutrino Utility
Building No.3 (NU3)
Neutrino Utility
Building No.2 (NU2)
Beam dump
Target Station
Decay V
olu
me
Installation Building
(NC)
Neutrino Monitor
Building & hole (NM)
N
Figure 2.4: The layout of neutrino facility complex
22

• Beam dump,
• Muon monitor,
• Near neutrino detector,
and several utility buildings.Special features of T2K beam line are (1) the first use of superconducting (SC) combined function
magnets in the primary proton beam line, and (2) the first application of OA beam [23]. The use ofthe combined function magnets enabled to reduce cost while keeping large acceptance of the beamline. The OA beam can produce low energy high intensity νμ beam with adjustable sharp peak inthe energy spectrum. The position of the peak will be tuned at energy of oscillation maximum tomaximize the sensitivity. In order to have tunability of the neutrino energy spectrum, the neutrinobeam line is designed to cover OA angle from 2 to 2.5 degree.
Proton beam is extracted from 50-GeV PS in single turn (fast extraction). The design intensity ofthe beam is 3.3 × 10¹⁴ protons/pulse, and repetition period is 3.5 s, resulting in the beam power of0.75 MW at 50-GeV operation. The “50-GeV” PS will be operated at 30 or 40 GeV in early stage.One pulse (spill) consists of 8 bunches each with 58-ns full width and separated 598 ns, and the totalspill width is ∼4.2 μs. Possibility to operate with 15 bunches with doubled harmonic number is alsobeing studied.
The primary proton beam line is to transfer a proton beam from the 50GeV-PS to the neutrinoproduction target. It consists of the preparation, the arc, and the final focusing section (Fig. 2.5).The preparation section is the most upstream part of about 54 m long which consists of 12 normal
FQ
4F
Q3
BF
Q3
AF
H2
FV
2F
V1
FQ
2B
FQ
2A
FH
1F
Q1
PQ4B
PH3
PV2PQ5
PV1 PQ3B
PQ4A1.92 deg. bend
PQ2B
PD2PQ3A
PD1
PQ1
1.92 deg. bend
PQ2A
PH1PH2
Fast ext.(kicker, septum)
1.125kW (0.15%)
Preparation section
(ctrl’ed loss by collimator)
0.75kW (0.1%)
50GeV ring0.5W/m
Final Focusing section
0.25kW (0.03%)
Arc
part 1
W/m
Figure 2.5: Assumed beam loss in the primary proton beam line.
conducting magnets and collimators. Clean beam matched with the following arc section is pre-pared by the magnets and the collimators. It is designed to accommodate the beam emittance of60π mm·mrad. In the arc section, the proton beam is bent about 80◦ toward the Kamioka directionby 28 superconducting combined function magnets. The dipole and quadrupole components of themagnets are 2.586T and 18.62T/m for 50GeV operation. Radius of the arc section is 104.4m and thelength is about 150 m. The final focus section is the downstream of the arc section and consists of10 normal conducting magnet. The beam from the arc section is shaped to be suitable for the neu-trino target. Intensity, position, profile and loss monitors are installed along the primary beam line tomonitor/keep good beam conditions during the experiment. Beam loss of 750 W, 1 W/m and 250 Ware assumed in the preparation, arc and final focusing section, respectively (Fig. 2.5). Thickness ofradiation shielding is determined based on the assumption.
23

Target station accommodates a production target and electromagnetic horns. The target is a ∼3-cm diameter and 90-cm long Graphite rod (corresponding to 2 interaction length). About 80% ofincoming protons interact with the target material. Heat load from the beam is about 60 kJ/spill(∼20 kW). The target is cooled by forced-flow Helium gas in order to remove the heat. The target isfollowed by three electromagnetic horns which focus generated pions to forward direction. They aredriven by pulsed current of 320 kA at peak synchronized with the proton beam timing. The first hornand the target is protected from accidental hit of miss-steered proton beam by a kind of collimatorcalled baffle which is placed just upstream of the target & 1st horn. In order to reduce Tritium andNOx production, the target station is filled with Helium gas. In order to separate the 1atm Heliumgas and primary line vacuum, beam window is placed at the upstream entrance of the target station.It is made of Ti alloy and is cooled by Helium gas. Everything inside the target station will be highlyradio-activated and will never be accessible by hands once beam operation starts. All the beam linecomponents will have to be maintained remotely.
The decay volume (DV) is a free space down stream of the horn where pions decay in flight intoνμs and muons. The length between the target and the end of the decay volume is about 110 m. DVis filled with helium gas to reduce pion absorption, and is surrounded by concrete shield of about 6 mthick. The wall of Helium vessel is water cooled to remove heat load by the beam.
The beam dump is placed at the end of DV and stops hadrons such as remaining protons andsecondary mesons. The dump consists of graphite blocks of 3.15 m thickness, 0.9-m thick Copperand 1.5-m thick Iron from upstream to downstream. The graphite blocks are cooled by Aluminumblock in which cooling water pipes are embedded.
The Muon monitor is placed just behind the beam dump, where is called muon pit, to detectmuons. While almost all hadrons are absorbed by the beam dump, muons of energy > 5 GeV canpenetrate the beam dump. Expected muon flux in the muon pit is ∼ 108/cm2/spill. The muon monitoris designed to provide pulse by pulse information on the intensity and profile (direction) of the beam.
At 280 m from the production target, neutrino detectors will be placed in order to measure neutrinobeam properties. Detail of the near detector is described in the detector section.
2.1.4 Overall status and schedule
The neutrino beam line facility was approved by the Japanese government in Dec. 2003 and theconstruction was started in April 2004 and will complete in March 2009.
In FY2004-2005, civil construction of 50-m part of the decay volume has been finished. InFY2005-2006, the construction of primary beam line tunnel is in progress. In FY2006, the con-struction of the target station will start. All the remaining tunnels and buildings will be constructedin the last two years, FY2007-2008. R&D and design, production of beam line components are inprogress as described in the following sections. Installation of primary line components will start inFY2007 and all the secondary beam line components will be installed in FY2008.
2.2 Normal conducting magnet
Based on the beam optics requirements, parameters of the magnets such as magnetic field strengthand gap heights were determined as shown in Table 2.1.
Engineering design of the magnets in the preparation section has been done. Fabrication is inprogress, and will be completed by the end of FY2006. After magnetic field measurement, installationof the magnets will be carried out in summer 2007
For the final-focus magnets, engineering design is in progress. Fabrication will be done in FY2007,followed by magnetic field measurement and installation to the final-focus section in 2008.
Commissioning of the magnets will be done in end of 2008 for both preparation and final-focusmagnets.
24

Table 2.1: Parameters of the normal-conducting magnets.
LHWhtdiwthgieHhtdiwpaG
08903700900309006000.143184CIM022C61HP
08903700900309006000.167136CIM022C62HP
014,3053,1053,1002000,3019.0CIM064Q1QP
043,3030,1030,1051000,3048.0CIM063Q2QP
083,3427004,1004061000,3898.1051431063D81DP
083,3496004,1004031000,3898.1061101062D82DP
004,1001,1006052051000,1000.106821CIM023D51VP
053,2082,1082,1051000,2019.0033Q3QP
092,1004,1026003021000,1000.131189022D62VP
073,3049049051000,3368.0063Q4QP
004,1006002,1003021000,1000.143184022D73HP
005,2627627001000,2087.0042Q5QP
005,2627627001000,2846.0042Q1QF
092,1026004,1002021000,1000.12815022D41VF
092,1026004,1002021000,1000.12738022D41HF
004,1042,2022,1005002057000.119141414D012HF
078,2049049051005,2587.0053Q2QF
078,2049049051005,2008.0053Q3QF
004,1022,1042,2005002057000.109361414D012HF
083,2004,1496004031000,2037.176129043D81DV
000,3002,1002,1051005,1495.0033Q4QF
083,3004,1496004031000,3047.158109063D82DV
htgneL
]mm[
]mm[ mrof drawtuOemaN
)retemaid elop( 051
]mm[paG lacitpO
)retemaid elop( 002
)retemaid elop( 051
edoc epyT
citengaM
dleiF
]T[
]mm[ paG tengaM
)retemaid elop( 051
)retemaid elop( 051
)retemaid elop( 051
)retemaid elop( 051
)retemaid elop( 001
)retemaid elop( 001
The normal conducting magnets will be placed in very high radiation environment, and hence bestrongly radio-active. It is necessary to minimize working time on maintenance or replacement of themagnets. Various components which enable shortening the work time such as quick connection/dis-connection system for water pipe and current lead, as well as remote sling tools to avoid close ap-proach to the magnets, have been developed.
2.3 Superconducting combined magnet system
As stated previously, the arc section consists of 28 superconducting combined function magnets.The section also contains 3 corrector coil packages, which is the combination of normal and skewdipole magnets. The cross section of the magnet is shown in Fig. 2.6 and the main parameters aresummarized in Table 2.2.
Table 2.2: Main Parameters of Superconducting Combined Function Magnet
Item Value ValueBeam Energy 50 GeV 40 GeVDipole Field 2.586 T 2.070 T
Quadrupole Field 18.62 T/m 14.90 T/mMagnetic Length 3.3 m 3.3 mOperation Current 7345 A 5876 A
Operating Temperature < 5 K -Load Line Ratio 75 % 60 %
Inductance 14 mH -Stored Energy 386 kJ 247 kJ
Magnet Coil Inner Diameter 173.4 mm -Beam Tube Inner Diameter 154.1 mm -
Magnet Yoke Outer Diameter 550.0 mm -Magnet Shell Outer Diameter 570.0 mm -
25

Iron Yoke
Yoke Stack Tube
L/R AsymmetricCoil
Plastic Collar
Lock Key
Stainless Steel Shell(SHe Vessel)
SC Busbar
Figure 2.6: Cross Section of Superconducting Combined Function Magnet
The 41 turn left-right asymmetric coil consists of 2 blocks on the high field side and 5 blocks onthe low field side. A pair of top and bottom coils, which are mirror symmetry, produce a dipole fieldof 2.586 T, and a quadrupole field of 18.62 T/m with an operation current of 7345 A for 50 GeVoperation with sufficiently good field quality. The coils are wound from the conductor used for theCERN-LHC arc dipole magnet outer layer coil. The plastic collars are made from glass-fiber filledphenolic plastic, which is equivalent to that used for the RHIC magnets. The collars work as groundinsulation, which simplifies the assembly process. The RHIC type yoke structure fixes the coil sizewith the compression pre-stress of 80 MPa providing a mechanical stability as well as good fieldquality. Construction of the magnet is completed with a 10 mm thick stainless steel shell, which alsoserves as the helium vessel.
The magnets are connected in series and powered by a single power supply. Each of the magnetsis protected by a cold diode and quench protection heaters. The cold diodes are those used for LHCarc quadrupole magnets. The quench detection system, which triggers the quench protection heaters,is based on the system developed by CEN Saclay (France) and will be supplied by Saclay.
The cryostat design is based on that of the LHC arc dipole magnets. The cryostat encases thetwo magnets in series constructing a doublet. Each of the magnets is mechanically supported by twosupport posts, and they are connected by bellows to decouple mechanically. The LHC common partsare either acquired directly from CERN or purchased from the company who produces the LHC partswith technical supports from CERN.
The corrector package consists of normal and skew dipole coils that are wound using the BNL(USA) developed direct winding technology. Each coil produces 0.1 Tm integral dipole field at theoperation current of about 50 A. The package is developed and is expected to be supplied by BNL.
The development of the combined function magnets is started in 2002. Two full scale prototypemagnets were built in JFY 2004. The bidding of the production magnets and cryostated doubletswas won by Mitsubishi Electric, and two production magnets were built in JFY 2005. Assemblyperformed at Mitsubishi Electric is shown in Fig. 2.7. All the magnets are tested in vertical cryostat,and excited up to 7700 A (105 % of 50 GeV operation current) without any spontaneous quenches.The quench protection scheme was also tested and was proven to be safe with a sufficient margin. The
26

field qualities were measured at a warm test bench as well as the vertical cryostat. The field qualitiesof the magnets are reproducible and meet the optics requirements. The first cryostated doublet whichcontains two prototype magnets were also completed and waited for testing.
Figure 2.7: Superconducting combined function magnet assembly at Mitsubishi Electric.
The construction schedule of the arc superconducting magnet system is as follows. In JFY 2006,twelve combined function magnets and six cryostated doublets will be built. The design of the cor-rector package as well as the quench detection system will be fixed in early JFY 2006 and fabricationwill be started within this fiscal year. The specification of the power supply and the transfer line,which connects ground level refrigerator and underground magnet system, will be defined also. InJFY 2007, fourteen (or twelve) magnets and seven (or six) doublets will be built. The installationof the doublet may start in the end of JFY 2007. The fabrication of the corrector packages will becompleted in summer 2007 and will be installed in the system within this fiscal year. The fabricationof the quench detector will be completed in March 2008. The power supply will be purchased in JFY2007. The fabrication of the transfer line will be started in JFY 2007. In the JFY 2008, the rest ofthe fabrication of the system as well as the installation will be finished until December. The systemcommissioning without beam will be started in January 2009 and ended in March. The system willbe ready for beam in the beginning of JFY 2009.
2.4 Primary Proton Beam Monitors
In the T2K experiment, four types of beam monitors will be installed to measure the primary protonbeam properties; 1) Beam Intensity Monitor, 2) Beam Position Monitor, 3) Beam Profile Monitor,and 4) Beam Loss Monitor.
2.4.1 Beam Intensity Monitor
A current transformer (CT), which is made of a toroidal magnetic core and a coil wound around thecore, is employed to measure the proton beam intensity since it is non-destructive, simple and estab-lished technology. Finemet(FT-3M), produced by Hitachi Metal Co., is chosen as the core material
27

since it has higher saturation flux density than usual core material such as Permalloy or ferrite. FourCTs will be installed; at the beginning and at the end of the two normal-conducting sections.
Two prototype CTs were manufactured and tested. The first prototype with an inner diameter of190mm was installed in the K2K proton beam line to check the basic performance of the intensitymonitor. The beam intensity measured with this CT agreed with the intensity measured with K2K’sCT with a relative deviation of about 0.8% upto the K2K beam intensity of ∼ 6 × 10¹²ppp.
The second prototype was made to prove the performance. The inner diameter was expanded to260mm to fit the real beam pipe size including the flange part. By performing a high current testand a temperature dependence test, it was confirmed that the output signal is linear to the input pulsecharge within 1.3% upto corresponding charge to one bunch of J-PARC full-intensity beam, and nosignificant temperature dependence was found.
The engineering design is being finalized by the end of 2006. Fabrication will be done in FY2007, and the installation will take place in FY 2007 (in the preparation section) and in FY 2008 (inthe final-focus section).
2.4.2 Beam Position Monitor
The beam center position is required to be measured within 0.5 mm accuracy. Beam position monitorsshould be operational under the highest beam intensity. The electro-static monitor (ESM) with fourpick-up electrodes surrounding the beam-axis is employed. Beam position is obtained from the left-right (or up-down) asymmetry of the signal amplitudes. This monitor is non-destructive and thestructure is simple. We install 20 beam position monitors distributed along the beam line.
A prototype was constructed and exposed to the K2K primary proton beam to check the basicperformance(Fig. 2.8). Position resolution is demonstrated to be better than 0.3 mm which satisfy the
200mm200mm
Figure 2.8: ESM prototype.
requirement of 0.5 mm.Engineering design for production is being finalized. Mass production will start within FY2006.
The installation is to be completed by the fall 2008.
2.4.3 Beam Profile Monitor
Beam profile monitors are required to measure beam center position with 0.5 mm precision and profilewidth with 0.35 mm and 0.7 mm precision for the most downstream and the other locations, respec-tively. These requirements are to control the neutrino beam direction within 1 mrad and to protect thetarget from breakdown.
A Segmented Secondary-Emission Monitor (SSEM) will be used as a profile monitor. The mon-itor consists of a HV anode foil and two cathode layers of segmented foils (x and y) in both sides ofthe anode foil. Secondary electrons are emitted from the cathode foils when the proton beam passesthrough the cathode material, giving a positive signal read out from the cathode foils. In order toreduce beam loss caused by interactions of protons in the foils, very thin Titanium foils of 5 μm thick,
28
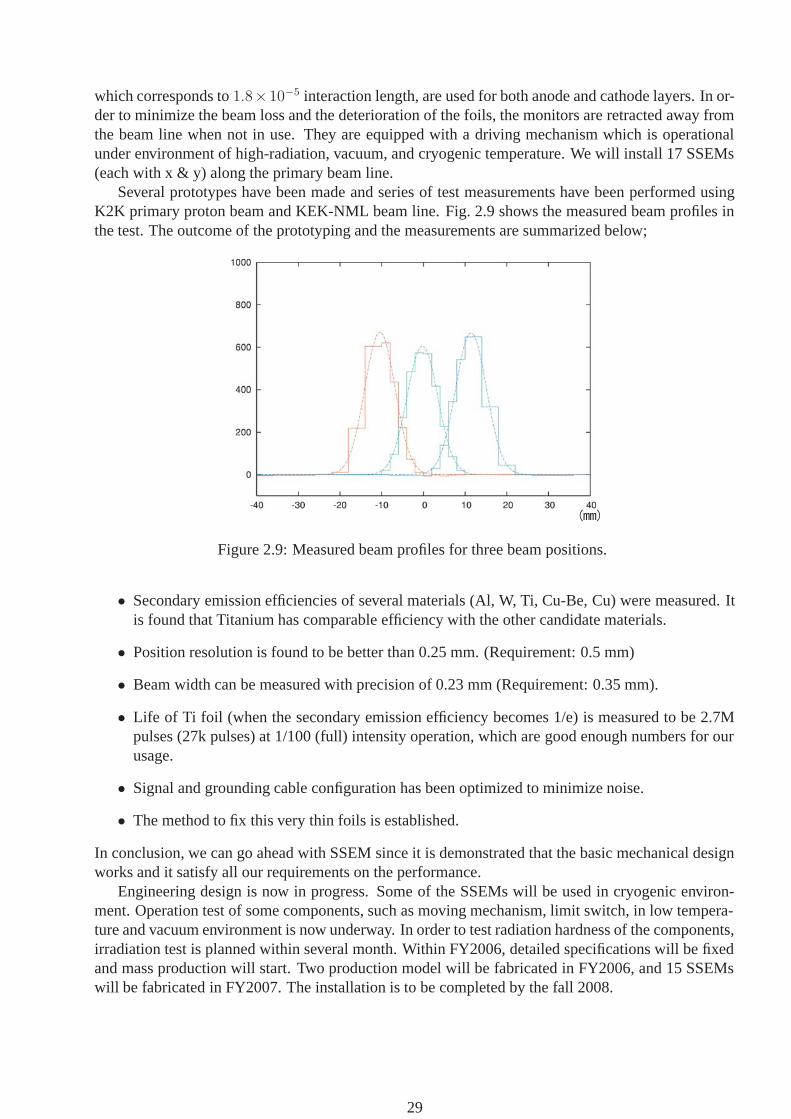
which corresponds to 1.8×10⁻⁵ interaction length, are used for both anode and cathode layers. In or-der to minimize the beam loss and the deterioration of the foils, the monitors are retracted away fromthe beam line when not in use. They are equipped with a driving mechanism which is operationalunder environment of high-radiation, vacuum, and cryogenic temperature. We will install 17 SSEMs(each with x & y) along the primary beam line.
Several prototypes have been made and series of test measurements have been performed usingK2K primary proton beam and KEK-NML beam line. Fig. 2.9 shows the measured beam profiles inthe test. The outcome of the prototyping and the measurements are summarized below;
Figure 2.9: Measured beam profiles for three beam positions.
• Secondary emission efficiencies of several materials (Al, W, Ti, Cu-Be, Cu) were measured. Itis found that Titanium has comparable efficiency with the other candidate materials.
• Position resolution is found to be better than 0.25 mm. (Requirement: 0.5 mm)
• Beam width can be measured with precision of 0.23 mm (Requirement: 0.35 mm).
• Life of Ti foil (when the secondary emission efficiency becomes 1/e) is measured to be 2.7Mpulses (27k pulses) at 1/100 (full) intensity operation, which are good enough numbers for ourusage.
• Signal and grounding cable configuration has been optimized to minimize noise.
• The method to fix this very thin foils is established.
In conclusion, we can go ahead with SSEM since it is demonstrated that the basic mechanical designworks and it satisfy all our requirements on the performance.
Engineering design is now in progress. Some of the SSEMs will be used in cryogenic environ-ment. Operation test of some components, such as moving mechanism, limit switch, in low tempera-ture and vacuum environment is now underway. In order to test radiation hardness of the components,irradiation test is planned within several month. Within FY2006, detailed specifications will be fixedand mass production will start. Two production model will be fabricated in FY2006, and 15 SSEMswill be fabricated in FY2007. The installation is to be completed by the fall 2008.
29

2.4.4 Beam Loss Monitor
To monitor the beam losses, Beam Loss Monitors (BLMs) will be distributed along the beam line.If BLMs detect large beam loss, accelerator operation will be vetoed to minimize the damage tobeam-line components and environmental radiation level. In the arc section, the maximum beamenergy loss is required to be less than 1 W/m. Therefore, the BLMs are required to continuouslymonitor the beam loss throughout this section. Considering the signal dynamic range, costs, andradiation hardness features, ionization chamber is a good candidate for the BLM. Additionally, air-filled ionization chambers don’t require a gas circulating system.
To check the basic operation of the BLM, two prototype monitors were made and tested at the K2Kbeam line. The measured charge was consistent with the expected values from the MARS simulation.
The design of a readout circuit system and integration to the interlock system should be workedout. The installation should be completed by the end of FY 2007 for the preparation section, and byfall 2008 for the final-focus section.
2.4.5 Optical Transition Radiation Detector
An optical transition radiation detector (OTR) will be used to measure beam position and profile justupstream of the target [26]. Thin Ti-alloy foil will be placed in front of the target. The OTR lightfrom the foil is lead to imaging detector made of MCP-CCD chain through series of mirrors. It isconfirmed with MC simulation that the basic concept works in principle. Currently conceptual designis being done. The OTR system is the one of contributions expected from Canada.
2.5 Vacuum System
Requirements on the vacuum level of the primary-proton beam-line are as follows:
• 1Pa everywhere to keep the beam loss due to the residual gas negligibly small,
• ∼ 10−6Pa at the boundary to the main ring.
• 10−2Pa at the boundary to the arc to keep heat flow into the arc less than a few W,
• 10−2Pa at the monitor locations to operate beam profile monitors.
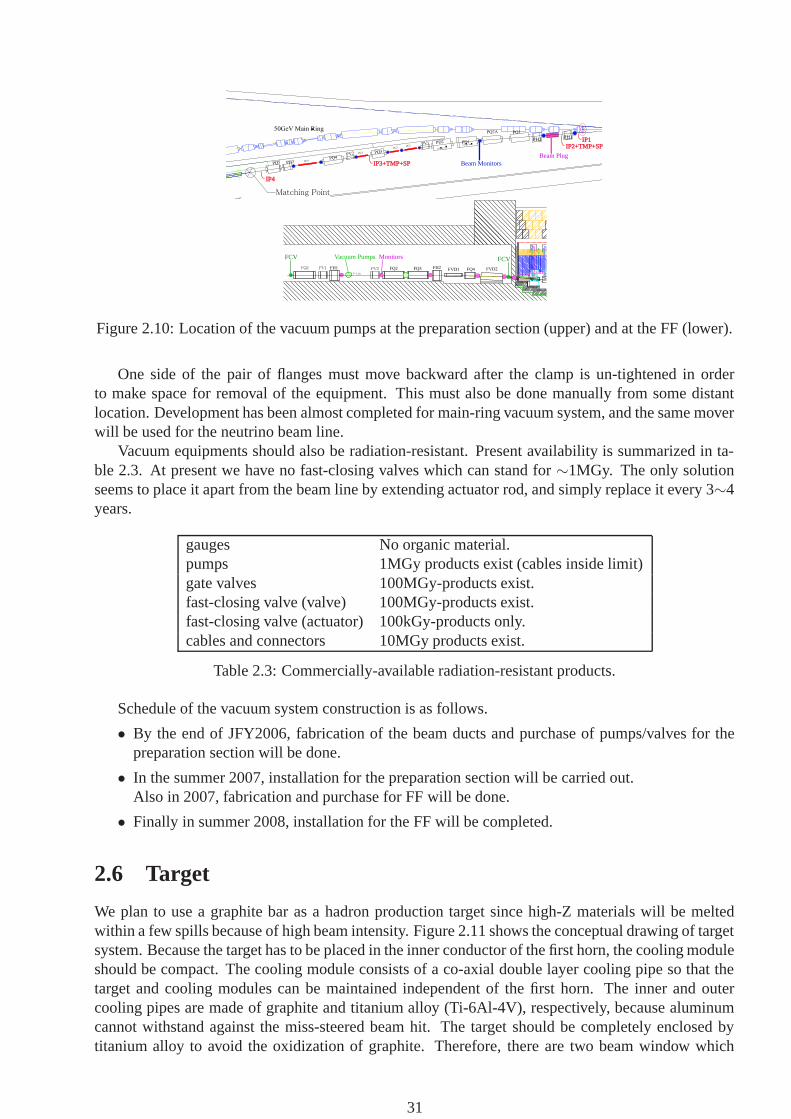
To fulfill the requirements, ion pumps are distributed for evacuation at the normal operation stage,while initial pumping will be done with detachable turbo-molecular pumps and their follow-up pumps.Locations of the vacuum pumps are shown in Fig. 2.10.
At the downstream-end of the final-focus section (FF), there is a thin titanium window to separatethe beam line vacuum from the target-station helium vessel. Fast-closing valves will be installed atthe end of the FF, as well as at the boundary to the main ring, to protect the beam window and mainring vacuum, respectively, in the case of vacuum break.
GEANT simulation was carried out to examine which material can stand for the direct hit of thebeam. Deform and stress caused by atmospheric pressure were also calculated by a finite-elementanalysis.
Stainless-steel was ruled out because it suffers too much thermal-shock stress. Titanium and somealuminum alloy are shown to survive the beam-hit. For the most-upstream part, therefore, 3mm-thicktitanium will be used to achieve the high vacuum and low residual radio-activity, while 5mm-thickaluminum alloy will be used otherwise.
Residual radiation level around the upstream magnets should be too high for hands-on operationof flanges. Therefore vacuum flanges with ”semi-remote” clamps will be adopted to enable manualdisconnection/connection from distant location.
30
IP1IP1IP2+TMP+SPIP2+TMP+SP
IP3+TMP+SPIP3+TMP+SP
IP4IP4
PH1PH2
Beam PlugBeam Monitors
MonitorsVacuum PumpsFCV FCV
Figure 2.10: Location of the vacuum pumps at the preparation section (upper) and at the FF (lower).
One side of the pair of flanges must move backward after the clamp is un-tightened in orderto make space for removal of the equipment. This must also be done manually from some distantlocation. Development has been almost completed for main-ring vacuum system, and the same moverwill be used for the neutrino beam line.
Vacuum equipments should also be radiation-resistant. Present availability is summarized in ta-ble 2.3. At present we have no fast-closing valves which can stand for ∼1MGy. The only solutionseems to place it apart from the beam line by extending actuator rod, and simply replace it every 3∼4years.
gauges No organic material.pumps 1MGy products exist (cables inside limit)gate valves 100MGy-products exist.fast-closing valve (valve) 100MGy-products exist.fast-closing valve (actuator) 100kGy-products only.cables and connectors 10MGy products exist.
Table 2.3: Commercially-available radiation-resistant products.
Schedule of the vacuum system construction is as follows.
• By the end of JFY2006, fabrication of the beam ducts and purchase of pumps/valves for thepreparation section will be done.
• In the summer 2007, installation for the preparation section will be carried out.Also in 2007, fabrication and purchase for FF will be done.
• Finally in summer 2008, installation for the FF will be completed.
2.6 Target
We plan to use a graphite bar as a hadron production target since high-Z materials will be meltedwithin a few spills because of high beam intensity. Figure 2.11 shows the conceptual drawing of targetsystem. Because the target has to be placed in the inner conductor of the first horn, the cooling moduleshould be compact. The cooling module consists of a co-axial double layer cooling pipe so that thetarget and cooling modules can be maintained independent of the first horn. The inner and outercooling pipes are made of graphite and titanium alloy (Ti-6Al-4V), respectively, because aluminumcannot withstand against the miss-steered beam hit. The target should be completely enclosed bytitanium alloy to avoid the oxidization of graphite. Therefore, there are two beam window which
31
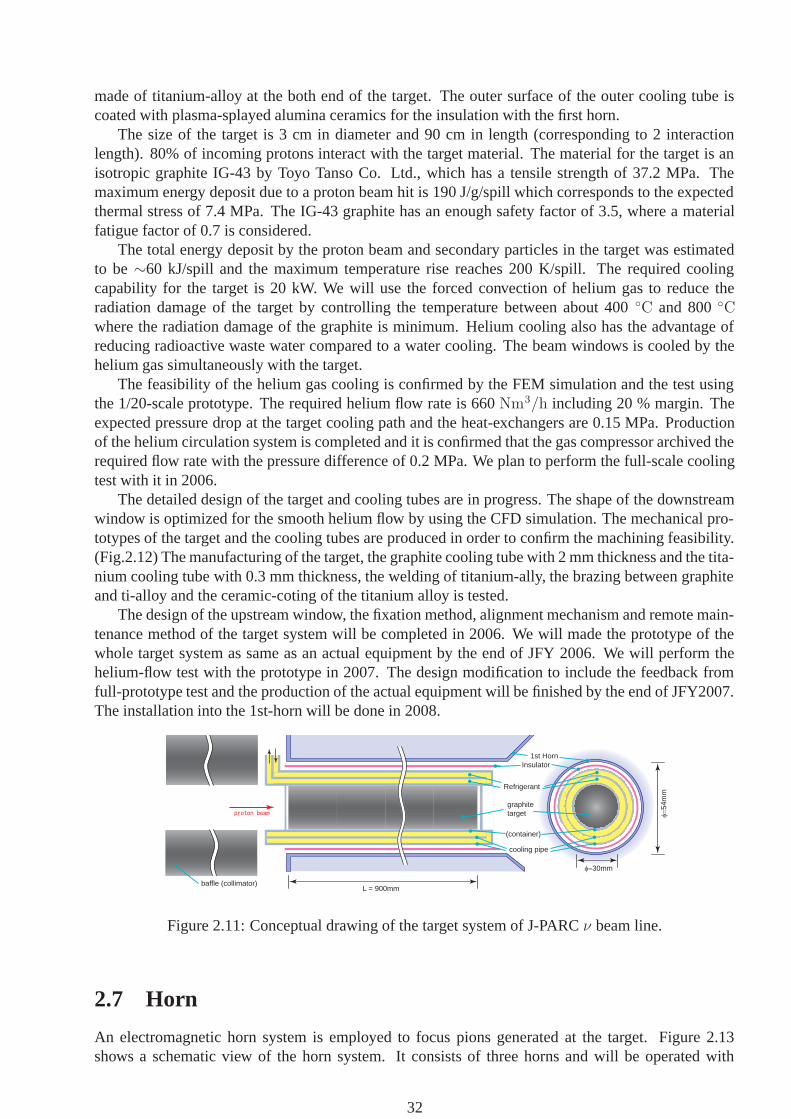
made of titanium-alloy at the both end of the target. The outer surface of the outer cooling tube iscoated with plasma-splayed alumina ceramics for the insulation with the first horn.
The size of the target is 3 cm in diameter and 90 cm in length (corresponding to 2 interactionlength). 80% of incoming protons interact with the target material. The material for the target is anisotropic graphite IG-43 by Toyo Tanso Co. Ltd., which has a tensile strength of 37.2 MPa. Themaximum energy deposit due to a proton beam hit is 190 J/g/spill which corresponds to the expectedthermal stress of 7.4 MPa. The IG-43 graphite has an enough safety factor of 3.5, where a materialfatigue factor of 0.7 is considered.
The total energy deposit by the proton beam and secondary particles in the target was estimatedto be ∼60 kJ/spill and the maximum temperature rise reaches 200 K/spill. The required coolingcapability for the target is 20 kW. We will use the forced convection of helium gas to reduce theradiation damage of the target by controlling the temperature between about 400 ◦C and 800 ◦Cwhere the radiation damage of the graphite is minimum. Helium cooling also has the advantage ofreducing radioactive waste water compared to a water cooling. The beam windows is cooled by thehelium gas simultaneously with the target.
The feasibility of the helium gas cooling is confirmed by the FEM simulation and the test usingthe 1/20-scale prototype. The required helium flow rate is 660 Nm3/h including 20 % margin. Theexpected pressure drop at the target cooling path and the heat-exchangers are 0.15 MPa. Productionof the helium circulation system is completed and it is confirmed that the gas compressor archived therequired flow rate with the pressure difference of 0.2 MPa. We plan to perform the full-scale coolingtest with it in 2006.
The detailed design of the target and cooling tubes are in progress. The shape of the downstreamwindow is optimized for the smooth helium flow by using the CFD simulation. The mechanical pro-totypes of the target and the cooling tubes are produced in order to confirm the machining feasibility.(Fig.2.12) The manufacturing of the target, the graphite cooling tube with 2 mm thickness and the tita-nium cooling tube with 0.3 mm thickness, the welding of titanium-ally, the brazing between graphiteand ti-alloy and the ceramic-coting of the titanium alloy is tested.
The design of the upstream window, the fixation method, alignment mechanism and remote main-tenance method of the target system will be completed in 2006. We will made the prototype of thewhole target system as same as an actual equipment by the end of JFY 2006. We will perform thehelium-flow test with the prototype in 2007. The design modification to include the feedback fromfull-prototype test and the production of the actual equipment will be finished by the end of JFY2007.The installation into the 1st-horn will be done in 2008.
graphite
target
Refrigerant
(container)
cooling pipe
1st Horn
Insulator
L = 900mm
φ=30mm
φ=54m
m
baffle (collimator)
Figure 2.11: Conceptual drawing of the target system of J-PARC ν beam line.
2.7 Horn
An electromagnetic horn system is employed to focus pions generated at the target. Figure 2.13shows a schematic view of the horn system. It consists of three horns and will be operated with
32
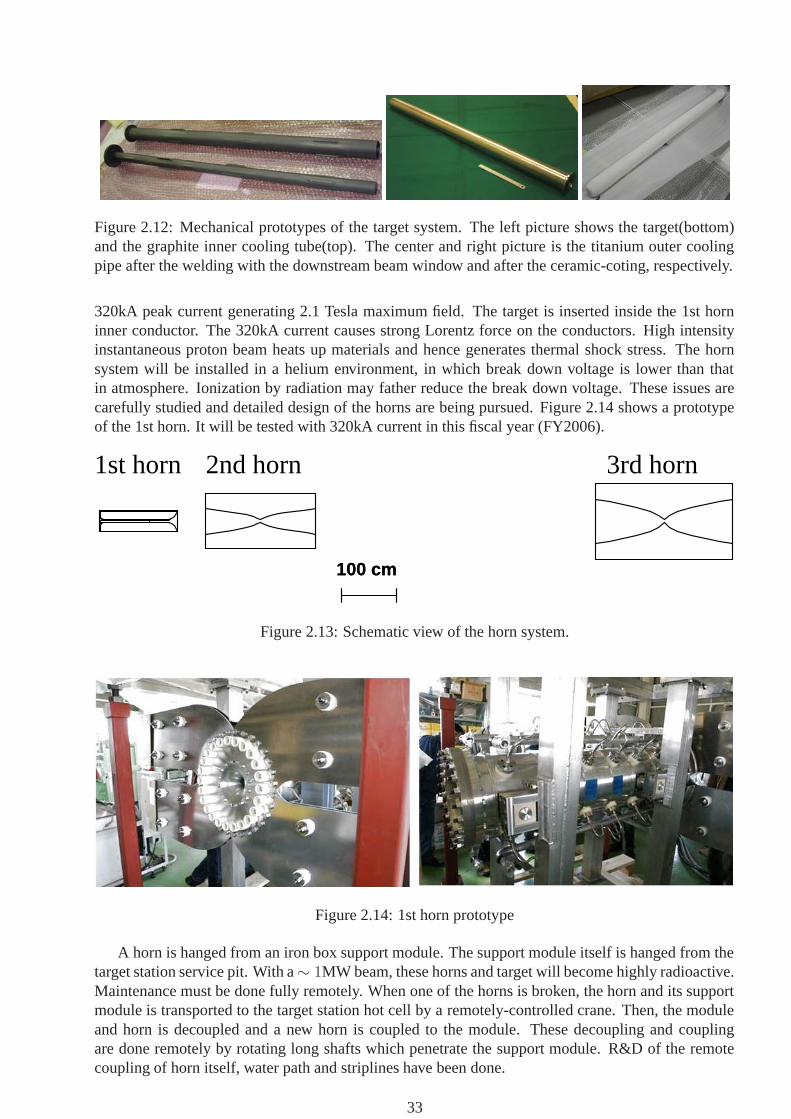
Figure 2.12: Mechanical prototypes of the target system. The left picture shows the target(bottom)and the graphite inner cooling tube(top). The center and right picture is the titanium outer coolingpipe after the welding with the downstream beam window and after the ceramic-coting, respectively.
320kA peak current generating 2.1 Tesla maximum field. The target is inserted inside the 1st horninner conductor. The 320kA current causes strong Lorentz force on the conductors. High intensityinstantaneous proton beam heats up materials and hence generates thermal shock stress. The hornsystem will be installed in a helium environment, in which break down voltage is lower than thatin atmosphere. Ionization by radiation may father reduce the break down voltage. These issues arecarefully studied and detailed design of the horns are being pursued. Figure 2.14 shows a prototypeof the 1st horn. It will be tested with 320kA current in this fiscal year (FY2006).
100 cm100 cm
1st horn 2nd horn 3rd horn
Figure 2.13: Schematic view of the horn system.
Figure 2.14: 1st horn prototype
A horn is hanged from an iron box support module. The support module itself is hanged from thetarget station service pit. With a ∼ 1MW beam, these horns and target will become highly radioactive.Maintenance must be done fully remotely. When one of the horns is broken, the horn and its supportmodule is transported to the target station hot cell by a remotely-controlled crane. Then, the moduleand horn is decoupled and a new horn is coupled to the module. These decoupling and couplingare done remotely by rotating long shafts which penetrate the support module. R&D of the remotecoupling of horn itself, water path and striplines have been done.
33

The R&D including production of prototypes will continue throughout FY2006. Life-time testswith 320kA current operation for the 1st horn and 3rd horn will continue from FY2006 to FY2007with those prototypes. The remote maintenance will be checked with the Target station He-chambermock-up and the prototype of the support module. All real components will be produced in FY2007and installed in FY2008. Tests of the remote maintenance and current operation with the final setupwill be done in FY2008 during/after the installation.
2.8 Target station
The target station is the building and facility where pion production target and pion beam focusinghorn magnet locate. Proton beam of 50GeV and 15μA is focused by the final focusing section of thebeam-line in front of the target station and hit the target at 12-m deep underground. Pions produced atthe target are focused by the three horn magnets along the beam-line and sent into the decay volumewhich follows the target station. It is essential for the safety to effectively shield the radiation andremove the heat created by the secondary particles such as pions produced by the proton hittingthe target. Thus, the keys in the design of the target station are radiation shielding, cooling, andmaintenance.
Target station consists of the following five elements; 1) Target, horn and their support struc-ture, 2) Radiation shielding, 3) Surface building, 4) Underground machine room, 5) Storage room ofradioactive materials. Figure 2.15 shows the cross section and side view of the target station.
27m
Iron shield
Iron structure/Helium vessel
Machineroom Service pit
Storage for radioactive material
14m
34m
Concrete blocks
40 ton crane
Target & 1st horn
Beam window
2nd horn3rd horn
Final focus
Decay volume
Concrete structure
Ground level
Baffle
22m
Assembly stage
for horns
Figure 2.15: The target station
In order to avoid activation of the air, target and the three horns are in an iron container filledwith helium gas. The weight of target and horns are supported by an iron support structure from thefloor. Surrounding the helium container are the iron shielding blocks which are further surroundedby concrete shielding. Since significant temperature rise is expected in the support iron structure,helium container and the iron shielding blocks, they are cooled at their surfaces. Connect/disconnect
34

of pluming and power lines is done by human in the empty space of the concrete shielding above thetarget and horn, which is called service pit. Next to the service pit, there is an underground machineroom where various cooling machines are placed. A storage for radioactive materials locates on theother side of the service pit where damaged radioactive horn and target will be temporarily stored.The vacuum of the primary beam final focusing section is separated by a beam window foil at theupstream end of the helium container. The upstream edge of decay volume is connected to the heliumcontainer. At the beginning of the decay volume is made of water-cooled iron shielding, called DVcollimator, which reduces the heat load in the concrete section of the decay volume.
The status of the target station is as follows:
• The detail design work for the building finished in Mar. 2005, and the contract of the construc-tion is under bidding.
• The detail design work for the cooling apparatus finished in Mar. 2005.
• The detail design work of the support structure and the most upstream part of the decay volumefinished in Mar. 2006, and the contract of the assembly is under bidding.
• The basic design work of the upper concrete shields finished in Mar. 2006.
• The inner iron and concrete shields are under designing.
• The DV collimator is under designing.
• The beam window and final monitor chamber are under designing by RAL and TRIUMF, re-spectively.
Figure 2.16 shows the future schedule of each component of the target station.
Building
underground
surface
cooling app.
Support structure
side and bottom wall
upper part
Most up-stream
part of DV
Outer iron shield
bottom and side
side blocks
DV collimator
copper
iron
Inner sield
iron Ins.
concrete Ins.
Horns Test
Upper concrete shields Ins.
FY2007 FY2008FY2006
Construction on cite
Bid Processing at factory
Bid
Bid
Const.
Const.
Const.
Bid
Install
Install
Bid Processing at factory
Design
Bid
Tubing
Tubing
Bid Processing at factory
Design
Bid Processing at factory
Install
Install
Design
Design
Installation
Construction on citeBid
Bid
Bid Install
Bid Processing at factory
Design
Design
Processing at factoryBid
Processing at factoryBid
Bid Processing at factory
Bid Processing at factory
Bid Processing at factory
Figure 2.16: The schedule of target station
35

Decay volume: ~94m
6m thick concrete
OA2º
OA3º
Beam
dump
Target
station
Completed in 2005: ~50m
3NBT
Figure 2.17: The decay volume
2.9 Decay volume
Construction of the upstream 50 meter of the decay volume started in July 2004 and finished in Dec.2005. Figure 2.17 shows the side view of the decay volume. The four iron plates, on which thecooling circuits called the plate-coil were attached by welding, were welded at the factory to form arectangular box, and 29 boxes were connected by welding to form the 50 m long tunnel in which pionsdecay into muons and neutrinos. Figure 2.18 shows the 50 m long iron tunnel before surrounded byconcrete wall. After constructing 6 m thick concrete wall surrounding the iron tunnel, the 40 coolingcircuits were formed by connecting the plate-coils by U-shape tubes. Figure 2.19 shows the insideof the decay volume. The most upstream part of the decay volume will be assembled by the 20 cmthick iron plates with plate-coils and connected to the helium vessel of the target station in FY2007.For the remaining downstream part of the decay volume, the iron plates have been fabricated with theplate-coils to form the 26 m long iron tunnel. This downstream part of the tunnel will be assembledwith the concrete wall in FY2007, and will be connected to the helium vessel of the beam dump inFY2008.
Figure 2.18: The 50 meter iron tunnelFigure 2.19: The inside of thedecay volume
36

2.10 Beam Dump - Hadron Absorber
The beam dump - hadron absorber, which can deal with a few Mega-Watt of heat, will be installedat the downstream of the decay volume. By the close cooperation with the engineering division ofCCLRC Rutherford Appleton Laboratory and with Japanese heavy industrial companies, we havefinalized basic design both for the hadron absorber core and for its surrounding helium vessel ironstructure in JFY 2005.
4,6
90
4,6
90
3,1503,150
Cooling ModuleCooling ModuleWater circuitWater circuit cast Al alloycast Al alloy
Copper Cast BlocksCopper Cast Blockswith water paths, ~90tonswith water paths, ~90tons
Graphite BlocksGraphite Blocks7blocks7blocks 7 layers ~50 tons7 layers ~50 tons
900900
Figure 2.20: The conceptual drawings of the T2K hadron absorber core and its graphite modulecomponent
Figure 2.20 shows conceptual drawing of the core. It has a rectangular cross section with about 5 mhigh and 3 m wide, to handle tunable off-axis beam. The upstream part is composed of large extrudedgraphite blocks, which has 230 W/m·K heat conductivity, and aluminum-alloy cooling modules withwater circuits casted in it. There are 14 units, i.e. left/right × 7 in height. One unit is composedof 7 graphite blocks with cross section of 670mm×450mm and about 1m long, fastened laterallyto a cooling module by screws and nut-pins. With help of the scheme we can achieve more than4 kW/m2·K of heat transfer between the surface of graphite blocks and the cooling module. Thedownstream part of the core is composed of 10 (left/right × 5 layers) large copper cast plates withwater paths brazed at one side of the plates.
Figure 2.21 shows typical results of the FEM simulations. In the simulation we assume thermallinks between one graphite to another, and also graphite blocks to cooling modules, based on themeasurement with a test module. The maximum temperature of the graphite should be lower than650 degree C, even in the helium environment, to avoid oxidization by the contamination of theatmosphere. Lower primary proton energy, and thus wider beam divergence, is preferred by thetolerance of the graphite core. With 30 GeV primary beam energy, it is turned out that current designcan handle beam operation power up to 3MW.
37

(a) (b)
2.6MPa2.6MPa
215215ooCC
Figure 2.21: The results of the FEM analysis of the core, (a) Von-Mises equivalent stress distributionin the graphite blocks and (b) temperature distribution in the copper plates, for 4MW operation with30GeV primary proton energy.
In JFY 2006, we will purchase large graphite blocks, and complete detailed designs both for corecomponents and the helium vessel structure. At the same time we will make the first unit of thegraphite core module to establish the way of assembly. Whole machining and production will start inJFY 2007, and installation will take place in the end of JFY 2008.
2.11 The muon monitor(MUMON)
Accurate control of the beam direction is essential to reduction of the systematic uncertainty in longbaseline experiments. In the case of T2K, 1 mrad change in the neutrino direction corresponds toabout 25 MeV shift in the peak neutrino energy, which contributes to the systematic uncertainty inthe measurement of Δm2
23. In order to achieve the aimed precision of the experiment (δ(Δm2) �10−4 eV2), the direction of the neutrino beam should be controlled and monitored with precisionmuch better than 1 mrad. This is the principle goal of the muon monitor.
The muon monitor measures the direction, profile and intensity of the beam on a spill by spillbasis. It will be located downstream of the beam dump and detect high energy (> 5 GeV) muonswhich penetrate the dump. Because the muons are produced from the same parent particles as theneutrinos, the muon properties are directly associated with those of the neutrinos. The spatial profileand intensity of the muons are sensitive to the condition of the magnetic horn system and the accuracyof the proton targeting. The muon monitor will also provide information necessary for tuning of thebeam in the commissioning of the experiment. It therefore needs to be sensitive to the beam condition,e.g. proton beam position at the target.
The expected muon flux at the position of muon monitor is ∼ 108 muons/cm2/spill at the beamcenter, which corresponds to O(1015) muons/cm2 for one year of operation. The detectors mustsurvive this high radiation. Because the muon monitor is the only instrument that can assure thequality of the neutrino beam on a spill by spill basis, a failure of the muon monitor would causedeadtime for the whole experiment. Therefore, the detectors should be robust and stable. Based onthe experience in K2K, we chose a combination of a segmented ionization chamber and an array ofthe semiconductor detectors as the baseline design of the T2K muon monitor.
The ionization chamber is a simple and reliable device to monitor the beam for a long run period.It is also suitable to cover the large area of the beam profile with the large number of devices. Some
38

weak points are the slow response and the non-strong signal over the unknown backgrounds from thebeam dump.
The semiconductor detector has a fast response, and is less sensitive to background because of thelarge and fast signal. A concern for the semiconductor detector is the long term stability due to theradiation damage. Currently we plan to use the silicon-pad detector for the neutrino beam commis-sioning (day 1), which can be used for one year. A diamond detector which is an another type of thesemiconductor detector with higher radiation tolerance, is also studied as a candidate detector for theT2K MUMON. The diamond detector is extensively studied and developed by RD42 collaboration atCERN [25]. A concern on the diamond detector is the capability of the mass production, which willlimit the number of available sensors at day 1. We will use ∼20 diamond sensors, among which wehave five in our hand now.
We design to construct two detector planes with different sampling intervals: one consisting ofthe ionization chambers and the other of the semiconductor detectors. Two independent and com-plementary detectors provide reliable monitor information that is mandatory for the experiment. TheMUMON signals will be recorded by the FADC modules commonly used for the T2K beam-linemonitor developed at KEK. The MUMON data will be also processed by the beam-line DAQ.
39

Chapter 3
Near Detector ND280
To achieve the physics goals set out in the introduction, it is essential to have precise measurements ofthe neutrino beam properties near the target, and measurements of neutrino interaction cross sectionsand kinematics.
For the νμ disappearance study, it is important to measure the flux of muon neutrinos and theirspectrum. In addition, cross sections need to be measured for muon neutrino interactions for whichthe far detector will misinterpret and assign the wrong neutrino energy. For the νe appearance study,the flux and spectrum of electron neutrinos must be known, as well as the cross sections for inter-actions that the far detector will misinterpret as coming from νe. To make these measurements tothe required precision necessitates a highly segmented large volume detector, capable of charged andneutral particle energy measurements and particle identification.
The reconstruction of the neutrino energy at the near detector is based on Charged-Current Quasi-Elastic (CCQE) interactions, where the neutrino energy Eν is reconstructed measuring the muon orelectron energy El and its angle θl to the neutrino beam direction as shown by a formula:
Eν =mNEl − m2
l /2
mN − El + plcosθl
, (3.1)
where mN and ml are the masses of the neutron and lepton(=e or μ). The inelastic reactions ofhigh energy neutrinos constitute the background to Eν measurement with the CCQE. In addition, theinelastic reactions produce π0’s that are the main background for νe appearance search. Then thedetection of γ’s and reconstruction of π0’s is also required.
This chapter describes the detectors proposed to make these measurements.
3.1 Overview of the ND280 Near Detector
The near detector complex (ND280) at 280 m from the target contains a fine-resolution magnetizeddetector designed to measure the neutrino beam’s energy spectrum, flux, flavor content, and interac-tion cross-sections before the neutrino beam has a chance to oscillate. This detector sits off-axis inthe neutrino beam along a line between the average pion decay point in the decay volume and theSuper-Kamiokande detector, at a distance of 280 m from the hadron production target.
The ND280 detector consists of the following elements, illustrated in Figure 3.1:
• Magnet: ND280 uses the UA1 magnet operated with a magnetic field of 0.2 T to measure themomenta of penetrating charged particles produced by neutrino interactions in the near detector.The inner dimensions of the magnet are 3.5 m × 3.6 m × 7.0 m.
• Pi-Zero Detector (P0D): The P0D detector sits at the upstream end of ND280, and is optimizedfor measuring the rate of neutral current π0 production. The P0D consists of tracking planescomposed of scintillating bars alternating with lead foil. Inactive layers of passive water in
40

Pi-zeroDetector
Tracker
TPCsFGDs
ECAL
� beam
Magnetyoke
Magnetcoils
Figure 3.1: Cutaway view of the T2K 280 m near detector. The neutrino beam enters from the left.
41

sections of the P0D provide a water target for measuring interactions on oxygen. The P0D isapproximately cubical, and is covered on all 6 sides by the electromagnetic calorimeter.
• Tracker: Downstream of the P0D is a tracking detector optimized for measuring the momenta ofcharged particles, particularly muons and pions produced by CC interactions, and for measuringthe νe background in the beam.
1. Time Projection Chambers (TPCs): Three time projection chambers will measure the 3-momenta of muons produced by charged current interactions in the detector, and willprovide the most accurate measurement of the neutrino energy spectrum. The 3D trackingand dE/dx measurements in the TPC will also determine the sign of charged particles andidentify muons, pions, and electrons.
2. Fine Grained Detectors (FGDs): Two FGD modules, placed after the first and secondTPCs, consist of layers of finely segmented scintillating tracker bars. The FGDs providethe target mass for neutrino interactions that will be measured by the TPCs, and also mea-sure the direction and ranges of recoil protons produced by CC interactions in the FGDs,giving clean identification of CC QE and CC non-QE interactions. One FGD module willconsist entirely of plastic scintillator, while the second will consist of plastic scintilla-tor and water to allow the separate determination of exclusive neutrino cross-sections oncarbon and on water.
• Electromagnetic calorimeter (ECAL): Surrounding the P0D and the tracker is an electromag-netic calorimeter. The ECAL is a segmented Pb-scintillator detector whose main purpose isto measure those γ-rays produced in ND280 that do not convert in the inner detectors and iscritical for the reconstruction of π0 decays.
• Side Muon Range Detector (SMRD): Air gaps in the sides of the UA1 magnet are instrumentedwith plastic scintillator to measure the ranges of muons that exit the sides of the ND280. TheSMRD also can provide a veto for events entering the detector from the outside and a triggeruseful for calibration.
In addition to these detectors which will be set at off-axis of neutrino beams, the on-axis neutrinomonitor (N-GRID) will be set to directly measure the direction of the neutrino beam.
3.2 Neutrino experimental hall
The neutrino experimental hall is called the ND280 hall (the neutrino detector hall at 280m fromthe target point). The location of the ND280 hall is shown in Figure 3.2. The ND280 hall is beingdesigned as follows, which is drawn in Figure 3.3.
The ND280 hall has a pit with a diameter of 17.5m and a depth of 37m, which incorporates boththe on-axis and off-axis detectors. The B1 floor, which is about 24m deep, is for the off-axis detector.The off-axis detector is nearly located on the line between the target point and the SK position. TheB2 floor, which is about 33m deep, is for the horizontal part of the on-axis detector. The B3 floor,which is 37m deep, is for the deepest part of the vertical on-axis detector. The exact location of theon-axis detector N-GRID will be fixed for the nominal off-axis angle 2.5deg and the horizontal unitsof N-GRID will be set on the B2 floor. This facility design can accommodate with the off-axis caseof 2.0 − 2.5 degrees with the condition that the on-axis detector covers the ±4m area.
The hut with a size of 21m × 28m covers the pit, and has a 10ton crane. The effective heightof the crane is 5m. There is an area in the hut for the unloading of detector components and for thedetector preparation. Some area in the hut at the ground floor is used for the electricity preparationand the cooling water preparation.
The construction of the ND280 hall and the installation of the detectors will be done in the fol-lowing steps starting in Spring 2007.
42

ND280 hall Muon pit Decay volumeTarget point
284m
Figure 3.2: Location of the muon pit and the ND280 hall.
Electricitypreparation room Entrance shutter
StairsElevator
Toilet
Cooling waterpreparation room
nu beam
10ton crane
Off-axisdetector
On-axisdetector
nu beam
Top View Side View
Figure 3.3: Current design of the ND280 hall.
43

beam center
ν
Veto Counter
8m
8m
Figure 3.4: The arrangement of N-GRID detectors at the near detector hall.
1. The excavation of the pit.
2. The construction of the underground floors.
3. The installation of the magnet yokes and coils using external cranes.
4. The construction of the hut including the 10ton crane.
5. The installation of the on-axis detector.
6. The installation of the off-axis detector.
3.3 The on-axis neutrino monitor (N-GRID)
The muon monitor observes only the small fraction of muons which have energy greater than 5 GeV.Therefore, it is also important to directly measure the direction of the neutrino beam. The on-axisneutrino monitor (N-GRID) will be installed in the near detector hall to measure the neutrino beamdirection and profile using neutrinos directly. It is required to measure the neutrino beam directionwith precision much better than 1 mrad as for MUMON.
The neutrino event rate around the beam center is estimated to be ∼ 0.3 events/ton/spill. In orderto monitor the stability of the neutrino event rate (direction) at the 1% (1 mrad) precision within asingle day (� 2.5 × 10⁴ spills), O(1) ton fiducial mass is necessary for the detector. In addition, thevariation of the efficiency of the detector across the beam profile should be calibrated at a precisionof 1% during the experiment.
The N-GRID detector is designed to consist of 7+7 identical units, arranged to form a grid whichsamples the beam on 8 × 8m2 (±4m × ±4m) area, as shown in Figure 3.4. The design of one unitwhich was made as a prototype is shown in Figure 3.5. For N-GRID, the target of neutrino interactionis iron, and the scintillators are used to detect a muon from the interaction.
3.4 Magnet
The UA1 magnet is presently stored at CERN, and the CERN Council has approved its donation tothe T2K experiment. The magnet will provide a horizontal uniform field of 0.2 T, perpendicular to theneutrino beam direction over an inner volume of 88 m3. A schematic drawing of the magnet, placedon its support structure, is shown in Figure 3.6 and the specification is summarized in Table 3.1.
44
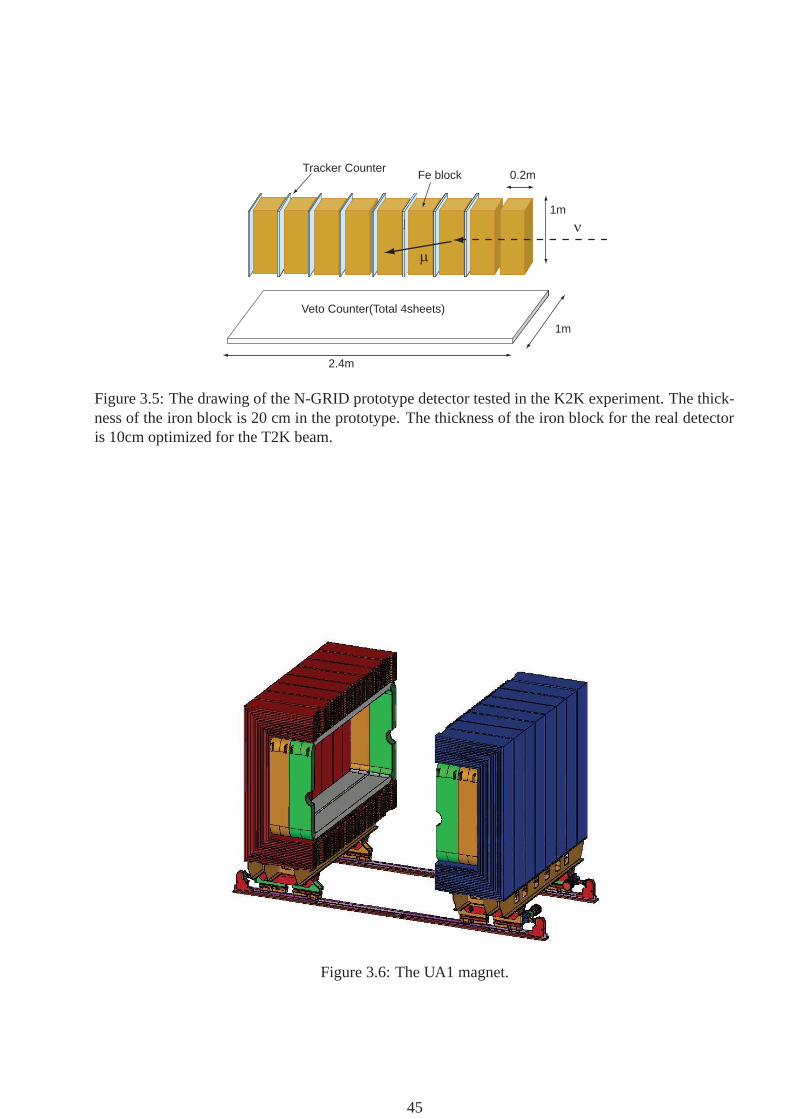
μ
Tracker Counter
Veto Counter(Total 4sheets)
0.2m
1m
2.4m
1m
Fe block
ν
μ
Figure 3.5: The drawing of the N-GRID prototype detector tested in the K2K experiment. The thick-ness of the iron block is 20 cm in the prototype. The thickness of the iron block for the real detectoris 10cm optimized for the T2K beam.
Figure 3.6: The UA1 magnet.
45
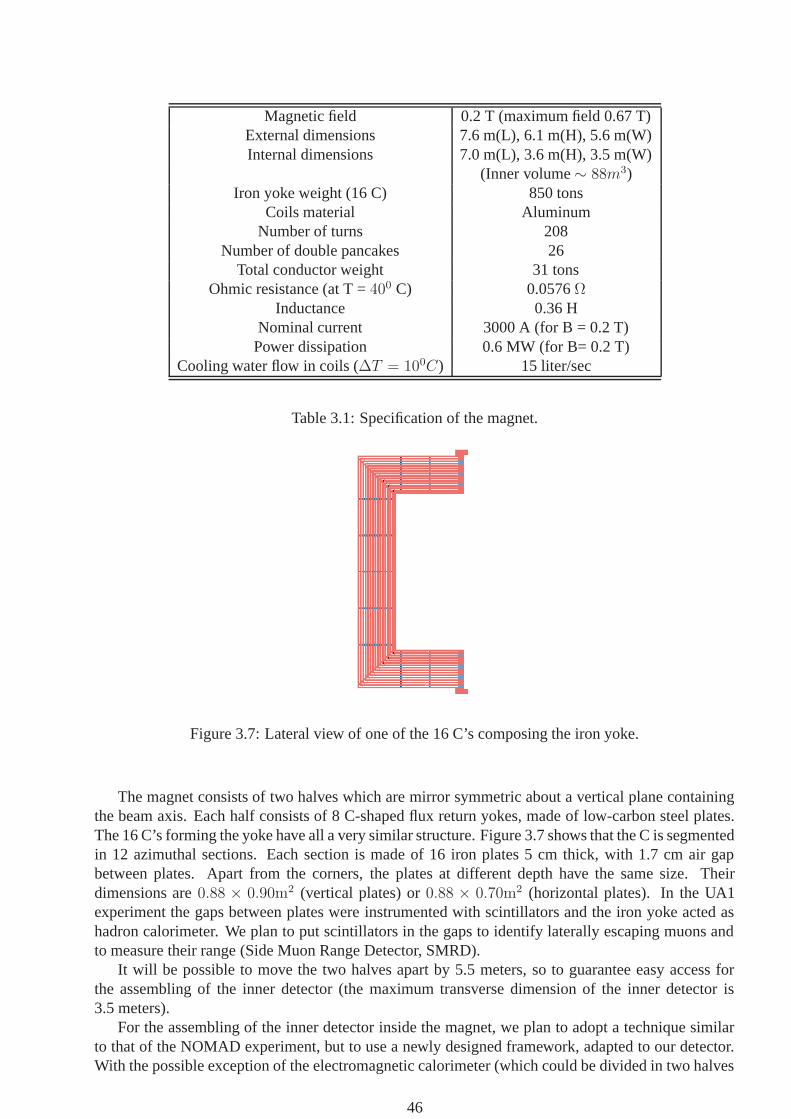
Magnetic field 0.2 T (maximum field 0.67 T)External dimensions 7.6 m(L), 6.1 m(H), 5.6 m(W)Internal dimensions 7.0 m(L), 3.6 m(H), 3.5 m(W)
(Inner volume ∼ 88m3)Iron yoke weight (16 C) 850 tons
Coils material AluminumNumber of turns 208
Number of double pancakes 26Total conductor weight 31 tons
Ohmic resistance (at T = 400 C) 0.0576 ΩInductance 0.36 H
Nominal current 3000 A (for B = 0.2 T)Power dissipation 0.6 MW (for B= 0.2 T)
Cooling water flow in coils (ΔT = 100C) 15 liter/sec
Table 3.1: Specification of the magnet.
Figure 3.7: Lateral view of one of the 16 C’s composing the iron yoke.
The magnet consists of two halves which are mirror symmetric about a vertical plane containingthe beam axis. Each half consists of 8 C-shaped flux return yokes, made of low-carbon steel plates.The 16 C’s forming the yoke have all a very similar structure. Figure 3.7 shows that the C is segmentedin 12 azimuthal sections. Each section is made of 16 iron plates 5 cm thick, with 1.7 cm air gapbetween plates. Apart from the corners, the plates at different depth have the same size. Theirdimensions are 0.88 × 0.90m2 (vertical plates) or 0.88 × 0.70m2 (horizontal plates). In the UA1experiment the gaps between plates were instrumented with scintillators and the iron yoke acted ashadron calorimeter. We plan to put scintillators in the gaps to identify laterally escaping muons andto measure their range (Side Muon Range Detector, SMRD).
It will be possible to move the two halves apart by 5.5 meters, so to guarantee easy access forthe assembling of the inner detector (the maximum transverse dimension of the inner detector is3.5 meters).
For the assembling of the inner detector inside the magnet, we plan to adopt a technique similarto that of the NOMAD experiment, but to use a newly designed framework, adapted to our detector.With the possible exception of the electromagnetic calorimeter (which could be divided in two halves
46

Figure 3.8: Preliminary drawing of the basket.
and fixed to the iron yokes), all other detectors will be assembled inside a metallic frame (”basket”)with approximate dimensions of 6.5 × 2.6 × 2.5m3. A preliminary design of the basket with itssupporting structure is shown in Figure 3.8. The basket will be completely open at the top, to allowthe insertion of the various detectors. Two short beams will be fixed at the center of the two faces ofthe basket perpendicular to the beam axis. The short beams will be connected outside the magnet to astructure fixed on the floor, which holds the basket. The beams will connect the basket to the externalsupport structure passing through the holes in the coils , originally designed to allow the passage ofthe beam pipe. When opening the magnet, the C’s and the coils move apart, while the basket and theinner detector remain in the position chosen for data taking. The design and construction of the basketand of the supporting structures, can be accomplished in less than one year. Therefore, we shall waitfor the final engineering design of the inner detectors before to finalize the design of these structures.
3.5 TPC
Three identical TPC modules in the shape of rectangular boxes as shown in Figure 3.9 are installedin the basket. The outer dimensions of each module are assumed to be approximately 2.5 m × 2.5 min the plane perpendicular to the neutrino beam direction, and 0.9 m along the beam direction. Thetransverse dimension is chosen to provide space between the inner wall of the magnet and the TPCmodules for electromagnetic calorimeter and for a mechanical support cage. The dimension alongthe beam direction is chosen to achieve the required momentum resolution, including the necessaryinactive elements.
Diffusion of the drifting electrons can be a limiting factor in the intrinsic space point resolutionof a TPC. A simple upper bound on the diffusion can be calculated using the standard Glucksternparameterization, assuming a large number of measurements along the length of the track,
D <σpt
pt
√nT L
720(L[m])2 0.3B[T ]
pt[GeV/c]
1√Ldrift
= 260 μm/√
cm, (3.2)
by demanding that the diffusion component of the momentum resolution is less than 5% at p t =
47
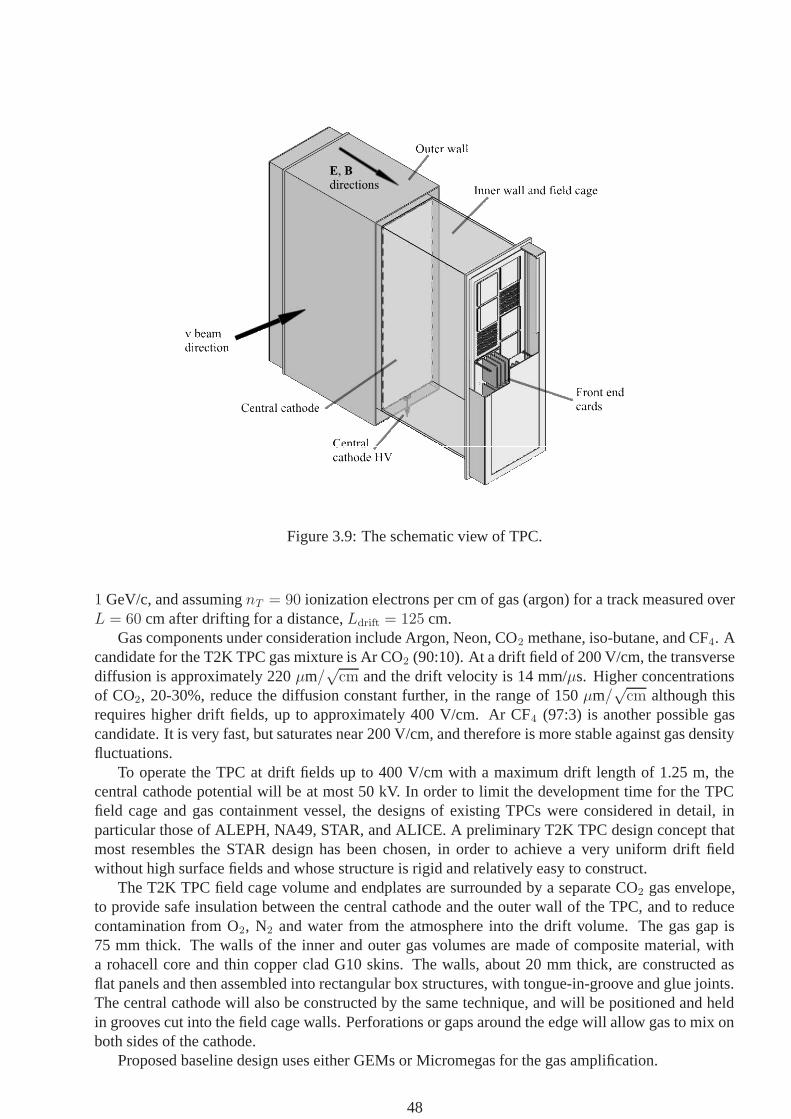
Figure 3.9: The schematic view of TPC.
1 GeV/c, and assuming nT = 90 ionization electrons per cm of gas (argon) for a track measured overL = 60 cm after drifting for a distance, Ldrift = 125 cm.
Gas components under consideration include Argon, Neon, CO2 methane, iso-butane, and CF4. Acandidate for the T2K TPC gas mixture is Ar CO2 (90:10). At a drift field of 200 V/cm, the transversediffusion is approximately 220 μm/
√cm and the drift velocity is 14 mm/μs. Higher concentrations
of CO2, 20-30%, reduce the diffusion constant further, in the range of 150 μm/√
cm although thisrequires higher drift fields, up to approximately 400 V/cm. Ar CF4 (97:3) is another possible gascandidate. It is very fast, but saturates near 200 V/cm, and therefore is more stable against gas densityfluctuations.
To operate the TPC at drift fields up to 400 V/cm with a maximum drift length of 1.25 m, thecentral cathode potential will be at most 50 kV. In order to limit the development time for the TPCfield cage and gas containment vessel, the designs of existing TPCs were considered in detail, inparticular those of ALEPH, NA49, STAR, and ALICE. A preliminary T2K TPC design concept thatmost resembles the STAR design has been chosen, in order to achieve a very uniform drift fieldwithout high surface fields and whose structure is rigid and relatively easy to construct.
The T2K TPC field cage volume and endplates are surrounded by a separate CO2 gas envelope,to provide safe insulation between the central cathode and the outer wall of the TPC, and to reducecontamination from O2, N2 and water from the atmosphere into the drift volume. The gas gap is75 mm thick. The walls of the inner and outer gas volumes are made of composite material, witha rohacell core and thin copper clad G10 skins. The walls, about 20 mm thick, are constructed asflat panels and then assembled into rectangular box structures, with tongue-in-groove and glue joints.The central cathode will also be constructed by the same technique, and will be positioned and heldin grooves cut into the field cage walls. Perforations or gaps around the edge will allow gas to mix onboth sides of the cathode.
Proposed baseline design uses either GEMs or Micromegas for the gas amplification.
48

Figure 3.10: The prototype TPC.
GEM foils measuring 30 cm × 30 cm that follow the design used in the Compass experiment [29]can be used to build readout amplification modules that are joined together into sectors and insertedinto the field cage endplate. Three GEM foils are used in each readout module, in order to safelyachieve good gas gain of a few thousand. Potential suppliers of large GEM foils include the CERNPCB shop and two private companies, 3M and TechEtch. The GEM foils are placed on thin fiberglassframes, with narrow spacer strips to maintain the gap between neighboring GEM foils.
Similarly, large Micromegas foils could be used to build the readout modules. Today, the largestmicrochannel devices in operation are the 40 × 40 cm2 Micromegas modules of Compass [30]. Largesurface Micromegas detectors can be realized with a woven mesh (produced for instance by Gantois)of 38 μm thickness. A promising technique to build these modules is ”Micromegas in the bulk” [31],where the mesh is sandwiched between two resistive ”Vacrel” layers. This leads to mechanicallyrobust detectors and there is no need of an external frame to hold the mesh. Possible furnishers ofthese detectors are the CERN PCB shop and the SEDI (Dapnia, Saclay) laboratory.
Prototype TPC was built as shown in Figure 3.10 with which various tests are being performed.We tested two technologies and proved that both worked well. So the T2K collaboration will makethe decision to select one technology by July 2006.
3.6 FGD
The ND280 detector will contain two fine-grained detectors (FGDs), each with dimensions of 200 cm× 200 cm × 30 cm (scintillator volume only, not including supports or electronics). One FGD willconsist of x-y layers of plastic scintillator bars read out with wavelength-shifting fibers, similar to theSciBar detector [32]. The second detector will be a water-rich detector, will consist of x-y layers ofplastic scintillator alternating with 3 cm thick layers of water.
49
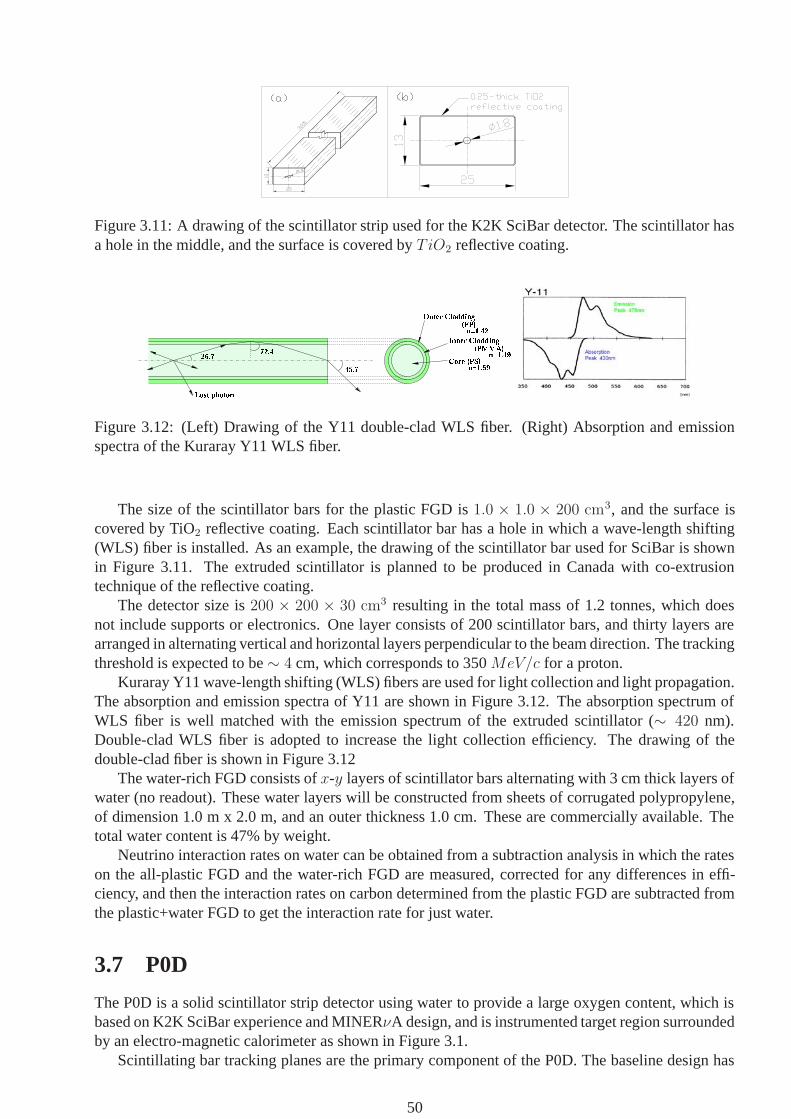
Figure 3.11: A drawing of the scintillator strip used for the K2K SciBar detector. The scintillator hasa hole in the middle, and the surface is covered by T iO2 reflective coating.
Figure 3.12: (Left) Drawing of the Y11 double-clad WLS fiber. (Right) Absorption and emissionspectra of the Kuraray Y11 WLS fiber.
The size of the scintillator bars for the plastic FGD is 1.0 × 1.0 × 200 cm3, and the surface iscovered by TiO2 reflective coating. Each scintillator bar has a hole in which a wave-length shifting(WLS) fiber is installed. As an example, the drawing of the scintillator bar used for SciBar is shownin Figure 3.11. The extruded scintillator is planned to be produced in Canada with co-extrusiontechnique of the reflective coating.
The detector size is 200 × 200 × 30 cm3 resulting in the total mass of 1.2 tonnes, which doesnot include supports or electronics. One layer consists of 200 scintillator bars, and thirty layers arearranged in alternating vertical and horizontal layers perpendicular to the beam direction. The trackingthreshold is expected to be ∼ 4 cm, which corresponds to 350 MeV/c for a proton.
Kuraray Y11 wave-length shifting (WLS) fibers are used for light collection and light propagation.The absorption and emission spectra of Y11 are shown in Figure 3.12. The absorption spectrum ofWLS fiber is well matched with the emission spectrum of the extruded scintillator (∼ 420 nm).Double-clad WLS fiber is adopted to increase the light collection efficiency. The drawing of thedouble-clad fiber is shown in Figure 3.12
The water-rich FGD consists of x-y layers of scintillator bars alternating with 3 cm thick layers ofwater (no readout). These water layers will be constructed from sheets of corrugated polypropylene,of dimension 1.0 m x 2.0 m, and an outer thickness 1.0 cm. These are commercially available. Thetotal water content is 47% by weight.
Neutrino interaction rates on water can be obtained from a subtraction analysis in which the rateson the all-plastic FGD and the water-rich FGD are measured, corrected for any differences in effi-ciency, and then the interaction rates on carbon determined from the plastic FGD are subtracted fromthe plastic+water FGD to get the interaction rate for just water.
3.7 P0D
The P0D is a solid scintillator strip detector using water to provide a large oxygen content, which isbased on K2K SciBar experience and MINERνA design, and is instrumented target region surroundedby an electro-magnetic calorimeter as shown in Figure 3.1.
Scintillating bar tracking planes are the primary component of the P0D. The baseline design has
50
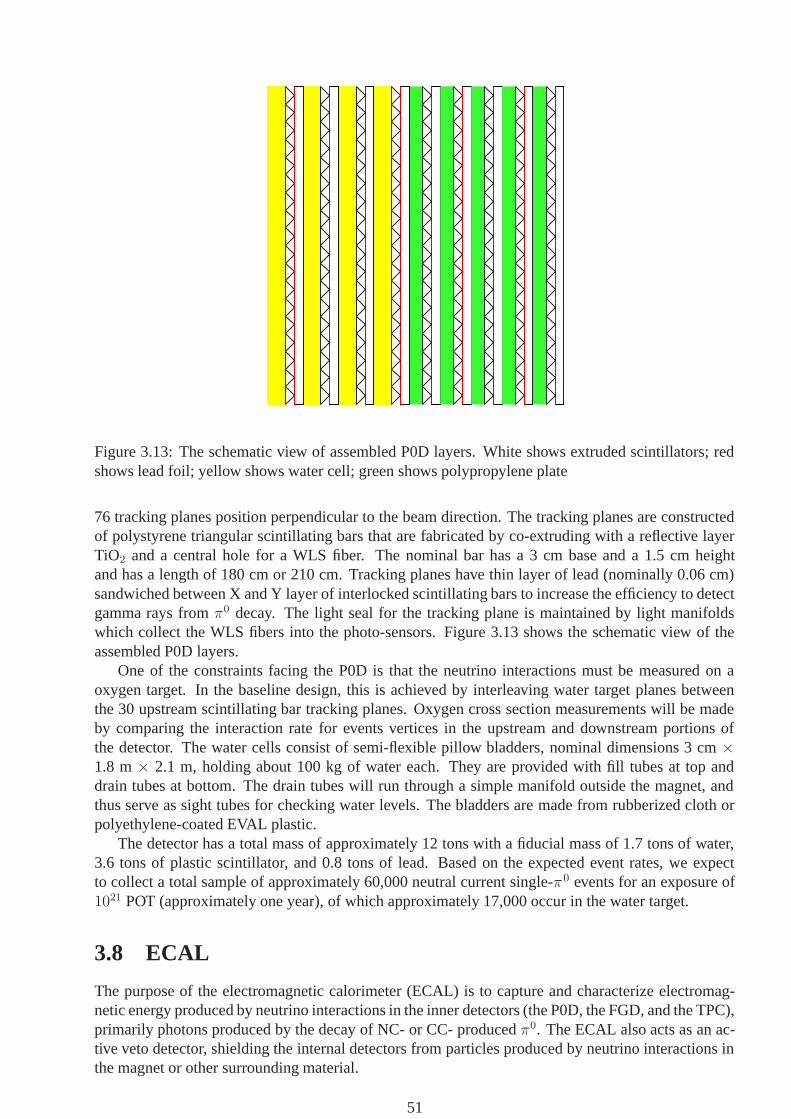
Figure 3.13: The schematic view of assembled P0D layers. White shows extruded scintillators; redshows lead foil; yellow shows water cell; green shows polypropylene plate
76 tracking planes position perpendicular to the beam direction. The tracking planes are constructedof polystyrene triangular scintillating bars that are fabricated by co-extruding with a reflective layerTiO2 and a central hole for a WLS fiber. The nominal bar has a 3 cm base and a 1.5 cm heightand has a length of 180 cm or 210 cm. Tracking planes have thin layer of lead (nominally 0.06 cm)sandwiched between X and Y layer of interlocked scintillating bars to increase the efficiency to detectgamma rays from π0 decay. The light seal for the tracking plane is maintained by light manifoldswhich collect the WLS fibers into the photo-sensors. Figure 3.13 shows the schematic view of theassembled P0D layers.
One of the constraints facing the P0D is that the neutrino interactions must be measured on aoxygen target. In the baseline design, this is achieved by interleaving water target planes betweenthe 30 upstream scintillating bar tracking planes. Oxygen cross section measurements will be madeby comparing the interaction rate for events vertices in the upstream and downstream portions ofthe detector. The water cells consist of semi-flexible pillow bladders, nominal dimensions 3 cm ×1.8 m × 2.1 m, holding about 100 kg of water each. They are provided with fill tubes at top anddrain tubes at bottom. The drain tubes will run through a simple manifold outside the magnet, andthus serve as sight tubes for checking water levels. The bladders are made from rubberized cloth orpolyethylene-coated EVAL plastic.
The detector has a total mass of approximately 12 tons with a fiducial mass of 1.7 tons of water,3.6 tons of plastic scintillator, and 0.8 tons of lead. Based on the expected event rates, we expectto collect a total sample of approximately 60,000 neutral current single-π0 events for an exposure of1021 POT (approximately one year), of which approximately 17,000 occur in the water target.
3.8 ECAL
The purpose of the electromagnetic calorimeter (ECAL) is to capture and characterize electromag-netic energy produced by neutrino interactions in the inner detectors (the P0D, the FGD, and the TPC),primarily photons produced by the decay of NC- or CC- produced π0. The ECAL also acts as an ac-tive veto detector, shielding the internal detectors from particles produced by neutrino interactions inthe magnet or other surrounding material.
51
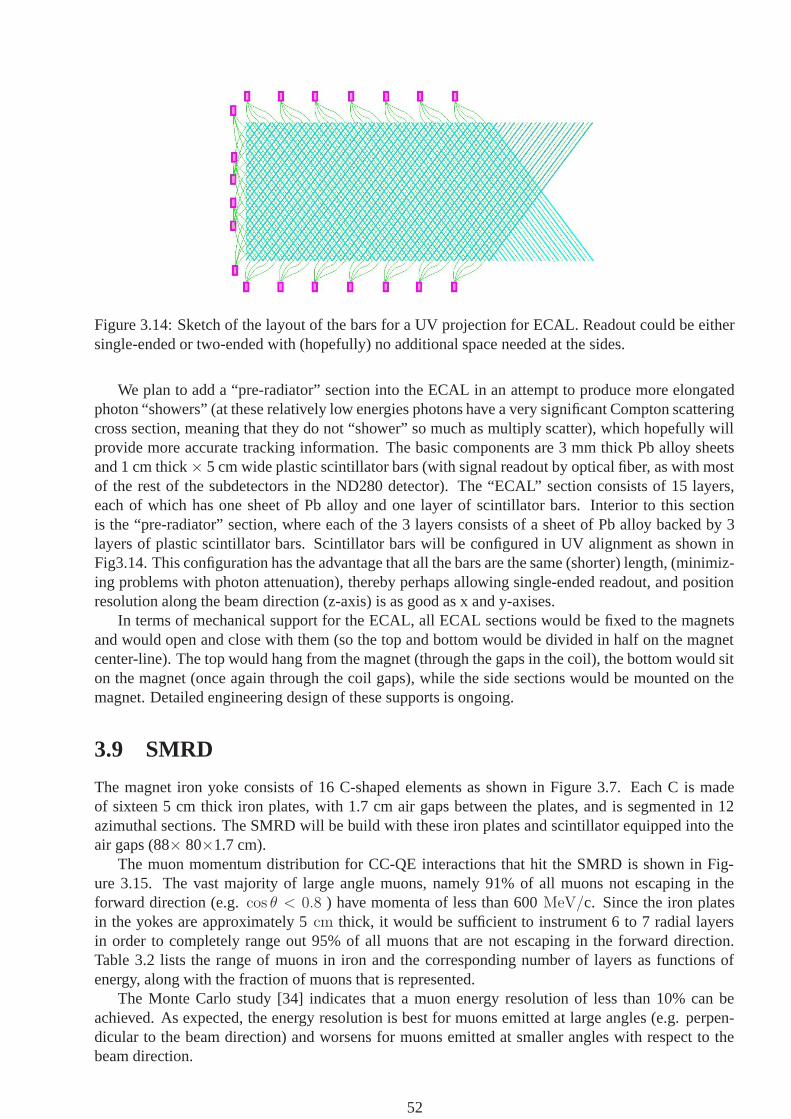
Figure 3.14: Sketch of the layout of the bars for a UV projection for ECAL. Readout could be eithersingle-ended or two-ended with (hopefully) no additional space needed at the sides.
We plan to add a “pre-radiator” section into the ECAL in an attempt to produce more elongatedphoton “showers” (at these relatively low energies photons have a very significant Compton scatteringcross section, meaning that they do not “shower” so much as multiply scatter), which hopefully willprovide more accurate tracking information. The basic components are 3 mm thick Pb alloy sheetsand 1 cm thick × 5 cm wide plastic scintillator bars (with signal readout by optical fiber, as with mostof the rest of the subdetectors in the ND280 detector). The “ECAL” section consists of 15 layers,each of which has one sheet of Pb alloy and one layer of scintillator bars. Interior to this sectionis the “pre-radiator” section, where each of the 3 layers consists of a sheet of Pb alloy backed by 3layers of plastic scintillator bars. Scintillator bars will be configured in UV alignment as shown inFig3.14. This configuration has the advantage that all the bars are the same (shorter) length, (minimiz-ing problems with photon attenuation), thereby perhaps allowing single-ended readout, and positionresolution along the beam direction (z-axis) is as good as x and y-axises.
In terms of mechanical support for the ECAL, all ECAL sections would be fixed to the magnetsand would open and close with them (so the top and bottom would be divided in half on the magnetcenter-line). The top would hang from the magnet (through the gaps in the coil), the bottom would siton the magnet (once again through the coil gaps), while the side sections would be mounted on themagnet. Detailed engineering design of these supports is ongoing.
3.9 SMRD
The magnet iron yoke consists of 16 C-shaped elements as shown in Figure 3.7. Each C is madeof sixteen 5 cm thick iron plates, with 1.7 cm air gaps between the plates, and is segmented in 12azimuthal sections. The SMRD will be build with these iron plates and scintillator equipped into theair gaps (88× 80×1.7 cm).
The muon momentum distribution for CC-QE interactions that hit the SMRD is shown in Fig-ure 3.15. The vast majority of large angle muons, namely 91% of all muons not escaping in theforward direction (e.g. cos θ < 0.8 ) have momenta of less than 600 MeV/c. Since the iron platesin the yokes are approximately 5 cm thick, it would be sufficient to instrument 6 to 7 radial layersin order to completely range out 95% of all muons that are not escaping in the forward direction.Table 3.2 lists the range of muons in iron and the corresponding number of layers as functions ofenergy, along with the fraction of muons that is represented.
The Monte Carlo study [34] indicates that a muon energy resolution of less than 10% can beachieved. As expected, the energy resolution is best for muons emitted at large angles (e.g. perpen-dicular to the beam direction) and worsens for muons emitted at smaller angles with respect to thebeam direction.
52

(GeV)μP0 0.2 0.4 0.6 0.8 1 1.2 1.4 1.6 1.8 2E
ven
ts (
arb
itra
ry n
orm
aliz
atio
n)
0
100
200
300
400
500
600
700
800
)θcos(0 0.1 0.2 0.3 0.4 0.5 0.6 0.7 0.8 0.9 1
(G
eV)
μP
0
0.2
0.4
0.6
0.8
1
1.2
1.4
1.6
1.8
2
Figure 3.15: Left plot: muon momentum for CC-QE muons reaching the SMRD with cos θ < 0.8.Right plot: muon momentum for CC-QE muons reaching the SMRD versus | cos θ|.
P maxμ (GeV) f(%) Range (cm) Layer
0.5 79 24 50.6 91 31 60.7 96 37 70.8 98 44 90.9 99 51 101.0 99 57 121.1 100 65 13
Table 3.2: Maximum detected muon momentum and corresponding fraction f of muons originatingfrom CC-QE reactions with | cos θ| < 0.8. The penetration depth in iron and the correspondingnumber of layers in the SMRD are specified in the two right-hand columns.
53

Figure 3.16: The left and right panel show a 87 cm long, 17 cm wide, and 1 cm thick scintillator withgrooves to embed WLS fibers. The spacing between the grooves is 2.5 cm. The scintillator shown inthe right panel is coated with a chemical reflector.
In order for the ND280 detector to reliably identify CC-QE interactions and identify backgroundevents originating from the cavity and the iron yokes themselves, the SMRD is required to identifyminimum ionizing particles (MIP) with very good efficiency. Hence the active detector medium hasto provide uniform and high light yield. It is also desirable to have good inter-layer timing resolutionto distinguish inward- from outward-going particles.
The active component of the SMRD will consist of slabs of 1 cm thick plastic scintillator whichwill be sandwiched between the iron plates of the magnet yokes. Equidistant wavelength shiftingfibers will be embedded into the scintillators in order to achieve good light yield and consequentlyhigh detection efficiencies of traversing minimum ionizing particles (MIP). A prototype scintillator-WLS configuration shows the MIP detection efficiency is more than about 99.5%.
The WLS fiber will also serve to guide the light into the photo-detectors. The fibers can beread out on both sides. The scintillators will be coated with a chemical reflector to enhance thelight yield. Figure 3.16 shows a 87×17×1 cm slab of extruded scintillator with grooves for futureinsertion of WLS fibers. The left and right panel show the plastic before and after the application of achemical reflector coating. The grooves are spaced at 2.5 cm. The WLS fibers will be bend inside thescintillator with a radius of 3 cm to allow the fibers to exit parallel to the gap in between iron yokes.This setup aims to minimize the mechanical exposure of the sensitive fibers inside the inter-yoke gapsand naturally prevents the fibers from being buckled.
The mechanical implementation of the SMRD will allow access to each scintillator slab after thestart of the experiment, so that repairs and adjustments can be accomplished. It is planned to placethe scintillator slabs into thin aluminum drawers. Each of the drawers will fit into a gap in the ironyokes and individual drawers will be connected to each other with flexible but sturdy spacers. Thiswill allow installation and access for repair to all scintillator slabs despite the limited detector accessspace and space constraints imposed by the iron yokes. Figure 3.17 shows a sketch of such a drawerconfiguration. The drawers provide mechanical stability and will also serve to protect the light tightwrapping from tear during installation and potential maintenance retrieval.
54
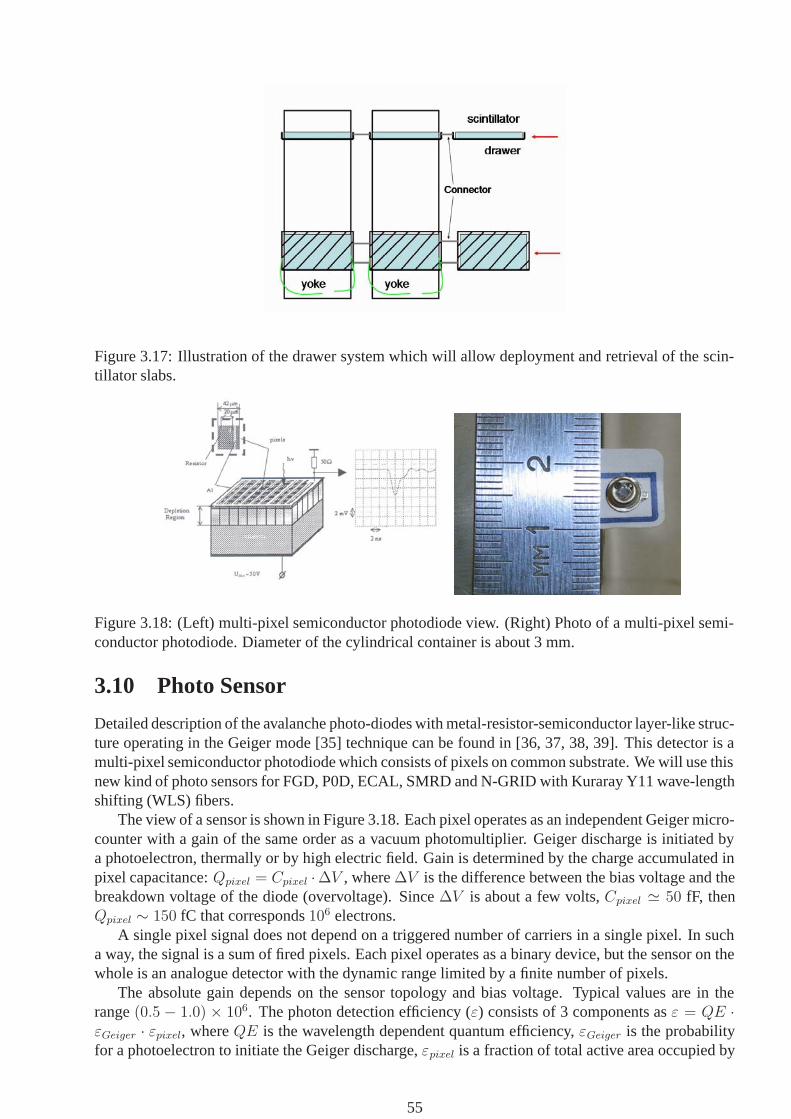
Figure 3.17: Illustration of the drawer system which will allow deployment and retrieval of the scin-tillator slabs.
Figure 3.18: (Left) multi-pixel semiconductor photodiode view. (Right) Photo of a multi-pixel semi-conductor photodiode. Diameter of the cylindrical container is about 3 mm.
3.10 Photo Sensor
Detailed description of the avalanche photo-diodes with metal-resistor-semiconductor layer-like struc-ture operating in the Geiger mode [35] technique can be found in [36, 37, 38, 39]. This detector is amulti-pixel semiconductor photodiode which consists of pixels on common substrate. We will use thisnew kind of photo sensors for FGD, P0D, ECAL, SMRD and N-GRID with Kuraray Y11 wave-lengthshifting (WLS) fibers.
The view of a sensor is shown in Figure 3.18. Each pixel operates as an independent Geiger micro-counter with a gain of the same order as a vacuum photomultiplier. Geiger discharge is initiated bya photoelectron, thermally or by high electric field. Gain is determined by the charge accumulated inpixel capacitance: Qpixel = Cpixel ·ΔV , where ΔV is the difference between the bias voltage and thebreakdown voltage of the diode (overvoltage). Since ΔV is about a few volts, Cpixel � 50 fF, thenQpixel ∼ 150 fC that corresponds 106 electrons.
A single pixel signal does not depend on a triggered number of carriers in a single pixel. In sucha way, the signal is a sum of fired pixels. Each pixel operates as a binary device, but the sensor on thewhole is an analogue detector with the dynamic range limited by a finite number of pixels.
The absolute gain depends on the sensor topology and bias voltage. Typical values are in therange (0.5 − 1.0) × 106. The photon detection efficiency (ε) consists of 3 components as ε = QE ·εGeiger · εpixel, where QE is the wavelength dependent quantum efficiency, εGeiger is the probabilityfor a photoelectron to initiate the Geiger discharge, εpixel is a fraction of total active area occupied by
55

sensitive pixels. Measured QE is shown in Fig. 3.19 as well as the emission spectrum of the WLSfiber Y11(150). Peak emission of the fiber depends on its length due to light absorption while the
��������
����
����
QE
400 450 500 550 600
RE
LAT
IVE
IN
TE
NS
ITY
, a.
u.
WAVELENGTH, nm
WLS fiber Y11(150) spectral emission
50
30
40Y11 length 5 cm
Y11 length 150 cm
0.5
1.0
0.75
0.25
60
QU
AN
TU
M E
FF
ICIE
NC
Y, %
Figure 3.19: Light emission spectrum of Y11(150) fiber and the quantum efficiency of the sensor.
sensitivity is almost flat for green light. εGeiger depends on applied bias voltage and comparable withQE, εpixel is determined by topology, its typical value is about 40-60%.
Single photoelectron resolution was checked with a blue LED. The light from this LED wasdirected to a sensor through the short Y11 fiber. Fig. 3.20 shows the spectrum of the LED flash.Resolution here is determined by electronic noise of fast amplifier and pick-up noise produced bycabling, ground loops, etc. Intrinsic gain stability of sensor allows us to see the ADC signal withseparated peaks which correspond 1, 2, 3... pixels.
We will develop the photo-sensor with a Russian company (CPTA) and a Japanese company(HPK). These new devices are successfully tested at KEK-PS (T853) and we are convinced that thenew devices satisfy our requirement. We plan to have the first production proto-type in our hand bythe end of 2006.
56
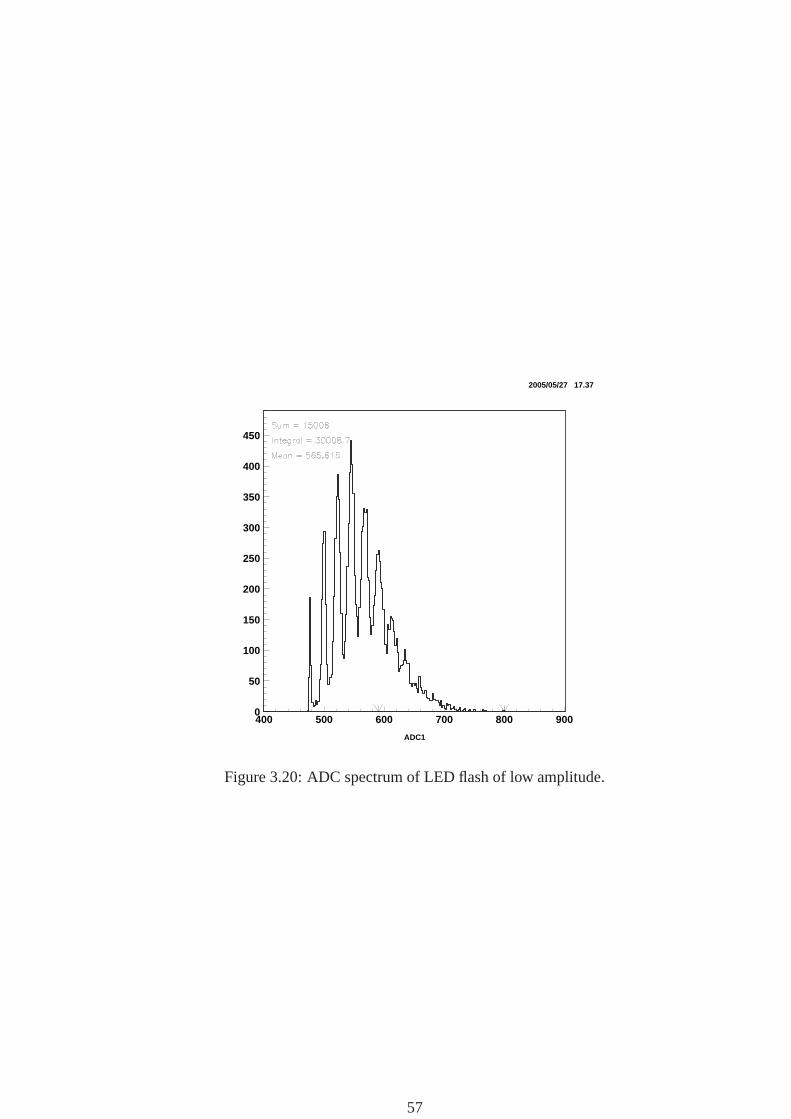
ADC1
0
50
100
150
200
250
300
350
400
450
400 500 600 700 800 900
2005/05/27 17.37
Figure 3.20: ADC spectrum of LED flash of low amplitude.
57

Chapter 4
Commissioning
4.1 Neutrino beam commissioning
Although the detailed commissioning plan is yet to be worked out from now, some critical items incommissioning can be listed based on previous experience in the K2K experiment and other experi-ments.
The goals of the commissioning include
• Ensure all the components are working as designed
• Tune primary proton beam
• Optimize targeting (position, direction, focusing)
• Understand behavior and tune secondary beam (direction)
At least the following modes of accelerator operation will be necessary from the commissioningphase to the normal operation mode.
1. Single shot, single or two bunch with 1% proton/bunch intensity (∼ 0.1% intensity/spill).
2. Single shot, single or two bunch with 1% proton/bunch intensity (∼ 0.1% intensity/spill). Thefilled bunch is changed from 1st to 9th bunch.
3. Single shot, 9 bunches with 1% proton/bunch intensity (∼ 1% intensity/spill).
4. Periodic (nominal repetition), single or two bunch with 1% proton/bunch intensity (∼ 0.1%intensity/spill).
5. Normal mode: Periodic (nominal repetition), 9 bunch with intensity from 1% to 100%.
In April 2009, the first beam will be on target. The first operation will be in the Mode 1 above andmove to the next mode step-by-step after confirming everything is OK.
All the proton monitors, CT (intensity), ESM (beam position), SSEM (profile) will be used forbeam diagnosis and tuning in the low intensity (� 1%) run. At higher intensity, SSEM can not beexposed to the beam all the time due to beam loss and foil aging, but can be for limited number ofspills. It can be confirmed that the beam profile is changed or not when beam intensity is increasedusing SSEM data. Muon monitor and on-axis neutrino detector must be working from the beginning.Those detectors are necessary to optimize and monitor targetting and neutrino beam (direction).
The followings are possible measurement items during beam commissioning.
• Scan beam position, size and direction on target. This is for optimization of targetting efficiency,for understanding horn focusing and so on.
58

Figure 4.1: Time schedule of the off-axis and on-axis detectors.
• Horn current scan. By measuring beam profile, intensity at muon monitor and/or on-axis de-tector, this will provide information on beam direction at different energy component, horncollection efficiency, horn alignment and so on.
4.2 ND280 commissioning
Figure 4.1 shows the current plan of ND280 detectors. The construction of the ND280 facility willstart at the beginning of Apr. 2007. The pit excavation and the construction of the underground floorswill be completed by Mar. 2008.
The magnet will be installed on the underground floor B1 before the ND280 building construction,which will start in July 2008 and will be finished in 2008. From Jan. 2009, we will install a part ofdetectors: N-GRID, tracker(TPC and FGD) and a part of SMRD, for commissioning with neutrinobeams which will be delivered from Apr. 2009.
With this partial ND280, we can measure the neutrino beam direction by the on-axis neutrinomonitor N-GRID to give important information for neutrino beam line operation, and also can performmeasurement of νμ and νe spectrum by the tracker via CCQE interactions.
Following the commissioning for three months with the partial ND280, we will install P0D andremaining SMRD during a break in 2009 summer then will do data taking with the ND280(withoutECAL). Finally we will install ECAL in Jan.2010 to complete ND280 and will be able to carry outmeasurement of γ’s and π0’s with the expected ND280 performance for other reactions than CCQE,which enables us to aim the goal of T2K experiment.
59

Chapter 5
Expected Foreign Contributions
5.1 Expected contributions to the neutrino beam line from abroad
In the beam line, the following items are expected to be contributed from collaboration institutesabroad.
• GPS time synchronization system (U.Washington/US)
• Proton intensity monitor (CT) including readout electronics (Louisiana State U./US)
• Readout electronics for proton profile monitor (SSEM) (SNU/Korea)
• Readout electronics for beam position monitor (ESM) (U. Washington/US)
• Superconducting corrector magnet (BNL,SUNY/US)
• Quench detection system (Saclay/France)
• Vacuum chamber for most downstream proton monitors including remote maintenance mecha-nism (TRIUMF/Canada)
• Beam window design and manufacturing (RAL/UK)
• Baffle design and manufacturing (RAL/UK)
• Optical transition radiation detector (Canada)
• Design of target and its remote handling mechanism (RAL/UK)
• Horn design and production of 2nd horn (US)
• Beam dump design (RAL/UK)
On most of the items above, collaboration work, such as R&D, design work, prototyping andits test, has already been started. Each country has requested budget for the contributions to theirfunding agency. Korea and Canada have already got approval. UK already has got “seed” budgetto start design work. Saclay also secured budget for quench detection system. Results of the budgetrequest in other countries are also coming within several month.
60

Item CostN-GRID $ 700kMagnet $ 1,100kTPC $ 1,580kFGD $ 2,271kP0D $ 3,340kECAL $ 1,447kSMRD $ 1,281kTotal $11,719k
Table 5.1: Cost estimate of detectors. Costs don’t include a contingency, labor or facilities. We count100 Japanese yen as 1 US dollar.
5.2 Estimated cost for ND280 and expected contributions
Table 5.1 shows the estimated cost for the ND280 detectors. We should note that it doesn’t includecosts for labor or facilities which will be estimated in detail. It also doesn’t prepare for a contingency.Large fraction of cost for the ND280 detectors will come from abroad.
ND280 detectors are shared by sub-groups of collaborators who are interested in the subjects forND280. The following list shows expected nation contributions to ND280 detectors.
• N-GRID : France, Japan, Korea, Russia, Switzerland
• Magnet : France, Italy, Spain, Switzerland, UK
• TPC : Canada, France, Italy, Spain, Switzerland
• FGD : Canada, Japan, Russia, UK
• P0D : UK, US
• ECAL : UK
• SMRD : Italy, Japan, Russia, US
• Electronics/DAQ : Canada, France, Japan, Spain, UK
Figure 5.1 shows the ND280 organization, with which R&D, design and many things for ND280detectors are being carried out.
61

Figure 5.1: ND280 organization. Boxes show sub-groups and sub-group coordinators are shown inparentheses. Expected contributing nations to sub-groups are indicated nearby those in which theyare interested.
62

Bibliography
[1] B. Cleveland, et al., Astrophys. J. 496, 505 (1998)
[2] Y. Fukuda, et al., Phys. Rev. Lett. 77, 1683-1686 (1996);K.S. Hirata, et al., Phys. Rev. D 44, 2241-2260 (1991)
[3] V. Gavrin, Results from the Russian American Gallium Experiment (SAGE), VIIIth InternationalConference on Topics in Astroparticle and Underground Physics (TAUP 2003), Seattle, Septem-ber 5–9, 2003;J.N. Abdurashitov et al., J. Exp. Theor. Phys. 95, 181 (2002);the latest SAGE results were presented by C. Cattadori, Results from Radiochemical Solar Neu-trino Experiments, XXIst International Conference on Neutrino Physics and Astrophysics (Neu-trino 2004), Paris, June 14–19, 2004.
[4] E. Bellotti, The Gallium Neutrino Observatory (GNO), VIIIth International Conference on Top-ics in Astroparticle and Underground Physics (TAUP 2003), Seattle, September 5–9, 2003;M. Altmann et al., Phys. Lett. B 490, 16 (2000);W. Hampel et al., Phys. Lett. B 447, 127 (1999)
[5] Y. Ashie, et al., Phys. Rev. D 71, 112005 (2005);Y. Fukuda, et al., Phys. Rev. Lett. 81, 1562-1567 (1998)
[6] Q.R. Ahmad et al., Phys. Rev. Lett. 87, 071301 (2001);Q.R. Ahmad et al., Phys. Rev. Lett. 89, 011301 (2002);S.N. Ahmed et al., Phys. Rev. Lett. 92, 181301 (2004);nucl-ex/0502021, submitted to Phys Rev C
[7] K. Eguchiet al., Phys. Rev. Lett. 90, 021802 (2003);K. Eguchi et al., Phys. Rev. Lett. 94, 081801 (2005)
[8] E. Aliu et al., Phys. Rev. Lett. 94, 081802 (2005)
[9] Z. Maki, N. Nakagawa, and S. Sakata, Prog. Theor. Phys. 28, 870 (1962)
[10] M. Kobayashi, T. Maskawa, Prog. Theor. Phys. 49, 652 (1973)
[11] S. P. Mikheyev and A. Yu. Smirnov, Sov. J. Nucl. Phys. 42, 913 (1985);L. Wolfenstein, Phys. Rev. D 17, 2369 (1978)
[12] C. Athanassopoulos, et al., Phys. Rev. C542685-27081996, nucl-ex/9605001;A. Aguilar, et al., Phys. Rev. D641120072001
[13] B. Armbruster, et al., Phys. Rev. D 65, 112001 (2002);E.D. Church, K. Eitel, G.B. Mills, M. Steidl, Phys. Rev. D 66, 013001 (2002)
[14] E. Church, et al., nucl-ex/9706011.
[15] M. Fukugita and T. Yanagida, Phys. Lett. B 174, 45 (1986)
63

[16] M. Apollonio, et al., Eur. Phys. J. C27, 331-374 (2003);M. Apollonio, et al., Phys. Lett. B 466, 415-430 (1999).
[17] P-875: A Long Baseline Neutrino Oscillation Experimentat Fermilab, D. Ayres et al.. MINOS Proposal, NuMI-L-63.http://www.hep.anl.gov/ndk/hypertext/numi notes.html.
[18] The OPERA experiment, H. Pessard, et al. (OPERA), hep-ex/0504033.
[19] The ICARUS experiment, a second-generation proton decay experiment and neutrino observa-tory at the Gran Sasso Laboratory, Arneodo, F, et al. (ICARUS), hep-ex/0103008.
[20] First MINOS Oscillation Results, http://www-numi.fnal.gov/talks/results06.html
[21] http://jkj.tokai.jaeri.go.jp/index-e.html
[22] Y. Fukuda, et al., Nucl. Instrum. Methods A, 501 (2003)418-462
[23] D. Beavis, A. Carroll, I. Chiang, et al., Proposal of BNL AGS E-889 (1995).
[24] S. Fukuda et al. (Super-Kamiokande Collaboration), Phys. Rev. Lett. 85, 2000 (3999-4003)
[25] RD42 Collaboration web page, http://rd42.web.cern.ch/RD42/
[26] A section in Canadian proposal to their funding agency,http://jnusrv01.kek.jp/jnu/monitor/OTR/nserc rti v2.1.pdf
[27] R. Ishida, Talk at the T2K280m meeting, October 25, 2003.http://www-he.scphys.kyoto-u.ac.jp/ nakaya/jparc/index.htmhttp://www-he.scphys.kyoto-u.ac.jp/ nakaya/jparc/doc/ND280m Oct25-27-2003/r ishida.pdf
[28] S.J.Barish et al, Phys. Rev. D19:2521,(1979).
[29] C. Altunbas, et al., Construction, test and commissioning of the triple-gem tracking detector forcompass, Nucl. Instrum. Methods A, 490 (2002)177.
[30] A. Magnon et al., Tracking with 40x40-cm**2 micromegas detectors in the high energy, highluminosity compass experiment, Nucl. Instrum. Methods A, 478 (2002)210.
[31] I. Giomataris et al., Micromegas in a Bulk, physics/0501003, January 2005.
[32] K. Nitta et al.,The K2K SciBar detector, Nucl. Instrum. Methods A, 535 (2004)147-151
[33] Minerva Collaboration, hep-ex/0405002
[34] F. Sanchez, Talk at the T2K280m meeting, October 7, 2004
[35] G.Bondarenko,V.Golovin, M.Tarasov, Patent for invention in Russia No. 2142175, 1999.
[36] G.Bondarenko et al., Nucl. Phys. Proc. Suppl., 61B (1998)347.
[37] A. Akindinov et al., NIM, A494 (2002) 474.
[38] G.Bondarenko et al., NIM, A442 (2000) 187.
[39] V.Golovin, V.Saveliev, NIM, A518 (2004) 560.
64