tokyo gas group business activities and material balance
TRANSCRIPT
Note: The sum of individual environmental data may not be equal to the total due to the way figures are rounded.
Tokyo Gas Group Business Activities and Material Balance
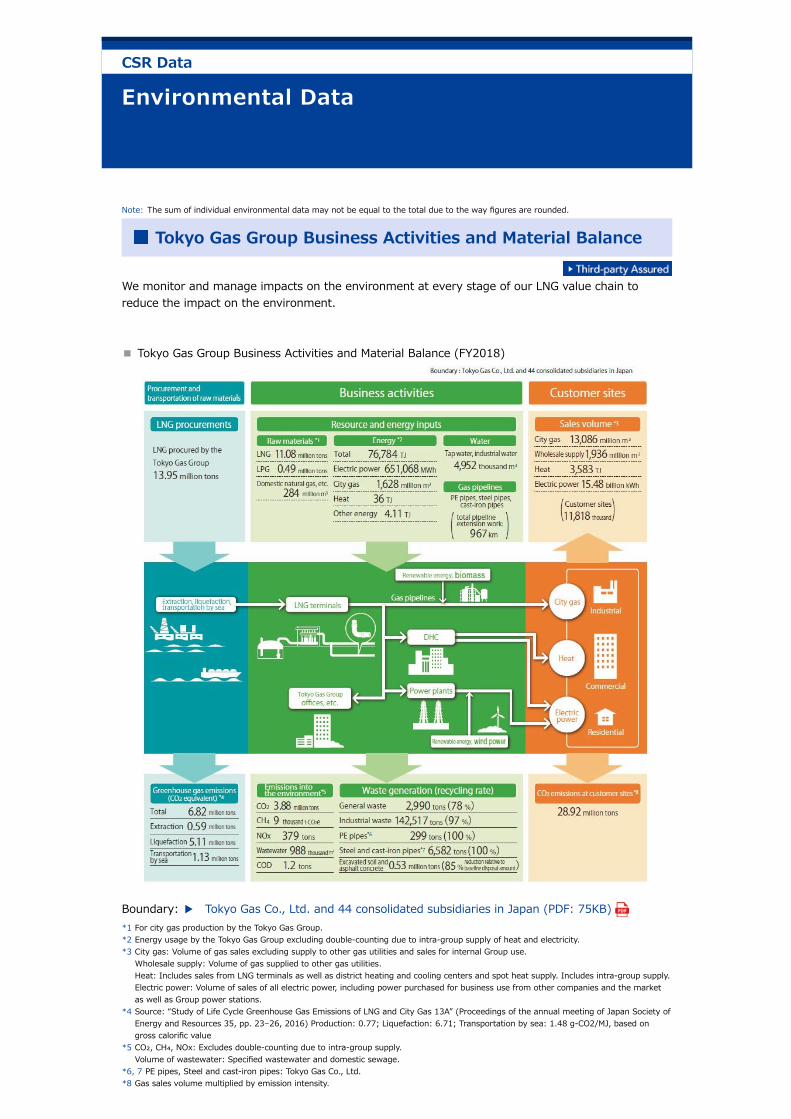
We monitor and manage impacts on the environment at every stage of our LNG value chain toreduce the impact on the environment.
■ Tokyo Gas Group Business Activities and Material Balance (FY2018)
Boundary: ▶ Tokyo Gas Co., Ltd. and 44 consolidated subsidiaries in Japan (PDF: 75KB) *1 For city gas production by the Tokyo Gas Group.*2 Energy usage by the Tokyo Gas Group excluding double-counting due to intra-group supply of heat and electricity.*3 City gas: Volume of gas sales excluding supply to other gas utilities and sales for internal Group use.
Wholesale supply: Volume of gas supplied to other gas utilities.Heat: Includes sales from LNG terminals as well as district heating and cooling centers and spot heat supply. Includes intra-group supply.Electric power: Volume of sales of all electric power, including power purchased for business use from other companies and the marketas well as Group power stations.
*4 Source: “Study of Life Cycle Greenhouse Gas Emissions of LNG and City Gas 13A” (Proceedings of the annual meeting of Japan Society ofEnergy and Resources 35, pp. 23–26, 2016) Production: 0.77; Liquefaction: 6.71; Transportation by sea: 1.48 g-CO2/MJ, based ongross calorific value
*5 CO₂, CH₄, NOx: Excludes double-counting due to intra-group supply.Volume of wastewater: Specified wastewater and domestic sewage.
*6, 7 PE pipes, Steel and cast-iron pipes: Tokyo Gas Co., Ltd.*8 Gas sales volume multiplied by emission intensity.
CSR Data

■ City Gas Feedstock (LNG/LPG) ■ City Gas Sales
■ Heat Sales ■ Power Sales
▶ Tokyo Gas Group Business Activities and Material Balance (FY2018) (PDF: 1,142KB)
(1) Use of Energy and Water/Emissions into theAtmosphere and Water System
Use of Energy and Water/Emissions into the Atmosphere and WaterSystems
■ Feedstock and Sales Volume
Category Unit FY2014 FY2015 FY2016 FY2017 FY2018
City gas feedstock(Note 1)
Feedstock LNG Thousand tons 11,513 11,411 11,583 11,407 11,083
Feedstock LPG Thousand tons 441 438 434 491 491
Production
City gas sales(Note 2)
Million m3 15,358 15,263 15,571 15,380 15,022
Heat sales (Note 3)
TJ 3,287 3,251 3,451 3,496 3,583
Power Sales(Note 4)
Billion kWh 10.61 10.96 12.65 14.66 15.48
Note 1: For city gas production by the Tokyo Gas Group.Note 2: Volume of gas sales including supply to other gas utilities and excluding sales for internal Group use.Note 3: Includes sales volume from LNG terminals, in addition to district heating and cooling centers and spot heat supply. Also includes
intra-group supply.Note 4: Volume of sales of all electric power, including power purchased for business use from other companies and the market as well as
Group power stations.

■ Energy Usage*1, 2
Category Unit FY2014 FY2015 FY2016 FY2017 FY2018
Energy usage (Note 1) TJ 66,399 68,561 79,230 82,651 76,784
LNG terminals TJ 4,069 3,998 4,169 4,291 4,106
District heatingand coolingcenters
TJ 4,167 4,167 4,316 4,037 4,173
Power plants TJ 55,639 57,871 68,250 71,967 66,322
Tokyo Gasbusinessoffices, etc.
TJ 1,417 1,387 1,483 1,444 1,419
Other Groupcompanies
TJ 1,490 1,460 1,362 1,368 1,279
(Tokyo Gas Co.,Ltd.)
TJ 5,785 5,678 5,954 6,043 5,877
Electric power (Note 2) MWh 593,097 615,419 626,729 607,725 651,068
LNG terminals MWh 334,229 345,227 363,053 368,259 357,068
District heatingand coolingcenters
MWh 90,973 94,640 98,529 84,621 84,722
Power plants MWh 8,774 11,407 9,775 10,700 93,486
Tokyo Gasbusinessoffices, etc.
MWh 52,350 52,372 51,526 49,786 49,629
Other Groupcompanies
MWh 115,677 112,890 103,847 105,089 98,696
(Tokyo Gas Co.,Ltd.)
MWh 391,536 402,357 419,502 422,776 416,928
City gasThousand
m3 1,402,022 1,447,012 1,691,380 1,775,849 1,628,350
LNG terminalsThousand
m3 18,769 14,600 14,544 16,206 14,450
District heatingand coolingcenters
Thousandm3 74,482 73,328 75,133 72,420 76,216
Power plantsThousand
m3 1,289,852 1,341,099 1,582,434 1,668,543 1,519,617
Tokyo Gasbusinessoffices, etc.
Thousandm3 16,726 15,969 18,209 17,697 17,082
Other Groupcompanies
Thousandm3 2,192 2,015 1,060 984 985
(Tokyo Gas Co.,Ltd.)
Thousandm3 40,994 35,990 38,347 39,676 37,035
Heat (Note 2) TJ 38 48 71 55 36
District heatingand coolingcenters
TJ 203 198 232 211 119

Tokyo Gasbusinessoffices, etc.
TJ 85 88 93 95 96
Other Groupcompanies
TJ 158 166 195 195 172
(Tokyo Gas Co.,Ltd.)
TJ 94 96 102 104 105
Other fuels TJ 5.23 5.80 4.89 4.04 4.11
LNG terminals TJ 0.22 0.68 0.50 0.53 0.43
Tokyo Gasbusinessoffices, etc.
TJ 0.64 0.60 1.34 0.50 0.55
Other Groupcompanies
TJ 4.37 4.52 3.04 3.01 3.14
(Tokyo Gasbusinessoffices, etc.)
TJ 0.86 1.28 1.84 1.03 0.98
Fuels forvehicles
Gasoline kL 3,282 3,219 3,342 3,195 3,263
(Tokyo Gas Co.,Ltd.)
kL 1,425 1,444 1,420 1,335 1,297
Diesel oil kL 219 208 198 249 239
(Tokyo Gas Co.,Ltd.)
kL 35 41 47 59 65
City gasThousand
m3 203 175 135 133 65
(Tokyo Gas Co.,Ltd.)
Thousandm3 172 142 124 124 58
LPG kL 280 220 142 114 94
(Tokyo Gas Co.,Ltd.)
kL - - - - -
LNG cryogenic energyThousand
tons2,289 2,364 2,678 2,890 2,862
Cryogenicpowergeneration
Thousandtons
460 724 785 787 616
Portion sent tosubsidiariesand affiliates
Thousandtons
853 852 820 820 821
BOG treatment,etc.
Thousandtons
976 788 1,073 1,283 1,424

■ Energy Usage (by Business)
Note 1: Excludes double counting by intra-group supply of heat and electricity.Note 2: Excludes double counting by intra-group supply. Since fiscal 2018, the amount of heat accommodated was deducted for district
heating and cooling centers.
■ Water Usage
Category Unit FY2014 FY2015 FY2016 FY2017 FY2018
Tap water and industrial waterThousand
m3 5,751 5,388 5,017 5,180 4,952
LNG terminalsThousand
m3 1,662 1,457 1,138 1,125 1,045
District heating andcooling centers
Thousandm3 1,439 1,459 1,552 1,507 1,780
Power plantThousand
m3 1,703 1,569 1,492 1,765 1,325
Tokyo Gas businessoffices, etc.
Thousandm3 572 537 544 506 516
Other Group companiesThousand
m3 375 366 290 276 286
(Tokyo Gas Co., Ltd.)Thousand
m3 2,276 2,036 1,726 1,674 1,644
Seawater LNG terminalsThousand
m3 784,406 773,963 781,879 784,651 738,529
■ Water Usage (Tap Water and Industrial Water)
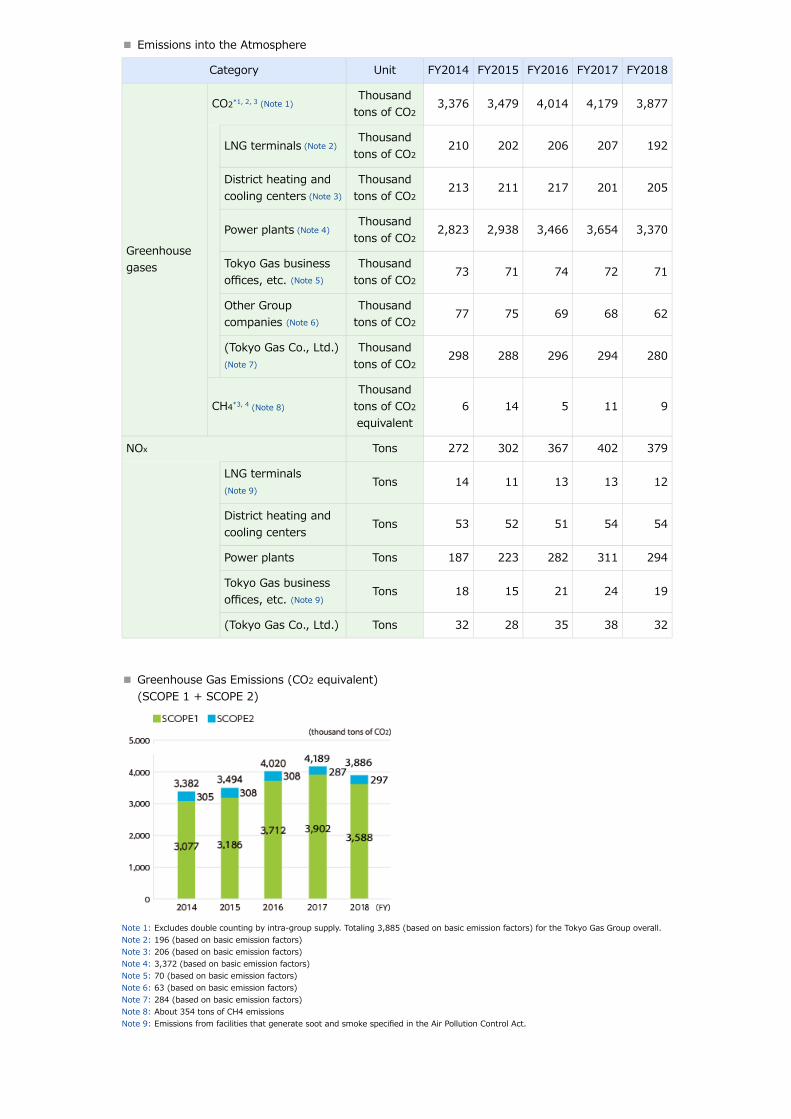
■ Greenhouse Gas Emissions (CO2 equivalent)(SCOPE 1 + SCOPE 2)
■ Emissions into the Atmosphere
Category Unit FY2014 FY2015 FY2016 FY2017 FY2018
Greenhousegases
CO2*1, 2, 3 (Note 1)Thousand
tons of CO23,376 3,479 4,014 4,179 3,877
LNG terminals (Note 2)Thousand
tons of CO2210 202 206 207 192
District heating andcooling centers (Note 3)
Thousandtons of CO2
213 211 217 201 205
Power plants (Note 4)Thousand
tons of CO22,823 2,938 3,466 3,654 3,370
Tokyo Gas businessoffices, etc. (Note 5)
Thousandtons of CO2
73 71 74 72 71
Other Groupcompanies (Note 6)
Thousandtons of CO2
77 75 69 68 62
(Tokyo Gas Co., Ltd.)(Note 7)
Thousandtons of CO2
298 288 296 294 280
CH4*3, 4 (Note 8)
Thousandtons of CO2
equivalent6 14 5 11 9
NOx Tons 272 302 367 402 379
LNG terminals(Note 9)
Tons 14 11 13 13 12
District heating andcooling centers
Tons 53 52 51 54 54
Power plants Tons 187 223 282 311 294
Tokyo Gas businessoffices, etc. (Note 9)
Tons 18 15 21 24 19
(Tokyo Gas Co., Ltd.) Tons 32 28 35 38 32
Note 1: Excludes double counting by intra-group supply. Totaling 3,885 (based on basic emission factors) for the Tokyo Gas Group overall.Note 2: 196 (based on basic emission factors)Note 3: 206 (based on basic emission factors)Note 4: 3,372 (based on basic emission factors)Note 5: 70 (based on basic emission factors)Note 6: 63 (based on basic emission factors)Note 7: 284 (based on basic emission factors)Note 8: About 354 tons of CH4 emissionsNote 9: Emissions from facilities that generate soot and smoke specified in the Air Pollution Control Act.

■ Greenhouse Gas Emissions from Feedstock Procurement (SCOPE 3)
Category Unit FY2014 FY2015 FY2016 FY2017 FY2018
LNG procured Million tons 13.97 13.87 14.25 14.24 13.95
Greenhouse gas(CO2
equivalent)(Note 1)
ExtractionMillion tons of
CO20.62 0.58 0.60 0.60 0.59
LiquefactionMillion tons of
CO26.38 5.08 5.22 5.22 5.11
Transport bysea
Million tons ofCO2
1.50 1.12 1.15 1.15 1.13
Note 1: Calculated based on greenhouse gas emission intensity throughout the lifecycle, from extraction of natural gas to processing andtransportation, as analyzed by the LCA approach.
FY2012–14 emission intensityExtraction: 0.81; Liquefaction: 8.36; Transportation by sea: 1.97 g-CO2/MJ, based on gross calorific valueSource: “Future Forecast for Life Cycle Greenhouse Gas Emissions of LNG and City Gas 13A” (Japan Society of Energy and Resources,presentation report 28 (2), pp. 51–56, 2007)
Emission intensity from FY2015Extraction: 0.77; Liquefaction: 6.71; Transportation by sea: 1.48 g-CO2/MJ, based on gross calorific valueSource: “Study of Life Cycle Greenhouse Gas Emissions of LNG and City Gas 13A” (Proceedings of the annual meeting of Japan Societyof Energy and Resources 35, pp. 23–26, 2016)
■ CO2 Emissions and Emissions Reduction at Customer Sites (SCOPE 3)
Category Unit FY2011 FY2012 FY2013 FY2014 FY2015 FY2016 FY2017 FY2018
CO2
Totalamount
Milliontons of
CO2
26.94 27.09 27.67 29.36 28.96 29.43 29.60 28.92
AmountofreductionrelativetoFY2011
Milliontons of
CO2
Baseline 0.87 1.52 3.29 3.43 3.94 4.04 4.52
■ Energy Usage and CO2 Emissions Associated with Cargo Transportation (Tokyo Gas Co., Ltd.)(SCOPE 3)
Category Unit FY2014 FY2015 FY2016 FY2017 FY2018
Transportation amountMillion tons
-km94.59 98.42 85.70 82.72 93.29
Energy usage (crude oilequivalent)
kL 3,275 3,354 3,165 3,055 3,237
Energy usage intensitykL/Million tons-
km34.6 34.1 36.9 36.9 34.7
CO2 emissions tons-CO2 8,615 8,810 8,267 7,993 8,520
■ Emissions into Water Systems
Category Unit FY2014 FY2015 FY2016 FY2017 FY2018
WastewaterThousand
m3 1,116 1,091 1,090 1,069 988
LNG terminals (Note 1)Thousand
m3 265 287 291 242 221
District heating and coolingcenters
Thousandm3 325 330 354 330 362
Power plantsThousand
m3 525 474 445 498 405

■ Wastewater ■ COD (Chemical Oxygen Demand)
(Tokyo Gas Co., Ltd.)Thousand
m3 273 296 300 258 254
COD Tons 1.9 1.6 1.4 1.4 1.2
LNG terminals Tons 1.2 1.2 1.0 0.9 0.9
Power plants Tons 0.6 0.5 0.4 0.4 0.3
(Tokyo Gas Co., Ltd.) Tons 1.2 1.2 1.0 0.9 0.9
Note 1: Data are for wastewater discharges from wastewater treatment facilities and sewage discharges.
Conversion Factor, etc.
■ CO2 Emission Factor
Category Unit FY2014 FY2015 FY2016 FY2017 FY2018
City gas (Tokyo Gas 13A)(Note 1)
kg-CO2/m3 2.21
Purchased electricity (average of allpower sources) (Note 2)
kg-CO2/kWh0.530
etc.0.505
etc.0.500
etc.0.486
etc.0.462
etc.
Heat(Note 3)
Steam (excluding industrialuse), hot water, cold water
kg-CO2/MJ 0.057
Industrial steam kg-CO2/MJ 0.060
Otherfuels(Note 3)
Heavy oil A kg-CO2/L 2.71
Diesel kg-CO2/L 2.58
Kerosene kg-CO2/L 2.49
Gasoline kg-CO2/L 2.32
LPG kg-CO2/kg 3.00
Note 1: Calculated based on the typical composition of city gas (type 13A) supplied by the Tokyo Gas (15°C, gauge pressure of 2 kPa).Note 2: Emission factors from electric power companies, released in accordance with the ministerial ordinance stipulated by the Act on
Promotion of Global Warming Countermeasures. The basic emission factors were used until fiscal 2017 and adjusted emissionfactors are used since fiscal 2018.
Note 3: Calculated using the unit calorific value released in accordance with the ministerial ordinance stipulated by the Act on Promotion ofGlobal Warming Countermeasures, and multiplying this amount by the emission factor per unit calorific value and by 44/12.
■ Unit Calorific Value
Category Unit FY2014 FY2015 FY2016 FY2017 FY2018
City gas (Tokyo Gas 13A)(Note 1)
MJ/m3N 45.00
Purchasedelectricity
Daytime electricity MJ/kWh 9.97
Nighttime electricity MJ/kWh 9.28(Note 2)*5
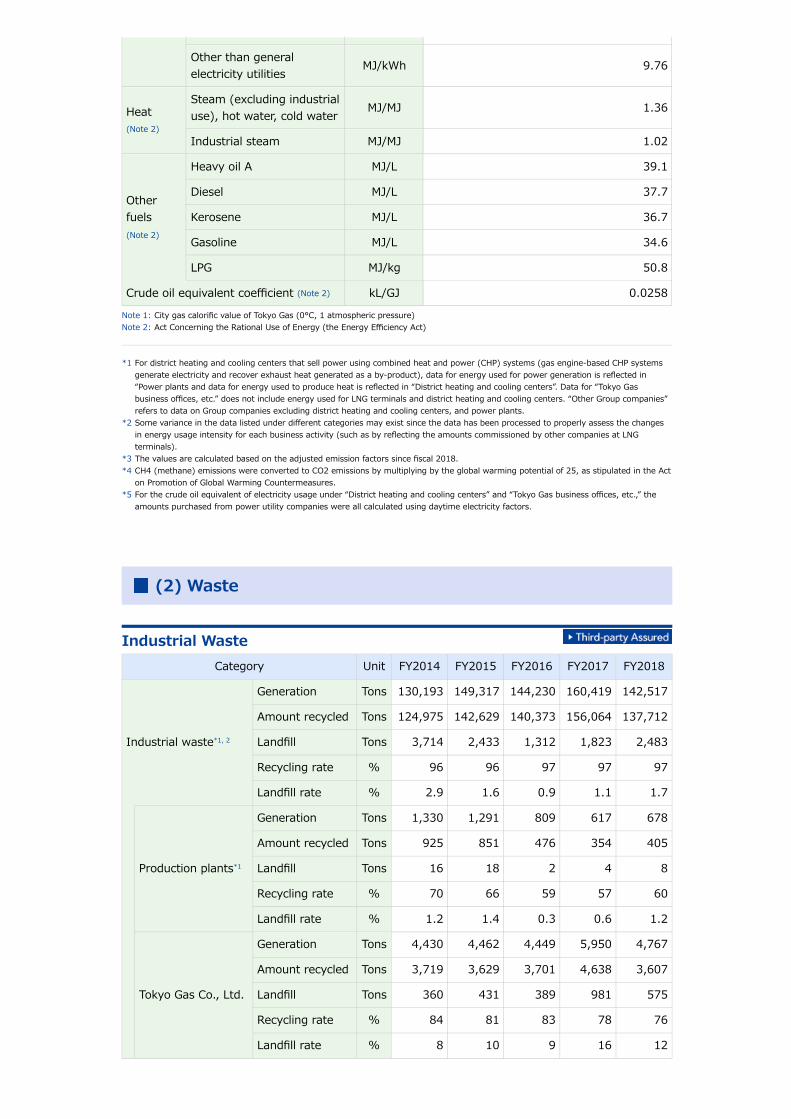
Other than generalelectricity utilities
MJ/kWh 9.76
Heat(Note 2)
Steam (excluding industrialuse), hot water, cold water
MJ/MJ 1.36
Industrial steam MJ/MJ 1.02
Otherfuels(Note 2)
Heavy oil A MJ/L 39.1
Diesel MJ/L 37.7
Kerosene MJ/L 36.7
Gasoline MJ/L 34.6
LPG MJ/kg 50.8
Crude oil equivalent coefficient (Note 2) kL/GJ 0.0258
Note 1: City gas calorific value of Tokyo Gas (0°C, 1 atmospheric pressure)Note 2: Act Concerning the Rational Use of Energy (the Energy Efficiency Act)
*1 For district heating and cooling centers that sell power using combined heat and power (CHP) systems (gas engine-based CHP systemsgenerate electricity and recover exhaust heat generated as a by-product), data for energy used for power generation is reflected in“Power plants and data for energy used to produce heat is reflected in “District heating and cooling centers”. Data for “Tokyo Gasbusiness offices, etc.” does not include energy used for LNG terminals and district heating and cooling centers. “Other Group companies”refers to data on Group companies excluding district heating and cooling centers, and power plants.
*2 Some variance in the data listed under different categories may exist since the data has been processed to properly assess the changesin energy usage intensity for each business activity (such as by reflecting the amounts commissioned by other companies at LNGterminals).
*3 The values are calculated based on the adjusted emission factors since fiscal 2018.*4 CH4 (methane) emissions were converted to CO2 emissions by multiplying by the global warming potential of 25, as stipulated in the Act
on Promotion of Global Warming Countermeasures.*5 For the crude oil equivalent of electricity usage under “District heating and cooling centers” and “Tokyo Gas business offices, etc.,” the
amounts purchased from power utility companies were all calculated using daytime electricity factors.
(2) Waste
Industrial WasteCategory Unit FY2014 FY2015 FY2016 FY2017 FY2018
Industrial waste*1, 2
Generation Tons 130,193 149,317 144,230 160,419 142,517
Amount recycled Tons 124,975 142,629 140,373 156,064 137,712
Landfill Tons 3,714 2,433 1,312 1,823 2,483
Recycling rate % 96 96 97 97 97
Landfill rate % 2.9 1.6 0.9 1.1 1.7
Production plants*1
Generation Tons 1,330 1,291 809 617 678
Amount recycled Tons 925 851 476 354 405
Landfill Tons 16 18 2 4 8
Recycling rate % 70 66 59 57 60
Landfill rate % 1.2 1.4 0.3 0.6 1.2
Tokyo Gas Co., Ltd.
Generation Tons 4,430 4,462 4,449 5,950 4,767
Amount recycled Tons 3,719 3,629 3,701 4,638 3,607
Landfill Tons 360 431 389 981 575
Recycling rate % 84 81 83 78 76
Landfill rate % 8 10 9 16 12

■ Industrial Waste (All) ■ Industrial Waste (Production Plants)
Results by Major Sites (FY2018)
■ LNG terminals (Negishi, Sodegaura, Ohgishima, Hitachi)
CategoryGeneration
(tons)
Amountrecycled(tons)
Landfill(tons)
Recyclingrate (%)
Landfillrate (%)
Sludge 121.3 24.0 0.1 19.8 0.1
Scrap metal 16.5 16.5 0.0 100.0 0.0
Waste oil 7.2 5.8 0.0 80.5 0.3
Waste plastics 6.9 5.7 0.1 83.1 0.9
Specially controlled industrial waste 17.9 17.2 0.0 95.8 0.0
Other 50.1 2.2 0.8 4.3 1.7
Total 219.9 71.3 1.1 32.4 0.5
■ District Heating and Cooling Centers
CategoryGeneration
(tons)
Amountrecycled(tons)
Landfill(tons)
Recyclingrate (%)
Landfillrate(%)
Sludge 20.4 4.6 4.0 22.7 19.8
Scrap metal 14.0 14.0 0.0 100.0 0.0
Waste oil 7.0 6.3 0.7 90.1 9.9
Waste plastics 5.9 5.9 0.0 100.0 0.0
Other 48.1 4.9 2.2 10.2 4.6
Total 95.3 35.7 7.0 37.4 7.3
*1 Data for “Production plants” include that from business offices that produce city gas and other products, district heating and coolingcenters, and power plants.
*2 Including construction work for customers of our subcontractors, subsidiaries and affiliates.
General Waste
Category Unit FY2014 FY2015 FY2016 FY2017 FY2018
GeneralWaste
Generation Tons 3,457 3,143 2,931 2,818 2,990
Amountrecycled
Tons 2,725 2,441 2,224 2,090 2,333
Recycling rate % 79 78 76 74 78

■ General Waste (All) ■ Copy Paper (All)
Tokyo GasCo., Ltd.
Generation Tons 1,132 1,016 1,045 1,010 998
Amountrecycled
Tons 967 870 850 806 811
Recycling rate % 85 86 81 80 81
Copypaper
Amountpurchased
Million 133 134 129 121 115
Tokyo GasCo., Ltd.
Amountpurchased
Million 66 63 64 59 53
By-products from Gas Pipeline Construction
Category Unit FY2014 FY2015 FY2016 FY2017 FY2018
Gas pipe(Note 1)
PE pipe
Amount recovered Tons 228 235 260 283 299
Amount recycled Tons 228 235 260 283 299
Recycling rate % 100 100 100 100 100
Steel andcast-ironpipe
Amount recoveredand recycled
Tons 4,670 5,003 6,126 6,605 6,582
Recycling rate % 100 100 100 100 100
Excavatedsoil(Note 2)
Gas pipeline extension work km 1,170 1,121 1,026 1,038 967
Estimated excavated amountMilliontons
3.71 4.49 3.88 4.03 3.61
Actualreducedamount
Reduction (byshallower laying ofpipes in narrowtrenches and non-open-cut method)
Milliontons
1.42 1.32 1.35 1.28 1.26
Reuse (generatedsoil)
Milliontons
0.52 0.84 0.62 0.61 0.55
Recycle (improvedsoil, regenerationtreatment)
Milliontons
1.15 1.33 1.27 1.27 1.27
Total reductionamount
Milliontons
3.09 3.49 3.24 3.16 3.09
Rate of reductionamount (comparisonto estimated
% 83 78 83 79 85
excavated amount)

■ PE Pipe ■ Steel and Cast-iron Pipe
Residual soil (actual amount)Milliontons
0.62 1.0 0.64 0.86 0.53
Rate of residual soil(comparison to estimatedexcavated amount)
% 17 22 17 21 15
Tokyo GasCo., Ltd.(Note 2)
Gas pipeline extension work km 1,065 1,020 973 1,003 934
Estimated excavated amountMilliontons
3.47 4.25 3.75 3.94 3.53
Actualreducedamount
Reduction (byshallower laying ofpipes in narrowtrenches and non-open-cut method)
Milliontons
1.35 1.25 1.31 1.24 1.23
Reuse (generatedsoil)
Milliontons
0.47 0.79 0.61 0.61 0.55
Recycle (improvedsoil, regenerationtreatment)
Milliontons
1.12 1.31 1.26 1.25 1.24
Total reductionamount
Milliontons
2.94 3.35 3.18 3.10 3.02
Rate of reductionamount (comparisonto estimatedexcavated amount)
% 85 79 85 78 85
Residual soil (actual amount)Milliontons
0.52 0.90 0.57 0.85 0.51
Rate of residual soil(comparison to estimatedexcavated amount)
% 15 21 15 22 15

■ Residual Soil and Reduction Amount
Note 1: Tokyo Gas Co., Ltd.Note 2: Data for excavated soil and asphalt concrete.
Recovery of Used Gas Appliances from Customers
Category Unit FY2014 FY2015 FY2016 FY2017 FY2018
Waste,etc.
Amountrecovered (Note1)
Used gasappliance,etc.
Tons 3,933 3,861 3,715 3,445 3,288
Other Tons 5,057 5,075 4,581 4,695 4,103
Total Tons 8,991 8,936 8,296 8,140 7,391
Note 1: Excludes waste from specified kinds of home appliances.
■ Breakdown (FY2018)
CategoryAmount
recovered(tons)
Amountrecycled(tons)
Finaldisposal(tons)
Recyclingrate (%)
Final disposalrate (%)
Used gas appliancesand scrap metal
3,288.1 3,288.1 0.0 100.0 0.0
Waste plastics 521.0 456.3 64.7 87.6 12.4
Polystyrene foam 13.6 13.6 0.0 100.0 0.0
Cardboard boxes 558.2 558.2 0.0 100.0 0.0
Debris 331.0 294.6 36.4 89.0 11.0
Concrete and tilescraps
200.0 92.0 108.0 46.0 54.0
Other 2,492.5 2,248.9 243.5 90.2 9.8
Total 7,390.7 6,938.1 452.6 93.9 6.1

Compliance with Local Government Ordinances on theEnvironment and Energy
Tokyo Gas prepares and publishes the following plans and reports in accordance with the ordinancesof local authorities.
Tokyo
Global Warming Action Plan (Large Establishments)• FY2019 Hamamatsucho (Head Office) Building• FY2019 Senju Techno Station
• Global Warming Action Report (Small/Medium-Sized Establishments)
Environmental Energy Reporting Program• FY2019 Energy Status Reports• FY2019 Environmental Energy Plans
Saitama Pref. FY2019 Global Warming Action Plan Report
Kanagawa Pref. FY2019 Report on Results of Action against Global Warming in Business
Yokohama CityFY2019 Report on State of Action against Global Warming FY2019 Report and Plan for Promoting Low-carbon Electricity
Assessment of CO2 Emissions Reduction due to Reductionsin Purchased Electricity
Amount of Thermal Power Generation Varies According to ElectricityUsageIn Japan, the electricity supplied by electric utilities is generated primarily by thermal power, nuclearpower and hydroelectric power plants. Nuclear power plants operate at full capacity except whenundergoing a routine inspection, while the annual power output of hydroelectric power plants isdetermined by the amount of rainfall. The electricity supply is adjusted by operations at thermalpower plants. Therefore, in terms of total annual output, it is most likely to be thermal powergeneration that is cut when electricity use is reduced through energy-saving measures.
Link▶ The Greenhouse Gas Protocol (Guidelines for Quantifying GHG Reductions from Grid-
Connected Electricity Projects)

Overview of Employees
■ Number of Full-time Employees by Gender*1, 2, 3, 4
Unit FY2016 FY2017 FY2018
Male
Non-consolidated
Persons (%)
6,518 (85.7) 6,392 (85.0) 6,334 (84.5)
Consolidated 11,745 (84.2) 11,418 (83.4) 11,300 (82.8)
Female
Non-consolidated
1,086 (14.3) 1,126 (15.0) 1,158 (15.5)
Consolidated 2,212 (15.8) 2,271 (16.6) 2,341 (17.2)
Total
Non-consolidated
7,604 7,518 7,492
Consolidated 13,957 13,689 13,641
*1 Data are as of the end of March of each fiscal year.*2 Non-consolidated data exclude personnel on loan to Tokyo Gas from other organizations and include personnel on loan from Tokyo Gas to
other organizations (registered personnel).*3 Consolidated data exclude personnel on loan to Tokyo Gas and its subsidiaries from other organizations and include personnel on loan
from Tokyo Gas and its subsidiaries to other organizations.*4 Data in fiscal 2017 were revised.
Note: Number of Tokyo Gas employees (registered personnel) as of the end of March of each fiscal year.
■ Breakdown of Employees by Age and Gender*1, 2, 3
Age Unit Male Female Total
Under 30
Non-consolidated
Persons(%)
1,772 (28.0) 320 (27.6) 2,092 (27.9)
Consolidated 2,641 (23.4) 615 (26.3) 3,256 (23.9)
From 30 to 39
Non-consolidated
899 (14.2) 154 (13.3) 1,053 (14.1)
Consolidated 1,989 (17.6) 417 (17.8) 2,406 (17.6)
From 40 to 49
Non-consolidated
1,646 (26.0) 415 (35.8) 2,061 (27.5)
Consolidated 3,339 (29.5) 802 (34.3) 4,141 (30.4)
CSR Data

From 50 to 59
Non-consolidated
1,984 (31.3) 266 (23.0) 2,250 (30.0)
Consolidated 3,243 (28.7) 498 (21.3) 3,741 (27.4)
60 and over
Non-consolidated
33 (0.5) 3 (0.3) 36 (0.5)
Consolidated 88 (0.8) 9 (0.4) 97 (0.7)
Total
Non-consolidated
6,334 1,158 7,492
Consolidated 11,300 2,341 13,641
*1 Data are as of the end of March 2019.*2 Non-consolidated data are for Tokyo Gas employees (registered personnel).*3 Consolidated data exclude personnel on loan to Tokyo Gas and its subsidiaries from other organizations and include personnel on loan
from Tokyo Gas and its subsidiaries to other organizations.
■ Average Age by Gender*1, 2, 3
Unit FY2016 FY2017 FY2018
Male
Non-consolidated
Age
41.4 40.7 40.8
Consolidated 41.8 41.2 41.2
Female
Non-consolidated
41.1 40.6 40.5
Consolidated 39.9 40.0 40.1
Total
Non-consolidated
41.4 40.7 40.8
Consolidated 41.5 41.0 41.0
*1 Data are as of the end of March of each fiscal year.*2 Non-consolidated data are for Tokyo Gas employees (registered personnel).*3 Consolidated data exclude personnel on loan to Tokyo Gas and its subsidiaries from other organizations and include personnel on loan
from Tokyo Gas and its subsidiaries to other organizations.
Note: Number of Tokyo Gas employees (registered personnel) are as of the end of March of each fiscal year.
■ Average Length of Employment by Gender*1, 2, 3, 4
Unit FY2016 FY2017 FY2018
Male
Non-consolidated
Years
19.7 19.3 19.5
Consolidated 17.1 16.7 17.0
Female
Non-consolidated
18.7 19.3 18.5
Consolidated 14.4 14.8 14.5

Total
Non-consolidated
19.6 19.3 19.3
Consolidated 16.7 16.4 16.5
*1 Data are as of the end of March of each fiscal year.*2 Non-consolidated data are for Tokyo Gas employees (registered personnel).*3 Consolidated data exclude personnel on loan to Tokyo Gas and its subsidiaries from other organizations and include personnel on loan
from Tokyo Gas and its subsidiaries to other organizations.*4 Data in fiscal 2017 were revised.
Note: Number of Tokyo Gas employees (registered personnel) are as of the end of March of each fiscal year.
■ Ratio of Women in Management*1, 2
*1 Number of Tokyo Gas employees (registered personnel) are as of April 1 of each fiscal year.*2 Employees in supervisory positions, or employees of equivalent status.
■ Hiring of New Graduates*1
Unit
Breakdown ofFY2017 Hires
Breakdown ofFY2018 Hires
Breakdown ofFY2019 Hires
Male Female Male Female Male Female
Undergraduateand Graduate*2
Non-consolidated
Persons
167 53 125 61 162 62
Consolidated - - 217 127 273 145
High School
Non-consolidated
27 4 18 2 0 0
Consolidated - - 62 11 34 7
Total
Non-consolidated
194 57 143 63 162 62
Consolidated - - 279 138 307 152
*1 Data are as of April 1 of each fiscal year.*2 Including technical college and junior college graduates.

■ Hiring of Mid-Career Personnel*1
UnitMay 2016 toApril 2017
May 2017 toApril 2018
May 2018 toApril 2019
Male
Non-consolidated
Persons
12 12 15
Consolidated - 234 191
Female
Non-consolidated
2 1 0
Consolidated - 66 74
Total
Non-consolidated
14 13 15
Consolidated - 300 265
*1 Data includes contract employees who became regular employees.
■ Hiring of People with Disabilities*1, 2, 3
Unit March 2017 March 2018 March 2019
Number ofpersons hired(percentage oftotal employees)
Persons(%)
153 (2.10) 150 (2.10) 167 (2.44)
*1 Data are for regular and contract employees at Tokyo Gas Co., Ltd.*2 Figures are as of the first day of the month shown for each fiscal year.*3 Figure has risen to 170 people, or 2.46% of the workforce, as of June 2019.
■ State of Reemployment after Mandatory Retirement
Unit FY2016 FY2017 FY2018
Total number of retired employees*1 Persons 348 273 172
Number of reemployed*2
Tokyo GasPersons
(%)
251 (72.1) 203 (74.4) 103 (59.9)
Subsidiaries 42 (12.1) 46 (16.8) 52 (30.2)
Total 293 (84.2) 249 (91.2) 155 (90.1)
*1 Number of employees who left the company at the mandatory retirement age of 60 for Tokyo Gas Co., Ltd.*2 Number of people hired as “career employees” (contract employees rehired after reaching mandatory retirement age).
■ Major Programs and Number of Users*1 (Company programs that exceed regulatoryrequirements are underlined.)
Programs Outline Item UnitFY2016 FY2017 FY2018
Male Female Male Female Male Female
Parentalleave
Until the end ofApril immediatelyfollowing thechildʼs 3rd birthday(employees areallowed to changethe scheduled dateof reinstatement ifthey are unable toenroll theirchildren in anursery school)
Number ofusers
Persons 2 65 5 45 5 70
Percentagereturningto work*2
% 100 100 100 92 100 100

Shorterhours forparents ofsmallchildren
Flextime programavailable duringpregnancy anduntil the childcompletes the 6thgrade
Number ofusers
Persons 3 224 3 214 9 220
Nursingcare leave
Up to 3 years toprovide care for arelative within thesecond degree ofkinship
Number ofusers
Persons 0 4 0 1 2 0
Nursingcare work
Applicable to arelative within thesecond degree ofkinshipFlextimeprogram availableup to 3 years toprovide care
Number ofusers
Persons 0 3 0 2 0 3
Leave toaccompanypartner
For employeesaccompanying aspouse postedoverseas
Number ofusers
Persons 4 3 4
Communityserviceleave
Special paid leavefor up to 5 dayswithin 1 year
Cumulativenumber ofusers
Persons 48 58 61
Sabbaticalsystem
Commemorativegift and paid leavefor employees whoreach the ages of30, 35, 40 and 50
Number ofusers
Persons 514 673 509
*1 Data are for Tokyo Gas Co., Ltd.*2 Percentage of employees who completed parental leaves each fiscal year and those returned to work at the company.
■ Number of Employees Leaving the Company *1, 2, 3
Unit FY2016 FY2017 FY2018
Male(Percentage of employees leavingthe company)
Non-consolidated
Persons(%) *4
58 (0.86) 29 (0.43) 47 (0.72)
Consolidated - (-) 203 (-) 216 (1.88)
Female (Percentage of employees leavingthe company)
Non-consolidated 9 (0.85) 9 (0.79) 8 (0.68)
Consolidated - (-) 113 (-) 89 (3.71)
Total(Percentage of employees leavingthe company)
Non-consolidated 67 (0.86) 38 (0.49) 55 (0.71)
Consolidated - (-) 316 (-) 305 (2.19)
*1 Non-consolidated data are for Tokyo Gas employees (registered personnel).*2 Consolidated data exclude personnel on loan to Tokyo Gas and its subsidiaries from other organizations and include personnel on loan
from Tokyo Gas and its subsidiaries to other organizations.*3 Data in fiscal 2017 were revised.*4 The percentage of people leaving the company is calculated as follows: number of regular employees leaving for personal reasons (as of
March 31 of each fiscal year)/number of regular employees (as of April 1 of each fiscal year).

■ Number of Temporary and Contract Employees*1, 2
Unit FY2017 FY2018 FY2019
Contractemployees
Persons
1,728 1,670 1,495
Male 1,153 1,131 950
Female 575 539 545
Temporary employees 642 558 589
Total 2,370 2,228 2,084
*1 Data are for Tokyo Gas Co., Ltd.*2 Data are as of April 1 of each fiscal year.
■ Average Annual Salary*1, 2
Unit FY2016 FY2017 FY2018
Average annual salary 10,000 yen 640 636 657
*1 Data are for Tokyo Gas Co., Ltd.*2 Figures exclude the salary of personnel in management positions.
■ Average Overtime Hours*1
Unit FY2016 FY2017 FY2018
Average monthly overtime hours Hours/person 16.6 15.9 15.6
*1 Data are for Tokyo Gas Co., Ltd.
■ Days of Paid Leave Taken per Year*1
Unit FY2016 FY2017 FY2018
Days of paid leave taken per year Days/person 15.5 15.1 15.4
*1 Data are for Tokyo Gas Co., Ltd.*2 Data are as of the end of March of each fiscal year.
■ Number of Employees with Right to Collective Bargaining (Employees Excluding Management)*1, 2
Unit FY2016 FY2017 FY2018
Number of employees Persons 7,199 6,937 6,906
*1 Data are for Tokyo Gas Co., Ltd.*2 Data are as of the end of March of each fiscal year.
■ Average Annual Training Hours*1, 2
Unit FY2016 FY2017 FY2018
Average annual training hours Hours/person 18.2 13.5 12.0
*1 Data are for Tokyo Gas Co., Ltd.*2 Data on training provided by the Personnel Department (excludes training provided independently by other departments).

Implementation of Occupational Safety and HealthEducation Programs
■ Implementation of Occupational Safety and Health Education Programs*1
Details Unit FY2016 FY2017 FY2018
Level-specific training on safety andhealth and on safety planning
New employeetraining
Persons
291 252 206
Safety and healthtraining fornew managers
306 243 245
Statutory foreman training 156 151 146
Statutory training for safety administrators at the time ofappointment*2 41 36 40
Hygiene supervisor training 75 74 94
Traffic safety and driving training (for new drivers, personsinvolved in accidents and others)
898 789 747
Safe driving with attendant instructors utilizing drive recorders 795 798 853
Seminars on promoting health 2,510 2,731 1,452
*1 Data are for Tokyo Gas Co., Ltd.*2 Data are the results of the Tokyo Gas Group.
Overview of Accidents and Injuries
■ Change in Number of Work-related Injuries, Number of Traffic Accidents, Rate of Lost Work-timeInjuries, and Severity Rate*1
Unit FY2016 FY2017 FY2018
Work-related injuries*2
Cases23 38 36
Traffic accidents 141 134 142
Rate of lost work-time injuries*3, 5
-0.41 0.36 0.62
Severity rate*4, 5, 6 0.003 0.002 0.005
*1 Data are for regular and semi-regular employees of Tokyo Gas.*2 Includes accidents not resulting in lost worktime.*3 Rate of people taking work leave per 1 million total actual working hours.*4 Number of workdays lost as a result of accidents/injuries per 1,000 total actual working hours.*5 Includes injuries due to traffic accidents caused by others.*6 Lost workdays are counted based on standards placed by the Japanese Ministry of Health, Labour and Welfare.

Membership of the Board of Directors, Advisory Committee,Audit & Supervisory Board, and Corporate ExecutiveMeeting
UnitAs of theend of
June 2017
As of theend of
June 2018
As of theend of
June 2019
Board ofDirectors
Directors
Persons (Numberof femalemembers)
11 (1) 8 (1) 9 (2)
External 3 (1) 3 (1) 4 (2)
AdvisoryCommittee
Outside directors 2 2 2
Outside Audit &Supervisory Boardmembers
1 1 1
Director, Chairman ofthe Board
1 1 1
Director, President 1 1 1
Audit &SupervisoryBoard
Audit & SupervisoryBoard members
5 5 5
External 3 (1) 3 (1) 3 (1)
CorporateExecutiveMeeting
President and CEO*1 1 1 1
Executive VicePresidents*1
2 2 2
Senior ManagingExecutive Officer
- 2 2
Managing ExecutiveOfficer
11 6 (1) 7 (1)
Note: Data shown are for Tokyo Gas Co., Ltd.Note: External directors and external Audit & Supervisory Board members are independent officers.*1 Post is held concurrently by three representative directors.
CSR Data

Training and Consultation on Human Rights and Compliance
■ Participants in Training on Human Rights
Overview Unit FY2016 FY2017 FY2018
Level-specifictraining
Training upon entering the company,during the third year, and duringqualification promotions (two levels)
Numberof
persons
1,531 1,527 1,291
Workplaceworkshops
Practical training on topics selected byeach workplace
11,699 15,543 15,825
Trainingprogramsand follow-up forhuman rightspromotionleaders
First-time leader training (6 months)and follow-up training
225 353 344
Planning-type training
Human rights study sessions 380 350 285
Note: Data shown are for the Tokyo Gas Group.
■ Participants in Training on Compliance
Outline Unit FY2016 FY2017 FY2018
Level-specifictraining
Training upon entering the company,during the third year, and duringqualification promotions (two levels)
Numberof
persons
1,531 1,527 1,291
Workplaceworkshops
Training at the individual workplacelevel led by compliance promoters
25,136 28,726 32,796
Note: Data shown are for the Tokyo Gas Group.
■ Number of Cases Handled by Consultation Desks
Consultation Topics Unit FY2016 FY2017 FY2018
Interpersonal relations and harassment
Numberof
cases
71 58 51
Benefits and working hours 17 35 20
Internal regulations 7 7 11
Laws, regulations, and other matters 11 4 16
Total 106 104 98
Note: Data shown are for the Tokyo Gas Group.

Third-Party Independent Assurance Report
The social and environmental performance indicators (data on human resources and theenvironment)*1 provided in the Tokyo Gas Group Sustainability Report on this PDF have been third-party assured by KPMG AZSA Sustainability Co., Ltd. (a member of the KPMG Japan group) toenhance their credibility.We will work to further raise the standard of our CSR activities in the future, taking account of theissues pointed out in the course of the third-party assurance process and the reader feedbackreceived via our website and other channels.*1 Third-party assured content is indicated by a box next to the subject title.
■ Independent Assurance Report on the Tokyo Gas Group Sustainability Report
CSR Data