toledo feedstock optimization project - ohio …epa.ohio.gov/portals/27/pti_applications/permit...
TRANSCRIPT
BBPP ––HHUUSSKKYY RREEFFIINNIINNGG LLLLCC TTOOLLEEDDOO RREEFFIINNEERRYY
TTOOLLEEDDOO FFEEEEDDSSTTOOCCKK OOPPTTIIMMIIZZAATTIIOONN PPRROOJJEECCTT
PPEERRMMIITT--TTOO--IINNSSTTAALLLL AAPPPPLLIICCAATTIIOONN
Prepared for:
Toledo Refinery 4001 Cedar Point Road
Oregon, Ohio 43616
Prepared by:
URS Corporation Waterfront Plaza Tower One
325 West Main Street Suite 1200 Louisville, Kentucky 40202-4251
URS Project No. 41917214
October 19, 2012
BBPP –– HHUUSSKKYY RREEFFIINNIINNGG LLLLCC TTOOLLEEDDOO RREEFFIINNEERRYY TTOOLLEEDDOO FFEEEESSTTOOCCKK OOPPTTIIMMIIZZAATTIIOONN ((TTFFOO)) PPRROOJJEECCTT
PPEERRMMIITT--TTOO--IINNSSTTAALLLL AAPPPPLLIICCAATTIIOONN
Prepared For: Allen Ellett BP - Husky Refining LLC. Toledo Refinery 4001 Cedar Point Road Oregon, Ohio 43616 Ph. 419-697-6064 Prepared by:
URS Corporation Waterfront Plaza Tower One 325 West Main Street Suite 1200 Louisville, Kentucky 40202-4251 Ph. 502-569-2301 URS Project No. 41917214 This document was prepared and reviewed by the following key URS Personnel:
Project Manager Date: October 19, 2012 Mary Stuart Peace, P.E. Principal In Charge Date: October 19, 2012
Todd P. Royer, P.E.
Toledo Feedstock Optimization PTIO Application
BPH TFO Application i 10/19/2012 41917214 1 TFO Application Text 10-19-12
Table of Contents Page
EXECUTIVE SUMMARY ........................................................................................... 1
1.0 PROJECT DESCRIPTION ....................................................................................1-1
1.1 Crude/Vacuum 1 Unit & Heaters (P011, B015, B031) ......................................1-1
1.2 Coker 3 Process Unit (P036), Coker 3 heater (B032) ........................................1-1
1.3 ADHT Process Unit and Heater (P028, B029)...................................................1-2
1.4 BGOT Process Unit (P029) ...............................................................................1-3
1.5 Sewer/Waste Water Treatment System .............................................................1-3
1.6 Shutdown/Replaced Emission Units ..................................................................1-3
1.7 Other Affected but Unmodified Emission Units ................................................1-3
1.7.1 Coke Handling (F002, F005, F006) ................................................... 1-4
1.7.2 SRUs (P009, P037)............................................................................ 1-4
1.7.3 Alstom Boilers (B034, B035) ............................................................ 1-4
1.7.4 Refinery Hydrocarbon Flare System .................................................. 1-4
1.7.5 Tankage............................................................................................. 1-5
1.7.6 Cooling Tower .................................................................................. 1-5
2.0 EMISSIONS SUMMARY ..............................................................................2-1
2.1 Projected Emissions from New Emission Units .................................................2-1
New Crude 1 and Vacuum 1 Heaters ............................................................. 2-1
2.2 Emissions from the Shutdown Emission Units ..................................................2-2
Existing Crude 1 (B015) and Vacuum 1 (B031) Heaters ............................... 2-2
2.3 Projected Emissions from Modified Emission Units ..........................................2-2
2.3.1 Coker 3 (P036) Coke Drum Venting/Cutting/Draining ...................... 2-2
2.3.2 Particulate emissions from Coke handling (F005), Crushing (F006), and Temporary Coke Pile (F002) ...................................................... 2-3
2.3.3 Fugitive Equipment Leak Emissions from Coker 3 (P036), CV1 (P011), and ADHT (P028) Units ....................................................... 2-5
2.3.4 Sewer/WWT (P025) .......................................................................... 2-6
2.4 Projected Emission Increases from Unmodified but Affected Units...................2-6
2.4.1 Coker 3 (B032) & ADHT (B029) heaters .......................................... 2-6
2.4.2 Increase in Steam Demand (B034 & B035 – East & West Alstom Boilers) ............................................................................................. 2-7
2.4.3 Sulfur Recovery Units: SRU1 (P009) and SRU2&3 (P037) ............... 2-7
2.4.4 Tankage............................................................................................. 2-8
2.4.6 Cooling Tower .................................................................................. 2-9
3.0 APPLICABLE REGULATIONS ...................................................................3-1
3.1 NSPS Subpart Ja ...............................................................................................3-1
3.1.1 New Heaters Subject to NSPS Ja ....................................................... 3-1
3.1.3 Coker 3 Process Unit (P036) Subject to NSPS Ja ............................... 3-2
3.2 NSPS Subpart GGGa - Standards for Equipment Leaks ....................................3-2
Toledo Feedstock Optimization PTIO Application
BPH TFO Application ii 10/19/2012 41917214 1 TFO Application Text 10-19-12
3.3 NSPS Subpart NNN - Standards of Performance for Volatile Organic Compound (VOC) Emissions from Synthetic Organic Chemical Manufacturing Industry (SOCMI) Distillation Operations ......................................................................3-3
3.4 40 CFR Subpart CC—National Emission Standards for Hazardous Air Pollutants from Petroleum Refineries ................................................................................3-3
3.5 40 CFR Subpart DDDDD — National Emission Standards for Hazardous Air Pollutants for Major Sources: Industrial, Commercial, and Institutional Boilers and Process Heaters ..........................................................................................3-3
3.6 40 CFR Part 51 and 52 New Source Review and Prevention of Significant Deterioration (NSR/PSD)..................................................................................3-4
3.7 Ohio Permitting Regulations .............................................................................3-5
3.7.1 OAC rule 3745-31-05 Ohio Best Available Technology (BAT) ......... 3-5
3.7.2 OAC rule 3745-21-09(T) Leaks from petroleum refinery equipment . 3-5
3.7.3 OAC rule 3745-109 (Clean Air Interstate Rule) ................................. 3-6
3.7.5 OAC Rule 3745-114 (Air Toxics) ...................................................... 3-6
4.0 NEW SOURCE REVIEW FOR ATTAINMENT AND NON-ATTAINMENT AREAS (NSR/PSD).........................................................................................4-8
4.1 Contemporaneous Increases and Decreases ..................................................... 4-10
4.2 Project Creditable SO2 Emissions Decreases from Fuel Gas TRS Reduction (Modified Coker Gas Plant) ............................................................................ 4-13
4.3 Other Proposed Permit Condition Changes ..................................................... 4-14
5.0 BEST AVAILABLE TECHNOLOGY (BAT) ...............................................5-1
5.1 BAT for NOx from Refinery Heaters .................................................................5-3
Step 1 – Identify All Control Technologies ................................................... 5-3
A description of each technology and its potential application to the proposed heaters is included in the following section. ....................... 5-6
Step 2 – Eliminate Technically Infeasible Options ........................................ 5-6
Step 3 – Rank Remaining Control Technologies by Control Effectiveness .... 5-8
Step 4 - Evaluate Most Effective Controls and Document Results ................. 5-9
Step 5 – Select BAT for NOx Control .......................................................... 5-11
5.2 BAT for SO2 from Refinery Heaters ............................................................... 5-11
5.3 BAT for CO from Refinery Heaters ................................................................ 5-13
5.4 BAT for VOC from Refinery Heaters ............................................................. 5-16
5.5 BAT for PM/PM10/PM2.5 from Refinery Heaters ............................................. 5-16
5.6 BAT for VOC from Coker 3 Coke Drum Vent ................................................ 5-16
5.7 BAT for VOC from Fugitive Equipment Leaks (Coker 3, CV1, AHDT Units) 5-17
6.0 PERMIT APPLICATION FORMS ...............................................................6-1
Toledo Feedstock Optimization PTIO Application
BPH TFO Application iii 10/19/2012 41917214 1 TFO Application Text 10-19-12
Appendices
Appendix A Emission Calculations Appendix B Air Quality Analysis Appendix C BAT Cost Calculations Appendix D New Source Review Issues for Project Aggregation Appendix E GHG BACT Analysis Appendix F Refinery Fuel Gas Total Reduced Sulfur (TRS) Data Appendix G Proposed Interim Group SO2 Limit
Toledo Feedstock Optimization PTIO Application
BPH TFO Application iv 10/19/2012 41917214 1 TFO Application Text 10-19-12
List of Acronyms ADHT A-Diesel Hydrotreater (a refinery process unit) AP-42 Compilation of Air Pollutant Emission Factors, Volume 1: Stationary
Point and Area Sources BACT Best Available Control Technology BAT Best Available Technology bbl barrels BGOT B-Gas Oil Hydrotreater (a refinery process unit) CEM Continuous emissions monitor CFR Code of Federal Regulations FCCU Fluid Catalytic Cracking Unit HAP Hazardous air pollutant hr hour kbpd kilo (thousand) barrels per day lb pounds LAER Lowest Achievable Emission Rate LDAR leak detection and repair MACT Maximum Available Control Technology (40 CFR Part 63) NHT Naphtha Hydrotreater (a refinery process unit) NSPS New Source Performance Standard (40 CFR Part 60) NSR New Source Review OEPA Ohio Environmental Protection Agency PM Particulate Matter PSD Prevention of Significant Deterioration PTI Permit To Install RACT Reasonably Available Control Technology TAN Total Acid Number (measure of acidity of crude oil) tpy tons per year TFO Toledo Feedstock Optimization U.S. EPA United States Environmental Protection Agency VOC volatile organic compounds
Toledo Feedstock Optimization PTIO Application
BPH TFO Application v 10/19/2012 41917214 1 TFO Application Text 10-19-12
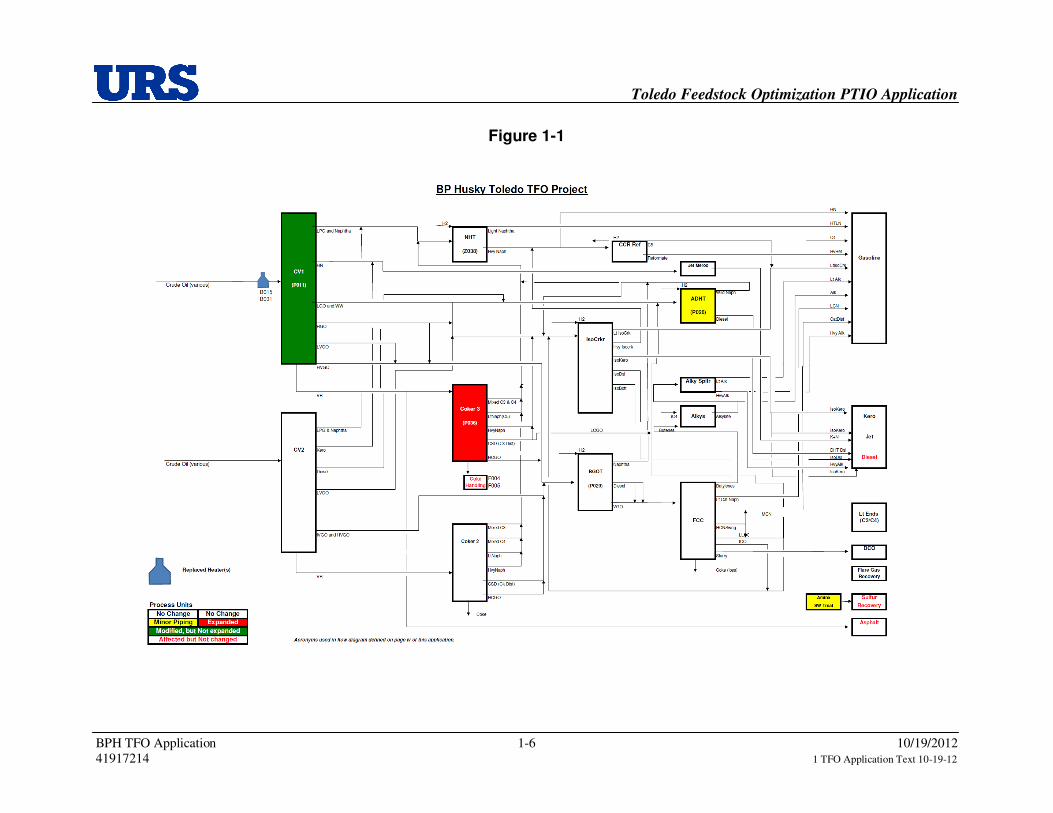
List of Acronyms on Flow Diagram Process Units ADHT A-Diesel Hydrotreater Unit BGOT B-Gas Oil Hydrotreater Unit CV1 Crude Vacuum 1 Unit CV2 Crude Vacuum 2 Unit CKR Coker Unit NHT Naphtha Hydrotreater Unit FCC Fluid Catalytic Cracker Unit ALKY Alkylation Unit IsoCrkr IsoCracker Unit CCR Ref Continuous Catalytic Reformer Process Streams LPG Liquid Petroleum Gas HN Heavy Naphtha LGO Light Gas Oil HGO Heavy Gas Oil VGO Virgin Gas Oil LVGO Light Virgin Gas Oil IVGO Intermediate Virgin Gas Oil HVGO Heavy Virgin Gas Oil WW Water White VR Vacuum Residuum ALK Alkylate Kero Kerosene Naph Naphtha CSD Coker Distillate LCN Light Cat Naphtha MCN Medium Cat Naphtha HCN Heavy Cat Naphtha DSL Diesel DCO Decant Oil SW Sour Water REF Reformate H2 Hydrogen C3, C4, etc Propane, Butane, etc. iC4 Isobutane
Toledo Feedstock Optimization PTIO Application
BPH TFO Application 1 10/19/2012 41917214 1 TFO Application Text 10-19-12
Executive Summary
BP-Husky Refining LLC (BPH) Toledo Refinery is proposing some modifications
to the existing refinery to increase the flexibility to process a higher percentage of crude
oil feedstocks similar to that which will soon be available from BPH’s Sunrise oil field
development in Canada. This project is called the Toledo Feedstock Optimization (TFO)
Project.
This project will not increase the BPH refinery’s overall crude capacity. Nor is it
intended to increase the amount of Canadian crudes relative to what is currently being
processed at the Refinery. TFO simply allows the flexibility to substitute BPH’s own
Sunrise Canadian crude or other somewhat more corrosive crude oil feedstocks for the
Canadian crude oils being processed today.
The TFO project will replace the existing heaters in the Crude Vacuum 1 process
unit (P011) and upgrade the metallurgy of that unit. It also includes changes to the Coker
3 process unit (P036) to reduce the coke drum cycle time, and a modification to the Coker
gas plant to improve light ends recovery and reduce total sulfur compounds in the fuel gas
that is combusted in the refinery. Finally, minor piping changes will be required in the
following process units: Crude Vac 1 (P011); A-Diesel Hydrotreater (ADHT) (P028); B-
Gas Oil Hydrotreater (BGOT) (P029); and Coker 3 (P036). The proposed project will not
significantly increase emissions of any conventional pollutant when considered with
contemporaneous and creditable increases and decreases at the facility. The project will,
however, trigger Prevention of Significant Deterioration (PSD) pre-construction review
for GHGs. A PSD BACT evaluation for GHGs is included in Appendix E of this
application.
Further details of the project description are provided in Section 1 of this permit
application. Overall project emissions are summarized in Section 2. Applicable
regulations and PSD discussion are described in Sections 3 and 4 respectively. The Ohio
BAT Analysis is included as Section 5 and GHG BACT is included in Appendix E.
Details of emissions calculations are included as Appendix A. Additional appendices
contain other supporting information.

Toledo Feedstock Optimization PTIO Application
BPH TFO Application 1-1 10/19/2012 41917214 1 TFO Application Text 10-19-12
1.0 Project Description
This TFO Project application is for a permit to install and operate (PTIO) to allow
the BPH Toledo Refinery to install and operate the new and modified existing equipment
to allow the flexibility to process crude oils originating in the BPH Sunrise fields in
Canada, or other crude oils having similar characteristics. In addition to the new and
modified equipment, some downstream process units and other refinery infrastructure
units, although not physically modified, will have increased utilization. Each of these
proposed changes and potential impacts are described in detail below.
A block process flow diagram of the refinery showing the major components of the
project is shown as Figure 1-1 at the end of this section.
1.1 Crude/Vacuum 1 Unit & Heaters (P011, B015, B031)
Processing higher quantities of Sunrise crudes will require metallurgical upgrades
in several portions of the Crude/Vacuum 1 (CV1) process unit. BPH proposes to replace
the Crude 1 and Vacuum 1 heaters (B015 & B031) and make metallurgy improvements to
the distillation towers and some piping that will enable the CV1 (P011) Unit to process the
new somewhat more corrosive crude oils. These improvements will include two new
Crude 1 heaters with a combined rating of 450 MMBtu/hr and a new Vacuum 1 Heater
rated at 150 MMBtu/hr. In addition, the project will add heat exchangers and new
desalters to improve unit operability and reliability with the new crudes.
Emissions impacts from these changes to the CV1 unit are:
• Potential increase in fugitive emissions from piping components; and
• Slight net increase in emissions of NSR regulated pollutants resulting from
the shutdown of Crude 1 heater (B015) and Vacuum 1 heater (B031); and
the start-up of the replacements for those heaters,.
1.2 Coker 3 Process Unit (P036), Coker 3 heater (B032)
BPH will also make physical changes to the Coker 3 process unit (P036). Changes
to the coke drum blowdown system will decrease the cycle time from approximately 16.5
hours to 14 hours so that more coker feed can be processed with the existing system.
While short-term emissions will not increase, annual emissions from coke drum venting
and cutting will increase due to a greater number of cycles per year. The increased
Toledo Feedstock Optimization PTIO Application
BPH TFO Application 1-2 10/19/2012 41917214 1 TFO Application Text 10-19-12
throughput capacity of the Coker 3 unit is expected to be nominally 33 thousand barrels
per day (KB/D), which is an increase from a current capacity of approximately 28 KB/D.
The project also may include adding an additional coke cutting water tank to increase
storage capacity for water used to hydroblast the coke from the coke drum. This tank
would not increase emissions.
The Coker 3 Heater (B032) capacity and burner characteristics will not be affected
by these changes. While the annual utilization of this heater may increase because of
higher Coker 3 feed rates, the heater will not be physically modified and its maximum
potential or allowable emissions will not increase. Therefore, the Coker 3 Heater (B032)
is not considered to be “modified” in the context of NSPS, BAT or BACT.
Modifications to the existing Coker gas plant will improve separation and recovery
of light hydrocarbons and organic sulfur compounds from both of the existing Coker units
(Coker 2 (P017) and Coker 3 (P036)) before the gas is sent to the refinery fuel gas system.
These changes will reduce the concentration of organic sulfur compounds in the refinery
fuel gas system and will result in a decrease in SO2 emissions from many refinery heaters.
As discussed in Section 4.3 of this permit application, BPH is requesting new lower
enforceable permit limits on SO2 from several of the refinery’s heaters consistent with this
planned improved SO2 performance.
Emissions impacts from these changes to the Coker 3 unit (P036) are:
• Potential increase in fugitive emissions from new piping components;
• Increased actual Coker 3 heater firing (B032);
• Increased coke drum venting and cutting emissions; and
• Decreased SO2 from refinery heaters discussed separately.
1.3 ADHT Process Unit and Heater (P028, B029)
The “A” Diesel Hydrotreater (ADHT) process unit (P028) will be modified to add
more heat exchangers, amine contactors, and wash water pumps. These changes will
allow more extensive hydrotreating of the diesel needed due to higher concentrations of
ammonia, nitrogen and nitrogen compounds in the new crudes. The capacity of the unit
will not change as a result of these changes. The unit is currently capable of processing
approximately 21 KB/D. The small ADHT (B029) heater will not be modified. Unit feed
rates and heater firing are not expected to increase appreciably due to this project.
Toledo Feedstock Optimization PTIO Application
BPH TFO Application 1-3 10/19/2012 41917214 1 TFO Application Text 10-19-12
However, for conservatism, heater firing rates are assumed to increase to its permitted
allowable limit.
The possible emissions impacts from these changes are:
• Potential increase in fugitive emissions from new piping components; and
• Potential increased existing ADHT heater (B029) firing.
1.4 BGOT Process Unit (P029)
The B Gas Oil Hydrotreater (BGOT) Unit (P029) will have new wash water pumps
installed to allow higher wash water for use with the somewhat more corrosive crude oil
feedstocks from the Sunrise Oil fields in Canada. No emission impacts result from this
change. The new wash water pump piping will not contain VOC and will not be a source
of increased fugitive emissions. The capacity of the BGOT unit will not be changed in any
way. Neither will the TFO project increase the actual process feed rates or heater firing.
1.5 Sewer/Waste Water Treatment System
A few new oily water sewer drain systems will be installed in some of the areas
impacted by the above described changes. The emissions from these have been included
in the project increases.
1.6 Shutdown/Replaced Emission Units
As mentioned previously, the existing Crude 1 Heater (B015)(325 MMBtu/hr) and
the Vacuum 1 Heater (B031)(130 MMBtu/hr) will be shutdown/replaced as part of the
proposed TFO project. Each of these heaters will be replaced with new state-of-the-art
refinery process heaters in the same service providing the same function as the existing
heaters.
1.7 Other Affected but Unmodified Emission Units
The project will result in increased utilization of several other emission units at the
refinery. These units are not being physically modified or undergoing a change in the
method of operation as a result of this project. The proposed project may, however,
increase utilization and emissions due to the alternate crude feed material. These impacts
are discussed in the following sections.
Toledo Feedstock Optimization PTIO Application
BPH TFO Application 1-4 10/19/2012 41917214 1 TFO Application Text 10-19-12
1.7.1 Coke Handling (F002, F005, F006)
There will not be any physical changes made to the coke handling system that
would result in emission increases; however, the amount of coke processed through the
handling system is expected to increase due to the reduced cycle time in Coker 3. This
increase in unit throughput will increase coke production rate which increases the
particulate emissions from the downstream Coke Crushing (F006), Handling (F005) and
potentially the temporary coke storage pile (F002) operations.
1.7.2 SRUs (P009, P037)
The Sulfur Recovery Units (SRUs) will not be modified; however, the other
modifications in the TFO project allow the refinery to process additional types of crudes
that could potentially increase the sulfur load to the SRUs. Since the TFO project does not
include any modifications to the SRUs, and because they are already running close to their
capacity, emissions increases from possible increased sulfur load should be modest.
Potential SRU emission increases are estimated by assuming their loading is increased to
the SRUs unit’s current capacity. BPH proposes a new annual SO2 limit on the combined
emissions of both SRU units that represents the maximum potential emissions at full load.
The difference between this limit and the SRU’s baseline actual emissions is included in
the estimated project increases.
1.7.3 Alstom Boilers (B034, B035)
The TFO project is expected to result in a modest increase in steam demand,
predominantly from increased steam needed by the modified Coker gas plant.
Accordingly, the emissions resulting from additional firing of the refinery boilers have
been included in the estimated project increases.
1.7.4 Refinery Hydrocarbon Flare System
Flaring emissions at the refinery will not increase as a result of the TFO project. In
fact, flaring is expected to be reduced, although credit is not being taken for this reduction.
The primary project scope element associated with flaring is a change to the Coke drum
blowdown process.
During the normal coking operation, the gas from the coke drums is routed to the
Coker Bubble Tower for capture and treatment before being introduced to the refinery fuel
gas system. When a coke drum is taken offline for coke removal, the current practice is to
route the gas from the coke drum to the flare gas recovery compressors where the gas is
Toledo Feedstock Optimization PTIO Application
BPH TFO Application 1-5 10/19/2012 41917214 1 TFO Application Text 10-19-12
captured and routed through the Coker Wet Gas Compressor before being introduced into
the fuel gas system. This practice begins shortly after the steaming of the coke drum
commences, when the drum pressure is approximately 45 psig, and continues until the
drum is depressured to the point where it can be opened to the atmosphere, usually
between 3 and 4 psig. Utilization of the flare gas recovery system to depressure the coke
drum occurs for approximately four hours and repeats during each coke drum cycle.
The TFO project will add additional equipment and change the routing of the coker
blowdown in order to divert Coker blowdown gas from the flare gas recovery system and
ensure that flare emissions will not increase as a result of the TFO project. Under the new
process configuration, the coke drums initially will be depressured through steam eductors
directly to the Coker Wet Gas Compressor, bypassing the flare gas recovery compressors.
By utilizing this alternative processing route for the coker blowdown gas, BPH will free
up a significant amount of the available flare gas recovery capability during these
blowdown periods. This process change will enable the existing flare gas recovery system
to recover additional gas from the flare header at times when the gas otherwise may have
been vented to the flare. In this manner, the proposed change to the coker blowdown
process will reduce flare emissions. Although the vacuum eductors will be the primary
means to reduce the pressure in the coke drums, BPH will retain the blowdown connection
to the flare gas recovery compressor suction.
1.7.5 Tankage
A slight increase in the throughput to diesel storage tanks has been estimated to
account for potential diesel production increases related to the project.
1.7.6 Cooling Tower
With the proposed changes at Coker 3, it is anticipated that additional cooling
water circulation may be needed, especially in the hot summer months. An incremental
increase of 10,000 gallons per minute of circulation rate in the existing cooling towers is
conservatively assumed and results in a small amount of additional particulate and VOC
emissions.
Toledo Feedstock Optimization PTIO Application
BPH TFO Application 1-6 10/19/2012 41917214 1 TFO Application Text 10-19-12
Figure 1-1
Toledo Feedstock Optimization PTIO Application
BPH TFO Application 2-1 10/19/2012 41917214 1 TFO Application Text 10-19-12
2.0 Emissions Summary
This section provides a brief summary of the basis of the emissions calculations.
Detailed calculations are provided in Appendix A of this application. Also, a table
summarizing all the emissions increases and decreases resulting from the TFO project is
presented at the end of Section 2 in Table 2-1. Past actual baseline emissions for existing
affected emission units are based on the 24 month baseline period of calendar years 2004
and 2005.
2.1 Projected Emissions from New Emission Units
New Crude 1 and Vacuum 1 Heaters
There are three new heaters included in the TFO project scope. The existing
Crude 1 heater (B015) will be replaced by two new 225 MMBtu/hr (HHV) heaters. The
existing Vacuum 1 heater (B031) will be replaced with a new Vacuum 1 heater rated at
150 MMBtu/hr (HHV). Project emissions from these heaters are based on their
maximum emissions potential at their design nameplate capacity of each heater in
MMBtu/hr. EPA AP-42 factors from Chapter 1.4, Natural Gas Combustion, July 1998
version were used to estimate emissions of VOC, PM/PM10/PM2.5, lead, and combustion
HAPs. Emissions of Green House Gases (GHG) expressed as CO2e were estimated
based on site-specific fuel carbon content and the methodology from the Mandatory GHG
Rule, 40 CFR Part 98 Subpart C. Emissions of CO, NOx, SO2, and H2SO4 were
estimated using the following assumptions:
• Conservative engineering estimate of 0.06 lb CO/MMBtu (approx. 84
ppmvd CO @ 3% O2) – based on the BAT determination in Section 5 of
this application;
• NOx emissions are based on NSPS Ja NOx requirement of 0.04 lb/MMBtu
NOx which is also determined to be BAT (see Section 5 of this
application);
• Annual SO2 emissions (tons/yr) are based on an annual average
concentration of 70 ppmv total sulfur in refinery fuel gas.
• H2SO4 is based on 3% of SO2 emissions converting to SO3 and total
conversion of SO3 to H2SO4.
Toledo Feedstock Optimization PTIO Application
BPH TFO Application 2-2 10/19/2012 41917214 1 TFO Application Text 10-19-12
Note: The above specified basis for future maximum annual SO2 emission from
these heaters represents the anticipated maximum sulfur levels after the TFO project is
fully implemented. However, due to practical project execution constraints,
implementation of the planned refinery fuel gas sulfur improvements cannot be fully in
place immediately upon the startup of the first TFO scope items that may increase SO2
emissions. During the interim period between TFO startup and completion of those
improvements, notably the modified Coker gas plant, BPH proposes an interim group
SO2 emission limits and other requirements that will assure that no significant net SO2
emissions increase will occur. Details of the proposed interim SO2 group limit are
discussed in Section 4.3 (PSD netting) and Appendix G. This is also applicable to the
other project affected process heater SO2 emissions listed in this application.
2.2 Emissions from the Shutdown Emission Units
Existing Crude 1 (B015) and Vacuum 1 (B031) Heaters
The amount of the creditable emissions decrease for the shutdown of these heaters
was estimated using the actual firing rate during the baseline period (2004-2005) and AP-
42 emission factors for CO, VOC and PM10/PM2.5. For NOx emissions, stack test data
was available and was used for the Crude 1 heater (B015). No stack testing has been
performed on the smaller Vacuum 1 heater (B031), so the NOx emission factor specified
for low NOx burners in the compliance determination for compliance with the NOx limit
for these heaters in the PTI 04-0959 issued 5/30/2006 and the Title V was used. That
NOx factor (0.07 lb NOx/MMBtu) is consistent with low NOx burner performance for the
vintage of this heater’s burners. Tested recent actual total sulfur composition of the BPH
refinery fuel gas was used to estimate past actual SO2 emissions.
2.3 Projected Emissions from Modified Emission Units
2.3.1 Coker 3 (P036) Coke Drum Venting/Cutting/Draining
There are three batch steps that can generate emissions from the delayed coking
units; venting, cutting, and draining. During the delayed coker operating cycle, the vast
majority of the vapors from the coke drum are routed to a closed blowdown system with
no emissions.
The first emissions event from the coke drums occurs when the coke drum is
vented to the atmosphere after the coke drum is depressured to its set point. At this point,

Toledo Feedstock Optimization PTIO Application
BPH TFO Application 2-3 10/19/2012 41917214 1 TFO Application Text 10-19-12
residual vapors from the coke drum are released to the atmosphere to allow the drum to
be opened for coke removal. The amount of gas vented from the delayed coking unit
during this final depressurization step has been estimated using an enthalpy balance and
the resulting emissions are calculated based on the concentration of each pollutant
measured during the July 2011 stack test of the BPH Coker 3 unit (particulate, CH4, CO,
VOC, H2S). The size of the drums, mass of coke, the resulting void space in the drums,
and temperature and pressure at venting were all used to estimate the total flow rate of the
vented gas per venting event. Past actual baseline emissions are estimated based on the
actual number of venting events (drum cycles) in the baseline period and assumed
venting at 3 psig (the average past venting pressure). Future emissions are based on a
new coke drum cycle of 14 hrs, resulting in 626 venting events per year (8760 hrs/yr
divided by 14 hrs per cycle) and venting at a new lower pressure of 2 psig. BPH is
requesting an enforceable requirement to reduce the Coker 3 drum pressure to not more
than 2 psig before venting to the atmosphere to satisfy BAT.
The next step in the de-coking process involves removing the coke from the
drums using a high pressure water stream. Coke cutting emissions of VOC, H2S, CO,
CH4, and CO2 are estimated using an enthalpy balance to calculate the amount of water
that is vaporized based on the heat contained in the coke. Emissions are estimated based
on the concentration of constituents present.
Lastly, emissions are calculated from the evaporation of trace VOC and H2S in
the cutting water after it drains from the coke drums. These estimates are based on VOC
and H2S concentration data obtained at Toledo and a mass balance of water through the
process.
2.3.2 Particulate emissions from Coke handling (F005), Crushing (F006), and
Temporary Coke Pile (F002)
The changes planned at the Coker 3 (P036) process unit are anticipated to
increase petroleum coke production. An increase in coke production could cause an
increase in particulate emissions from the downstream processes from Coke Handling
(F005), Coke Crushing (F006), and the temporary Coke Storage Piles (F002) at the
refinery. Future potential emissions are based on an increase of coke production to a new
rate of 2300 ton per day, which is significantly above current coke production rates but it
is consistent with the throughput used as the basis for the existing allowable emissions
Toledo Feedstock Optimization PTIO Application
BPH TFO Application 2-4 10/19/2012 41917214 1 TFO Application Text 10-19-12
limits from these units established in PTI 04-01471 (Delta Valve permit). Estimated
emissions occur from several steps in the handling process as discussed below.
The coke handling emissions (F005) include coke that has been removed from the
Coke drums and forms a pile in the coke pit. Wind erosion from the pit coke pile is
estimated using Equation 4 from Section 2.1.2 (Aggregate Storage Piles) of the RACM
document. No control efficiency credit for the partial enclosure of the pit is assumed in
the calculation. All of the coke is removed from the pile with a clamshell crane and
dropped into the inlet chute of a crusher. Emissions from this transfer operation are
estimated using the equation from AP-42 Section 13.2.4.3 (11/06) for aggregate drop
operations. Additionally, it is assumed that 25% of the coke is re-handled once to
manage the pile (i.e.; one additional drop operation). These operations take place in the
pit, but no control credit is taken for the partial enclosure of the pit. Dust generated by
movement of the clamshell crane around the pit to access all the coke has been estimated
using AP-42 Section 13.2.2 (11/06) for vehicle traffic on unpaved surfaces at industrial
sites.
The coke crusher (F006) is assumed to process 100% of the coke production from
Coker 3. The crushing operation takes place inside an enclosed crusher. Emissions from
coke crushing are based on the factor for the primary crushing of coal from Table 2.19-2
of Ohio EPA's Reasonably Available Control Measures for Fugitive Dust document
(August 1983, page 2-431) and an estimated 70% control for the process enclosure.
From the crusher, the coke is dropped onto a conveyor belt which transports it to
an offsite customer (Toledo Edison who operates a coke fired boiler near the refinery.)
There are two drop operations (transfer points) on the conveyor, one loading it onto the
conveyor and one midway along the conveyor route. These emissions are part of the
handling operations (F005) and are estimated using the equation from AP-42 Section
13.2.4.3 (11/06) for drop operations. The conveyor and drop points are partially enclosed
and a control effectiveness of 70% has been assumed.
The process steps described above represent the normal handling and crushing
processes for Coker 3 coke. Occasionally, due to off spec product, conveyor downtime
or operating problems at Toledo Edison, it is necessary to divert some of the coke
production to a temporary storage pile (F002). Emissions from this occasional activity
Toledo Feedstock Optimization PTIO Application
BPH TFO Application 2-5 10/19/2012 41917214 1 TFO Application Text 10-19-12
are calculated assuming that 5% of the Coker 3 coke requires these additional/alternative
handling steps.
The coke which is transported to the temporary pile is loaded by the clamshell
crane into haul trucks. The emissions from this loading are already covered by the
estimated emissions from assuming all coke is loaded into the crusher inlet chute because
all of the coke goes one place or the other. Both activities represent uncontrolled drop
operations with equivalent emissions.
The roadway dust emitted by the haul truck traffic to and from the pile is
estimated using AP-42 Section 13.2.1 (1/11) for vehicle traffic on paved surfaces at
industrial sites. No natural mitigation or additional control efficiency is assumed.
Emissions from the roadway dust from movement of a front-end loader used to manage
the temporary storage pile is estimated using AP-42 Section 13.2.2 (11/06) for vehicle
traffic on unpaved surfaces at industrial sites.
Finally, emissions from wind erosion of material in the temporary coke storage
pile are estimated using Equation 4 from Section 2.1.2 (Aggregate Storage Piles) of the
RACM document taking no credit for any controls. Load into and out of the temporary
storage pile is estimated using the equation from AP-42 Section 13.2.4.3 (11/06) for
aggregate drop operations. Details of the coke handling, coke crushing, and temporary
coke storage pile emissions are included in Appendix A.
2.3.3 Fugitive Equipment Leak Emissions from Coker 3 (P036), CV1 (P011),
and ADHT (P028) Units
Fugitive emissions from piping component leakage are estimating using EPA
correlation equations for monitored equipment and average leak factors for unmonitored
equipment from the EPA Protocol document EPA-453/R-95-017, November 1995 (EPA
Protocol) for refineries. Correlation equations use an assumed leak rate based on past
experience at the BPH Toledo refinery which has an existing Leak Detection and Repair
(LDAR) program in place. New piping component counts are estimated from
preliminary piping and instrumentation drawings (PIDs) for the new equipment or for
similar processes. VOC estimates assume that piping contains 100% VOC. These are
conservative estimates since BPH plans on using new valves and packing that are low
leaking provided they are commercially available.
Toledo Feedstock Optimization PTIO Application
BPH TFO Application 2-6 10/19/2012 41917214 1 TFO Application Text 10-19-12
The only fugitive equipment leaks of GHG emissions will be methane component of the
new fugitive leaks from the light ends fractionation equipment in the modified Coker gas
plant. GHG emissions are estimated from this equipment assuming the piping contains
32.8 weight % methane which is an engineering estimate of the maximum methane
content of the process streams in that equipment. GHG emissions from fugitive leaks for
the other TFO piping changes are insignificant because the other modified piping will not
contain significant quantities of GHGs. The modified piping in other parts of the project
contains mainly crude oil, distillate, naphtha, gas oil and similar non-GHG hydrocarbons.
2.3.4 Sewer/WWT (P025)
The TFO project scope includes some new or modified individual drain systems.
The design of these new components will be controlled to meet 40 CFR 60, Subpart QQQ
control requirements. Emissions from the new applicable components with the potential
of VOC emissions are estimated using AP-42 factors from Chapter 5.1 and factors
presented in the NSPS QQQ Background Information Document.
2.4 Projected Emission Increases from Unmodified but Affected Units
Emissions from existing process units that are not modified, but may be affected
(i.e.; increased utilization) by the proposed changes have been estimated.
2.4.1 Coker 3 (B032) & ADHT (B029) heaters
Project scope includes changes at the Coker 3 and ADHT process units that could
cause increased firing rates over past actual at these heaters. Future potential emissions
from these heaters are based on the nameplate firing capacity of each heater in
MMBtu/hr. EPA AP-42 factors from Chapter 1.4, Natural Gas Combustion, July 1998
version were used to estimate emissions of VOC, PM/PM10/PM2.5, CO, Lead, and
combustion HAPs. Emissions of Green House Gases (GHG) expressed as CO2e were
estimated based on refinery site-specific fuel carbon content and the methodology
outlined in EPA’s Mandatory GHG Rule from 40 CFR Part 98 Subpart C. Emissions of
NOx, SO2, and H2SO4 were estimated using the following assumptions:
• Coker 3 (B032) NOx emission factors are based on the stack test
performed 8/17/1999;
Toledo Feedstock Optimization PTIO Application
BPH TFO Application 2-7 10/19/2012 41917214 1 TFO Application Text 10-19-12
• ADHT (B029) NOx emission factor is based on the low-NOx burner
emission factor specified for compliance determination with this heater’s
NOx limits in PTI 04-00708 (1992) and the current Title V permit;
• Past actual SO2 emissions are based on the average concentration of TRS
(ppmv) in refinery fuel gas mix drum (ESMD (235 ppm TRS) for ADHT);
(EPA Contactor (367 ppm TRS) for Coker 3) from BP-Husky Toledo
refinery testing1.
• Future potential annual SO2 emissions are based on an annual average
concentration of 70 ppmv total sulfur in refinery fuel gas.
• H2SO4 based on 3% of SO2 emissions convert to SO3 and total conversion
of SO3 to H2SO4.
2.4.2 Increase in Steam Demand (B034 & B035 – East & West Alstom
Boilers)
The TFO Project is expected to increase steam demand in the refinery by an
estimated 62 MMBtu/hr (HHV). This increase is within the capacity of the existing
boilers. As an "infrastructure" or “support” element of the refinery operations, the
relevant boiler emissions for the permitting this project are the maximum expected
increase from the incremental increased loading which will result from the maximum
utilization of the new or modified facilities.
Emissions for PM, CO, VOC, lead and combustion HAPs are calculated by
multiplying the maximum incremental boiler firing by the appropriate AP-42 emission
factor from Chapter 1.4 (July 1998). Emissions of NOx are estimated based on the
permitted NOx performance of 0.036 lb NOx/MMBtu from P0406444 issued January 12,
2012. Emissions of GHG, SO2, HAP, and H2SO4 emissions were calculated using the
same process as described for other combustion sources discussed above.
2.4.3 Sulfur Recovery Units: SRU1 (P009) and SRU2&3 (P037)
As mentioned in the project description, the SRUs are not being modified, but it is
anticipated that the sulfur load to the SRUs could increase due to this project. Criteria
1 Past actual baseline emissions are calculated as the lower of the past actual emissions or allowable emissions.
Toledo Feedstock Optimization PTIO Application
BPH TFO Application 2-8 10/19/2012 41917214 1 TFO Application Text 10-19-12
pollutant emissions, VOC, CO, NOx, PM/PM10/PM2.5, and combustion HAPs primarily
result from the combustion of supplemental fuel within the SRUs incinerators and
combustors. These emissions are estimated based on the firing rate of natural gas in the
SRUs and AP-42 Chapter 1.4 emission factors for natural gas combustion. A GHG
emission factor in tons of CO2e per long ton per day of sulfur production was used to
calculate the expected increase in CO2e from the project. The GHG factor was generated
based on data compiled for the 2011 reporting requirements from 40 CFR Part 98 since
that is the first full year of available data.
Past actual SO2 emissions are calculated based on SO2 CEMs recorded data and
flow rates for the SRU stacks. The SRU 1 tail gas flow rate meter was not reliable for the
baseline period of 2004-2005, so its flow was estimated based on the amount of sulfur
produced in long tons per day in 2004-2005 times the SRU 1 unit specific experienced
based ratio of tail gas flow rate to sulfur production (established during periods when the
flow meter was reliable and available. The larger SRU 2/3 tail gas flow meter was
available for the baseline period.
Future SO2 emissions are based on the SRU’s SO2 PTE as limited by a new
proposed SO2 emissions limit on the combined SO2 emissions from the two SRUs. The
SRU units’ current PTE is limited by NSPS Subpart J which allows up to 250 ppmv SO2
in the SRU tail gas unit’s stack. However, BPH’s SRU performance is, on average, much
better than this NSPS limit. BPH proposes the TFO permit impose a new permit limit of
80 tons/yr combined SO2 emissions from both SRU 1 and SRU 2/3 (expressed as tons/yr
rolling-12 month average). This value is BPH’s estimated maximum potential annual
emissions of these units at their maximum sulfur capacity.
2.4.4 Tankage
The TFO project is anticipated to increase diesel production by approximately one
thousand barrels per day (KB/D) and probably decrease gasoline production about 2
KB/D. Nevertheless, for conservatism in estimating TFO project emissions, it has been
assumed that diesel increases 2 KB/D resulting in increased throughputs to this product
storage tank’s resulting increase in VOC emissions. No credit is claimed for a gasoline
production decrease.
Diesel is stored in diesel tanks T061 (tank 3), T156 (tank 171), T155 (tank 172),
T153 (tank 175), T110 (tank 761), and T111 (tank 775). The incremental throughput

Toledo Feedstock Optimization PTIO Application
BPH TFO Application 2-9 10/19/2012 41917214 1 TFO Application Text 10-19-12
could go through any combination of these tanks at any time. For conservative
calculation purposes, it has been assumed that the incremental throughput is routed
through the tank that would result in the highest emissions, which is tank 761 (T110), a
fixed roof tank.
The incremental tank emissions were calculated using EPA’s tank calculation
methodology outlined in AP-42 Chapter 7 and using the tank properties and total
increased throughput.
2.4.6 Cooling Tower
Some of the proposed changes in the TFO project may require additional cooling
water circulation to maintain current temperatures in some of the process streams. The
cooling towers won’t be changed but maximum cooling water recirculation rate could
increase up to 10,000 gallon per minute. This is within the current capabilities of the
existing cooling towers. As an "infrastructure" or “support” element of the refinery
operations, the relevant cooling tower emissions for the permitting of this project are
from the maximum expected increase from the incremental increased cooling water
recirculation rate, instead of re-permitting the entire cooling tower capacity at the
refinery.
Emissions of total particulate, PM10 and VOC have been estimated using AP-42
parameters and emission factors from Chapters 13.4 and 5.1 respectively. A worst-case
total dissolved solids average has been based on the recent past operations at the BPH
refinery.
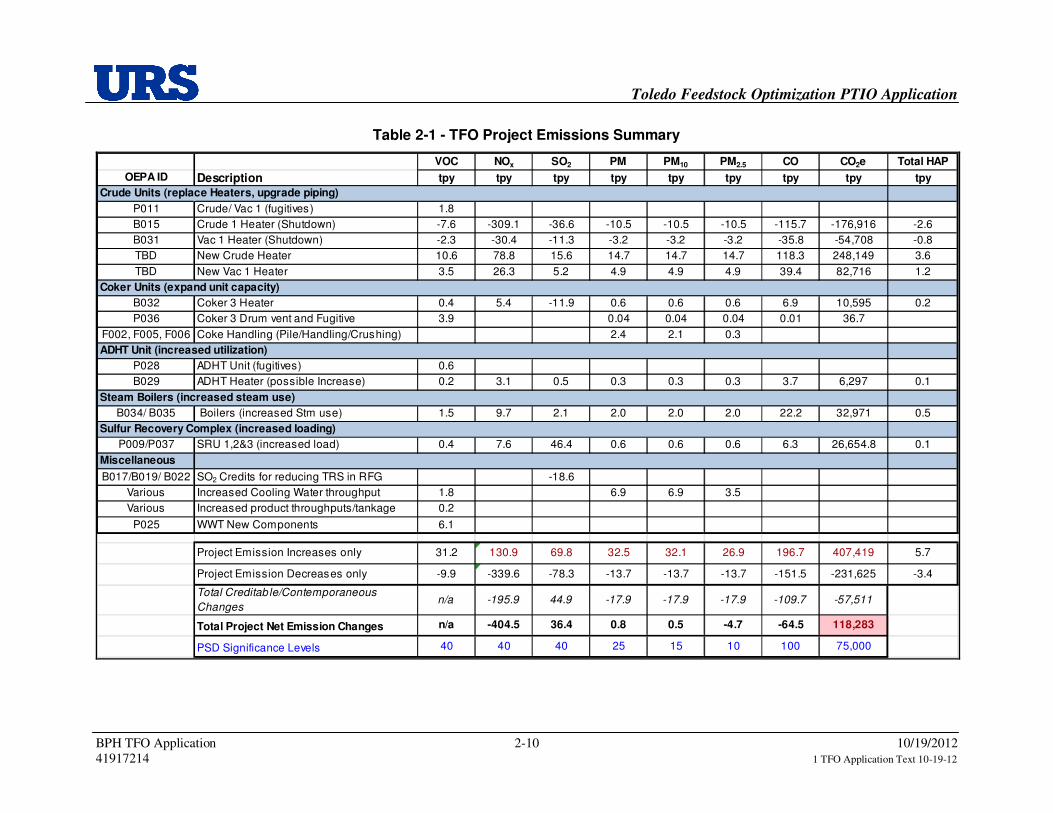
Table 2-1 on the next page summarizes the emissions increases and decreases
resulting from the TFO project. These are based on calculations as discussed above and
presented in Appendix A.
Toledo Feedstock Optimization PTIO Application
BPH TFO Application 2-10 10/19/2012 41917214 1 TFO Application Text 10-19-12
Table 2-1 - TFO Project Emissions Summary
VOC NOx SO2 PM PM10 PM2.5 CO CO2e Total HAP
OEPA ID Description tpy tpy tpy tpy tpy tpy tpy tpy tpy
Crude Units (replace Heaters, upgrade piping)
P011 Crude/ Vac 1 (fugitives) 1.8
B015 Crude 1 Heater (Shutdown) -7.6 -309.1 -36.6 -10.5 -10.5 -10.5 -115.7 -176,916 -2.6
B031 Vac 1 Heater (Shutdown) -2.3 -30.4 -11.3 -3.2 -3.2 -3.2 -35.8 -54,708 -0.8
TBD New Crude Heater 10.6 78.8 15.6 14.7 14.7 14.7 118.3 248,149 3.6
TBD New Vac 1 Heater 3.5 26.3 5.2 4.9 4.9 4.9 39.4 82,716 1.2
Coker Units (expand unit capacity)
B032 Coker 3 Heater 0.4 5.4 -11.9 0.6 0.6 0.6 6.9 10,595 0.2
P036 Coker 3 Drum vent and Fugitive 3.9 0.04 0.04 0.04 0.01 36.7
F002, F005, F006 Coke Handling (Pile/Handling/Crushing) 2.4 2.1 0.3
ADHT Unit (increased utilization)
P028 ADHT Unit (fugitives) 0.6
B029 ADHT Heater (possible Increase) 0.2 3.1 0.5 0.3 0.3 0.3 3.7 6,297 0.1
Steam Boilers (increased steam use)
B034/ B035 Boilers (increased Stm use) 1.5 9.7 2.1 2.0 2.0 2.0 22.2 32,971 0.5
Sulfur Recovery Complex (increased loading)
P009/P037 SRU 1,2&3 (increased load) 0.4 7.6 46.4 0.6 0.6 0.6 6.3 26,654.8 0.1
Miscellaneous
B017/B019/ B022 SO2 Credits for reducing TRS in RFG -18.6
Various Increased Cooling Water throughput 1.8 6.9 6.9 3.5
Various Increased product throughputs/tankage 0.2
P025 WWT New Components 6.1
Project Emission Increases only 31.2 130.9 69.8 32.5 32.1 26.9 196.7 407,419 5.7
Project Emission Decreases only -9.9 -339.6 -78.3 -13.7 -13.7 -13.7 -151.5 -231,625 -3.4
Total Creditable/Contemporaneous
Changesn/a -195.9 44.9 -17.9 -17.9 -17.9 -109.7 -57,511
Total Project Net Emission Changes n/a -404.5 36.4 0.8 0.5 -4.7 -64.5 118,283
PSD Significance Levels 40 40 40 25 15 10 100 75,000
Toledo Feedstock Optimization PTIO Application
BPH TFO Application 3-1 10/19/2012 41917214 1 TFO Application Text 10-19-12
3.0 Applicable Regulations
The following section lists the major regulations applicable to process units that
are new or will be modified in this project. Additionally, in select cases, where it may
not be obvious, a discussion is provided why a particular regulation does not apply to this
project.
3.1 NSPS Subpart Ja
The New Source Performance Standards (NSPS) at 40 CFR 60 Subpart Ja apply
to FCCUs, Cokers, SRUs, and fuel gas combustion devices that are constructed,
reconstructed, or modified after May 14, 2007. NSPS Ja also has provisions applicable to
new and modified flares. A new revised version of the rule was published in the federal
register on September 12, 2012. BPH will comply with the requirements of this final
promulgated rule.
This project will result in applicability of this standard to the following sources:
• The new replacement heaters (Crude 1 heaters and Vacuum 1 heater) (new
sources);
• The existing Coker 3 Process Unit (modified source).
The existing Hydrocarbon Flares are already subject to Ja as a result of the
Reformer 3 Project PTI P0103694 issued 8/7/2009. Other TFO affected heaters will not
be subject to Ja since they are not being modified.
The applicability and requirements of NSPS Ja to the Crude Vac 1 heaters and the
Coker 3 process unit source types are summarized below.
3.1.1 New Heaters Subject to NSPS Ja
The new Crude and Vacuum heaters will be regulated by NSPS Subpart Ja as new
fuel gas combustion devices (heaters). NSPS Ja requires the following:
• SO2 Emissions
o The following short term (3 hr) emissions limits:
� Use of fuel gas that contains H2S not to exceed 162 ppmv (or SO2
not to exceed 20 ppmv (dry basis, corrected to 0% excess air).
Toledo Feedstock Optimization PTIO Application
BPH TFO Application 3-2 10/19/2012 41917214 1 TFO Application Text 10-19-12
o The following annual (rolling 365 day average) emissions limits:
� Use of fuel gas that contains H2S not to exceed 60 ppmv. (or SO2
not to exceed 8 ppmv)
• NOx Emissions (30 day rolling average):
o NOx not to exceed 0.040 pounds per MMBtu HHV (or NOx not to
exceed 40 ppmv (dry basis, corrected to 0% excess air).
3.1.3 Coker 3 Process Unit (P036) Subject to NSPS Ja
Coker 3 process unit (P036), a delayed coker, will be modified and, therefore, will
become an affected source under this regulation.
• NSPS Ja does not have specific emission limitations for delayed cokers, but
does require delayed cokers to depressure to 5 lb per square inch gauge and
vent the exhaust gases to the fuel gas system, the flare, or other control device
prior to opening the vent to the atmosphere. The BPH Toledo Refinery’s
current operating practice already complies with this requirement. Further,
BPH proposes to reduce the coke drum pressure to no more than 2 psig prior
to venting to the atmosphere as outlined in Appendix E of this application
(GHG BACT).
3.2 NSPS Subpart GGGa - Standards for Equipment Leaks
The Crude/Vac 1 (P011), A-DHT (P029), and Coker 3 (P036) process units will
all have new fugitive piping components in VOC service added by the TFO project. The
additional components will result in slightly higher emissions from piping. NSPS GGGa
applicability is triggered for all the piping components in a process unit if new
components are added and result in an emission increase except for small changes not
considered a “capital expenditure” (exemption in § 60.590a(c)). The term “capital
expenditure” in this context is defined elsewhere in the NSPS rules and EPA guidance to
only changes that involve a change which is expensive enough to not quality as routine
repair and replacement following formulas and industry specific annual asset repair
guideline factors specified by EPA and the Internal Revenue Service.
Based on the estimated costs of the additional piping components at these process
units, the piping modifications at each of the above listed process unit will meet the
definition of ‘Capital Expenditure’ as defined in 40 CFR 60.14. Therefore, these
Toledo Feedstock Optimization PTIO Application
BPH TFO Application 3-3 10/19/2012 41917214 1 TFO Application Text 10-19-12
emissions units will be considered modified as defined in 40 CFR 60.590a and NSPS
GGGa will apply.
Compliance with NSPS Subpart GGGa will be achieved by adding the new piping
components from these emissions units into the existing refinery wide LDAR program
which is designed to provide monitoring, leak repair and recordkeeping for affected
process units meeting the requirements of NSPS Subparts GGGa and VVa (to which
Subpart GGGa refers) as well as Refinery MACT Subpart CC.
3.3 NSPS Subpart NNN - Standards of Performance for Volatile Organic
Compound (VOC) Emissions from Synthetic Organic Chemical Manufacturing
Industry (SOCMI) Distillation Operations
The provisions NSPS Subpart NNN apply to distillation operations that produces
any of the chemicals listed in 40 CFR 60.667 as a product, co-product, by-product, or
intermediate. The modifications to the Coker Gas Plant at the Coker 3 process unit
(P036) include an absorber/stripper and debutanizer distillation process that will produce
both propane and butane. These products are listed in the NSPS NNN applicable
chemical list. Accordingly, NSPS NNN will apply to this part of the gas plant distillation
process and BPH will comply with the applicable NSPS requirements
3.4 40 CFR Subpart CC—National Emission Standards for Hazardous Air
Pollutants from Petroleum Refineries
Equipment leaks in the new and affected process units including the Crude
Vacuum 1 (P011), Coker 3 (P036), and the ADHT (P028) already are and will remain
subject to the existing source provisions of 40 CFR 63 Subpart CC, also known as
Refinery MACT I. Compliance will be maintained by adding the new fugitive piping
components into the refinery wide LDAR program which complies with the requirements
of Subpart CC. As discussed above, these new components will also meet the
requirements of NSPS Subpart GGGa.
3.5 40 CFR Subpart DDDDD — National Emission Standards for Hazardous Air
Pollutants for Major Sources: Industrial, Commercial, and Institutional Boilers
and Process Heaters
MACT Subpart DDDDD applies to commercial, institutional and industrial boilers and
process heaters at major sources of HAP. The status of the MACT Subpart DDDDD rule
Toledo Feedstock Optimization PTIO Application
BPH TFO Application 3-4 10/19/2012 41917214 1 TFO Application Text 10-19-12
is still in flux. A reconsideration of the rule was proposed on December 23, 2011 after
the “final” rule was published on March 21, 2011. The “final” rule was stayed on May
18, 2011, but then unstayed on January 8, 2012 making the “final” rule effective once
again. It is anticipated that by the start-up of the new heaters, the March 2011 “final
rule” will be replaced by the “reconsidered” rule. Unless the final rule changes, the new
Crude 1 and Vacuum 1 heaters will be subject to the requirements in the rule for new
process heaters designed to burn gas 1 fuels, which include natural gas and refinery gas.
In both above versions of the rule, the only requirement specifically applicable to
a new refinery fuel gas fired heater greater than 10 MMBtu/hr size is the completion of
an annual tune-up as specified in § 63.7540. (The tune-up requirements are specified in
§63.7540 paragraphs (a)(10)(i) through (vi))
Regarding allowable time between the tune-ups, per 63.7515(e), annual is no
more than 13 months. The burner inspection may be delayed until the next scheduled or
unscheduled unit shutdown per §63.7540 (a)(10)(i), but each burner must be inspected at
least once every 36 months. If the unit is not operating on the required date for a tune-
up, the tune-up must be conducted within one week of the next startup.
MACT Subpart DDDDD also requires a one-time energy assessment for facilities
with existing affected boilers or heaters. BPH will be required to perform this
assessment, as required by DDDDD, regardless of the TFO project (if this provision of
DDDDD remains in the final rule.)
As mentioned, the above requirements could change upon EPA’s issuance of a
final new rule. When the final rule is issued and the effective date is established, the
existing and new BP-Husky affected heaters will comply with the requirements of the
final rule.
3.6 40 CFR Part 51 and 52 New Source Review and Prevention of Significant
Deterioration (NSR/PSD)
The BPH Toledo Refinery is an existing major source for New Source Review
purposes. As such, any new project needs to be reviewed for potential applicability under
either Prevention of Significant Deterioration (PSD) or Non-attainment New Source
Review (NSR) requirements. Section 4.0 of this permit application discusses the
applicability of these requirements relative to the TFO project.

Toledo Feedstock Optimization PTIO Application
BPH TFO Application 3-5 10/19/2012 41917214 1 TFO Application Text 10-19-12
3.7 Ohio Permitting Regulations
Prior to the modification of an existing emissions unit, a Permit to Install (PTI)
must be applied for and issued as directed by OAC Rule 3745-31. Only after the PTI is
issued may a facility begin modification of the emissions unit (except for site preparation
activities allowed by OAC 3745-31-33.) A period of 18 months from the date of PTI
issuance is allowed for commencing construction. This application includes the required
elements for OEPA to review and issue a PTI. Other Ohio air rules applicable to the
emission units in the TFO project are discussed in the following sections.
3.7.1 OAC rule 3745-31-05 Ohio Best Available Technology (BAT)
OAC Chapter 3745-31-05, Paragraph 31-05(A)(3) requires that a new or modified
source with the potential to emit greater than 10 tpy of any pollutant with a NAAQS
standard employ Best Available Technology (BAT).
BAT is defined in OAC 3745-31-01 as "any combination of work practices, raw
material specifications, throughput limitations, source design characteristics, an
evaluation of the annualized cost per ton of air pollutant removed, and air pollution
control devices that have been previously demonstrated to the director of environmental
protection to operate satisfactorily in this state or other states with similar air quality on
substantially similar air pollution sources.” The BAT evaluation considers the energy,
environmental, economic, and other costs associated with each alternative technology,
and the benefit of reduced emissions that the technology would bring.
Section 5 of this application contains the BAT analysis for the project’s emissions
sources.
3.7.2 OAC rule 3745-21-09(T) Leaks from petroleum refinery equipment
This state regulation will apply to the proposed new and modified process
equipment (piping components). The requirements of this rule are generally less
stringent than other applicable regulations including NSPS GGGa and MACT Subpart
CC discussed above. Ohio EPA has previously agreed that consistent with the U.S. EPA
streamlining policy that BPH may elect to demonstrate compliance with this rule by
demonstrating compliance with rules that are generally more stringent. Compliance will
be achieved by adding the new fugitive piping components into the refinery wide LDAR
program which complies with the requirements of Subpart CC. As discussed above,
these new components will also meet the requirements of NSPS Subpart GGGa.
Toledo Feedstock Optimization PTIO Application
BPH TFO Application 3-6 10/19/2012 41917214 1 TFO Application Text 10-19-12
3.7.3 OAC rule 3745-109 (Clean Air Interstate Rule)
This rule is not applicable to any new TFO project source. Ohio EPA rules to
comply with the requirements of U.S. EPA’s Clean Air Interstate Rule (“CAIR”) found
in Volume 70 of the Federal Register, Page 25162 (70 FR 25162), are contained in OAC
3745-109. The CAIR rules require reductions in air emissions of nitrogen oxides (NOx)
and sulfur dioxides (SO2) from Electric Generating Units (EGUs) and to fossil fuel-fired
industrial boilers greater than 250 MMBTU/hr (non-EGU’s). However, the CAIR rule
does not apply to large heaters that do not generate steam or heat some other heat transfer
medium. The new and modified process heaters for the TFO project directly heat process
feedstocks, without the use of a heat transfer medium. Consequently, the CAIR rule is
not applicable.
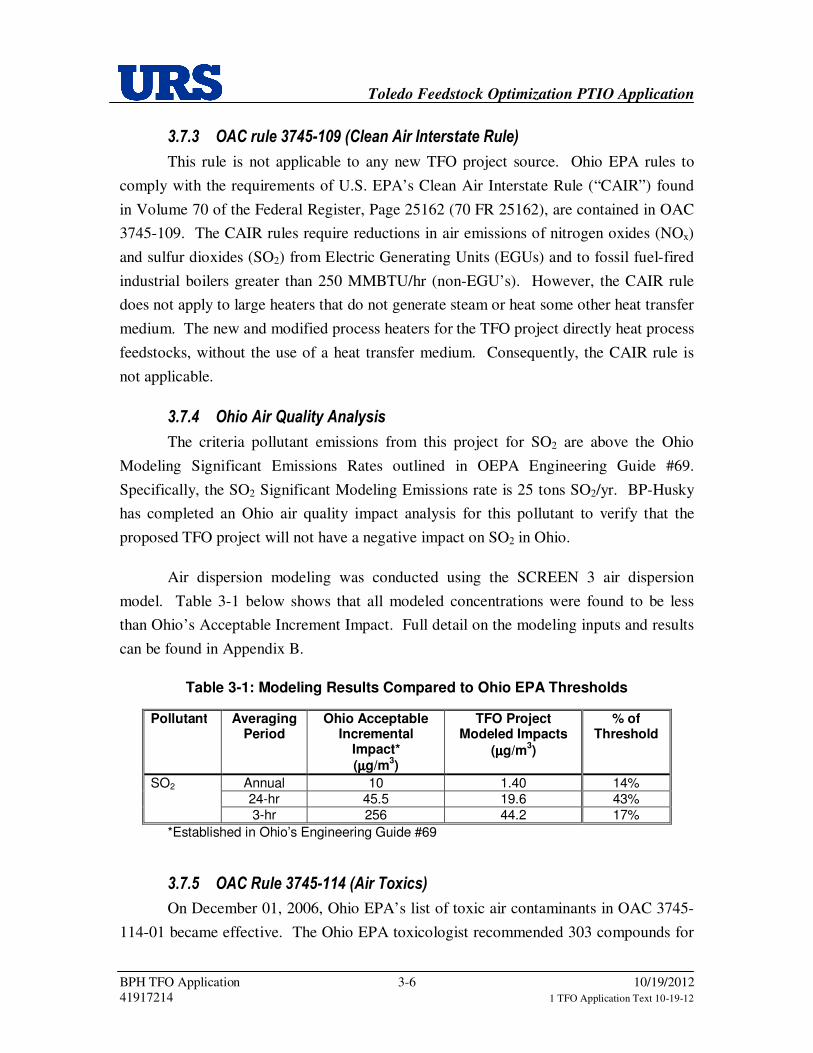
3.7.4 Ohio Air Quality Analysis
The criteria pollutant emissions from this project for SO2 are above the Ohio
Modeling Significant Emissions Rates outlined in OEPA Engineering Guide #69.
Specifically, the SO2 Significant Modeling Emissions rate is 25 tons SO2/yr. BP-Husky
has completed an Ohio air quality impact analysis for this pollutant to verify that the
proposed TFO project will not have a negative impact on SO2 in Ohio.
Air dispersion modeling was conducted using the SCREEN 3 air dispersion
model. Table 3-1 below shows that all modeled concentrations were found to be less
than Ohio’s Acceptable Increment Impact. Full detail on the modeling inputs and results
can be found in Appendix B.
Table 3-1: Modeling Results Compared to Ohio EPA Thresholds
Pollutant Averaging Period
Ohio Acceptable Incremental
Impact*
(µµµµg/m3)
TFO Project Modeled Impacts
(µµµµg/m3)
% of Threshold
SO2 Annual 10 1.40 14% 24-hr 45.5 19.6 43% 3-hr 256 44.2 17%
*Established in Ohio’s Engineering Guide #69
3.7.5 OAC Rule 3745-114 (Air Toxics)
On December 01, 2006, Ohio EPA’s list of toxic air contaminants in OAC 3745-
114-01 became effective. The Ohio EPA toxicologist recommended 303 compounds for
Toledo Feedstock Optimization PTIO Application
BPH TFO Application 3-7 10/19/2012 41917214 1 TFO Application Text 10-19-12
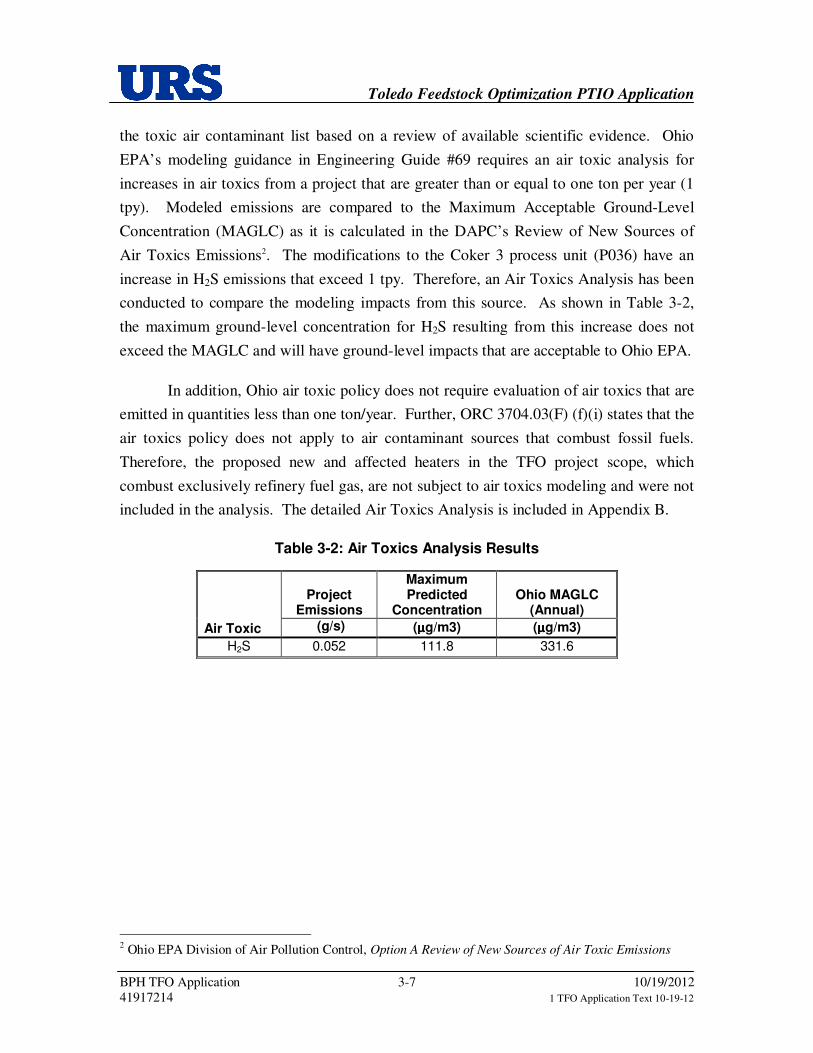
the toxic air contaminant list based on a review of available scientific evidence. Ohio
EPA’s modeling guidance in Engineering Guide #69 requires an air toxic analysis for
increases in air toxics from a project that are greater than or equal to one ton per year (1
tpy). Modeled emissions are compared to the Maximum Acceptable Ground-Level
Concentration (MAGLC) as it is calculated in the DAPC’s Review of New Sources of
Air Toxics Emissions2. The modifications to the Coker 3 process unit (P036) have an
increase in H2S emissions that exceed 1 tpy. Therefore, an Air Toxics Analysis has been
conducted to compare the modeling impacts from this source. As shown in Table 3-2,
the maximum ground-level concentration for H2S resulting from this increase does not
exceed the MAGLC and will have ground-level impacts that are acceptable to Ohio EPA.
In addition, Ohio air toxic policy does not require evaluation of air toxics that are
emitted in quantities less than one ton/year. Further, ORC 3704.03(F) (f)(i) states that the
air toxics policy does not apply to air contaminant sources that combust fossil fuels.
Therefore, the proposed new and affected heaters in the TFO project scope, which
combust exclusively refinery fuel gas, are not subject to air toxics modeling and were not
included in the analysis. The detailed Air Toxics Analysis is included in Appendix B.
Table 3-2: Air Toxics Analysis Results
Air Toxic
Project Emissions
Maximum Predicted
Concentration Ohio MAGLC
(Annual) (g/s) (µµµµg/m3) (µµµµg/m3)
H2S 0.052 111.8 331.6
2 Ohio EPA Division of Air Pollution Control, Option A Review of New Sources of Air Toxic Emissions
Toledo Feedstock Optimization PTIO Application
BPH TFO Application 4-8 10/19/2012 41917214 1 TFO Application Text 10-19-12
4.0 New Source Review for Attainment and Non-Attainment Areas (NSR/PSD)
The BPH Toledo Refinery is an existing major source for New Source Review
purposes. Since Lucas County is in attainment for all pollutants, the net emissions from
the TFO project have been reviewed to determine if the project is a “major modification”
and subject to further PSD review. The first step in evaluating PSD applicability is to
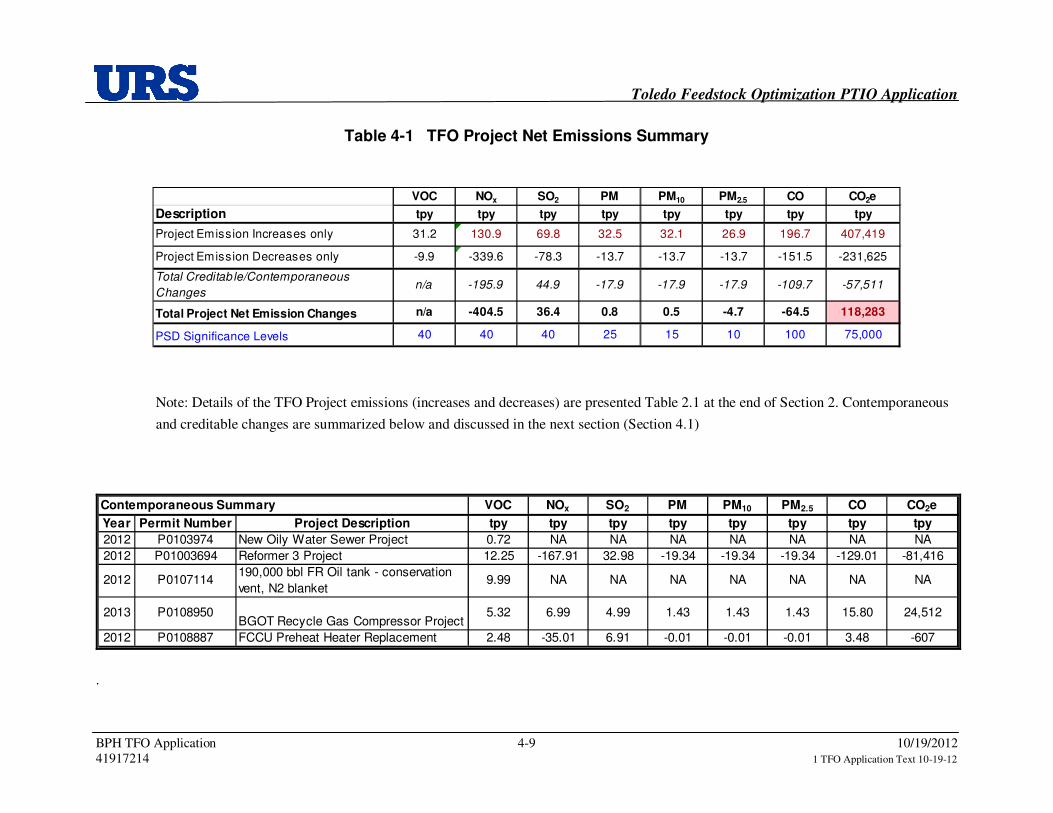
look at just the annual emissions increases from the proposed TFO project alone. As
shown in Table 4-1, the combined project emissions increases will exceed the PSD
significance threshold for several regulated pollutants. Therefore, PSD would be
triggered for these pollutants unless, as a second step of the PSD review, a netting
analysis, is performed which shows that the overall project net emission are below the
PSD applicability thresholds. The second step of the PSD applicability determination
considers both project increases and decreases along with other contemporaneous and
creditable increases and decreases.
As shown in the below Table 4-1, VOC project emission increases alone are not
above the PSD significant emission rates. Therefore, PSD is not applicable to this
pollutant and the PSD netting review described above (Step 2) is not triggered for this
pollutant. The other listed pollutants have increases that are above the PSD significance
levels. Accordingly, a netting analysis was performed for each of the other pollutants
because their project increases alone were significant. The netting analysis of all these
other pollutants, except greenhouse gases, shows that the TFO project emission impacts,
together with the other contemporaneous increases and decreases occurring at the facility,
result in overall net emissions of each below the applicable PSD significance levels. For
greenhouse gas (GHG) emissions, overall net emissions are increased by approximately
118,000 tons/yr CO2e. This is above the PSD significant emission rate of 75,000 tons/yr.
Consequently, PSD will be triggered for GHG, but only for GHG emissions.
The following sections discuss the contemporaneous and creditable emission
changes reflected in the netting analysis and other proposed permit conditions used to
make the assumptions of the netting analysis enforceable.
Toledo Feedstock Optimization PTIO Application
BPH TFO Application 4-9 10/19/2012 41917214 1 TFO Application Text 10-19-12
Table 4-1 TFO Project Net Emissions Summary
VOC NOx SO2 PM PM10 PM2.5 CO CO2e
Description tpy tpy tpy tpy tpy tpy tpy tpy
Project Emission Increases only 31.2 130.9 69.8 32.5 32.1 26.9 196.7 407,419
Project Emission Decreases only -9.9 -339.6 -78.3 -13.7 -13.7 -13.7 -151.5 -231,625
Total Creditab le/Contemporaneous
Changesn/a -195.9 44.9 -17.9 -17.9 -17.9 -109.7 -57,511
Total Project Net Emission Changes n/a -404.5 36.4 0.8 0.5 -4.7 -64.5 118,283
PSD Significance Levels 40 40 40 25 15 10 100 75,000
Note: Details of the TFO Project emissions (increases and decreases) are presented Table 2.1 at the end of Section 2. Contemporaneous
and creditable changes are summarized below and discussed in the next section (Section 4.1)
VOC NOx SO2 PM PM10 PM2.5 CO CO2e
Year Permit Number Project Description tpy tpy tpy tpy tpy tpy tpy tpy
2012 P0103974 New Oily Water Sewer Project 0.72 NA NA NA NA NA NA NA
2012 P01003694 Reformer 3 Project 12.25 -167.91 32.98 -19.34 -19.34 -19.34 -129.01 -81,416
2012 P0107114190,000 bbl FR Oil tank - conservation
vent, N2 blanket 9.99 NA NA NA NA NA NA NA
2013 P0108950BGOT Recycle Gas Compressor Project
5.32 6.99 4.99 1.43 1.43 1.43 15.80 24,512
2012 P0108887 FCCU Preheat Heater Replacement 2.48 -35.01 6.91 -0.01 -0.01 -0.01 3.48 -607
Contemporaneous Summary
.
Toledo Feedstock Optimization PTIO Application
BPH TFO Application 4-10 10/19/2012 41917214 1 TFO Application Text 10-19-12
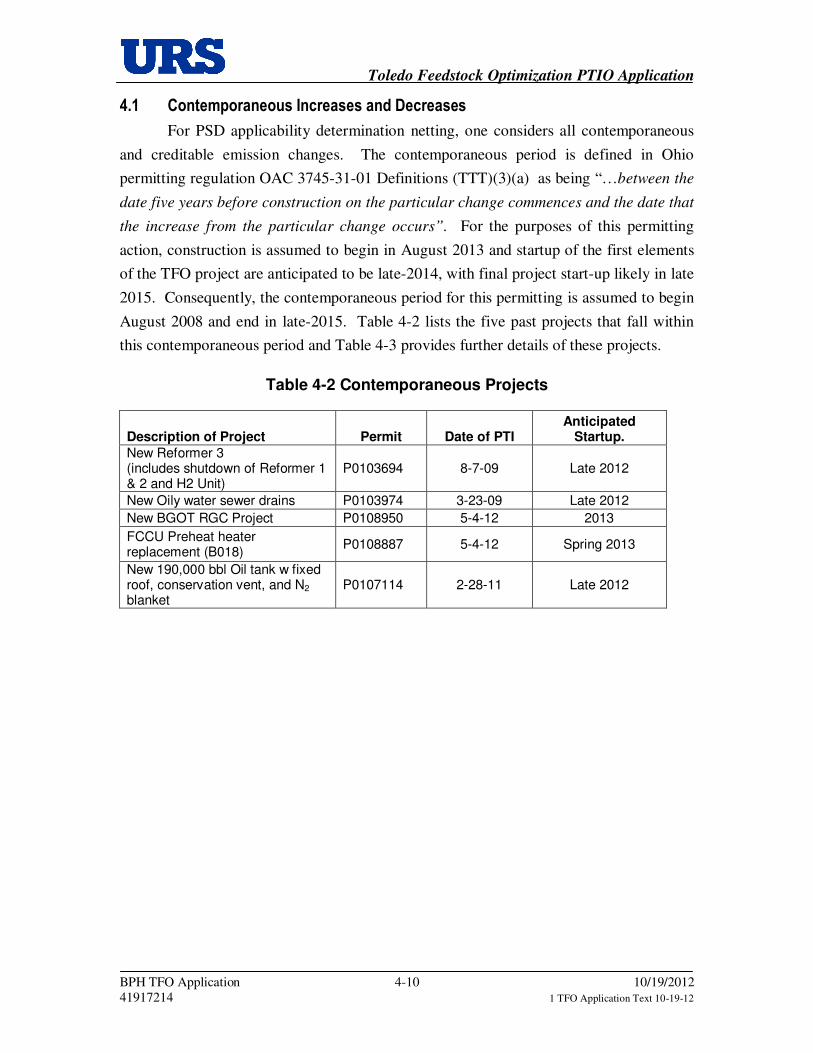
4.1 Contemporaneous Increases and Decreases
For PSD applicability determination netting, one considers all contemporaneous
and creditable emission changes. The contemporaneous period is defined in Ohio
permitting regulation OAC 3745-31-01 Definitions (TTT)(3)(a) as being “…between the
date five years before construction on the particular change commences and the date that
the increase from the particular change occurs”. For the purposes of this permitting
action, construction is assumed to begin in August 2013 and startup of the first elements
of the TFO project are anticipated to be late-2014, with final project start-up likely in late
2015. Consequently, the contemporaneous period for this permitting is assumed to begin
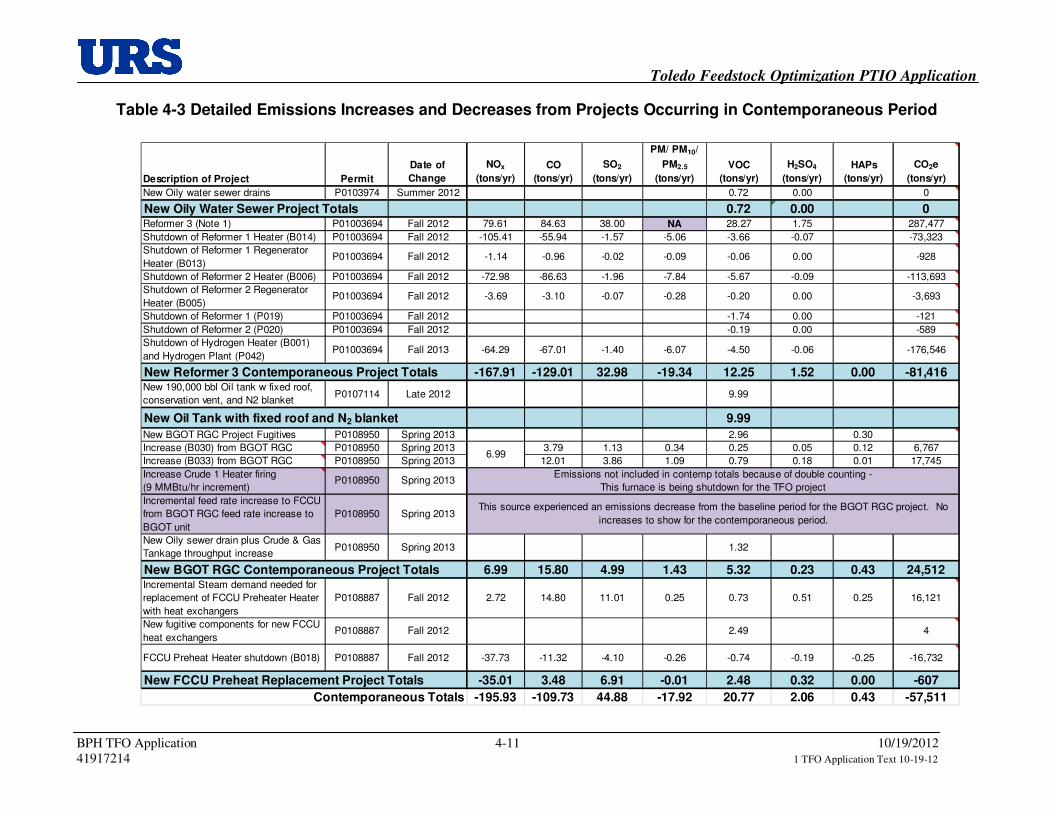
August 2008 and end in late-2015. Table 4-2 lists the five past projects that fall within
this contemporaneous period and Table 4-3 provides further details of these projects.
Table 4-2 Contemporaneous Projects
Description of Project Permit Date of PTI Anticipated
Startup.
New Reformer 3 (includes shutdown of Reformer 1 & 2 and H2 Unit)
P0103694 8-7-09 Late 2012
New Oily water sewer drains P0103974 3-23-09 Late 2012
New BGOT RGC Project P0108950 5-4-12 2013
FCCU Preheat heater replacement (B018)
P0108887 5-4-12 Spring 2013
New 190,000 bbl Oil tank w fixed roof, conservation vent, and N2 blanket
P0107114 2-28-11 Late 2012
Toledo Feedstock Optimization PTIO Application
BPH TFO Application 4-11 10/19/2012 41917214 1 TFO Application Text 10-19-12
Table 4-3 Detailed Emissions Increases and Decreases from Projects Occurring in Contemporaneous Period
Description of Project Permit
Date of
Change
NOx
(tons/yr)
CO
(tons/yr)
SO2
(tons/yr)
PM/ PM10/
PM2.5
(tons/yr)
VOC
(tons/yr)
H2SO4
(tons/yr)
HAPs
(tons/yr)
CO2e
(tons/yr)
New Oily water sewer drains P0103974 Summer 2012 0.72 0.00 0
New Oily Water Sewer Project Totals 0.72 0.00 0Reformer 3 (Note 1) P01003694 Fall 2012 79.61 84.63 38.00 NA 28.27 1.75 287,477
Shutdown of Reformer 1 Heater (B014) P01003694 Fall 2012 -105.41 -55.94 -1.57 -5.06 -3.66 -0.07 -73,323
Shutdown of Reformer 1 Regenerator
Heater (B013)P01003694 Fall 2012 -1.14 -0.96 -0.02 -0.09 -0.06 0.00 -928
Shutdown of Reformer 2 Heater (B006) P01003694 Fall 2012 -72.98 -86.63 -1.96 -7.84 -5.67 -0.09 -113,693
Shutdown of Reformer 2 Regenerator
Heater (B005)P01003694 Fall 2012 -3.69 -3.10 -0.07 -0.28 -0.20 0.00 -3,693
Shutdown of Reformer 1 (P019) P01003694 Fall 2012 -1.74 0.00 -121
Shutdown of Reformer 2 (P020) P01003694 Fall 2012 -0.19 0.00 -589
Shutdown of Hydrogen Heater (B001)
and Hydrogen Plant (P042)P01003694 Fall 2013 -64.29 -67.01 -1.40 -6.07 -4.50 -0.06 -176,546
New Reformer 3 Contemporaneous Project Totals -167.91 -129.01 32.98 -19.34 12.25 1.52 0.00 -81,416New 190,000 bbl Oil tank w fixed roof,
conservation vent, and N2 blanket P0107114 Late 2012 9.99
New Oil Tank with fixed roof and N2 blanket 9.99
New BGOT RGC Project Fugitives P0108950 Spring 2013 2.96 0.30
Increase (B030) from BGOT RGC P0108950 Spring 2013 3.79 1.13 0.34 0.25 0.05 0.12 6,767
Increase (B033) from BGOT RGC P0108950 Spring 2013 12.01 3.86 1.09 0.79 0.18 0.01 17,745
Increase Crude 1 Heater firing
(9 MMBtu/hr increment)P0108950 Spring 2013
Emissions not included in contemp totals because of double counting -
This furnace is being shutdown for the TFO project
Incremental feed rate increase to FCCU
from BGOT RGC feed rate increase to
BGOT unit
P0108950 Spring 2013This source experienced an emissions decrease from the baseline period for the BGOT RGC project. No
increases to show for the contemporaneous period.
New Oily sewer drain plus Crude & Gas
Tankage throughput increaseP0108950 Spring 2013 1.32
New BGOT RGC Contemporaneous Project Totals 6.99 15.80 4.99 1.43 5.32 0.23 0.43 24,512Incremental Steam demand needed for
replacement of FCCU Preheater Heater
with heat exchangers
P0108887 Fall 2012 2.72 14.80 11.01 0.25 0.73 0.51 0.25 16,121
New fugitive components for new FCCU
heat exchangersP0108887 Fall 2012 2.49 4
FCCU Preheat Heater shutdown (B018) P0108887 Fall 2012 -37.73 -11.32 -4.10 -0.26 -0.74 -0.19 -0.25 -16,732
New FCCU Preheat Replacement Project Totals -35.01 3.48 6.91 -0.01 2.48 0.32 0.00 -607
Contemporaneous Totals -195.93 -109.73 44.88 -17.92 20.77 2.06 0.43 -57,511
6.99
Toledo Feedstock Optimization PTIO Application
BPH TFO Application 4-12 10/19/2012 41917214 1 TFO Application Text 10-19-12
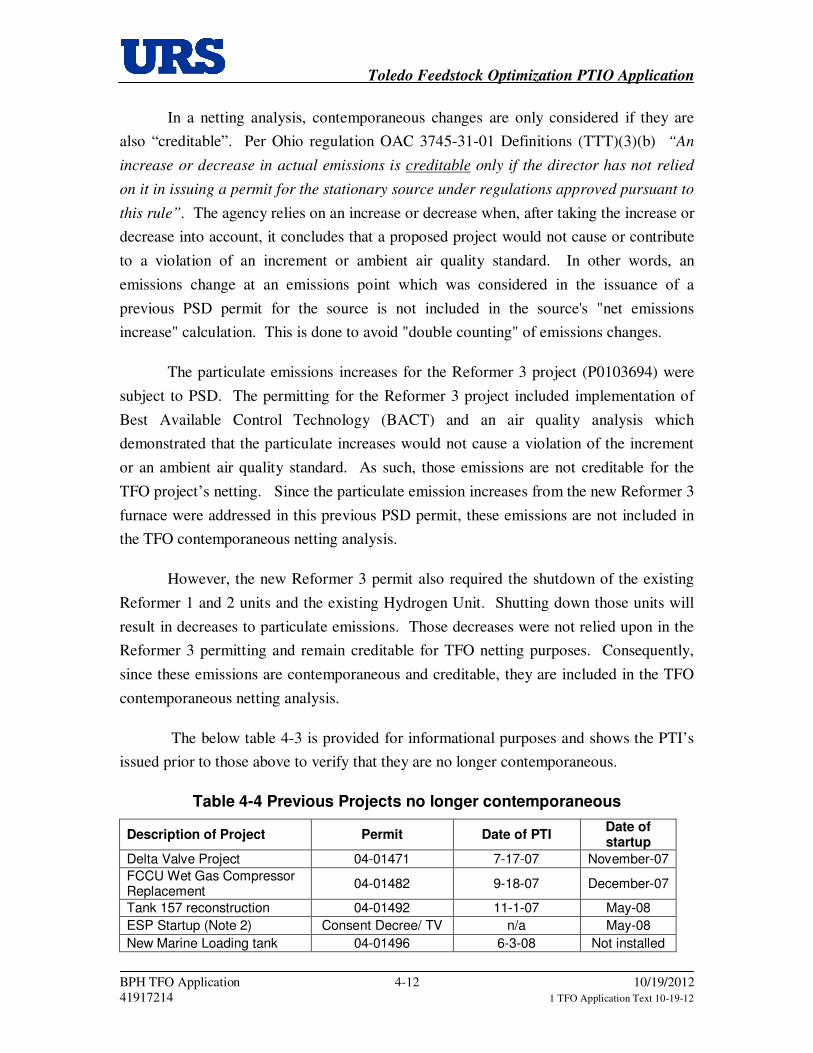
In a netting analysis, contemporaneous changes are only considered if they are
also “creditable”. Per Ohio regulation OAC 3745-31-01 Definitions (TTT)(3)(b) “An
increase or decrease in actual emissions is creditable only if the director has not relied
on it in issuing a permit for the stationary source under regulations approved pursuant to
this rule”. The agency relies on an increase or decrease when, after taking the increase or
decrease into account, it concludes that a proposed project would not cause or contribute
to a violation of an increment or ambient air quality standard. In other words, an
emissions change at an emissions point which was considered in the issuance of a
previous PSD permit for the source is not included in the source's "net emissions
increase" calculation. This is done to avoid "double counting" of emissions changes.
The particulate emissions increases for the Reformer 3 project (P0103694) were
subject to PSD. The permitting for the Reformer 3 project included implementation of
Best Available Control Technology (BACT) and an air quality analysis which
demonstrated that the particulate increases would not cause a violation of the increment
or an ambient air quality standard. As such, those emissions are not creditable for the
TFO project’s netting. Since the particulate emission increases from the new Reformer 3
furnace were addressed in this previous PSD permit, these emissions are not included in
the TFO contemporaneous netting analysis.
However, the new Reformer 3 permit also required the shutdown of the existing
Reformer 1 and 2 units and the existing Hydrogen Unit. Shutting down those units will
result in decreases to particulate emissions. Those decreases were not relied upon in the
Reformer 3 permitting and remain creditable for TFO netting purposes. Consequently,
since these emissions are contemporaneous and creditable, they are included in the TFO
contemporaneous netting analysis.
The below table 4-3 is provided for informational purposes and shows the PTI’s
issued prior to those above to verify that they are no longer contemporaneous.
Table 4-4 Previous Projects no longer contemporaneous
Description of Project Permit Date of PTI Date of startup
Delta Valve Project 04-01471 7-17-07 November-07
FCCU Wet Gas Compressor Replacement
04-01482 9-18-07 December-07
Tank 157 reconstruction 04-01492 11-1-07 May-08
ESP Startup (Note 2) Consent Decree/ TV n/a May-08
New Marine Loading tank 04-01496 6-3-08 Not installed
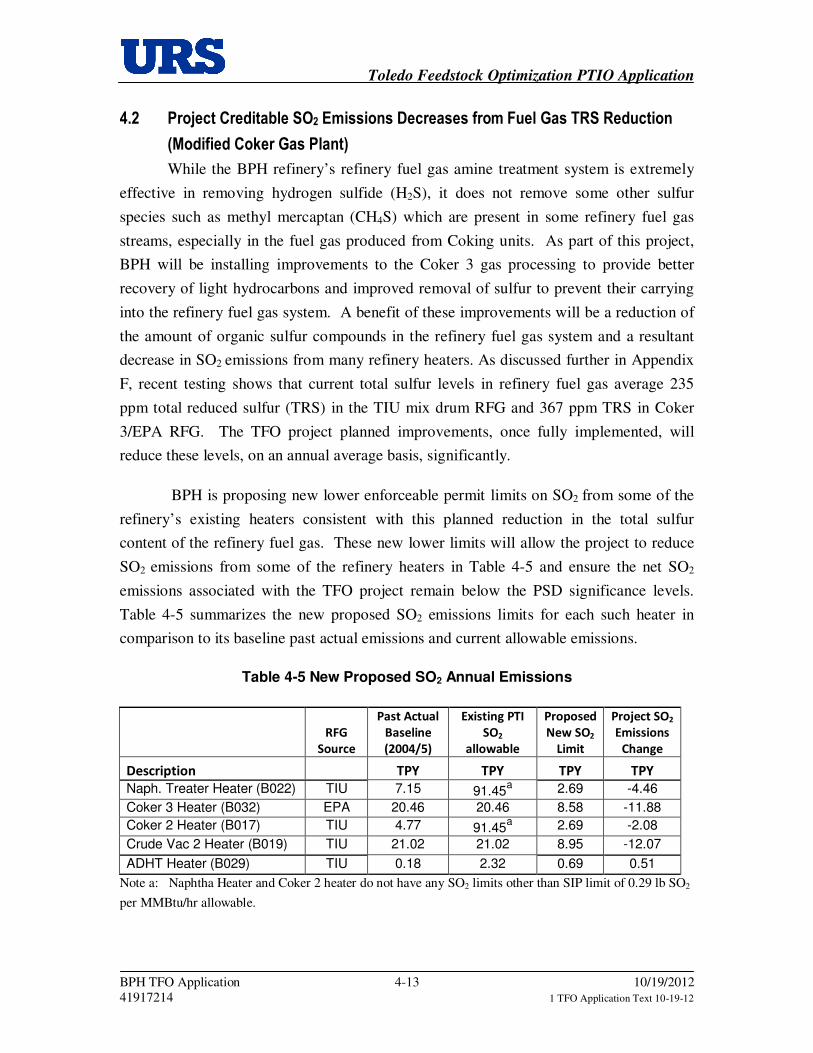
Toledo Feedstock Optimization PTIO Application
BPH TFO Application 4-13 10/19/2012 41917214 1 TFO Application Text 10-19-12
4.2 Project Creditable SO2 Emissions Decreases from Fuel Gas TRS Reduction
(Modified Coker Gas Plant)
While the BPH refinery’s refinery fuel gas amine treatment system is extremely
effective in removing hydrogen sulfide (H2S), it does not remove some other sulfur
species such as methyl mercaptan (CH4S) which are present in some refinery fuel gas
streams, especially in the fuel gas produced from Coking units. As part of this project,
BPH will be installing improvements to the Coker 3 gas processing to provide better
recovery of light hydrocarbons and improved removal of sulfur to prevent their carrying
into the refinery fuel gas system. A benefit of these improvements will be a reduction of
the amount of organic sulfur compounds in the refinery fuel gas system and a resultant
decrease in SO2 emissions from many refinery heaters. As discussed further in Appendix
F, recent testing shows that current total sulfur levels in refinery fuel gas average 235
ppm total reduced sulfur (TRS) in the TIU mix drum RFG and 367 ppm TRS in Coker
3/EPA RFG. The TFO project planned improvements, once fully implemented, will
reduce these levels, on an annual average basis, significantly.
BPH is proposing new lower enforceable permit limits on SO2 from some of the
refinery’s existing heaters consistent with this planned reduction in the total sulfur
content of the refinery fuel gas. These new lower limits will allow the project to reduce
SO2 emissions from some of the refinery heaters in Table 4-5 and ensure the net SO2
emissions associated with the TFO project remain below the PSD significance levels.
Table 4-5 summarizes the new proposed SO2 emissions limits for each such heater in
comparison to its baseline past actual emissions and current allowable emissions.
Table 4-5 New Proposed SO2 Annual Emissions
RFG
Source
Past Actual
Baseline
(2004/5)
Existing PTI
SO2
allowable
Proposed
New SO2
Limit
Project SO2
Emissions
Change
Description TPY TPY TPY TPY
Naph. Treater Heater (B022) TIU 7.15 91.45a 2.69 -4.46
Coker 3 Heater (B032) EPA 20.46 20.46 8.58 -11.88
Coker 2 Heater (B017) TIU 4.77 91.45a 2.69 -2.08
Crude Vac 2 Heater (B019) TIU 21.02 21.02 8.95 -12.07
ADHT Heater (B029) TIU 0.18 2.32 0.69 0.51
Note a: Naphtha Heater and Coker 2 heater do not have any SO2 limits other than SIP limit of 0.29 lb SO2
per MMBtu/hr allowable.
Toledo Feedstock Optimization PTIO Application
BPH TFO Application 4-14 10/19/2012 41917214 1 TFO Application Text 10-19-12
Although additional reductions in SO2 emissions from some other heaters likely
will occur, no other changes to allowable emissions for other heaters are claimed in this
project’s PSD netting. (Note: The TFO PSD netting analysis does assume that OEPA
will impose annual SO2 limits on the maximum annual PTE for the new Crude 1 and
Vacuum 1 heaters being installed by this project at the emissions rates in Table 2-1 and
detailed in Appendix A.)
Due to practical project execution constraints, implementation of this refinery fuel
gas sulfur improvements may not be in place immediately upon the start-up of the TFO
project scope items that would increase SO2 emissions. Therefore, BPH proposes to
demonstrate compliance with the new SO2 limits in Table 4-5 only after the completion
of the modified Coker gas plant portion of this project, which may lag startup of the first
SO2 increasing scope elements by approximately 15 months. For the interim period
before the modifications of the Coker gas plant, BPH is proposing an interim SO2 group
limit on total SO2 emissions from emission units affected by the TFO project and all
contemporaneous projects to keep project SO2 increases below PSD significance levels.
The interim group limit will be effective until the new permanent emissions limits
discussed above become effective, which is proposed to be the later of (a) fifteen (15)
months or (b) the completion of construction and initial shakedown of the modified
Coker Gas Plant. Details of the proposed interim SO2 group limit are included in the
Administrative Permit Application included in Appendix G.
4.3 Other Proposed Permit Condition Changes
New SO2 limits on the SRUs: In order to ensure that SO2 emissions increases
from the TFO project do not exceed significance levels, BPH is proposing to limit the
maximum combined potential SO2 emissions increase of the refinery’s Sulfur Recovery
Units, SRU 1 (P009) and SRU 2/3 (P037) on a 12-month rolling basis. SRU 2/3
currently has a PTI limit of 172 tons/yr SO2. SRU 1 does not have a current limit. BPH
proposes a limit on the combined SO2 emissions of the two units of 80 tons/yr SO2 on a
rolling 12 month average basis. Each unit has an existing SO2 CEMs which can be used
to demonstrate compliance.
Toledo Feedstock Optimization PTIO Application
BPH TFO Application 5-1 10/19/2012 41917214 1 TFO Application Text 10-19-12
5.0 Best Available Technology (BAT)
As mentioned in Section 3.6.1 of this application, the permitting of the TFO
project requires the employment of Best Available Technology (BAT) on new or
modified emissions sources as required under the OAC Chapter 3745-31-05, “Criteria for
decision by the director”. One of these requirements is that BAT be installed for all new
and modified units that emit criteria pollutants with an applicable NAAQS standard.
Accordingly, the pollutants subject to BAT for this project are VOC, CO, SO2,
particulate, and NOx. GHG and HAP emissions are not subject to BAT because no
NAAQS standard applies. However, these emissions are typically minimized through the
implementation of BAT on the other regulated pollutants. New and modified equipment
in this project subject to BAT are the Crude/Vacuum 1 new heaters, new fugitive piping
components and the modified Coker 3 process unit. Other unmodified emission sources
that merely increase utilization are not subject to this requirement.
BAT is defined in Ohio EPA Engineering Guide #42 as “a case-by-case
determination of an emissions limit and/or control technique which, taking into account
environmental, energy, and economic considerations, represents the maximum emission
control achievable by the source.” The BAT evaluation considers the energy,
environmental, economic, and other costs associated with each alternative technology,
and the benefit of reduced emissions that the technology would bring.
According to OEPA policy3 the procedure for determining BAT limits includes
first evaluating if a MACT/BACT or LAER standard applies for each emission
unit/pollutant. If one of these standards apply, then this is the BAT limit. If there is no
MACT, BACT or LAER standard, next the state VOC and NOx RACT rules are reviewed
to see if a similar source has a RACT limit. If so, the most stringent RACT limit on the
same type of source becomes the BAT limit. Finally, if none of these limits apply to the
new or modified emission units or the pollutants emitted, then a case-by-case BAT
analysis is performed.
In the case of this project, there are no MACT, BACT, LAER or RACT limits
applicable to the Ohio BAT regulated pollutants for the TFO new or modified sources.
3 BAT Requirements for Permit Applications Filed On or After August 3, 2009, Inter-Office Communication from M. Hopkins, December 10, 2009.
Toledo Feedstock Optimization PTIO Application
BPH TFO Application 5-2 10/19/2012 41917214 1 TFO Application Text 10-19-12
Accordingly, BPH utilized a case-by-case “top-down” approach to review various control
strategies for the BAT regulated emissions from the TFO project. The “top-down”
evaluation of BAT commonly follows a five-step process summarized as follows:
• Step 1 – Identify All Control Technologies;
• Step 2 – Eliminate Technically Infeasible Options;
• Step 3 – Rank Remaining Control Technologies by Control Effectiveness;
• Step 4 – Evaluate the Most Effective Controls and Document Results;
• Step 5 – Select BAT.
Where a New Source Performance Standards (NSPS) in 40 CFR Part 60 applies
to a source subject to BAT, that NSPS defines the minimum level of control considered
in the BAT analysis. It is common for BAT to be determined to compliance with the
applicable NSPS, especially for newly established NSPS standards. The applicable
NSPS regulations to the new and modified sources in the TFO project are as follows:
• NSPS Subpart Ja, which regulates SO2 emissions from new or modified
heaters by requiring combustion devices that burn gaseous fuels to only burn
gas with no more than 162 ppm H2S (3-hour average) and 60 ppm (H2S) on an
annual average, (or expressed as SO2 in the stack: 20 ppm 3-hr average and 8
ppm annual average),
• NSPS Subpart Ja, which limits NOx emissions from new or modified heaters
to 0.04 lb/MMBtu or 40 ppmv (dry basis, corrected to 0% excess oxygen) on a
30-day rolling average for refinery process heaters,
• NSPS Ja, which requires delayed cokers to depressure to 5 lb per square inch
gauge before venting the exhaust gases to the fuel gas system; and
• NSPS Subpart GGGa, which requires use of a specific LDAR program to
control VOC emissions from piping (applicable to the new fugitive
component additions of this project).
Table 5-1 summarizes the BAT proposals for the TFO project’s new or modified
emissions sources. The following sections describe and document the BAT
determination for each emission unit type and pollutant.
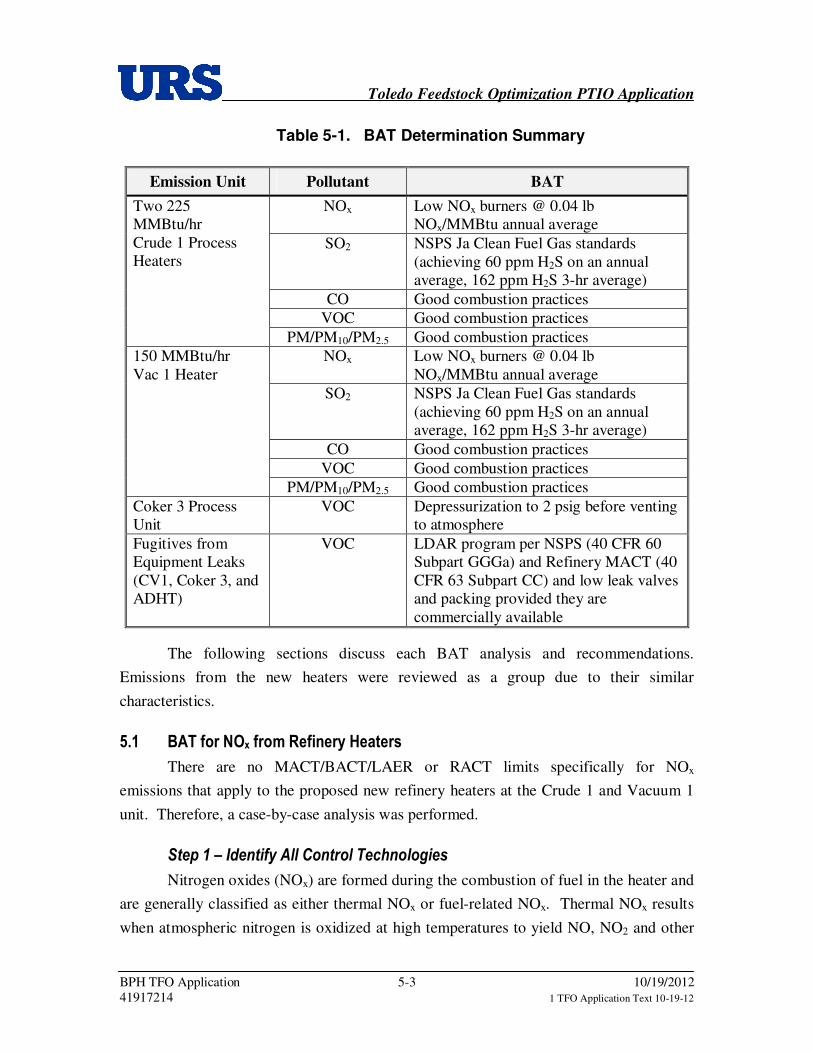
Toledo Feedstock Optimization PTIO Application
BPH TFO Application 5-3 10/19/2012 41917214 1 TFO Application Text 10-19-12
Table 5-1. BAT Determination Summary
Emission Unit Pollutant BAT
Two 225 MMBtu/hr Crude 1 Process Heaters
NOx Low NOx burners @ 0.04 lb NOx/MMBtu annual average
SO2 NSPS Ja Clean Fuel Gas standards (achieving 60 ppm H2S on an annual average, 162 ppm H2S 3-hr average)
CO Good combustion practices VOC Good combustion practices
PM/PM10/PM2.5 Good combustion practices 150 MMBtu/hr Vac 1 Heater
NOx Low NOx burners @ 0.04 lb NOx/MMBtu annual average
SO2 NSPS Ja Clean Fuel Gas standards (achieving 60 ppm H2S on an annual average, 162 ppm H2S 3-hr average)
CO Good combustion practices
VOC Good combustion practices PM/PM10/PM2.5 Good combustion practices
Coker 3 Process Unit
VOC Depressurization to 2 psig before venting to atmosphere
Fugitives from Equipment Leaks (CV1, Coker 3, and ADHT)
VOC LDAR program per NSPS (40 CFR 60 Subpart GGGa) and Refinery MACT (40 CFR 63 Subpart CC) and low leak valves and packing provided they are commercially available
The following sections discuss each BAT analysis and recommendations.
Emissions from the new heaters were reviewed as a group due to their similar
characteristics.
5.1 BAT for NOx from Refinery Heaters
There are no MACT/BACT/LAER or RACT limits specifically for NOx
emissions that apply to the proposed new refinery heaters at the Crude 1 and Vacuum 1
unit. Therefore, a case-by-case analysis was performed.
Step 1 – Identify All Control Technologies
Nitrogen oxides (NOx) are formed during the combustion of fuel in the heater and
are generally classified as either thermal NOx or fuel-related NOx. Thermal NOx results
when atmospheric nitrogen is oxidized at high temperatures to yield NO, NO2 and other
Toledo Feedstock Optimization PTIO Application
BPH TFO Application 5-4 10/19/2012 41917214 1 TFO Application Text 10-19-12
oxides of nitrogen. Fuel-related NOx is formed from the chemically bound nitrogen in
the fuel. For natural gas or refinery fuel gas combustion, thermal NOx formation is the
dominant mechanism since there is little or no nitrogen bound in the fuel.
The rate of formation of thermal NOx is a function of residence time and free
oxygen, and is exponential with peak flame temperature. “Front-end” NOx control
techniques are aimed at controlling one or more of these variables. The most efficient
front-end combustion controls for heaters include low NOx burners. “Add-on” controls
attempt to chemically reduce the NOx emissions after they are created through catalytic
or non-catalytic techniques.
In order to identify possible NOx control technologies and resulting emission
rates, a review of EPA’s RACT/BAT/LAER Clearinghouse was conducted. A search of
the RACT/BACT/LAER Clearinghouse (RBLC) was conducted, and several entries
within the past ten years were found for similar refinery-fuel gas fired heaters. Table 5-2,
Database Survey -- Available NOx Control Technologies, summarize the information
found. The data search results were filtered to leave only BACT determinations on
refinery-fuel gas heaters and boilers, and to show only those with lb/MMBtu limits to
allow for comparison.
• For heaters less than 200 MMBtu/hr, no add-on controls were identified in
the RBLC. Emissions limits utilizing combustion controls of low-NOx or
Ultra-Low NOx burners range from 0.03-0.08 lb/MMBtu, and
• For heaters and boilers greater than 250 MMBtu/hr, there are examples of
LNB, FGR or SCR with a range of emission limits of 0.0125 – 0.08 lb
NOx/MMBtu.
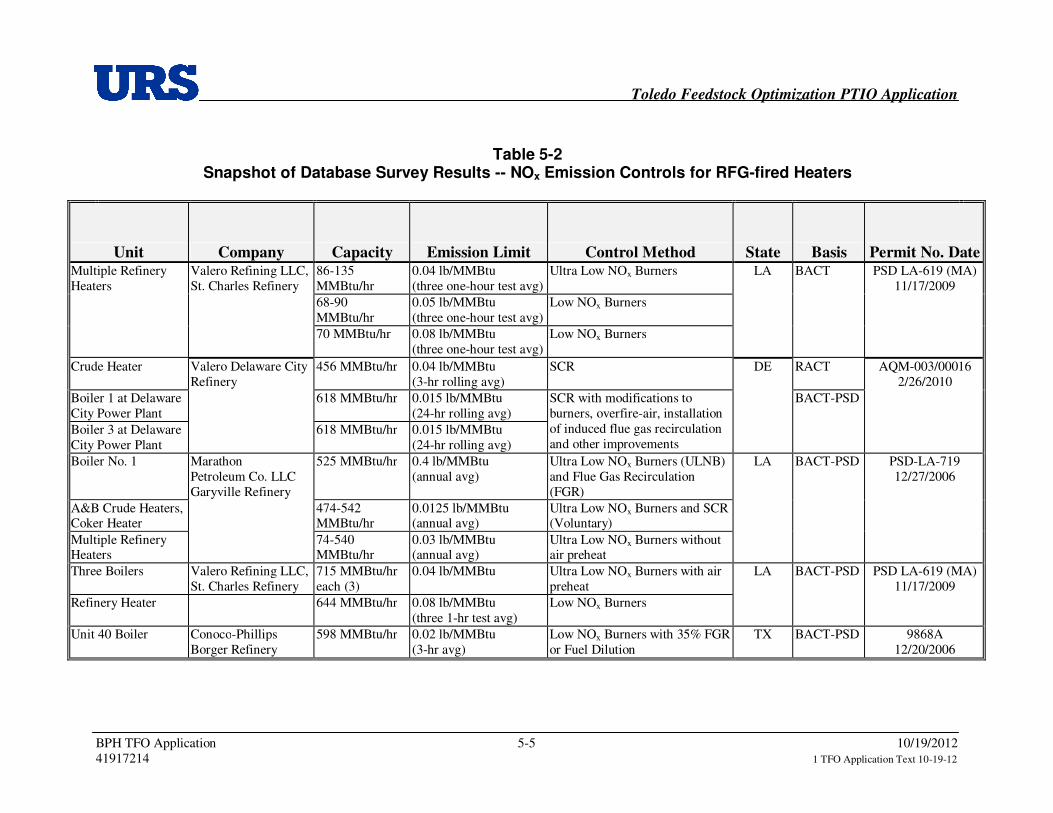
Toledo Feedstock Optimization PTIO Application
BPH TFO Application 5-5 10/19/2012 41917214 1 TFO Application Text 10-19-12
Table 5-2
Snapshot of Database Survey Results -- NOx Emission Controls for RFG-fired Heaters
Unit Company Capacity Emission Limit Control Method State Basis Permit No. Date Multiple Refinery Heaters
Valero Refining LLC, St. Charles Refinery
86-135 MMBtu/hr
0.04 lb/MMBtu (three one-hour test avg)
Ultra Low NOx Burners LA BACT PSD LA-619 (MA) 11/17/2009
68-90 MMBtu/hr
0.05 lb/MMBtu (three one-hour test avg)
Low NOx Burners
70 MMBtu/hr 0.08 lb/MMBtu (three one-hour test avg)
Low NOx Burners
Crude Heater Valero Delaware City Refinery
456 MMBtu/hr 0.04 lb/MMBtu (3-hr rolling avg)
SCR DE RACT AQM-003/00016 2/26/2010
Boiler 1 at Delaware City Power Plant
618 MMBtu/hr 0.015 lb/MMBtu (24-hr rolling avg)
SCR with modifications to burners, overfire-air, installation of induced flue gas recirculation and other improvements
BACT-PSD
Boiler 3 at Delaware City Power Plant
618 MMBtu/hr 0.015 lb/MMBtu (24-hr rolling avg)
Boiler No. 1 Marathon Petroleum Co. LLC Garyville Refinery
525 MMBtu/hr 0.4 lb/MMBtu (annual avg)
Ultra Low NOx Burners (ULNB) and Flue Gas Recirculation (FGR)
LA BACT-PSD PSD-LA-719 12/27/2006
A&B Crude Heaters, Coker Heater
474-542 MMBtu/hr
0.0125 lb/MMBtu (annual avg)
Ultra Low NOx Burners and SCR (Voluntary)
Multiple Refinery Heaters
74-540 MMBtu/hr
0.03 lb/MMBtu (annual avg)
Ultra Low NOx Burners without air preheat
Three Boilers Valero Refining LLC, St. Charles Refinery
715 MMBtu/hr each (3)
0.04 lb/MMBtu Ultra Low NOx Burners with air preheat
LA BACT-PSD PSD LA-619 (MA) 11/17/2009
Refinery Heater 644 MMBtu/hr 0.08 lb/MMBtu (three 1-hr test avg)
Low NOx Burners
Unit 40 Boiler Conoco-Phillips Borger Refinery
598 MMBtu/hr 0.02 lb/MMBtu (3-hr avg)
Low NOx Burners with 35% FGR or Fuel Dilution
TX BACT-PSD 9868A 12/20/2006
Toledo Feedstock Optimization PTIO Application
BPH TFO Application 5-6 10/19/2012 41917214 1 TFO Application Text 10-19-12
In addition to the findings in our RBLC search results and based on experience
and industry knowledge with other types of combustion sources, we have identified
selective non-catalytic reduction (SNCR) as an additional technology to consider.
Therefore, the following potential NOx control technology options are evaluated in this
BAT analysis:
• Low NOx (or ultra low NOx ) Burners;
• Flue Gas Recirculation
• Selective Catalytic Reduction (SCR); and
• Selective Non-Catalytic Reduction (SNCR).
A description of each technology and its potential application to the proposed heaters is
included in the following section.
Step 2 – Eliminate Technically Infeasible Options
Combustion Controls (Low NOx burners) - Combustion modifications, such as
low-NOx burners reduce the concentration of NOx emissions in the heater exhaust gas by
decreasing combustion temperature or decreasing the quantity of oxygen available for
combustion. The most commonly used burner in process heaters is the direct flame type,
where combustion is performed in the open space within the heater’s firebox. Typical
low NOx combustors achieve 0.04 to 0.07 lb NOx/MMBtu on an annual average basis.
More advanced “next generation ultra-low NOx burner” can, in some circumstances, be
designed to achieve as low as 0.02 lb NOx/MMBtu on an annual average basis on some
types of fuels and heaters.
The ultimate performance of advanced low-NOx burners depends on the exact
composition of gaseous fuel and the configuration and operating conditions of the
specific heater. Although, some PSD BACT entries in the RBLC database for heaters
show predicted annual emissions performance of 0.03 lb NOx/MMBtu, BP-Husky
believes that this low level may not be possible for ultra-low NOx burners in BP-Husky’s
proposed heaters. The BPH Toledo Refinery has past experience installing burners
supposedly designed to achieve 0.018 lb/MMBtu, which performed at a level of 0.036
lb/MMBtu in actual operation. In the proposed heater configurations, and with BP-
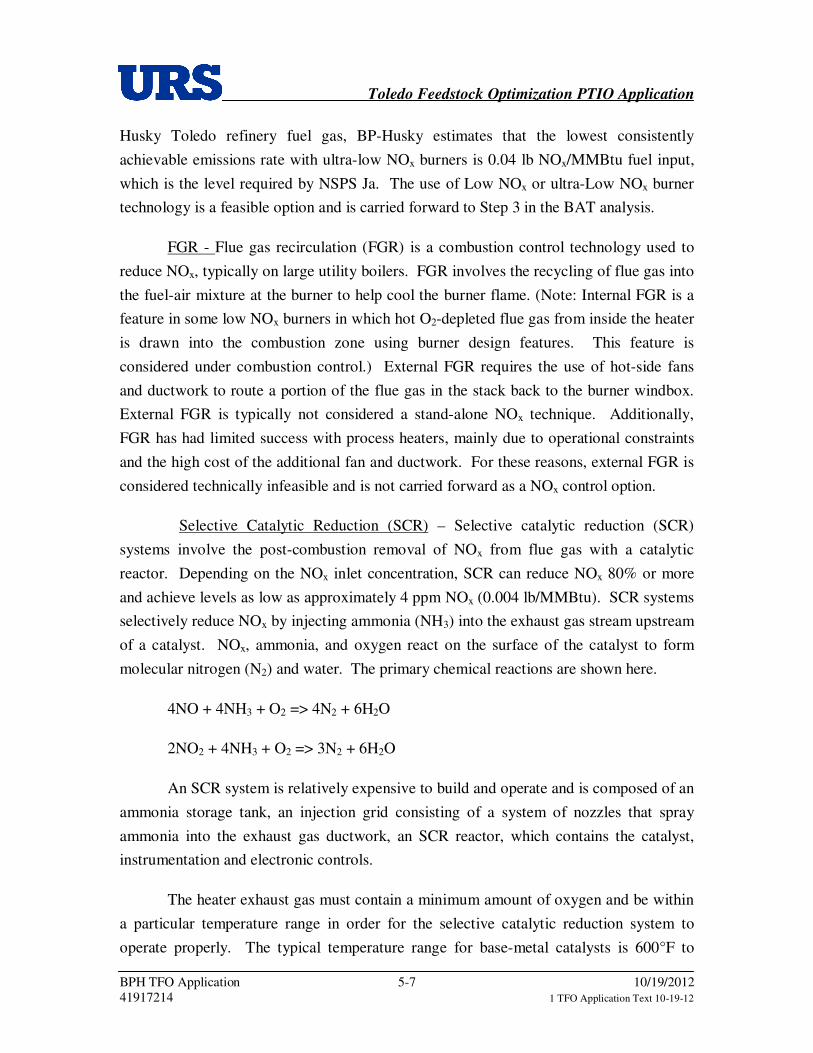
Toledo Feedstock Optimization PTIO Application
BPH TFO Application 5-7 10/19/2012 41917214 1 TFO Application Text 10-19-12
Husky Toledo refinery fuel gas, BP-Husky estimates that the lowest consistently
achievable emissions rate with ultra-low NOx burners is 0.04 lb NOx/MMBtu fuel input,
which is the level required by NSPS Ja. The use of Low NOx or ultra-Low NOx burner
technology is a feasible option and is carried forward to Step 3 in the BAT analysis.
FGR - Flue gas recirculation (FGR) is a combustion control technology used to
reduce NOx, typically on large utility boilers. FGR involves the recycling of flue gas into
the fuel-air mixture at the burner to help cool the burner flame. (Note: Internal FGR is a
feature in some low NOx burners in which hot O2-depleted flue gas from inside the heater
is drawn into the combustion zone using burner design features. This feature is
considered under combustion control.) External FGR requires the use of hot-side fans
and ductwork to route a portion of the flue gas in the stack back to the burner windbox.
External FGR is typically not considered a stand-alone NOx technique. Additionally,
FGR has had limited success with process heaters, mainly due to operational constraints
and the high cost of the additional fan and ductwork. For these reasons, external FGR is
considered technically infeasible and is not carried forward as a NOx control option.
Selective Catalytic Reduction (SCR) – Selective catalytic reduction (SCR)
systems involve the post-combustion removal of NOx from flue gas with a catalytic
reactor. Depending on the NOx inlet concentration, SCR can reduce NOx 80% or more
and achieve levels as low as approximately 4 ppm NOx (0.004 lb/MMBtu). SCR systems
selectively reduce NOx by injecting ammonia (NH3) into the exhaust gas stream upstream
of a catalyst. NOx, ammonia, and oxygen react on the surface of the catalyst to form
molecular nitrogen (N2) and water. The primary chemical reactions are shown here.
4NO + 4NH3 + O2 => 4N2 + 6H2O
2NO2 + 4NH3 + O2 => 3N2 + 6H2O
An SCR system is relatively expensive to build and operate and is composed of an
ammonia storage tank, an injection grid consisting of a system of nozzles that spray
ammonia into the exhaust gas ductwork, an SCR reactor, which contains the catalyst,
instrumentation and electronic controls.
The heater exhaust gas must contain a minimum amount of oxygen and be within
a particular temperature range in order for the selective catalytic reduction system to
operate properly. The typical temperature range for base-metal catalysts is 600°F to
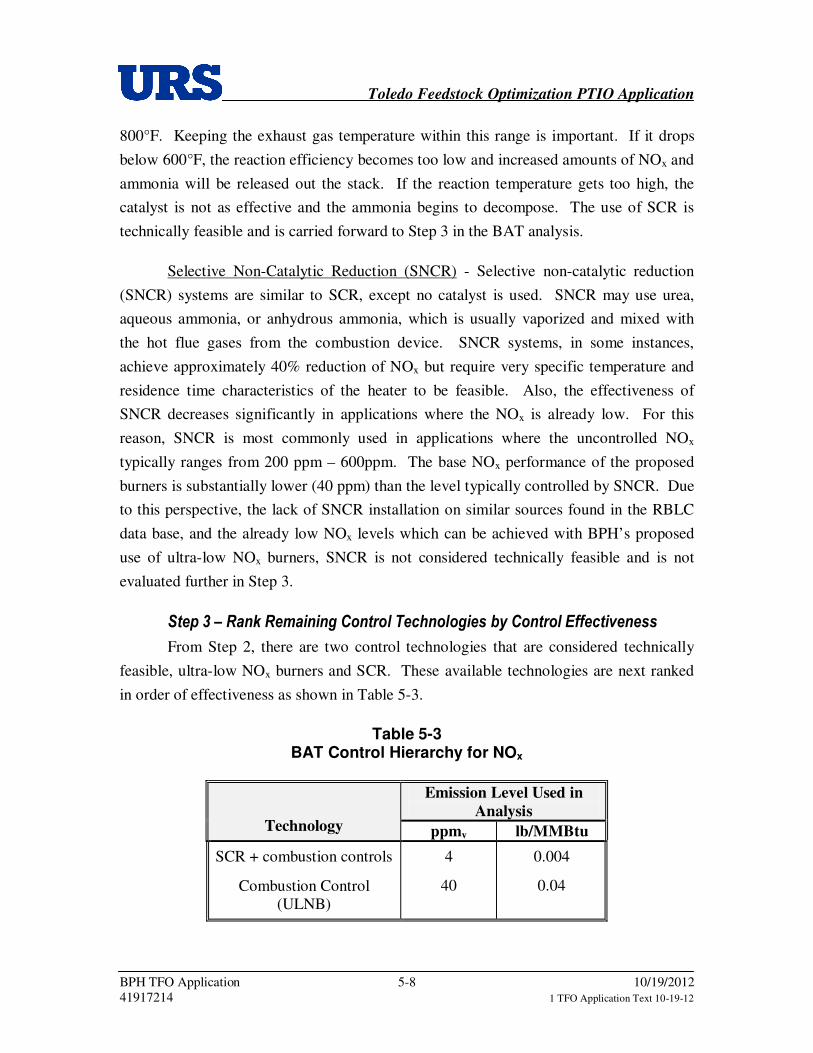
Toledo Feedstock Optimization PTIO Application
BPH TFO Application 5-8 10/19/2012 41917214 1 TFO Application Text 10-19-12
800°F. Keeping the exhaust gas temperature within this range is important. If it drops
below 600°F, the reaction efficiency becomes too low and increased amounts of NOx and
ammonia will be released out the stack. If the reaction temperature gets too high, the
catalyst is not as effective and the ammonia begins to decompose. The use of SCR is
technically feasible and is carried forward to Step 3 in the BAT analysis.
Selective Non-Catalytic Reduction (SNCR) - Selective non-catalytic reduction
(SNCR) systems are similar to SCR, except no catalyst is used. SNCR may use urea,
aqueous ammonia, or anhydrous ammonia, which is usually vaporized and mixed with
the hot flue gases from the combustion device. SNCR systems, in some instances,
achieve approximately 40% reduction of NOx but require very specific temperature and
residence time characteristics of the heater to be feasible. Also, the effectiveness of
SNCR decreases significantly in applications where the NOx is already low. For this
reason, SNCR is most commonly used in applications where the uncontrolled NOx
typically ranges from 200 ppm – 600ppm. The base NOx performance of the proposed
burners is substantially lower (40 ppm) than the level typically controlled by SNCR. Due
to this perspective, the lack of SNCR installation on similar sources found in the RBLC
data base, and the already low NOx levels which can be achieved with BPH’s proposed
use of ultra-low NOx burners, SNCR is not considered technically feasible and is not
evaluated further in Step 3.
Step 3 – Rank Remaining Control Technologies by Control Effectiveness
From Step 2, there are two control technologies that are considered technically
feasible, ultra-low NOx burners and SCR. These available technologies are next ranked
in order of effectiveness as shown in Table 5-3.
Table 5-3 BAT Control Hierarchy for NOx
Technology
Emission Level Used in Analysis
ppmv lb/MMBtu
SCR + combustion controls 4 0.004
Combustion Control (ULNB)
40 0.04
Toledo Feedstock Optimization PTIO Application
BPH TFO Application 5-9 10/19/2012 41917214 1 TFO Application Text 10-19-12
Step 4 - Evaluate Most Effective Controls and Document Results
This step involves the consideration of energy, environmental, and economic
impacts associated with each feasible control technology. The control options evaluated
in detail for the BAT analysis were (1) combustion control (low NOx burners), and (2) the
combination of combustion control with SCR.
Costs: Separate cost estimates were generated for the Crude 1 Heaters (225
MMBtu/hr each) and the Vacuum 1 Heater (150 MMBtu/hr). These estimates utilized
capital cost quotes from a previous refinery project, and were ratioed based on heater size
(using accepted scaling algorithms). EPA factors were used to estimate Total Capital
Investment and Annualized Costs. Table 5-4 summarizes these estimates and the details
are included in Appendix C.
Other Toxic/Environmental/Energy Impacts: The ammonia used as a reagent in
SCR has some negative side effects. Anhydrous ammonia is very hazardous if
accidently released. Consequently, many users of SCR instead use aqueous ammonia
(dissolved in water). The use of aqueous ammonia requires extra energy for vaporization
of the ammonia. That extra energy creates additional emissions. Also, for maximum
SCR effectiveness, some amount of excess ammonia must be added which results in a
small “slip” of ammonia in the stack. This creates emissions of this toxic pollutant that
would not otherwise occur. Also, a portion of the ammonia can react with sulfur in the
stack forming ammonium sulfate or bisulfate solids, which increase particulate emissions.
In many cases, these effects can be reasonably managed and their overall impacts can be
small.
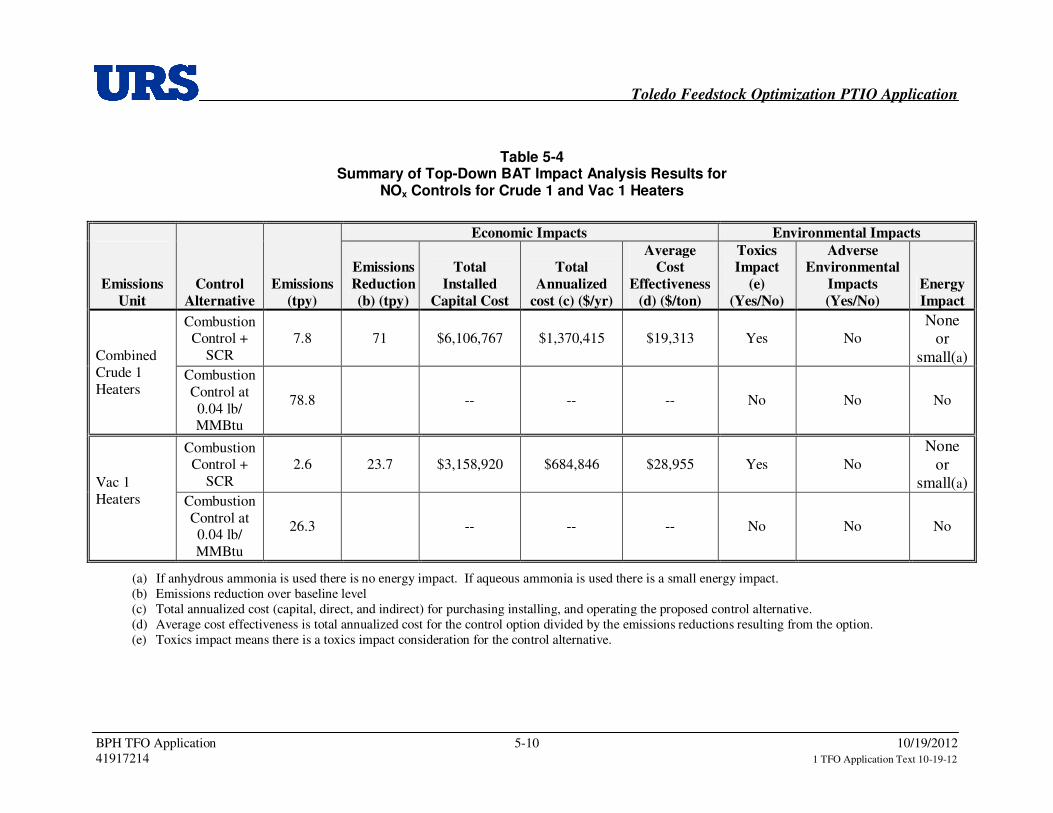
Toledo Feedstock Optimization PTIO Application
BPH TFO Application 5-10 10/19/2012 41917214 1 TFO Application Text 10-19-12
Table 5-4 Summary of Top-Down BAT Impact Analysis Results for
NOx Controls for Crude 1 and Vac 1 Heaters
Emissions Unit
Control Alternative
Emissions (tpy)
Economic Impacts Environmental Impacts
Emissions Reduction (b) (tpy)
Total Installed
Capital Cost
Total Annualized
cost (c) ($/yr)
Average Cost
Effectiveness (d) ($/ton)
Toxics Impact
(e) (Yes/No)
Adverse Environmental
Impacts (Yes/No)
Energy Impact
Combined Crude 1 Heaters
Combustion Control +
SCR 7.8 71 $6,106,767 $1,370,415 $19,313 Yes No
None or
small(a) Combustion Control at 0.04 lb/ MMBtu
78.8 -- -- -- No No No
Vac 1 Heaters
Combustion Control +
SCR 2.6 23.7 $3,158,920 $684,846 $28,955 Yes No
None or
small(a) Combustion Control at 0.04 lb/ MMBtu
26.3 -- -- -- No No No
(a) If anhydrous ammonia is used there is no energy impact. If aqueous ammonia is used there is a small energy impact. (b) Emissions reduction over baseline level (c) Total annualized cost (capital, direct, and indirect) for purchasing installing, and operating the proposed control alternative. (d) Average cost effectiveness is total annualized cost for the control option divided by the emissions reductions resulting from the option. (e) Toxics impact means there is a toxics impact consideration for the control alternative.

Toledo Feedstock Optimization PTIO Application
BPH TFO Application 5-11 10/19/2012 41917214 1 TFO Application Text 10-19-12
Step 5 – Select BAT for NOx Control
The final step in the top-down BAT analysis process is to select BAT. For this
case, the final selection of BAT comes down to a question of the cost-effectiveness of the
control options. Cost effectiveness is the economic criterion used to assess the potential
for achieving an objective. Cost-effectiveness in a BAT determination is usually
measured in terms of annual dollars of air pollution control device cost per tons of
pollutant emissions removed by the control device. While there is no specific published
value, a control technology costing approximately $10,000 per ton of pollutant controlled
is a typical cut-off for cost-effectiveness for NOx. As shown in Table 5-4, SCR is not
considered cost-effective for the proposed heaters.
Due to the fact that SCR is not cost-effective, the next highest control option, if
reasonable, is selected as BAT. Combustion controls at an emission rate of 0.04 lb
NOx/MMBtu fuel input on an annual average basis using ultra low NOx burners is
acceptable to BPH and is proposed as BAT for NOx for the new Crude 1 and Vacuum 1
heaters.
5.2 BAT for SO2 from Refinery Heaters
There are no MACT/BACT/LAER or RACT limits for SO2 emissions that apply to the
proposed new refinery heaters at the Crude/Vacuum 1 unit. There are, however, new
NSPS limits on H2S fuel sulfur levels that apply, and the project is proposing to install
modifications at the Coker gas plant that will lower the total amount of SO2 producing
compounds in the refinery fuel gas. SO2 is generated when sulfur-bearing fuels such as
refinery fuel gas are combusted, and the H2S and other sulfur species are oxidized to SO2.
As described in the following paragraphs, BAT for SO2 emissions from refinery heaters
is proposed to be addressed by the following NSPS Ja requirement:
• Compliance with recently issued NSPS Ja which regulates SO2 by limiting
the allowable H2S content of refinery fuel gas to no more than 162 ppmv
H2S on a short term (3 hr average) basis and 60 ppmv on a rolling annual
basis.
The refinery utilizes MDEA (methyl diethanolamine) scrubbers to remove H2S
from the refinery fuel gas prior to combustion in any of the facilities heaters and boilers.
This control technology is used throughout the refining industry and is extremely
Toledo Feedstock Optimization PTIO Application
BPH TFO Application 5-12 10/19/2012 41917214 1 TFO Application Text 10-19-12
effective at removing H2S, the major sulfur species in refinery fuel gas. Prior to 2008,
new and modified refinery heaters were required to comply with NSPS J standard of 162
ppmv (3 hr average). In their recent update to the refinery NSPS Ja, US EPA considered
requiring lower levels of H2S. However, in the final rulemaking, US EPA kept the 162
ppm 3-hr average standard but also added a 60 ppmv H2S annual limit. As explained in
their April 2008 Regulatory Impact Analysis4, US EPA estimated the incremental costs to
comply with this new annual H2S standard was reasonable at $1,500 to $2,400/ton SO2
reduced.
In their NSPS Ja Regulatory Impact Analysis, US EPA also considered a more
stringent standard regulating all sulfur species instead of just H2S. The option evaluated
reflected a limit of 162 ppmv TRS (total reduced sulfur) averaged over 3 hours and 60
ppmv annual average. In their evaluation, US EPA determined that standard refinery
amine systems could not comply with this TRS standard and that new separate treatment
would be required. They estimated the costs of controlling TRS to these levels would
incrementally cost $31,000 to $42,000 per ton of SO2 reduced. US EPA judged this to be
prohibitively expensive, and thus, did not impose any sulfur standards on refinery fuel
gas besides the H2S standard.
The estimated cost to control non-H2S sulfur in refinery fuel gas is significantly
higher than traditionally required for Ohio BAT, and should not be required as BAT.
(Note: BPH has volunteered annual SO2 limits on some of the refinery heaters that are
stricter than the NSPS standard in order to provide assurance that SO2 emissions will
remain below PSD significance levels. These voluntary proposals are “beyond BAT” as
demonstrated by US EPA’s economic analysis. Accordingly, BPH proposes that
compliance with the new NSPS Ja standard for H2S of 162 ppmv 3-hr and 60 ppmv 365-
day average should constitute Ohio BAT for SO2 emissions from fuel gas used in the new
refinery heaters.
BPH proposes the BAT permit limit for SO2 be stated as compliance with the
NSPS Ja fuel H2S standard and not expanded to impose a lb/hr SO2 emissions limit as
explained below.
4 Regulatory Impact Analysis for the Petroleum Refineries NSPS, EPA-452/R-08-002, April 2008.
Toledo Feedstock Optimization PTIO Application
BPH TFO Application 5-13 10/19/2012 41917214 1 TFO Application Text 10-19-12
There currently is insufficient data available at BPH or in the refining industry
broadly to establish short-term concentration limits on non-H2S sulfur in refinery fuel
gas. BPH proposes to install new analyzers to measure total sulfur in the refinery fuel
gas system. These analyzers will provide data regarding fluctuations in the total sulfur
content of the BPH refinery fuel gas. However, at this time, there is inadequate data to
establish short-term rate based limits on the total sulfur content of refinery fuel gas and a
corresponding SO2 emissions limit.
Additionally, the only regulatory driver that would relate to a lb/hr SO2 limit is
Ohio EPA’s Best Available Technology (BAT) requirement in OAC 3745-31-05(A)(3).
As discussed above, the refinery’s MDEA (methyl diethanolamine) scrubber control
technology is the same technology used throughout the refining industry and is routinely
accepted as the best available for this purpose. The BAT limit needs to ensure use of
these amine scrubbers to minimize H2S to NSPS J and Ja levels. This purpose can be
accomplished directly by the existing NSPS Subpart J and Ja requirement to monitor and
maintain H2S ppm below this level. BPH proposes that the BAT objective can be
achieved by compliance with the applicable NSPS limit.
5.3 BAT for CO from Refinery Heaters
CO emissions depend on the efficiency of combustion. The less efficient the combustion,
the more CO emissions will result as products of incomplete combustion. Process heaters
are generally designed for good combustion because there is an economic incentive to
ensure that fuel is not wasted. Additionally, gaseous fuel combusts efficiently and a
heater burning only gaseous fuel can be designed to be highly efficient. The RBLC
database was surveyed for recent determinations for CO emissions from refinery-fuel gas
fired heaters. Table 5-5 shows these results. Permitted levels in these BACT
determinations range from 0.04 – 0.08 lb/MMBtu using only good combustion practices.
No other add-on control technologies for CO (or HAPs) were required for gas-fired
heaters.
Therefore, BPH proposes good design and proper operation of the burners to
serve as BAT for CO from the process heaters. AP-42 lists CO emissions at a level of
0.08 lb/MMBtu for natural-gas fired sources. The range in the RBLC for RFG-heaters is
from 0.04-0.08 lb/MMBtu. BPH proposes the new heaters will limit CO to no more than
0.06 lb CO/MMBtu. This value is in the middle of the range reported in the RBLC as

Toledo Feedstock Optimization PTIO Application
BPH TFO Application 5-14 10/19/2012 41917214 1 TFO Application Text 10-19-12
BACT, and is less than AP-42. Based on our experience with similar heaters at the
refinery, we think this is a reasonable and achievable value. BPH proposes a one-time
stack test on the new heaters to demonstrate compliance.
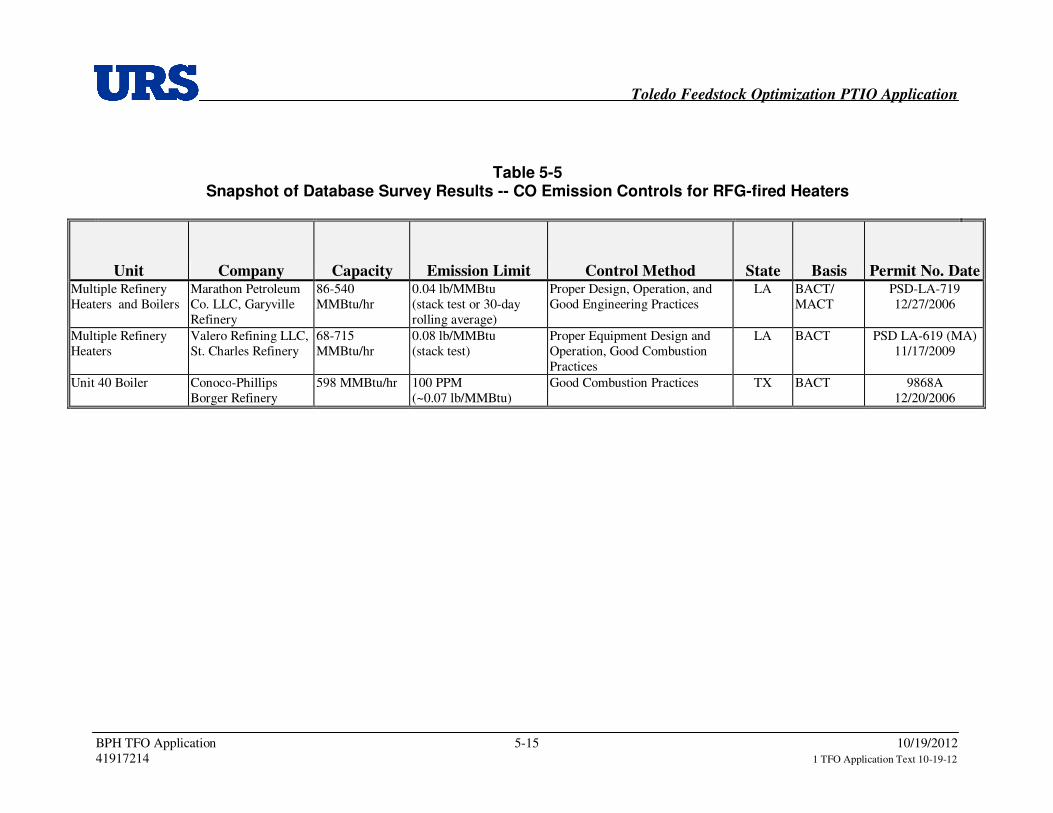
Toledo Feedstock Optimization PTIO Application
BPH TFO Application 5-15 10/19/2012 41917214 1 TFO Application Text 10-19-12
Table 5-5 Snapshot of Database Survey Results -- CO Emission Controls for RFG-fired Heaters
Unit Company Capacity Emission Limit Control Method State Basis Permit No. Date Multiple Refinery Heaters and Boilers
Marathon Petroleum Co. LLC, Garyville Refinery
86-540 MMBtu/hr
0.04 lb/MMBtu (stack test or 30-day rolling average)
Proper Design, Operation, and Good Engineering Practices
LA BACT/ MACT
PSD-LA-719 12/27/2006
Multiple Refinery Heaters
Valero Refining LLC, St. Charles Refinery
68-715 MMBtu/hr
0.08 lb/MMBtu (stack test)
Proper Equipment Design and Operation, Good Combustion Practices
LA BACT PSD LA-619 (MA) 11/17/2009
Unit 40 Boiler Conoco-Phillips Borger Refinery
598 MMBtu/hr 100 PPM (~0.07 lb/MMBtu)
Good Combustion Practices TX BACT 9868A 12/20/2006

Toledo Feedstock Optimization PTIO Application
BPH TFO Application 5-16 10/19/2012 41917214 1 TFO Application Text 10-19-12
5.4 BAT for VOC from Refinery Heaters
The rate of VOC emissions depends on combustion efficiency. Combustion
efficiency is typically very high with gaseous fuels and VOC emissions are extremely
low – too low to even be reliably detected in testing. VOC emissions are minimized by
using good combustion practices, which incorporate high combustion temperatures, long
resident times, and turbulent mixing of fuel and combustion air. For these reasons, BPH
proposes that additional controls would not be cost-effective. As with CO, BAT for VOC
is proposed to be good combustion practices for the new heaters.
5.5 BAT for PM/PM10/PM2.5 from Refinery Heaters
PM, PM10, and PM2.5 emission rates from gas-fired process heaters are inherently
low because they achieve high combustion efficiencies and burn clean fuels. In fact,
outlet PM emissions from gas-fired combustion sources are usually so low that they are
difficult to measure with high accuracy and repeatability using standard EPA approved
methods. Outlet loadings are far too low to justify any type of add-on PM control
devices such as an electrostatic precipitator, baghouse, or cyclone. For these reasons,
good heater design and operation is recognized as BAT for particulate emissions from the
gas-fired process heaters. Additionally, use of the proposed BAT for NOx and SO2 will
help reduce emissions of these precursors to particulate.
5.6 BAT for VOC from Coker 3 Coke Drum Vent
There are no MACT/BACT/LAER or RACT limits for VOC emissions that apply
to the coking unit, Coker 3, drum vent. However, the new NSPS Ja standards require
cokers to be depressure through a closed system until the coke drum pressure is not more
than 5 pounds per square inch gauge (psig) before venting the drum to the atmosphere
during the coke removal process.
The BPH Toledo Refinery currently does not vent to the atmosphere until the
coke drums have depressured to about 3 psig. Proposed modifications to the blowdown
system will enable the refinery to reduce this pressure to not more than 2 psig before
venting the coke drums to the atmosphere. This limit is consistent with industry leading
practice and is more stringent than required by NSPS. Therefore, as BAT for VOC
emissions control from the coke drums, BPH proposes to reduce the drum pressure to not
more than 2 psig prior to venting the drums to atmosphere during the coke removal
process.
Toledo Feedstock Optimization PTIO Application
BPH TFO Application 5-17 10/19/2012 41917214 1 TFO Application Text 10-19-12
5.7 BAT for VOC from Fugitive Equipment Leaks (Coker 3, CV1, AHDT Units)
Small leaks from the seals of pumps and the stem packing of valves are the main
source of fugitive VOC emissions. The new piping components of the modifications at
Coker 3 and other modified units are designed not to leak, but statistically, a few leaks
are expected to occur from time to time. As required by multiple regulations, all new
fugitive emission components will be integrated into the BPH Leak Detection and Repair
(LDAR) program. This program is designed to comply with applicable NSPS Subpart
GGG, Subpart GGGa and Refinery MACT Subpart CC standards. The LDAR program
promptly identifies leaking components and institutes a schedule for the repair. Such an
LDAR program is industry best practice and is the only technically feasible method of
controlling VOC emissions from equipment leaks. In addition, BPH plans to use low
leak valves and packing for the new components provided they are commercially
available. Compliance with the applicable NSPS GGGa and Refinery MACT (CC)
LDAR regulations is proposed as BAT for fugitive VOC emissions from components.
Toledo Feedstock Optimization PTIO Application
BPH TFO Application 6-1 10/19/2012 41917214 1 TFO Application Text 10-19-12
6.0 Permit Application Forms
The Ohio EPA Permit application forms were completed and are included in the
Application created and submitted through the OEPA Air Services web portal.
