tolerancing, alignment and test of the transiting ...€¦ · transiting exoplanet survey satellite...
TRANSCRIPT

Transiting Exoplanet Survey Satellite
This work is sponsored by the National Aeronautics and Space Administration under Air Force Contract #FA8721-05-C-0002. Opinions, interpretations, conclusions and recommendations are those of the author and are not necessarily endorsed by the United States Government..
Brian Primeau, Michael Chrisp, Gregory Balonek, Christian Chesbrough, James Andre, Kristin Clark
Tolerancing, alignment and test of the Transiting Exoplanet Survey Satellite (TESS) optical assembly
https://ntrs.nasa.gov/search.jsp?R=20160010628 2020-04-07T17:39:31+00:00Z
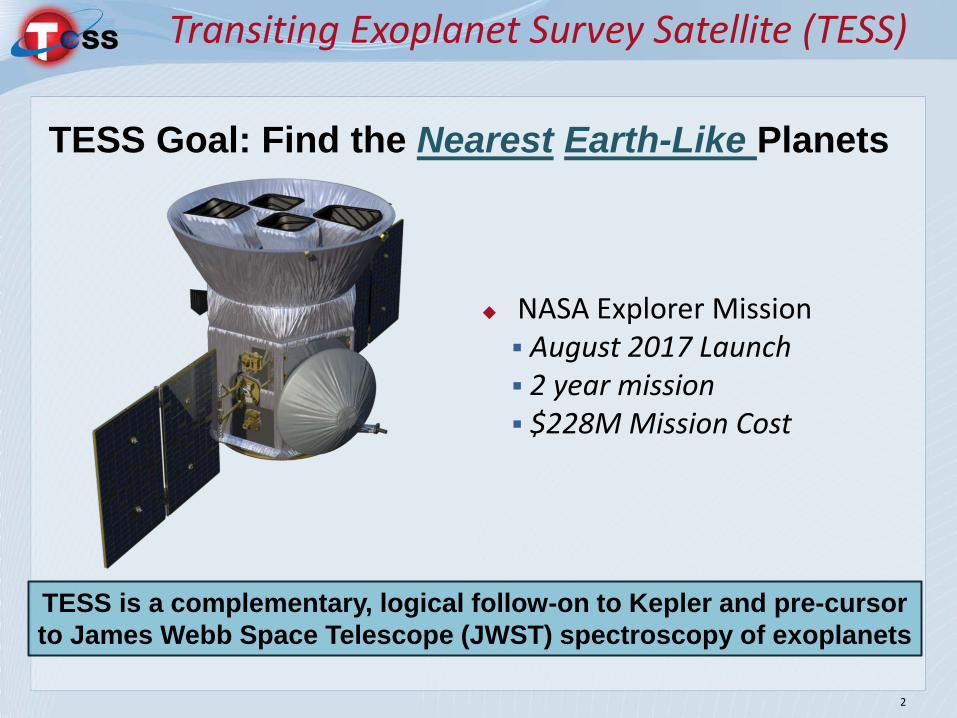
TESS is a complementary, logical follow-on to Kepler and pre-cursor to James Webb Space Telescope (JWST) spectroscopy of exoplanets
TESS Goal: Find the Nearest Earth-Like Planets
NASA Explorer Mission August 2017 Launch 2 year mission $228M Mission Cost
2
Transiting Exoplanet Survey Satellite (TESS)
TESS Instrument Overview
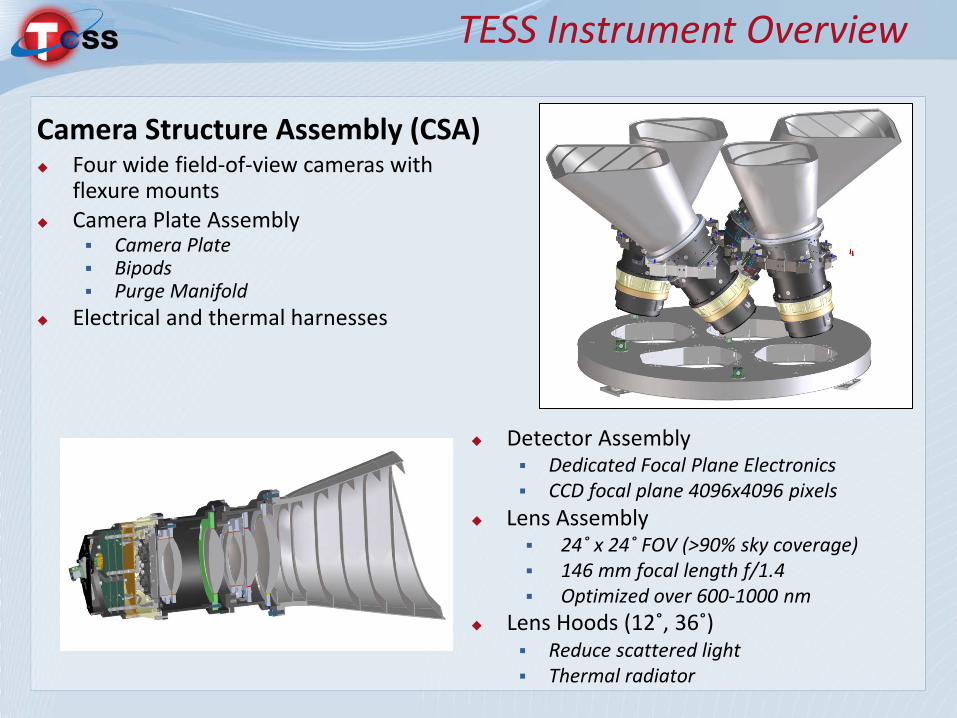
Camera Structure Assembly (CSA) Four wide field-of-view cameras with
flexure mounts Camera Plate Assembly
Camera Plate Bipods Purge Manifold
Electrical and thermal harnesses
Detector Assembly Dedicated Focal Plane Electronics CCD focal plane 4096x4096 pixels
Lens Assembly 24˚ x 24˚ FOV (>90% sky coverage) 146 mm focal length f/1.4 Optimized over 600-1000 nm
Lens Hoods (12˚, 36˚) Reduce scattered light Thermal radiator
TESS Coverage and Environment
4
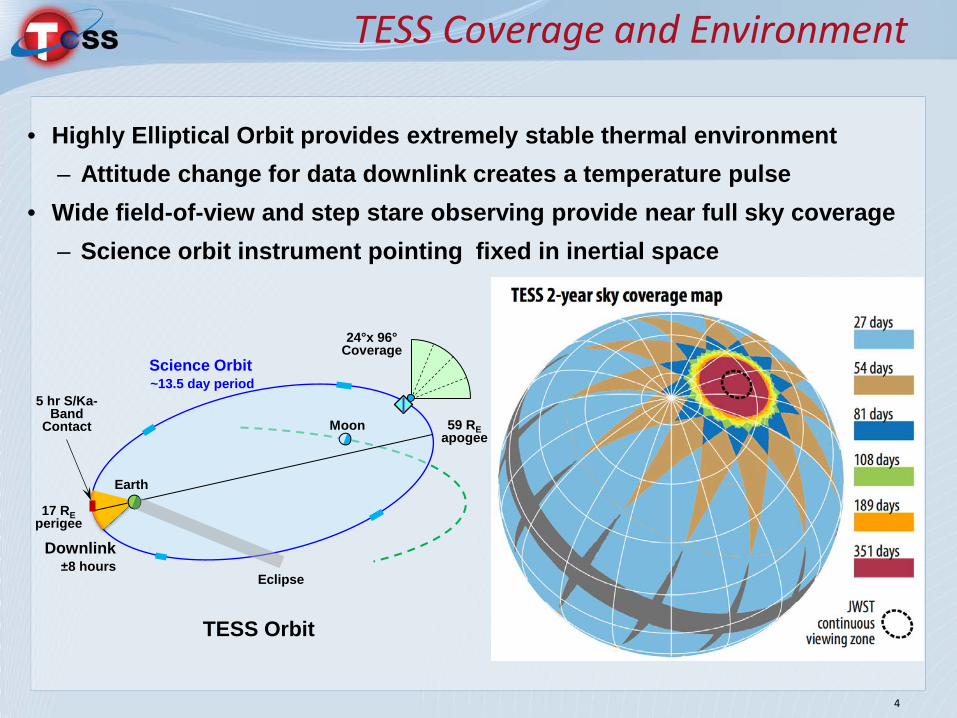
TESS Orbit
Earth
Moon
Downlink
Science Orbit
5 hr S/Ka-Band
Contact
17 RE perigee
59 RE apogee
±8 hours
~13.5 day period
24°x 96° Coverage
Eclipse
• Highly Elliptical Orbit provides extremely stable thermal environment – Attitude change for data downlink creates a temperature pulse
• Wide field-of-view and step stare observing provide near full sky coverage – Science orbit instrument pointing fixed in inertial space
Optical Design Overview
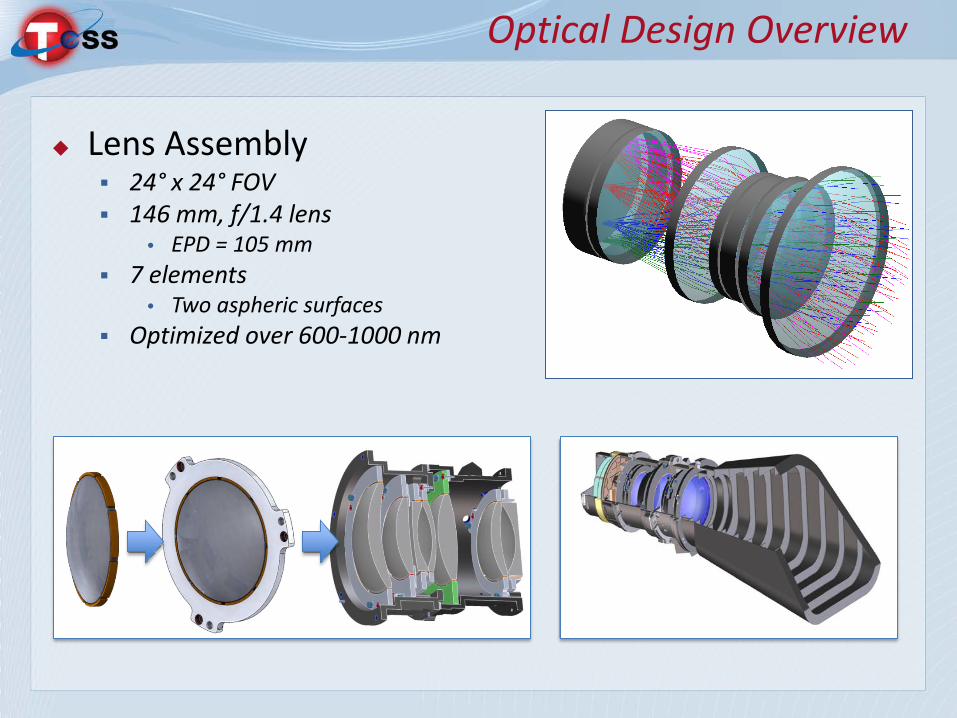
Lens Assembly 24° x 24° FOV 146 mm, f/1.4 lens
• EPD = 105 mm 7 elements
• Two aspheric surfaces Optimized over 600-1000 nm
Lens Assembly Design Tolerances
Lens
Sur. Fringes (power)
Fringes (irregularity)
dN (melt comp.)
dV (melt comp.)
Lens wedge
(ETD μm)
Lens thickness
(μm)
Axial position
(μm)
Radial decenter
(μm)
Lens tilt (arc min)
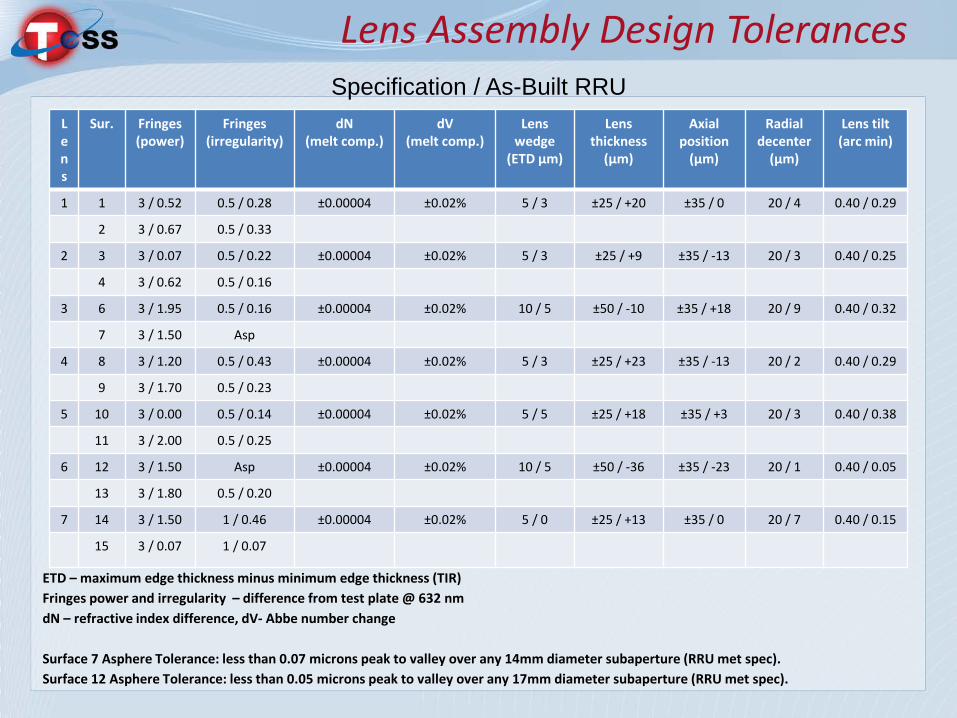
1 1 3 / 0.52 0.5 / 0.28 ±0.00004 ±0.02% 5 / 3 ±25 / +20 ±35 / 0 20 / 4 0.40 / 0.29
2 3 / 0.67 0.5 / 0.33
2 3 3 / 0.07 0.5 / 0.22 ±0.00004 ±0.02% 5 / 3 ±25 / +9 ±35 / -13 20 / 3 0.40 / 0.25
4 3 / 0.62 0.5 / 0.16
3 6 3 / 1.95 0.5 / 0.16 ±0.00004 ±0.02% 10 / 5 ±50 / -10 ±35 / +18 20 / 9 0.40 / 0.32
7 3 / 1.50 Asp
4 8 3 / 1.20 0.5 / 0.43 ±0.00004 ±0.02% 5 / 3 ±25 / +23 ±35 / -13 20 / 2 0.40 / 0.29
9 3 / 1.70 0.5 / 0.23
5 10 3 / 0.00 0.5 / 0.14 ±0.00004 ±0.02% 5 / 5 ±25 / +18 ±35 / +3 20 / 3 0.40 / 0.38
11 3 / 2.00 0.5 / 0.25
6 12 3 / 1.50 Asp ±0.00004 ±0.02% 10 / 5 ±50 / -36 ±35 / -23 20 / 1 0.40 / 0.05
13 3 / 1.80 0.5 / 0.20
7 14 3 / 1.50 1 / 0.46 ±0.00004 ±0.02% 5 / 0 ±25 / +13 ±35 / 0 20 / 7 0.40 / 0.15
15 3 / 0.07 1 / 0.07
ETD – maximum edge thickness minus minimum edge thickness (TIR) Fringes power and irregularity – difference from test plate @ 632 nm dN – refractive index difference, dV- Abbe number change Surface 7 Asphere Tolerance: less than 0.07 microns peak to valley over any 14mm diameter subaperture (RRU met spec). Surface 12 Asphere Tolerance: less than 0.05 microns peak to valley over any 17mm diameter subaperture (RRU met spec).
Specification / As-Built RRU
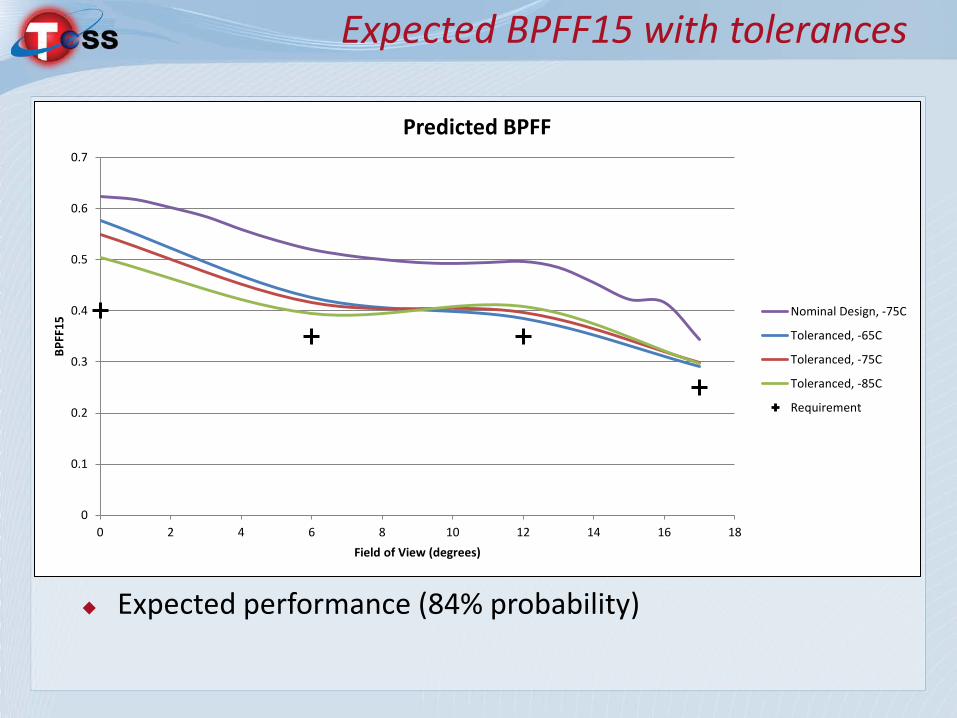
Expected BPFF15 with tolerances
Expected performance (84% probability)
0
0.1
0.2
0.3
0.4
0.5
0.6
0.7
0 2 4 6 8 10 12 14 16 18
BPFF
15
Field of View (degrees)
Predicted BPFF
Nominal Design, -75C
Toleranced, -65C
Toleranced, -75C
Toleranced, -85C
Requirement
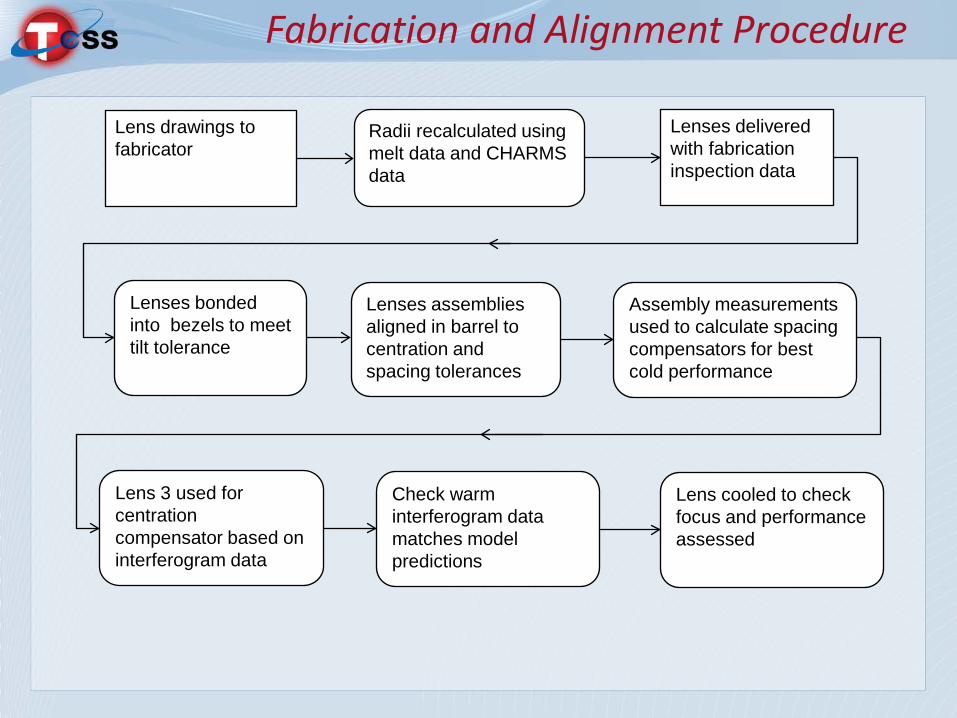
Fabrication and Alignment Procedure
Lens drawings to fabricator
Radii recalculated using melt data and CHARMS data
Lenses delivered with fabrication inspection data
Lenses assemblies aligned in barrel to centration and spacing tolerances
Assembly measurements used to calculate spacing compensators for best cold performance
Lens 3 used for centration compensator based on interferogram data
Check warm interferogram data matches model predictions
Lens cooled to check focus and performance assessed
Lenses bonded into bezels to meet tilt tolerance
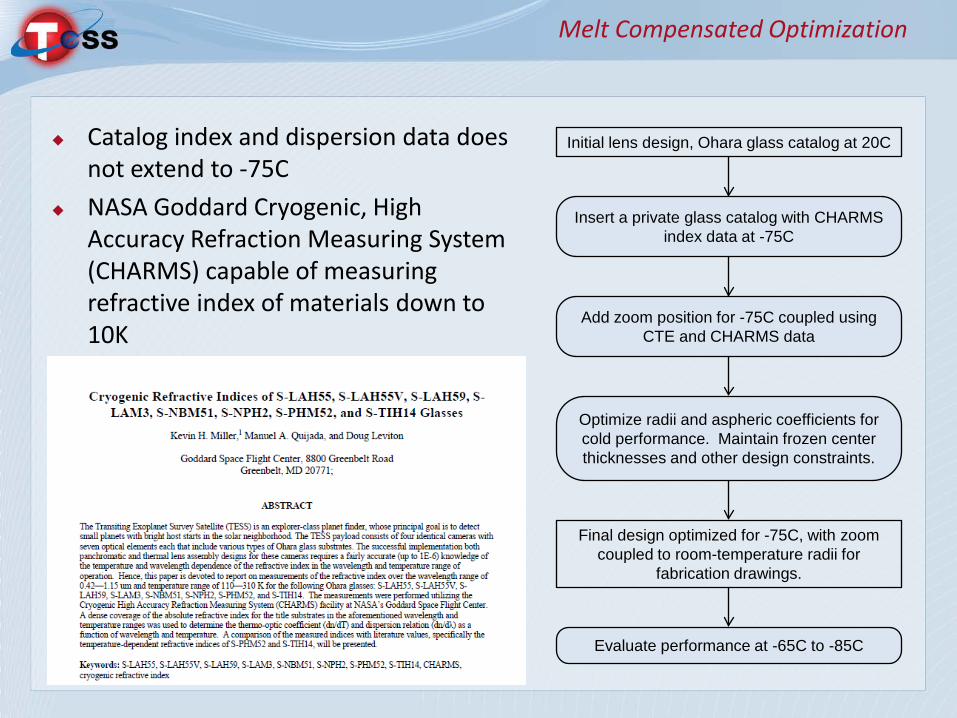
Melt Compensated Optimization
Catalog index and dispersion data does not extend to -75C
NASA Goddard Cryogenic, High Accuracy Refraction Measuring System (CHARMS) capable of measuring refractive index of materials down to 10K
Initial lens design, Ohara glass catalog at 20C
Insert a private glass catalog with CHARMS index data at -75C
Add zoom position for -75C coupled using CTE and CHARMS data
Optimize radii and aspheric coefficients for cold performance. Maintain frozen center thicknesses and other design constraints.
Final design optimized for -75C, with zoom coupled to room-temperature radii for
fabrication drawings.
Evaluate performance at -65C to -85C
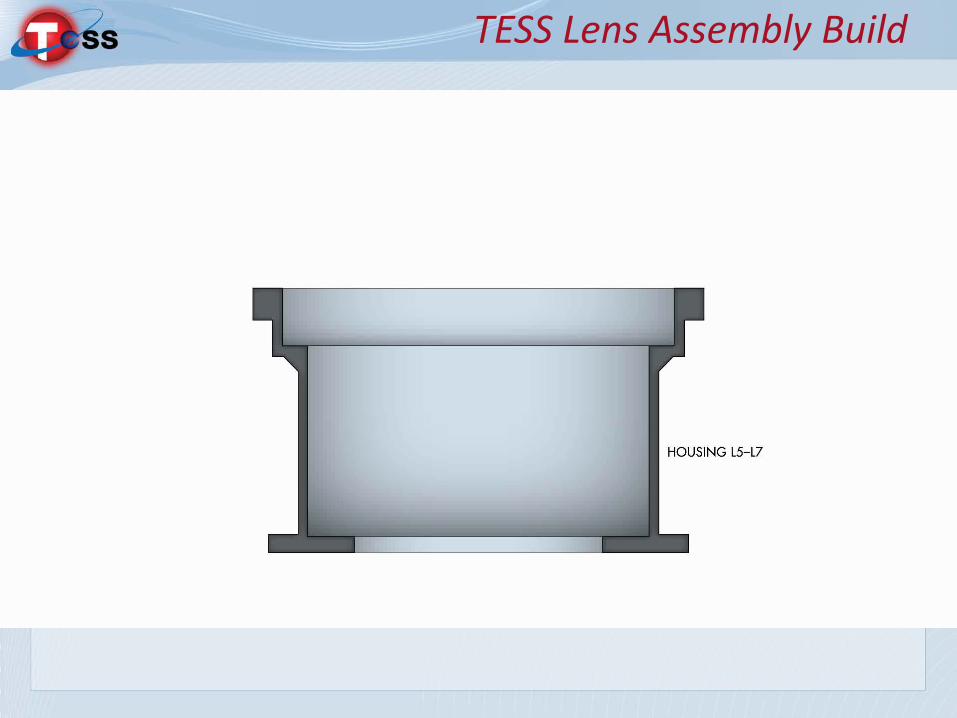
TESS Lens Assembly Build
RRU Lens Assembly Build – Pathfinder for Flight Build
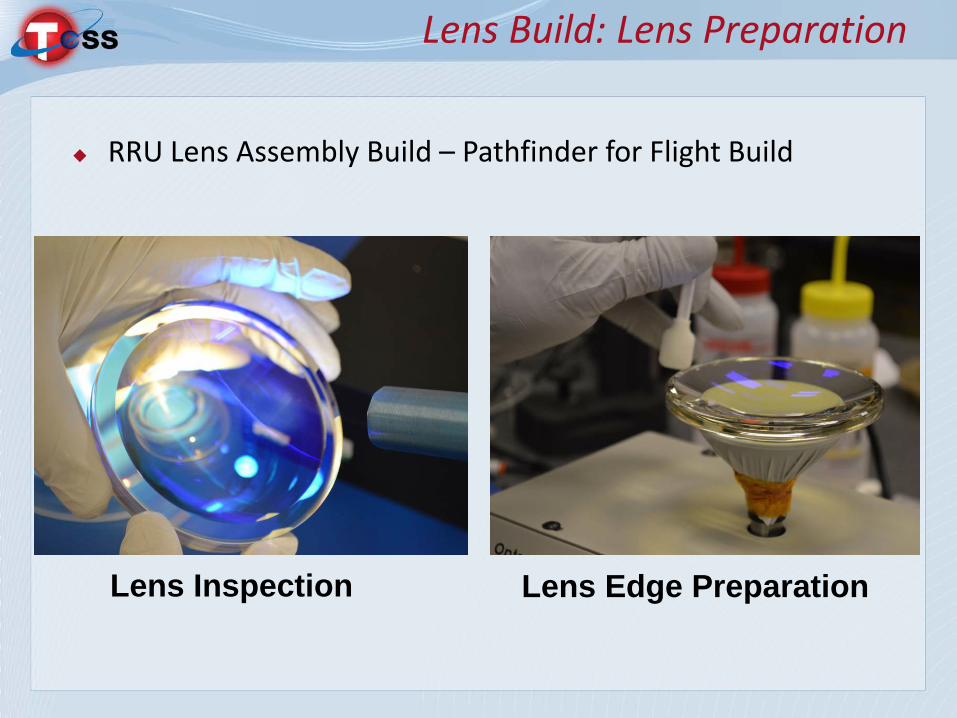
Lens Build: Lens Preparation
Lens Inspection Lens Edge Preparation
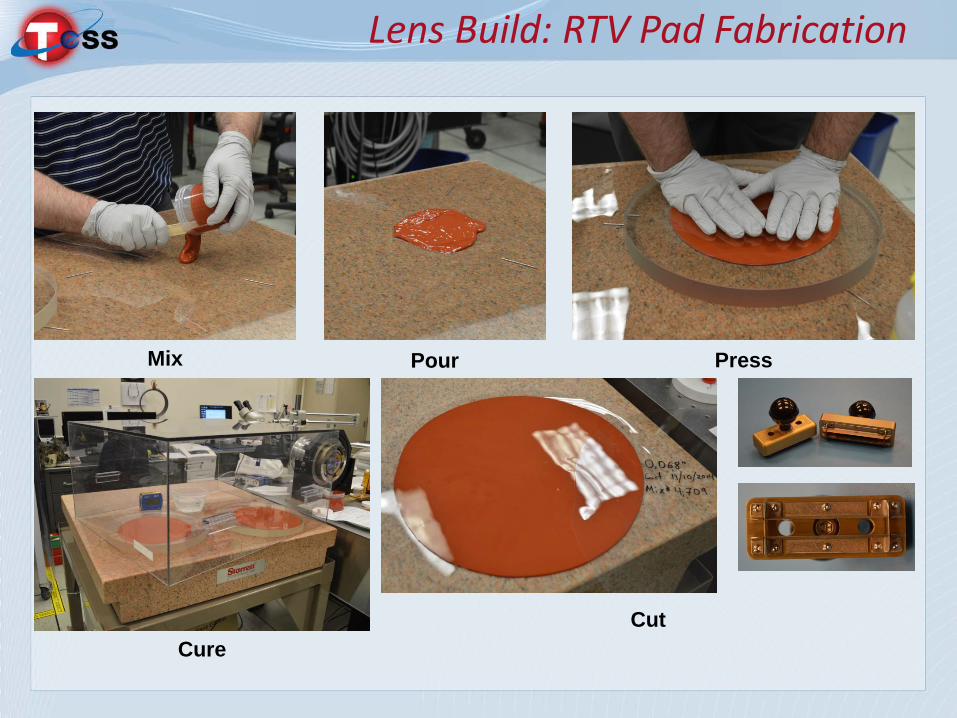
Lens Build: RTV Pad Fabrication
Mix Pour
Cut
Press
Cure
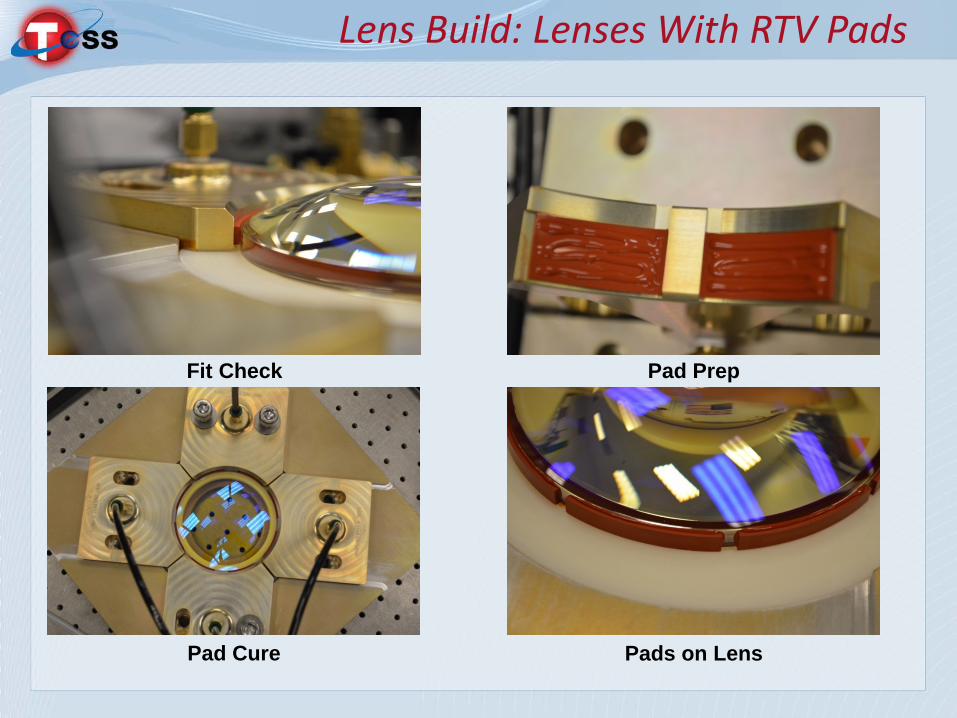
Lens Build: Lenses With RTV Pads
Fit Check
Pad Cure Pads on Lens
Pad Prep
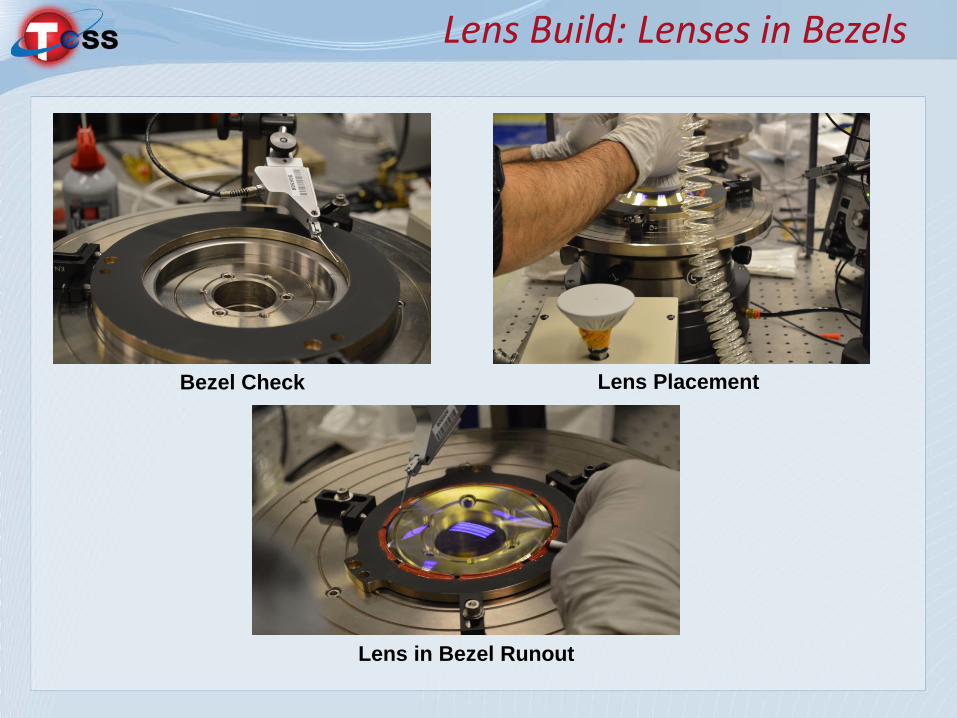
Lens Build: Lenses in Bezels
Lens in Bezel Runout
Bezel Check Lens Placement
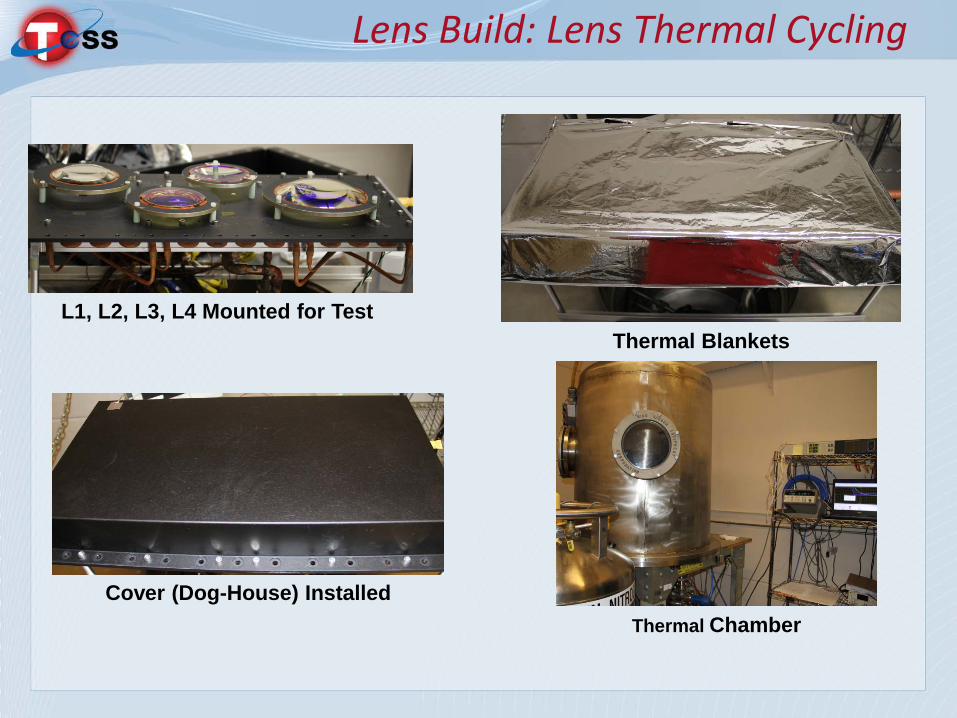
Lens Build: Lens Thermal Cycling
Cover (Dog-House) Installed Thermal Chamber
L1, L2, L3, L4 Mounted for Test Thermal Blankets
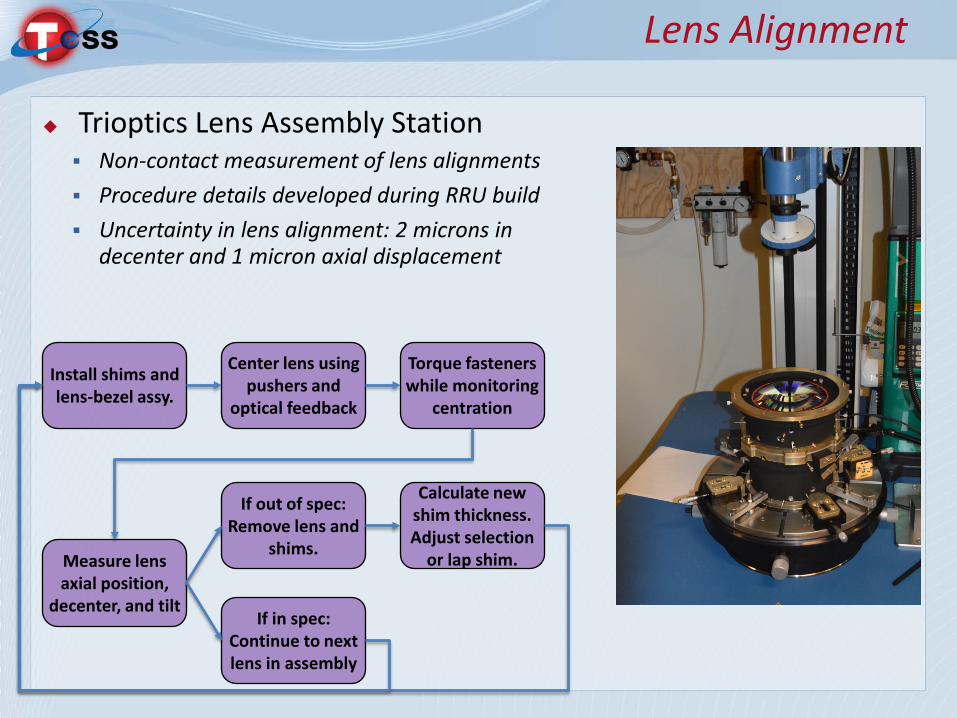
Lens Alignment
Trioptics Lens Assembly Station Non-contact measurement of lens alignments Procedure details developed during RRU build Uncertainty in lens alignment: 2 microns in
decenter and 1 micron axial displacement
Install shims and lens-bezel assy.
Torque fasteners while monitoring
centration
Measure lens axial position,
decenter, and tilt
Center lens using pushers and
optical feedback
If out of spec: Remove lens and
shims.
Calculate new shim thickness. Adjust selection
or lap shim.
If in spec: Continue to next lens in assembly

Lens install
Upper Barrel
Lower Barrel Complete
Lens Complete
Lens Build: Barrel Assembly and Alignment
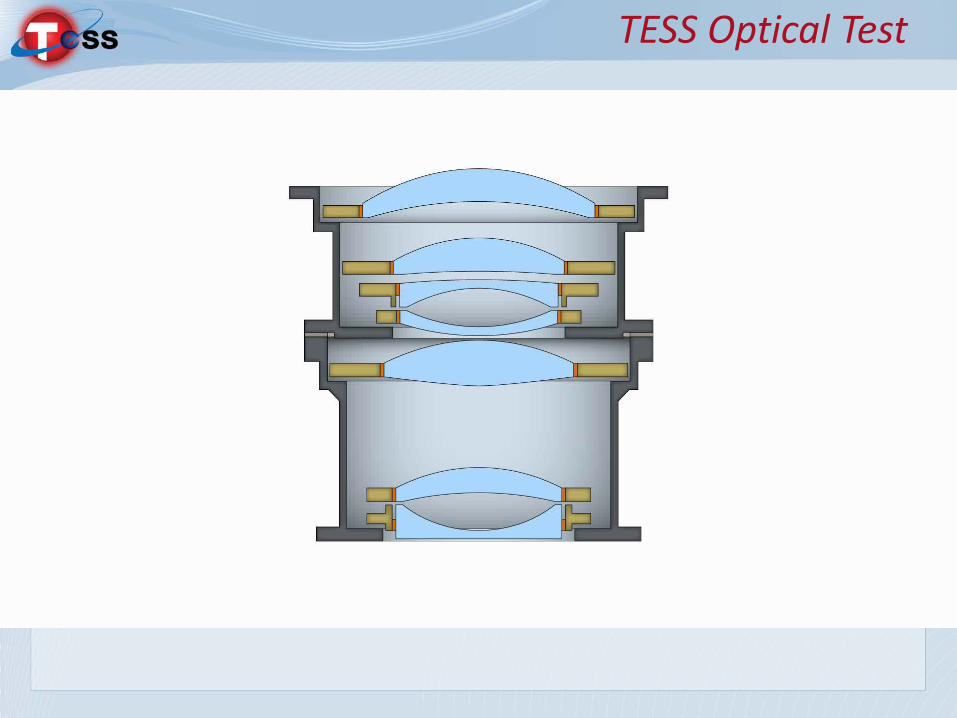
TESS Optical Test
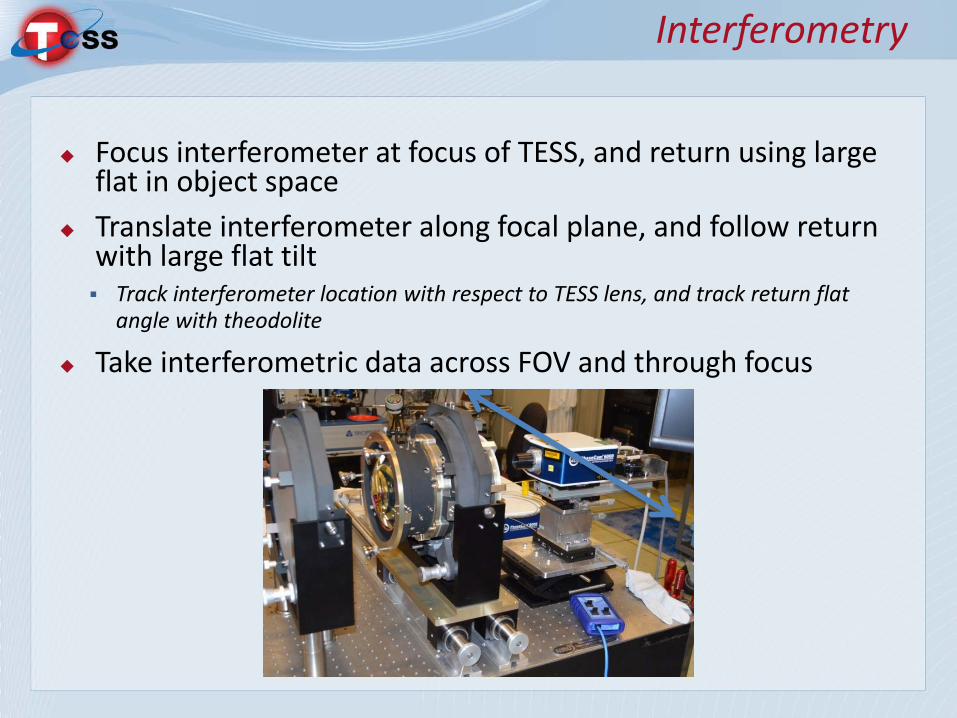
Focus interferometer at focus of TESS, and return using large flat in object space
Translate interferometer along focal plane, and follow return with large flat tilt Track interferometer location with respect to TESS lens, and track return flat
angle with theodolite
Take interferometric data across FOV and through focus
Interferometry
RRU Ambient Interferometry
0.44λ 0.64λ 0.62λ
0.67λ
0.60λ
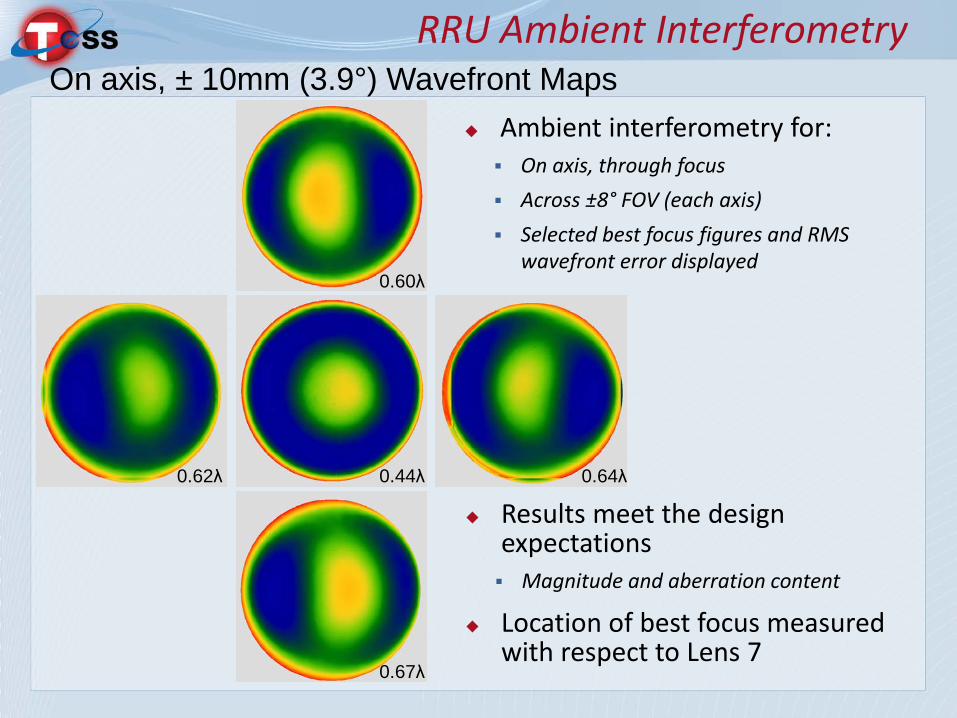
On axis, ± 10mm (3.9°) Wavefront Maps Ambient interferometry for: On axis, through focus Across ±8° FOV (each axis) Selected best focus figures and RMS
wavefront error displayed
Results meet the design expectations Magnitude and aberration content
Location of best focus measured with respect to Lens 7
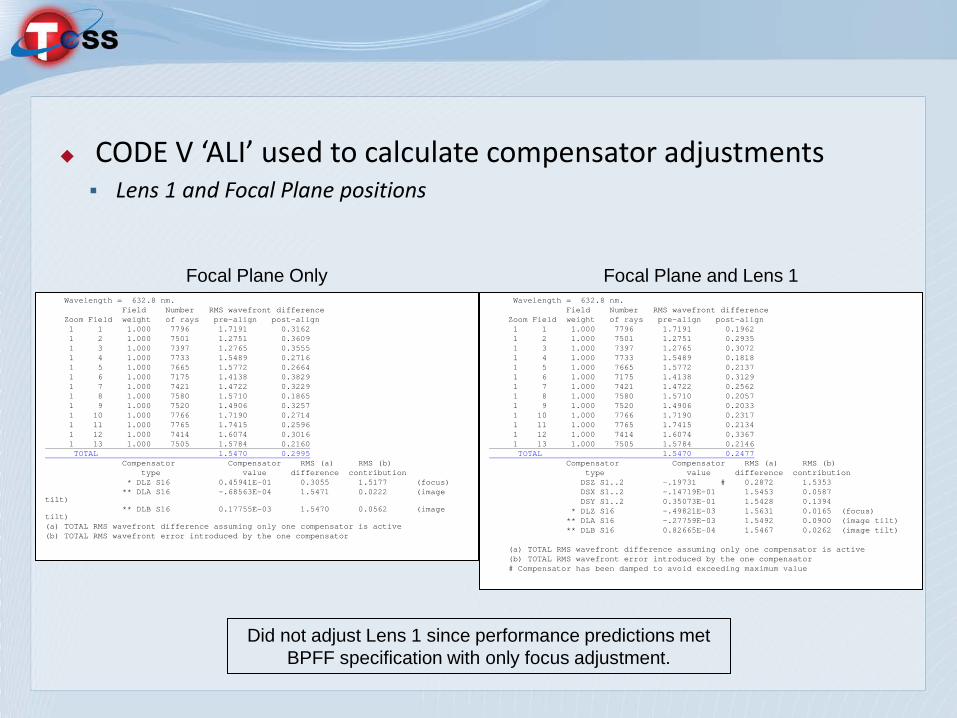
CODE V ‘ALI’ used to calculate compensator adjustments Lens 1 and Focal Plane positions
Wavelength = 632.8 nm. Field Number RMS wavefront difference Zoom Field weight of rays pre-align post-align 1 1 1.000 7796 1.7191 0.1962 1 2 1.000 7501 1.2751 0.2935 1 3 1.000 7397 1.2765 0.3072 1 4 1.000 7733 1.5489 0.1818 1 5 1.000 7665 1.5772 0.2137 1 6 1.000 7175 1.4138 0.3129 1 7 1.000 7421 1.4722 0.2562 1 8 1.000 7580 1.5710 0.2057 1 9 1.000 7520 1.4906 0.2033 1 10 1.000 7766 1.7190 0.2317 1 11 1.000 7765 1.7415 0.2134 1 12 1.000 7414 1.6074 0.3367 1 13 1.000 7505 1.5784 0.2146 TOTAL 1.5470 0.2477 Compensator Compensator RMS (a) RMS (b) type value difference contribution DSZ S1..2 -.19731 # 0.2872 1.5353 DSX S1..2 -.14719E-01 1.5453 0.0587 DSY S1..2 0.35073E-01 1.5428 0.1394 * DLZ S16 -.49821E-03 1.5631 0.0165 (focus) ** DLA S16 -.27759E-03 1.5492 0.0900 (image tilt) ** DLB S16 0.82665E-04 1.5467 0.0262 (image tilt) (a) TOTAL RMS wavefront difference assuming only one compensator is active (b) TOTAL RMS wavefront error introduced by the one compensator # Compensator has been damped to avoid exceeding maximum value
Wavelength = 632.8 nm. Field Number RMS wavefront difference Zoom Field weight of rays pre-align post-align 1 1 1.000 7796 1.7191 0.3162 1 2 1.000 7501 1.2751 0.3609 1 3 1.000 7397 1.2765 0.3555 1 4 1.000 7733 1.5489 0.2716 1 5 1.000 7665 1.5772 0.2664 1 6 1.000 7175 1.4138 0.3829 1 7 1.000 7421 1.4722 0.3229 1 8 1.000 7580 1.5710 0.1865 1 9 1.000 7520 1.4906 0.3257 1 10 1.000 7766 1.7190 0.2714 1 11 1.000 7765 1.7415 0.2596 1 12 1.000 7414 1.6074 0.3016 1 13 1.000 7505 1.5784 0.2160 TOTAL 1.5470 0.2995 Compensator Compensator RMS (a) RMS (b) type value difference contribution * DLZ S16 0.45941E-01 0.3055 1.5177 (focus) ** DLA S16 -.68563E-04 1.5471 0.0222 (image tilt) ** DLB S16 0.17755E-03 1.5470 0.0562 (image tilt) (a) TOTAL RMS wavefront difference assuming only one compensator is active (b) TOTAL RMS wavefront error introduced by the one compensator
Focal Plane Only Focal Plane and Lens 1
Did not adjust Lens 1 since performance predictions met BPFF specification with only focus adjustment.

Transiting Exoplanet Survey Satellite
This work is sponsored by the National Aeronautics and Space Administration under Air Force Contract #FA8721-05-C-0002. Opinions, interpretations, conclusions and recommendations are those of the author and are not necessarily endorsed by the United States Government..
Extra Slides
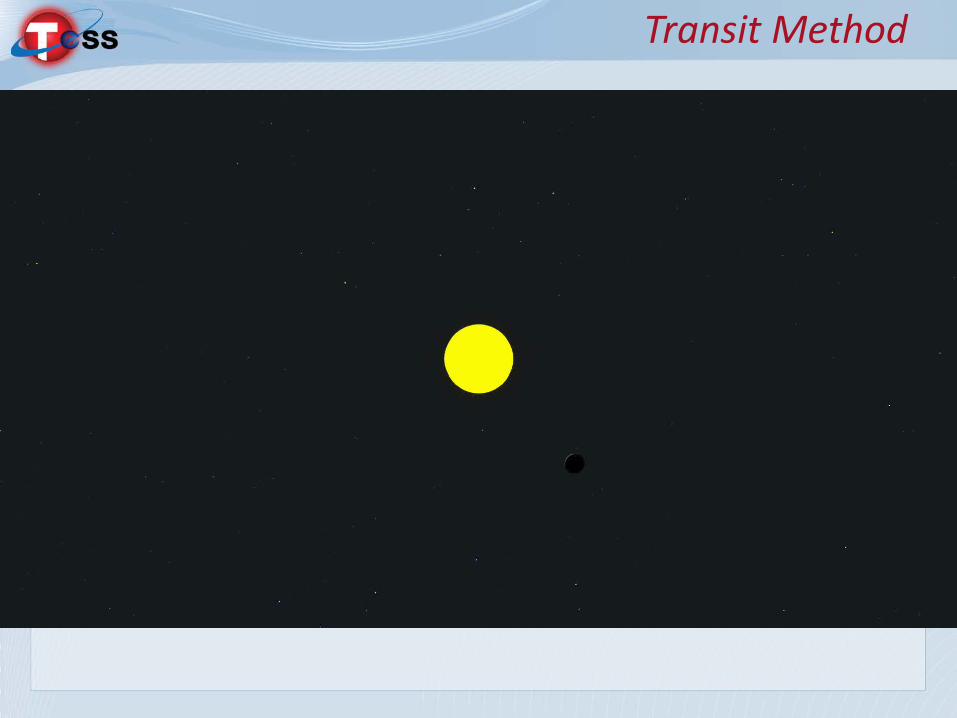
Transit Method
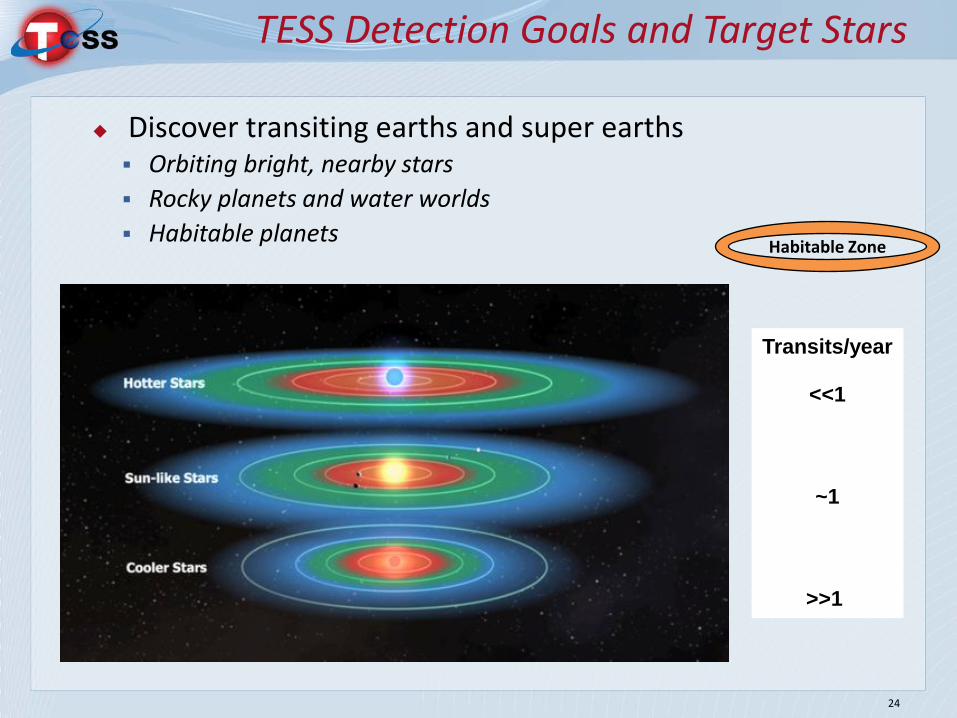
Discover transiting earths and super earths Orbiting bright, nearby stars Rocky planets and water worlds Habitable planets
TESS Detection Goals and Target Stars
24
Habitable Zone
Transits/year
<<1
~1
>>1
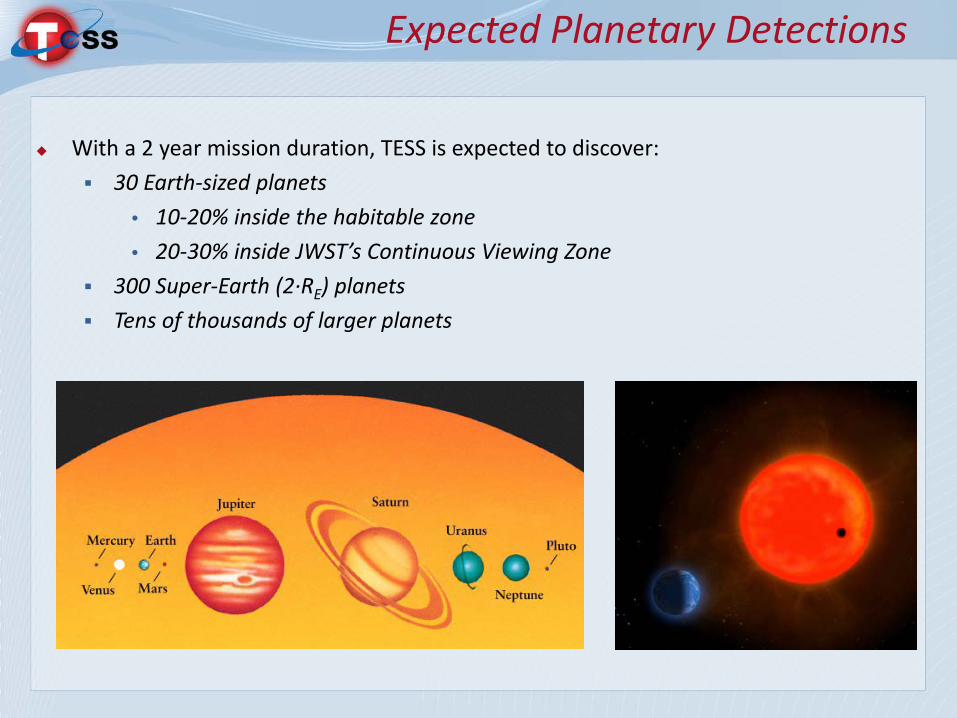
Expected Planetary Detections
With a 2 year mission duration, TESS is expected to discover: 30 Earth-sized planets
• 10-20% inside the habitable zone • 20-30% inside JWST’s Continuous Viewing Zone
300 Super-Earth (2·RE) planets Tens of thousands of larger planets
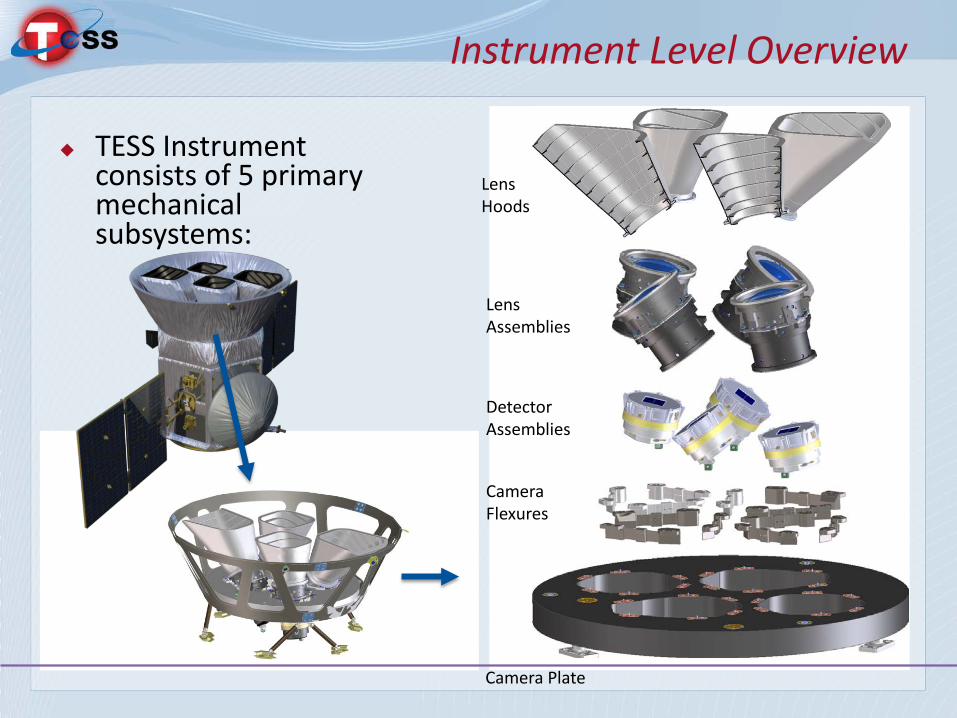
Instrument Level Overview
TESS Instrument consists of 5 primary mechanical subsystems:
Lens Hoods
Lens Assemblies
Detector Assemblies
Camera Flexures
Camera Plate
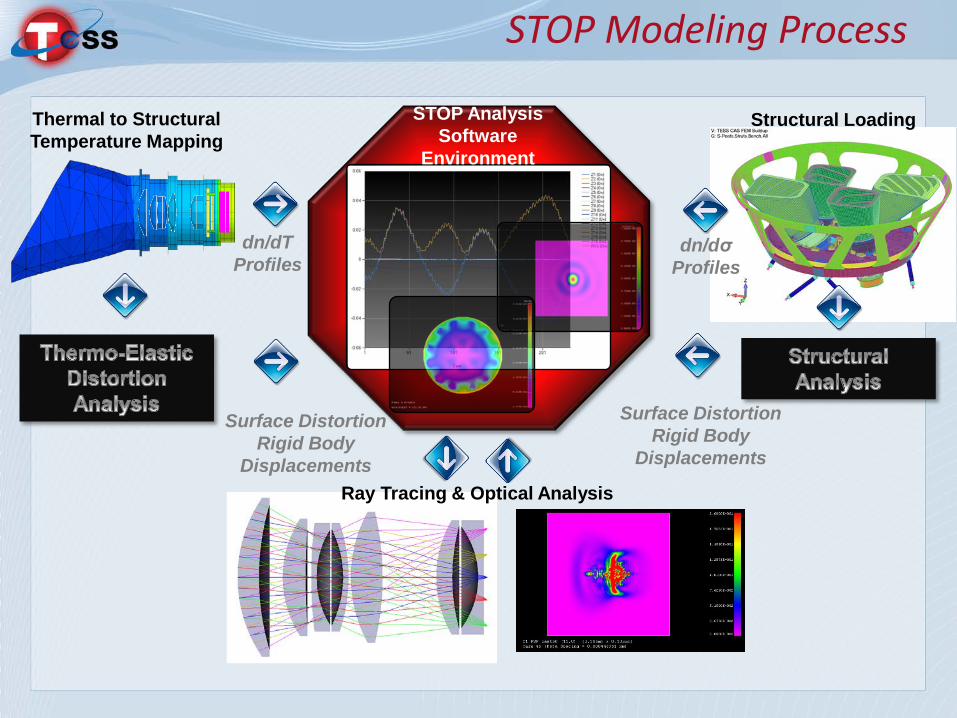
STOP Modeling Process
Thermal to Structural Temperature Mapping
Structural Loading
Ray Tracing & Optical Analysis
Surface Distortion Rigid Body
Displacements
Surface Distortion Rigid Body
Displacements
dn/dT Profiles
dn/dσ Profiles
STOP Analysis Software
Environment
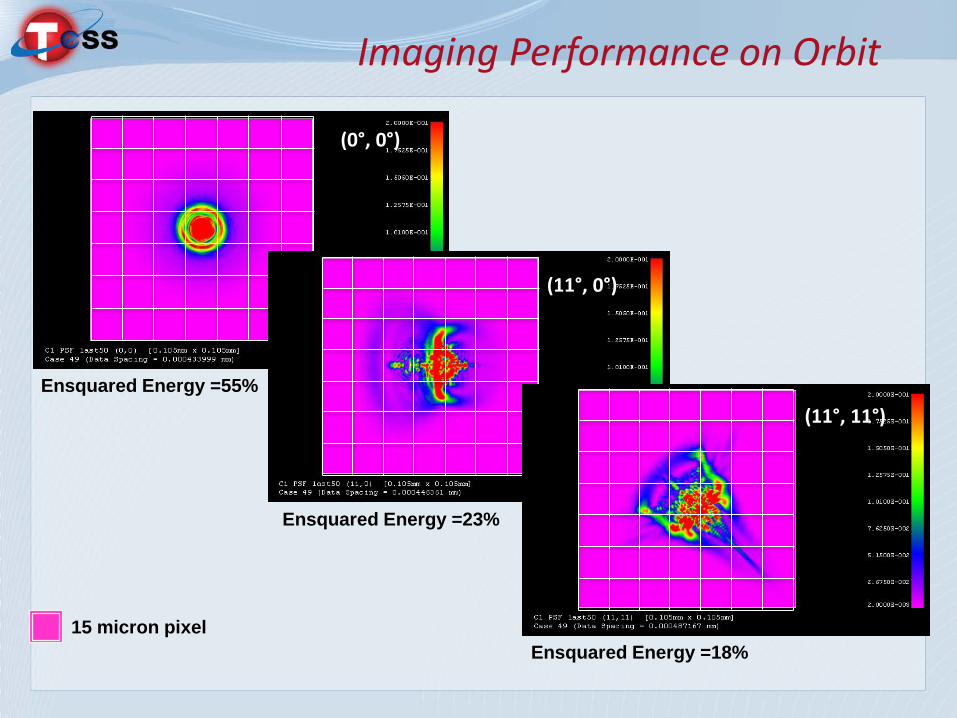
Imaging Performance on Orbit
(0°, 0°)
(11°, 0°)
(11°, 11°)
15 micron pixel
Ensquared Energy =55%
Ensquared Energy =23%
Ensquared Energy =18%
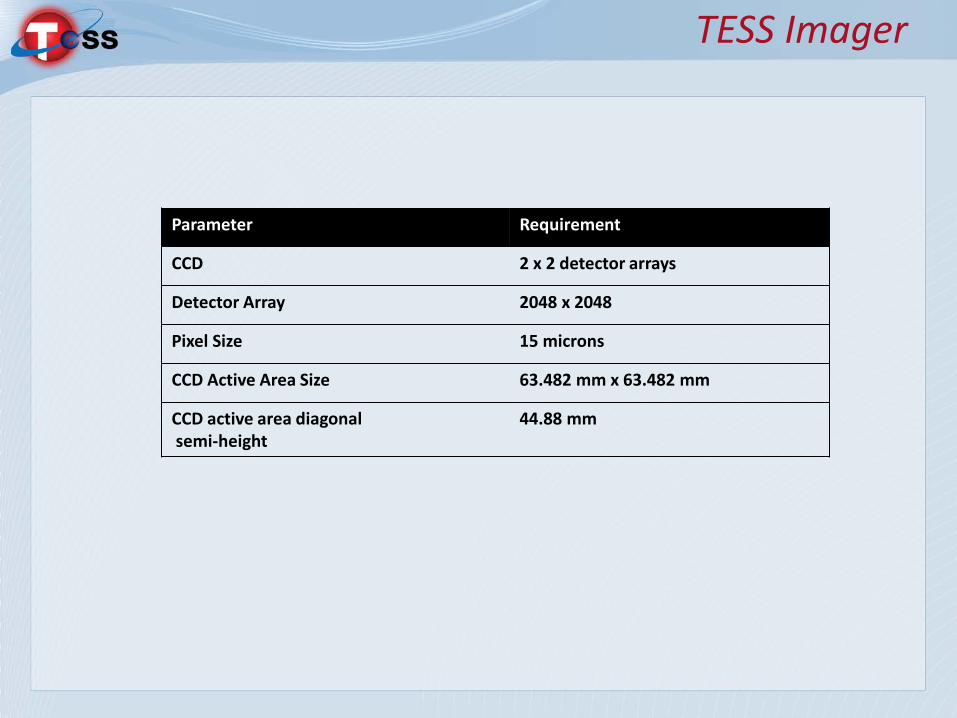
TESS Imager
Parameter Requirement
CCD 2 x 2 detector arrays
Detector Array 2048 x 2048
Pixel Size 15 microns
CCD Active Area Size 63.482 mm x 63.482 mm
CCD active area diagonal semi-height
44.88 mm

TESS Imager Summary
Prototype Detector Assembly
Packaged CCID-80 Imager
Performance Value Achieved
Well Capacity > 150,000 e- (goal) > 190,000 e-
Conversion Gain < 10 µV/e- 7 µV/e-
Read Noise @ 625 kHz < 20 e- < 14 e- w/FPE
Dark Current @ -30°C < 8 e-/pix/sec < 2.5 e-/p/s
Device Thickness 100 µm (-10/+15µm) 95 – 115 µm
Depletion-depth control Substrate bias Functional
Targeted Spectral Range 600-1000 nm 70% @ 950 nm
Completed 200 mm
CCD Wafer
2048 x 2048 frame-transfer format, (2k x 4k CCD) 15-µm pixels
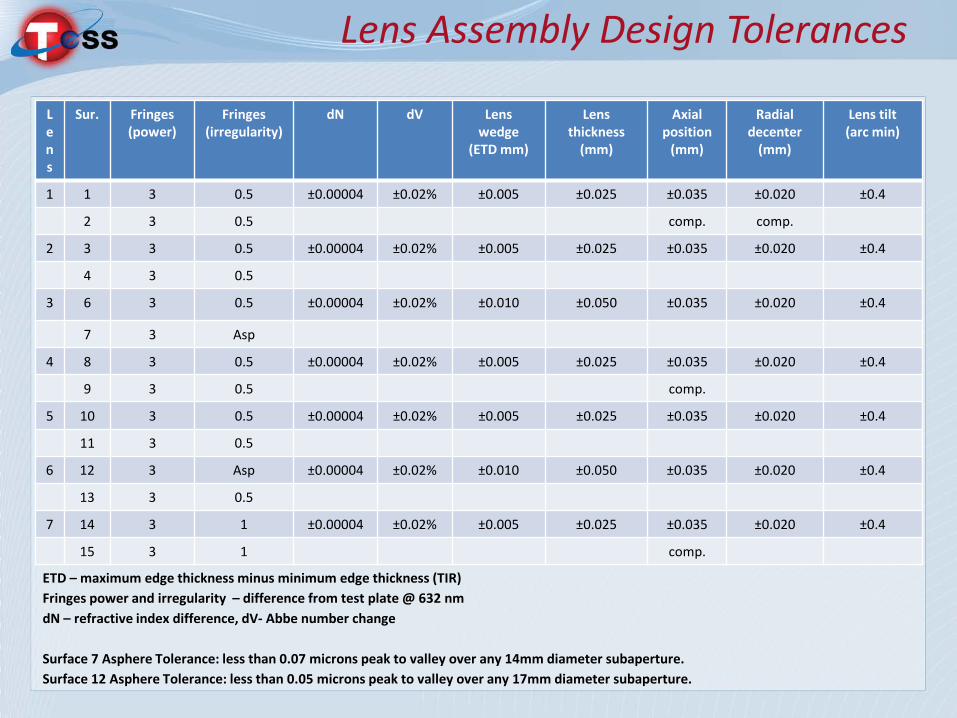
Lens Assembly Design Tolerances
Lens
Sur. Fringes (power)
Fringes (irregularity)
dN dV Lens wedge
(ETD mm)
Lens thickness
(mm)
Axial position
(mm)
Radial decenter
(mm)
Lens tilt (arc min)
1 1 3 0.5 ±0.00004 ±0.02% ±0.005 ±0.025 ±0.035 ±0.020 ±0.4
2 3 0.5 comp. comp.
2 3 3 0.5 ±0.00004 ±0.02% ±0.005 ±0.025 ±0.035 ±0.020 ±0.4
4 3 0.5
3 6 3 0.5 ±0.00004 ±0.02% ±0.010 ±0.050 ±0.035 ±0.020 ±0.4
7 3 Asp
4 8 3 0.5 ±0.00004 ±0.02% ±0.005 ±0.025 ±0.035 ±0.020 ±0.4
9 3 0.5 comp.
5 10 3 0.5 ±0.00004 ±0.02% ±0.005 ±0.025 ±0.035 ±0.020 ±0.4
11 3 0.5
6 12 3 Asp ±0.00004 ±0.02% ±0.010 ±0.050 ±0.035 ±0.020 ±0.4
13 3 0.5
7 14 3 1 ±0.00004 ±0.02% ±0.005 ±0.025 ±0.035 ±0.020 ±0.4
15 3 1 comp.
ETD – maximum edge thickness minus minimum edge thickness (TIR) Fringes power and irregularity – difference from test plate @ 632 nm dN – refractive index difference, dV- Abbe number change Surface 7 Asphere Tolerance: less than 0.07 microns peak to valley over any 14mm diameter subaperture. Surface 12 Asphere Tolerance: less than 0.05 microns peak to valley over any 17mm diameter subaperture.
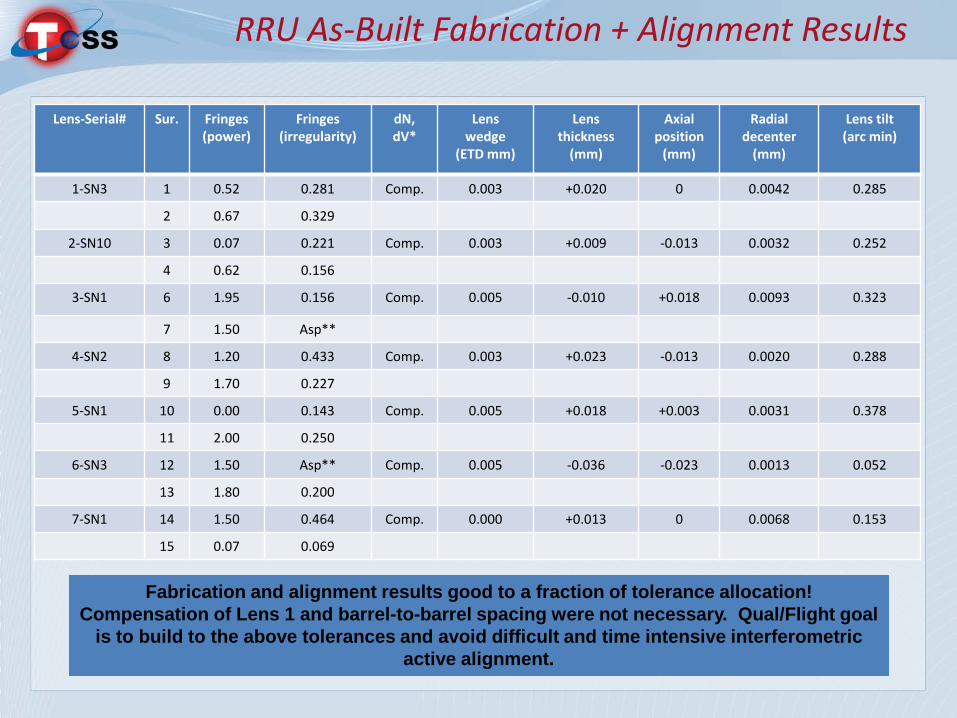
RRU As-Built Fabrication + Alignment Results
Lens-Serial# Sur. Fringes (power)
Fringes (irregularity)
dN, dV*
Lens wedge
(ETD mm)
Lens thickness
(mm)
Axial position
(mm)
Radial decenter
(mm)
Lens tilt (arc min)
1-SN3 1 0.52 0.281 Comp. 0.003 +0.020 0 0.0042 0.285
2 0.67 0.329
2-SN10 3 0.07 0.221 Comp. 0.003 +0.009 -0.013 0.0032 0.252
4 0.62 0.156
3-SN1 6 1.95 0.156 Comp. 0.005 -0.010 +0.018 0.0093 0.323
7 1.50 Asp**
4-SN2 8 1.20 0.433 Comp. 0.003 +0.023 -0.013 0.0020 0.288
9 1.70 0.227
5-SN1 10 0.00 0.143 Comp. 0.005 +0.018 +0.003 0.0031 0.378
11 2.00 0.250
6-SN3 12 1.50 Asp** Comp. 0.005 -0.036 -0.023 0.0013 0.052
13 1.80 0.200
7-SN1 14 1.50 0.464 Comp. 0.000 +0.013 0 0.0068 0.153
15 0.07 0.069
Fabrication and alignment results good to a fraction of tolerance allocation! Compensation of Lens 1 and barrel-to-barrel spacing were not necessary. Qual/Flight goal
is to build to the above tolerances and avoid difficult and time intensive interferometric active alignment.