tollbrothers 10-q-jan_2007
TRANSCRIPT

UNITED STATES SECURITIES AND EXCHANGE COMMISSIONWashington, D.C. 20549
Form 10-Q
(Mark One)¥ QUARTERLY REPORT PURSUANT TO SECTION 13 OR 15(d)
OF THE SECURITIES EXCHANGE ACT OF 1934For the quarterly period ended January 31, 2007
or
n TRANSITION REPORT PURSUANT TO SECTION 13 OR 15(d)OF THE SECURITIES EXCHANGE ACT OF 1934For the transition period from to
Commission file number 1-9186
TOLL BROTHERS, INC.(Exact name of registrant as specified in its charter)
Delaware 23-2416878(State or other jurisdiction of (I.R.S. Employerincorporation or organization) Identification No.)
250 Gibraltar Road,Horsham, Pennsylvania 19044
(Address of principal executive offices) (Zip Code)
(215) 938-8000(Registrant’s telephone number, including area code)
Not applicable(Former name, former address and former fiscal year, if changed since last report)
Indicate by check mark whether the registrant (1) has filed all reports required to be filed by Section 13 or 15(d)of the Securities Exchange Act of 1934 during the preceding 12 months (or for such shorter period that the registrantwas required to file such reports), and (2) has been subject to such filing requirements for the past90 days. Yes ¥ No n
Indicate by check mark whether the registrant is a large accelerated filer, an accelerated filer, or a non-accelerated filer. See definition of “an accelerated filer and large accelerated filer” in Rule 12b-2 of the ExchangeAct. (Check one):
Large accelerated filer ¥ Accelerated filer n Non-accelerated filer n
Indicate by check mark whether the Registrant is a shell company (as defined in Rule 12b-2 of the ExchangeAct) Yes n No ¥
Indicate the number of shares outstanding of each of the issuer’s classes of common stock, as of the latestpracticable date:
At March 2, 2007, there were approximately 154,652,000 shares of Common Stock, $.01 par value,outstanding.

TOLL BROTHERS, INC. AND SUBSIDIARIES
TABLE OF CONTENTS
PageNo.
Statement on Forward-Looking Information. . . . . . . . . . . . . . . . . . . . . . . . . . . . . . . . . . . . . . . . . . . . . . 1
PART I. FINANCIAL INFORMATIONItem 1. Financial Statements
Condensed Consolidated Balance Sheets at January 31, 2007 (Unaudited) and October 31,2006 . . . . . . . . . . . . . . . . . . . . . . . . . . . . . . . . . . . . . . . . . . . . . . . . . . . . . . . . . . . . . . . . . . 2
Condensed Consolidated Statements of Income (Unaudited) For the Three Months EndedJanuary 31, 2007 and 2006 . . . . . . . . . . . . . . . . . . . . . . . . . . . . . . . . . . . . . . . . . . . . . . . . . 3
Condensed Consolidated Statements of Cash Flows (Unaudited) For the Three MonthsEnded January 31, 2007 and 2006 . . . . . . . . . . . . . . . . . . . . . . . . . . . . . . . . . . . . . . . . . . . . 4
Notes to Condensed Consolidated Financial Statements (Unaudited) . . . . . . . . . . . . . . . . . . . 5
Item 2. Management’s Discussion and Analysis of Financial Condition and Results of Operations . . . 22
Item 3. Quantitative and Qualitative Disclosures About Market Risk . . . . . . . . . . . . . . . . . . . . . . . . . 36
Item 4. Controls and Procedures . . . . . . . . . . . . . . . . . . . . . . . . . . . . . . . . . . . . . . . . . . . . . . . . . . . 36
PART II. OTHER INFORMATIONItem 1. Legal Proceedings . . . . . . . . . . . . . . . . . . . . . . . . . . . . . . . . . . . . . . . . . . . . . . . . . . . . . . . . 37
Item 1A. Risk Factors . . . . . . . . . . . . . . . . . . . . . . . . . . . . . . . . . . . . . . . . . . . . . . . . . . . . . . . . . . . . 37
Item 2. Unregistered Sales of Equity Securities and Use of Proceeds . . . . . . . . . . . . . . . . . . . . . . . . . 37
Item 3. Defaults upon Senior Securities . . . . . . . . . . . . . . . . . . . . . . . . . . . . . . . . . . . . . . . . . . . . . . 38
Item 4. Submission of Matters to a Vote of Security Holders . . . . . . . . . . . . . . . . . . . . . . . . . . . . . . 38
Item 5. Other Information . . . . . . . . . . . . . . . . . . . . . . . . . . . . . . . . . . . . . . . . . . . . . . . . . . . . . . . . 38
Item 6. Exhibits. . . . . . . . . . . . . . . . . . . . . . . . . . . . . . . . . . . . . . . . . . . . . . . . . . . . . . . . . . . . . . . . 38
SIGNATURES . . . . . . . . . . . . . . . . . . . . . . . . . . . . . . . . . . . . . . . . . . . . . . . . . . . . . . . . . . . . . . . . . . . 39
STATEMENT ON FORWARD-LOOKING INFORMATION
Certain information included herein and in our other reports, SEC filings, verbal or written statements andpresentations is forward-looking within the meaning of the Private Securities Litigation Reform Act of 1995,including, but not limited to, information related to our anticipated operating results, financial resources, changes inrevenues, changes in profitability, changes in margins, changes in accounting treatment, interest expense, landrelated write-downs, effects of home buyer cancellations, growth and expansion, anticipated income to be realizedfrom our investments in unconsolidated entities, the ability to acquire land, the ability to gain governmentalapprovals and to open new communities, the ability to sell homes and properties, the ability to deliver homes frombacklog, the expected average delivered prices of homes, the ability to secure materials and subcontractors, theability to produce the liquidity and capital necessary to expand and take advantage of future opportunities, and stockmarket valuations. In some cases you can identify those so called forward-looking statements by words such as“may,” “will,” “should,” “expect,” “plan,” “anticipate,” “believe,” “estimate,” “predict,” “potential,” “project,”“intend,” “can,” “appear,” “could,” “might,” or “continue” or the negative of those words or other comparablewords. Such forward-looking information involves important risks and uncertainties that could significantly affectactual results and cause them to differ materially from expectations expressed herein and in our other reports, SECfilings, verbal or written statements and presentations. These risks and uncertainties include local, regional andnational economic conditions, the demand for homes, domestic and international political events, uncertaintiescreated by terrorist attacks, the effects of governmental regulation, the competitive environment in which weoperate, fluctuations in interest rates, changes in home prices, the availability and cost of land for future growth,adverse market conditions that could result in substantial inventory write-downs, the availability of capital,uncertainties and fluctuations in capital and securities markets, changes in tax laws and their interpretation, legalproceedings, the availability of adequate insurance at reasonable cost, the ability of customers to finance thepurchase of homes, the availability and cost of labor and materials, and weather conditions. Additional informationconcerning potential factors that we believe could cause our actual results to differ materially from expected andhistorical results is included in Item 1A “Risk Factors” of our Annual Report on Form 10-K for the fiscal year endedOctober 31, 2006. Moreover, the financial guidance contained herein related to our expected results of operationsfor fiscal 2007 reflects our expectations as of February 22, 2007 and is not being reconfirmed or updated by thisQuarterly Report on Form 10-Q.
If one or more of the assumptions underlying our forward-looking statements proves incorrect, then our actualresults, performance or achievements could differ materially from those expressed in, or implied by the forward-looking statements contained in this report. Therefore, we caution you not to place undue reliance on our forward-looking statements. This statement is provided as permitted by the Private Securities Litigation Reform Act of 1995.
When this report uses the words “we,” “us,” and “our,” they refer to Toll Brothers, Inc. and its subsidiaries,unless the context otherwise requires. Reference herein to “fiscal 2007,” “fiscal 2006,” and “fiscal 2005,” refer toour fiscal year ending October 31, 2007, and our fiscal years ended October 31, 2006 and October 31, 2005,respectively.

PART I. FINANCIAL INFORMATION
ITEM 1. FINANCIAL STATEMENTS
TOLL BROTHERS, INC. AND SUBSIDIARIES
CONDENSED CONSOLIDATED BALANCE SHEETS
January 31,2007
October 31,2006
(Unaudited)(Amounts in thousands)
ASSETSCash and cash equivalents . . . . . . . . . . . . . . . . . . . . . . . . . . . . . . . . . . . . . . . . . . $ 449,249 $ 632,524
Inventory . . . . . . . . . . . . . . . . . . . . . . . . . . . . . . . . . . . . . . . . . . . . . . . . . . . . . . . 6,182,279 6,095,702
Property, construction and office equipment, net . . . . . . . . . . . . . . . . . . . . . . . . . . 94,299 99,089
Receivables, prepaid expenses and other assets . . . . . . . . . . . . . . . . . . . . . . . . . . . 144,019 160,446
Contracts receivable . . . . . . . . . . . . . . . . . . . . . . . . . . . . . . . . . . . . . . . . . . . . . . . 166,887 170,111
Mortgage loans receivable . . . . . . . . . . . . . . . . . . . . . . . . . . . . . . . . . . . . . . . . . . 78,345 130,326
Customer deposits held in escrow . . . . . . . . . . . . . . . . . . . . . . . . . . . . . . . . . . . . . 51,008 49,676Investments in and advances to unconsolidated entities . . . . . . . . . . . . . . . . . . . . . 251,035 245,667
$7,417,121 $7,583,541
LIABILITIES AND STOCKHOLDERS’ EQUITYLiabilities:
Loans payable . . . . . . . . . . . . . . . . . . . . . . . . . . . . . . . . . . . . . . . . . . . . . . . . . $ 710,870 $ 736,934
Senior notes . . . . . . . . . . . . . . . . . . . . . . . . . . . . . . . . . . . . . . . . . . . . . . . . . . . 1,141,452 1,141,167
Senior subordinated notes . . . . . . . . . . . . . . . . . . . . . . . . . . . . . . . . . . . . . . . . . 350,000 350,000
Mortgage company warehouse loan . . . . . . . . . . . . . . . . . . . . . . . . . . . . . . . . . . 65,887 119,705
Customer deposits . . . . . . . . . . . . . . . . . . . . . . . . . . . . . . . . . . . . . . . . . . . . . . 344,674 360,147
Accounts payable . . . . . . . . . . . . . . . . . . . . . . . . . . . . . . . . . . . . . . . . . . . . . . . 253,353 292,171
Accrued expenses . . . . . . . . . . . . . . . . . . . . . . . . . . . . . . . . . . . . . . . . . . . . . . . 759,186 825,288
Income taxes payable . . . . . . . . . . . . . . . . . . . . . . . . . . . . . . . . . . . . . . . . . . . . 286,128 334,500
Total liabilities . . . . . . . . . . . . . . . . . . . . . . . . . . . . . . . . . . . . . . . . . . . . . . . 3,911,550 4,159,912
Minority interest. . . . . . . . . . . . . . . . . . . . . . . . . . . . . . . . . . . . . . . . . . . . . . . . . . 7,763 7,703
Stockholders’ equity:
Preferred stock, none issued
Common stock, 156,292 shares issued at January 31, 2007 and October 31,2006 . . . . . . . . . . . . . . . . . . . . . . . . . . . . . . . . . . . . . . . . . . . . . . . . . . . . . . . 1,563 1,563
Additional paid-in capital . . . . . . . . . . . . . . . . . . . . . . . . . . . . . . . . . . . . . . . . . 225,359 220,783
Retained earnings . . . . . . . . . . . . . . . . . . . . . . . . . . . . . . . . . . . . . . . . . . . . . . . 3,317,590 3,263,274
Treasury stock, at cost — 1,645 and 2,393 shares at January 31, 2007 andOctober 31, 2006, respectively . . . . . . . . . . . . . . . . . . . . . . . . . . . . . . . . . . . . (46,704) (69,694)
Total stockholders’ equity . . . . . . . . . . . . . . . . . . . . . . . . . . . . . . . . . . . . . 3,497,808 3,415,926
$7,417,121 $7,583,541
See accompanying notes
2

TOLL BROTHERS, INC. AND SUBSIDIARIES
CONDENSED CONSOLIDATED STATEMENTS OF INCOME
2007 2006
Three Months EndedJanuary 31,
(Amounts in thousands,except per share data)
(Unaudited)
Revenues:
Traditional home sales . . . . . . . . . . . . . . . . . . . . . . . . . . . . . . . . . . . . . . . . . . . $1,054,136 $1,278,709
Percentage of completion . . . . . . . . . . . . . . . . . . . . . . . . . . . . . . . . . . . . . . . . . 33,085 57,569
Land sales . . . . . . . . . . . . . . . . . . . . . . . . . . . . . . . . . . . . . . . . . . . . . . . . . . . . 3,390 4,678
1,090,611 1,340,956
Cost of revenues:
Traditional home sales . . . . . . . . . . . . . . . . . . . . . . . . . . . . . . . . . . . . . . . . . . . 846,403 884,091
Percentage of completion . . . . . . . . . . . . . . . . . . . . . . . . . . . . . . . . . . . . . . . . . 25,897 47,346
Land sales . . . . . . . . . . . . . . . . . . . . . . . . . . . . . . . . . . . . . . . . . . . . . . . . . . . . 1,037 3,836
Interest . . . . . . . . . . . . . . . . . . . . . . . . . . . . . . . . . . . . . . . . . . . . . . . . . . . . . . . 22,643 28,754
895,980 964,027
Selling, general and administrative . . . . . . . . . . . . . . . . . . . . . . . . . . . . . . . . . . . . 134,210 139,178
Goodwill impairment . . . . . . . . . . . . . . . . . . . . . . . . . . . . . . . . . . . . . . . . . . . . . . 8,973
Income from operations . . . . . . . . . . . . . . . . . . . . . . . . . . . . . . . . . . . . . . . . . . . . 51,448 237,751
Other:
Equity earnings from unconsolidated entities . . . . . . . . . . . . . . . . . . . . . . . . . . . 6,792 16,569
Interest and other . . . . . . . . . . . . . . . . . . . . . . . . . . . . . . . . . . . . . . . . . . . . . . . 28,960 11,327
Income before income taxes . . . . . . . . . . . . . . . . . . . . . . . . . . . . . . . . . . . . . . . . . 87,200 265,647
Income taxes . . . . . . . . . . . . . . . . . . . . . . . . . . . . . . . . . . . . . . . . . . . . . . . . . . . . 32,884 101,797
Net income . . . . . . . . . . . . . . . . . . . . . . . . . . . . . . . . . . . . . . . . . . . . . . . . . . . . . $ 54,316 $ 163,850
Earnings per share:
Basic . . . . . . . . . . . . . . . . . . . . . . . . . . . . . . . . . . . . . . . . . . . . . . . . . . . . . . . . $ 0.35 $ 1.06
Diluted . . . . . . . . . . . . . . . . . . . . . . . . . . . . . . . . . . . . . . . . . . . . . . . . . . . . . . . $ 0.33 $ 0.98
Weighted average number of shares:
Basic . . . . . . . . . . . . . . . . . . . . . . . . . . . . . . . . . . . . . . . . . . . . . . . . . . . . . . . . 154,212 155,076Diluted . . . . . . . . . . . . . . . . . . . . . . . . . . . . . . . . . . . . . . . . . . . . . . . . . . . . . . . 164,048 167,027
See accompanying notes
3
TOLL BROTHERS, INC. AND SUBSIDIARIES
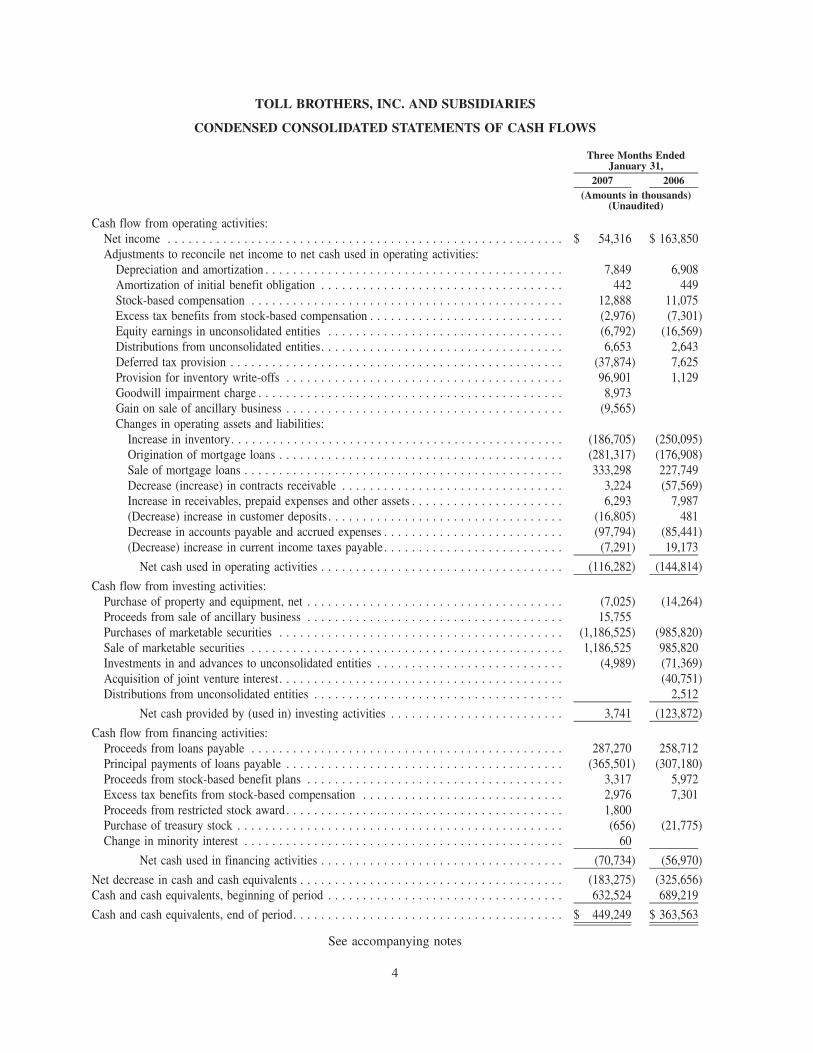
CONDENSED CONSOLIDATED STATEMENTS OF CASH FLOWS
2007 2006
Three Months EndedJanuary 31,
(Amounts in thousands)(Unaudited)
Cash flow from operating activities:Net income . . . . . . . . . . . . . . . . . . . . . . . . . . . . . . . . . . . . . . . . . . . . . . . . . . . . . . . . . $ 54,316 $ 163,850Adjustments to reconcile net income to net cash used in operating activities:
Depreciation and amortization . . . . . . . . . . . . . . . . . . . . . . . . . . . . . . . . . . . . . . . . . . . 7,849 6,908Amortization of initial benefit obligation . . . . . . . . . . . . . . . . . . . . . . . . . . . . . . . . . . . 442 449Stock-based compensation . . . . . . . . . . . . . . . . . . . . . . . . . . . . . . . . . . . . . . . . . . . . . 12,888 11,075Excess tax benefits from stock-based compensation . . . . . . . . . . . . . . . . . . . . . . . . . . . . (2,976) (7,301)Equity earnings in unconsolidated entities . . . . . . . . . . . . . . . . . . . . . . . . . . . . . . . . . . (6,792) (16,569)Distributions from unconsolidated entities. . . . . . . . . . . . . . . . . . . . . . . . . . . . . . . . . . . 6,653 2,643Deferred tax provision . . . . . . . . . . . . . . . . . . . . . . . . . . . . . . . . . . . . . . . . . . . . . . . . (37,874) 7,625Provision for inventory write-offs . . . . . . . . . . . . . . . . . . . . . . . . . . . . . . . . . . . . . . . . 96,901 1,129Goodwill impairment charge . . . . . . . . . . . . . . . . . . . . . . . . . . . . . . . . . . . . . . . . . . . . 8,973Gain on sale of ancillary business . . . . . . . . . . . . . . . . . . . . . . . . . . . . . . . . . . . . . . . . (9,565)Changes in operating assets and liabilities:
Increase in inventory. . . . . . . . . . . . . . . . . . . . . . . . . . . . . . . . . . . . . . . . . . . . . . . . (186,705) (250,095)Origination of mortgage loans . . . . . . . . . . . . . . . . . . . . . . . . . . . . . . . . . . . . . . . . . (281,317) (176,908)Sale of mortgage loans . . . . . . . . . . . . . . . . . . . . . . . . . . . . . . . . . . . . . . . . . . . . . . 333,298 227,749Decrease (increase) in contracts receivable . . . . . . . . . . . . . . . . . . . . . . . . . . . . . . . . 3,224 (57,569)Increase in receivables, prepaid expenses and other assets . . . . . . . . . . . . . . . . . . . . . . 6,293 7,987(Decrease) increase in customer deposits . . . . . . . . . . . . . . . . . . . . . . . . . . . . . . . . . . (16,805) 481Decrease in accounts payable and accrued expenses . . . . . . . . . . . . . . . . . . . . . . . . . . (97,794) (85,441)(Decrease) increase in current income taxes payable . . . . . . . . . . . . . . . . . . . . . . . . . . (7,291) 19,173
Net cash used in operating activities . . . . . . . . . . . . . . . . . . . . . . . . . . . . . . . . . . . (116,282) (144,814)
Cash flow from investing activities:Purchase of property and equipment, net . . . . . . . . . . . . . . . . . . . . . . . . . . . . . . . . . . . . . (7,025) (14,264)Proceeds from sale of ancillary business . . . . . . . . . . . . . . . . . . . . . . . . . . . . . . . . . . . . . 15,755Purchases of marketable securities . . . . . . . . . . . . . . . . . . . . . . . . . . . . . . . . . . . . . . . . . (1,186,525) (985,820)Sale of marketable securities . . . . . . . . . . . . . . . . . . . . . . . . . . . . . . . . . . . . . . . . . . . . . 1,186,525 985,820Investments in and advances to unconsolidated entities . . . . . . . . . . . . . . . . . . . . . . . . . . . (4,989) (71,369)Acquisition of joint venture interest. . . . . . . . . . . . . . . . . . . . . . . . . . . . . . . . . . . . . . . . . (40,751)Distributions from unconsolidated entities . . . . . . . . . . . . . . . . . . . . . . . . . . . . . . . . . . . . 2,512
Net cash provided by (used in) investing activities . . . . . . . . . . . . . . . . . . . . . . . . . 3,741 (123,872)
Cash flow from financing activities:Proceeds from loans payable . . . . . . . . . . . . . . . . . . . . . . . . . . . . . . . . . . . . . . . . . . . . . 287,270 258,712Principal payments of loans payable . . . . . . . . . . . . . . . . . . . . . . . . . . . . . . . . . . . . . . . . (365,501) (307,180)Proceeds from stock-based benefit plans . . . . . . . . . . . . . . . . . . . . . . . . . . . . . . . . . . . . . 3,317 5,972Excess tax benefits from stock-based compensation . . . . . . . . . . . . . . . . . . . . . . . . . . . . . 2,976 7,301Proceeds from restricted stock award . . . . . . . . . . . . . . . . . . . . . . . . . . . . . . . . . . . . . . . . 1,800Purchase of treasury stock . . . . . . . . . . . . . . . . . . . . . . . . . . . . . . . . . . . . . . . . . . . . . . . (656) (21,775)Change in minority interest . . . . . . . . . . . . . . . . . . . . . . . . . . . . . . . . . . . . . . . . . . . . . . 60
Net cash used in financing activities . . . . . . . . . . . . . . . . . . . . . . . . . . . . . . . . . . . (70,734) (56,970)
Net decrease in cash and cash equivalents . . . . . . . . . . . . . . . . . . . . . . . . . . . . . . . . . . . . . . (183,275) (325,656)Cash and cash equivalents, beginning of period . . . . . . . . . . . . . . . . . . . . . . . . . . . . . . . . . . 632,524 689,219
Cash and cash equivalents, end of period. . . . . . . . . . . . . . . . . . . . . . . . . . . . . . . . . . . . . . . $ 449,249 $ 363,563
See accompanying notes
4

TOLL BROTHERS, INC. AND SUBSIDIARIES
NOTES TO CONDENSED CONSOLIDATED FINANCIAL STATEMENTS(Unaudited)
1. Significant Accounting Policies
Basis of Presentation
The accompanying unaudited condensed consolidated financial statements include the accounts of TollBrothers, Inc. (the “Company”), a Delaware corporation, and its majority-owned subsidiaries. All significantintercompany accounts and transactions have been eliminated. Investments in 50% or less owned partnerships andaffiliates are accounted for using the equity method unless it is determined that the Company has effective control ofthe entity, in which case the entity would be consolidated.
The accompanying unaudited condensed consolidated financial statements have been prepared in accordancewith the rules and regulations of the Securities and Exchange Commission (“SEC”) for interim financialinformation. The October 31, 2006 balance sheet amounts and disclosures included herein have been derivedfrom our October 31, 2006 audited financial statements. Since the accompanying condensed consolidated financialstatements do not include all the information and footnotes required by U.S. generally accepted accountingprinciples for complete financial statements, the Company suggests that they be read in conjunction with theconsolidated financial statements and notes thereto included in its Annual Report on Form 10-K for the fiscal yearended October 31, 2006. In the opinion of management, the accompanying unaudited condensed consolidatedfinancial statements include all adjustments, which are of a normal recurring nature, necessary to present fairly theCompany’s financial position as of January 31, 2007, and the results of its operations and cash flows for the threemonths ended January 31, 2007 and 2006. The results of operations for such interim periods are not necessarilyindicative of the results to be expected for the full year.
Recent Accounting Pronouncements
In June 2006, the Financial Accounting Standards Board (the “FASB”) issued FASB Interpretation No. 48,“Accounting for Uncertainty in Income Taxes” (“FIN 48”). FIN 48 clarifies the accounting for uncertainty inincome taxes recognized in accordance with Statement of Financial Accounting Standards (“SFAS”) No. 109,“Accounting for Income Taxes”, and prescribes a recognition threshold and measurement attribute for the financialstatement recognition and measurement of a tax position taken or expected to be taken in a tax return. FIN 48 will beeffective for the Company’s fiscal year beginning November 1, 2007. The Company is currently reviewing theeffect FIN 48 will have on its financial statements.
In September 2006, the FASB issued SFAS No. 158, “Employers’ Accounting for Defined Benefit Pension andOther Postretirement Plans, an amendment of FASB Statements No. 87, 88, 106, and 132(R)” (“SFAS 158”).SFAS 158 requires the Company to (a) recognize in its statement of financial position the overfunded orunderfunded status of a defined benefit postretirement plan measured as the difference between the fair valueof plan assets and the benefit obligation, (b) recognize as a component of other comprehensive income, net of tax,the actuarial gains and losses and the prior service costs and credits that arise during the period, (c) measure definedbenefit plan assets and defined benefit plan obligations as of the date of the Company’s statement of financialposition, and (d) disclose additional information about certain effects on net periodic benefit costs in the upcomingfiscal year that arise from the delayed recognition of the actuarial gains and losses and the prior service costs andcredits. SFAS 158 is effective for the Company’s fiscal year beginning November 1, 2007. The Company does notexpect that adoption of SFAS 158 will have a material effect on its financial statements.
In September 2006, the Emerging Issues Task Force (the “EITF”) of the FASB issued EITF Issue No. 06-8,“Applicability of the Assessment of a Buyer’s Continuing Investment under SFAS No. 66 for the Sale ofCondominiums” (“EITF 06-8”). EITF 06-8 states that in assessing the collectibility of the sales price pursuantto paragraph 37(d) of SFAS 66, an entity should evaluate the adequacy of the buyer’s initial and continuinginvestment to conclude that the sales price is collectible. If an entity is unable to meet the criteria of paragraph 37,including an assessment of collectibility using the initial and continuing investment tests described in
5
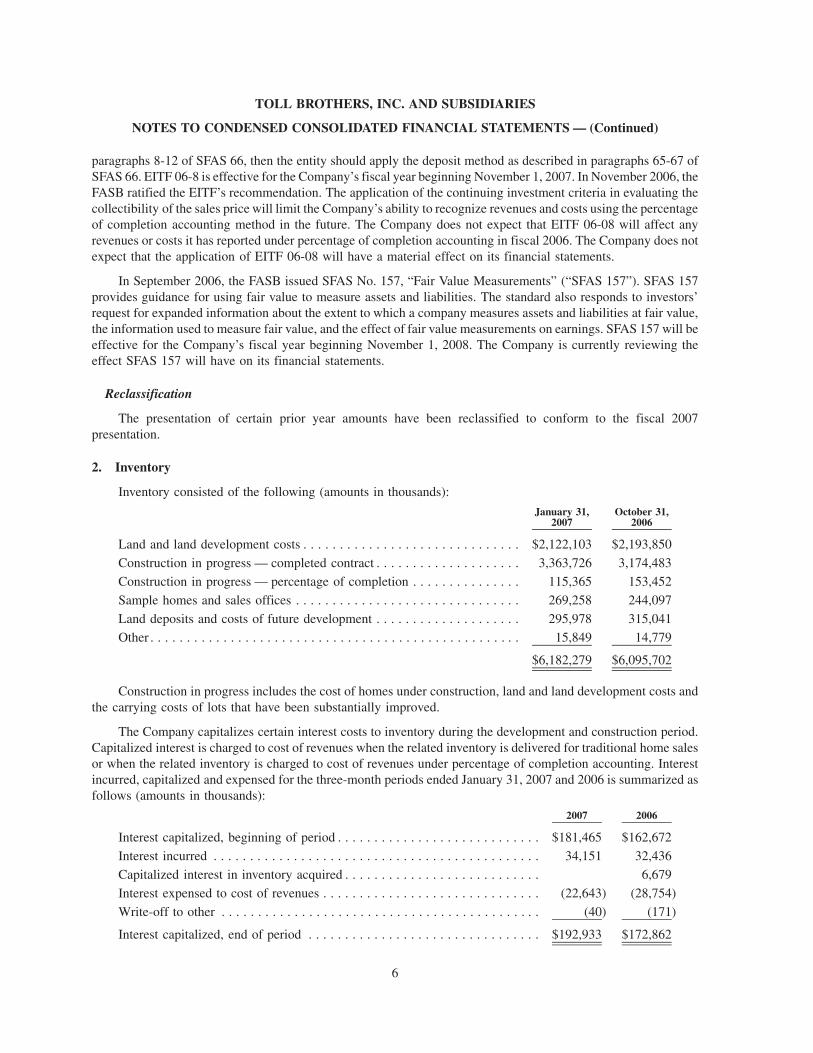
paragraphs 8-12 of SFAS 66, then the entity should apply the deposit method as described in paragraphs 65-67 ofSFAS 66. EITF 06-8 is effective for the Company’s fiscal year beginning November 1, 2007. In November 2006, theFASB ratified the EITF’s recommendation. The application of the continuing investment criteria in evaluating thecollectibility of the sales price will limit the Company’s ability to recognize revenues and costs using the percentageof completion accounting method in the future. The Company does not expect that EITF 06-08 will affect anyrevenues or costs it has reported under percentage of completion accounting in fiscal 2006. The Company does notexpect that the application of EITF 06-08 will have a material effect on its financial statements.
In September 2006, the FASB issued SFAS No. 157, “Fair Value Measurements” (“SFAS 157”). SFAS 157provides guidance for using fair value to measure assets and liabilities. The standard also responds to investors’request for expanded information about the extent to which a company measures assets and liabilities at fair value,the information used to measure fair value, and the effect of fair value measurements on earnings. SFAS 157 will beeffective for the Company’s fiscal year beginning November 1, 2008. The Company is currently reviewing theeffect SFAS 157 will have on its financial statements.
Reclassification
The presentation of certain prior year amounts have been reclassified to conform to the fiscal 2007presentation.
2. Inventory
Inventory consisted of the following (amounts in thousands):
January 31,2007
October 31,2006
Land and land development costs . . . . . . . . . . . . . . . . . . . . . . . . . . . . . . $2,122,103 $2,193,850
Construction in progress — completed contract . . . . . . . . . . . . . . . . . . . . 3,363,726 3,174,483
Construction in progress — percentage of completion . . . . . . . . . . . . . . . 115,365 153,452
Sample homes and sales offices . . . . . . . . . . . . . . . . . . . . . . . . . . . . . . . 269,258 244,097
Land deposits and costs of future development . . . . . . . . . . . . . . . . . . . . 295,978 315,041
Other . . . . . . . . . . . . . . . . . . . . . . . . . . . . . . . . . . . . . . . . . . . . . . . . . . . 15,849 14,779
$6,182,279 $6,095,702
Construction in progress includes the cost of homes under construction, land and land development costs andthe carrying costs of lots that have been substantially improved.
The Company capitalizes certain interest costs to inventory during the development and construction period.Capitalized interest is charged to cost of revenues when the related inventory is delivered for traditional home salesor when the related inventory is charged to cost of revenues under percentage of completion accounting. Interestincurred, capitalized and expensed for the three-month periods ended January 31, 2007 and 2006 is summarized asfollows (amounts in thousands):
2007 2006
Interest capitalized, beginning of period . . . . . . . . . . . . . . . . . . . . . . . . . . . . $181,465 $162,672
Interest incurred . . . . . . . . . . . . . . . . . . . . . . . . . . . . . . . . . . . . . . . . . . . . . 34,151 32,436
Capitalized interest in inventory acquired . . . . . . . . . . . . . . . . . . . . . . . . . . . 6,679
Interest expensed to cost of revenues . . . . . . . . . . . . . . . . . . . . . . . . . . . . . . (22,643) (28,754)
Write-off to other . . . . . . . . . . . . . . . . . . . . . . . . . . . . . . . . . . . . . . . . . . . . (40) (171)
Interest capitalized, end of period . . . . . . . . . . . . . . . . . . . . . . . . . . . . . . . . $192,933 $172,862
6
TOLL BROTHERS, INC. AND SUBSIDIARIES
NOTES TO CONDENSED CONSOLIDATED FINANCIAL STATEMENTS — (Continued)

Interest included in cost of revenues for the three-month periods ended January 31, 2007 and 2006 was asfollows (amounts in thousands):
2007 2006
Traditional home sales revenue . . . . . . . . . . . . . . . . . . . . . . . . . . . . . . . . . . . . $21,737 $26,830
Percentage of completion revenues . . . . . . . . . . . . . . . . . . . . . . . . . . . . . . . . . 905 1,417
Land sales revenues . . . . . . . . . . . . . . . . . . . . . . . . . . . . . . . . . . . . . . . . . . . . 1 507
$22,643 $28,754
Inventory write-downs and the expensing of costs that the Company believed not to be recoverable for thethree-month periods ended January 31, 2007 and 2006 were as follows (amounts in thousands):
2007 2006
Land controlled for future communities . . . . . . . . . . . . . . . . . . . . . . . . . . . . . . . $13,939 $1,130
Operating communities . . . . . . . . . . . . . . . . . . . . . . . . . . . . . . . . . . . . . . . . . . . 82,962
Total . . . . . . . . . . . . . . . . . . . . . . . . . . . . . . . . . . . . . . . . . . . . . . . . . . . . . . . $96,901 $1,130
The Company has evaluated its land purchase contracts to determine if the selling entity is a variable interestentity (“VIE”) and, if it is, whether the Company is the primary beneficiary of the entity. The Company does notpossess legal title to the land, and its risk is generally limited to deposits paid to the seller. The creditors of the sellergenerally have no recourse against the Company. At January 31, 2007, the Company had determined that it was theprimary beneficiary of one VIE related to its land purchase contracts and had recorded $76.1 million as inventory,$68.6 million as a loan payable and $5.5 million as accrued liabilities.
3. Investments in and Advances to Unconsolidated Entities
The Company has investments in and advances to several joint ventures with unrelated parties to develop land.Some of these joint ventures develop land for the sole use of the venture partners, including the Company, and othersdevelop land for sale to the venture partners and to unrelated builders. The Company recognizes its share of earningsfrom the sale of home sites to other builders. The Company does not recognize earnings from home sites itpurchases from the joint ventures, but instead reduces its cost basis in these home sites by its share of the earnings onthe home sites. At January 31, 2007, the Company had approximately $163.3 million invested in or advanced tothese joint ventures and was committed to contributing additional capital in an aggregate amount of approximately$228.2 million (net of the Company’s $141.0 million of loan guarantees related to two of the joint ventures’ loans) ifrequired by the joint ventures. At January 31, 2007, three of the joint ventures had an aggregate of $1.41 billion ofloan commitments, and had approximately $1.15 billion borrowed against the commitments, of which theCompany’s guarantee of its pro-rata share of the borrowings was $112.7 million.
In October 2004, the Company entered into a joint venture in which it has a 50% interest with an unrelatedparty to convert a 525-unit apartment complex, The Hudson Tea Buildings, located in Hoboken, New Jersey, intoluxury condominium units. At January 31, 2007, the Company had investments in and advances to the joint ventureof $52.8 million, and was committed to making up to $1.5 million of additional investments in and advances to thejoint venture.
The Company has investments in and advances to two joint ventures with unrelated parties to develop luxurycondominium projects, including for-sale residential units and commercial space. At January 31, 2007, theCompany had investments in and advances to the joint ventures of $19.4 million, was committed to making up to$115.5 million of additional investments in and advances to the joint ventures if required by the joint ventures, andguaranteed $13.0 million of joint venture loans. At January 31, 2007, these joint ventures had an aggregate of$292.6 million of loan commitments and had approximately $119.8 million borrowed against the commitments.
7
TOLL BROTHERS, INC. AND SUBSIDIARIES
NOTES TO CONDENSED CONSOLIDATED FINANCIAL STATEMENTS — (Continued)

In fiscal 2005, the Company, together with the Pennsylvania State Employees Retirement System (“PASERS”),formed Toll Brothers Realty Trust Group II (“Trust II”) to be in a position to take advantage of commercial real estateopportunities. Trust II is owned 50% by the Company and 50% by PASERS. At January 31, 2007, the Company had aninvestment of $8.9 million in Trust II. In addition, the Company and PASERS each entered into subscriptionagreements that expire in September 2007, whereby each agreed to invest additional capital in an amount not to exceed$11.1 million if required by Trust II. Prior to the formation of Trust II, the Company used Toll Brothers RealtyTrust Group (the “Trust”) to invest in commercial real estate opportunities.
To take advantage of commercial real estate opportunities, the Company formed the Trust in 1998. The Trust iseffectively owned one-third by the Company; one-third by Robert I. Toll, Bruce E. Toll (and members of his family),Zvi Barzilay (and members of his family), Joel H. Rassman and other members of the Company’s current andformer senior management; and one-third by PASERS (collectively, the “Shareholders”). The Shareholders enteredinto subscription agreements whereby each group has agreed to invest additional capital in an amount not to exceed$1.9 million if required by the Trust. The subscription agreements expire in August 2008. At January 31, 2007, theCompany had an investment of $6.6 million in the Trust. The Company provides development, finance andmanagement services to the Trust and received fees under the terms of various agreements in the amounts of$498,000 and $647,000 in the three-month periods ended January 31, 2007 and 2006, respectively. The Companybelieves that the transactions between itself and the Trust were on terms no less favorable than it would have agreedto with unrelated parties.
The Company’s investments in these entities are accounted for using the equity method.
4. Goodwill Impairment
During the three-month period ended January 31, 2007, due to the continued decline of the Detroit market, theCompany re-evaluated the carrying value of goodwill that resulted from a 1999 acquisition in accordance withFASB 142, “Goodwill and Other Intangible Assets”. The Company estimated the fair value of its assets in thismarket including goodwill. Fair value was determined based on the discounted future cash flow expected to begenerated in this market. Based upon this evaluation and the Company’s expectation that this market will notrecover for a number of years, the Company has determined that the related goodwill has been impaired. TheCompany recognized a $9.0 million impairment charge in the three-month period ended January 31, 2007. Afterrecognizing this charge, the Company does not have any goodwill remaining from this acquisition.
5. Accrued Expenses
Accrued expenses at January 31, 2007 and October 31, 2006 consisted of the following (amounts inthousands):
January 31,2007
October 31,2006
Land, land development and construction costs . . . . . . . . . . . . . . . . . . . . . $320,834 $376,114
Compensation and employee benefit costs . . . . . . . . . . . . . . . . . . . . . . . . . 110,671 127,433
Insurance and litigation . . . . . . . . . . . . . . . . . . . . . . . . . . . . . . . . . . . . . . . 129,912 130,244
Warranty costs . . . . . . . . . . . . . . . . . . . . . . . . . . . . . . . . . . . . . . . . . . . . . 57,835 57,414Interest . . . . . . . . . . . . . . . . . . . . . . . . . . . . . . . . . . . . . . . . . . . . . . . . . . . 43,737 43,629
Other . . . . . . . . . . . . . . . . . . . . . . . . . . . . . . . . . . . . . . . . . . . . . . . . . . . . 96,197 90,454
$759,186 $825,288
The Company accrues for the expected warranty costs at the time each home is closed and title and possessionhave been transferred to the home buyer. Costs are accrued based upon historical experience. Changes in the
8
TOLL BROTHERS, INC. AND SUBSIDIARIES
NOTES TO CONDENSED CONSOLIDATED FINANCIAL STATEMENTS — (Continued)

warranty accrual for the three-month periods ended January 31, 2007 and 2006 were as follows (amounts inthousands):
2007 2006
Balance, beginning of period . . . . . . . . . . . . . . . . . . . . . . . . . . . . . . . . . . . . . . $57,414 $54,722
Additions . . . . . . . . . . . . . . . . . . . . . . . . . . . . . . . . . . . . . . . . . . . . . . . . . . . . 7,534 8,531
Charges incurred . . . . . . . . . . . . . . . . . . . . . . . . . . . . . . . . . . . . . . . . . . . . . . . (7,113) (8,604)
Balance, end of period . . . . . . . . . . . . . . . . . . . . . . . . . . . . . . . . . . . . . . . . . . $57,835 $54,649
6. Employee Retirement Plan
In October 2004, the Company established a defined benefit retirement plan effective as of September 1, 2004,which covers four current or former senior executives and a director of the Company. Effective as of February 1,2006, the Company adopted an additional defined benefit retirement plan for nine other executives. The retirementplans are unfunded and vest when the participant has completed 20 years of service with the Company and reachesnormal retirement age (age 62). Unrecognized prior service costs are being amortized over the period from theeffective date of the plans until the participants are fully vested. The Company used a 5.68% and 5.65% discountrate in its calculation of the present value of its projected benefit obligations for fiscal 2007 and 2006, respectively,which represented the approximate long-term investment rate at October 31 of the preceding fiscal year for whichthe present value was calculated.
For the three-month periods ended January 31, 2007 and 2006, the Company recognized the following costsrelated to these plans (amounts in thousands):
2007 2006
Service cost . . . . . . . . . . . . . . . . . . . . . . . . . . . . . . . . . . . . . . . . . . . . . . . . . . . . . . . $ 83 $ 67
Interest cost . . . . . . . . . . . . . . . . . . . . . . . . . . . . . . . . . . . . . . . . . . . . . . . . . . . . . . . 253 205
Amortization of initial benefit obligation . . . . . . . . . . . . . . . . . . . . . . . . . . . . . . . . . 442 449
Total cost . . . . . . . . . . . . . . . . . . . . . . . . . . . . . . . . . . . . . . . . . . . . . . . . . . . . . . . $778 $721
Benefits paid . . . . . . . . . . . . . . . . . . . . . . . . . . . . . . . . . . . . . . . . . . . . . . . . . . . . . . $ 91 —
7. Stock Based Benefit Plans
The fair value of each option award is estimated on the date of grant using a lattice-based option valuationmodel that uses assumptions noted in the following table. The lattice-based option valuation models incorporateranges of assumptions for inputs; those ranges are disclosed in the table below. Expected volatilities are based onimplied volatilities from traded options on the Company’s stock, historical volatility of the Company’s stock andother factors. The expected life of options granted is derived from the historical exercise patterns and anticipatedfuture patterns and represents the period of time that options granted are expected to be outstanding; the range givenbelow results from certain groups of employees exhibiting different behavior. The risk-free rate for periods withinthe contractual life of the option is based on the U.S. Treasury yield curve in effect at the time of grant.
9
TOLL BROTHERS, INC. AND SUBSIDIARIES
NOTES TO CONDENSED CONSOLIDATED FINANCIAL STATEMENTS — (Continued)

The weighted-average assumptions and the fair value used for stock option grants for the three-month periodsended January 31, 2007 and 2006 are as follows:
2007 2006
Expected volatility . . . . . . . . . . . . . . . . . . . . . . . . . . . . . . . 36.32% - 38.22% 36.33% - 38.28%
Weighted-average volatility . . . . . . . . . . . . . . . . . . . . . . . . . 37.16% 37.55%
Risk-free interest rate . . . . . . . . . . . . . . . . . . . . . . . . . . . . . 4.57% - 4.61% 4.38% - 4.51%
Expected life (years) . . . . . . . . . . . . . . . . . . . . . . . . . . . . . . 3.69 - 8.12 4.11 - 9.07
Dividends . . . . . . . . . . . . . . . . . . . . . . . . . . . . . . . . . . . . . . none noneWeighted-average grant date fair value per share of options
granted . . . . . . . . . . . . . . . . . . . . . . . . . . . . . . . . . . . . . . $11.17 $15.30
In the three-month period ended January 31, 2007, the Company recognized $12.8 million of stock com-pensation expense and $4.8 million of income tax benefit related to stock options awards. In the three-month periodended January 31, 2006, the Company recognized $11.0 million of stock compensation expense and $4.0 million ofincome tax benefit related to stock options awards.
The Company expects to recognize approximately $26.7 million of expense and $9.8 million of income taxbenefit for the full fiscal 2007 year related to stock option awards. The Company recognized approximately$26.8 million of expense and $9.1 million of income tax benefit for the full fiscal 2006 year related to stock optionawards.
The Company’s stock option plans for employees, officers and directors provide for the granting of incentivestock options and non-qualified options with a term of up to ten years at a price not less than the market price of thestock at the date of grant. Options granted generally vest over a four-year period for employees, although for certaingrants vesting is over five years, and grants to non-employee directors which vest over a two-year period. Sharesissued upon the exercise of a stock option are either from shares held in treasury or newly issued shares.
Pursuant to the provisions of the Company’s stock option plans, participants are permitted to use the value of theCompany’s common stock that they own to pay for the exercise of options. The Company received 4,172 shares withan average fair market value per share of $35.43 for the exercise of stock options in the three months ended January 31,2006. No shares were received for the exercise of stock options in the three months ended January 31, 2007.
Stock option activity for the three months ended January 31, 2007 and 2006 was as follows:
Shares(in 000’s)
Weighted-Average
Exercise Price(per share)
Shares(in 000’s)
Weighted-Average
Exercise Price(per share)
2007 2006
Outstanding, beginning of period . . . . . . . . . . . 25,178 $12.70 26,155 $11.04Granted . . . . . . . . . . . . . . . . . . . . . . . . . . . . . . 1,803 $31.82 1,433 $35.97
Exercised . . . . . . . . . . . . . . . . . . . . . . . . . . . . . (460) $ 6.67 (894) $ 6.59
Cancelled . . . . . . . . . . . . . . . . . . . . . . . . . . . . . (39) $31.27 (11) $22.10
Outstanding, end of period . . . . . . . . . . . . . . . . 26,482 $14.08 26,683 $12.52
At January 31, 2007, the exercise price of approximately 5.7 million options was higher than the averageclosing price of the Company’s common stock on the New York Stock Exchange (the “NYSE”) for the three-monthperiod ended January 31, 2007.
The Company realized a tax benefit from the exercise of non-qualified stock options and the exercise anddisqualifying disposition of incentive stock options of approximately $3.5 million and $8.4 million in the threemonths ended January 31, 2007 and 2006, respectively.
10
TOLL BROTHERS, INC. AND SUBSIDIARIES
NOTES TO CONDENSED CONSOLIDATED FINANCIAL STATEMENTS — (Continued)

The intrinsic value of options outstanding and exercisable is the difference between the fair market value of theCompany’s common stock on the applicable date (“Measurement Value”) and the exercise price of those optionsthat had an exercise price that was less than the Measurement Value. The intrinsic value of options exercised is thedifference between the fair market value of the Company’s common stock on the date of exercise and the exerciseprice.
The intrinsic value of options outstanding and exercisable at January 31, 2007 and 2006 were as follows(amounts in thousands):
2007 2006
Intrinsic value of options
Outstanding . . . . . . . . . . . . . . . . . . . . . . . . . . . . . . . . . . . . . . . . . . . . . . . $526,002 $575,948Exercisable . . . . . . . . . . . . . . . . . . . . . . . . . . . . . . . . . . . . . . . . . . . . . . . $513,633 $568,008
The intrinsic value of options exercised and the fair value of options which became vested in the three-monthperiods ended January 31, 2007 and 2006 were as follows (amounts in thousands):
2007 2006
Intrinsic value of options exercised . . . . . . . . . . . . . . . . . . . . . . . . . . . . . . . . . $11,234 $26,869Fair value of options vested. . . . . . . . . . . . . . . . . . . . . . . . . . . . . . . . . . . . . . . $21,642 $23,551
Stock options outstanding and exercisable at January 31, 2007 were as follows:
Range of Exercise Prices ($)
NumberOutstanding
(in 000’s)
Weighted-Average
RemainingContractual
Life(in years)
Weighted-AverageExercise
Price($)
NumberExercisable(in 000’s)
Weighted-Average
RemainingContractual
Life(in years)
Weighted-AverageExercise
Price($)
Options Outstanding Options Exercisable
4.38 - 6.86 . . . . . . . . . . . . . . . 10,052 2.1 5.34 10,052 2.1 5.346.87 - 9.66 . . . . . . . . . . . . . . . 3,251 3.1 9.03 3,251 3.1 9.03
9.67 - 10.88 . . . . . . . . . . . . . . . 5,235 5.3 10.75 5,235 5.3 10.75
10.89 - 20.14 . . . . . . . . . . . . . . . 2,286 6.9 20.14 1,751 6.9 20.14
20.15 - 35.97 . . . . . . . . . . . . . . . 5,659 8.8 33.14 1,754 8.1 33.27
26,483 4.7 14.08 22,043 3.9 10.56
7. Earnings per Share Information
Information pertaining to the calculation of earnings per share for the three-month periods ended January 31,2007 and 2006 are as follows (amounts in thousands):
2007 2006
Basic weighted-average shares. . . . . . . . . . . . . . . . . . . . . . . . . . . . . . . . . . . . . 154,212 155,076
Common stock equivalents . . . . . . . . . . . . . . . . . . . . . . . . . . . . . . . . . . . . . . . 9,836 11,951
Diluted weighted-average shares . . . . . . . . . . . . . . . . . . . . . . . . . . . . . . . . . . . 164,048 167,027
9. Stock Repurchase Program
In March 2003, the Company’s Board of Directors authorized the repurchase of up to 20 million shares of itsCommon Stock, par value $.01, from time to time, in open market transactions or otherwise, for the purpose of
11
TOLL BROTHERS, INC. AND SUBSIDIARIES
NOTES TO CONDENSED CONSOLIDATED FINANCIAL STATEMENTS — (Continued)

providing shares for its various employee benefit plans. At January 31, 2007, the Company was authorized torepurchase approximately 12.1 million shares.
10. Commitments and Contingencies
At January 31, 2007, the aggregate purchase price of land parcels under option and purchase agreements,excluding parcels that the Company does not expect to acquire, was approximately $2.68 billion (including$1.22 billion of land to be acquired from joint ventures which the Company has investments in, made advances to ormade loan guarantees on behalf of, in the amount of $162.7 million), of which it had paid or depositedapproximately $161.3 million. The Company’s option agreements to acquire the home sites do not require theCompany to buy the home sites, although the Company may, in some cases, forfeit any deposit balance outstandingif and when it terminates an option contract. Of the $161.3 million the Company had paid or deposited on thesepurchase agreements, $124.0 million was non-refundable at January 31, 2007. Any deposit in the form of a standbyletter of credit is recorded as a liability at the time the standby letter of credit is issued. Included in accrued liabilitiesis $76.8 million representing the Company’s outstanding standby letters of credit issued in connection with optionsto purchase home sites.
At January 31, 2007, the Company had outstanding surety bonds amounting to approximately $742.5 million,related primarily to its obligations to various governmental entities to construct improvements in the Company’svarious communities. The Company estimates that approximately $271.2 million of work remains on theseimprovements. The Company has an additional $132.9 million of surety bonds outstanding that guarantee otherobligations of the Company. The Company does not believe it is likely that any outstanding bonds will be drawnupon.
At January 31, 2007, the Company had agreements of sale outstanding to deliver 5,949 homes with anaggregate sales value of approximately $4.15 billion, of which the Company has recognized $166.9 million ofrevenues using the percentage of completion accounting method.
At January 31, 2007, the Company was committed to providing approximately $942.4 million of mortgageloans to its home buyers and to others. All loans with committed interest rates are covered by take-out commitmentsfrom third-party lenders, which minimize the Company’s interest rate risk.
The Company has a $1.8 billion credit facility consisting of a $1.5 billion unsecured revolving credit facilityand a $300 million term loan facility (collectively, the “Credit Facility”) with 33 banks, which extends to March 17,2011. At January 31, 2007, interest was payable on borrowings under the revolving credit facility at 0.475% (subjectto adjustment based upon the Company’s debt rating and leverage ratios) above the Eurodollar rate or at otherspecified variable rates as selected by the Company from time to time. At January 31, 2007, the Company had nooutstanding borrowings against the revolving credit facility but had letters of credit of approximately $398.5 millionoutstanding under it, of which the Company had recorded $76.8 million as liabilities under land purchaseagreements. Under the term loan facility, interest is payable at 0.50% (subject to adjustment based upon theCompany’s debt rating and leverage ratios) above the Eurodollar rate or at other specified variable rates as selectedby the Company from time to time. At January 31, 2007, interest was payable on the $300 million term loan at5.87%. Under the terms of the Credit Facility, the Company is not permitted to allow its maximum leverage ratio (asdefined in the agreement) to exceed 2.00 to 1.00 and was required to maintain a minimum tangible net worth (asdefined in the agreement) of approximately $2.36 billion at January 31, 2007. At January 31, 2007, the Company’sleverage ratio was approximately 0.56 to 1.00 and its tangible net worth was approximately $3.47 billion. Basedupon the minimum tangible net worth requirement, the Company’s ability to pay dividends and repurchase itscommon stock was limited to an aggregate amount of approximately $1.11 billion at January 31, 2007.
The Company is involved in various claims and litigation arising in the ordinary course of business. TheCompany believes that the disposition of these matters will not have a material effect on the business or on thefinancial condition of the Company.
12
TOLL BROTHERS, INC. AND SUBSIDIARIES
NOTES TO CONDENSED CONSOLIDATED FINANCIAL STATEMENTS — (Continued)

In January 2006, the Company received a request for information pursuant to Section 308 of the Clean WaterAct from Region 3 of the Environmental Protection Agency (the “EPA”) requesting information about storm waterdischarge practices in connection with our homebuilding projects in the states that comprise EPA Region 3. To theextent the EPA’s review were to lead the EPA to assert violations of state and/or federal regulatory requirements andrequest injunctive relief and/or civil penalties, the Company would defend and attempt to resolve any such assertedviolations. At this time the Company cannot predict the outcome of the EPA’s review.
11. Business Segments
During the fourth quarter of fiscal 2006, the Company reassessed the aggregation of its operating segments,and as a result, restated its disclosure to include four separate reportable segments. The restatement had no impacton the Company’s financial position, results of operations or cash flows for the three-month period endedJanuary 31, 2006.
Revenue and income before income taxes for each of the Company’s geographic segments for the three monthsended January 31, 2007 and 2006 were as follows (amounts in thousands):
2007 2006
Revenues:
North . . . . . . . . . . . . . . . . . . . . . . . . . . . . . . . . . . . . . . . . . . . . . . . . . $ 211,147 $ 311,328
Mid-Atlantic . . . . . . . . . . . . . . . . . . . . . . . . . . . . . . . . . . . . . . . . . . . 331,322 393,954
South . . . . . . . . . . . . . . . . . . . . . . . . . . . . . . . . . . . . . . . . . . . . . . . . . 247,766 275,830
West . . . . . . . . . . . . . . . . . . . . . . . . . . . . . . . . . . . . . . . . . . . . . . . . . 300,376 359,844
Total . . . . . . . . . . . . . . . . . . . . . . . . . . . . . . . . . . . . . . . . . . . . . . . $1,090,611 $1,340,956
Income before income taxes:
North . . . . . . . . . . . . . . . . . . . . . . . . . . . . . . . . . . . . . . . . . . . . . . . . . $ 755 $ 71,861
Mid-Atlantic . . . . . . . . . . . . . . . . . . . . . . . . . . . . . . . . . . . . . . . . . . . 51,604 118,059
South . . . . . . . . . . . . . . . . . . . . . . . . . . . . . . . . . . . . . . . . . . . . . . . . . 4,019 34,462
West . . . . . . . . . . . . . . . . . . . . . . . . . . . . . . . . . . . . . . . . . . . . . . . . . 56,866 84,340
Corporate and other . . . . . . . . . . . . . . . . . . . . . . . . . . . . . . . . . . . . . . (26,044) (43,075)
Total . . . . . . . . . . . . . . . . . . . . . . . . . . . . . . . . . . . . . . . . . . . . . . . $ 87,200 $ 265,647
Corporate and other is comprised principally of general corporate expenses such as the Offices of the ChiefExecutive Officer and President, and the corporate finance, accounting, audit, tax, human resources, risk man-agement, marketing and legal groups, offset in part by interest income and income from our ancillary businesses.
13
TOLL BROTHERS, INC. AND SUBSIDIARIES
NOTES TO CONDENSED CONSOLIDATED FINANCIAL STATEMENTS — (Continued)

Inventory write-downs and the expensing of costs that it believed not to be recoverable for the three monthsended January 31, 2007 and 2006 were as follows (amounts in thousands):
2007 2006
Land controlled for future communities:
North . . . . . . . . . . . . . . . . . . . . . . . . . . . . . . . . . . . . . . . . . . . . . . . . . . . . . . $ 933 $ 595
Mid-Atlantic . . . . . . . . . . . . . . . . . . . . . . . . . . . . . . . . . . . . . . . . . . . . . . . . . 1,352
South . . . . . . . . . . . . . . . . . . . . . . . . . . . . . . . . . . . . . . . . . . . . . . . . . . . . . . 1,937 429
West . . . . . . . . . . . . . . . . . . . . . . . . . . . . . . . . . . . . . . . . . . . . . . . . . . . . . . . 9,717 106
13,939 1,130
Operating communities:
North . . . . . . . . . . . . . . . . . . . . . . . . . . . . . . . . . . . . . . . . . . . . . . . . . . . . . . 32,200
Mid-Atlantic . . . . . . . . . . . . . . . . . . . . . . . . . . . . . . . . . . . . . . . . . . . . . . . . . 21,500
South . . . . . . . . . . . . . . . . . . . . . . . . . . . . . . . . . . . . . . . . . . . . . . . . . . . . . . 28,100
West . . . . . . . . . . . . . . . . . . . . . . . . . . . . . . . . . . . . . . . . . . . . . . . . . . . . . . . 1,162
82,962 —
$96,901 $1,130
Total assets for each of the Company’s geographic segments at January 31, 2007 and October 31, 2006(amounts in thousands) were as follows:
January 31,2007
October 31,2006
North . . . . . . . . . . . . . . . . . . . . . . . . . . . . . . . . . . . . . . . . . . . . . . . . . . $1,814,921 $1,776,723
Mid-Atlantic . . . . . . . . . . . . . . . . . . . . . . . . . . . . . . . . . . . . . . . . . . . . . 1,699,190 1,729,057
South . . . . . . . . . . . . . . . . . . . . . . . . . . . . . . . . . . . . . . . . . . . . . . . . . . 1,358,339 1,338,344
West . . . . . . . . . . . . . . . . . . . . . . . . . . . . . . . . . . . . . . . . . . . . . . . . . . . 1,864,115 1,843,395
Corporate and other . . . . . . . . . . . . . . . . . . . . . . . . . . . . . . . . . . . . . . . . 680,556 896,022
Total . . . . . . . . . . . . . . . . . . . . . . . . . . . . . . . . . . . . . . . . . . . . . . . . . $7,417,121 $7,583,541
Corporate and other is comprised principally of cash and cash equivalents and the assets of the Company’smanufacturing facilities and mortgage subsidiary.
14
TOLL BROTHERS, INC. AND SUBSIDIARIES
NOTES TO CONDENSED CONSOLIDATED FINANCIAL STATEMENTS — (Continued)
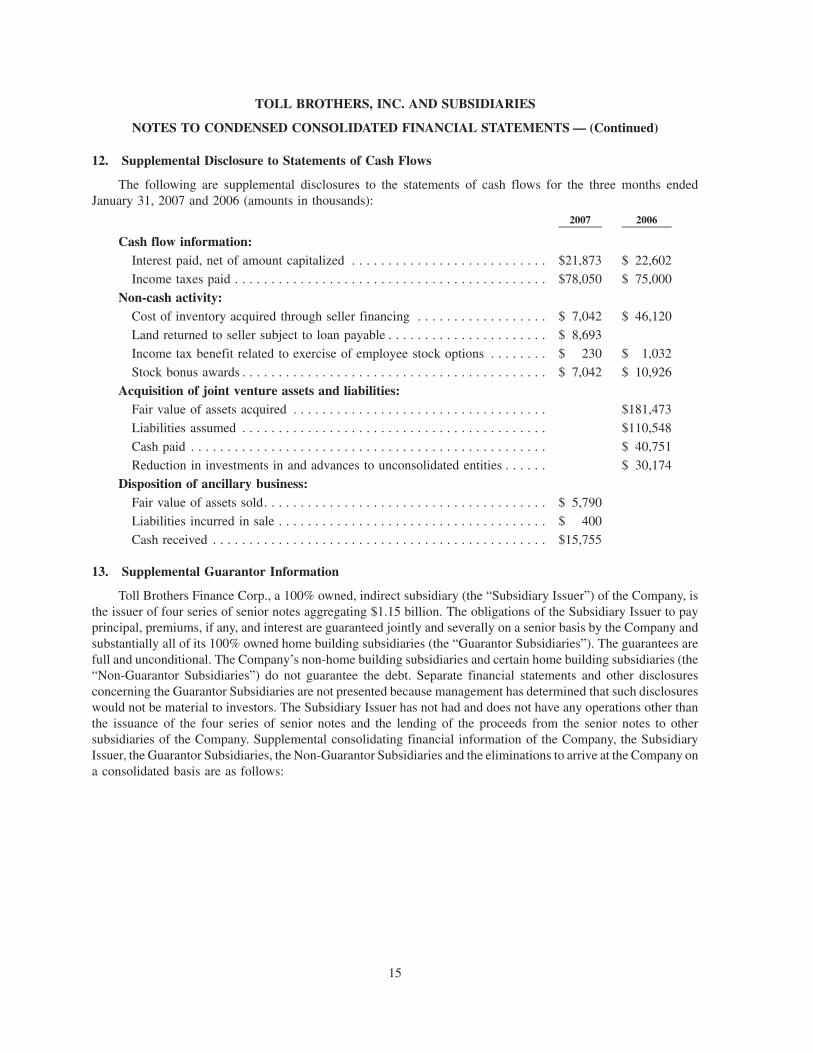
12. Supplemental Disclosure to Statements of Cash Flows
The following are supplemental disclosures to the statements of cash flows for the three months endedJanuary 31, 2007 and 2006 (amounts in thousands):
2007 2006
Cash flow information:Interest paid, net of amount capitalized . . . . . . . . . . . . . . . . . . . . . . . . . . . $21,873 $ 22,602
Income taxes paid . . . . . . . . . . . . . . . . . . . . . . . . . . . . . . . . . . . . . . . . . . . $78,050 $ 75,000
Non-cash activity:Cost of inventory acquired through seller financing . . . . . . . . . . . . . . . . . . $ 7,042 $ 46,120
Land returned to seller subject to loan payable . . . . . . . . . . . . . . . . . . . . . . $ 8,693
Income tax benefit related to exercise of employee stock options . . . . . . . . $ 230 $ 1,032
Stock bonus awards . . . . . . . . . . . . . . . . . . . . . . . . . . . . . . . . . . . . . . . . . . $ 7,042 $ 10,926
Acquisition of joint venture assets and liabilities:Fair value of assets acquired . . . . . . . . . . . . . . . . . . . . . . . . . . . . . . . . . . . $181,473
Liabilities assumed . . . . . . . . . . . . . . . . . . . . . . . . . . . . . . . . . . . . . . . . . . $110,548
Cash paid . . . . . . . . . . . . . . . . . . . . . . . . . . . . . . . . . . . . . . . . . . . . . . . . . $ 40,751
Reduction in investments in and advances to unconsolidated entities . . . . . . $ 30,174
Disposition of ancillary business:Fair value of assets sold. . . . . . . . . . . . . . . . . . . . . . . . . . . . . . . . . . . . . . . $ 5,790
Liabilities incurred in sale . . . . . . . . . . . . . . . . . . . . . . . . . . . . . . . . . . . . . $ 400
Cash received . . . . . . . . . . . . . . . . . . . . . . . . . . . . . . . . . . . . . . . . . . . . . . $15,755
13. Supplemental Guarantor Information
Toll Brothers Finance Corp., a 100% owned, indirect subsidiary (the “Subsidiary Issuer”) of the Company, isthe issuer of four series of senior notes aggregating $1.15 billion. The obligations of the Subsidiary Issuer to payprincipal, premiums, if any, and interest are guaranteed jointly and severally on a senior basis by the Company andsubstantially all of its 100% owned home building subsidiaries (the “Guarantor Subsidiaries”). The guarantees arefull and unconditional. The Company’s non-home building subsidiaries and certain home building subsidiaries (the“Non-Guarantor Subsidiaries”) do not guarantee the debt. Separate financial statements and other disclosuresconcerning the Guarantor Subsidiaries are not presented because management has determined that such disclosureswould not be material to investors. The Subsidiary Issuer has not had and does not have any operations other thanthe issuance of the four series of senior notes and the lending of the proceeds from the senior notes to othersubsidiaries of the Company. Supplemental consolidating financial information of the Company, the SubsidiaryIssuer, the Guarantor Subsidiaries, the Non-Guarantor Subsidiaries and the eliminations to arrive at the Company ona consolidated basis are as follows:
15
TOLL BROTHERS, INC. AND SUBSIDIARIES
NOTES TO CONDENSED CONSOLIDATED FINANCIAL STATEMENTS — (Continued)

Condensed Consolidating Balance Sheet at January 31, 2007 ($ in thousands):Toll
Brothers,Inc.
SubsidiaryIssuer
GuarantorSubsidiaries
Non-Guarantor
Subsidiaries Eliminations Consolidated
ASSETSCash and cash equivalents . . . . . . . . . 380,615 68,634 449,249
Inventory . . . . . . . . . . . . . . . . . . . . . 5,797,982 384,297 6,182,279
Property, construction and officeequipment, net . . . . . . . . . . . . . . . 91,073 3,226 94,299
Receivables, prepaid expenses andother assets . . . . . . . . . . . . . . . . . . 4,759 65,782 72,977 501 144,019
Contracts receivable . . . . . . . . . . . . . 98,602 68,285 166,887
Mortgage loans receivable . . . . . . . . . 78,345 78,345
Customer deposits held in escrow . . . 48,724 2,284 51,008
Investments in and advances to
unconsolidated entities . . . . . . . . . 251,035 251,035
Investments in and advances to
consolidated entities . . . . . . . . . . . 3,785,882 1,156,424 (1,336,009) (134,979) (3,471,318) —
3,785,882 1,161,183 5,397,804 543,069 (3,470,817) 7,417,121
LIABILITIES AND STOCKHOLDERS’ EQUITYLiabilities:
Loans payable . . . . . . . . . . . . . . . . 484,741 226,129 710,870
Senior notes . . . . . . . . . . . . . . . . . 1,141,452 1,141,452
Senior subordinated notes . . . . . . . 350,000 350,000
Mortgage company warehouseloan . . . . . . . . . . . . . . . . . . . . . 65,887 65,887
Customer deposits . . . . . . . . . . . . . 311,443 33,231 344,674
Accounts payable . . . . . . . . . . . . . 243,771 9,582 253,353
Accrued expenses . . . . . . . . . . . . . 19,731 614,680 124,775 759,186
Income taxes payable . . . . . . . . . . 288,074 (1,946) 286,128
Total liabilities . . . . . . . . . . . . . 288,074 1,161,183 2,004,635 457,658 — 3,911,550
Minority interest . . . . . . . . . . . . . . . . 7,763 7,763
Stockholders’ equity:
Common stock . . . . . . . . . . . . . . . 1,563 2,003 (2,003) 1,563
Additional paid-in capital . . . . . . . 225,359 4,420 2,734 (7,154) 225,359
Retained earnings . . . . . . . . . . . . . 3,317,590 3,388,749 72,911 (3,461,660) 3,317,590
Treasury stock, at cost . . . . . . . . . . (46,704) (46,704)
Total stockholders’ equity . . . . . 3,497,808 — 3,393,169 77,648 (3,470,817) 3,497,808
3,785,882 1,161,183 5,397,804 543,069 (3,470,817) 7,417,121
16
TOLL BROTHERS, INC. AND SUBSIDIARIES
NOTES TO CONDENSED CONSOLIDATED FINANCIAL STATEMENTS — (Continued)

Condensed Consolidating Balance Sheet at October 31, 2006 ($ in thousands):Toll
Brothers,Inc.
SubsidiaryIssuer
GuarantorSubsidiaries
Non-Guarantor
Subsidiaries Eliminations Consolidated
ASSETSCash and cash equivalents . . . . . . . . . 582,465 50,059 632,524
Inventory . . . . . . . . . . . . . . . . . . . . . . 5,719,057 376,645 6,095,702
Property, construction and officeequipment, net . . . . . . . . . . . . . . . . 90,676 8,413 99,089
Receivables, prepaid expenses andother assets . . . . . . . . . . . . . . . . . . 4,932 76,317 78,920 277 160,446
Contracts receivable . . . . . . . . . . . . . . 87,030 83,081 170,111
Mortgage loans receivable . . . . . . . . . 130,326 130,326
Customer deposits held in escrow . . . . 46,198 3,478 49,676
Investments in and advances tounconsolidated entities . . . . . . . . . . 245,667 245,667
Investments in and advances toconsolidated entities . . . . . . . . . . . . 3,752,372 1,157,554 (1,350,097) (151,355) (3,408,474) —
3,752,372 1,162,486 5,497,313 579,567 (3,408,197) 7,583,541
LIABILITIES AND STOCKHOLDERS’ EQUITYLiabilities:
Loans payable . . . . . . . . . . . . . . . . 510,848 226,086 736,934
Senior notes . . . . . . . . . . . . . . . . . . 1,141,167 1,141,167Senior subordinated notes . . . . . . . . 350,000 350,000
Mortgage company warehouseloan . . . . . . . . . . . . . . . . . . . . . . 119,705 119,705
Customer deposits . . . . . . . . . . . . . 325,607 34,540 360,147
Accounts payable . . . . . . . . . . . . . . 282,194 9,977 292,171
Accrued expenses . . . . . . . . . . . . . 21,319 690,651 113,319 (1) 825,288
Income taxes payable . . . . . . . . . . . 336,446 (1,946) 334,500
Total liabilities . . . . . . . . . . . . 336,446 1,162,486 2,159,300 501,681 (1) 4,159,912
Minority interest . . . . . . . . . . . . . . . . 7,703 7,703
Stockholders’ equity:
Common stock. . . . . . . . . . . . . . . . 1,563 2,003 (2,003) 1,563
Additional paid-in capital . . . . . . . . 220,783 4,420 2,734 (7,154) 220,783
Retained earnings. . . . . . . . . . . . . . 3,263,274 3,333,593 65,446 (3,399,039) 3,263,274
Treasury stock, at cost . . . . . . . . . . (69,694) (69,694)
Total stockholders’ equity . . . . 3,415,926 — 3,338,013 70,183 (3,408,196) 3,415,926
3,752,372 1,162,486 5,497,313 579,567 (3,408,197) 7,583,541
17
TOLL BROTHERS, INC. AND SUBSIDIARIES
NOTES TO CONDENSED CONSOLIDATED FINANCIAL STATEMENTS — (Continued)

Condensed Consolidating Statement of Income for the three months ended January 31, 2007($ in thousands):
TollBrothers,
Inc.Subsidiary
IssuerGuarantor
Subsidiaries
Non-Guarantor
Subsidiaries Eliminations Consolidated
Revenues:
Traditional home sales. . . . . . . . . . 1,054,136 1,054,136Percentage of completion . . . . . . . 14,896 18,189 33,085
Land sales . . . . . . . . . . . . . . . . . . 3,390 3,390
— — 1,072,422 18,189 — 1,090,611
Costs of revenues:
Traditional home sales. . . . . . . . . . 846,177 1,566 (1,340) 846,403
Percentage of completion . . . . . . . 12,473 13,424 25,897
Land sales . . . . . . . . . . . . . . . . . . 1,037 1,037
Interest . . . . . . . . . . . . . . . . . . . . . 16,735 18,989 3,654 (16,735) 22,643
— 16,735 878,676 18,644 (18,075) 895,980
Selling, general and administrative . . 7 180 134,425 8,403 (8,805) 134,210
Goodwill impairment . . . . . . . . . . . . 8,973 8,973
Income from operations . . . . . . . . . . (7) (16,915) 50,348 (8,858) 26,880 51,448
Other:
Equity earnings . . . . . . . . . . . . . . . 6,792 6,792
Interest and other . . . . . . . . . . . . . 16,915 30,067 21,117 (39,139) 28,960
Earnings from subsidiaries. . . . . . . 87,207 (87,207) —
Income before income taxes . . . . . . . 87,200 — 87,207 12,259 (99,466) 87,200
Income taxes . . . . . . . . . . . . . . . . . . 32,884 32,051 4,793 (36,844) 32,884
Net income. . . . . . . . . . . . . . . . . . . . 54,316 — 55,156 7,466 (62,622) 54,316
18
TOLL BROTHERS, INC. AND SUBSIDIARIES
NOTES TO CONDENSED CONSOLIDATED FINANCIAL STATEMENTS — (Continued)

Condensed Consolidating Statement of Income for the three months ended January 31, 2006($ in thousands):
TollBrothers,
Inc.Subsidiary
IssuerGuarantor
Subsidiaries
Non-Guarantor
Subsidiaries Eliminations Consolidated
Revenues:
Traditional home sales . . . . . 1,278,709 1,278,709Percentage of completion . . . 28,015 29,554 57,569
Land sales . . . . . . . . . . . . . . 4,678 4,678
— — 1,311,402 29,554 — 1,340,956
Costs of revenues:
Traditional home sales . . . . . 883,469 1,271 (649) 884,091
Percentage of completion . . . 21,616 25,730 47,346
Land sales . . . . . . . . . . . . . . 3,836 3,836
Interest . . . . . . . . . . . . . . . . 16,735 28,553 766 (17,300) 28,754
— 16,735 937,474 27,767 (17,949) 964,027
Selling, general andadministrative . . . . . . . . . . . 17 173 139,554 7,421 (7,987) 139,178
Income from operations . . . . . . (17) (16,908) 234,374 (5,634) 25,936 237,751
Other:
Equity earnings . . . . . . . . . . 16,569 16,569
Interest and other . . . . . . . . . 16,908 14,720 11,996 (32,297) 11,327
Earnings from subsidiaries . . 265,664 (265,664) —
Income before income taxes. . . 265,647 — 265,663 6,362 (272,025) 265,647
Income taxes . . . . . . . . . . . . . . 101,797 102,572 2,488 (105,060) 101,797
Net income . . . . . . . . . . . . . . . 163,850 — 163,091 3,874 (166,965) 163,850
19
TOLL BROTHERS, INC. AND SUBSIDIARIES
NOTES TO CONDENSED CONSOLIDATED FINANCIAL STATEMENTS — (Continued)

Condensed Consolidating Statement of Cash Flows for the three months ended January 31, 2007($ in thousands):
TollBrothers,
Inc.Subsidiary
IssuerGuarantor
Subsidiaries
Non-Guarantor
Subsidiaries Eliminations Consolidated
Cash flow from operating activities:Net income . . . . . . . . . . . . . . . . . . . . . . . . . . . . . . . . . . . 54,316 55,156 7,466 (62,622) 54,316Adjustments to reconcile net income to net cash used in
operating activities:Depreciation and amortization . . . . . . . . . . . . . . . . . . . . . 285 7,449 115 7,849Amortization of initial benefit obligation . . . . . . . . . . . . . . 442 442Stock-based compensation . . . . . . . . . . . . . . . . . . . . . . . . 12,888 12,888Excess tax benefit from stock-based compensation . . . . . . . . (2,976) (2,976)Equity earnings in unconsolidated entities . . . . . . . . . . . . . . (6,521) (271) (6,792)Distributions from unconsolidated entities . . . . . . . . . . . . . . 6,660 (7) 6,653Deferred tax provision . . . . . . . . . . . . . . . . . . . . . . . . . . (37,874) (37,874)Provision for inventory write-offs . . . . . . . . . . . . . . . . . . . 96,901 96,901Goodwill impairment . . . . . . . . . . . . . . . . . . . . . . . . . . . 8,973 8,973Gain on sale of business . . . . . . . . . . . . . . . . . . . . . . . . . (9,565) (9,565)Changes in operating assets and liabilities
Increase in inventory . . . . . . . . . . . . . . . . . . . . . . . . . . (179,053) (7,652) (186,705)Origination of mortgage loans . . . . . . . . . . . . . . . . . . . . (281,317) (281,317)Sale of mortgage loans . . . . . . . . . . . . . . . . . . . . . . . . 333,298 333,298Decrease (increase) in contracts receivable . . . . . . . . . . . . (11,572) 14,796 3,224Decrease (increase) in receivables, prepaid expenses and
other assets . . . . . . . . . . . . . . . . . . . . . . . . . . . . . . (33,510) 1,303 (13,566) (10,556) 62,622 6,293Decrease in customer deposits . . . . . . . . . . . . . . . . . . . . (16,690) (115) (16,805)(Decrease) increase in accounts payable and accrued
expenses . . . . . . . . . . . . . . . . . . . . . . . . . . . . . . . . 7,010 (1,588) (114,277) 11,061 (97,794)Decrease in current income taxes payable . . . . . . . . . . . . (7,291) (7,291)
Net cash (used in) provided by operating activities . . . . . (7,437) — (166,098) 57,253 — (116,282)
Cash flow from investing activities:Purchase of property and equipment, net . . . . . . . . . . . . . . . . (6,307) (718) (7,025)Purchase of marketable securities . . . . . . . . . . . . . . . . . . . . . (1,073,575) (112,950) (1,186,525)Sale of marketable securities . . . . . . . . . . . . . . . . . . . . . . . . 1,073,575 112,950 1,186,525Proceeds from sale of business . . . . . . . . . . . . . . . . . . . . . . 15,755 15,755Investments in and advances to unconsolidated entities . . . . . . . (4,989) (4,989)
Net cash provided by (used in) investing activities . . . . . — — (11,296) 15,037 — 3,741
Cash flow from financing activities:Proceeds from loans payable . . . . . . . . . . . . . . . . . . . . . . . . 506 286,764 287,270Principal payments of loans payable . . . . . . . . . . . . . . . . . . . (24,962) (340,539) (365,501)Proceeds from stock-based benefit plans . . . . . . . . . . . . . . . . 3,317 3,317Excess tax benefit from stock-based compensation . . . . . . . . . . 2,976 2,976Proceeds from restricted stock award . . . . . . . . . . . . . . . . . . 1,800 1,800Change in minority interest . . . . . . . . . . . . . . . . . . . . . . . . . 60 60Purchase of treasury stock . . . . . . . . . . . . . . . . . . . . . . . . . (656) (656)
Net cash (used in) provided by financing activities . . . . . 7,437 — (24,456) (53,715) — (70,734)
Net (decrease) increase in cash and cash equivalents . . . . . . . . . . — — (201,850) 18,575 — (183,275)Cash and cash equivalents, beginning of period . . . . . . . . . . . . . 582,465 50,059 632,524
Cash and cash equivalents, end of period . . . . . . . . . . . . . . . . . — — 380,615 68,634 — 449,249
20
TOLL BROTHERS, INC. AND SUBSIDIARIES
NOTES TO CONDENSED CONSOLIDATED FINANCIAL STATEMENTS — (Continued)

Condensed Consolidating Statement of Cash Flows for the three months ended January 31, 2006($ in thousands):
TollBrothers,
Inc.Subsidiary
IssuerGuarantor
Subsidiaries
Non-Guarantor
Subsidiaries Eliminations Consolidated
Cash flow from operating activities:Net income . . . . . . . . . . . . . . . . . . . . . . . . . . . . . . 163,850 163,091 3,874 (166,965) 163,850Adjustments to reconcile net income to net cash used
in operating activities:Depreciation and amortization . . . . . . . . . . . . . . . 285 6,050 573 6,908Amortization of initial benefit obligation . . . . . . . . 449 449Stock-based compensation . . . . . . . . . . . . . . . . . . 11,075 11,075Excess tax benefit from stock-based
compensation . . . . . . . . . . . . . . . . . . . . . . . . . (7,301) (7,301)Equity earnings in unconsolidated entities . . . . . . . (16,569) (16,569)Distributions from unconsolidated entities . . . . . . . 2,643 2,643Deferred tax provision . . . . . . . . . . . . . . . . . . . . . 7,625 7,625Provision for inventory write-offs . . . . . . . . . . . . . 1,129 1,129Changes in operating assets and liabilities:
Increase in inventory . . . . . . . . . . . . . . . . . . . . (215,625) (34,470) (250,095)Origination of mortgage loans . . . . . . . . . . . . . . (176,908) (176,908)Sale of mortgage loans . . . . . . . . . . . . . . . . . . . 227,749 227,749Contracts receivable . . . . . . . . . . . . . . . . . . . . . (28,015) (29,554) (57,569)(Increase) decrease in receivables, prepaid
expenses and other assets . . . . . . . . . . . . . . . (196,846) 573 (7,642) 47,977 163,925 7,987Increase in customer deposits . . . . . . . . . . . . . . 481 481Increase (decrease) in accounts payable and
accrued expenses . . . . . . . . . . . . . . . . . . . . . 10,926 (858) (104,876) 6,327 3,040 (85,441)Increase in current income taxes payable . . . . . . 19,173 19,173
Net cash (used in) provided by operatingactivities . . . . . . . . . . . . . . . . . . . . . . . . . 8,502 — (198,884) 45,568 — (144,814)
Cash flow from investing activities:Purchase of property and equipment, net . . . . . . . . . . (13,469) (795) (14,264)Purchases of marketable securities . . . . . . . . . . . . . . (970,820) (15,000) (985,820)Sales of marketable securities . . . . . . . . . . . . . . . . . 970,820 15,000 985,820Investments in and advances to unconsolidated
entities . . . . . . . . . . . . . . . . . . . . . . . . . . . . . . . (71,369) (71,369)Acquisition of joint venture interest . . . . . . . . . . . . . (40,751) (40,751)Distributions from unconsolidated entities . . . . . . . . . 2,512 2,512
Net cash used in investing activities . . . . . . . . — — (123,077) (795) — (123,872)
Cash flow from financing activities:Proceeds from loans payable . . . . . . . . . . . . . . . . . . 80,870 177,842 258,712Principal payments of loans payable . . . . . . . . . . . . . (93,894) (213,286) (307,180)Proceeds from stock based benefit plans . . . . . . . . . . 5,972 5,972Excess tax benefit from stock-based compensation . . . 7,301 7,301Purchase of treasury stock . . . . . . . . . . . . . . . . . . . . (21,775) (21,775)
Net cash used in financing activities . . . . . . . . (8,502) — (13,024) (35,444) — (56,970)
Net (decrease) increase in cash and cash equivalents . . . — — (334,985) 9,329 — (325,656)Cash and cash equivalents, beginning of period . . . . . . . 664,312 24,907 689,219
Cash and cash equivalents, end of period . . . . . . . . . . . — — 329,327 34,236 — 363,563
21
TOLL BROTHERS, INC. AND SUBSIDIARIES
NOTES TO CONDENSED CONSOLIDATED FINANCIAL STATEMENTS — (Continued)

ITEM 2. MANAGEMENT’S DISCUSSION AND ANALYSIS OF FINANCIAL CONDITION ANDRESULTS OF OPERATIONS
OVERVIEW
The financial guidance contained herein related to our expected results of operations for fiscal 2007 reflectsour expectations as of February 22, 2007, is the same guidance given in the Form 8-K that we filed on February 22,2007 and is not being reconfirmed or updated by this Quarterly Report on Form 10-Q.
In our first quarter ended January 31, 2007, we recognized $1.09 billion of revenues and earned $54.3 millionof net income as compared to $1.34 billion of revenue and $163.9 million of net income in the first quarter of fiscal2006. We recognized $105.9 million of inventory write-downs and a goodwill impairment in the first quarter offiscal 2007 as compared to $1.1 million of inventory write-downs in the first quarter of fiscal 2006. In addition, ourbacklog at January 31, 2007 of $4.15 billion decreased 30% as compared to our backlog at January 31, 2006.Backlog consists of homes under contract but not yet delivered to our home buyer for our traditional product and forour non-traditional high- and mid-rise product accounted for using the completed contract method of accounting.Backlog for homes for which we use the percentage of completion accounting method consists of homes undercontract but not yet delivered to our home buyer less the amount of revenues we have recognized related to thosehomes.
Beginning in the fourth quarter of fiscal 2005 and continuing throughout fiscal 2006 and into the secondquarter of fiscal 2007, we have experienced a slowdown in new contracts signed. In our fiscal quarter endedJanuary 31, 2007, the value of new contracts signed of $748.7 million was $391.2 million, or 34%, lower than thevalue of contracts signed in the first quarter of fiscal 2006. We believe this slowdown is attributable to a decline inconsumer confidence, an overall softening of demand for new homes, and an oversupply of homes available for sale.We attribute the reduction in demand to concerns on the part of prospective home buyers about the direction ofhome prices, due in part to many home builders’ advertising price reductions and increased sales incentives, andconcerns by the prospective home buyers about being able to sell their existing homes. In addition, we believespeculators and investors are no longer helping to fuel demand. We try to avoid selling homes to speculators, and wegenerally do not build detached homes without having a signed agreement of sale and receiving a substantial downpayment from a buyer. Nonetheless, we have been impacted by an overall increase in the supply of homes availablefor sale in many markets, as speculators attempt to sell the homes they previously purchased or cancel contracts forhomes under construction, and as builders, who, as part of their business strategy, were building homes inanticipation of capturing additional sales in a demand-driven market, attempt to reduce their inventories bylowering prices and adding incentives. In addition, based on the high cancellation rates reported by us and otherbuilders, non-speculative buyer cancellations are also adding to the supply of homes in the marketplace. Of theagreements of sale that home buyers executed during the first quarter of fiscal 2007 and the fourth quarter of fiscal2006, they canceled approximately 30% and 37% of them, respectively. Our historical cancellation rate has beenapproximately 7%. When we report contracts signed, the number and value of contracts signed are reported net ofany cancellations occurring during the reporting period, whether signed in that reporting period or in a prior period.Despite this slowdown, we remain cautiously optimistic about the future growth of our business. Our industrydemographics remain strong due to the continuing regulation-induced constraints on lot supplies and the growingnumber of affluent households. In the current challenging environment, we believe our access to reliable capital andour strong balance sheet give us an important competitive advantage. Based on our experience during past cycles,we have learned that unexpected opportunities may arise in difficult times for those who are well-prepared. Webelieve that our solid financial base, our broad geographic presence, our diversified product lines and our nationalbrand name all position us well for such opportunities now and in the future. At January 31, 2007, we had$449.2 million of cash and cash equivalents and approximately $1.10 billion available under our bank revolvingcredit facility which extends to March 17, 2011. With these resources and our history of success in accessing thepublic debt markets, we believe we have the resources available to fund this potential future growth.
We believe geographic and product diversification, access to lower-cost capital, a versatile and abundant homemortgage market, and improving demographics have in the past and will in the future promote demand for thosebuilders who can control land and persevere through the increasingly difficult regulatory approval process. Webelieve that this evolution in our industry favors the large publicly traded home building companies with the capital
22

and expertise to control home sites and gain market share. We believe that as the approval process continues tobecome more difficult, and as the political pressure from no-growth proponents continues to increase, our expertisein taking land through the approval process and our already approved land positions will allow us to grow in theyears to come.
Because of the length of time that it takes to obtain the necessary approvals on a property, complete the landimprovements on it, and deliver a home after a home buyer signs an agreement of sale, we are subject to many risks.We attempt to reduce certain risks by: controlling land for future development through options whenever possible,thus allowing us to obtain the necessary governmental approvals before acquiring title to the land; generallycommencing construction of a detached home only after executing an agreement of sale and receiving a substantialdown payment from a buyer; and using subcontractors to perform home construction and land development work ona fixed-price basis. In response to current market conditions, we are re-evaluating and renegotiating many of ouroptioned land positions. As a result, we have reduced our land position to approximately 67,500 lots controlledcompared to 73,000 at October 31, 2006 and 91,200 lots at April 30, 2006. In the first quarter of fiscal 2007, werecognized impairment charges of approximately $83.0 million on several communities in which we are currentlyselling and on land owned and $13.9 million of write-downs attributable to land under option related to futurecommunities. In addition, we recognized a $9.0 million charge for impairment of the goodwill related to anacquisition in the Detroit, Michigan market in 1999. In the first quarter of fiscal 2006, we recognized write-offs of$1.1 million.
In the ordinary course of doing business, we must make estimates and judgments that affect decisions on howwe operate and on the reported amounts of assets, liabilities, revenues and expenses. These estimates include, butare not limited to, those related to the recognition of income and expenses; impairment of assets; estimates of futureimprovement and amenity costs; capitalization of costs to inventory; provisions for litigation, insurance andwarranty costs; and income taxes. We base our estimates on historical experience and on various other assumptionsthat we believe to be reasonable under the circumstances. On an ongoing basis, we evaluate and adjust our estimatesbased on the information currently available. Actual results may differ from these estimates and assumptions orconditions.
Projecting revenues and earnings results remain very difficult in the current environment. The guidance wegave on February 22, 2007 stated that, based upon our evaluation of our backlog, our communities open and theexpected timing of new community openings in fiscal 2007, we believe that in fiscal 2007 we will deliver between6,000 and 7,000 homes with an average delivered price between $670,000 and $680,000; recognize between$180 million and $195 million of revenues using the percentage of completion method of accounting related toseveral high-rise residences that are under construction; earn net income between $240 million and $305 million;and achieve diluted earnings per share between $1.46 and $1.85 per share.
At January 31, 2007, we were selling from 320 communities compared to 300 communities at October 31,2006 and 258 communities at January 31, 2006. We expect to be selling from approximately 340 communities atOctober 31, 2007.
CRITICAL ACCOUNTING POLICIES
We believe the following critical accounting policies reflect the more significant judgments and estimates usedin the preparation of our consolidated financial statements.
Inventory
Inventory is stated at the lower of cost or fair value in accordance with Statement of Financial AccountingStandards (“SFAS”) No. 144, “Accounting for the Impairment or Disposal of Long-Lived Assets” (“SFAS 144”). Inaddition to direct land acquisition, land development and home construction costs, costs include interest, real estatetaxes and direct overhead related to development and construction, which are capitalized to inventories during theperiod beginning with the commencement of development and ending with the completion of construction.
Once a parcel of land has been approved for development, it generally takes four to five years to fully develop,sell and deliver all the homes in one of our typical communities. Longer or shorter time periods are possible
23
depending on the number of home sites in a community and the sales and delivery pace of the homes in acommunity. Our master planned communities, consisting of several smaller communities, may take up to 10 yearsor more to complete. Because our inventory is considered a long-lived asset under U.S. generally acceptedaccounting principles, we are required, under SFAS 144, to regularly review the carrying value of each of ourcommunities and write down the value of those communities for which we believe the values are not recoverable.When the profitability of a current community deteriorates, the sales pace declines significantly or some otherfactor indicates a possible impairment in the recoverability of the asset, the asset is reviewed for impairment bycomparing the estimated future undiscounted cash flow for the community to its carrying value. If such cash flow isless than the community’s carrying value, the carrying value is written down to its estimated fair value by chargingcost of revenues in the period the impairment is determined. Fair value is determined by the use of estimates madeby management including estimate of future revenues and costs.
In addition, we review all land held for future communities or future sections of current communities, whetherowned or under contract, to determine whether or not we expect to proceed with the development of the land asoriginally contemplated. Based upon this review, we decide (a) as to land that is under a purchase contract but notowned, whether the contract will likely be terminated or renegotiated, and (b) as to land we own, whether the landwill likely be developed as contemplated or in an alternative manner, or should be sold. We then further determinewhich costs that have been capitalized to the property are recoverable and which costs should be written off. Werecognized $96.9 million and $1.1 million of write-offs of costs related to current and future communities in thethree-month periods ended January 31, 2007 and 2006, respectively. The write-offs in fiscal 2007 were attributableto the write-down of the carrying cost of several operating communities and owned land, primarily located inFlorida, Minnesota and New Jersey and one condominium conversion project in Maryland, and the write-off of landdeposits and predevelopment costs of land optioned for future communities primarily in California and Florida.
We have a significant number of land purchase contracts, sometimes referred to herein as “options” or “optionagreements,” and several investments in unconsolidated entities which we evaluate in accordance with the FinancialAccounting Standards Board (“FASB”) Interpretation No. 46 “Consolidation of Variable Interest Entities, aninterpretation of ARB No. 51,” as amended by FIN 46R (“FIN 46”). Pursuant to FIN 46, an enterprise that absorbs amajority of the expected losses or receives a majority of the expected residual returns of a variable interest entity(“VIE”) is considered to be the primary beneficiary and must consolidate the operations of the VIE. A VIE is anentity with insufficient equity investment or in which the equity investors lack some of the characteristics of acontrolling financial interest. For land purchase contracts with sellers meeting the definition of a VIE, we perform areview to determine which party is the primary beneficiary of the VIE. This review requires substantive judgmentand estimation. These judgments and estimates involve assigning probabilities to various estimated cash flowpossibilities relative to the entity’s expected profits and losses and the cash flows associated with changes in the fairvalue of the land under contract. At January 31, 2007, we had determined that we were the primary beneficiary ofone VIE related to a land purchase contract and recorded $76.1 million as inventory, $68.6 million as a loan payableand $5.5 million as accrued liabilities .
Revenue and Cost Recognition
Traditional Home Sales
Because the construction time for one of our traditional homes is generally less than one year, revenues andcost of revenues from traditional home sales are recorded at the time each home is delivered and title and possessionare transferred to the buyer. Closing normally occurs shortly after construction is substantially completed. Inaddition, we have several high-rise/mid-rise projects which do not qualify for percentage of completion accountingin accordance SFAS No. 66, “Accounting for Sales of Real Estate” (“SFAS 66”), which we will include in thiscategory of revenues and costs commencing in the later portion of fiscal 2007 when units in these building begin tobe delivered to customers.
Land, land development and related costs, both incurred and estimated to be incurred in the future, areamortized to the cost of homes closed based upon the total number of homes to be constructed in each community.Any changes resulting from a change in the estimated number of homes to be constructed or in the estimated costssubsequent to the commencement of delivery of homes are allocated to the remaining undelivered homes in the
24

community. Home construction and related costs are charged to the cost of homes closed under the specificidentification method. The estimated land, common area development and related costs of master plannedcommunities, including the cost of golf courses, net of their estimated residual value, are allocated to individualcommunities within a master planned community on a relative sales value basis. Any changes resulting from achange in the estimated number of homes to be constructed or in the estimated costs are allocated to the remaininghome sites in each of the communities of the master planned community.
Percentage of Completion
We are developing several high-rise/mid-rise projects that may take substantially more than one year tocomplete. Under the provisions of SFAS 66, revenues and costs are recognized using the percentage of completionmethod of accounting when construction is beyond the preliminary stage, the buyer is committed to the extent ofbeing unable to require a refund except for non-delivery of the unit, sufficient units in the project have been sold toensure that the property will not be converted to rental property, the sales proceeds are collectible and the aggregatesales proceeds and the total cost of the project can be reasonably estimated. Revenues and costs of individualprojects are recognized on the individual project’s aggregate value of units for which the home buyers have signedbinding agreements of sale, less an allowance for cancellations, and are based on the percentage of total estimatedconstruction costs that have been incurred. Total estimated revenues and construction costs are reviewed period-ically, and any change is applied to current and future periods.
Land Sales
Land sales revenues and cost of revenues are recorded at the time that title and possession of the property havebeen transferred to the buyer. We recognize the pro rata share of revenues and cost of land sales revenues to entitiesin which we have a 50% or less interest based upon the ownership percentage attributable to the non-Companyinvestors. Any profit not recognized in a transaction reduces our investment in the entity.
OFF-BALANCE SHEET ARRANGEMENTS
We have investments in and advances to several joint ventures, to Toll Brothers Realty Trust Group (“Trust”)and Toll Brothers Realty Trust Group II (“Trust II”). At January 31, 2007, we had investments in and advances tothese entities of $251.0 million, were committed to invest or advance an additional $358.2 million in the aggregateto these entities if needed and had guaranteed approximately $154.0 million of these entities’ indebtedness and/orloan commitments. See Note 3 of the Notes to Condensed Consolidated Financial Statements, “Investments in andAdvances to Unconsolidated Entities” for more information regarding these entities. We do not believe that thesearrangements, individually or in the aggregate, have or are reasonably likely to have a current or future materialeffect on our financial condition, results of operations, liquidity or capital resources. Our investments in theseentities are accounted for using the equity method.
25
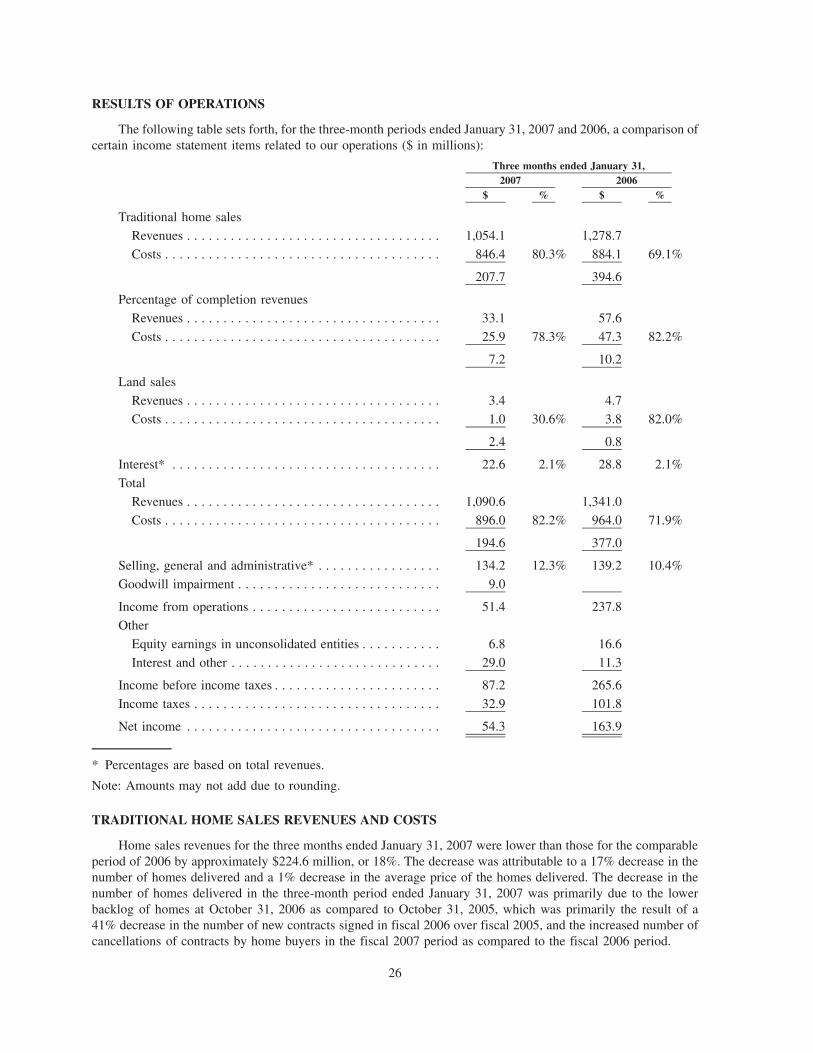
RESULTS OF OPERATIONS
The following table sets forth, for the three-month periods ended January 31, 2007 and 2006, a comparison ofcertain income statement items related to our operations ($ in millions):
$ % $ %2007 2006
Three months ended January 31,
Traditional home sales
Revenues . . . . . . . . . . . . . . . . . . . . . . . . . . . . . . . . . . . 1,054.1 1,278.7
Costs . . . . . . . . . . . . . . . . . . . . . . . . . . . . . . . . . . . . . . 846.4 80.3% 884.1 69.1%
207.7 394.6
Percentage of completion revenues
Revenues . . . . . . . . . . . . . . . . . . . . . . . . . . . . . . . . . . . 33.1 57.6
Costs . . . . . . . . . . . . . . . . . . . . . . . . . . . . . . . . . . . . . . 25.9 78.3% 47.3 82.2%
7.2 10.2
Land sales
Revenues . . . . . . . . . . . . . . . . . . . . . . . . . . . . . . . . . . . 3.4 4.7
Costs . . . . . . . . . . . . . . . . . . . . . . . . . . . . . . . . . . . . . . 1.0 30.6% 3.8 82.0%
2.4 0.8
Interest* . . . . . . . . . . . . . . . . . . . . . . . . . . . . . . . . . . . . . 22.6 2.1% 28.8 2.1%
Total
Revenues . . . . . . . . . . . . . . . . . . . . . . . . . . . . . . . . . . . 1,090.6 1,341.0
Costs . . . . . . . . . . . . . . . . . . . . . . . . . . . . . . . . . . . . . . 896.0 82.2% 964.0 71.9%
194.6 377.0
Selling, general and administrative* . . . . . . . . . . . . . . . . . 134.2 12.3% 139.2 10.4%
Goodwill impairment . . . . . . . . . . . . . . . . . . . . . . . . . . . . 9.0
Income from operations . . . . . . . . . . . . . . . . . . . . . . . . . . 51.4 237.8
Other
Equity earnings in unconsolidated entities . . . . . . . . . . . 6.8 16.6
Interest and other . . . . . . . . . . . . . . . . . . . . . . . . . . . . . 29.0 11.3
Income before income taxes . . . . . . . . . . . . . . . . . . . . . . . 87.2 265.6
Income taxes . . . . . . . . . . . . . . . . . . . . . . . . . . . . . . . . . . 32.9 101.8
Net income . . . . . . . . . . . . . . . . . . . . . . . . . . . . . . . . . . . 54.3 163.9
* Percentages are based on total revenues.
Note: Amounts may not add due to rounding.
TRADITIONAL HOME SALES REVENUES AND COSTS
Home sales revenues for the three months ended January 31, 2007 were lower than those for the comparableperiod of 2006 by approximately $224.6 million, or 18%. The decrease was attributable to a 17% decrease in thenumber of homes delivered and a 1% decrease in the average price of the homes delivered. The decrease in thenumber of homes delivered in the three-month period ended January 31, 2007 was primarily due to the lowerbacklog of homes at October 31, 2006 as compared to October 31, 2005, which was primarily the result of a41% decrease in the number of new contracts signed in fiscal 2006 over fiscal 2005, and the increased number ofcancellations of contracts by home buyers in the fiscal 2007 period as compared to the fiscal 2006 period.
26

The value of new sales contracts signed was $590.4 million (878 homes) in the three months ended January 31,2007, a 41% decrease compared to the value of contracts signed in the comparable period of fiscal 2006 of$1.01 billion (1,395 homes). This decrease is attributable to a 37% decrease in the number of new contracts signedand a 7% decrease in the average value of each contract. We believe the decrease in the number of new contractssigned is attributable to a decline in consumer confidence, an overall softening of demand for new homes and anoversupply of homes available for sale. We attribute the reduction in demand to concerns on the part of prospectivehome buyers about the direction of home prices, due in part to many homebuilders’ advertising price reductions andincreased sales incentives, and concerns by the prospective home buyer about being able to sell their existinghomes. In addition, speculators and investors are no longer helping to fuel demand. We try to avoid selling homes tospeculators, and we generally do not build detached homes without having a signed agreement of sale. Nonetheless,we have been impacted by an overall increase in the supply of homes available for sale in many markets asspeculators attempt to sell the homes they previously purchased or cancel contracts for homes under construction,and as builders, who, as part of their business strategy, were building homes in anticipation of capturing additionalsales in a demand-driven market attempt to reduce their inventories by lowering prices and adding incentives. Inaddition, based on the high cancellation rates reported by us and by other builders, non-speculative buyercancellations are also adding to the supply of homes in the marketplace. The decline in the average sales pricewas due to higher sales incentives given to homebuyers in the fiscal 2007 period as compared to the comparableperiod of fiscal 2006 and a shift in the number of contracts signed to less expensive areas in the fiscal 2007 period ascompared to the comparable period of fiscal 2006.
At January 31, 2007, our backlog of traditional homes under contract was $3.58 billion (5,120 homes),36% lower than the $5.57 billion (8,106 homes) backlog at January 31, 2006. The decrease in backlog at January 31,2007 compared to the backlog at January 31, 2006 is primarily attributable to a lower backlog at October 31, 2006 ascompared to the backlog at October 31, 2005, and the decrease in the value and number of new contracts signed inthe fiscal 2007 period as compared to the fiscal 2006 period, offset in part by lower deliveries in the fiscal 2007period as compared to the fiscal 2006 period. The guidance we gave on February 22, 2007 stated that, based on thesize of our current backlog and the expected demand for our product, we believe that we will deliver between 6,000and 7,000 homes (including 100 to 150 units in several of our non-traditional high- and mid-rise projects accountedfor under the completed contract method of accounting) in fiscal 2007 and that the average delivered price of thosehomes will be between $670,000 and $680,000.
Home costs as a percentage of home sales revenue were 80.3% in the three-month period ended January 31,2007 as compared to 69.1% in the comparable period of fiscal 2006. The increase in the percentage in the fiscal2007 period was the result of the higher amount of inventory write-offs/write-downs recognized, higher salesincentives on the homes delivered, higher overhead costs per home due to the decreased construction activity andhigher external broker sales commissions on the homes delivered. In the three-month periods ended January 31,2007 and 2006, we recognized inventory write-downs and the expensing of costs that we believed not to berecoverable of $96.9 million and $1.1 million, respectively. The guidance we gave on February 22, 2007 stated that,for the full 2007 fiscal year, we expect that home costs (including inventory write-offs/write-downs of the$96.9 million consisting of write-offs recognized in the first quarter of fiscal 2007 and an additional $60 million ofwrite-offs for the remainder of fiscal 2007), as a percentage of home sales revenues will be between 77.90% and78.55% as compared to 71.7% in fiscal 2006.
PERCENTAGE OF COMPLETION REVENUES AND COSTS
We are developing several projects for which we are recognizing revenues and costs using the percentage ofcompletion method of accounting. Revenues and costs of individual projects are recognized on the individualproject’s aggregate value of units for which home buyers have signed binding agreements of sale and are based onthe percentage of total estimated construction costs that have been incurred. Total estimated revenues andconstruction costs are reviewed periodically and any change is applied to current and future periods. We beganrecognizing revenue and costs using percentage of completion accounting on several projects in fiscal 2006. In thethree-month periods ended January 31, 2007 and 2006, we recognized $33.1 million and $57.6 million of revenues,respectively, and $25.9 million and $47.3 million of costs, respectively, on these projects. At January 31, 2007, ourbacklog of homes in communities that we account for using the percentage of completion method of accounting was
27

$138.7 million (net of $166.9 million of revenue recognized) compared to $226.7 million at January 31, 2006 (net of$57.6 million of revenue recognized). The decline in the backlog at January 31, 2007 is primarily the result of therecognition of revenues offset in part by the new contracts signed. We expect that this decline will continue as werecognize revenues, and sell out of existing projects without replacing them with new projects that qualify under theaccounting rules for the application of the percentage of completion accounting method. See “New AccountingPronouncements” in Note 1 of our “Condensed Consolidated Financial Statements” for further information.
The guidance we gave on February 22, 2007 stated that for fiscal 2007, we believe that revenues recognizedunder the percentage of completion accounting method will be between $180 million and $195 million and costsbefore interest expense will be approximately 75% of revenues.
LAND SALES REVENUES AND COSTS
We are developing several communities in which we expect to sell a portion of the land to other builders orentities. The amount and profitability of land sales will vary from year to year depending upon the sale and deliveryof the specific land parcels. In the three-month periods ended January 31, 2007 and 2006, land sales were$3.4 million and $4.7 million, respectively. Cost of land sales was approximately 30.6% and 82.0% of land salesrevenues in the three-month periods ended January 31, 2007 and 2006, respectively. The guidance we gave onFebruary 22, 2007 stated that for the full fiscal 2007 year, land sales revenues are expected to be approximately$7.0 million, and cost of land sales is expected to be approximately 60% of revenues.
INTEREST EXPENSE
In our traditional homebuilding operations, we determine interest expense on a specific lot-by-lot basis and forland sales, on a parcel-by-parcel basis. As a percentage of total revenues, interest expense varies depending on manyfactors, including the period of time that we owned the land, the length of time that the homes delivered during theperiod were under construction, and the interest rates and the amount of debt carried by us in proportion to theamount of our inventory during those periods.
For projects using the percentage of completion method of revenue recognition, interest expense is determinedbased on the total estimated interest for the project and the percentage of total estimated construction costs that havebeen incurred to date. Any change in the estimated interest expense for the project is applied to current and futureperiods.
Interest expense as a percentage of revenues was slightly lower in the three-month period ended January 31,2007 as compared to the comparable period of fiscal 2006. The guidance we gave on February 22, 2007 stated thatfor the full 2007 fiscal year, we expect interest expense as a percentage of total revenues to be approximately 2.1%as compared to 2.0% in fiscal 2006.
SELLING, GENERAL AND ADMINISTRATIVE EXPENSES (“SG&A”)
SG&A spending decreased by $5.0 million, or 3.6%, in the three-month period ended January 31, 2007 ascompared to the comparable period of fiscal 2006. The reduction in spending was due to cost reductions, offset inpart by the expenses resulting from the increased number of communities from which we are operating. AtJanuary 31, 2007, we had 320 selling communities, a 24% increase over the 258 selling communities we had atJanuary 31, 2006.
The guidance we gave on February 22, 2007 stated that for the full 2007 fiscal year, we expect that SG&A as apercentage of revenues will be between 11.3% and 11.7% of revenues as compared to 9.4% for the full 2006 fiscalyear.
GOODWILL IMPAIRMENT
During the three-month period ended January 31, 2007, due to the continued decline of the Detroit market, were-evaluated the carrying value of goodwill associated with a 1999 acquisition. We estimated the fair value of ourassets in this market, including goodwill. Fair value was determined based on the discounted future cash flowexpected to be generated in this market. Based upon this evaluation and our expectation that this market will not
28

recover for a number of years, we have determined that the related goodwill has been impaired. We recognized a$9.0 million impairment charge in the three-month period ended January 31, 2007. After recognizing this charge,we do not have any goodwill remaining from this acquisition.
EQUITY EARNINGS IN UNCONSOLIDATED ENTITIES
We are a participant in several joint ventures and in the Trust and Trust II. We recognize our proportionateshare of the earnings from these entities. Many of our joint ventures are land development projects or high-rise/mid-rise construction projects and do not generate revenues and earnings for a number of years during the developmentof the property. Once development is complete, the joint ventures will generally, over a relatively short period oftime, generate revenues and earnings until all the assets of the entities are sold. Because there is not a steady flow ofrevenues and earnings from these entities, the earnings recognized from these entities will vary significantly fromquarter to quarter and year to year. In the three months ended January 31, 2007, we recognized $6.8 million ofearnings from unconsolidated entities as compared to $16.6 million in the comparable period of fiscal 2006. Theguidance we gave on February 22, 2007 stated that for fiscal 2007, we expect to recognize approximately$22.8 million of earnings from our investments in these joint ventures and in the Trust and Trust II compared to$48.4 million in fiscal 2006.
INTEREST AND OTHER INCOME
For the three months ended January 31, 2007, interest and other income was $29.0 million, an increase of$17.6 million from the $11.3 million recognized in the comparable period of fiscal 2006. This increase wasprimarily the result of a $9.5 million gain realized from the sale of our cable TV and broadband internet business,higher retained customer deposits on cancelled contracts and higher interest income. The guidance we gave onFebruary 22, 2007 stated that for the full 2007 fiscal year, we expect interest and other income to be approximately$49.0 million compared to $52.7 million in fiscal 2006.
INCOME BEFORE INCOME TAXES
For the three-month period ended January 31, 2007, income before taxes was $87.2 million, a decrease of 67%from the $265.6 million earned in the comparable period of fiscal 2006.
INCOME TAXES
Income taxes were provided at an effective rate of 37.7% and 38.3% for the three-month periods endedJanuary 31, 2007 and 2006, respectively. The decrease in the effective tax rate in the three-month period of fiscal2007 as compared to the comparable period of fiscal 2006 was due primarily to higher tax-free interest income in thefiscal 2007 period as a percentage of total income, offset in part by the recognition of higher interest expense (net ofinterest income) on estimated income tax assessments. The guidance we gave on February 22, 2007 stated that forthe full fiscal 2007 year, we expect that our effective tax rate will be approximately 38.8% as compared to 39.0% infiscal 2006.
CAPITAL RESOURCES AND LIQUIDITY
Funding for our business has been provided principally by cash flow from operating activities, unsecured bankborrowings and the public debt and equity markets. We have used our cash flow from operating activities, bankborrowings and the proceeds of public debt and equity offerings to acquire additional land for new communities,fund additional expenditures for land development, fund construction costs needed to meet the requirements of ourbacklog and the increasing number of communities in which we are offering homes for sale, invest in uncon-solidated entities, repurchase our stock, and repay debt.
We were a net user of cash in our operating activities in the first quarter of fiscal 2007 and fiscal 2006 dueprimarily to spending for land and construction in progress. We expect that we will continue to be a net user of cashin our operating activities during the remainder of fiscal 2007. We expect that our inventory of lots will continue toincrease, as we purchase land that we currently have under contract or place under contract in the future. We arecurrently negotiating and searching for additional opportunities to obtain control of land for future communities. At
29

January 31, 2007, the aggregate purchase price of land parcels under option and purchase agreements wasapproximately $2.68 billion (including $1.22 billion of land to be acquired from joint ventures which we haveinvested in, made advances to or made loan guarantees on behalf of, in the amount of $162.7 million), of which wehad paid or deposited approximately $161.3 million.
In general, cash flow from operating activities assumes that, as each home is delivered, we will purchase ahome site to replace it. Because we own several years’ supply of home sites, we do not need to buy home sitesimmediately to replace the ones delivered. In addition, we generally do not begin construction of our traditionalsingle-family detached homes until we have a signed contract with the home buyer, although in fiscal 2006 andduring the three months ended January 31, 2007, due to an extremely high cancellation rate of customer contractsand the increase in the number of attached-home communities that we were operating from, the number ofspeculative homes in our inventory increased significantly. In the three-month period ended January 31, 2007, thevalue of new contracts signed decreased 34% as compared to the comparable period of fiscal 2006. In addition, infiscal 2006, the value of new contracts signed with home buyers decreased by 41% from fiscal 2005. Should ourbusiness continue to decline significantly, we believe that our inventory levels would decrease, as we complete anddeliver the homes under construction but do not commence construction of as many new homes and sell and deliverthe speculative homes that are currently in inventory, resulting in a temporary increase in our cash flow fromoperations. In addition, we might continue to delay or curtail our acquisition of additional land, as we did in the firstquarter of fiscal 2007 and the second half of fiscal 2006, which would further reduce our inventory levels and cashneeds. We decreased our home sites owned and controlled at January 31, 2007 by approximately 9% fromOctober 31, 2006 and by approximately 26% from April 30, 2006, the high point of lots owned and controlled, inresponse to the deterioration of the housing market.
During the past several years, we have had a significant amount of cash invested in either short-term cashequivalents or short-term interest-bearing marketable securities. In addition, we have made a number of investmentsin unconsolidated entities related to the acquisition and development of land for future home sites or in entities thatare constructing or converting apartment buildings into luxury condominiums. Our investment activities related tomarketable securities and investments in and distributions of investments from unconsolidated entities arecontained in the Condensed Consolidated Statements of Cash Flows in the section “Cash flow from investingactivities.”
We have a $1.8 billion credit facility consisting of a $1.5 billion unsecured revolving credit facility and a$300 million term loan facility (collectively, the “Credit Facility”) with 33 banks, which extends to March 2011. AtJanuary 31, 2007, interest was payable on borrowings under the revolving credit facility at 0.475% (subject toadjustment based upon our corporate debt rating and leverage ratios) above the Eurodollar rate or at other specifiedvariable rates as selected by us from time to time. At January 31, 2007, we had no outstanding borrowings againstthe revolving credit facility but had letters of credit of approximately $398.5 million outstanding under it. Under theterm loan facility, interest is payable at 0.50% (subject to adjustment based upon our corporate debt rating andleverage ratios) above the Eurodollar rate or at other specified variable rates as selected by us from time to time. AtJanuary 31, 2007, interest was payable on the $300 million term loan at 5.87%. Prior to expanding our CreditFacility to encompass a term loan that provides outstanding borrowings under our Credit Facility, we hadperiodically maintained a loan balance outstanding on our revolving credit facility; such borrowing was entirelyelective by us and was not required by the terms of our revolving credit facility.
We believe that we will be able to continue to fund our operations and meet our contractual obligations througha combination of existing cash resources and our existing sources of credit and the public debt markets.
INFLATION
The long-term impact of inflation on us is manifested in increased costs for land, land development,construction and overhead, as well as in increased sales prices of our homes. We generally contract for landsignificantly before development and sales efforts begin. Accordingly, to the extent land acquisition costs are fixed,increases or decreases in the sales prices of homes will affect our profits. Because the sales price of each of ourhomes is fixed at the time a buyer enters into a contract to acquire a home, and because we generally contract to sellour homes before we begin construction, any inflation of costs in excess of those anticipated may result in lower
30

gross margins. We generally attempt to minimize that effect by entering into fixed-price contracts with oursubcontractors and material suppliers for specified periods of time, which generally do not exceed one year.
In general, housing demand is adversely affected by increases in interest rates and housing costs. Interest rates,the length of time that land remains in inventory and the proportion of inventory that is financed affect our interestcosts. If we are unable to raise sales prices enough to compensate for higher costs, or if mortgage interest ratesincrease significantly, affecting prospective buyers’ ability to adequately finance home purchases, our revenues,gross margins and net income would be adversely affected. Increases in sales prices, whether the result of inflationor demand, may affect the ability of prospective buyers to afford new homes.
GEOGRAPHIC SEGMENTS
We operate in four geographic segments around the United States: the North, consisting of Connecticut,Illinois, Massachusetts, Michigan, Minnesota, New Jersey, New York, Ohio and Rhode Island; the Mid-Atlantic,consisting of Delaware, Maryland, Pennsylvania, Virginia and West Virginia; the South, consisting of Florida,North Carolina, South Carolina and Texas; and the West, consisting of Arizona, California, Colorado and Nevada.We stopped selling homes in Ohio in fiscal 2005 and delivered our last home in this state in fiscal 2006. Theoperations in Ohio were immaterial to the North segment.
The following table summarizes by geographic segments total revenues and income before income taxes foreach of the three months ended January 31, 2007 and 2006:
2007 2006 2007 2006 2007 2006Revenues Income Before Income Taxes
Units Units (In millions) (In millions) (In millions) (In millions)
North(a) . . . . . . . . . . . . . . . . . . . . . . 287 417 $ 211.1 $ 311.5 $ 0.8 $ 71.9
Mid-Atlantic(b) . . . . . . . . . . . . . . . . . 512 589 331.4 393.8 51.6 118.0
South(c) . . . . . . . . . . . . . . . . . . . . . . 403 470 247.8 275.9 4.0 34.5
West . . . . . . . . . . . . . . . . . . . . . . . . . 357 403 300.3 359.8 56.9 84.3Corporate and other. . . . . . . . . . . . . . (26.1) (43.1)
Total . . . . . . . . . . . . . . . . . . . . . . . 1,559 1,879 $1,090.6 $1,341.0 $ 87.2 $265.6
(a) Includes percentage of completion revenues of $19.5 million and $39.7 million in the three months endedJanuary 31, 2007 and 2006, respectively, and land revenues of $0.2 million in the three months endedJanuary 31, 2007 and 2006, respectively.
(b) Includes land revenues of $2.3 million and $0.2 million in three months ended January 31, 2007 and 2006,respectively.
(c) Includes percentage of completion revenues of $13.6 million and $17.9 million in the three months endedJanuary 31, 2007 and 2006, respectively, and land revenues of $1.1 million and $4.3 million in the three monthsended January 31, 2007 and 2006, respectively.
North
Revenues for the three months ended January 31, 2007 were lower than those for the comparable period of2006 by approximately $100.4 million, or 32%. The decrease in revenues was attributable to a 31% decrease in thenumber of homes delivered, and a decrease in percentage of completion revenues of approximately $20.2 million,partially offset by a 2% increase in the average price of the homes delivered. The decrease in the number of homesdelivered in the three-month period ended January 31, 2007 was primarily due to the lower backlog of homes atOctober 31, 2006 as compared to October 31, 2005, which was primarily the result of a 27% decrease in the numberof new contracts signed in fiscal 2006 over fiscal 2005 and the increased cancellation rate by home buyers in the firstquarter of fiscal 2007.
31
The value of net new contracts signed in the three months ended January 31, 2007 was approximately$291.5 million, a 1% decline from the $293.8 million of net new contracts signed in the three months endedJanuary 31, 2006. This decrease was attributable to an 8% decrease in the number of net new contracts signed, offsetby an 8% increase in the average value of each contract. The decline in new contracts signed in the three-monthperiod ended January 31, 2007 was primarily due to a slowdown in the housing market, which began in the fourthquarter of fiscal 2005 and continued throughout fiscal 2006 and into the second quarter of 2007. The increase in theaverage sales price was due to a shift in the number of contracts signed to areas with higher home prices in the fiscal2007 period as compared to the comparable period of fiscal 2006, partially offset by higher sales incentives given tohome buyers in the fiscal 2007 period as compared to the comparable period of fiscal 2006.
Income before income taxes for the three months ended January 31, 2007 was $0.8 million, a decrease of$71.1 million from the $71.9 million reported for the three months ended January 31, 2006. This decrease was dueto the lower profits realized on the decreased revenues in the three-month period ended January 31, 2007 ascompared to the three-month period ended January 31, 2006, decreased income realized from unconsolidatedentities in the first quarter 2007 as compared to the first quarter 2006, higher costs of revenues in the fiscal 2007period as compared to the fiscal 2006 period (principally related to a $33.1 million inventory write-down) and therecognition of a $9.0 million charge for goodwill impairment related to a 1999 acquisition in the Detroit market.
Mid-Atlantic
Revenues for the three months ended January 31, 2007 were lower than those for the comparable period of2006 by approximately $62.4 million, or 16%. The decrease in revenues was attributable to a 13% decrease in thenumber of homes delivered (primarily in Virginia) and a 3% decrease in the average sales price of the homesdelivered. The decrease in the number of homes delivered in the three-month period ended January 31, 2007 wasprimarily due to an increase in the number of cancellations in the first quarter of 2007 as compared to the firstquarter of fiscal 2006 and a lower backlog of homes at October 31, 2006 as compared to October 31, 2005. Thedecrease in the backlog of homes was primarily the result of a 43% decrease in the number of new contracts signedin fiscal 2006 over fiscal 2005, due primarily to weak demand, and a significantly higher number of contractcancellations in fiscal 2006 than in fiscal 2005.
The value of net new contracts signed in the three-month period ended January 31, 2007 was approximately$207.2 million, a 35% decline from the $318.8 million of net new contracts signed in the three-month period endedJanuary 31, 2006. This decrease is attributable to a 30% decrease in the number of net new contracts signed and a7% decrease in the average value of each contract. The decline in the number of net new contracts was due primarilyto weak demand and higher than normal contract cancellations in the three-month period ended January 31, 2007.The decline in the average sales price was due to higher sales incentives given to home buyers in the fiscal 2007period as compared to the comparable period of fiscal 2006 and a shift in the number of contracts signed to areaswith lower home prices in the fiscal 2007 period as compared to the comparable period of fiscal 2006.
Income before income taxes for the three months ended January 31, 2007 was $51.6 million, a decrease of$66.4 million from the $118.0 million reported for the three months ended January 31, 2006. This decrease wasattributable to lower revenues and higher cost of revenues in the three-month period ended January 31, 2007 ascompared to the same period in 2006. The higher cost of revenues in the fiscal 2007 period is primarily due to a$22.9 million inventory write-down in fiscal 2007 and higher sales incentives given on the homes delivered in thethree months ended January 31, 2007 as compared to those delivered in the three months ended January 31, 2006.
South
Revenues for the three months ended January 31, 2007 were lower than those for the comparable period of2006 by approximately $28.1 million, or 10%. The decrease in revenues was attributable to a 14% decrease in thenumber of traditional homes delivered, partially offset by a 6% increase in the average sales price of homesdelivered. The decrease in the number of homes delivered was primarily attributable to our operations in Florida,where we had a lower number of homes in backlog at October 31, 2006 as compared to October 31, 2005 and theincreased cancellation rate by home buyers in the first quarter of fiscal 2007.
32

The value of net new contracts signed in the three month period ended January 31, 2007 was approximately$120.6 million, a 42% decline from the $208.2 million of net new contracts signed in the three-month period endedJanuary 31, 2006. This decline was due to a 36% decrease in the number of net new contracts signed and a 10%decrease in the average value of each contract. The decrease in the number of net new signed contracts wasprimarily the result of weak market conditions in Florida, despite an increase in the number of selling communitiesin Florida in the first quarter of 2007 as compared to the first quarter of 2006, and a significantly higher number ofcontract cancellations in the three months ended January 31, 2007 than in the comparable period in 2006. Thedecrease in the average sales price was due to higher sales incentives given to home buyers in the fiscal 2007 periodas compared to the comparable period of fiscal 2006 and a shift in the number of contracts to areas with lower homeprices in the fiscal 2007 period as compared to the comparable period of fiscal 2006.
Income before income taxes for the three months ended January 31, 2007 was $4.0 million, a decrease of$30.5 million from the $34.5 million reported for the three months ended January 31, 2006. This decrease was dueto decreased revenues in the three-month period ended January 31, 2007 as compared to the three-month periodended January 31, 2006, and higher cost of revenues as a percentage of total revenues, partially offset by higherretained customer deposits on contract cancellations for the three months ended January 31, 2007 as compared tothe three months ended January 31, 2006. The higher cost of revenues is principally due to inventory write-downs.We recognized inventory write-downs of $30.0 million in the three months ended January 31, 2007 as compared to$0.4 million in the comparable period of fiscal 2006.
West
Revenues for the three months ended January 31, 2007 were lower than those for the comparable period of2006 by approximately $59.5 million, or 17%. The decrease in revenues was attributable to an 11% and 6%decrease in the number of homes delivered and average sales price, respectively. The decrease in the number ofhomes delivered was primarily attributable to our operations in California where we had a lower number of homesin backlog at October 31, 2006 as compared to October 31, 2005, and a significantly higher number of contractcancellations in the three months ended January 31, 2007 than in the same period in 2006.
The value of net new contracts signed in the three months ended January 31, 2007, approximately $129.3 million,decreased 59% from the first quarter 2006 net new contracts signed of approximately $319.1 million. The decline wasdue primarily to weak demand and higher than normal contract cancellations in the three months ended January 31, 2007.
Income before income taxes for the three months ended January 31, 2007 was $56.9 million, a decrease of$27.4 million from the $84.3 million reported for the three months ended January 31, 2006. This decrease was dueto the decrease in revenues in the three-months ended January 31, 2007 and the higher cost of revenues as apercentage of total revenues (principally related to the $10.9 million inventory write-downs), partially offset byhigher retained customer deposits on contract cancellations for the three months ended January 31, 2007 ascompared to the three months ended January 31, 2006.
Corporate and other
Loss before income taxes for the three months ended January 31, 2007 was $26.1 million, a decrease of$17.0 million from the $43.1 million loss before income taxes reported for the three months ended January 31, 2006.This decrease was primarily the result of a $9.5 million gain realized from the sale of our cable TV and broadbandinternet business, lower selling, general and administrative costs and higher interest income.
33

HOUSING DATA
Revenues for the three-month period ended January 31,2007 2006 2007 2006Units Units (In millions) (In millions)
Traditional product:North . . . . . . . . . . . . . . . . . . . . . . . . . . . . . . . . . . . . . . . . . . . 287 417 $ 191.6 $ 271.6Mid-Atlantic . . . . . . . . . . . . . . . . . . . . . . . . . . . . . . . . . . . . . . 512 589 329.1 393.6South . . . . . . . . . . . . . . . . . . . . . . . . . . . . . . . . . . . . . . . . . . . 403 470 233.1 253.7West . . . . . . . . . . . . . . . . . . . . . . . . . . . . . . . . . . . . . . . . . . . . 357 403 300.3 359.8
Total . . . . . . . . . . . . . . . . . . . . . . . . . . . . . . . . . . . . . . . . . . 1,559 1,879 $1,054.1 $1,278.7
Percentage of completion:North . . . . . . . . . . . . . . . . . . . . . . . . . . . . . . . . . . . . . . . . . . . $ 19.5 $ 39.7South . . . . . . . . . . . . . . . . . . . . . . . . . . . . . . . . . . . . . . . . . . . 13.6 17.9
Total . . . . . . . . . . . . . . . . . . . . . . . . . . . . . . . . . . . . . . . . . . $ 33.1 $ 57.6
Total:North . . . . . . . . . . . . . . . . . . . . . . . . . . . . . . . . . . . . . . . . . . . 287 417 $ 211.1 $ 311.3Mid-Atlantic . . . . . . . . . . . . . . . . . . . . . . . . . . . . . . . . . . . . . . 512 589 329.1 393.6South . . . . . . . . . . . . . . . . . . . . . . . . . . . . . . . . . . . . . . . . . . . 403 470 246.6 271.6West . . . . . . . . . . . . . . . . . . . . . . . . . . . . . . . . . . . . . . . . . . . . 357 403 300.3 359.8
Total consolidated . . . . . . . . . . . . . . . . . . . . . . . . . . . . . . . . 1,559 1,879 1,087.1 1,336.3Unconsolidated entities . . . . . . . . . . . . . . . . . . . . . . . . . . . . . . 27 99 20.6 52.1
1,586 1,978 $1,107.7 $1,388.4
Contracts for the three-month period ended January 31,2007 2006 2007 2006Units Units (In millions) (In millions)
Traditional product:North . . . . . . . . . . . . . . . . . . . . . . . . . . . . . . . . . . . . . . . . . . . 217 265 $136.3 $ 177.4Mid-Atlantic . . . . . . . . . . . . . . . . . . . . . . . . . . . . . . . . . . . . . . 328 456 206.8 313.5South . . . . . . . . . . . . . . . . . . . . . . . . . . . . . . . . . . . . . . . . . . . 212 331 118.4 203.5West . . . . . . . . . . . . . . . . . . . . . . . . . . . . . . . . . . . . . . . . . . . . 121 343 128.9 315.1
Total . . . . . . . . . . . . . . . . . . . . . . . . . . . . . . . . . . . . . . . . . . 878 1,395 $590.4 $1,009.5
Non-traditional — High- and mid-rise:North . . . . . . . . . . . . . . . . . . . . . . . . . . . . . . . . . . . . . . . . . . . 123 111 $140.0 $ 102.0Mid-Atlantic . . . . . . . . . . . . . . . . . . . . . . . . . . . . . . . . . . . . . . 1 13 0.4 5.3West . . . . . . . . . . . . . . . . . . . . . . . . . . . . . . . . . . . . . . . . . . . . 1 5 0.4 4.0
Total . . . . . . . . . . . . . . . . . . . . . . . . . . . . . . . . . . . . . . . . . . 125 129 $140.8 $ 111.3
Percentage of completion:North . . . . . . . . . . . . . . . . . . . . . . . . . . . . . . . . . . . . . . . . . . . 24 20 $ 15.3 $ 14.4South . . . . . . . . . . . . . . . . . . . . . . . . . . . . . . . . . . . . . . . . . . . 2.2 4.7
Total . . . . . . . . . . . . . . . . . . . . . . . . . . . . . . . . . . . . . . . . . . 24 20 $ 17.5 $ 19.1
Total:North . . . . . . . . . . . . . . . . . . . . . . . . . . . . . . . . . . . . . . . . . . . 364 396 $291.6 $ 293.8Mid-Atlantic . . . . . . . . . . . . . . . . . . . . . . . . . . . . . . . . . . . . . . 329 469 207.2 318.8South . . . . . . . . . . . . . . . . . . . . . . . . . . . . . . . . . . . . . . . . . . . 212 331 120.6 208.2West . . . . . . . . . . . . . . . . . . . . . . . . . . . . . . . . . . . . . . . . . . . . 122 348 129.3 319.1
Total consolidated . . . . . . . . . . . . . . . . . . . . . . . . . . . . . . . . 1,027 1,544 748.7 1,139.9Unconsolidated entities . . . . . . . . . . . . . . . . . . . . . . . . . . . . . . 45 28 29.2 16.8
1,072 1,572 $777.9 $1,156.7
34

Backlog at January 31,2007 2006 2007 2006Units Units (In millions) (In millions)
Traditional product:North . . . . . . . . . . . . . . . . . . . . . . . . . . . . . . . . . . . . . . . . . . . 1,114 1,643 $ 737.4 $1,126.6
Mid-Atlantic . . . . . . . . . . . . . . . . . . . . . . . . . . . . . . . . . . . . . . 1,363 2,197 918.9 1,486.4
South . . . . . . . . . . . . . . . . . . . . . . . . . . . . . . . . . . . . . . . . . . . 1,400 2,179 781.7 1,186.7
West . . . . . . . . . . . . . . . . . . . . . . . . . . . . . . . . . . . . . . . . . . . . 1,243 2,087 1,146.7 1,774.8
Total . . . . . . . . . . . . . . . . . . . . . . . . . . . . . . . . . . . . . . . . . . 5,120 8,106 $3,584.7 $5,574.5
Non-traditional — High- and mid-rise:North . . . . . . . . . . . . . . . . . . . . . . . . . . . . . . . . . . . . . . . . . . . 379 127 $ 383.9 $ 117.6
Mid-Atlantic . . . . . . . . . . . . . . . . . . . . . . . . . . . . . . . . . . . . . . 59 43 24.0 18.3
West . . . . . . . . . . . . . . . . . . . . . . . . . . . . . . . . . . . . . . . . . . . . 27 12 18.6 9.5
Total . . . . . . . . . . . . . . . . . . . . . . . . . . . . . . . . . . . . . . . . . . 465 182 $ 426.5 $ 145.4
Percentage of completion:North . . . . . . . . . . . . . . . . . . . . . . . . . . . . . . . . . . . . . . . . . . . 288 275 $ 189.4 $ 181.6
South . . . . . . . . . . . . . . . . . . . . . . . . . . . . . . . . . . . . . . . . . . . 76 72 116.2 102.7
Less revenue recognized on units remaining in backlog . . . . . . (166.9) (57.6)
Total . . . . . . . . . . . . . . . . . . . . . . . . . . . . . . . . . . . . . . . . . . 364 347 $ 138.7 $ 226.7
Total:North . . . . . . . . . . . . . . . . . . . . . . . . . . . . . . . . . . . . . . . . . . . 1,781 2,045 $1,310.7 $1,425.8
Mid-Atlantic . . . . . . . . . . . . . . . . . . . . . . . . . . . . . . . . . . . . . . 1,422 2,240 942.9 1,504.7
South . . . . . . . . . . . . . . . . . . . . . . . . . . . . . . . . . . . . . . . . . . . 1,476 2,251 897.9 1,289.4
West . . . . . . . . . . . . . . . . . . . . . . . . . . . . . . . . . . . . . . . . . . . . 1,270 2,099 1,165.3 1,784.3
Less revenue recognized on units remaining in backlog . . . . . . (166.9) (57.6)
Total consolidated . . . . . . . . . . . . . . . . . . . . . . . . . . . . . . . . 5,949 8,635 4,149.9 5,946.6
Unconsolidated entities . . . . . . . . . . . . . . . . . . . . . . . . . . . . . . 43 32 26.7 20.8
5,992 8,667 $4,176.6 $5,967.4
35

ITEM 3. QUANTITATIVE AND QUALITATIVE DISCLOSURES ABOUT MARKET RISK
We are exposed to market risk primarily due to fluctuations in interest rates. We utilize both fixed-rate andvariable-rate debt. For fixed-rate debt, changes in interest rates generally affect the fair market value of the debtinstrument, but not our earnings or cash flow. Conversely, for variable-rate debt, changes in interest rates generallydo not impact the fair market value of the debt instrument, but do affect our earnings and cash flow. We do not havethe obligation to prepay fixed-rate debt prior to maturity, and, as a result, interest rate risk and changes in fair marketvalue should not have a significant impact on our fixed-rate debt until we are required or elect to refinance it.
The table below sets forth, at January 31, 2007, our debt obligations, principal cash flows by scheduledmaturity, weighted-average interest rates and estimated fair value (amounts in thousands):
Fiscal Year of Maturity AmountWeighted-Average
Interest Rate AmountWeighted-Average
Interest Rate
Fixed-Rate Debt Variable-Rate Debt (a)(b)
2007 . . . . . . . . . . . . . . . . . . . . . . . . $ 126,964 7.58% $ 65,887 6.43%
2008 . . . . . . . . . . . . . . . . . . . . . . . . 45,417 5.84% 150 3.66%
2009 . . . . . . . . . . . . . . . . . . . . . . . . 3,842 6.28% 150 3.66%
2010 . . . . . . . . . . . . . . . . . . . . . . . . 1,985 7.61% 148,129 6.09%
2011 . . . . . . . . . . . . . . . . . . . . . . . . 270,335 7.75% 300,150 5.87%
Thereafter . . . . . . . . . . . . . . . . . . . . 1,300,902 6.01% 12,846 3.66%
Discount . . . . . . . . . . . . . . . . . . . . . (8,548)
Total . . . . . . . . . . . . . . . . . . . . . . . . $1,740,897 6.73% $527,312 5.95%
Fair value at January 31, 2007 . . . . . $1,726,518 $527,312
(a) We have a $1.8 billion credit facility consisting of a $1.5 billion unsecured revolving credit facility and a$300 million term loan facility (collectively, the “Credit Facility”) with 33 banks, which extends to March 17,2011. At January 31, 2007, interest was payable on borrowings under the revolving credit facility at 0.475%(subject to adjustment based upon our corporate debt rating and leverage ratios) above the Eurodollar rate or atother specified variable rates as selected by us from time to time. At January 31, 2007, we had no outstandingborrowings against the revolving credit facility, but had letters of credit of approximately $398.5 millionoutstanding under it. Under the term loan facility, interest is payable at 0.50% (subject to adjustment based uponour corporate debt rating and leverage ratios) above the Eurodollar rate or at other specified variable rates asselected by us from time to time. At January 31, 2007, interest was payable on the $300 million term loan at5.87%.
(b) Our mortgage subsidiary has a $125 million line of credit with four banks to fund mortgage originations. Theline is due within 90 days of demand by the banks and bears interest at the banks’ overnight rate plus anagreed-upon margin. At January 31, 2007, the subsidiary had $65.9 million outstanding under the line at anaverage interest rate of 6.43%. Borrowings under this line are included in the fiscal 2007 maturities.
Based upon the amount of variable-rate debt outstanding at January 31, 2007, and holding the variable-ratedebt balance constant, each 1% increase in interest rates would increase the interest incurred by us by approximately$5.3 million per year.
ITEM 4. CONTROLS AND PROCEDURES
A control system, no matter how well conceived and operated, can provide only reasonable, not absolute,assurance that the objectives of the control system are met. Further, the design of a control system must reflect thefact that there are resource constraints and the benefits of controls must be considered relative to costs. Because ofthe inherent limitations in all control systems, no evaluation of controls can provide absolute assurance that allcontrol issues and instances of fraud, if any, within the company have been detected. Because of the inherentlimitations in a cost-effective control system, misstatements due to error or fraud may occur and not be detected.Our disclosure controls and procedures are designed to provide reasonable assurance of achieving their objectives.
36

Our chief executive officer and chief financial officer, with the assistance of management, evaluated theeffectiveness of our disclosure controls and procedures (as defined in Rules 13a-15(e) and 15d-15(e) under theSecurities Exchange Act of 1934, as amended) as of the end of the period covered by this report (the “EvaluationDate”). Based on that evaluation, our chief executive officer and chief financial officer concluded that, as of theEvaluation Date, our disclosure controls and procedures were effective to ensure that information required to bedisclosed in our reports under the Exchange Act is recorded, processed, summarized and reported within the timeperiods specified in the Securities and Exchange Commission’s rules and forms, and that such information isaccumulated and communicated to management, including our chief executive officer and chief financial officer, asappropriate to allow timely decisions regarding required disclosure.
There has not been any change in internal control over financial reporting during our quarter ended January 31,2007 that has materially affected, or is reasonably likely to materially affect, our internal control over financialreporting.
PART II. OTHER INFORMATION
ITEM 1. LEGAL PROCEEDINGS
We are involved in various claims and litigation arising principally in the ordinary course of business. Webelieve that the disposition of these matters will not have a material adverse effect on our business or our financialcondition.
In January 2006, the Company received a request for information pursuant to Section 308 of the Clean WaterAct from Region 3 of the Environmental Protection Agency (the “EPA”) requesting information about storm waterdischarge practices in connection with our homebuilding projects in the states that comprise EPA Region 3. To theextent the EPA’s review were to lead the EPA to assert violations of state and/or federal regulatory requirements andrequest injunctive relief and/or civil penalties, the Company would defend and attempt to resolve any such assertedviolations. At this time the Company cannot predict the outcome of the EPA’s review.
There are no other proceedings required to be disclosed pursuant to Item 103 of Regulation S-K.
ITEM 1A. RISK FACTORS
There has been no material change in our risk factors as previously disclosed in our Form 10-K for the fiscalyear ended October 31, 2006 in response to Item 1A. to Part 1 of such Form 10-K.
ITEM 2. UNREGISTERED SALES OF EQUITY SECURITIES AND USE OF PROCEEDS
During the three months ended January 31, 2007 we repurchased the following shares of our common stock:
Period
TotalNumber of
SharesPurchased
AveragePrice
Paid PerShare
Total Number ofShares Purchased as
Part of a PubliclyAnnounced Plan or
Program(2)
Maximum Numberof Shares that MayYet be PurchasedUnder the Plan or
Program(2)(In thousands) (In thousands) (In thousands)
November 1, 2006 to November 30, 2006 . . 10 $28.68 10 12,094
December 1, 2006 to December 31, 2006 . . 4 $31.88 4 12,090
January 1, 2007 to January 31, 2007 . . . . . . 47(1) $31.25 8 12,082
Total . . . . . . . . . . . . . . . . . . . . . . . . . . . . 61 $30.87 22
(1) As part of Mr. Robert I. Toll’s 2006 bonus payment, he exchanged $1.8 million of cash and 38,634 unrestrictedshares of our common stock with a fair market value of $1.2 million as of January 5, 2007, which he received aspart of his 2006 bonus payment, for 96,586 restricted shares of our common stock valued as of January 5, 2007(the date of the bonus payment). The restricted shares vest 50% on the first anniversary of the exchange and
37
50% on the second anniversary of the exchange unless he should retire, die, or become disabled (as those termsare defined in the stock award document), at which time the shares would immediately vest.
(2) On March 26, 2003, we announced that our Board of Directors had authorized the repurchase of up to 20 millionshares of our common stock, par value $.01, from time to time, in open market transactions or otherwise, for thepurpose of providing shares for our various employee benefit plans. The Board of Directors did not fix anexpiration date for the repurchase program.
Except as set forth above, we have not repurchased any of our equity securities.
We have not paid any cash dividends on our common stock to date and expect that, for the foreseeable future,we will not do so. Rather, we will follow a policy of retaining earnings in order to finance the continued growth ofour business and, from time to time, repurchase shares of our common stock.
The payment of dividends is within the discretion of our Board of Directors and any decision to pay dividendsin the future will depend upon an evaluation of a number of factors, including our earnings, capital requirements, ouroperating and financial condition, and any contractual limitations then in effect. In this regard, our seniorsubordinated notes contain restrictions on the amount of dividends we may pay on our common stock. In addition,our Credit Facility requires us to maintain a minimum tangible net worth (as defined in the credit agreement), whichrestricts the amount of dividends we may pay. At January 31, 2007, under the most restrictive of these provisions,we could have paid up to approximately $1.11 billion of cash dividends.
ITEM 3. DEFAULTS UPON SENIOR SECURITIES
None
ITEM 4. SUBMISSION OF MATTERS TO A VOTE OF SECURITY HOLDERS
None
ITEM 5. OTHER INFORMATION
None
ITEM 6. EXHIBITS
10.1 Amendment to the Toll Brothers, Inc. Cash Bonus Plan dated as of December 15, 2006 is herebyincorporated by reference to Exhibit 10.1 of the Registrant’s Form 8-K filed with the Securities andExchange Commission on December 19, 2006.
10.2 Toll Brothers, Inc. Executive Officer Cash Bonus Plan Fiscal 2007 Performance Goals are herebyincorporated by reference to Exhibit 10.2 of the Registrant’s Form 8-K filed with the Securities andExchange Commission on December 19, 2006.
10.3* Stock Award to Robert I. Toll dated January 5, 2007.
31.1* Certification of Robert I. Toll pursuant to Section 302 of the Sarbanes-Oxley Act of 2002.
31.2* Certification of Joel H. Rassman pursuant to Section 302 of the Sarbanes-Oxley Act of 2002.
32.1* Certification of Robert I. Toll pursuant to Section 906 of the Sarbanes-Oxley Act of 2002.
32.2* Certification of Joel H. Rassman pursuant to Section 906 of the Sarbanes-Oxley Act of 2002.
* Filed electronically herewith.
38

SIGNATURES
Pursuant to the requirements of the Securities Exchange Act of 1934, the registrant has duly caused this reportto be signed on its behalf by the undersigned thereunto duly authorized.
TOLL BROTHERS, INC.(Registrant)
By: /s/ Joel H. Rassman
Joel H. RassmanExecutive Vice President, Treasurer andChief Financial Officer (Principal Financial Officer)
Date: March 9, 2007
By: /s/ Joseph R. Sicree
Joseph R. SicreeSenior Vice President and Chief Accounting Officer(Principal Accounting Officer)
Date: March 9, 2007
39

EXHIBIT 10.3
TOLL BROTHERS, INC. STOCK INCENTIVE PLAN (1998)
STOCK AWARD
This Stock Award (the “Award Agreement”) constitutes an Award Agreement in connection with the grant ofan Award by Toll Brothers, Inc. (the “Company”) pursuant to the terms of the Toll Brothers, Inc. Stock IncentivePlan (1998) (the “1998 Plan”). This Award consists of a grant of 96,586 shares of Common Stock (the “AwardShares”), granted on this 5th day of January, 2007 (the “Date of Grant”) to Robert I. Toll (the “Grantee”), and issubject to all applicable terms and conditions set forth in the 1998 Plan.
1. Definitions. All capitalized terms contained in this Award Agreement shall have the meaning set forth inthe 1998 Plan unless otherwise defined herein or as may be required by the context.
2. Purchase Price. The purchase price per share for the Award Shares shall be $31.06, which was the closingprice of the Company’s common stock on the New York Stock Exchange on the Date of Grant. Grantee shall deliver tothe Company on the Date of Grant the aggregate purchase price (the “Purchase Price”) for the Award Shares.
3. Restrictions on the Award Shares. Grantee shall not be permitted to sell, transfer, pledge or assign theAward Shares at any time except to the extent such Award Shares have become vested pursuant to the terms of thisAward Agreement or the 1998 Plan. The period during which such restrictions are effective is referred to herein asthe “Restricted Period.” The Company shall, in its discretion, either maintain possession of the certificatesrespecting the Award Shares, place the certificates in the custody of an escrow agent for the period the Award Sharesare not vested, or transfer certificates to the Grantee; provided, however, that such certificates shall be legended in amanner determined to be appropriate by the Committee that indicates such restrictions as are in effect with respectto the Award Shares evidenced by such certificates.
4. Lapse of Restrictions. Subject to the terms and conditions set forth herein and in the 1998 Plan, therestrictions set forth in Paragraph 3 with respect to the Award Shares shall lapse (and the Award Shares shall beconsidered as “vested”) with respect to one-half (1/2) of the Award Shares on the first anniversary of the Date ofGrant, and with respect to the remaining Award Shares on the second anniversary of the Date of Grant (each suchdate being a “Vesting Date”); provided, however, that such restrictions shall lapse on such dates only if the Granteehas been an employee of the Company or a member of the Company’s Board of Directors (the “Board”)continuously from the Date of Grant through such Vesting Date. Except as otherwise provided, Grantee shallbe required to transfer back to the Company any Award Shares that have not become vested as of the date Grantee’sservice as an employee of the Company and as a member of the Board terminates upon payment to Grantee of thelesser of (a) the Purchase Price paid by Grantee for the Award Shares, and (b) the fair market value of the AwardShares as of the date of such termination of employment or service.
5. Vesting Date on Death or Disability. Notwithstanding the foregoing, the Grantee’s Award Shares shall,if not already vested, become fully vested in the event the Grantee’s service as an employee of the Company or as amember of the Board terminates by reason of the Grantee’s death or by reason of the grantee’s “disability” (as thatterm is used for purposes of the 1998 Plan).
6. Vesting on Change of Control. In the event there is a Change of Control while Grantee is employed bythe Company or serving as a member of the Board, Grantee’s Award Shares shall immediately become fully vested.
7. Vesting on Retirement. Notwithstanding the foregoing, the Grantee’s Award Shares shall, if not alreadyvested, become fully vested in the event the Grantee’s service as an employee of the Company or as a member of theBoard terminates by reason of the Grantee’s “retirement” from the Company. For purposes of this Agreement“retirement” shall be defined as Grantee voluntarily terminating his service to the Company after reaching the ageof 62 and, not engaging directly or indirectly as a proprietor, equity holder, investor (except as a passive investor notholding more than 5% of the outstanding capital stock of a publicly held company), lender, partner, director, officer,employee, consultant or representative in the “Home Building Business”, as determined by the Board. As usedherein, the term “Home Building Business” shall generally means any business determined by the Board to beinvolved in the acquisition, development or improvement of any real estate for potential residential use, or thepurchase, construction, development, marketing or sale of single or multi-family residential units or any otherbusiness which competes with the Company as determined by the Board.
8. Rights of Grantee. During the Restricted Period, Grantee shall have the right to vote the Award Sharesand to receive dividends. Stock dividends received with respect to the Award Shares shall be subject to the samerestrictions as the Award Shares.
9. Notices. Any notice to the Company under this Agreement shall be made in care of the Committee to theoffice of the General Counsel, at the Company’s main offices. All notices under this Agreement shall be deemed tohave been given when hand delivered or mailed, first class postage prepaid, and shall be irrevocable once given.
10. Securities Laws. The Committee may from time to time impose any conditions on the Award Shares as itdeems necessary or advisable to ensure that Shares are issued and resold in compliance with the Securities Act of1933, as amended.
11. Delivery of Shares. Within ten (10) business days of any Vesting Date, the Company shall, withoutpayment from the Grantee (or the person to whom ownership rights may have passed by will or the laws of descentand distribution) for the Award Shares, (i) deliver to the Grantee (or such other person) a certificate for the AwardShares or (ii) if consented to by the Grantee (or such other person), deliver electronically to an account designatedby the Grantee (or such other person) the Award Shares, in either case without any legend or restrictions, except forsuch restrictions as may be imposed by the Committee, in its sole judgment. The Company may condition deliveryof the Award Shares upon the prior receipt from Grantee (or such other person) of any undertakings which it maydetermine are required to assure that the Award Shares are being issued in compliance with federal and statesecurities laws. The right to payment of any fractional Shares shall be satisfied in cash, measured by the product ofthe fractional amount times the fair market value of a Share on the Vesting Date, as determined by the Committee.
12. Award Not to Affect Service. The Award granted hereunder shall not confer upon Grantee any right tocontinue as an employee of the Company or as a member of the Board or to serve in any other capacity for theCompany or any Affiliate.
13. Amendment to Award Agreement. Notwithstanding anything contained herein to the contrary, theCommittee shall have the authority to amend or modify the terms and conditions set forth in this Award Agreementif the Committee determines, at its discretion, that any such amendment or modification is necessary or appropriate;provided, however, that the terms of this Award Agreement may not be changed in a manner that is unfavorable tothe Grantee without the Grantee’s consent.
14. Miscellaneous.
(a) The address for Grantee to which notice, demands and other communications to be given or delivered underor by reason of the provisions hereof shall be the Grantee’s address as reflected in the Company’s personnel records.
(b) Grantee acknowledges receipt of a copy of the 1998 Plan prospectus, included in which is a summary of theterms of the 1998 Plan and a copy of which is annexed hereto. The summary contained therein is qualified in its entiretyby reference to the terms of the 1998 Plan, copies of which are available with the Company’s public filings with theUnited States Securities and Exchange Commission at www.sec.gov, or by oral or written request directed to theCompany. The Grantee represents that he/she is familiar with the terms and provisions of the 1998 Plan, and herebyaccepts the Award subject to all of the terms and provisions thereof. Grantee agrees to hereby accept as binding,conclusive and final all decisions or interpretations of the Committee upon any questions arising under the 1998 Plan orthis Agreement. Grantee authorizes the Company to withhold in accordance with applicable law from any compensationpayable to him/her any taxes required to be withheld be federal, state or local law in connection with the Award.
(c) The validity, performance, construction and effect of this Award shall be governed by the laws ofPennsylvania, without giving effect to principles of conflicts of law.
IN WITNESS WHEREOF, this Award Agreement has been executed on this 5th day of January, 2007.
TOLL BROTHERS, INC. GRANTEE:
By: Joel H. Rassman Robert I. TollName: Joel H. Rassman Robert I. TollTitle: Chief Financial Officer
2

EXHIBIT 31.1
CERTIFICATION
I, Robert I. Toll, Chief Executive Officer of Toll Brothers, Inc., certify that:
1. I have reviewed this Quarterly Report on Form 10-Q of Toll Brothers, Inc.;
2. Based on my knowledge, this report does not contain any untrue statement of a material fact or omit to statea material fact necessary to make the statements made, in light of the circumstances under which such statementswere made, not misleading with respect to the period covered by this report;
3. Based on my knowledge, the financial statements, and other financial information included in this report,fairly present in all material respects the financial condition, results of operations and cash flows of the registrant asof, and for, the periods presented in this report;
4. The registrant’s other certifying officer and I are responsible for establishing and maintaining disclosurecontrols and procedures (as defined in Exchange Act Rules 13a-15(e) and 15d-15(e)) and internal control overfinancial reporting (as defined in Exchange Act Rules 13a-15(f) and 15d-15(f)) for the registrant and have:
(a) Designed such disclosure controls and procedures, or caused such disclosure controls and proceduresto be designed under our supervision, to ensure that material information relating to the registrant, including itsconsolidated subsidiaries, is made known to us by others within those entities, particularly during the period inwhich this report is being prepared;
(b) Designed such internal control over financial reporting, or caused such internal control over financialreporting to be designed under our supervision, to provide reasonable assurance regarding the reliability offinancial reporting and the preparation of financial statements for external purposes in accordance withgenerally accepted accounting principles;
(c) Evaluated the effectiveness of the registrant’s disclosure controls and procedures and presented in thisreport our conclusions about the effectiveness of the disclosure controls and procedures, as of the end of theperiod covered by this report based on such evaluation; and
(d) Disclosed in this report any change in the registrant’s internal control over financial reporting thatoccurred during the registrant’s most recent fiscal quarter (the registrant’s fourth fiscal quarter in the case of anannual report) that has materially affected, or is reasonably likely to materially affect, the registrant’s internalcontrol over financial reporting; and
5. The registrant’s other certifying officer and I have disclosed, based on our most recent evaluation of internalcontrol over financial reporting, to the registrant’s auditors and the audit committee of the registrant’s board ofdirectors (or persons performing the equivalent functions):
(a) All significant deficiencies and material weaknesses in the design or operation of internal controlover financial reporting which are reasonably likely to adversely affect the registrant’s ability to record,process, summarize and report financial information; and
(b) Any fraud, whether or not material, that involves management or other employees who have asignificant role in the registrant’s internal control over financial reporting.
Signed: Robert I. TollName: Robert I. TollTitle: Chief Executive Officer
Date: March 9, 2007

EXHIBIT 31.2
CERTIFICATION
I, Joel H. Rassman, Chief Financial Officer of Toll Brothers, Inc., certify that:
1. I have reviewed this Quarterly Report on Form 10-Q of Toll Brothers, Inc.;
2. Based on my knowledge, this report does not contain any untrue statement of a material fact or omit to statea material fact necessary to make the statements made, in light of the circumstances under which such statementswere made, not misleading with respect to the period covered by this report;
3. Based on my knowledge, the financial statements, and other financial information included in this report,fairly present in all material respects the financial condition, results of operations and cash flows of the registrant asof, and for, the periods presented in this report;
4. The registrant’s other certifying officer and I are responsible for establishing and maintaining disclosurecontrols and procedures (as defined in Exchange Act Rules 13a-15(e) and 15d-15(e)) and internal control overfinancial reporting (as defined in Exchange Act Rules 13a-15(f) and 15d-15(f)) for the registrant and have:
(a) Designed such disclosure controls and procedures, or caused such disclosure controls and proceduresto be designed under our supervision, to ensure that material information relating to the registrant, including itsconsolidated subsidiaries, is made known to us by others within those entities, particularly during the period inwhich this report is being prepared;
(b) Designed such internal control over financial reporting, or caused such internal control over financialreporting to be designed under our supervision, to provide reasonable assurance regarding the reliability offinancial reporting and the preparation of financial statements for external purposes in accordance withgenerally accepted accounting principles;
(c) Evaluated the effectiveness of the registrant’s disclosure controls and procedures and presented in thisreport our conclusions about the effectiveness of the disclosure controls and procedures, as of the end of theperiod covered by this report based on such evaluation; and
(d) Disclosed in this report any change in the registrant’s internal control over financial reporting thatoccurred during the registrant’s most recent fiscal quarter (the registrant’s fourth fiscal quarter in the case of anannual report) that has materially affected, or is reasonably likely to materially affect, the registrant’s internalcontrol over financial reporting; and
5. The registrant’s other certifying officer and I have disclosed, based on our most recent evaluation of internalcontrol over financial reporting, to the registrant’s auditors and the audit committee of the registrant’s board ofdirectors (or persons performing the equivalent functions):
(a) All significant deficiencies and material weaknesses in the design or operation of internal controlover financial reporting which are reasonably likely to adversely affect the registrant’s ability to record,process, summarize and report financial information; and
(b) Any fraud, whether or not material, that involves management or other employees who have asignificant role in the registrant’s internal control over financial reporting.
Signed: Joel H. RassmanName: Joel H. RassmanTitle: Chief Financial Officer
Date: March 9, 2007

EXHIBIT 32.1
CERTIFICATION PURSUANT TO18 U.S.C. SECTION 1350,
AS ADOPTED PURSUANT TOSECTION 906 OF THE SARBANES-OXLEY ACT OF 2002
In connection with the Quarterly Report on Form 10-Q of Toll Brothers, Inc. (the “Company”) for the threemonths ended January 31, 2007, as filed with the Securities and Exchange Commission on the date hereof (the“Report”), I, Robert I. Toll, Chief Executive Officer of the Company, certify, pursuant to 18 U.S.C. Section 1350, asadopted pursuant to Section 906 of the Sarbanes-Oxley Act of 2002, that:
(1) The Report fully complies with the requirements of Section 13(a) or 15(d) of the Securities ExchangeAct of 1934; and
(2) The information contained in the Report fairly presents, in all material respects, the financialcondition and results of operations of the Company.
By: /s/ Robert I. Toll
Name: Robert I. TollTitle: Chief Executive Officer
Date: March 9, 2007

EXHIBIT 32.2
CERTIFICATION PURSUANT TO18 U.S.C. SECTION 1350,
AS ADOPTED PURSUANT TOSECTION 906 OF THE SARBANES-OXLEY ACT OF 2002
In connection with the Quarterly Report on Form 10-Q of Toll Brothers, Inc. (the “Company”) for the threemonths ended January 31, 2007, as filed with the Securities and Exchange Commission on the date hereof (the“Report”), I, Joel H. Rassman, Chief Financial Officer of the Company, certify, pursuant to 18 U.S.C. Section 1350,as adopted pursuant to Section 906 of the Sarbanes-Oxley Act of 2002, that:
(1) The Report fully complies with the requirements of Section 13(a) or 15(d) of the Securities ExchangeAct of 1934; and
(2) The information contained in the Report fairly presents, in all material respects, the financialcondition and results of operations of the Company.
By: /s/ Joel H. Rassman
Name: Joel H. RassmanTitle: Chief Financial Officer
Date: March 9, 2007