toll‐like receptor 2 antagonists identified through ... · toll-like receptor 2 antagonists...
TRANSCRIPT

Toll-like receptor 2 antagonists identified through virtualscreening and experimental validationPrasannavenkatesh Durai1, Hyeon-Jun Shin1, Asma Achek1, Hyuk-Kwon Kwon1,Rajiv Gandhi Govindaraj2 , Suresh Panneerselvam1, Dhanusha Yesudhas1, Jiwon Choi2,Kyoung Tai No2,3 and Sangdun Choi1
1 Department of Molecular Science and Technology, Ajou University, Suwon, Korea
2 Bioinformatics and Molecular Design Research Center, Seoul, Korea
3 Department of Biotechnology, Yonsei University, Seoul, Korea
Keywords
antagonist; pharmacophore; plasmon
resonance analysis; Toll-like receptor 2;
virtual screening
Correspondence
S. Choi, Department of Molecular Science
and Technology, Ajou University, Suwon
443-749, Korea
Fax: +82 31 219 1615
Tel: +82 31 219 2600
E-mail: [email protected]
(Received 14 December 2016, revised 8
May 2017, accepted 30 May 2017)
doi:10.1111/febs.14124
Toll-like receptor 2 (TLR2) antagonists are key therapeutic targets because
they inhibit several inflammatory diseases caused by surplus TLR2 activa-
tion. In this study, we identified two novel nonpeptide TLR2 antagonists,
C11 and C13, through pharmacophore-based virtual screening. At 10 lM,the level of interleukin (IL)-8 inhibition by C13 and C11 in human embry-
onic kidney TLR2 overexpressing cells was comparable to the commer-
cially available TLR2 inhibitor CU-CPT22. In addition, C11 and C13
acted in mouse macrophage-like RAW 264.7 cells as TLR2-specific inhibi-
tors and did not suppress the tumor necrosis factor-a induction by TLR3
and TLR4 activators. Moreover, the two identified compounds bound
directly to the human recombinant TLR2 ectodomain, during surface
plasmon resonance analysis, and did not affect cell viability in a 3-
(4,5-dimethylthiazol-2-yl)-5(3-carboxymethonyphenol)-2-(4-sulfophenyl)-2H-
tetrazolium assay. In total, two virtually screened molecules, C11 and C13,
were experimentally proven to be effective as TLR2 antagonists, and thus
will provide new insights into the structure of TLR2 antagonists, and pave
the way for the development of TLR2-targeted drug molecules.
Introduction
Toll-like receptors (TLRs) act as the first line of host
defense, by sensing a wide range of conserved micro-
bial molecules called pathogen-associated molecular
patterns [1]. In contrast, excessive TLR stimulation
can lead to several immune-related diseases [2]. Verte-
brate TLRs, located in the plasma membrane or on
endosomes, are evolutionarily classified into six sub-
families: TLR1/2/6/10, TLR3, TLR4, TLR5, TLR7/8/
9 and TLR11/12/13/21/22/23 [3]. The members of each
subfamily recognize a specific type of ligand and form
homo- or heterodimers to activate the downstream sig-
nal transduction cascades [4]. A few studies have
reported that certain TLRs are species-specific, but
sense the same type of ligand [5,6]. TLRs are type I
transmembrane proteins that contain three types of
domains: an N-terminal ligand-binding ectodomain
(ECD) composed of leucine-rich repeats (LRRs), a
transmembrane helix domain, and a Toll/interleukin
Abbreviations
AD, AUTODOCK; ADMET, absorption, distribution, metabolism, excretion and toxicity; CD, CDOCKER; DS, DISCOVERY STUDIO; ECD, ectodomain;
HBA, hydrogen bond acceptor; HBD, hydrogen bond donor; HEK293-hTLR2, human embryonic kidney TLR2 overexpressing; HYD,
hydrophobic feature; IL, interleukin; LRR, leucine-rich repeat; MD, molecular dynamics; MM/PBSA, molecular mechanics/Poisson–Boltzmann
surface area; MTS, 3-(4,5-dimethylthiazol-2-yl)-5(3-carboxymethonyphenol)-2-(4-sulfophenyl)-2H-tetrazolium; MyD88, myeloid differentiation
primary-response protein 88; PDB, Protein Data Bank; SPR, surface plasmon resonance; TIR, Toll/interleukin-1 receptor; TLR, Toll-like
receptor; TNF, tumor necrosis factor; VS, virtual screening.
2264 The FEBS Journal 284 (2017) 2264–2283 ª 2017 Federation of European Biochemical Societies

(IL)-1 receptor (TIR) homology domain, which initiates
TLR signaling and results in the production of proin-
flammatory cytokines and type I interferons [7,8]. To
date, crystal structures have been determined for the
agonist-bound ECDs of TLRs 1, 2, 4 and 8 (human);
TLRs 2, 3, 6 and 13 (mouse); and TLR5 (zebrafish) [9–12]. With regard to the crystal structure of the antago-
nist-bound TLR ECD and molecular dynamics (MD)-2,
staphylococcal superantigen-like protein 3-TLR2
(mouse), Eritoran–TLR4–MD-2 (human), lipid IVa–MD-2 (human) and TLR9-inhibitory DNA4084 (horse)
complexes have been solved [9,13,14].
Members of the TLR2 subfamily reside in the
plasma membrane and bind primarily to bacterial, fun-
gal and viral substances. The main TLR2 ligands are
lipopeptides, peptidoglycans, lipoteichoic acids,
lipoarabinomannans, the phosphatidylethanolamine-
diethylene triamine pentaacetic acid, phenol-soluble
modulins, glycosylphosphatidylinositols and zymosan
[4,15–17]. In the TLR2 subfamily, the crystal struc-
tures of dimeric TLR2–TLR1 with triacyl lipopeptide,
Pam3CSK4 and dimeric TLR2–TLR6 with diacyl
lipopeptide Pam2CSK4 have been described [18,19].
The results of our recent protein–ligand molecular
docking study suggested that triacyl lipopeptides may
be the ligands for TLR2–TLR10, and diacyl lipopep-
tides may activate TLR10–TLR1 and TLR10–TLR10
complexes [20]. Another study experimentally con-
firmed the hypothesis that TLR2–TLR10 recognizes
triacyl lipopeptides [21]. Structural studies have shown
that ligand-induced dimerization of the ECDs of
TLR2 subfamily members leads to the dimerization of
their TIR domains and the initiation of downstream
signaling [7]. TLR2 signaling starts with the recruit-
ment of the TIR-domain-containing adaptor molecule,
myeloid differentiation primary-response protein 88
(MyD88), which regulates the canonical pathway [8].
Subsequently, molecules such as IL-1-receptor-
associated kinase family members [22], tumor necrosis
factor (TNF) receptor-associated factor 6 and trans-
forming growth factor b-activated kinase 1 activate the
IjB kinase complex. This complex activates nuclear
factor-jB to initiate the transcription of inflammatory
genes [23]. As in other TLRs, the ECDs of TLR2 sub-
family members contain LRRs of 19–33 residues [7].
However, similar to TLR4, the ECDs of TLR2 sub-
family members can be divided into three subdomains:
N-terminal, central and C-terminal [7]. TLR2 subfam-
ily members occur as monomers, but after ligand bind-
ing, TLR2 binds with TLR1 or TLR6, to activate the
signaling cascade [7]. In the TLR2–TLR1–Pam3CSK4
crystal structure [Protein Data Bank (PDB) ID:
2Z7X], LRRs 9–12, in the convex regions of both
TLR2 and TLR1, are the binding region for triacyl
lipopeptide agonists [18].
Accumulating evidence suggests that TLR2 antago-
nists act against ischemia, atopic dermatitis and
atherosclerosis [15,24,25]. Hence, there is a need for
therapeutically appropriate ligands to block TLR2 sig-
naling, and there is a growing interest in the develop-
ment of drug-like nonpeptide TLR2 antagonists with
increased efficacy. Here, we present a receptor–ligand-based and ligand-based virtual screening (VS)
approach, based on structural insights from the crystal
structure of 2Z7X and a recent high-throughput
screening study of TLR2 synthetic small-molecule ago-
nists [18,26]. The major benefit of pharmacophore-
based VS is its capacity to identify active compounds
with different chemical structures that bind to the
same target [27]. In addition, VS is economical and
time-efficient [28]. Approximately seven million mole-
cules in our in-house virtual library were screened in
this study, and the initial hits were filtered to select
drug-like molecules. Furthermore, the predicted bind-
ing modes of the compounds were investigated using
molecular docking and MD simulations, combined
with binding free energy calculations. Sixteen selected
molecules were evaluated for their direct binding to
human recombinant TLR2, using surface plasmon res-
onance (SPR) assay. Further, we tested the ability of
these molecules to inhibit the synthesis and secretion
of IL-8 in human embryonic kidney cells overexpress-
ing TLR2 (HEK293-hTLR2) stimulated with the
TLR2 agonist Pam3CSK4. We ultimately chose the
two molecules (C11 and C13) that displayed sufficient
direct binding to TLR2 ECD and significantly reduced
Pam3CSK4-induced IL-8 production. Interestingly,
C11 and C13 also reduced the TNF-a secretion acti-
vated by Pam3CSK4 in RAW 264.7 cells. Moreover,
the antagonists presented here were proven to be non-
cytotoxic in cell viability assays and may possess posi-
tive pharmacological properties, because of their low
molecular mass (< 500 Da). They also are nonpeptides
that are distinct from several known TLR2 inhibitors
with fatty acid chains [29]. Thus, these antagonists will
be important in the rational design of novel drugs
appropriate for the treatment of various TLR2-related
inflammatory diseases.
Results
In silico alanine scanning mutagenesis and
pharmacophore models
The availability of high-resolution crystal structures
for TLR2–TLR1–Pam3CSK4 and of a high-throughput
2265The FEBS Journal 284 (2017) 2264–2283 ª 2017 Federation of European Biochemical Societies
P. Durai et al. Computational identification of TLR2 antagonists
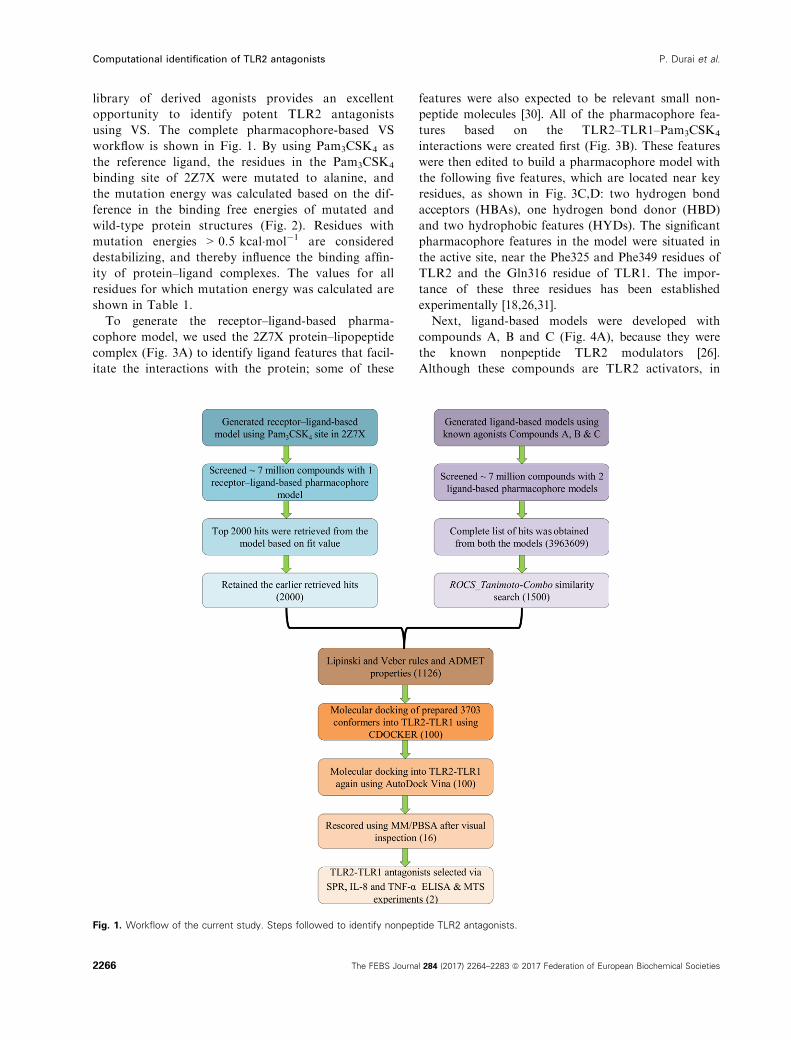
library of derived agonists provides an excellent
opportunity to identify potent TLR2 antagonists
using VS. The complete pharmacophore-based VS
workflow is shown in Fig. 1. By using Pam3CSK4 as
the reference ligand, the residues in the Pam3CSK4
binding site of 2Z7X were mutated to alanine, and
the mutation energy was calculated based on the dif-
ference in the binding free energies of mutated and
wild-type protein structures (Fig. 2). Residues with
mutation energies > 0.5 kcal�mol�1 are considered
destabilizing, and thereby influence the binding affin-
ity of protein–ligand complexes. The values for all
residues for which mutation energy was calculated are
shown in Table 1.
To generate the receptor–ligand-based pharma-
cophore model, we used the 2Z7X protein–lipopeptidecomplex (Fig. 3A) to identify ligand features that facil-
itate the interactions with the protein; some of these
features were also expected to be relevant small non-
peptide molecules [30]. All of the pharmacophore fea-
tures based on the TLR2–TLR1–Pam3CSK4
interactions were created first (Fig. 3B). These features
were then edited to build a pharmacophore model with
the following five features, which are located near key
residues, as shown in Fig. 3C,D: two hydrogen bond
acceptors (HBAs), one hydrogen bond donor (HBD)
and two hydrophobic features (HYDs). The significant
pharmacophore features in the model were situated in
the active site, near the Phe325 and Phe349 residues of
TLR2 and the Gln316 residue of TLR1. The impor-
tance of these three residues has been established
experimentally [18,26,31].
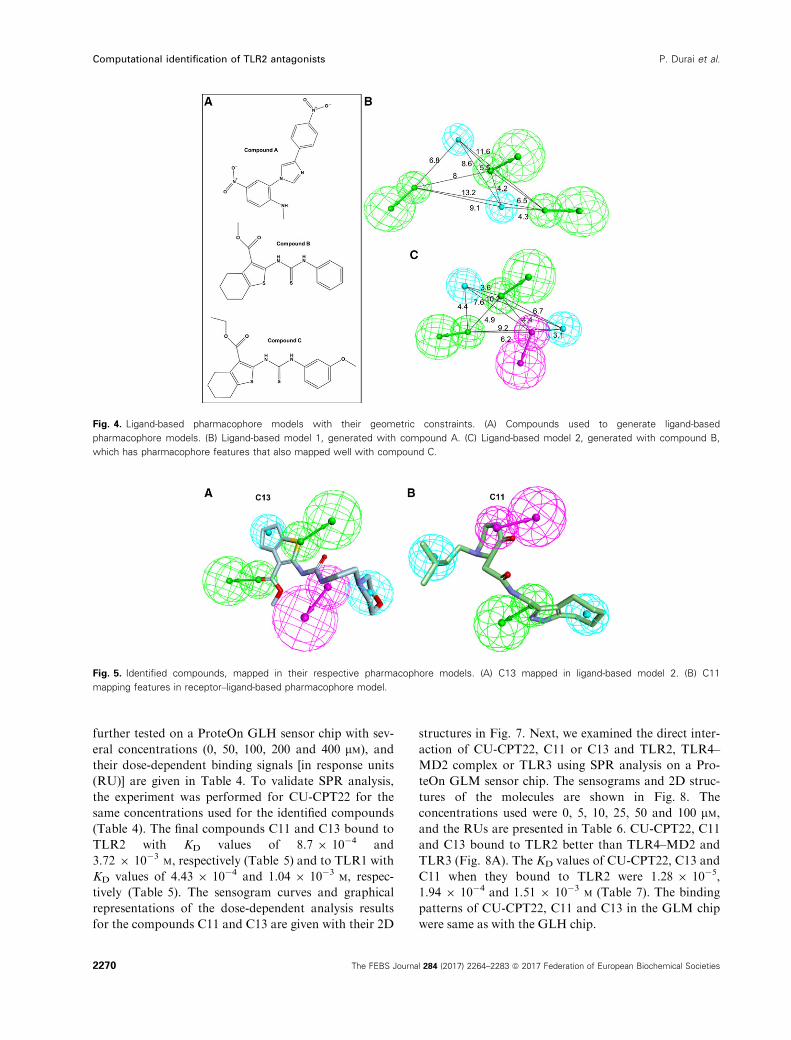
Next, ligand-based models were developed with
compounds A, B and C (Fig. 4A), because they were
the known nonpeptide TLR2 modulators [26].
Although these compounds are TLR2 activators, in
Fig. 1. Workflow of the current study. Steps followed to identify nonpeptide TLR2 antagonists.
2266 The FEBS Journal 284 (2017) 2264–2283 ª 2017 Federation of European Biochemical Societies
Computational identification of TLR2 antagonists P. Durai et al.

this study they provided the molecule C13, with minor
structural differences, which effectively inhibited TLR2
signaling. Compounds A and B were used to generate
the ligand-based models 1 and 2, respectively. Of the
10 pharmacophore models (ranked from 1 to 10) gen-
erated with various features from compound A, we
chose the first ranking output model with three HBAs
and two HYDs for ligand-based model 1, which was
more likely to map to active molecules (Fig. 4B). For
ligand-based model 2 (Fig. 4C), the third ranking out-
put model was selected because its features (one HBD,
two HBAs and two HYDs) in compound B were also
present in compound C. Due to structural similarities
between compounds B and C, compound C mapped
to all five pharmacophore features that were obtained
from compound B, in ligand-based model 2. The final
selected TLR2 antagonists, C11 and C13, mapped in
their respective pharmacophore models, are given in
Fig. 5.
Database similarity search and selection of drug-
like compounds
The receptor–ligand-based model was used to screen
our in-house virtual library. The top 2000 molecules
that mapped to any of the four pharmacophore features
(out of five) were retrieved based on the fit value. The fit
value in DISCOVERY STUDIO (DS 4.0; Accelrys Software
Inc., San Diego, CA, USA) is calculated from a measure
of how good the ligand fits the pharmacophore model.
For the ligand-based model search, hits were obtained
from both of the ligand-based models, and subjected to
shape and atom type similarity matching using the pro-
gram OPENEYE ROCS (Santa Fe, NM, USA) [32]. Com-
pound A was used as a query, and the best 500 similar
molecules were filtered from the 2 312 604 ligand-based
model 1 hits. Compound B was used as an input to
screen the 1 651 005 ligand-based model 2 hits, and the
500 molecules most similar to compound B were chosen.
The 1 651 005 hits obtained through ligand-based
model 2 were filtered again by using compound C as a
query, and the 500 molecules that closely resemble com-
pound C were retrieved.
The calculation of drug-like properties for the candi-
date compounds can help avoid the synthesis of unfa-
vorable compounds during the later stages of drug
development [33]. The 3500 hit molecules (2000 from
the receptor–ligand-based model and 1500 from the
ligand-based models) were tested for these properties,
with filters such as the Lipinski [34] and Veber [35]
rules and absorption, distribution, metabolism, excre-
tion and toxicity (ADMET) [33]. The Lipinski and
Veber rules were used to screen for compounds with
better oral bioavailability. In addition, calculation of
the ADMET descriptors identified the molecules with
good absorption, optimal solubility, low blood–brainbarrier penetrability, cytochrome P450 2D6 noninhibi-
tion, nonhepatotoxic properties and nonplasma pro-
tein-binding properties. After discarding inappropriate
compounds, we selected 1126 drug-like compounds for
further screening.
Molecular docking and scoring
In computer-aided drug design, the molecular docking
of hit molecules into a target protein is an effective
means of identifying leads [36]. In this study, molecular
docking was performed with two programs, CDOCKER
(CD) [37] and AUTODOCK (AD) Vina [38], to prefilter and
select the best docking poses. To isolate the top com-
pounds, we used CD to dock the 1126 drug-like hits into
the Pam3CSK4 binding site shown in Fig. 3A. The 100
poses with the most negative CD interaction energy
Fig. 2. TLR2–TLR1 residues subjected to computational mutation
binding energy calculations. Sequence alignment of the active site
in human TLR2 and TLR1, based on structure. Details of the
residues that bind Pam3CSK4 in the 2Z7X crystal structure, and the
results obtained from computational alanine scanning are given.
Residues with mutation energies > 0.5 kcal�mol�1 were considered
destabilizing.
2267The FEBS Journal 284 (2017) 2264–2283 ª 2017 Federation of European Biochemical Societies
P. Durai et al. Computational identification of TLR2 antagonists

were redocked with AD Vina. Although 34 binding sites
were available in this crystal structure, the cavity size of
TLR2 (~ 1600 �A3) and TLR1 (~ 400 �A3) in the triacyl
lipopeptide site highly favored ligand interactions with
both TLR2 and TLR1 [18]. Moreover, our target was to
obtain compounds that compete with agonists and bind
to the residues that agonists interact with. Hence, we
used the dimeric TLR2–TLR1 structure for molecular
docking. The best 18 poses of 16 molecules were selected
based on ligand interactions with experimentally
established key residues and listed with their AD bind-
ing energy and CD interaction energy in Table 2. The
molecular docking results for the final two molecules,
C11 and C13, are shown in Fig. 6.
Interaction energy calculations to rescore
docking complexes
The interaction energy provides insights into the
driving forces of protein–ligand interactions.
Table 1. In silico mutation energy calculations. Values of TLR2–TLR1 residues, subjected to computational alanine scanning.
Mutation to alanine Mutation energy (kcal�mol�1) Van der Waals term Electrostatic term Entropy term Nonpolar term
Leu324 1.53 3.68 �0.11 �0.32 0
Lys347 1.27 4.41 �0.62 �0.78 0
Ile314 1.23 1.83 �0.29 0.57 0
Phe284 1.21 1.15 0.28 0.62 0
Leu266 1.17 1.64 �0.06 0.48 0
Tyr320* 1.17 1.26 0.44 0.4 0
Ile341 1.15 1.84 �0.08 0.34 0
Leu355 1.15 1.65 �0.03 0.42 0
Asp327 1.13 2.54 0.14 �0.26 0
Val339* 1.13 2.18 �0.1 0.11 0
Phe295 1.05 1.49 0.06 0.34 0
Val343 1.02 1.84 0.08 0.08 0
Pro352 0.98 1.48 0.3 0.11 0
Leu334 0.96 1.54 0.02 0.23 0
Val351 0.83 1.37 0.1 0.12 0
Ile319 0.81 1.28 0.19 0.09 0
Leu317 0.79 1.01 0.11 0.29 0
Leu282 0.75 1.18 0.2 0.07 0
Val311* 0.72 2.21 �0.06 �0.44 0
Val348 0.7 1.23 0.13 0.02 0
Phe312* 0.63 0.47 �0.04 0.52 0
Val309 0.56 0.91 0.01 0.13 0
Val338 0.49 0.93 �0.02 0.04 0
Asn294 0.37 1.07 0.22 �0.34 0
Trp258* 0.36 0.13 0.15 0.27 0
Met270 0.33 0.61 �0.18 0.14 0
Leu289 0.31 0.6 �0.13 0.09 0
Pro315* 0.28 0.5 0.09 �0.02 0
Phe323* 0.24 0.03 �0.01 0.29 0
Ile319* 0.16 0.06 0.07 0.12 0
Phe314* 0.14 0.1 0.17 0.01 0
Tyr318* 0.13 0.2 �0.11 0.1 0
Ile304* 0.1 0.01 0.03 0.1 0
Phe261* 0.08 0.01 �0.04 0.12 0
Ile322* 0.01 0.02 0.01 0 0
Val333* 0.01 0.02 �0.04 0.02 0
Leu265* 0.01 0 0.01 0 0
Ser346 0.01 �0.07 0.09 0 0
Val307* �0.04 0.01 �0.21 0.07 0
Leu283* �0.07 �0.01 �0.17 0.02 0
Gly313* �0.07 �0.27 �0.06 0.12 0
Met338* �0.13 0.08 �0.38 0.03 0
Thr336* �0.27 0.08 �0.64 0.01 0
Asterisks represent TLR1 residues.
2268 The FEBS Journal 284 (2017) 2264–2283 ª 2017 Federation of European Biochemical Societies
Computational identification of TLR2 antagonists P. Durai et al.

Therefore, 1 ns MD simulations were carried out
for the 18 docking complexes identified above and
were reordered according to molecular mechanics/
Poisson–Boltzmann surface area (MM/PBSA) bind-
ing free energy calculations. They were calculated
with 50 snapshots obtained at 20-ps intervals
throughout a 1-ns MD simulation. The average
binding energy scores were calculated for the 18
complexes from several energy components and are
listed in Table 2. The TLR2–TLR1–Pam3CSK4
complex was included as a control. The values of
the various energy components that compose bind-
ing free energy are helpful for understanding the
complex binding process.
In vitro binding of virtual hits
The computationally predicted 16 compounds given in
Table 2 were purchased for in vitro testing from Chem-
Bridge (San Diego, CA, USA), Enamine (Kyiv,
Ukraine) and VitasM (Champaign, IL, USA). To vali-
date the binding of virtual hits with TLR2 and TLR1,
SPR analysis on a ProteOn GLH sensor chip was per-
formed with 200 and 100 lM of molecules and the
results indicated the substantial direct binding of the
molecules C1, C7, C11, C13 and C16 to TLR2, and
C11, C13 and C16 to TLR1 (Table 3). The molecules
(C1, C7, C11, C13, C14, C15 and C16) selected in the
primary screening experiments, including SPR, were
Fig. 3. Receptor–ligand-based pharmacophore model. (A) Crystal structure of TLR2–TLR1–Pam3CSK4 (PDB ID: 2Z7X). (B) All
pharmacophore features generated from Pam3CSK4 bound to TLR2–TLR1. (C) The five selected pharmacophore features for the
receptor–ligand-based model and the residues around the features are labeled. Asterisks indicate TLR1 residues. The green, magenta and
cyan spheres indicate HBA, HBD and HYD, respectively. The gray exclusion spheres indicate the spaces used by the proteins. (D)
Receptor–ligand-based pharmacophore model, showing only features and geometric constraints. The distances between two features are
given in angstroms (�A).
2269The FEBS Journal 284 (2017) 2264–2283 ª 2017 Federation of European Biochemical Societies
P. Durai et al. Computational identification of TLR2 antagonists
further tested on a ProteOn GLH sensor chip with sev-
eral concentrations (0, 50, 100, 200 and 400 lM), andtheir dose-dependent binding signals [in response units
(RU)] are given in Table 4. To validate SPR analysis,
the experiment was performed for CU-CPT22 for the
same concentrations used for the identified compounds
(Table 4). The final compounds C11 and C13 bound to
TLR2 with KD values of 8.7 9 10�4 and
3.72 9 10�3M, respectively (Table 5) and to TLR1 with
KD values of 4.43 9 10�4 and 1.04 9 10�3M, respec-
tively (Table 5). The sensogram curves and graphical
representations of the dose-dependent analysis results
for the compounds C11 and C13 are given with their 2D
structures in Fig. 7. Next, we examined the direct inter-
action of CU-CPT22, C11 or C13 and TLR2, TLR4–MD2 complex or TLR3 using SPR analysis on a Pro-
teOn GLM sensor chip. The sensograms and 2D struc-
tures of the molecules are shown in Fig. 8. The
concentrations used were 0, 5, 10, 25, 50 and 100 lM,and the RUs are presented in Table 6. CU-CPT22, C11
and C13 bound to TLR2 better than TLR4–MD2 and
TLR3 (Fig. 8A). The KD values of CU-CPT22, C13 and
C11 when they bound to TLR2 were 1.28 9 10�5,
1.94 9 10�4 and 1.51 9 10�3M (Table 7). The binding
patterns of CU-CPT22, C11 and C13 in the GLM chip
were same as with the GLH chip.
Fig. 4. Ligand-based pharmacophore models with their geometric constraints. (A) Compounds used to generate ligand-based
pharmacophore models. (B) Ligand-based model 1, generated with compound A. (C) Ligand-based model 2, generated with compound B,
which has pharmacophore features that also mapped well with compound C.
Fig. 5. Identified compounds, mapped in their respective pharmacophore models. (A) C13 mapped in ligand-based model 2. (B) C11
mapping features in receptor–ligand-based pharmacophore model.
2270 The FEBS Journal 284 (2017) 2264–2283 ª 2017 Federation of European Biochemical Societies
Computational identification of TLR2 antagonists P. Durai et al.

Cytokine and cell viability assays
To assess the antagonistic activity of the 16 compounds
on TLR2, HEK293-hTLR2 cells were first incubated
with the compounds (at 1 and 5 lM) for 1 h, followed
by treatment with 50 nM of Pam3CSK4. After 24 h, IL-8
levels in the cell culture supernatant were quantified
using ELISA. The results showed that a few molecules,
including C11 and C13, that earlier displayed effective
binding in SPR analysis, significantly reduced the
Pam3CSK4-triggered IL-8 production, as shown in
Fig. 9. We considered the results from the above
experiments, and only seven molecules (C1, C7, C11,
C12, C13, C14 and C16) were selected for further dose-
dependent analyses. We tested these seven selected
molecules (at the concentrations of 1, 5 and 10 lM), inaddition to 10 lM of CU-CPT22, a known TLR2–TLR1 antagonist (Fig. 10A). Compared with the lower
concentrations, all the seven compounds highly reduced
IL-8 secretion at 10 lM. In particular, C13 and C11 led
to the greatest reduction in the production of IL-8. To
determine if the seven chosen compounds had cytotoxic
properties, we performed a 3-(4,5-dimethylthiazol-2-yl)-
5(3-carboxymethonyphenol)-2-(4-sulfophenyl)-2H-tet-
razolium (MTS) assay in HEK293-hTLR2 cells. As
shown in Fig. 10B, the MTS assay confirmed that
none of the compounds caused cellular cytotoxicity,
at any of the concentrations (1, 5 and 10 lM) tested.
Further, when we tested CU-CPT22, C11 and C13
in both HEK293-hTLR2 and HEK293-Null cells,
10 lM of the three molecules reduced Pam3CSK4-
induced IL-8 secretion only in HEK293-hTLR2 cells
(Fig. 11A). As expected, HEK293-Null cells did not
express TLR2 and thereby no Pam3CSK4-induced IL-
8 production in these cells. The TLRs and species
specificities of C11 and C13 were further verified
in vitro. Mouse macrophage-like RAW 264.7 cells
were treated with CU-CPT22 or C11 or C13 in com-
bination with a few TLR agonists, and the resulting
TNF-a level was measured (Fig. 11B). Interestingly,
CU-CPT22, C11 and C13 significantly repressed only
Pam3CSK4-induced TLR2–TLR1 activated TNF-aproduction. In other words, CU-CPT22, C11 and
C13 were not seem to inhibit TNF-a when cells were
treated with Poly (I : C) (TLR3) or lipopolysaccha-
ride (LPS; TLR4), the other TLR activators
(Fig. 11B). C13 can also slightly inhibit TLR2–TLR6
heterodimer; however, this inhibition should be better
explored in future studies. These results exhibit that
C11 and C13 are specific inhibitors of TLR2 and not
TLR3 or TLR4.
Table 2. Computational binding values of the virtual hits. The energy values calculated to obtain the MM/PBSA binding energy, CD
interaction energy and the AD binding energy of all 18 docking complexes, chosen after visual inspection. The structure of 2Z7X complexed
with Pam3CSK4 was added as a control.
Compound
name
Van der
Waals energy
(kJ�mol–1)
Electrostatic
energy
(kJ�mol–1)
Polar
solvation
energy
(kJ�mol–1)
SASA
energy
(kJ�mol–1)
SAV
energy
(kJ�mol–1)
WCA
energy
(kJ�mol–1)
MM/PBSA
binding energy
(kJ�mol–1)
AD binding
energy
(kcal�mol–1)
CD interaction
energy
(kcal�mol–1)
C7 �229.142 �903.310 245.344 �24.879 �268.883 83.874 �1096.996 �11.622 �58.9132
C15 �245.747 �811.725 227.765 �24.287 �249.815 86.074 �1017.736 �11.13 �63.5574
C3 �141.993 �984.124 281.512 �20.085 �215.393 69.732 �1010.352 �8.296 �58.0539
C16 �246.337 �781.112 224.124 �24.547 �265.807 89.533 �1004.145 �9.427 �63.244
C13 �186.422 �841.548 219.218 �20.341 �215.359 69.897 �974.554 �8.357 �58.0981
C8 �143.428 �796.057 133.866 �16.771 �167.924 79.734 �910.581 9.894 64.4827
C2 �161.663 �718.391 169.642 �19.184 �208.633 67.879 �870.349 �8.485 �58.1906
C9 �28.261 �689.736 �47.112 �5.594 �66.314 61.890 �775.126 �9.325 �60.4863
C5 �32.318 �728.836 �17.082 �5.192 �46.689 68.736 �761.382 �10.088 �58.7772
C10 �30.821 �647.060 �16.111 �5.199 �101.245 64.670 �735.766 �8.379 �58.3077
C11 �155.492 �445.508 123.638 �17.954 �180.452 74.762 �601.006 �9.862 �58.2775
C11 �27.195 �397.705 �41.165 �6.468 �117.839 74.607 �515.766 �11.288 �58.1155
C4 �207.316 �144.311 120.990 �22.996 �246.643 75.405 �424.870 �8.741 �59.1087
C6 �38.280 �304.739 �46.897 �6.916 �99.760 85.727 �410.864 �10.002 �58.7992
C1 �223.114 �68.654 93.952 �24.302 �268.474 84.860 �405.733 �9.232 �59.2525
C7 �245.948 �43.055 100.432 �24.876 �258.714 83.121 �389.040 �10.5590 �60.0077
C14 �45.596 �47.185 �42.740 �8.114 �114.042 81.761 �175.916 �10.752 �58.8057
C12 �67.798 14.551 6.016 �9.804 �190.832 86.491 �161.374 �10.668 �60.6824
Pam3CSK4 �583.956 �623.005 374.013 �64.348 �681.373 281.650 �3297.019 * *
*Because the crystal structure was used, molecular docking was not performed for Pam3CSK4. SASA, solvent accessible surface area;
SAV, solvent accessible volume; WCA, Weeks-Chandler-Andersen theory.
2271The FEBS Journal 284 (2017) 2264–2283 ª 2017 Federation of European Biochemical Societies
P. Durai et al. Computational identification of TLR2 antagonists

Discussion
An uncontrolled TLR2 response may lead to several
inflammatory and autoimmune diseases, and therefore
inhibitors that control TLR2 signaling are required
[39]. The currently known TLR2 modulators mainly
comprise lipopeptides that contain long fatty acyl
chains [29]. These high molecular mass molecules are
unsuitable as drugs. Likewise, the microbial compo-
nents that modulate TLR2 signaling are unsafe as
drugs, due to their toxic nature [40]. Hence, there is a
need for an effective drug-like compound that inhibits
TLR2 signaling. The development of analogs for exist-
ing high molecular mass structures may yield com-
pounds with poor pharmacokinetic properties. Thus,
to identify effective TLR2 antagonists, we can screen
chemical libraries with the receptor [15]. In addition,
we can look for molecules that are structurally similar
to known TLR nonpeptide agonists, but with the
opposite activity. However, the identification of TLR2
small-molecule modulators through computational
methods is one of the most challenging tasks in drug
discovery, due to the expansive TLR2–TLR1/TLR6
interfaces. Nevertheless, in our previous studies, we
used the molecular docking approach for TLR2 sub-
family members, to successfully predict their high
molecular mass TLR2 agonists and their binding
modes [20,41]. In this study, we adopted a VS method
that integrates protein–ligand-based and ligand-based
pharmacophore approaches to identify TLR2 antago-
nists. Among the computationally predicted molecules,
C11 and C13 (Fig. 7A) were confirmed through SPR
biosensor analysis, IL-8 ELISA and cell viability
assays as novel, effective and nontoxic TLR2
A C13
Phe312*
Phe325
3.4
3.62.8
3.1
3.13.1
2.12.5
3.7
3.4
Phe312*
Tyr323
Phe349
Val348
B C11
Phe325
Fig. 6. Molecular docking results of identified TLR2 antagonists. The TLR2 and TLR1 residues are shown in blue and green, respectively.
The dark green dotted lines represent stronger hydrogen bonds, and the light green dotted lines represent weaker hydrogen bonds. The
hydrogen bond distances in angstroms are written next to the dotted lines. Asterisks indicate TLR1 residues. The green dashed arrow
shows the hydrogen bond interactions of the ligand with the main chains of amino acids. The orange line indicates the Pi interactions. (A)
C13. (B) C11.
2272 The FEBS Journal 284 (2017) 2264–2283 ª 2017 Federation of European Biochemical Societies
Computational identification of TLR2 antagonists P. Durai et al.

antagonists. We identified C13 using the ligand-based
model 2 obtained from compounds B and C. The
minor structural differences of C13 when compared
with compound B and compound C are as follows.
Compounds B and C are derivatives of thiourea, and
substituted by thiophene and benzene rings. However,
Table 3. SPR biosensor experiment of 16 virtual hits. Results from SPR analysis of the molecules, when tested for binding with TLR2 and
TLR1 at 200 and 100 lM. RUs of the compounds are given.
Compound
200 lM 100 lM
TLR2 TLR1 TLR2 TLR1
C1 19.79 7.15 6.56 3.9
C2 �7.58 �4.73 �9.53 9 10�1 3.73 9 10�1
C3 3.70 9 10�1 1.04 1.09 8.90 9 10�1
C4 1.58 4.59 �1.01 9.19 9 10�1
C5 �3.26 9 10�1 �1.86 �1.6 �1.8
C6 1.06 1.77 1 7.36 9 10�1
C7 23.96 �10.37 3.21 7.96 9 10�1
C8 �6.49 �3.86 �1.91 �1.97
C9 �15.42 �11.44 �5.36 �3.7
C10 �1.2 4.87 9 10�2 2.14 3.65 9 10�1
C11 43.84 11.68 10.25 4.19
C12 12.65 2.74 �6.39 9 10�1 �1.32
C13 33.53 15.16 9.87 7.55
C14 11.51 4.9 5.67 2.74
C15 3.77 3.3 1.03 1.09
C16 16.38 11.62 6.52 5.25
DMSO �3.1 �2.81 �3.57 �3.53
Table 4. Dose-dependent SPR analysis of the compounds selected during primary screening. RUs of the compounds are given.
Target
Dose
(lM) C1 C7 C11 C13 C14 C15 C16 CU-CPT22
TLR2 0 2.83 9 10�1 �7.74 9 10�2 �3.56 9 10�2 1.33 9 10�1 4.33 9 10�1 9.64 9 10�1 2.07 3.19
50 3.78 9.54 11.78 6.63 3.3 1.02 4 33.09
100 13.13 23.04 21.76 14.89 7.91 1.2 6.77 33.32
200 23.06 42.42 39.19 27.83 12.3 5.45 14.12 40.81
400 17.24 71.23 65.59 53.59 22.73 8.76 21.03 59.1
TLR1 0 6.12 9 10�1 1.43 9 10�1 �3.45 9 10�1 �5.97 9 10�1 2.51 9 10�1 1.22 2 14.83
50 7.15 9 10�1 �5.57 9 10�1 2.41 9 10�1 1.24 5.83 9 10�1 �0.456 �8.81 9 10�1 3.78
100 2.22 4.58 4.11 7.52 2.75 9.05 9 10�1 1.09 117.83
200 5.19 9.86 7.24 12.94 5.93 4.75 8.9 11.48
400 4.1 16.5 8.9 20.49 8.94 4.35 7.52 12.91
Table 5. SPR binding affinities of the compounds selected during primary screening. The association rate (Ka), dissociation rate (Kd) and
binding affinity constant (KD) of the compounds are given.
Compound
TLR2 TLR1
Ka (Ms�1) Kd (s�1) KD (M) Ka (Ms�1) Kd (s�1) KD (M)
C1 3.48 9 104 3.90 1.12 9 10�4 2.07 9 104 3.42 1.65 9 10�4
C7 2.24 9 107 2.63 9 104 1.17 9 10�3 2.44 9 10�2 6.05 9 10�1 24.83
C11 3.34 9 102 2.90 9 10�1 8.70 9 10�4 5.95 9 102 2.64 9 10�1 4.43 9 10�4
C13 8.90 9 102 3.31 3.72 9 10�3 7.82 9 102 8.09 9 10�1 1.04 9 10�3
C14 2.78 9 103 2.83 1.02 9 10�3 1.86 9 105 1.65 9 102 8.83 9 10�4
C15 1.26 9 104 1.87 9 102 1.49 9 10�2 3.73 9 104 2.19 9 101 5.88 9 10�4
C16 4.08 9 103 2.65 6.50 9 10�4 4.16 9 102 2.31 9 10�1 5.56 9 10�4
CU-CPT22 2.05 9 103 1.20 9 10�2 5.83 9 10�6 1.65 9 103 8.15 9 10�6 4.93 9 10�9
2273The FEBS Journal 284 (2017) 2264–2283 ª 2017 Federation of European Biochemical Societies
P. Durai et al. Computational identification of TLR2 antagonists

compound C13 is a derivative of urea, substituted by
thiophene and morpholine rings (Fig. 12). The two-
dimensional structures of the compounds other than
C11 and C13 that were included in the experiments
are shown in Fig. 13.
The primary event for TLR2-mediated proinflamma-
tory responses is pathogen recognition by ECDs of the
TLR2 subfamily. Hence, discovering molecules that
may prevent TLR2 activators from binding with ECDs
of TLR2 may hinder the dimerization of ECDs. Subse-
quently, dimerization of the TIR domains will be
obstructed, and thus TLR2 cannot employ MyD88 to
initiate the TLR2 signaling pathway. Consequently,
after screening, we used molecular docking and bind-
ing free energy calculations to select 16 molecules that
may possibly bind to the ECDs of the TLR2–TLR1
dimer. To confirm the direct binding of these 16 com-
pounds with TLR2 and TLR1 ECDs at the molecular
level, SPR analysis was performed, and C11 and C13
were among the best binders (Figs 7 and 8, and
Tables 3–7). The ProteOn GLH sensor chip (Fig. 7) is
used for general amine coupling and has a highly
extended mixed polymer layer, with a maximum bind-
ing capacity for the highest analyte response. The
capacity of this sensor chip is close to that of the CM7
from Biacore. The ProteOn GLM sensor chip (Fig. 8)
is designed for general amine coupling and has an
extended polymer matrix with an intermediate binding
capacity for a high analyte response. The capacity of
the GLM sensor chip is comparable to that of the
CM5 chip from Biacore. The differences between the
GLH and GLM sensor chips lie only in their binding
capacity. In addition, the SPR assay includes several
variable factors, such as the concentration of immobi-
lized proteins, the flow of analytes, flow rate, dissocia-
tion time, association time and the type of buffer used.
In our first experiment using the GLH chip, we immo-
bilized the proteins based on their concentration
(lg�mL�1), which does not consider the number of
molecules on the microchip. Conversely, for the second
SPR analysis using the GLM chip, we immobilized the
proteins based on molarity (140 lM). Thus, these
immobilized recombinant proteins used on the two dif-
ferent sensor chips had different molecular masses.
Fig. 7. The identified TLR2–TLR1 antagonists, and the results of SPR analysis performed on the GLH sensor chip. (A) Two-dimensional
structures of the two nonpeptide TLR2–TLR1 antagonists. (B) The binding kinetics of the compounds with TLR2, measured through SPR.
The binding signals were captured between TLR2 and different concentrations of the compounds. (C) Sensograms show the association
and dissociation of varying concentrations of the compounds with TLR2.
2274 The FEBS Journal 284 (2017) 2264–2283 ª 2017 Federation of European Biochemical Societies
Computational identification of TLR2 antagonists P. Durai et al.

Therefore, the differences in KD values obtained using
these two sensor chips might be due to differences in
the immobilized proteins. The SPR results supported
the possibility that C11 and C13 disrupt TLR2–TLR1
heterodimerization, and their molecular docking poses
suggested the same. As seen in Fig. 6A, C13 forms
strong hydrogen bonds with the backbones of Phe349
and Phe325 of TLR2. Similarly, C11 also forms strong
hydrogen bonds with the backbone of Phe325
(Fig. 6B). As discussed above, Phe349 and Phe325 of
TLR2 are important for Pam3CSK4-induced TLR2–TLR1 heterodimerization.
TLR2
TLR4/MD2
TLR3
CU-CPT22 C11 C13
TLR2
TLR4/MD2
TLR3
TLR2
TLR4/MD2
TLR3
N
HN
NH
O
HN
NO
C11 C13CU-CPT22
HO
HO
O
OOH
O
O
20
40
20
0
–120 –80 –40 0 40 80 120 160 200 240 280 –120
20
10
0
–10–80 –40 0 40 80 120 160 200 240 280
–120
20
10
0
–10–80 –40 0 40 80 120 160 200 240 280
–120
20
10
0
–80 –40 0 40 80 120 160 200 240 280
40
20
0
–120 –80 –40 0 40 80 120 160 200 240 28040
20
0
–120 –80 –40 0 40 80 120 160 200 240 280
Res
pons
e (R
U)
Res
pons
e (R
U)
Res
pons
e (R
U)
Res
pons
e (R
U)
Res
pons
e (R
U)
Res
pons
e (R
U)
Res
pons
e (R
U)
Res
pons
e (R
U)
Res
pons
e (R
U)
–100 0 100 200 300
–100 0 100 200 300
–100 0 100Time (s) Time (s) Time (s)
200 300
0
20
0
20
0
O O
OS
HN
HN
N
O
0 μM5102550100
μM
μMμM
μMμM
0 μM5102550100
μM
μMμM
μMμM
0 μM5102550100
μM
μMμM
μMμM
0 μM5102550100
μM
μMμM
μMμM
0 μM5102550100
μM
μMμM
μMμM
0 μM5102550100
μM
μMμM
μMμM
0 μM5102550100
μM
μMμM
μMμM
0 μM5102550100
μM
μMμM
μMμM
0 μM5102550100
μM
μMμM
μMμM
A
B
Fig. 8. The identified TLR2–TLR1 antagonists, and the results of SPR analysis performed on the GLM sensor chip. (A) Sensograms show
the association and dissociation of varying concentrations of the compounds with TLR2, TLR4-MD2 and TLR3. (B) Two-dimensional
structures of CU-CPT22, C11 and C13.
Table 6. Dose-dependent SPR analysis of C11 and C13, and the
positive control, CU-CPT22, on the GLM sensor chip. RUs of the
compounds are given.
Target Dose (lM)
RU
CU-CPT22 C11 C13
Recombinant TLR2 0 0 0 0
5 4.89 2.56 1.12
10 6.01 2.96 1.97
25 8.58 6.14 3.56
50 12.16 13.85 9.42
100 13.06 29.71 17.48
Recombinant
TLR4–MD2 complex
0 0 0 0
5 0 0 0
10 0 0 0
25 0 0 0
50 3.43 3.82 3.48
100 4.14 5.27 4.21
Recombinant TLR3 0 0 0 0
5 0 0 0
10 0 0 0
25 0 0 0
50 3.7 2.68 3.42
100 3.44 4.06 3.52
Table 7. Langmuir-kinetic analysis for TLR2. SPR binding affinities
of C11 and C13, along with the positive control, CU-CPT22, on the
GLM sensor chip. The association rate (Ka), dissociation rate (Kd)
and binding affinity constant (KD) of the compounds when tested
with TLR2 are given.
Analyte Ka (Ms�1) Kd (s�1) KD (M)
CU-CPT22 1.27 9 105 1.63 1.28 9 10�5
C11 1.53 9 102 2.31 9 10�1 1.51 9 10�3
C13 4.13 9 103 8.03 9 10�1 1.94 9 10�4
2275The FEBS Journal 284 (2017) 2264–2283 ª 2017 Federation of European Biochemical Societies
P. Durai et al. Computational identification of TLR2 antagonists

During the Pam3CSK4-induced TLR2 activation,
one of the main proinflammatory cytokines to be
secreted is IL-8. Accordingly, we measured the level
of IL-8 inhibition by each of the 16 compounds in
HEK293-hTLR2 cells. C11 and C13 were two of the
compounds that reasonably reduced IL-8 release
(Figs 9 and 10A). As a control for HEK293-hTLR2
cells, HEK293-Null cells were also used to estimate
the Pam3CSK4-induced IL-8 secretion (Fig. 11A). As
expected, no TLR2-activated IL-8 production in
HEK293-Null cells was observed. The compounds
C11 and C13 have passed the tests for exhibiting
drug-like properties in computational screening, and
these molecules were also confirmed to be nontoxic in
MTS assay (Fig. 10B). TLR inhibitors can be TLR-
specific or species-specific. Thus, to evaluate the speci-
ficity of C11 and C13, we tested them in mouse
macrophage-like RAW 264.7 cells also with the pres-
ence of TLR2–TLR6 (FSL-1), TLR3 [Poly (I : C)]
and TLR4 (LPS) agonists (Fig. 11B). Surprisingly,
C11 and C13 effectively reduced the production of
Pam3CSK4-induced TNF-a in RAW 264.7 cells
(Fig. 11B). Moreover, C11 and C13 did not suppress
TNF-a induced by TLR4 and TLR3. C13 seems to
reduce the level of TNF-a activated by FSL-1, but
not effectively. Similarly, C11 almost did not inhibit
the TNF-a induced by FSL-1. Hence, C11 and C13
are potent TLR2–TLR1 antagonists and are active
against both human and mouse cells. At present, low
molecular mass TLR2 antagonists such as CU-
CPT22, compound 2 and compound 1 are believed to
target the ECDs of TLR2–TLR1 [42–44]. However,
to our knowledge, none of them have been clinically
approved as a drug.
The TLR2–TLR1 inhibitory activities of C11 and
C13 are comparable to the previously known molecules
(Fig. 12). Our results showed that the TNF-a reduction
in RAW 264.7 cells by 10 lM of the molecules C13,
CU-CPT22 and C11 was 56%, 73% and 48%, respec-
tively (Fig. 11B). Likewise, at 10 lM, IL-8 suppression
by the compounds C13, CU-CPT22 and C11 in
HEK293-hTLR2 cells was 47%, 52% and 33%, respec-
tively (Fig. 11A). At 15 lM, the already known TLR2–TLR1 inhibitor compound 2 reduced only 16.46% of
TLR2–TLR1-dependent nuclear factor-jB activity [43].
However, the IC50 value of compound 2 was around
3.3 lM, when it decreased the TNF-a production in
human monocytes [43]. The other known TLR2–TLR1
antagonist, a natural product-like compound 1, inhibits
around half of the Pam3CSK4-induced TNF-a and IL-
6 secretion at 4 lM in RAW 264.7 cells [44]. As seen in
Fig. 12, the structures of C11 and C13 vary consider-
ably from those of already reported TLR2–TLR1
antagonists. C13 is a derivative of urea substituted by
thiophene and morpholine rings, and C11 has a pyra-
zole ring connected to piperazin-2-one through an
amide linkage. However, compound 1 has two indole
rings connected by an amide linkage, and compound 2
is the derivative of urea substituted with naphthol and
benzene rings, whereas CU-CPT22 is an anti-aromatic
compound with hydroxyl, carbonyl and ester func-
tional groups on the ring. Overall, this study has identi-
fied two potential TLR2 antagonists, C11 and C13,
that are required at micromolar concentrations to
effectively inhibit TLR2 signaling. These structurally
distinct nonpeptide molecules may be valuable thera-
peutics or may assist in the design of an effective drug
to treat TLR2-related inflammatory diseases.
0
500
1000
1500
2000
2500
3000
3500
4000
4500IL
-8 se
cret
ion
(pg·
mL
–1)
C2 C3 C4 C5 C6 C7 C8 C9 C10
**
* ***
* * ** * **
**
** * **
HEK293-hTLR2
C1
1 5 1 5 1 5 1 5 1 5 1 5 1 5 1 5 1 5 1 5 1 5 1 5 1 5 1 5 1 5 1 5
C11 C12 C13 C14 C15 C16
Fig. 9. Initial screening of compounds for TLR2-induced cytokine response. HEK293-hTLR2 cells were co-treated with Pam3CSK4 (50 nM)
and the compounds (at 1 and 5 lM) for 24 h. IL-8 secretion was detected by ELISA. All data shown represent the mean � SEM of three
independent experiments (*P < 0.05, **P < 0.01).
2276 The FEBS Journal 284 (2017) 2264–2283 ª 2017 Federation of European Biochemical Societies
Computational identification of TLR2 antagonists P. Durai et al.

Materials and methods
Computational mutation scanning and
pharmacophore modeling
The 2Z7X (TLR2–TLR1–Pam3CSK4) structure was
obtained from PDB. The co-crystallized ligands, except
Pam3CSK4 and water molecules, were removed, and hydro-
gen atoms were added to the structure [45]. The module
Calculate Mutation Energy (Binding) in Accelrys DS 4.0
software (Accelrys Software Inc.) was used to assess the
effect of single-point mutations in the Pam3CSK4 binding
site of 2Z7X. Mutation energies were calculated as a total
of scaled van der Waals, electrostatic, entropic and nonpo-
lar terms. To create a receptor–ligand-based model, we
used the Receptor–ligand Pharmacophore Generation
protocol to create pharmacophore features, by targeting
the lipopeptide binding site of 2Z7X with the default
parameters. Because key residues were known from previ-
ous studies, all matching features from the resulting phar-
macophore models based on genetic function
approximations [46] were edited, and five significant fea-
tures were selected to build the receptor–ligand-basedmodel (Fig. 3).
0
1000
2000
3000
4000
5000
6000
7000
IL-8
sec
retio
n (p
g·m
L–1)
C1μM 51 μM 10 μM
C7 C11 C12 C13 C14 C16
**
* * *
**
**
***
****
**
*
*** *
A
0
20
40
60
80
100
120
Cel
l via
bilit
y (%
)
C1 C7 C11 C12 C13 C14 C16
B
10 μM
10 μM
μM 51 μM 10 μM μM 51 μM 10 μM μM 51 μM 10 μM μM 51 μM 10 μM μM 51 μM 10 μM μM 51 μM 10 μM μM 51 μM 10 μM
μM 51 μM 10 μM μM 51 μM 10 μM μM 51 μM 10 μM μM 51 μM 10 μM μM 51 μM 10 μM μM 51 μM 10 μM
Fig. 10. Dose-dependent TLR2 inhibitory effects and cytotoxic properties of the identified TLR2–TLR1 antagonists. HEK293-hTLR2 cells
were first treated with the compounds at three different concentrations (1, 5 and 10 lM) for 1 h, and then with 50 nM of Pam3CSK4. (A)
After 24 h, culture supernatants were collected and IL-8 secretion was measured with an ELISA kit. The experiments were conducted
independently (n = 3) and are shown as mean � SD (n = 1, *P < 0.05 or **P < 0.01). (B) After 24 h, cell viability was determined by
measuring the optical density at 490 nm with CellTiter 96 AQueous One Solution Cell Proliferation Assay (MTS). The percentage of cell
viability compared with control is presented in the bar graph; data are shown as the mean � SEM of independent experiments (n = 3).
2277The FEBS Journal 284 (2017) 2264–2283 ª 2017 Federation of European Biochemical Societies
P. Durai et al. Computational identification of TLR2 antagonists

The two ligand-based pharmacophore models were cre-
ated based on the structures of three known small-molecule
TLR2 agonists [26]. The two-dimensional structures of these
small molecules were drawn with CHEMBIODRAW ULTRA (Cam-
bridgeSoft, Cambridge, MA, USA), and converted into
three-dimensional structures. The energy was minimized with
the CHARMM [47] force field using default parameters in DS
4.0. We looked for HBD, HBA and HYD features, with the
Common Feature Pharmacophore Generation protocol, and
generated ligand-based models 1 and 2 with compounds A
and B, respectively (Fig. 4). The pharmacophore models
were created with features considered extremely selective,
based on genetic function approximations.
Pharmacophore-based database search and
isolation of drug-like molecules
The Search 3D Database segment in DS 4.0 was used to
retrieve hits from our in-house virtual library, of approxi-
mately seven million commercially available molecules. A
receptor–ligand-based model and two ligand-based pharma-
cophore models were used as inputs. The hits that mapped
to at least four features for receptor–ligand-based model
and hits that mapped to all five features for the ligand-
based models were obtained through the Best Search
method, with one conformation of each ligand as output.
The resulting hits from the ligand-based models were fur-
ther ranked according to the similarity of their molecular
shape and atom types to those of the query molecule, with
the ROCS_Tanimoto-Combo scoring function [32] and
default settings. To test the drug-like properties of the
resulting 3500 hit molecules, we applied filters such as Lip-
inski [34] and Veber [35] rules, and ADMET [33] proper-
ties, with the Filter Ligands and Calculate Molecular
Properties protocols in DS 4.0.
Structure preparation and molecular docking
The TLR2–TLR1 structure, prepared for mutational bind-
ing energy calculations, was used for molecular docking,
0
500
1000
1500
2000
2500
TN
F-α
secr
etio
n (p
g m
L–1
)
******
**
****
**
Control C11(10 µM)
-
Pam3CSK4 (50 nM) FSL-1 (100 ng mL–1) Poly(I:C) (10 µg mL–1) LPS (100 ng mL–1)
**
**
RAW 264.7B
TLR2-TLR1
TLR2-TLR6
TLR3
TLR4
C13(10 µM)
C11(10 µM)
- C13(10 µM)
C11(10 µM)
- C13(10 µM)
C11(10 µM)
- C13(10 µM)
0
1000
2000
3000
4000
5000
IL-8
sec
retio
n (p
g m
L–1
)
HEK293-hTLR2HEK293-Null
****
Control - CU-CPT22(10 µM)
C11(10 µM)
C13(10 µM)
Pam3CSK4 (50 nM)
A
· · ·
·
·
Fig. 11. Cytokine inhibitory effects of C11 and C13 in human and mouse cells. (A) HEK293-hTLR2 and HEK293-Null cells were pretreated
with 10 lM of CU-CPT22, C11 and C13 for 1 h, and then with 50 nM of Pam3CSK4. After 24 h, culture supernatants were collected and IL-8
secretion was measured with an ELISA kit. (B) The expression level of TNF-a secretion was measured by ELISA assay when the
compounds CU-CPT22, C11 and C13 were co-treated with TLR2/TLR1 (Pam3CSK4), TLR2/6 (FSL-1), TLR3 [Poly (I : C)] or TLR4 (LPS)
agonists in RAW 264.7 cells. CU-CPT22 was used as a positive control. The data shown represent at least three independent experiments
(n ≥ 3), and bars represent means � SEM (**P < 0.01).
2278 The FEBS Journal 284 (2017) 2264–2283 ª 2017 Federation of European Biochemical Societies
Computational identification of TLR2 antagonists P. Durai et al.

Fig. 12. Two-dimensional structures of the already reported and identified TLR2–TLR1 antagonists.
Fig. 13. Two-dimensional structures of the compounds, aside from C11 and C13, that were included in the experiments.
2279The FEBS Journal 284 (2017) 2264–2283 ª 2017 Federation of European Biochemical Societies
P. Durai et al. Computational identification of TLR2 antagonists

and ligands were prepared with the Prepare Ligand module
in DS 4.0. The lipopeptide binding site was chosen for
docking, as shown in Fig. 3A. Duplicates were removed
from the selected 1126 hit molecules, and isomers and tau-
tomers were enumerated. The 3703 conformers were
docked into the defined binding site with CD [37] imple-
mented in DS 4.0 using the default settings, but with one
top pose per ligand. CD is a grid-based molecular docking
method that generates random ligand conformations that
are later refined through MD simulated annealing using the
CHARMM force field.
The top 100 poses for ~ 60 compounds were chosen
based on the CD interaction energy. The compounds were
redocked with AD Vina [38] implemented in YASARA STRUC-
TURE [48]. The 2Z7X structure was used after the water
molecules and ligands were removed. The entire lipopeptide
binding site was set as a grid in the receptor, and saved in
SCE format, whereas the ligands were converted into PDB
format and saved. The dock_runscreening protocol was
applied in YASARA STRUCTURE. Each ligand was given 25
docking runs; using the dock_play protocol, we retrieved
the best-docked conformation for each ligand molecule,
based on the AD affinity energy value. All images were
generated using the program DS 4.0.
MD simulations and binding free energy
calculations
MD simulations were performed using the GROMACS pro-
gram version 4.6 [49] for the selected 18 protein–liganddocking complexes. The SwissParam online server [50] was
used to determine the CHARMM27 force field [51] for the
ligand molecules. The proteins and ligands were solvated
with the SPC216 water model, periodic boundary condi-
tions were applied in all directions, and the total charge of
the system was neutralized. The energy minimization steps
were carried out with a steepest descent and conjugate gra-
dient algorithm with a tolerance of 1000 kJ�mol�1�nm�1
(maximum of 100 runs with 0.01 nm as the energy step
size). For long-range interactions, the particle mesh Ewald
method [52] was used with a 1.2 nm cutoff, and a Fourier
spacing of 0.16 nm. The electrostatic cutoff was set to
1.0 nm, and the van der Waals cutoff was set to 1.4 nm.
The solvated and minimized systems were visualized and
inspected before further simulation steps. The bond angles
and water molecules were restrained with the LINCS and SET-
TLE algorithms [53], respectively. The Parrinello–Rahman
method was used to set the pressure (1 atm) of the system,
and the V-rescale weak coupling method was used to regu-
late the temperature (310 K). The position restraints in the
MD simulations for NVT and NPT were carried out for
100 ps, with a production run of 1 ns for each protein–ligand complex, and a time step of 2 fs. The structural
coordinates were saved for every 2 ps, and final snapshots
of the complexes were extracted with the GROMACS analysis
tool. To quantify the thermodynamic interaction of the
complexes of TLR2–TLR1 and small molecules, we used
the MM/PBSA method [54] with the G_MMPBSA tool [55] to
compute the ligand–protein intermolecular energy without
strain entropy based on the MD structure ensemble.
Surface plasmon resonance analysis
Surface plasmon resonance experiments were performed on
a ProteOn XPR36 instrument (Bio-Rad Laboratories, Inc.,
Hercules, CA, USA) with ProteOn GLH and GLM sensor
chips. Phosphate-buffered saline supplemented with 0.1%
Tween 20 (PBST containing 2% DMSO) was used as
running buffer, and 10 mM HCl or PBST 0.1% for regener-
ation. Human recombinant proteins TLR2, TLR1, TLR4–MD2 complex and TLR3 (R&D systems, Minneapolis,
MN, USA) were immobilized by amine coupling onto sur-
faces of a GLH or/and GLM sensor chips. We immobilized
140 lM of recombinant TLR2, TLR1, TLR4–MD2 com-
plex and TLR3 proteins on a GLM sensor chip. On a Pro-
teOn GLH or GLM sensor chip, up to six proteins can be
immobilized at a time in separate regions. In our study, all
the recombinant proteins were immobilized on one sensor
chip at the same time. Varying concentrations of the mole-
cules were injected into the chip, to check their binding
with the immobilized proteins. Running buffer was injected
into the empty channel as a reference. On the ProteOn
GLH sensor chip, the dissociation was monitored for
5 min, and the chip was regenerated for the second round.
The experiments were performed in duplicate using freshly
prepared reagents. The ProteOn manager software (version
2.0) was used to analyze the data. The binding curves were
processed for the starting injection alignment and for the
baseline. A reference-subtracted sensogram was fitted glob-
ally to the curves describing a homogeneous 1: 1 Langmuir
bimolecular reaction model. The data from the four protein
surfaces were grouped together to fit the kinetic rate con-
stants (Ka and Kd). The binding constant, KD, was calcu-
lated using the following equation: KD = Kd/Ka. We
performed the SPR experiments for C11 and C13 on a Pro-
teOn GLH sensor chip and the concentrations were
100 lM, 200 lM, and varying concentrations (0, 50, 100,
200 and 400 lM). For C11 and C13 on the ProteOn GLM
sensor chip, the concentrations were 0, 5, 10, 25, 50 and
100 lM. The conditions followed when using the GLM sen-
sor chip were 100 lL injection volume, 100 lL�min�1 flow
rate, 200-s dissociation, 20-s flow stabilization and 60-s
duration.
Cell culture and treatments
HEK293-hTLR2, HEK293-Null (Invivogen, San Diego,
CA, USA) and RAW 264.7 (Korean Cell Line Bank, Seoul,
Korea) cell lines were cultured in Dulbecco’s modified
Eagle’s medium (DMEM) with low glucose, and DMEM
2280 The FEBS Journal 284 (2017) 2264–2283 ª 2017 Federation of European Biochemical Societies
Computational identification of TLR2 antagonists P. Durai et al.

growth medium containing 10% fetal bovine serum and
1% penicillin/streptomycin (Thermo Fisher Scientific, Wal-
tham, MA, USA), respectively. Cells were incubated at
37 °C in an atmosphere of 5% CO2 (Thermo Fisher Scien-
tific). The compounds were dissolved in dimethyl sulfoxide
(Sigma-Aldrich, St Louis, MO, USA) in brown tubes and
stored at a concentration of 10 mM.
IL-8 and TNF-a secretion assays
The concentrations of IL-8 and TNF-a in the super-
natants of the culture media were determined using com-
mercially available ELISA kits (eBioscience, San Diego,
CA, USA). First, HEK293-hTLR2, HEK293-Null and
RAW 264.7 cells were dispensed into 96-well plates, and
treated with control CU-CPT22 (10 lM) and the com-
pounds (1, 5 and 10 lM) for 1 h, and then were stimulated
with Pam3CSK4 (50 nM), FSL-1 (100 ng�mL�1), Poly
(I : C) (10 lg�mL�1) and LPS (100 ng�mL�1) for 24 h.
Cell culture supernatants were collected and added to an
antibody-coated microplate, to capture human IL-8 and
mouse TNF-a. The plates were then maintained at room
temperature for 2 h. Next, the plates were washed five
times, a biotin-conjugated detecting antibody was added
to each well, and the plates were further incubated at
room temperature for 1 h. After incubation, the plates
were washed five times and incubated with avidin–horse-radish peroxidase for 30 min. Finally, detection was car-
ried out with 3,30,5,50-tetramethylbenzidine solution, by
measuring absorbance at 450 nm with an ELISA reader,
and analyzed using SOFTMAX PRO 5.3 software (Molecular
Devices, Sunnyvale, CA, USA).
Cell viability assay
The CellTiter 96 AQueous One Solution Cell Proliferation
Assay (MTS; Promega Corp., Madison, WI, USA) was
used to determine cell viability. HEK293-hTLR2 cells were
seeded into 96-well plates (BD Biosciences, San Diego, CA,
USA), grown overnight, and treated with 50 nM Pam3CSK4
(Invivogen), 10 lM CU-CPT22 (Tocris, Bristol, UK), and
the 16 compounds (at 1, 5 and 10 lM) for 24 h. Next, the
treated and untreated HEK293-hTLR2 cells were incubated
with the MTS solution (10 lL per well) for 3 h in a humid-
ified atmosphere containing 5% CO2 at 37 °C. Then, cell
viability was measured using a microplate spectrophotome-
ter system (Molecular Devices) at a wavelength of 490 nm.
Statistical analysis
The statistical analyses were performed by one-way
ANOVA using SIGMAPLOT software, version 12.0 (Systat
Software Inc., San Jose, CA, USA). For multiple compar-
isons, Turkey’s test was applied. All experiments were
repeated independently at least three times. Statistical
significance was defined as a P-value of *P < 0.05 and
**P < 0.01.
Acknowledgements
This work was supported by the Mid-Career
Researcher Program through the National Research
Foundation of Korea, funded by the Ministry of Edu-
cation, Science, and Technology (NRF-
2015R1A2A2A09001059), and by a grant from the
Korea Health Technology R&D Project through the
Korea Health Industry Development Institute
(HI14C1992). This work was also partially supported
by a grant from the National Research Foundation of
Korea (NRF 2012-0006687).
Author contributions
PD and SC planned the experiments. PD, H-JS, AA,
H-KK, RGG, SP, DY and JC performed the experi-
ments. PD and RGG analyzed the data. KTN and SC
contributed reagents. PD and SC wrote the
manuscript.
References
1 Kawai T & Akira S (2010) The role of pattern-
recognition receptors in innate immunity: update on
Toll-like receptors. Nat Immunol 11, 373–384.2 Kondo T, Kawai T & Akira S (2012) Dissecting
negative regulation of Toll-like receptor signaling.
Trends Immunol 33, 449–458.3 Roach JC, Glusman G, Rowen L, Kaur A, Purcell
MK, Smith KD, Hood LE & Aderem A (2005) The
evolution of vertebrate Toll-like receptors. Proc Natl
Acad Sci USA 102, 9577–9582.4 Kumar H, Kawai T & Akira S (2011) Pathogen
recognition by the innate immune system. Int Rev
Immunol 30, 16–34.5 Heil F, Hemmi H, Hochrein H, Ampenberger F,
Kirschning C, Akira S, Lipford G, Wagner H & Bauer
S (2004) Species-specific recognition of single-stranded
RNA via toll-like receptor 7 and 8. Science 303, 1526–1529.
6 Govindaraj RG, Manavalan B, Basith S & Choi S
(2011) Comparative analysis of species-specific ligand
recognition in Toll-like receptor 8 signaling: a
hypothesis. PLoS ONE 6, e25118.
7 Kang JY & Lee JO (2011) Structural biology of the Toll-
like receptor family. Annu Rev Biochem 80, 917–941.8 Akira S & Takeda K (2004) Toll-like receptor
signalling. Nat Rev Immunol 4, 499–511.9 Botos I, Segal DM & Davies DR (2011) The structural
biology of Toll-like receptors. Structure 19, 447–459.
2281The FEBS Journal 284 (2017) 2264–2283 ª 2017 Federation of European Biochemical Societies
P. Durai et al. Computational identification of TLR2 antagonists
10 Tanji H, Ohto U, Shibata T, Miyake K & Shimizu T
(2013) Structural reorganization of the Toll-like
receptor 8 dimer induced by agonistic ligands. Science
339, 1426–1429.11 Yoon SI, Kurnasov O, Natarajan V, Hong M, Gudkov
AV, Osterman AL & Wilson IA (2012) Structural basis
of TLR5-flagellin recognition and signaling. Science
335, 859–864.12 Song W, Wang J, Han Z, Zhang Y, Zhang H, Wang
W, Chang J, Xia B, Fan S, Zhang D et al. (2015)
Structural basis for specific recognition of single-
stranded RNA by Toll-like receptor 13. Nat Struct Mol
Biol 22, 782–787.13 Koymans KJ, Feitsma LJ, Brondijk TH, Aerts PC,
Lukkien E, Lossl P, vanKessel KP, de Haas CJ, van Strijp
JA&Huizinga EG (2015) Structural basis for inhibition
of TLR2 by staphylococcal superantigen-like protein 3
(SSL3). Proc Natl Acad Sci USA 112, 11018–11023.14 Ohto U, Shibata T, Tanji H, Ishida H, Krayukhina E,
Uchiyama S, Miyake K & Shimizu T (2015) Structural
basis of CpG and inhibitory DNA recognition by Toll-
like receptor 9. Nature 520, 702–705.15 Kanzler H, Barrat FJ, Hessel EM & Coffman RL
(2007) Therapeutic targeting of innate immunity with
Toll-like receptor agonists and antagonists. Nat Med
13, 552–559.16 Manavalan B, Basith S & Choi S (2011) Similar
structures but different roles - An updated perspective
on TLR structures. Front Physiol 2, 41.
17 Oliveira-Nascimento L, Massari P & Wetzler LM
(2012) The role of TLR2 in infection and immunity.
Front Immunol 3, 79.
18 Jin MS, Kim SE, Heo JY, Lee ME, Kim HM, Paik
SG, Lee H & Lee JO (2007) Crystal structure of the
TLR1-TLR2 heterodimer induced by binding of a tri-
acylated lipopeptide. Cell 130, 1071–1082.19 Kang JY, Nan X, Jin MS, Youn SJ, Ryu YH, Mah S,
Han SH, Lee H, Paik SG & Lee JO (2009) Recognition
of lipopeptide patterns by Toll-like receptor 2-Toll-like
receptor 6 heterodimer. Immunity 31, 873–884.20 Govindaraj RG, Manavalan B, Lee G & Choi S (2010)
Molecular modeling-based evaluation of hTLR10 and
identification of potential ligands in Toll-like receptor
signaling. PLoS ONE 5, e12713.
21 Guan Y, Ranoa DR, Jiang S, Mutha SK, Li X, Baudry
J & Tapping RI (2010) Human TLRs 10 and 1 share
common mechanisms of innate immune sensing but not
signaling. J Immunol 184, 5094–5103.22 Gosu V, Basith S, Durai P & Choi S (2012) Molecular
evolution and structural features of IRAK family
members. PLoS ONE 7, e49771.
23 Kawai T & Akira S (2006) TLR signaling. Cell Death
Differ 13, 816–825.24 O’Neill LA, Bryant CE & Doyle SL (2009) Therapeutic
targeting of Toll-like receptors for infectious and
inflammatory diseases and cancer. Pharmacol Rev 61,
177–197.25 Zuany-Amorim C, Hastewell J & Walker C (2002) Toll-
like receptors as potential therapeutic targets for
multiple diseases. Nat Rev Drug Discov 1, 797–807.26 Guan Y, Omueti-Ayoade K, Mutha SK, Hergenrother
PJ & Tapping RI (2010) Identification of novel
synthetic toll-like receptor 2 agonists by high
throughput screening. J Biol Chem 285, 23755–23762.27 Wolber G & Langer T (2005) LigandScout: 3-D
pharmacophores derived from protein-bound ligands
and their use as virtual screening filters. J Chem Inf
Model 45, 160–169.28 Shoichet BK (2004) Virtual screening of chemical
libraries. Nature 432, 862–865.29 Wang X, Smith C & Yin H (2013) Targeting Toll-like
receptors with small molecule agents. Chem Soc Rev 42,
4859–4866.30 Wells JA & McClendon CL (2007) Reaching for high-
hanging fruit in drug discovery at protein-protein
interfaces. Nature 450, 1001–1009.31 Kajava AV & Vasselon T (2010) A network of
hydrogen bonds on the surface of TLR2 controls ligand
positioning and cell signaling. J Biol Chem 285, 6227–6234.
32 Hawkins PC, Skillman AG & Nicholls A (2007)
Comparison of shape-matching and docking as virtual
screening tools. J Med Chem 50, 74–82.33 van de Waterbeemd H & Gifford E (2003) ADMET in
silico modelling: towards prediction paradise? Nat Rev
Drug Discov 2, 192–204.34 Lipinski CA, Lombardo F, Dominy BW & Feeney PJ
(2001) Experimental and computational approaches to
estimate solubility and permeability in drug discovery
and development settings. Adv Drug Deliv Rev 46, 3–26.35 Veber DF, Johnson SR, Cheng HY, Smith BR, Ward
KW & Kopple KD (2002) Molecular properties that
influence the oral bioavailability of drug candidates.
J Med Chem 45, 2615–2623.36 Kitchen DB, Decornez H, Furr JR & Bajorath J (2004)
Docking and scoring in virtual screening for drug
discovery: methods and applications. Nat Rev Drug
Discov 3, 935–949.37 Wu G, Robertson DH, Brooks CL 3rd & Vieth M
(2003) Detailed analysis of grid-based molecular
docking: a case study of CDOCKER-A CHARMm-
based MD docking algorithm. J Comput Chem 24,
1549–1562.38 Trott O & Olson AJ (2010) AutoDock Vina: improving
the speed and accuracy of docking with a new scoring
function, efficient optimization, and multithreading.
J Comput Chem 31, 455–461.39 Liew FY, Xu D, Brint EK & O’Neill LA (2005)
Negative regulation of toll-like receptor-mediated
immune responses. Nat Rev Immunol 5, 446–458.
2282 The FEBS Journal 284 (2017) 2264–2283 ª 2017 Federation of European Biochemical Societies
Computational identification of TLR2 antagonists P. Durai et al.

40 Lahiri A, Das P & Chakravortty D (2008) Engagement
of TLR signaling as adjuvant: towards smarter vaccine
and beyond. Vaccine 26, 6777–6783.41 Durai P, Govindaraj RG & Choi S (2013) Structure
and dynamic behavior of Toll-like receptor 2 subfamily
triggered by malarial glycosylphosphatidylinositols of
Plasmodium falciparum. FEBS J 280, 6196–6212.42 Cheng K, Wang X, Zhang S & Yin H (2012) Discovery
of small-molecule inhibitors of the TLR1/TLR2
complex. Angew Chem Int Ed Engl 51, 12246–12249.43 Murgueitio MS, Henneke P, Glossmann H, Santos-
Sierra S & Wolber G (2014) Prospective virtual screening
in a sparse data scenario: design of small-molecule TLR2
antagonists. ChemMedChem 9, 813–822.44 Zhong Z, Liu LJ, Dong ZQ, Lu L, Wang M, Leung
CH, Ma DL & Wang Y (2015) Structure-based
discovery of an immunomodulatory inhibitor of TLR1-
TLR2 heterodimerization from a natural product-like
database. Chem Commun (Camb) 51, 11178–11181.45 Spassov VZ & Yan L (2008) A fast and accurate
computational approach to protein ionization. Protein
Sci 17, 1955–1970.46 Rogers D & Hopfinger AJ (1994) Application of
genetic function approximation to quantitative
structure-activity relationships and quantitative
structure-property relationships. J Chem Inf Comput Sci
34, 854–866.47 Brooks BR, Brooks CL 3rd, Mackerell AD Jr, Nilsson
L, Petrella RJ, Roux B, Won Y, Archontis G, Bartels
C, Boresch S et al. (2009) CHARMM: the biomolecular
simulation program. J Comput Chem 30, 1545–1614.48 Krieger E, Koraimann G & Vriend G (2002) Increasing
the precision of comparative models with YASARA
NOVA–a self-parameterizing force field. Proteins 47,
393–402.49 Pronk S, Pall S, Schulz R, Larsson P, Bjelkmar P,
Apostolov R, Shirts MR, Smith JC, Kasson PM, van
der Spoel D et al. (2013) GROMACS 4.5: a high-
throughput and highly parallel open source molecular
simulation toolkit. Bioinformatics 29, 845–854.50 Zoete V, Cuendet MA, Grosdidier A & Michielin O
(2011) SwissParam: a fast force field generation tool for
small organic molecules. J Comput Chem 32, 2359–2368.
51 Vanommeslaeghe K, Hatcher E, Acharya C, Kundu S,
Zhong S, Shim J, Darian E, Guvench O, Lopes P,
Vorobyov I et al. (2010) CHARMM general force field:
a force field for drug-like molecules compatible with the
CHARMM all-atom additive biological force fields.
J Comput Chem 31, 671–690.52 Cerutti DS, Duke RE, Darden TA & Lybrand TP
(2009) Staggered Mesh Ewald: an extension of the
Smooth Particle-Mesh Ewald method adding great
versatility. J Chem Theory Comput 5, 2322.
53 Hess B, Bekker H, Berendsen HJC & Fraaije JGEM
(1997) LINCS: a linear constraint solver for molecular
simulations. J Comput Chem 18, 1463–1472.54 Kollman PA, Massova I, Reyes C, Kuhn B, Huo S,
Chong L, Lee M, Lee T, Duan Y, Wang W et al.
(2000) Calculating structures and free energies of
complex molecules: combining molecular mechanics
and continuum models. Acc Chem Res 33, 889–897.55 Kumari R, Kumar R, Open Source Drug Discovery
Consortium& Lynn A (2014) g_mmpbsa–a GROMACS
tool for high-throughput MM-PBSA calculations.
J Chem Inf Model 54, 1951–1962.
2283The FEBS Journal 284 (2017) 2264–2283 ª 2017 Federation of European Biochemical Societies
P. Durai et al. Computational identification of TLR2 antagonists