tom mcinerney president & ceo september 4,...
TRANSCRIPT

©2014 Genworth Financial, Inc. All rights reserved.
Scotiabank Financials Summit 2014 Tom McInerney President & CEO September 4, 2014

Agenda Introduction To Genworth Financial
Strategic Priorities & Vision
U.S. Life Insurance Division
Global Mortgage Insurance Division
Holding Company & Non-Core Businesses
Scotiabank Financials Summit 2014 September 4, 2014 1

2 Scotiabank Financials Summit 2014 September 4, 2014
This presentation contains certain “forward-looking statements” within the meaning of the United States Private Securities Litigation Reform Act of 1995. Forward-looking statements may be identified by words such as “expects,” “anticipates,” “intends,” “plans,” “believes,” “seeks,” “estimates,” “will” or words of similar meaning and include, but are not limited to, statements regarding the outlook for Genworth Financial, Inc.’s (Genworth) and its consolidated subsidiaries’ future business and financial performance. Forward-looking statements are based on management’s current expectations and assumptions, which are subject to inherent uncertainties, risks and changes in circumstances that are difficult to predict. Actual outcomes and results may differ materially due to global political, economic, business, competitive, market, regulatory and other factors and risks, including those discussed at the end of this presentation, as well as in the risk factors section of Genworth’s Annual Report on Form 10-K, filed with the United States Securities and Exchange Commission (SEC) on March 3, 2014, and updated on Form 10-Q on July 30, 2014. Genworth undertakes no obligation to publicly update any forward-looking statement, whether as a result of new information, future developments or otherwise.
Non-GAAP And Other Items
All financial data is as of June 30, 2014 unless otherwise noted. For important information regarding the use of non-GAAP and selected operating performance measures, see the Appendix. Unless otherwise noted, all references in this presentation to net income should be read as net income available to Genworth’s common stockholders.
Cautionary Note Regarding Forward-Looking Statements
Portions of this presentation should be used in conjunction with the accompanying audio or call transcript.

Who Is Genworth Financial?
3 Scotiabank Financials Summit 2014 September 4, 2014
Genworth Financial, Inc. (NYSE: GNW) Is A Leading Fortune 500 Insurance Holding Company Committed To Helping Families Become More Financially Secure, Self-Reliant And Prepared For The Future. Genworth Has Leadership Positions In Long Term Care Insurance (LTC) And Mortgage Insurance (MI) And Competitive Offerings In Life Insurance And Fixed Annuities That Assist Consumers In Solving Their Insurance, Retirement And Home Ownership Needs.

Scotiabank Financials Summit 2014 September 4, 2014 4
Strategic Priority & Objectives
Strategic Priority Rebuild Value For Shareholders
Objectives
Improve Business Performance Simplify Business Portfolio Generate Capital Increase Financial Strength & Flexibility
Business Goals Align With Strategic Objectives

5 Scotiabank Financials Summit 2014 September 4, 2014
Two Core Businesses: Leading Global Mortgage Insurer U.S. Life Insurer With Top Leadership Position In LTC & Competitive Positions In Life & Fixed Annuities
Non-Core Businesses (International Protection & Runoff) Being Managed To Enhance & Generate Capital
Strategic Vision
Distinct Strategic Advantages Have Leadership Market Positions
Maintain Competitive Customer Service & Distribution Relationships
Employ Experienced & Talented Workforce
Operating Priorities Generate Cash
Generate New Business Returns In Excess Of Related Cost Of Capital
Improve In Force Performance
Focus On Rebuilding Shareholder Value
Independent Businesses Achieve Competitive Performance
Support Own Infrastructure Costs
Cover Appropriate Share Of Debt Service & Dividends
Increase Financial Flexibility

Turnaround Progress Report
6 Scotiabank Financials Summit 2014 September 4, 2014
2012 2013 2014
Stabilization Transition To Growth Holding Company Cash > 1.5X Debt Service + $350MM
Buffer Addressed Near Term Debt Maturities Reestablished Credit Facility Holding Company & U.S. Life Company Ratings “Stable” 2013 Dividends Paid To Holding Company Of ~$500MM,
Including 1st Ordinary Dividend From U.S. Life Companies Since 2008
U.S. MI Capital Enhancing Reorganization U.S. MI Return To Profitability In Force Rate Action Progress In LTC Maintained Solid Margins In LTC Reserves Adequate To Strong Capital Ratios In All Businesses Restructuring Actions To Reduce Expenses
Completed Australia MI Partial IPO
Announced Review Of LTC Disabled Life Reserves
Draft GSE1 Eligibility Standards (PMIERs2) Released
More Work To Be Done To Improve Business Performance & Financial Flexibility To Enable Transition To Growth
1Government Sponsored Enterprises; 2Private Mortgage Insurer Eligibility Requirements

Genworth Historical Performance
7 Scotiabank Financials Summit 2014 September 4, 2014
357 334 394
164 163
(196)
204
398
204 268
(107)
(135) (176) (84) (79)
2011 2012 2013 1H13 1H14
616
284 352
Net Operating Income1 Highlights ($MM)
1Non-GAAP Measure. See Appendix For Additional Information About Each Adjustment. 2Non-GAAP Measure. Net Operating Income Attributable To Noncontroling Interests (NCI) In Australia MI. See Appendix.
U.S. Life Insurance Division LTC Three Part Strategy Continuing To Show Results LTC Disabled Life Reserve Review In Process; Intend To Complete By Release Of 3Q14 Results Life Mortality Performance Drives Results Growing Assets Under Management In Fixed Annuities
Global Mortgage Insurance Division U.S. MI Impacted By Continued Improvement In Housing Market Stable Markets & Improved Loss Performance In Australia & Canada Partial IPO Of Australia MI Completed In May 2014
Corporate & Other Division International Protection Impacted By High Unemployment In Europe Runoff Impacted By Equity Market Performance Corporate &
Other Div.
Global MI Div.
U.S. Life Ins. Div.
54
403
Australia MI NCI2 - - - - 11

8 Scotiabank Financials Summit 2014 September 4, 2014
U.S. Life Insurance Division
Protecting Families At Life’s Moments Of Truth

U.S. Life Insurance Division
9 Scotiabank Financials Summit 2014 September 4, 2014
Long Term Care Insurance
Life Insurance
Fixed Annuities
Individual & Group Products Provide Protection Against The Costs Of Long Term Care Services
A Leading Provider In The Industry (Market Position (Sales))1
Individual - #1; Group - #2
Primary Distribution Channels: Brokerage General Agencies, Retail, Financial Institutions
Indexed Universal Life (IUL), Universal Life (UL), Term Life, and Combination (Life-LTC) Products Provide Protection Against Financial Hardship After The Death Of An Insured
Market Positions (Sales)2
Term (BGA) #10; UL (BGA) #17; Combination Products #4
Primary Distribution Channels: Brokerage General Agencies
Single Premium Deferred Annuities (SPDA), Single Premium Immediate Annuities (SPIA) & Fixed Indexed Annuities (FIA) Create Dependable Income Streams
Market Positions (Sales)3
SPDA #8; SPIA #8; FIA #16
Primary Distribution Channels: Brokerage General Agencies, Banks, Financial Institutions
1Individual (LIMRA 2013 U.S. Individual Long Term Care Report), Group (LIMRA 2013 U.S. Group Long Term Care Report); 2Term & UL (LIMRA 2013 U.S. Retail Individual Life Insurance Sales Report), Combo (LIMRA 2013 Individual Life Combination Products Report, Extension Only Products); 3LIMRA 2013 U.S. Individual Annuities Sales Report
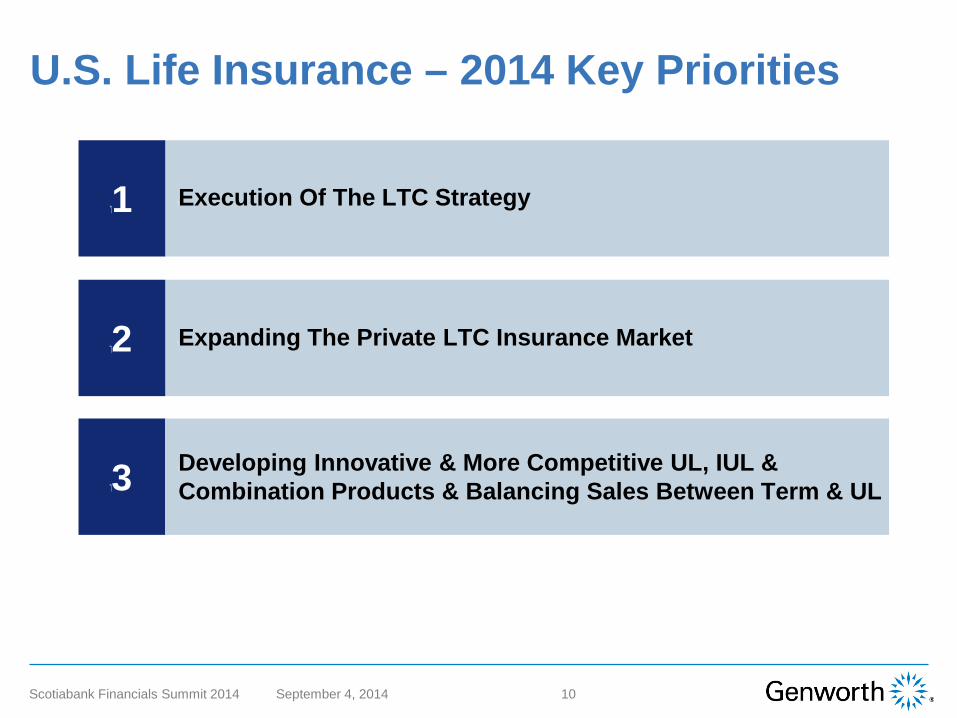
U.S. Life Insurance – 2014 Key Priorities
10 Scotiabank Financials Summit 2014 September 4, 2014
1
2
3
Execution Of The LTC Strategy
Expanding The Private LTC Insurance Market
& Developing Innovative & More Competitive UL, IULCombination Products & Balancing Sales Between Term & UL

11 Scotiabank Financials Summit 2014 September 4, 2014
Long Term Care Business Overview LTC Market Opportunity
Potential Consumers 50MM+
LTC Buyers ~7MM
Rising Cost Of Care
Demographics
Consumer Need – Clear And Growing 1 In 6 People In The US Will Be 65+ By 20201 ~70% Of People 65+ Will Need Long Term Care
Cost Of Care – Significant And Increasing National Median Nursing Home Costs Up From $66,000 (2007) To $88,000 (2013) 2
Public Finances Strained – Medicaid, Medicare
~18 Carriers Of LTC Insurance… Provides Continued Opportunity To Lead Market (Product, Pricing, Underwriting Advancements)
Increasing Need For LTC Financing Solutions
Commercial Strategy Primary Consumer Targets
Married, Preferred Health, Age 50 – 65 (Premium Discounts Offered To Enhance Risk Pool)
Evolving Product Structures To Lower Risk Profile While Providing Strong Consumer Value
Broadening Product Portfolio To Offer A Fuller Spectrum Of LTC Funding Solutions
Continue To Leverage Diverse Distribution
Differentiated Capabilities Extensive Industry Experience / Risk Insights
Have Been Issuing LTC Policies Since 1974; Largest Claims History… $10B Paid / ~200K Claims
Disciplined Underwriting Approach Cognitive Screens, Medical Records, Rx Drug Reports
Industry Leading Service / Claims Management Expert Policyholder & Claims Handling Teams; Strong Distribution Relationships & Services
Population Ages 40 – 75 ~115MM
Sources: U.S. Census, LIMRA, Genworth Consumer Segmentation 12010 US Census; Commonwealth Fund 2Genworth 2014 Cost Of Care Study – Cost For Private Room (Rounded)

LTC Three Part Strategy
12 Scotiabank Financials Summit 2014 September 4, 2014
Obtain Significant Premium Rate Increases On Older Blocks Written Before 2002 Bringing Them Closer to Break-Even Over Time
Increases Approved By 43 States As Of 2Q14 Expect Incremental Annual Net Premiums Of $250MM To $300MM When Fully Implemented By 2017
Request Smaller Rate Increases On Newer Blocks To Bring Them Back To Original Pricing Expectations
Increases Approved By 18 States As Of 2Q14
Introduce New Products That Are More Tightly Underwritten, Using More Conservative Assumptions
Launched Privileged Choice Flex 3 In July 2014

13 Scotiabank Financials Summit 2014 September 4, 2014
Life Insurance Business Overview
No Life Need – 20%
Underinsured 60%
Large Consumer Need… “Coverage Gap”
Covered – 20%
40% Recognize Need For More Coverage
Middle Market Households In The United States Show Greatest Need For Life Insurance Coverage
Estimated Coverage Need Of $4.2 Trillion
Source: LIMRA 2012 Closing The Life Insurance Gap; Federal Reserve Board 2010 SCF Date Source: LIMRA 2013 U.S. Individual Life Insurance Sales Survey
Target Middle Income To Mass Affluent Consumers In The United States
Focus On Preferred Health - Aligned With Genworth Risk Appetite
Shifting Sales Mix From Term To PermanentProducts
Strategic Focus On High Growth IUL + Combo Products… More Capital Efficient & Better Risk/Return Profile
Leverage Independent Distribution Remains Highest Sellers Of UL & Combo Products
Differentiated Capabilities Strong Mortality Experience And Disciplined Underwriting Model Has Led To Favorable Mortality Experience
Industry Leading, Low Cost Service Model Easy To Transact Business For Complex Products
Strong Distribution Relationships And Services
Commercial Strategy Market Opportunity

14 Scotiabank Financials Summit 2014 September 4, 2014
Fixed Annuities Business Overview
Increasing Retirement Income Need…
~43 ~54 ~70
2011 2020 2030
Projected # Of Retirees (MM)1
Differentiated Capabilities
Commercial Strategy Market Opportunity
Retirement Income Market Poised To Grow$12 Trillion Available For Retirement Investment In 2010… ~$22 Trillion By 20202
Large Market For Guaranteed Income$650B Of Assets Projected To Be Converted Into Annuities By Current Pre-Retiree + Retiree Population3
1LIMRA Analysis Of U.S. Census Current Population Survey, March 2011 & National Population Projections, 2009 + SSA Table Population Data (2006). 2 LIMRA, Based On 2001, 2007 & 2010 Survey Of Consumer Finances. 3 LIMRA 2012 Retirement Study
Maintain Broad, Diversified Product Portfolio ToHelp Compete In Different Market Conditions Disciplined Pricing Approach
Bi-Weekly Re-Pricing To Balance Sales And Target Return Objectives
Focus On BGA & (Regional) Bank Distribution Better Shelf-Space Presence / Lower Turnover Versus Wires And Large Banks
Active Profitability / Risk Management Flexible Product Designs… Allows For Rapid Changes In Rates, Floors, Benefits
Dynamic Asset Liability Management Strategy Multiple Distribution Channel Presence
Leverage Leading LTC + Life Product Distribution Relationships

U.S. Life Insurance Historical Performance
15 Scotiabank Financials Summit 2014 September 4, 2014
78 82 92 55 51
99 101 129
46 52
180 151
173
63 60
2011 2012 2013 1H13 1H14
Net Operating Income Highlights ($MM)
Life
Long Term Care
Fixed Annuities
357 334
Life Insurance Mortality Performance Drives Results Unfavorable Unlocking In 2012; Favorable Unlocking In 2013
LTC Three Part Strategy Continuing To Show Results Disabled Life Reserve Review In Process; Intend To Complete By Release Of 3Q14 Results
Fixed Annuities Results Impacted By Mortality & Investment Performance Growing Assets Under Management
394
164 163
Risk-Based Capital Ratio 405% 431% 487% 444% ~490%

Helping Families Achieve & Maintain The Dream Of Home Ownership
16 Scotiabank Financials Summit 2014 September 4, 2014
Global Mortgage Insurance (GMI) Division

GMI Division
17 Scotiabank Financials Summit 2014 September 4, 2014
Canada
Australia
U.S. MI
A Leading Private Mortgage Insurer Required For HLTV Loans… Canadian Government Decides What Types Of Mortgage Products Are Eligible For Coverage Under The Guarantee 90% Government Guarantee Primary Distribution Channels: Large, Regional & Mortgage Banks, Credit Unions
A Leading Private Mortgage Insurer No Explicit Requirement For Lenders Mortgage Insurance… But Prevalent Use In The Market Primary Distribution Channels: Large And Regional Banks, Building Societies, Credit Unions
A Leading Private Mortgage Insurer Offering Flow & Bulk Insurance Coverage In First Loss Position On Flow Insurance GSE Charter Requires Protection Against Default For 80% & Above Loan-To-Value (HLTV) HLTV Loans Purchased By GSEs Generally Insured With Private Mortgage Ins. Primary Distribution Channels: Large, Regional, Community & Mortgage Banks, Credit Unions

GMI Division – 2014 Key Priorities
18 Scotiabank Financials Summit 2014 September 4, 2014
1
2
Continued Execution Of The U.S. MI Business ReturnTo Profitability
Execution Of The IPO Of Up To 40% Of Australia MI
19 Scotiabank Financials Summit 2014 September 4, 2014
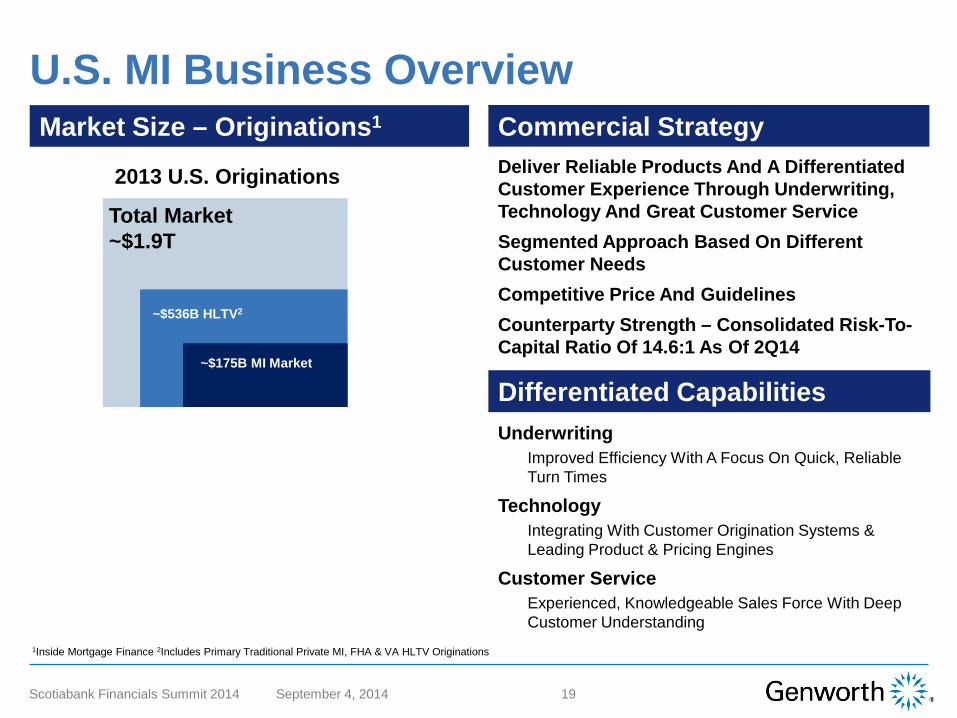
U.S. MI Business Overview
2013 U.S. Originations
Total Market ~$1.9T
~$175B MI Market
~$536B HLTV2
1Inside Mortgage Finance 2Includes Primary Traditional Private MI, FHA & VA HLTV Originations
Underwriting Improved Efficiency With A Focus On Quick, Reliable Turn Times
Technology Integrating With Customer Origination Systems & Leading Product & Pricing Engines
Customer Service Experienced, Knowledgeable Sales Force With Deep Customer Understanding
Deliver Reliable Products And A Differentiated Customer Experience Through Underwriting, Technology And Great Customer Service Segmented Approach Based On Different Customer Needs Competitive Price And Guidelines Counterparty Strength – Consolidated Risk-To-Capital Ratio Of 14.6:1 As Of 2Q14
Differentiated Capabilities
Commercial Strategy Market Size – Originations1

20 Scotiabank Financials Summit 2014 September 4, 2014
Australia Business Overview
1Australia Bureau Of Statistics & Management Estimates
2013 Australia Originations
Total Market ~$300B
~$75B MI Market
~$75B HLTV
$USD FX = 1.00
Deep Integration With Lenders Processes… Electronically Linked Systems Exceptional Customer Service With On-Site & Dedicated Relationship Resources Risk & Product Management With Over 40 Years Of LMI Experience & Extensive Data & Risk Tools Extensive Portfolio Analysis & Peer Benchmarking
Strengthen Market Leadership Position Through:
Enhancing The Value Proposition By Understanding The Product And Delivery Requirements Of Customers Maintain A Consistently High Level Of Service Through Technology And Process Efficiency Proactively Engaging With Industry And Regulators To Highlight Value Of Lenders Mortgage Insurance (LMI) To The Financial System
Differentiated Capabilities
Commercial Strategy Market Size – Originations1

21 Scotiabank Financials Summit 2014 September 4, 2014
Canada Business Overview
1Management Estimates
2013 Canada Originations
Total Market ~$270B
~$70B MI Market ~$75B HLTV
$USD FX = 1.00
Deep Integration With Lenders Processes… Electronically Linked Systems Proprietary Scoring Model / Database With Over 25 Years Of Data Disciplined Underwriting Supported By Automated Systems Extensive Portfolio Analysis And Peer Benchmarking
Grow Leading Position Through: Lender Tailored Solutions With Dedicated Relationship Leaders And Underwriting Teams
High Level Of Service Through Technology And Process Efficiency
Differentiated Capabilities
Commercial Strategy Market Size – Originations1

GMI Historical Performance
22 Scotiabank Financials Summit 2014 September 4, 2014
Net Operating Income Highlights ($MM)
(524)
(138) 37 34 72
196 142 228
101 119
159 234 170
85 88
(27)
(34)
(37) (16) (11)
2011 2012 2013 1H13 1H14
(196) 204 398
204 268
Canada
Australia
United States
Other Countries
Australia MI NCI - - - - 11
Canada MCT1 Ratio 162% 170% 223% 216% 230% Australia PCA2 Ratio 157% 149% 148% 134% 154% U.S. MI RTC3 Ratio 28.8:1 30.4:1 19.5:1 22.4:1 14.6:1
Canada Stable Economic Environment & Improved Loss Performance Strong Credit Quality Of Recent Books 2012 Reflected $78MM Benefit From New Government Guarantee Framework
Australia Stable Economic Environment & Improved Loss Performance Partial IPO Of Australia MI Completed In May 2014
United States Impacted By Continued Improvement In Housing Market Strong Loss Mitigation Performance 2009+ Books ~50% Of Risk In Force As Of 2Q14 Draft GSE Eligibility Standards (PMIERs) Released In July 2014
1Minimum Capital Test; 2Prescribed Capital Amount; 3Consolidated Risk-To-Capital

23 Scotiabank Financials Summit 2014 September 4, 2014
Holding Company & Non-Core Businesses

Holding Company & Non-Core Businesses
24 Scotiabank Financials Summit 2014 September 4, 2014
Holding Company
Leverage Ratio Of 23.9%1 As Of 2Q14; Targeting 20-22% By 2016
No Debt Maturities Until December 2016
Cash & Liquid Asset Target Of 1.5X Interest Coverage Plus Risk Buffer Of $350MM; ~$1.2B Cash & Liquid Assets As Of 2Q14
International Protection
A Leading Provider Of Payment Protection Coverages In Multiple European Countries With Operations In Select Other Countries
Products Primarily Help Consumers Meet Specified Payment Obligations Should They Become Unable To Pay Due To Accident, Illness, Involuntary Unemployment, Disability Or Death
Runoff Includes Products Which Are No Longer Actively Sold
Products Primarily Include Variable Annuity, Variable Life Insurance, Institutional, Corporate-Owned Life Insurance And Other Accident And Health Insurance Products
1Based On Moody’s Investors Service, Inc. Calculation Methodology & Also Excludes Unrealized Gains/Losses & Includes Unrealized Gains On Derivatives Qualifying As Hedges & Foreign Currency Translation

The Case For Genworth
25 Scotiabank Financials Summit 2014 September 4, 2014
Businesses
Focus
Action Plan
Improve Operating Performance Of Core Businesses, With Particular Emphasis On LTC & U.S MI
Continue To Reduce Financial Leverage Increase Cash Flow Coverage Of Annual Debt Service
Core Businesses With Distinct Competitive Advantages: U.S. Life Insurance – Strong Market Positions: #1 In LTC & #4 In Combination Products Global Mortgage Insurance – Leading Global Insurer With Operations In The United States, Australia, Canada, Europe & Select Markets
Non-Core Businesses Managed To Enhance & Generate Capital: International Protection And Runoff

26 Scotiabank Financials Summit 2014 September 4, 2014
Appendix

27 Scotiabank Financials Summit 2014 September 4, 2014
Investment Portfolio Overview
$76.9B
AAA 28% AA 11% A 30% BBB 28% BB 3% B & Lower -%
Cash & Cash Equivalents/Short Term Investments
Fixed Maturity Securities
Commercial Mortgage Loans Policy Loans Other Invested Assets
Fixed Maturities & Cash Investment Portfolio (As Of 6/30/14) Actively Reinvesting Cash
High Quality Portfolio
Strong Commercial Mortgage Loans
Overall Credit Quality Remains Strong With 96% Of Fixed Maturities Rated Investment Grade
Investing Cash As Market Opportunities Develop, While Maintaining Appropriate Liquidity
4% 2%
8%
81%
5%
Reported Yield
4.69%
4.79%
4.67%
4.81%
4.62% 4.63%
1Q13 2Q13 3Q13 4Q13 1Q14 2Q14
28 Scotiabank Financials Summit 2014 September 4, 2014
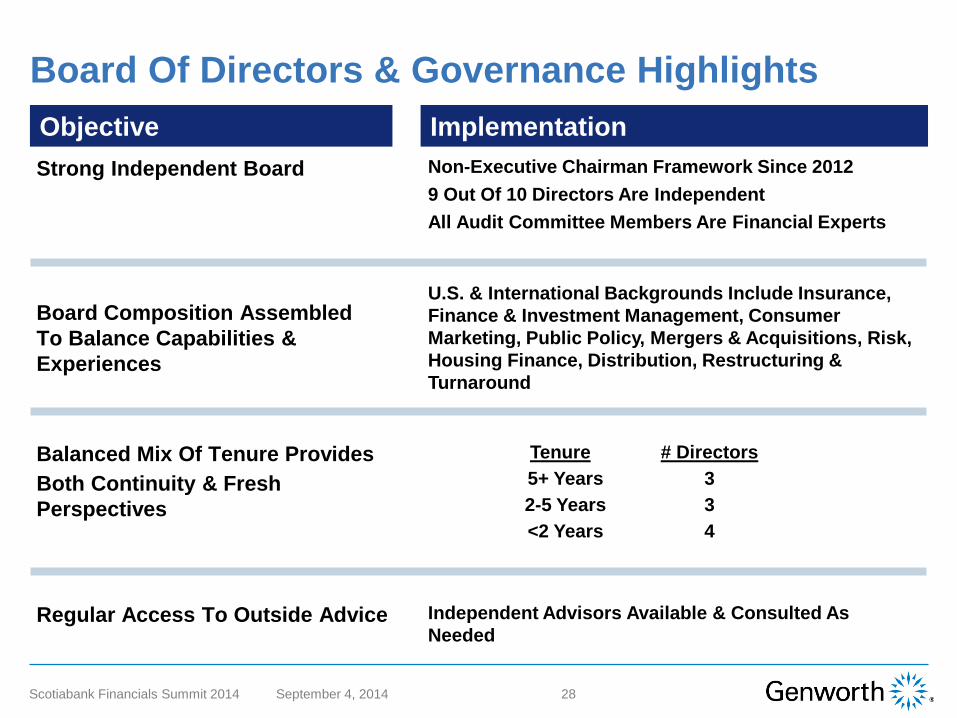
Board Of Directors & Governance Highlights Objective Implementation
Strong Independent Board Non-Executive Chairman Framework Since 20129 Out Of 10 Directors Are Independent All Audit Committee Members Are Financial Experts
Board Composition AssembledTo Balance Capabilities & Experiences
U.S. & International Backgrounds Include Insurance, Finance & Investment Management, Consumer Marketing, Public Policy, Mergers & Acquisitions, Risk, Housing Finance, Distribution, Restructuring & Turnaround
Balanced Mix Of Tenure Provides Both Continuity & FreshPerspectives
Tenure 5+ Years 2-5 Years <2 Years
# Directors 3 3 4
Regular Access To Outside Advice Independent Advisors Available & Consulted AsNeeded

29 Scotiabank Financials Summit 2014 September 4, 2014
Genworth’s Board Of Directors
G. Kent Conrad Independent Director; Served Since March 2013 Former U.S. Senator Committees: Legal & Public Affairs; Nominating & Corporate Governance
James S. Riepe, Non-Executive Chairman Of The Board Independent Director; Served Since March 2006; Lead Director From February 2009 – May 2012; Non-Executive Chairman Of The Board Since May 2012 Former Vice Chairman Of T. Rowe Price Group, Inc. Committees: Audit; Management Development & Compensation
William H. Bolinder Independent Director; Served Since October 2010 Former President, Chief Executive Officer & A Director Of Acadia Trust N.A. Committees: Legal & Public Affairs; Nominating & Corporate Governance (Chair)
Melina E. Higgins Independent Director; Served Since September 2013 Former Partner At The Goldman Sachs Group Committees: Legal & Public Affairs; Nominating & Corporate Governance

Nancy J. Karch Independent Director; Served Since October 2005 Former Senior Partner Of McKinsey & Company Committees: Management Development & Compensation (Chair); Nominating & Corporate Governance
30 Scotiabank Financials Summit 2014 September 4, 2014
Genworth’s Board Of Directors
Thomas J. McInerney Director; Served Since January 2013 President & Chief Executive Officer Of Genworth
Christine B. Mead Independent Director; Served Since October 2009 Former Executive Vice President & Chief Financial Officer Of Safeco Corporation Committees: Audit; Management Development & Compensation
David M. Moffett Independent Director; Served Since December 2012 Former Chief Executive Officer & Director Of Federal Home Loan Mortgage Corporation Committees: Legal & Public Affairs; Nominating & Corporate Governance

31 Scotiabank Financials Summit 2014 September 4, 2014
Thomas E. Moloney Independent Director; Served Since October 2009 Former Senior Executive Vice President & Chief Financial Officer Of John Hancock Financial Services, Inc. Committees: Audit; Legal & Public Affairs (Chair)
James A. Parke Independent Director; Served Since May 2004 Former Vice Chairman & Chief Financial Officer Of GE Capital Services And Former Senior Vice President Of General Electric Company Committees: Audit (Chair); Management Development & Compensation
Genworth’s Board Of Directors

32 Scotiabank Financials Summit 2014 September 4, 2014
Kevin Schneider Executive Vice President, Genworth President & CEO, Global Mortgage Insurance Division
Tom McInerney Genworth President & Chief Executive Officer President & CEO U.S. Life Insurance Division
Leon Roday Executive Vice President General Counsel & Secretary
Genworth Leadership
Scott McKay Senior Vice President IT
Lori Evangel Executive Vice President Chief Risk Officer
Michael Laming Executive Vice President Human Resources
Dan Sheehan Executive Vice President, Genworth Chief Investment Officer
Marty Klein Executive Vice President, Genworth Chief Financial Officer

33 Scotiabank Financials Summit 2014 September 4, 2014
Use Of Non-GAAP Measures This presentation includes the non-GAAP financial measure entitled "net operating income (loss)“ and “net operating income attributable to noncontrolling interests in Australia MI.” The chief operating decision maker evaluates segment performance and allocates resources on the basis of net operating income (loss). The company defines net operating income (loss) as income (loss) from continuing operations excluding the after-tax effects of income attributable to noncontrolling interests, net investment gains (losses), goodwill impairments, gains (losses) on the sale of businesses, gains (losses) on the early extinguishment of debt, gains (losses) on insurance block transactions and infrequent or unusual non-operating items. Gains (losses) on insurance block transactions are defined as gains (losses) on the early extinguishment of non-recourse funding obligations, early termination fees for other financing restructuring and/or resulting gains (losses) on reinsurance restructuring for certain blocks of business. The company excludes net investment gains (losses) and infrequent or unusual non-operating items because the company does not consider them to be related to the operating performance of the company's segments and Corporate and Other activities. A component of the company's net investment gains (losses) is the result of impairments, the size and timing of which can vary significantly depending on market credit cycles. In addition, the size and timing of other investment gains (losses) can be subject to the company's discretion and are influenced by market opportunities, as well as asset-liability matching considerations. Goodwill impairments, gains (losses) on the sale of businesses, gains (losses) on the early extinguishment of debt and gains (losses) on insurance block transactions are also excluded from net operating income (loss) because in the company's opinion, they are not indicative of overall operating trends. Other non-operating items are also excluded from net operating income (loss) if, in the company's opinion, they are not indicative of overall operating trends. The following transactions were excluded from net operating income (loss) for the periods presented as they related to the loss on the early extinguishment of debt. In the second quarter of 2014, the company paid an early redemption payment of approximately $2 million, net of taxes and portion attributable to noncontrolling interests, related to the early redemption of Genworth MI Canada Inc.'s notes that were scheduled to mature in 2015. In the third quarter of 2013, the company paid a make-whole expense of approximately $20 million, net of taxes, related to the early redemption of Genworth Holdings’ notes that were scheduled to mature in 2015. In the fourth quarter of 2012, we repurchased principal of approximately $100 million of Genworth Holdings’ notes that mature in June 2014 for an after-tax loss of $4 million. In the fourth quarter of 2012, we also repurchased $20 million of non-recourse funding obligations resulting in an after-tax gain of approximately $3 million. During 2011, we acquired $175 million aggregate principal amount of our non-recourse funding obligations, plus accrued interest, for an after-tax gain of $31 million. In the third quarter of 2012, we completed a life block transaction resulting in an after-tax loss of $6 million. In January 2012, we also completed a life block transaction resulting in an after-tax loss of approximately $41 million. We recorded after-tax goodwill impairments of $86 million related to our lifestyle protection insurance business in the third quarter of 2012 and $19 million related to our reverse mortgage business recorded in the fourth quarter of 2011. There was a $36 million gain related to the sale of our Medicare supplement insurance business recorded in the fourth quarter of 2011. There were no infrequent or unusual items excluded from net operating income (loss) during the periods presented other than a $13 million, net of taxes, expense recorded in the second quarter of 2013 related to restructuring costs. While some of these items may be significant components of net income (loss) available to Genworth’s common stockholders in accordance with GAAP, the company believes that net operating income (loss) and measures that are derived from or incorporate net operating income (loss), including net operating income (loss) per common share on a basic and diluted basis, are appropriate measures that are useful to investors because they identify the income (loss) attributable to the ongoing operations of the business. Management also uses net operating income (loss) as a basis for determining awards and compensation for senior management and to evaluate performance on a basis comparable to that used by analysts. However, the items excluded from net operating income (loss) have occurred in the past and could, and in some cases will, recur in the future. Net operating income (loss) and net operating income (loss) per common share on a basic and diluted basis are not substitutes for net income (loss) available to Genworth’s common stockholders or net income (loss) available to Genworth’s common stockholders per common share on a basic and diluted basis determined in accordance with GAAP. In addition, the company's definition of net operating income (loss) may differ from the definitions used by other companies. A reconciliation of net operating income (loss) of the company’s segments and Corporate and Other activities to net income available to Genworth’s common stockholders is included in this appendix. Adjustments to reconcile net income attributable to Genworth’s common stockholders and net operating income assume a 35% tax rate and are net of the portion attributable to noncontrolling interests. Net investment gains (losses) are also adjusted for deferred acquisition costs and other intangible amortization and certain benefit reserves. 1 U.S. Generally Accepted Accounting Principles

Reconciliation Of Net Operating Income To Net Income
34 Scotiabank Financials Summit 2014 September 4, 2014
(Amounts in millions) 2013 2012 2011 2014 2013U.S. Life Insurance DivisionU.S. Life Insurance segment:
Life Insurance 173$ 151$ 180$ 60$ 63$ Long-Term Care Insurance 129 101 99 52 46 Fixed Annuities 92 82 78 51 55 Total U.S. Life Insurance segment 394 334 357 163 164
Total U.S. Life Insurance Division 394 334 357 163 164
Global Mortgage Insurance DivisionInternational Mortgage Insurance segment:
Canada 170 234 159 88 85 Australia(1) 228 142 196 119 101 Other Countries (37) (34) (27) (11) (16) Total International Mortgage Insurance segment 361 342 328 196 170
U.S. Mortgage Insurance segment 37 (138) (524) 72 34 Total Global Mortgage Insurance Division 398 204 (196) 268 204
Corporate and Other DivisionInternational Protection segment 24 24 91 9 7 Runoff segment 66 46 27 27 22 Corporate and Other (266) (205) (225) (115) (113)
Total Corporate and Other Division (176) (135) (107) (79) (84)
NET OPERATING INCOME 616 403 54 352 284
ADJUSTMENTS TO NET OPERATING INCOME:Net investment gains (losses), net (11) (1) (100) 10 (13) Expenses related to restructuring, net (13) - - - (13) Gains (losses) on early extinguishment of debt, net (20) (1) 31 (2) - Goodwill impairment, net - (86) (19) - - Gains (losses) from life block transactions, net - (47) - - - Gain on sale of business, net - - 36 - - Income (loss) from discontinued operations, net of taxes (12) 57 36 - (14) NET INCOME AVAILABLE TO GENWORTH FINANCIAL, INC.'S COMMON STOCKHOLDERS 560 325 38 360 244 Add: net income attributable to noncontrolling interests 154 200 139 87 77
NET INCOME 714$ 525$ 177$ 447$ 321$
Six months ended June 30,2013 2012 2011 2014 2013
Australia's Net Operating Income 228$ 142$ 196$ 130$ 101$ Less: Net Operating Income Attributable to Noncontrolling Interests - - - 11 - Australia's Net Operating Income Available to Genworth Financial, Inc.'s Common Stockholders 228$ 142$ 196$ 119$ 101$
Years ended December 31,
(1)Adjusted for 33.8% owned by noncontrolling interests after the initial public offering of the Australian mortgage insurance business on May 21, 2014. The following table shows Australia's net operating income assuming 100% ownership and then adjusts for the portion related to noncontrolling interests.
June 30,Years ended December 31,Six months ended

35 Scotiabank Financials Summit 2014 September 4, 2014
Definition Of Selected Operating Performance Measures
The company reports selected operating performance measures including "sales" and "risk in force" which are commonly used in the insurance industry as measures of operating performance.
Management regularly monitors and reports sales metrics as a measure of volume of new and renewal business generated in a period. Sales refer to: (1) annualized first-year premiums for term life and long term care insurance products; (2) annualized first-year deposits plus five percent of excess deposits for universal and term universal life insurance products; (3) 10 percent of premium deposits for linked-benefits products; (4) new and additional premiums/deposits for fixed annuities; and (5) new insurance written for mortgage insurance. Sales do not include renewal premiums on policies or contracts written during prior periods. The company considers annualized first-year premiums/deposits, premium equivalents, new premiums/deposits and new insurance written to be a measure of the company's operating performance because they represent a measure of new sales of insurance policies or contracts during a specified period, rather than a measure of the company's revenues or profitability during that period.
Management regularly monitors and reports risk in force. Risk in force for the U.S. mortgage insurance business is the obligation that is limited under contractual terms to the amounts less than 100 percent of the mortgage loan value. The company considers risk in force to be a measure of the company’s operating performance because it represents a measure of the size of the business at a specific date which will generate revenues and profits in a future period, rather than a measure of the company’s revenues or profitability during that period.
This presentation also includes information related to loss mitigation activities for the U.S. mortgage insurance business. The company defines loss mitigation activities as rescissions, cancellations, borrower loan modifications, repayment plans, lender- and borrower-titled presales, claims administration and other loan workouts. Estimated savings related to rescissions are the reduction in carried loss reserves, net of premium refunds and reinstatement of prior rescissions. Estimated savings related to loan modifications and other cure related loss mitigation actions represent the reduction in carried loss reserves. Estimated savings related to claims mitigation activities represent amounts deducted or "curtailed" from claims due to acts or omissions by the insured or the servicer with respect to the servicing of an insured loan that is not in compliance with obligations under the company’s master policy. For non-cure related actions, including presales, the estimated savings represent the difference between the full claim obligation and the actual amount paid. Loans subject to the company’s loss mitigation actions, the results of which have been included in the company’s reported estimated loss mitigation savings, are subject to re-default and may result in a potential claim in future periods, as well as potential future loss mitigation savings depending on the resolution of the re-defaulted loan. The company believes that this information helps to enhance the understanding of the operating performance of the U.S. mortgage insurance business as loss mitigation activities specifically impact current and future loss reserves and level of claim payments.
These operating performance measures enable the company to compare its operating performance across periods without regard to revenues or profitability related to policies or contracts sold in prior periods or from investments or other sources.

36 Scotiabank Financials Summit 2014 September 4, 2014
This presentation contains certain "forward-looking statements" within the meaning of the Private Securities Litigation Reform Act of 1995. Forward-looking statements may be identified by words such as "expects," "intends," "anticipates," "plans," "believes," "seeks," "estimates," "will" or words of similar meaning and include, but are not limited to, statements regarding the outlook for the company’s future business and financial performance. Forward-looking statements are based on management’s current expectations and assumptions, which are subject to inherent uncertainties, risks and changes in circumstances that are difficult to predict. Actual outcomes and results may differ materially due to global political, economic, business, competitive, market, regulatory and other factors and risks, including, but not limited to, the following:
Risks relating to the company’s businesses, including downturns and volatility in global economies and equity and credit markets; downgrades or potential downgrades in the company’s financial strength or credit ratings; interest rate fluctuations and levels; adverse capital and credit market conditions; the valuation of fixed maturity, equity and trading securities; defaults or other events impacting the value of the company’s fixed maturity securities portfolio; defaults on the company’s commercial mortgage loans or the mortgage loans underlying the company’s investments in commercial mortgage-backed securities and volatility in performance; availability, affordability and adequacy of reinsurance; defaults by counterparties to reinsurance arrangements or derivative instruments; an adverse change in risk-based capital and other regulatory requirements; insufficiency of reserves and required increases to reserve liabilities; legal and regulatory constraints on dividend distributions by the company’s subsidiaries; competition, including from government-owned and government-sponsored enterprises (GSEs) offering mortgage insurance; loss of key distribution partners; regulatory restrictions on the company’s operations and changes in applicable laws and regulations; legal or regulatory investigations or actions; the failure of or any compromise of the security of the company’s computer systems and confidential information contained therein; the occurrence of natural or man-made disasters or a pandemic; the effect of the Dodd-Frank Wall Street Reform and Consumer Protection Act; ineffective or inadequate risk management program; changes in accounting and reporting standards; goodwill impairments; impairments of or valuation allowances against the company’s deferred tax assets; significant deviations from the company’s assumptions in its insurance policies and annuity contracts; accelerated amortization of deferred acquisition costs and present value of future profits; ability to increase premiums on in force and future long term care insurance products, including any current rate actions and any future rate actions; the failure of demand for life insurance, long term care insurance and fixed annuity products to increase; medical advances, such as genetic research and diagnostic imaging, and related legislation; ability to continue to implement actions to mitigate the impact of statutory reserve requirements; political and economic instability or changes in government policies; fluctuations in foreign currency exchange rates and international securities markets; the significant portion of the company’s international mortgage insurance risk in force with high loan-to-value ratios; increases in U.S. mortgage insurance default rates; failure to meet, or have waived to the extent needed, the company’s U.S. mortgage insurance subsidiaries’ minimum statutory capital requirements and hazardous financial condition standards; the influence of Federal National Mortgage Association (Fannie Mae), Federal Home Loan Mortgage Corporation (Freddie Mac) and a small number of large mortgage lenders and investors and changes to the role or structure of Fannie Mae and Freddie Mac; failure to meet the revised GSE eligibility standards or the capital required to meet the revised standards may be higher than anticipated; ability to realize the benefits of the company’s rescissions and curtailments; the extent to which loan modifications and other similar programs may provide benefits to the company; deterioration in economic conditions or a decline in home prices in the United States; problems associated with foreclosure process defects in the United States that may defer claim payments; decreases in the volume of high loan-to-value mortgage originations or increases in mortgage insurance cancellations in the United States; increases in the use of alternatives to private mortgage insurance in the United States and reductions by lenders in the level of coverage they select; the impact of the use of reinsurance with reinsurance companies affiliated with the company’s U.S. mortgage lending customers; and potential liabilities in connection with the company’s U.S. contract underwriting services;
Other risks, including the risk that the anticipated benefits of the announced expense reduction are not realized and the company may lose key personnel related to actions like this as well as general uncertainty in the timing of the company’s turnaround; the possibility that in certain circumstances the company will be obligated to make payments to General Electric Company (GE) under the tax matters agreement with GE even if the company’s corresponding tax savings are never realized and payments could be accelerated in the event of certain changes in control; and provisions of the company’s certificate of incorporation and bylaws and the tax matters agreement with GE may discourage takeover attempts and business combinations that stockholders might consider in their best interests; and
Risks relating to the company’s common stock, including the suspension of dividends and stock price fluctuations.
The company undertakes no obligation to publicly update any forward-looking statement, whether as a result of new information, future developments or otherwise.
Cautionary Note Regarding Forward-Looking Statements