tomco technologies te1000 rf vector impedance · pdf filetomco technologies te1000 rf vector...
TRANSCRIPT

Tomco Technologies
TE1000 RF Vector Impedance Analyser
USER’S GUIDE
Customer Support
Tomco Technologies 17 Clarke Street, Norwood, South Australia, 5067
+61 8 8364 2203 [email protected]
Document Number T001223 Issue I
Notice
The information contained in this document is subject to change without notice.
No part of this document may be photocopied or reproduced without prior written consent of Tomco
Technologies.
Copyright Tomco Technologies, 2001-2007 17 Clarke Street, Norwood, South Australia, 5067

Tomco Technologies
TE1000 RF Vector Impedance Analyser Page 3
Table of Contents
SECTION 1: THE TE1000 RF IMPEDANCE ANALYSER ...................................................................... 5
INTRODUCTION ............................................................... 5 GENERAL PRINCIPLES OF OPERATION............................. 7 OVERVIEW OF CONTROLS AND FUNCTIONS ..................... 8 POWER SUPPLY............................................................. 11 EARTHING PRECAUTIONS.............................................. 11 OPERATING HINTS ........................................................ 13
How to achieve accurate measurements.................. 13 ACCESSORIES................................................................ 15
Using the probe coaxial adaptor ............................. 15 Using the probe earthing pin ................................... 15
EXAMPLES OF TYPICAL MEASUREMENTS ..................... 17 General Use ............................................................... 17 Impedance measurement ......................................... 19 Scan Mode Measurements ...................................... 20
HOW THE TE1000 WORKS............................................. 21 EXAMPLES OF OTHER QUANTITIES THE TE1000 CAN MEASURE ...................................................................... 24
Measuring the length of a coaxial cable.................. 24 Measuring the loss in a length of coaxial cable....... 25
TECHNICAL SPECIFICATIONS......................................... 26
SECTION 2: THE TE1000 USER INTERFACE SOFTWARE ................................................................... 29
INTRODUCTION ............................................................. 29 HARDWARE AND SOFTWARE REQUIREMENTS............... 29 INSTALLATION .............................................................. 31 RUNNING THE TE1000 SOFTWARE ............................... 32 QUICKSTART................................................................. 33
Tomco Technologies
TE1000 RF Vector Impedance Analyser Page 4
REFERENCE................................................................... 35 What’s on the TE1000 interface screen? ................. 35 Menu Bar ................................................................. 35
File menu – opening, closing and saving experiments ................................................................ 35 Edit menu – setting the baud rate ........................... 36 View Menu – plotting data ........................................ 37 Help Menu – product information ............................ 38
Experiment Name .................................................... 38 Data Window ........................................................... 39
Frequency Setting...................................................... 39 Frequency sweep settings........................................ 39 Control buttons ........................................................... 40 Data display ................................................................ 40
DATA LOGGING – OVERWRITING DATA, ADDING MORE DATA POINTS AND OTHER FEATURES............................. 40 PLOTTING DATA............................................................ 42
Available plots ......................................................... 42 Tooltips .................................................................... 44 Plot menu ................................................................. 46
Annotating plots ......................................................... 47 Clear Annotations ...................................................... 47 Saving plots ................................................................ 47 Printing plots ............................................................... 47 Reset Axes ................................................................. 48 Zooming in and out .................................................... 48 Autorange ................................................................... 49 Properties (Smith Chart only)................................... 49
More about the Smith Chart..................................... 50 RESIZING WINDOWS ...................................................... 51 CUTTING, COPYING AND PRINTING DATA..................... 51 HOW TO “ZERO IN” ON A FEATURE OF INTEREST. .......... 52
SUPPORT ....................................................................... 53

Tomco Technologies
TE1000 RF Vector Impedance Analyser Page 5
Section 1: The TE1000 RF Impedance Analyser
Introduction The Tomco TE1000 RF Impedance Analyser is a portable instrument providing fast and accurate measurement of vector impedance, VSWR, R-L-C (as series or parallel equivalent circuits), vector reflection coefficient and return loss. The TE1000 determines impedance via direct measurement of RF voltage and current, a technique which permits accurate measurement of a very wide range of impedances. A distinct advantage of this technique is that it provides measurement via a hand-held probe, enabling fast and accurate in-circuit measurements that are very hard to achieve using a standard VNA. Typical applications include RF design and development, antenna testing and tuning, impedance matching, component test, cable fault finding, filter design and test, and cutting cables to precise electrical lengths. The TE1000 has full vector measurement capability and accurately resolves the resistive, capacitive and inductive components of a load. The TE1000 operates from 0.5-150MHz and includes a general purpose RF test signal output across the frequency range. The unit is rugged and lightweight and can be powered by mains or by internal battery making it ideally suited for both benchtop and portable use. The unit's RS232 interface and optional PC software further increase the power of the instrument by providing swept

Tomco Technologies
TE1000 RF Vector Impedance Analyser Page 6
frequency capability and facilities for complex data analysis and data logging.

Tomco Technologies
TE1000 RF Vector Impedance Analyser Page 7
General Principles of Operation
The TE1000 RF Impedance Analyser operates by generating an RF signal at a user defined frequency in the range 500kHz to 150MHz, and injecting it into the load at the probe tip. The resultant RF voltage and current are sampled and measured, and from this the unit calculates the complex impedance of the load. Once the complex impedance is known, the VSWR, reflection coefficient, R-L-C equivalent circuit and return loss can also be determined. The user selects which measurement is to be displayed and in which format. The impedance can be displayed in rectangular or polar format. The R-L-C equivalent circuit can be displayed as either a series or parallel circuit. There are 2 basic modes of operation. In fixed frequency mode one frequency only is selected by the user. In scan mode the user can scan sequentially through a range of frequencies. The scan mode is particularly useful for locating resonances such as in a quarter wave line or a crystal. The TE1000 can be controlled either via the keypads on the front panel or remotely from a PC using the RS232 serial line and control software. The PC software can be used to log data from the TE1000 and store this in a format which is compatible with MS Excel.
Tomco Technologies
TE1000 RF Vector Impedance Analyser Page 8
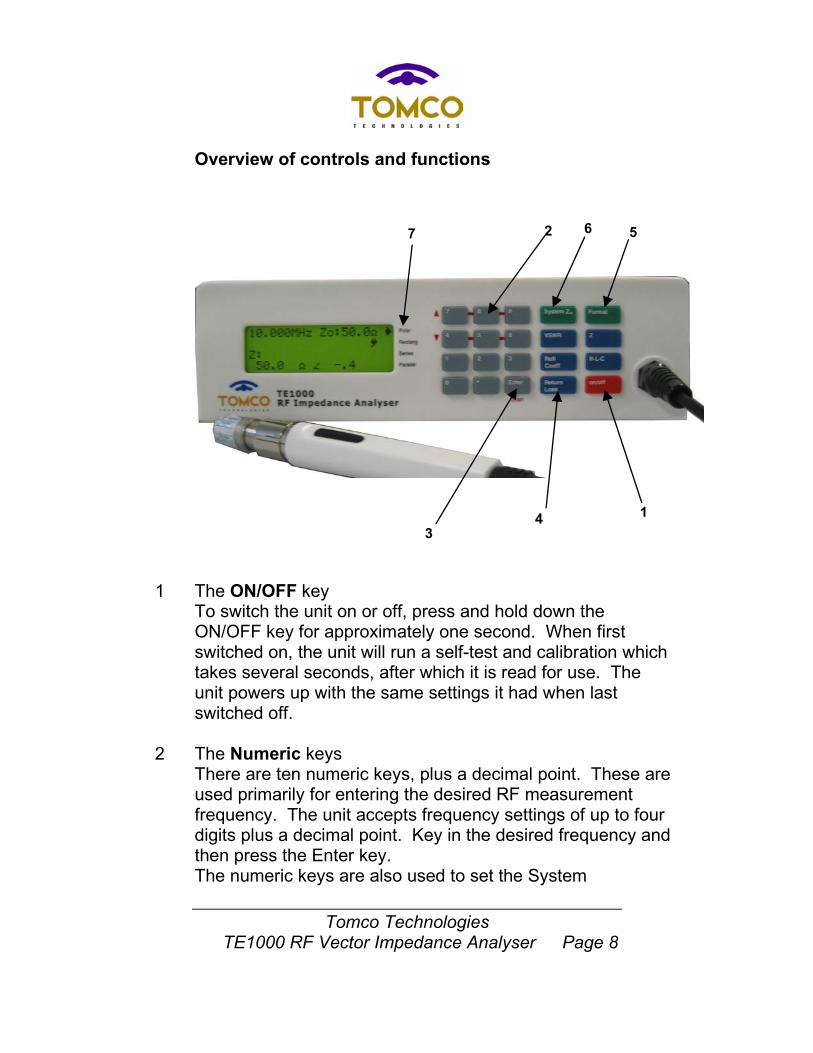
Overview of controls and functions
1 The ON/OFF key To switch the unit on or off, press and hold down the ON/OFF key for approximately one second. When first switched on, the unit will run a self-test and calibration which takes several seconds, after which it is read for use. The unit powers up with the same settings it had when last switched off.
2 The Numeric keys There are ten numeric keys, plus a decimal point. These are used primarily for entering the desired RF measurement frequency. The unit accepts frequency settings of up to four digits plus a decimal point. Key in the desired frequency and then press the Enter key. The numeric keys are also used to set the System
1
2
3 4
5 6 7

Tomco Technologies
TE1000 RF Vector Impedance Analyser Page 9
characteristic impedance. Press the System Zo key, followed by the desired numeric keys, followed by the Enter key. Finally, when the unit is in Scan mode, the top two rows of numeric keys function as up/down steppers, which increment the three least significant frequency digits up or down with each press.
3 The Enter key The Enter key has two functions. If pressed after one or more of the numeric keys, it sets the RF measurement frequency (or the system characteristic impedance) to the figure entered. If pressed without prior keying of any numeric keys, it switches the unit into Scan mode. Once in Scan mode, pressing the Enter key again switches the unit back into normal numeric entry mode.
4 The Measurement Mode keys In addition to RF impedance, the TE1000 can measure complex reflection coefficient, return loss, VSWR, and equivalent R-L-C circuit values. Press any one of these keys to display the desired parameter. Note that VSWR, Return Loss and reflection coefficient measurements require a value for the system Zo. Most often, this will be 50 or 75 ohms, but the TE1000 allows any value to be entered. Once a value for Zo has been entered, it becomes the power-up default until a new value is entered.
5 The Format key The TE1000 offers two options for the display format of complex results. These are: Polar format which displays magnitude in ohms and angle in degrees, and

Tomco Technologies
TE1000 RF Vector Impedance Analyser Page 10
Rectangular format which displays real (resistance) and imaginary (reactance) components in ohms. Pressing the Format key toggles between these options when measuring a complex parameter (that is, impedance or reflection coefficient). An arrow on the right-hand side of the display indicates the selected display format. When the TE1000 is in R-L-C mode, pressing the Format key toggles between the series or parallel equivalent circuit models. Again, an arrow on the right-hand side of the display indicates the selected display format. At a given frequency any network can be represented as a simple two-element R-L or R-C equivalent circuit, which in turn can be represented by either a series or parallel model. The TE1000 can display the results using either of these models. The meanings of the displayed results are as follows: Series model: The equivalent series two-element R-L-C circuit. For example, a display of 25 ohms, 15pF means that at the particular measurement frequency the impedance looks like a 25 ohm resistor in series with a 15pF capacitor. Parallel model: The equivalent parallel two-element R-L-C circuit. For example, a display of 37 ohms, 85pF means that at the particular measurement frequency the impedance looks like a 37 ohm resistor in parallel with a 85pF capacitor.
6 The System Zo key When measuring quantities whose value depends on the characteristic impedance (Zo) of the circuit, the Zo key is used to enter that parameter. Measurements affected by the Zo parameter are VSWR, Return Loss and Reflection Coefficient: the current Zo setting will be displayed on the screen whenever it is relevant.

Tomco Technologies
TE1000 RF Vector Impedance Analyser Page 11
To change the value of Zo, press the Zo key, followed by the desired Zo value in ohms, followed by the Enter key. The new value remains set until you change it again.
7 The display format indicators The currently selected display format is indicated by a small arrow at the right of the display screen. Pressing the Format key toggles the display format.
Power Supply The TE1000 is powered either by an internal, rechargeable battery or by a 110-240V AC mains supply via the plug-pack adaptor provided. The battery can supply enough power for more than 2 hours of continuous use. When the plug-pack is connected, the battery will automatically recharge when the TE1000 is turned off: full recharging takes approximately 12hours. When operating on battery power, a warning beep will sound every few minutes to remind the user to switch the unit off when it is no longer in use.
Earthing Precautions
Note that the plugpack is not referenced to mains earth. Therefore, when the TE1000 is powered by the plugpack the chassis and probe may float to a finite voltage with respect to mains earth.
Tomco Technologies
TE1000 RF Vector Impedance Analyser Page 12
When probing delicate circuits and components it is recommended that the user connects the chassis to earth using the earth bolt on the bottom plate of the chassis. This bolt is clearly marked “EARTH”. Alternatively the user can power the TE1000 via the internal battery in which case the chassis is automatically earthed.
CAUTION:
Never connect the TE1000 to any power source other than the DC plug pack originally supplied with it. Attempting to run the TE1000 from other power sources may cause irreparable damage to the
instrument, and may create a risk of electrical shock or fire.

Tomco Technologies
TE1000 RF Vector Impedance Analyser Page 13
Operating Hints
How to achieve accurate measurements The TE1000 is capable of extremely accurate measurements of a wide range of impedances. However, as with any high frequency measurement, a certain amount of care must be taken to ensure that the results are not "contaminated" by stray impedances. The following diagram illustrates the recommended technique for making measurements on a typical stand-alone electronic component.

Tomco Technologies
TE1000 RF Vector Impedance Analyser Page 14
Always observe the following recommendations when using the TE1000:
• Minimise any lead lengths between the probe and the impedance to be measured. Even a few millimetres of wire can be significant when measuring low impedances at high frequencies.
• Connect the load as close as possible to the base of the probe tip. This is the point which the TE1000 uses as its reference.
• Avoid having any excess lead length "hanging off" the probe tip: such lead length acts as a small antenna and appears as a capacitor in parallel with the impedance being measured. This can be significant when measuring high impedances at high frequencies.
• Keep your fingers clear of the probe tip when making a measurement. Hold the probe body and earth ring only.

Tomco Technologies
TE1000 RF Vector Impedance Analyser Page 15
Accessories
Using the probe coaxial adaptor The TE1000 is supplied with a special adaptor which allows the probe to be connected directly to a 50 ohm N-type coaxial connector. First, screw the adaptor onto the N-type socket. Then push the probe into the adaptor, taking care to ensure that the centre pin of the probe is aligned with the centre receptacle of the connector.
Using the probe earthing pin
The TE1000 probe earthing pin is designed to allow direct in-circuit probing of circuits or components.
When making in-circuit measurements, always follow the safety advice of the manufacturer of the circuit under test, and take extreme care to avoid electrical shock hazards. The maximum voltage that can be applied to the probe by the circuit under test for no damage to the probe is 50 volts DC or 20V AC peak. Note that these limits are for

Tomco Technologies
TE1000 RF Vector Impedance Analyser Page 16
no damage. High levels of RF interference will degrade the accuracy of the measurements.

Tomco Technologies
TE1000 RF Vector Impedance Analyser Page 17
Examples of Typical Measurements
General Use
1. Switch the TE1000 on by pressing the red on/off button and holding for a second or two. After self-calibrating, the display will show the previous settings
2. Place the probe tip on the sample to be measured with one end of the sample on the probe tip and the other on the probe casing. Note: To improve the accuracy of the measurement ensure that you are holding the probe casing and not touching the probe tip and that the sample lead lengths are as short as possible.
3. Enter the operating frequency in MHz, for example, to enter 120.5MHz press 1,2,0,decimal point, 5 and ENTER.
4. Select the measurement to be made by pressing one of the blue keys. The options are:-
impedance Z equivalent R-L-C circuit
R-L-C
standing wave ratio
VSWR
reflection coefficient
REFL COEFF
return loss RETURN LOSS

Tomco Technologies
TE1000 RF Vector Impedance Analyser Page 18
5. If you have selected impedance measurement the result can be displayed in either polar or rectangular format. For an R-L-C measurement the result can be displayed as either a series R-L-C or parallel R-L-C equivalent circuit. The desired format of the displayed result can be selected by pressing the green FORMAT button. The format selected is indicated by a right pointing arrow in the far right hand column of the display window.
6. Calculations of standing wave ratio, reflection coefficient and return loss involve the characteristic impedance of the system being measured. Thus, in order to calculate these parameters correctly the TE1000 must be told what the system impedance is. You can enter the system impedance by pressing the blue System Zo button, typing the required characteristic impedance in Ω and pressing the grey ENTER button. The TE1000 stores the entered value of system characteristic impedance and uses this value until a new characteristic impedance is entered. Hence, when the TE1000 is switched on, the characteristic impedance is set to the last value entered. The characteristic impedance is displayed in the display window as, for example, Zo=50Ω. The TE1000 accepts only real (resistive) values for system Zo.

Tomco Technologies
TE1000 RF Vector Impedance Analyser Page 19
Impedance measurement To measure impedance of a sample at 65.8MHz and display the result in polar coordinates.
1. Enter the frequency 6 5 • 8 ENTER .
2. Select impedance measurement Z .
3. Select polar format. First check the current format setting. This is indicated by the right pointing arrow in the display window. If this arrow points at Rectang, then the format is currently set at rectangular. To change to polar, press the FORMAT button and the arrow should now point at Polar.
4. The impedance of the sample will now be displayed in polar coordinates. The display window will show the following information. For this example we have assumed an impedance at 65.8MHz of 50Ω<10.
65.800MHz >
Z:
50.0 Ω ∠ 10.0
Polar
Rectang.
Series
Parallel

Tomco Technologies
TE1000 RF Vector Impedance Analyser Page 20
Scan Mode Measurements Follow steps 1 to 6 listed in the section headed "General Use". To go into scan mode press the grey ENTER button. The starting frequency is displayed with 6 arrows below 3 of the digits. For example, for a starting frequency of 120.0000MHz, pressing the ENTER button will result in the following frequency display:- 1 2 0. 0 0 0 0 MHz ttt uuu The frequency can be stepped either up or down by pressing the numbered keys on the keypad corresponding to the arrows on the display as listed below:-
Top left arrow 7 Top centre arrow 8 Top right arrow 9 Bottom left arrow 4 Bottom centre arrow 5 Bottom right arrow 6
The upward pointing arrows increment the corresponding digit of the frequency by 1 unit and the downward pointing arrows decrement the corresponding digit by 1 unit. For example to scan from 120MHz to 130MHz in steps of 1 MHz you would press button number 8 on the keypad ten times. To scan from 111MHz to 110MHz insteps of 0.1MHz you would press button number 6 ten times.

Tomco Technologies
TE1000 RF Vector Impedance Analyser Page 21
How the TE1000 works The TE1000's active probe injects a low-level RF signal into the circuit under test and samples the resultant voltage and current at the probe tip. The instrument measures the amplitudes of the voltage and current, and the angle between them. The TE1000 calculates the impedance in polar form from: Z = Z ∠θ where Z = V / I and θ = the measured phase between V and I, displayed in degrees. To display the impedance in rectangular form, the TE1000 calculates: Z = R ± jX where R = Z cosθ and X = Z sinθ To display reflection coefficient, the TE1000 calculates: Γ = (Z - Z0) / (Z + Z0) which it can display in either polar or rectangular form.

Tomco Technologies
TE1000 RF Vector Impedance Analyser Page 22
To display SWR, the TE1000 calculates: SWR = (1 + Γ) / (1 - Γ) which is dependent on the value of Z0, the system characteristic impedance, entered by the operator. To dispaly return loss, the TE1000 calculates: Return loss = 20 log10 ( 1 / Γ) which is a scalar quantity displayed in dB. To display the equivalent series R-L-C circuit of the measured impedance the TE1000 calculates the following from the polar impedance: Rs = Z cosθ and either Cs = 1 / ( 2 π f Z sinθ ) if θ is negative, or Ls = (Z sinθ ) / ( 2 π f ) if θ is positive. To display the equivalent parallel R-L-C circuit of the measured impedance the TE1000 calculates the following from the equivalent series circuit: Rp = ( Rs
2 + Xs2 ) / Rs
and

Tomco Technologies
TE1000 RF Vector Impedance Analyser Page 23
Xp = ( Rs
2 + Xs2 ) / Xs
from which the capacitance or inductance is then calculated.
Tomco Technologies
TE1000 RF Vector Impedance Analyser Page 24
Examples of other quantities the TE1000 can measure
Measuring the length of a coaxial cable
Connect the TE1000 to the cable, and terminate the cable with a "perfect" reflector - an open circuit is usually the easiest. If the total electrical length of the cable is less than one half-wavelength then the angle of the reflection coefficient (in polar format) is twice the electrical length of the cable: Electrical length in degrees = angle of reflection coefficient / 2 Furthermore, if the velocity factor Fc of the cable is known then the physical length of the cable can be calculated from: Physical length = ( electrical length in degrees x Fc x 3 x 10⁸ ) / (360 x frequency in Hz ). For example, if the reflection coefficient is 0.5∠40° then the cable is electrically 20° long. If the velocity factor of the cable is 0.66 and the frequency is 10MHz, then the cable is physically 1.1 metres long. Note that if the cable is between one quarter and one half wavelengths long, the angle displayed will be negative. In this case, convert the negative angle to a positive one by adding 180 degrees, before dividing by two. For example, if the displayed angle is -110 degrees, convert this to 110+180 = 290 degrees first.

Tomco Technologies
TE1000 RF Vector Impedance Analyser Page 25
Measuring the loss in a length of coaxial cable
Connect the TE1000 to the cable, and terminate the cable with a "perfect" reflector - an open circuit is usually the easiest. Then the loss in the cable is equal to the return loss divided by two. In other words, the return loss is the total loss in the cable, to the end and back again.

Tomco Technologies
TE1000 RF Vector Impedance Analyser Page 26
Technical Specifications Model number TE1000 Frequency range 0.5 - 150MHz
Frequency Resolution
0.500 - 9.999MHz in 1kHz steps 10.00 - 99.99MHz in 10kHz steps 100.0 - 150.0MHz in 100kHz steps
Measures impedance at any angle. Impedance
measurement range
The accuracy depends on the impedance being measured. Guaranteed accuracy for 3 standard impedances are listed below
impedance=50Ω magnitude ±1%, angle ±1° impedance=10Ω magnitude ±3%, angle ±3° impedance=1kΩ magnitude ±2%, angle ±3°
Measurement speed
Display updated every 500 milliseconds approx.

Tomco Technologies
TE1000 RF Vector Impedance Analyser Page 27
Measurement modes
• Complex impedance in polar or rectangular form
• R-L-C in series or parallel equivalent circuit format
• SWR for any system characteristic impedance
• Complex reflection coefficient for any system characteristic impedance.
• Return loss in dB for any system characteristic impedance
• Swept measurements and data logging to a PC via the RS232 serial port
SWR measurement range
Greater than 100:1 (depends on system characteristic impedance)
Power source DC plug-pack or internal battery Display 80 character alphanumeric LCD Measurement Probe
Active probe on 1 metre cable. Allows direct in-circuit measurements.
Test signal In order to make a measurement the probe
applies a pulsed RF test signal to the impedance under test. The characteristics of this test signal are: Open-circuit voltage approx. 35mV peak. Source impedance approx. 150 ohms.

Tomco Technologies
TE1000 RF Vector Impedance Analyser Page 28
Maximum voltage at probe tip
The voltage applied to the probe tip must not exceed 50 volts DC or peak AC.
Battery lifetime Approximately 2-3 hours Interface RS232 on 9-pin D
Software runs under Windows 95/98 Weight 1.9kg Dimensions 250w x 200d x 80h Accessories supplied
• Operation handbook • Windows interface software permits
swept frequency measurements and data logging.
• Coaxial adaptor (adapts the probe to plug directly onto an N-type 50 ohm connector)
• Spring-loaded probe grounding pin • Protective aluminium carry case
Optional accessories
• SMD tweezer probe adaptor

Tomco Technologies
TE1000 RF Vector Impedance Analyser Page 29
Section 2: The TE1000 User Interface Software
Introduction The TE1000 User Interface Software enables the TE1000 RF impedance analyser to be operated from your PC. It allows the user to capture data from the impedance analyser and display it in a wide range of graphical formats. Key features of the software are:- • a simple, interactive user interface • graphical representation of impedance magnitude
and phase, and VSWR in a flexible user friendly format
• ability to cut and paste data into other applications • ability to view multiple plots simultaneously • ability to save complete experiments consisting of
data, multiple plots and annotations • ability to annotate and print plots directly
Hardware and Software Requirements The TE1000 User Interface Software can only be used with the Tomco TE1000 RF Impedance Analyser. To install and run TE1000 User Interface Software you will need the following:-

Tomco Technologies
TE1000 RF Vector Impedance Analyser Page 30
• Installation of the Java 2 Platform, Standard Edition v1.4.1 Runtime Environment:
The Java 2 Runtime Environment may either be installed separately, or as part of the TE1000 software installation.
Java is available for download from Sun Microsystems at the following URLs: http://java.sun.com/j2se/1.4.1/download.html
http://java.sun.com/getjava/index.html • One the following operating systems:
Microsoft Windows 98 (1st or 2nd edition), NT 4.0 with Service Pack 5, ME, XP Home, XP Professional, 2000 Professional, 2000 Server, or 2000 Advanced Server operating systems running on Intel hardware.
The TE1000 software has been tested on the following platforms: Windows 98, ME, XP Home. Other platforms may be tested by running the TE1000 demo applet at http://www.tomco.com.au/TE1000software.html
• A Pentium 166MHz or faster processor with at least 64 megabytes of physical RAM. The TE1000 software requires 4MB of free disk space, or 24MB of free disk space if installed with the Java 2 Runtime Environment. If Java is installed separately, 70MB of free disk space is required.
Tomco Technologies
TE1000 RF Vector Impedance Analyser Page 31
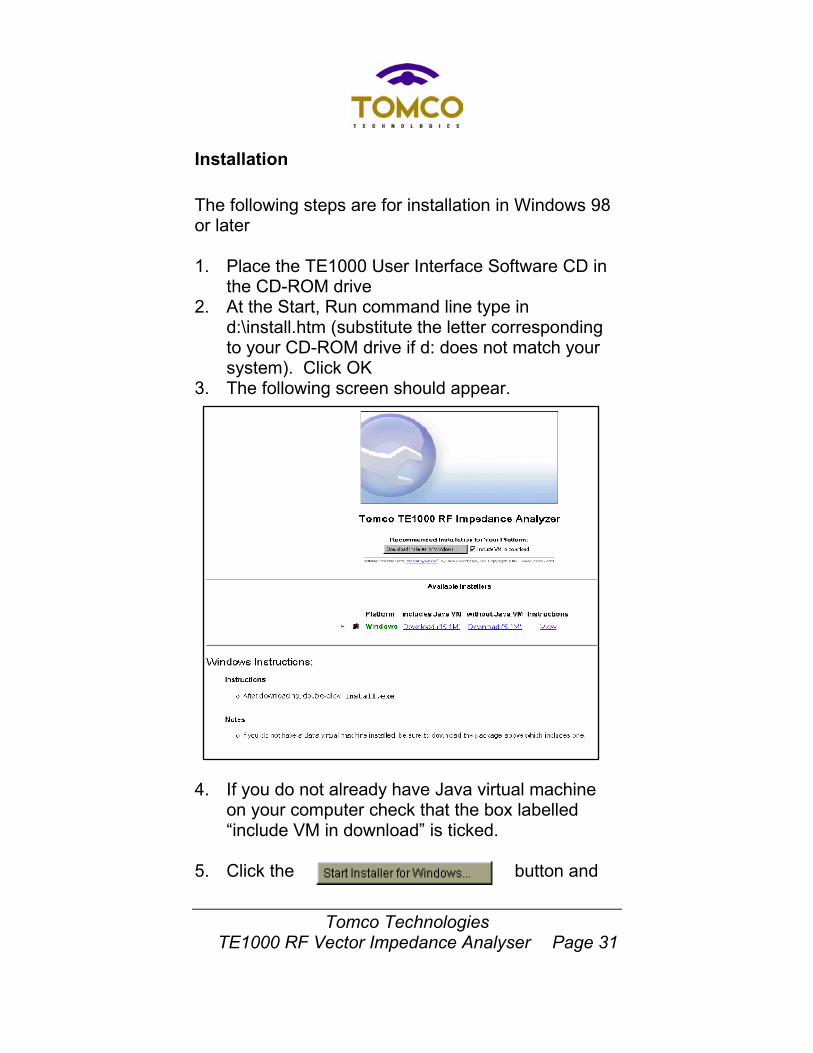
Installation The following steps are for installation in Windows 98 or later 1. Place the TE1000 User Interface Software CD in
the CD-ROM drive 2. At the Start, Run command line type in
d:\install.htm (substitute the letter corresponding to your CD-ROM drive if d: does not match your system). Click OK
3. The following screen should appear.
4. If you do not already have Java virtual machine
on your computer check that the box labelled “include VM in download” is ticked.
5. Click the button and

Tomco Technologies
TE1000 RF Vector Impedance Analyser Page 32
follow the on-screen instructions to complete the installation. The default location for the TE1000 software is Program Files\TE1000 RF Impedance Analyser
6. Alternatively, if you decide not to use the Zero-G applet then double click on either the Download(15.1M) or Download(5.1M) links according to whether or not you require Java VM.
You should now have the TE1000 User Interface Software and Java virtual machine installed on your computer.
Running the TE1000 Software Connect the TE1000 RF Impedance Analyser to a serial port on your computer using the serial cable supplied with the Impedance Analyser. This cable connects to the port marked RS232 on the rear panel of the Impedance Analyser. Ensure that the TE1000 is switched on. In Windows, click on the TE1000 icon in the Start, Programs menu. If you have not used the default folder location then double click on TE1000.exe, located in your chosen folder. The TE1000 User Interface screen will appear. If the TE1000 is not connected correctly to the PC an error message will appear.

Tomco Technologies
TE1000 RF Vector Impedance Analyser Page 33
Note that the function of the data fields and buttons on the screen is indicated by tool-tips which are activated by placing the mouse over the relevant area on the screen.
Quickstart For a quick start to collecting and displaying data follow these steps:- • type the start frequency into the “Start(MHz)” field
• type the stop frequency into the “Stop(MHZ” field
• type the number of frequency steps required into
the “# Samples” field
• select either linear or log frequency step interval
• click on the “Start” button
• Data will be logged point by point from the
TE1000 RF Impedance Analyser and will appear
in the “Frequency MHz”, “Magnitude Ω” and
“Phase°” columns.
• The data logging can be stopped at any time by
clicking on the “Stop” button. To continue logging
data click on the “Continue” button.
• Plots of the data can be displayed by selecting
the required graphical representation from the

Tomco Technologies
TE1000 RF Vector Impedance Analyser Page 34
selection listed in the drop down menu under
“View”.
• The data and plots can be saved to a file by
selecting the “Save” option under “File”.

Tomco Technologies
TE1000 RF Vector Impedance Analyser Page 35
Reference
What’s on the TE1000 interface screen?
Menu Bar
The menu bar is across the top of the screen and contains the commands File, Setup, View, Help File menu – opening, closing and saving experiments
open a new experiment
open an existing experiment
save the current experiment to a file (CSV format )
close the current file without saving
exit TE1000 software

Tomco Technologies
TE1000 RF Vector Impedance Analyser Page 36
In the TE1000 User Interface Software a data set is termed an Experiment. When an Experiment is saved, the data set is saved in CSV format. Any plots which have been generated from the data will not be saved, but must be re-generated when the experiment is re-opened. However, note that it is possible to save plots individually as PNG image files. Edit menu – setting the baud rate The Edit menu allows the user to set the baud rate. For the current generation of TE1000’s the baud rate must be set at 9600 at all times. The user can obtain information about the serial port to which the TE1000 is connected by clicking the “Scan for TE1000” button.
Tomco Technologies
TE1000 RF Vector Impedance Analyser Page 37
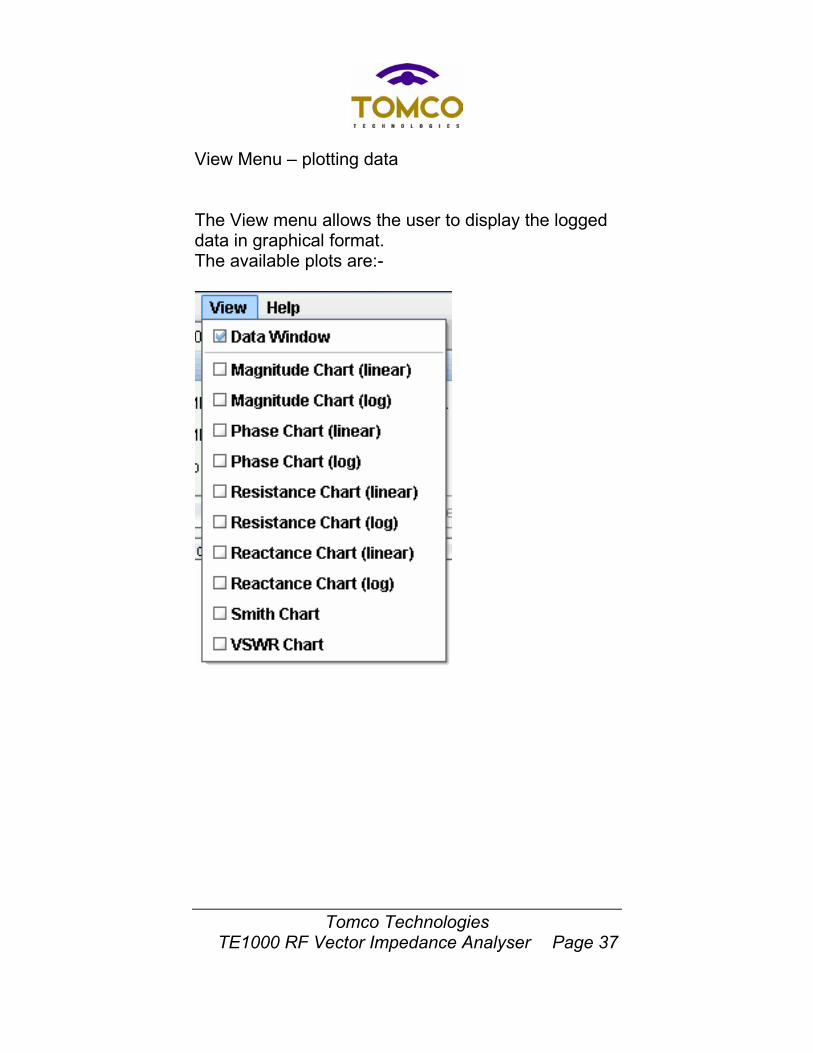
View Menu – plotting data The View menu allows the user to display the logged data in graphical format. The available plots are:-

Tomco Technologies
TE1000 RF Vector Impedance Analyser Page 38
Help Menu – product information
Experiment Name
A data set is termed an Experiment. Each experiment is labelled as shown above. Select an experiment by left clicking on the Experiment name. The data set and plots corresponding to the selected Experiment will be displayed. By right clicking on the Experiment name the user can access the Experiment menu shown below, allowing the user to rename, save and close the Experiment. Before the Close command is executed the user will be asked if the experiment is to be saved. Note that only the data set will be saved.

Tomco Technologies
TE1000 RF Vector Impedance Analyser Page 39
Data Window The data window is automatically generated when the user opens a new Experiment. The data window is the interface for sending commands to the TE1000 RF impedance analyser and for logging data measured by the analyser. Frequency Setting The start and stop frequencies and the number of frequency samples are entered into the fields below. Frequencies are entered in Megahertz. #Samples is the number of samples you want the TE1000 to take over the chosen frequency range.
Frequency sweep settings Linear (that is, constant) or logarithmically increasing frequency step intervals can be selected by left clicking on the “Linear” or “Log” button. By selecting the Loop option, the frequency sweep will repeat continuously until the Stop button is

Tomco Technologies
TE1000 RF Vector Impedance Analyser Page 40
selected. As the Impedance Analyser repeatedly loops through the frequency range. Control buttons Data logging is started by left clicking on the Start button. It can be stopped at any time by left clicking the Stop button and restarted by left clicking the Continue button. The data can be cleared by selecting the Clear button. This action will also clear any plots present. Data display Data are displayed in 3 columns:-frequency in Megahertz, impedance magnitude in Ohms and impedance phase in degrees.
Data Logging – overwriting data, adding more data points and other features Data is logged from the impedance meter sequentially from start to stop frequency. If a frequency sweep is stopped and then Continue is selected, data will continue to be logged from where the sweep was stopped. The data points already collected will not be cleared or overwritten. If a sweep is completed or stopped and then Start is selected, the new data will be merged with the data

Tomco Technologies
TE1000 RF Vector Impedance Analyser Page 41
already collected. Any data at new frequencies will be inserted in the appropriate position in the existing data. Any data at an existing frequency will overwrite the previous data point. This feature enables the user to gain increased resolution at frequencies of interest.

Tomco Technologies
TE1000 RF Vector Impedance Analyser Page 42
Plotting data Plots are generated using the roll-down View menu in the main menu bar. Select the required plot by clicking on the corresponding button in the View roll-down menu. Multiple plots can be selected and displayed simultaneously.
Available plots Magnitude chart (linear) Impedance magnitude in
ohms as a function of frequency in MHz. Frequency is displayed on a linear x-axis. Impedance magnitude is displayed on a linear y-axis.
Phase chart (linear) Impedance phase in
degrees as a function of frequency in MHz. Frequency is displayed on a linear x-axis. Impedance phase is displayed on a linear y-axis.
Magnitude chart (log) Impedance magnitude in ohms as a function of frequency. Frequency is

Tomco Technologies
TE1000 RF Vector Impedance Analyser Page 43
displayed on a logarithmic x-axis. Impedance magnitude is displayed on a linear y-axis.
Phase chart (log) Impedance phase in
degrees as a function of frequency.
Frequency is displayed on a logarithmic x-axis. Impedance phase is displayed on a linear y-axis.
Resistance chart (linear) Real component of
impedance (resistance) as a function of frequency.
Frequency is displayed on a linear x-axis. Resistance is displayed on a linear y-axis.
Resistance chart (log) Real component of
impedance (resistance) as a function of frequency.
Frequency is displayed on a logarithmic x-axis. Resistance is displayed on a linear y-axis.
Reactance chart (linear) Imaginary component of
impedance (reactance)

Tomco Technologies
TE1000 RF Vector Impedance Analyser Page 44
as a function of frequency.
Frequency is displayed on a linear x-axis. Resistance is displayed on a linear y-axis.
Reactance chart (log) Imaginary component of
impedance (reactance) as a function of frequency.
Frequency is displayed on a logarithmic x-axis. Resistance is displayed on a linear y-axis.
Smith chart The impedance data are
displayed on a Smith chart. The characteristic impedance is user-settable.
VSWR VSWR is displayed as a
function of frequency in MHz. Frequency is displayed on a linear x-axis. . The characteristic impedance is user-settable.
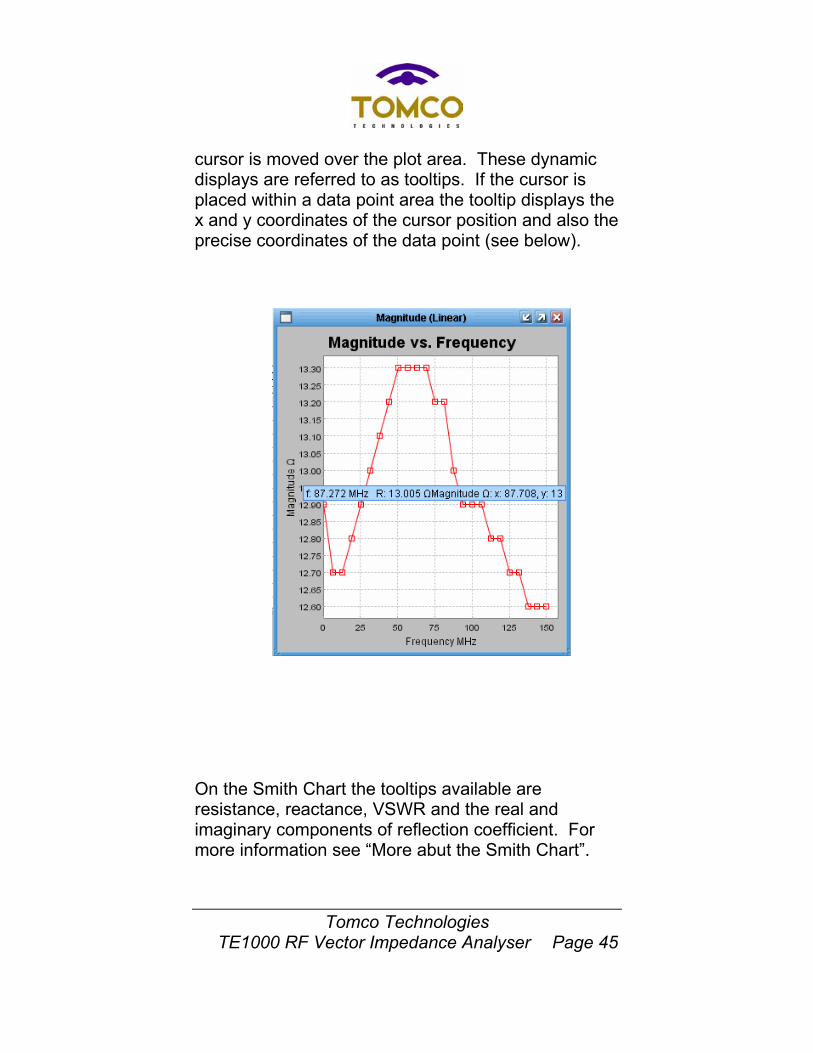
Tooltips On all of the plots the x and y coordinates of the cursor are displayed in a drop down window as the
Tomco Technologies
TE1000 RF Vector Impedance Analyser Page 45
cursor is moved over the plot area. These dynamic displays are referred to as tooltips. If the cursor is placed within a data point area the tooltip displays the x and y coordinates of the cursor position and also the precise coordinates of the data point (see below).
On the Smith Chart the tooltips available are resistance, reactance, VSWR and the real and imaginary components of reflection coefficient. For more information see “More abut the Smith Chart”.
Tomco Technologies
TE1000 RF Vector Impedance Analyser Page 46
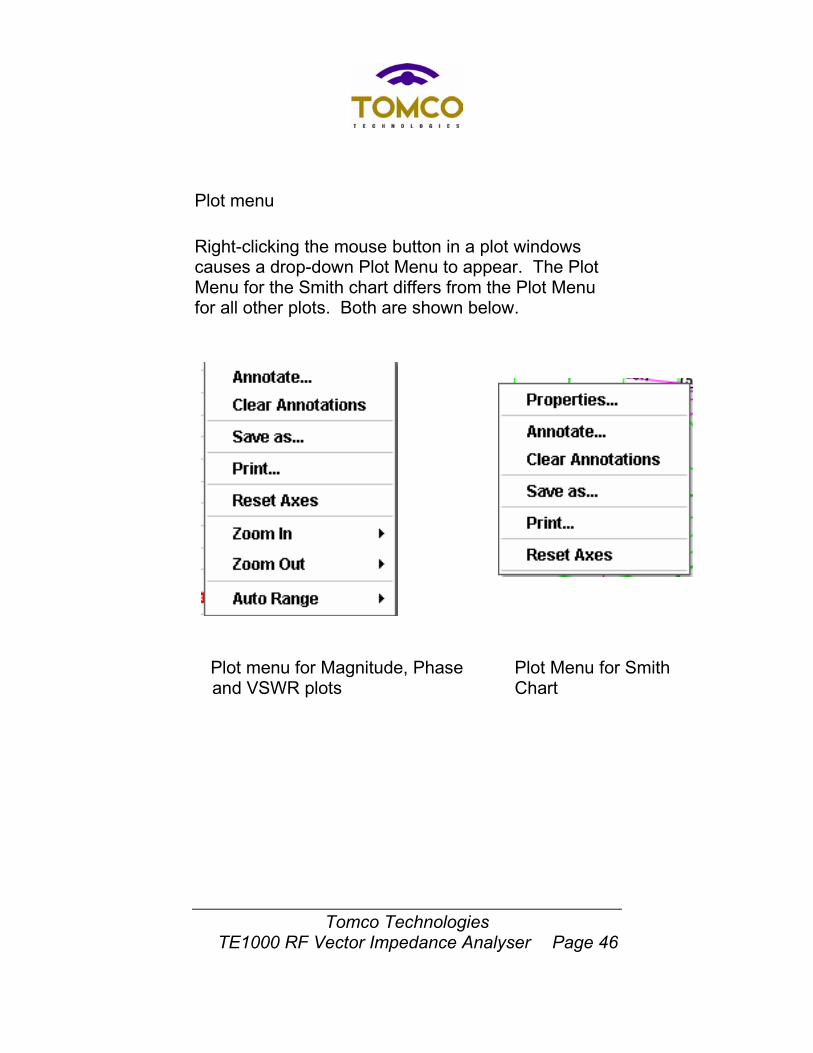
Plot menu Right-clicking the mouse button in a plot windows causes a drop-down Plot Menu to appear. The Plot Menu for the Smith chart differs from the Plot Menu for all other plots. Both are shown below.
Plot menu for Magnitude, Phase and VSWR plots
Plot Menu for Smith Chart

Tomco Technologies
TE1000 RF Vector Impedance Analyser Page 47
Annotating plots Clicking on the Annotate option allows the user to add notes to a plot in the form of a text string. The command window for entering the text is shown below.
Clear Annotations Selecting the Clear Annotations option will delete all annotations added to a plot Saving plots The Save As option allows the user to save the plot as a PNG image file Printing plots Plots can be printed by clicking on the Print option in the Plot Menu

Tomco Technologies
TE1000 RF Vector Impedance Analyser Page 48
Reset Axes The Reset Axes command redraws the plot on the original axes the plot was displayed on. Zooming in and out There are 2 techniques available for zooming into an area of a plot. The user can select an area of the plot by left clicking on the mouse button and dragging the cursor to select a rectangular box enclosing a sub-set of the data points. On releasing the mouse button the plot will be redrawn to display the selected range of data points only. This feature is available on all plots. Alternatively, the user can select the Zoom In command on the Plot Menu. The user then has the option of zooming in on both axes, the horizontal axis only or the vertical axis only. This command is not available on the Smith Chart.
To zoom out the user selects the Zoom Out command on the Plot Menu and then selects an
Tomco Technologies
TE1000 RF Vector Impedance Analyser Page 49
option from zooming out of both axes, the horizontal axis only or the vertical axis only. Zooming out to the original plot size can also be achieved by selecting Reset Axes. Autorange The Autorange command will automatically rescale the axes to fit the data points. The user has the option of selecting to autorange both axes, the horizontal axis only or the vertical axes only. If a plot is selected and no data is visible it may be due to the default scaling of the axes being too large. This can be rectified by autoranging both axes. The autoranging command is not available on the Smith Chart. Properties (Smith Chart only) The Properties command is only applicable to the Smith Chart and the VSWR plot. It enables the user to set the characteristic impedance of the system. This parameter is required in the calculation of VSWR and reflection coefficients. The characteristic impedance is entered into the Properties window as shown below. The default value is 50.0 Ohms. Clicking Reset to Default will set Zo back to 50 ohms.

Tomco Technologies
TE1000 RF Vector Impedance Analyser Page 50
More about the Smith Chart The Smith Chart is drawn as 2 sets of circles. The real component is represented by the green circles. The imaginary component is represented by the purple circles. The tooltip displays corresponding values of resistance, reactance, VSWR and real and imaginary reflection coefficient. The VSWR and reflection coefficient require a value for the characteristic impedance of the system. The default value is 50 Ohms. To change this value use the Properties command in the Plot Menu on the Smith Chart. The Properties command is accessed by right-clicking on the Smith Chart plot area. Zooming in on the Smith Chart can only be achieved by selecting an area with the cursor. To zoom out, select Reset Axes.

Tomco Technologies
TE1000 RF Vector Impedance Analyser Page 51
Resizing windows The Plot Windows and Data Window can be resized using the buttons on the window header (see below). Tooltips appear when the cursor is placed over these buttons to indicate their function. The windows can be resized by clicking and dragging on the corners of the window but the window must be in Restore mode to do this. It is not possible to click and drag the window to move it or resize it if Maximise has been selected.
Cutting, Copying and Printing Data In the Data window, data can be cut and pasted into other Windows applications as follows. Highlight the required data by holding down the left mouse button. Clicking on the right mouse button will then display the Data Menu (see below). Selecting Cut will delete the highlighted data from the data window and place the data on the clipboard. This data can then be pasted into other Windows applications. The data will be displayed in CSV format.
restor clos
minimis maximi

Tomco Technologies
TE1000 RF Vector Impedance Analyser Page 52
Selecting Copy will copy the data to the clipboard without deleting it from the data window. The Print command will print the data in CSV format.
How to “zero in” on a feature of interest. The TE1000 software is extremely useful in searching for and characterising features of interest in the impedance characteristic of the circuit under test. For example, imagine you want to check a circuit for resonances. First, a quick 10-point scan is made of the full 0.5-150MHz frequency range. This might reveal that the phase of the impedance changes sign somewhere between say 30 and 45MHz, indicating a possible resonance somewhere in that range. To “zoom in” on that range of interest, enter 30 and 45MHz as your new start and stop frequencies, and scan again. The new points will be added to the plots, resulting an enhanced resolution in the chosen range.

Tomco Technologies
TE1000 RF Vector Impedance Analyser Page 53
You can then zoom in on that portion of the plot, and repeat the process to add more data points until the full details of the resonance are revealed.
Support For support on the TE1000 Impedance Analyser or the User Interface Software, contact Tomco Technologies at [email protected]