tonal consonance and critical bandwidth - university of …psych.colorado.edu/~lharvey/p5665...
TRANSCRIPT

4.8, 4.9, 4.11, 4.12; 6.1 Received 26 April 1965
Tonal Consonance and Critical Bandwidth
R. PLoxip AND •V. J. 5[. LEVELT
lnslitute for Perception R I'O-TA'O, Soeslerberg, Netlterlamts
Firsfly, theories are reviewed on the explanation of tonal consonance as the singular nature of tone intervals with frequency ratios corresponding with small integer numbers. An evaluation of these explanations in the light of some experimental studies supports the hypothesis, as promoted by yon Hehnholtz, that the dif- ference between consonant and dissonant intervals is related to beats of adjacent partials. This relation was studied more fully by experiments in which subjects had to judge simple-tone intervals as a function of test frequency and interval width. The results may be considered as a modification of yon Helmholtz's conception and indicate that, as a function of frequency, the transition range between consonant and dis- sonant intervals is related to critical bandwidth. Simple-tone intervals are evaluated as consonant for frequency differences exceeding this bandwith. whereas the most dissonant intervals correspond with fre- quency differences of about a quarter of this bandwidth. On the base of tbese results, some properties of consonant intervals consisting of complex tones are explained. To answer the question whether critical bandwidth also plays a r61e in music, the chords of two compositions (parts of a trio sonata of J. S. Bach and of a string quartet of A. DvoCak) were analyzed by computing interval distributions as a function o• frequency and number of harmonics taken into account. The results strongly suggest that, indeed, critical bandwidth plays an important •61e in music: for a number of harmonics representative for musical instru- ments, the "density" of simultaneous partials alters as a function of frequency in the same way as critical bandwidth does.
INTRODUCTION
HM'S acoustical law, as fornmlated b\- yon Helmholtz, • states th;[t the human ear is able to analx-ze a complex of tones into its sim•soidal colnpon- ents. In a previous paper,'-' one of the authors reported experiments on the number of distinguishable partials of multitone signals and showed that partials can be "heard out" only if their frequency separation exceeds critical bandwidth.
The fact that there are certain limitations to the validity of Ohm's law was not overlooked by yon Helmholtz. In his opinion, however-, the exceptions did m,-mifcst themselves mailfly in the appearance of beats in the case of small frequency differences between two simultaneous tones. a On this basis, by taking into account also beats between adjacent harmonics, yon Hehnholtz was able to explain why the phenomenon of mnsicM consonance is rek[ted to simple frequency ratios of the tones involved. s Though this conception bectmm
• H. von Helmholtz, Die Leltre you der Tollelltpfiltd.tlltg½lt als physiologis,lte Grzmdlage flit die Tlteorie der Musik (Verlag F. Vieweg & Sohn, Braunschweig, 1863), Chap. 2.
a R. Plomp, "The Ear as a I.'requenc¾ Analyzer," J. Acoust. Soc. Am. 36, 1628-1636 (1964).
s Ref. 1, Chap. 8. • Ref. 1, Chap. 10.
well-known, it was criticized severel!' , in particular by psychologists and musicologists.
in this paper, the relation between beats amt conson- ance is studied again. • To avoid misunderstandings, it may be useful to emphasize in advance that our sole concern is the question of why consonance is related to simple frequency' ratio. Though the concept of conson- ;race is rather yahroe and may be different for nmsicians and laymen, this relationship is alwavs involved. In our opinion, consonance refers to the peculiar sensorial experience associated to isolated tone pairs with simple frequency ratios. We use the term lottal consottauce to indicate this characteristic experience. As we shall see, experimental results concerning "tonal consonance" support yon Helmholtz's conception, but they also necessitate a number of qualifications in which the concept of critical bandwidth will appear to piti)' an important r61e.
a A preliminary report of it was read at the Fourth International Congress on Acoustics, Copenhagen, 1962: R. Plomp and W. J. 51. Levelt, "Musical Consonance and Critical Bandwidth," Paper P55 in Proceedings of the Fourth [•ter•tational Congress on Acoustics, 1962, Copenl•agen (Organization Committee of the 4th ICA and Harlang & Toksvig, Copenhagen, 196,t).
548

TONAL COXSONANCb; ANI) CP. ITIC:\I. I/ :\ X I) \V I I) T If 549
I. HISTORICAL REVIEW
A. Explanations of Consonance
Tradition'ally, Py'thagoras is considered to l)e the discoverer of lhe fad that tones produced by a string vibrating in two parts with length ratios of I :1, I :2, 2:3, and 3:4, rcspeclively, give much betlcr harmonics than all other ratios. These tone intervals were called
consonances, and on lheir singnlar character the har- mony of Western music has been developed, especially after, in the •[iddle Ages, olher interwds with ratios of 4:5, 3:5, 5:6, and 5:8 were accepted as hnperfect eonsollaBcos.
The question why consonance is related to simple integer ratios of string lengths has occupic(l many scholars through lhe ages. [n [)arl[cular, between about 1860 and 1920 ntln]erolts studies were devoted to it. Nssenlk, Ilv all explanations propose(f; are based on one or more of the following data.
1. Freqtte•zcy Ralio
One of the first and most iml)orlant discoveries in aCO•lStiCS dUl'hlg the rise of modern science in the 161h and 17th centuries was lhe dependence of pitch on frc(lUcncy. 7 The latter implied that consonant intervals arc characterized hv simple frequency ratios, which suggested an aUraetire hypolhesis concerning lhc origin (•f consonance. So (;alild stated: "Agreeable corn sommecs a•c pairs of tones which sn'ike the car wilh ;• certain regularity; lhis regularity consists i• lhe fact that the pulses delivered by lhe two tones, in the same interwd of time, shall t)e commcl•snral)le in humher, s(} as not to keep the car drum in perpetual torment, [)ending in two different directions in order to yield to the ever (tiseordant impulses. "s Other scionlists ;[s Lcibniz and Eu[cr refined this explanation, cxchang• ing the eardrun• for the unconsci(mslv counting soul that would prefer intervals the more ;ts the viln'ations of the constituting tones concur more frc(lncntly. Substantially the same idea was promoted and worked out by Lipps • and Polak, TM whereas the recent "common long pattern theory" of Boomsliter an(t Creel TM also must be considered as belonging to lhis group.
• In this survey: onIy explanations related to hearing theory are include&
7 A thoroughgoing study of this discovery is given hy C. Trucs- dell, The Ralio,al Mechanics of Flexible or Elaslic Bodies, 163,¾- 17&¾, Leonhardi Euleri Opera Omnia Set. 1X, 11, Pt. 2 (Verlag O. Fassli, Ztirlch, 1960), Pt. 1.
• Galileo Galilei, Disc•rsl e dimoslrazi,•zi mittem•tichc inler;•o d due nuove scienze allenenll alia mecanica ed i movimenli locali (Elsevier, Leiden, 1638). The quotation is from the English translation, •'aloj;ues concerni•g Tzeo New •5'cicnccs, tranM. by H. Crew and A. de SaMo (McGraw-Hill Book Co., Inc., New York, 1963), p. 100.
• Th. I.ipps, Psychologische Studten (Verlag G. Weiss, I Ieidel- berg, lg85), pp. 92-161.
•0 A. J. Polak, [)ber Zeilei,heil i•z Bez•tg a•tf Konso;•anz, 11ar- mo,ie mzd Tomtlildl (Verlag Breitkopf & Hartel, I.eipzig, 1900).
n p. Boomsliter and W. Creel, "The Long Pattern Hypothesis in Harmony and ficaring," J. Music Theory 5, No. 2, 2 30 (1961).
2. Rdalio,ship c( Harmo,ics
The discovery (17th century) that the tones of musical instrtm•cnts are composed of partials 2 gave rise to an alternative explanation of consonance. AI first, the mere presence of harmonics with frequency ratios 1:2, 2:3, etc., ia every (complex) tone xvas considered as a sufficient proof of the consonance of these ratios (Ramean). In the 19th century, more-thoroughly formulaled implications of 1he existence of harmonks were presented. Both yon Helmholtz •2 and Wundfi :• 1)ascd lhe development of melody and harmony on the coinciding harmonics for consorator interwds. The oi)inion that consonance itself originates in these coin- cidences was defended more recently by Ogden TM and Husmann, •:' though from different points of view. Montani •'; has tried to give this exphmation a phy- siologicai base.
3. Beals belwee•t Harmo,ics
The existen(:e of harmonics led also to a quite different hypothesis, in which tl•e phenomenon of consonance was relaled to beats and ronghness, appearing for small frequency difi'crences of simnltaneous tones. Though nearly always yon Hdmholtz is mentioned as the originalor of 1his conception, there are nmch older statements of x quite similar nature (Sorge•7). von Hclmholtz a staled lhat for small frequency differences the heats between two simple tones can be heard in- dividually, bul for larger distances this becomes impossi- hie, due lo 1heir rapid succession, and the sound obtains a rongh and unpleasant char•;cter. He ascertained that this roughness has a n•aximum for a frequency difference of 30-40 cps, independent of frequency, but admitted also that for a constant difference the roughness in- creases wi/h frequency. For larger frequency differences, roughness decreases and the sound becomes consonant and agreeabl% independent of frequency ratio. For complex tones, as produced by ransteal instruments, also beats between harmonics of the lower tone and harmonics of lhe. higher one must he taken into account. in this way, yon Hehnholtz explained 4 that the smaller that the numbers are in which the frequency ratio can be expressed, the more consonant the interval is. The octave, with a frequency ratio of 1:2, is the most con- sonant interval because all partials of the higher tone coincide with partials of the lower one and no beats are introduced. The next most consonant intervaI is the
•.o Rel'. 1, Chaps. t4, 15. •s W. Wundt, Grtmdziige der physiologischea Psychologie (Verlag
W. Engelmann, l.cipz[g, 1880), 2nd ed., Vol. 1, pp. 402-408; Vol. 2, pp. 35-48.
n R. M. Ogden, ":\ Contribution to the Theory of Tonal Con- sonance," Psychoh Bull. 6, 297-303 (1909).
•:' H. I lusmann, I:om Weseu der Konso,anz (M filler-Thiergarten- Verlag, Heidelberg, 1953).
v; A. Montani, "Outline of a Physiological Theory of Musical Consonance," Riv. Musicale ltal. 49, 168 176 (1947).
l• G. A. Sorge, Vorgcmach der m•tsicalischcn Compositio, (Verlag des Autoris, I,ohen,cin, 1745 1747), PD. 333, 334.

550 PLOMP AND LEVELT
fifth (2:3), for in this case half of the partials coincides, whereas the other ones lie just half-way between partials of the lower tone. He considered it an affirmation of his theory that, in musical practice, thirds and sixths are avoided in the low-frequency range where partials are nearer to each other than at higher frequencies.
4. Difference Tones Though yon Hehnholtz had not denied that also
beats between difference tones may contribute to dis- sonance, this aspect was much more emphasized by Preyer, •s and in particular by Krueger? "2ø On the basis of detailed experiments on difference tones, '2t Krueger concluded that the significance of these tones was strongly underestimated by yon Helmholtz. As the total number of difference tones increases with com- plexity of frequency ratio, these tones could explain the order of consonant interwds, not only for complex but also for simple primary tones. More recently, Sandig 22 compared the character of intervals with both tones presented to the same ear and intervals with one tone presented to the left and the other one to the right ear, respectively, regarding the more neutral character of interwds in the last case as an affirmation of Krneger's theory.
5. Fusion
A quite different point of view was developed by Stumpf? In his opinion, neither harmonics nor differ- ence tones are essential to discriminate between consonant and dissonant intervals, whereas he re- jected the frequency•ratio theory its mere specula- tion. Stumpf called attention to the fact, investigated by him before 24 and confirmed by many others after him, that the degree of fusion ("Verschmelzung") of intervals depends on simple frequency folio in the same order as consonance does. By fusion, he meant the tendency of two simultaneous tones to be perceived as a unity. Stmnpf understood the close connection to con- sonance as a causal relation, fusion being the basis of consonance. However, many years latter, he admitted that this conclusion was not justified and that the rela- tion cannot be considered as a satisfactory explanation of the consonance phenomenon. 2•
• W. Preyer, Akustlsche Unlersuchunge•z (Verlag G. t:ischer, Jena, 1879), pp. 44 61.
• F. Krueger, "Differenztdne und Konsonanz," Arch. Ges. Psychol. 1, 205-275 (1903);2, 1-80 (1904).
20 F. Krueger, "Die Theorie der Konzonanz," Psychol. Studfen 1, 305-387 (1906); 2, 205-255 (1907); 4, 201 282 (1909); S, 294-411 (1910).
2 A summary of the results of these experiments can be found in R. Plomp, "Detectability Threshold for Combination Tones," J. Acoust. Soc. Am. 37, 1110-1123 (1965).
221•. Sandia, "Beobachtungen an Zweikl/•ngen in getrennt- ohriger und beidohriger Darbietung. Ein Beltrag zur Theorie der Konsonanz," Neue Psychol. Studfen 14, 25-131 (1939).
2aC. Stumpf• "Konsonanz und Dissonanz,"_Beitr. Akust. Musikwiss. 1, 1-108 (1898).
2• C. Stumpf, Tonpsychologie (Verlag S. Hirze], Leipzig, 1890), Vol. 2, pp. I27-218.
2a C. Stumpf, Die Sprachlaute (Verlag J. Springer, Berlin, 1926), p. 281.
B. Evaluation of These Explanations
The existence of these divergent theories suggests that consonance is a complex phenomenon and that conclusive experiments on the wdue of the explanations mentioned are difficult to find. In contrast with the time before about 1920, modern books on hearing pity only little or no attention to consonance. 2• Is this lack of interest justified and must we adnfit that those in- vestigators are right who considered consonance as determined mainly or exclusively by culturaP-L2 or even genetic 14.• factors?
In answering this question, we have to realize that our consommce perception is indeed profoundly in- fiuenced by the development of Western music and musical training. This is illustrated in two ways.
1. The primary reason why yon Helmholtz's ex- planation of consonance bv beats wats rejected by many investigators wits that in their opinion the degree of consonance or dissonance of an interval is not altered by removing the harmonics of the component tones. A stndy of the observations on which this opinion was based shows that, without exception, musically trained subjects were used to judge the intervals. This w:•s not considered ils a difficulty but, on the contrary, as an essential condition to obtain relevant responses. Stumpf himself, perhaps the most important critic of the beat theory, may be presented as it good illustration. His large interest in the psychology of tone was due to the fact that originally he intended to become a nmsician. aø For him, judgment of a particular tone interval was identical to finding out its musical name, and this knowledge determined entirely the consonance value that he attached to the interval. For this reason, he considered intervals like 8:15 and 7:10 as dissonants, also in cases without audible harmonics and difference tones. Appltrently, this approach was so self-evident to him (and many others) that he did not realize that his resttits had nothing to do with the origin of consonance and dissonance but must be considered only as at demon- stration of the success of his musical education and training. The large influence of training wats demon- strated by an investigation by Moran and Pratt :• in
• This may he illustrated hy S.S. Stevens and H. Davis, Hearing (John Wiley & Sons, Inc., New York, 1938). Though 13. G. Boring in his "Perspectivc" at the beginning of the book refers to the work of H. yon Hehnholtz and closes with the words, "Certainly we are ready now for a new Lehre yon den Tonempfin- dungert to orient us among the complexities of the new physiologi- cal acoustics which is now so successfully answering questions which Helmho]tz posed," this book spends only one paragraph to the phenomenon of consonance, merely mentioning yon Helm- holtz's expanation without comments.
27 N. Cazden, "Musical Consonance and Dissonance: A Cultural Criterion," J. Aesthet. 4, 3-11 (1945).
2s R. W. Lundin, "Toward a Cultural Theory of Consonance," J. Psychol. 23, 45 49 (1947).
2u H. T. Moore, "The Genetic Aspects of Consonance and Dissonance," Psychol. Monogr. 17, No. 2, 1-68 (1914).
• C. Stumpf, To•psychologie (Verlag S. Hirzel, Leipzig, 1883), Vol. 1, Preface.
a• H. Moran and C. C. Pratt• "Variability of Judgments on Musical Intervals," J. Exptl. Psychol. 9, 492-500 (1926).

TOXAI. COXS;ONAXCE :\Xl} CRITICAl. 11:\N1) WII)TH 551
which 3 ol)servcrs, who were able Io recognize any given lntlsical interval, had to adjust the frequency of nile Ihe Ioncs of each of a series of inlcrvals lo Ihe corret t value for fiutt interval. The resuhs, obtained for simple ioncs, indicaled lhat for each of the subjects the average settings were more in agreement with the interval widths afler the equally tempered scale, as used in ransic, lhan after the natur:d scale, given In' simple frequency ratios. These results show Ihat we have to mltkc a clear distinction between interval recognition and conson- ance judgmenl. The t[bilitv to recognize frequently used intervals does not explain why I he singuktr nalure of I he impressions produced by parlicul,tr intervals is rchttcd to simple frequency ralios of the component tones.
2. The inflnence of nutsic on lhe jndgment of intervals can be shown in another way also. Originally, only 1:1, 1:2, 2:3, and 3:4 were considered as con.•mlmt and agrce•d•le intervals. Nowadays, lhe situalion is much more complex. Asking a jury of musicians and psy- chologists to ascertain the nmk order of consonance of all intervals within the octave, M ahnbel'g• '• obtained the order 1:2, 2:3, 3:5, 3:4 and 4:5, 5:8, 5:6, 5:7, 5:q, 8:9, 8:15, and 15:16. (;uernsev *½ has conlirmcd lhc well-known facl that musicians make a clcttr distinc- tinn bet\\con pleasantness and consonance. In this sludy, it was fmmd that for a group of mnsicians lhc ranking of intervals for consommee was about 1 he s;une ,is that obtained by Maimberg, but lhe ordering in terms of pleasantness was qnite different: sixths (3:5, 5:8), thirds (4:5, 5:6), fourth (3:4), and minor seventh (S :9) did share the highest rank. For naive subjects, bnwcvcr, consommce and pleasantness are much more similar concepts, as was demonstrated by the authors a4 in an experiment in which 10 subjects had •o judge a large number of intervals on 10 different semantic scales. A high correlation between consommce and pleasanlness scores was frorod. In fact "consonance" appeared to be used as an evahmtion category. For these subjects, the sixths, thirds, and fourth were the most pleasant intervals, bnt their evalualion of the octave and lifth was nmch higher than for musicians, as wt•s also the case in (;uernscv's experiments. :*'* l"rom these rcsuhs, we may conchMe t hat t he original concept of consonance has been split up in two opinions: one hem by nmsicians, the other by naive subjects. This devclopnxent must be seen as a consequence of the fact that, in the course of history, preference did shift from intervals given by 1:2, 2:3, and 3:4 to more-complex frequency ratios. For laymen, the me:ming of the term cottsonance followed lhis shift. Musicians, however, did maintain the tradi- tional rank order of intervals in terms of consonance,
a-' C. F. Maimberg, "The Perceptiou of Consonance and Dis- sonance," Psychol. Monogr. 25, Xo. 2, 93-133 (1917-1918).
• M. Guernsey, "The Rfle of Consonance and Dissonance in Music," Am. J. Psychol. 40, 173-204 0928).
u j.p. van de Geer, W. J. M. Levelt, and R. Plomp, "The Connotation of MusicM Consonance," Acta Psychol. 20, 308-319 (1962).
ch;craclcl-izcd by smoothness and Ulfifornfity, indepcnd- (.'lit froIll cv•tlualiOl].
After these two digressions on the relation of con- soilaliCe to music Ihc {[tlcSl[r)ll can bc asked as lo how To evahtale the v•u-ious c(msonance explanations men- lioned in Sec. I A. in onr allcrept to answer this ques- tion, we are interested in perception of consonance not so nmch as a produel of ransteal erincation and lraining but as a basis of it. in our opinion, there exists a typical sensorial phenomenon that is related to simple integer frequency ratios and that is of a generM nature, holtling also fnr subjects without :my experience in musical harmony. This particular sensorial phenomenon, which we call "tonal consonance," may be considered to be basic to the relation between the concept of conson- ance, as hem by nmsicians aml laymen, and simple frequency ratios.
With lhese restrictions in mind, the resulls of only a few experiments are reitvain to decide upon the ruerils of the five different t3pcs of consommce ex- planation. The most pertinent study is that by Guthrie ;red Morrill :•:' on the judgment of inte,'vals composed of two simple tones. In this experiment, abmtt 380 subjects were presented with 44 different intervals, with frequency ratios from 1:1 to beyoral 2:3, and the subjects were asked to judge lhc interwd as consonant or dissonant, and as pleasant or unpleasant, respectively. In Fig. 1, the average results are reproduced. The fact lhal Ihc Iwo cur\-cs are quile similar is in agreement with lhc conclnsion, mentioned above, that for the naive subject the notions consonance and pleasantness are neath' Mentic;fl.
In ll•is conncclion, anolhcr investigation, in which only pleasamncss w,[s examined, is also relevant. In that study, ca,'ried ont I,v Kaestnery; pairs of interriffs
15:16 6 õ 5
0 50
5.7 ;/:3
i
lOO 150
I
200
l.'m. 1. I'crcentagc o[ subjects who judged simple tone intervals as cunsonant (solid curve} and picasant (ditched curve), •c spectively, plotted as a function of frequency difference between the tones. For all intervals the frequency o[ the lower lone xxas 395 cps. ['After Guthrie and Morrill?•
:• E. R. Guthrie and H. Morrill, "The Fusion of Non-Musical Intervals," Am. J. Psychol. 40, 624-625 (1928).
a•G. Kaestncr, "Untersuchungen fiber den GefCthlseindruck unanalysierter Zweikllinge," I)sychol..qiudlen 4. 473-.504 (1909).

552 PLOMP AND LEVELT
15:16 89 5'64.5 34 5-7 2:3 58 35 5.9 815 1.2
............... ,T,,. ' 0 50 1• 150 200 250 300
frequency dmtterence mn cOS
lq•. 2. Yercent•ge o[ c•ses in which • tone intesval was judge• •s more pleasant th•n the other ones, plotted •s ß •unction o• •reqoency difference between the tones. •hc solid curve rapresents t•e d•t• los sim]fie• the d•she• crave [o• complex tones. For inte•vMs, the frequency of the lower tone w•s 320 cps. •estne• ?]
were presented successively to observers who were asked to indicate which one was more pleasant. These experiments were performed for intervals composed of either simple or complex tones. In both cases, about 30 intervals within the octave were involved and all pairs of intervals were judged. In Fig. 2, the mean values of the most important resttits are presented. The simple- tone curve agrees with the cnrves of Fig. 1, whereas the other curve, based on complex tones, shows marked peaks for simple frequency ratios.
These experiments are very useful to eva]tlate the different explanations of consonance. As we see, for intervals composed of simple toues, simple freqnency ratios did not result in singnhu' points of lhe cnrves. On the contnu'y, the curves suggest that fi'equency distance rather than frequency ratio is the decisive parameter. For increasing frequency' difference, the curves show a marked ndnimum, followed by a broad maxinmm.
The only explanation supported by the results of these two experiments is the theor)' pronmted by yon Helmhohz, after which the dissonance of an interval is primarily due to rapid beats between the component tones. [n both investigations, the minimum of the curves corresponds very well with a frequency differ- ence of 30-40 cps, in accordance with yon Helmholtz's statement of maximum dissonance. The fact that the curve of Fig. 2 based on complex tones shows marked peaks for the intervals corresponding with simple fre- quency ratios is in agreetnent with this explanation.
On the other hand, the experhnents do not support the other explanations mentioned in Sec. I-A. Agaiust these views, the following objections can be raised:
1. The hy-pothesis that, anywise, freqnency ratio is perceived is contradictory to the finding that the simple- tone c•ves oJ Figs._l and 2 do not have peaks for simple ratios. All evidence in this direction must be due to intervM recognition as a result of nmsical training, the
intportance of which is demonstrated by the experi- ments of Moran and Pratt, mentioned above.
2. Insofar as consonance explanations based on re- lationships of harmonics imply that the presence of harmouics in every complex tone results in a "condi- tioning" for simpl• frequency ratios, the objections of (1) agaiu do apply. In another view on the inflnence of harmonics, consouance is considered to be related to the number of coinciding harmonics during actrod sounding of two complex tones simultaneously. How- ever, it is not clear how this coincidence may be relevant to consomtnce other than by the absence of beats or
difference tones, because every connllOll partial may be regarded as belonging to only one of the complex tones.
3. The influence of difference tones on consonance
perception also is not very probable in view of the data reproduced in Figs. I and 2. Moreover, experiments of one of the authors on the andibilitv of combimttion tones "t showed that the nonlinear distortion of the hearing organ is so small that it cannot be regarded as a constitutive base for consonance.
4. The fact that the rank order of consorator intervals is correlated with their degree of fusion cannot be considered as a satisfactory explanation, as Stumpf 2• himself admitted. This does not mean that the relation
has no relevance. However, in this paper it is left out of consideration.
From this survey-, we may conchide that it is of inter- est to investigate more thoroughly the hypothesis that tonal consonance, the peculiar character of intervals composed of cmnplex tones with simple frequency ratios, is due to the absence of rapid beats between harmonics of the component tones.
II. EXPERIMENTS
Iu the investigation by Guthrie and Morrill, tone intervals were iuvotYed only with a lower tone of
6
10 • 2 I0 • 2 5 frequency difference in cps •,
Flo. 3. Consonance rating scores of simple-tone intervals with a mean frequency of 125 cps as a function of frequency difference between the tones. The solid curve corresponds with the median, the dashed curves with the lower and upper quartiles of the scores (11 subjects).

TOXAL CONSOXAXCE AN[) CRITICAl. BAXDWIDTIt 553
305 cps. Kaestner used 256 and 320 cps for this fre- quency. So these studies do not give information ou lhc degree to x• hich evaluation of intervals, comi)osed of simple hines, depends on frequency. i:or a boiler in- sight in the relation between consonance and heals, the answer to lhis queslion is of great interest, aud for lhis reltson the aulhors t>lanncd the following experimenls.
A. Method and Procedure
In the experiments, observers had to judge tone intcrvals as a function of two parameters: sitnation of the interval in the frequency range aml frequency difference between the componenl tones. As a measnre of the lirst parameter, the geometric ntcan of the fre- quencies of the. two tones wits taken. In order to separ- ate the influence of the parameters as nmch as possible, this mean frequency has advanlages to frequency of the lower tone of the intervals which was used in earlier studies. For the same reason, different groups of ob- servers were used for each of lhe mean frequencies involved.
The subjects judged each tone interwtl on a 7-point scale, "consonant dissonant," I corresponding with most dissouaut, 7 wilh most consonant. Some subject-, asked for the meaning of co.so.a.l. In that case, the experimenter circumscribed the term by beatttiy'ul and e-upho. ious. This procedure is justified because, its was ascertained earlier, a cottso.a.l, beautiful, and eupho.ious are highly correlated for naive snbjects. In fact, they represent one dimension in semantic space: cvahuttion.
The experimental setup was very sintple. The tones were produced by 2 sine wave oscillators and repro- duced by a loudspeaker in front of the observer. The sound pressure near the subject's ear was kept al a constant level of abont 65 alii re 2.10 -4 dyn, cm'-'. The subjects were tester[ individualh' in a soundproof room with sound-absorbing walls. The experimenlcr was seated in another roont and presented each inlcrval tinring about 4 sec. After e;uzh exposure, he had to
6
•3
2
!
2 10 J 2 10 ] Irequcncy d•f'ference mcps ß
hut wi(h mean (requency •00 cps (11 •ubjec[s).
i-cad just thc frequency of the oscillators, resulting in a pause of 10-20 sec between expostires. An electronic counter wits used to adjnst frequencics yet 3 accurately.
The cxperitnents were carried out for 5 vaines of the mean frequency of the intervals: 125, 250, 500, 1000, and 2000 cps. Each subject was used only in one test sessimt, in which he had to judge 12-14 different interval-width x'alncs around one of tbe•c mean frequencies. To avoid the influence of interval recogni- lion, the widths of these intervals were chosen on base of frequency differcnce, not on frequency ratio.
The following procednre was used. First, the subject read writlen instrttctions concerning the purpose of the test and the way in which he had to record his responses on a sheet with horizontal lines, each prox4ded with 7 short vertical thmhes. After that, a preliminary series of 1(} different interwds, chosen at random out of the interval widths nsed in the experiment, was presented in order to make the subject familiar to the differences between the sitmilli and to warrant an adequate use of thc 7-poinl scale. Then, 5 series of 12-14 inlerwds were presented (12 for 125 cps, 14 for the other mean frequencies). Each of these series contained the same interval widths but in a different (random) order. Al- ways the first interval of a series was different from the lltst one of lhe preceding series.
The test subjects were young mMe adults of about 20 years of age and with secondary-school training. For the mcan frequencies 125, 250, 500, 1000, and 2000 cps, the nulnber of subjects was 19, 22, 18, 11, and 18, rcspcclively.
B. Results
To exclude ½l:da of subjects who were not able to give consistent responses, for each of them test retest reliability was dcterntined by calculating the torrehi- lton coehfcient between thc scores of the first and the hist of the 5 series of interval widths presented to the subjects. Only the data of those subjects were main- rained who ired a correlation coefficient above 11.5.
554: PLOMP AND LEVELT
!1 I l/ll " I
I L I /11! ' ',, ,, ,' i'l I " 51_
,,!, .,! .... !. frlqu•ncy ddf•r•nc½ in cps ram,
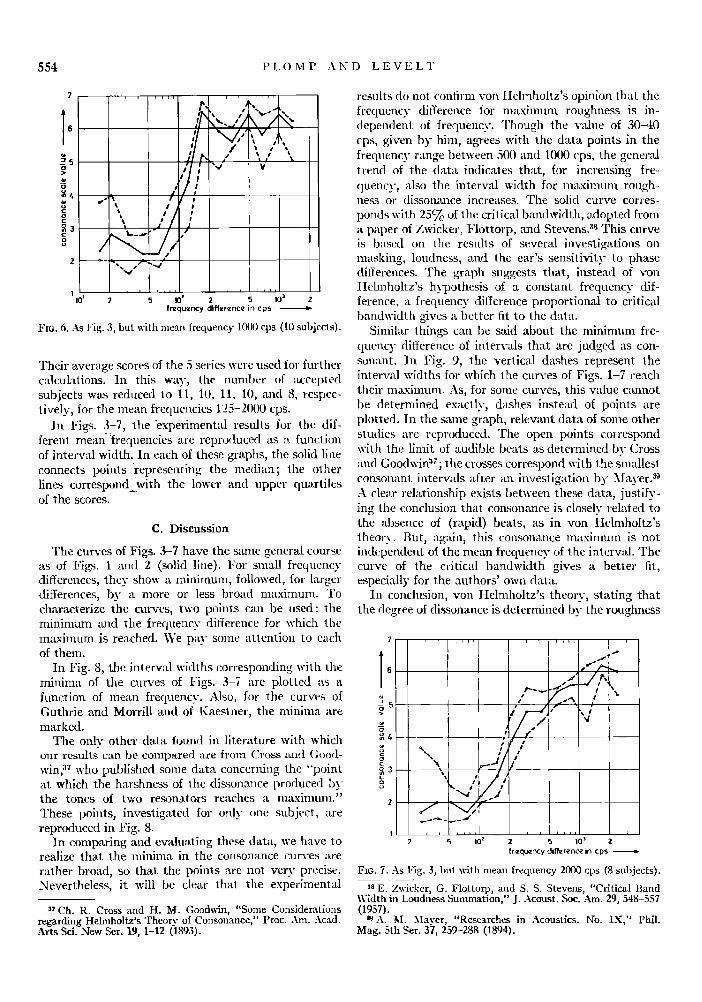
Fro. 6. As Fig. 3, but with mean frequency l•10 cps (10 subjects).
Their average scores of the 5 series were used for fitrther calculations. In this way, the nun•ber of accepted subjects was reduced to ll, 10, 11, 10, and 8, respec- tively, for the mean frequencies 125 2000 cps.
In Fi•..377, the 'experimental results for the dif- ferent mean frequencies are reproduced as a function of interval width. In each of these graphs, the solid line connects points representing the median; the other lines correspond_with the lower and upper quartiles of the scores.
C. Discussion
The curves of Figs. 3-7 have the sartre general course as of Figs. 1 and 2 (solid line). For small frequency differences, they show a minimum, followed, for larger differences, by a more or less broad maximum. To characterize the curves, two points can be used: the mininmm and the frequency difference for which the maximum is reached. We pay' some attention to each of them.
In Fig. 8, the interval widths corresponding with the minima of the curves of Figs. 3 7 are plotted as a function of mean frequency. Also, for the curves of Guthrie and Morrill and of Kaestner, the miniran are marked.
The only other data found in literature with which our results can be compared are from Cross and Good win, a• who published some data concerning the "point at which the harshness of the dissonance prodriced by the tones of two resonators reaches a maximum." These points, investigated for onh' one subject, are reproduced in Fig. 8.
In comparing and evaluating these data, we haxre to realize that the miniran in the consonance curves are rather broad, so that the points are not very precise. Nevertheless, it will be clear that the experiment;d
a? Ch. R. Cross and H. M. Goodwin, "Some Considerations regarding Helmholtz's Theory of Consonance," Proc. Am. Acad. Arts Sd. New Sec. 19, 1-12 (1893).
rc.•nlts do not confirm yon Hehnholtz's opinion that the frequency difference for maximum roughness is in- dependent of frequeIr%'. Though the value of 30-40 cps, given by him, agrees with the data points in the frequency range between 500 and 10(10 cps, the general trend of the data indicates that, for increasing fre- quency, also the imerval width for maximum rough- ness or dissonance increases. The solid curve corres- ponds with 256,70 of the critical bandwidth, adopted from a paper of Zwicker. Flottorp, and Stevens. as This curve is based on the results of several investigations on masking, loudness, and the cat's sensitivity to phase differences. The graph suggests that, instead of yon Hehnhohz's h3l)othesis of a constant frequency- dif- ference, a frequency difference proportional to critical bandwidth gives abctter fit to the data.
Simihtr things can be said about the minimum fre- quency difference of intervals that are judged as con- sonant. In Fig. 9, the vertical dashes represent the interval widths for which the curves of Figs. 1-7 reach their maximum. As, for some curves, this value cannot be deternfined exactly, dashes instead of points are plotted. In the same graph, relevant data of some other sludics are reproduced. The open points correspond with the limit of audible beats as determined by Cross and Goodwin '•;; the crosses correspond with the smallest consonant intervals after an investigation by Mayer. a• A clear relationship exists between these data, justify'- ing the conclusion that consommce is closely related to the absence of (rapid) beats, as in yon Helmholtz's theory. But, again, this consonance maximum is not independent of the mean frequency of the interwd. The curve of the critical bandwidth gives a better fit, especially for the authors' own data.
In conchtsion, yon Helnnholtz's theory, stating that the degree of dissonance is determined by the roughness
IO • õ I0 • 2 frequency d •rence n cps •
Fro. 7. As Fig. 3, but • ith mean frequency 2000 cps (8 subjects). as E. Zwicker, G. Flottorp, and S.S. Stevens, "Critical Band
Width in Loudness Summation," J. Acoust. Soc. Am. 29, 548-557 (1951).
• A.M. Mayer, "Researches in Acoustics. No. Lx•," Phil. Mag. 5th Ser. 37, 259-288 (1894).

TONAL CONSONANCE AND CRITICAL BANDWIDTH 555
of rapid beats, lnav be maintained. However, a modilica- tion has to hc made in the sense theft mininml aml maximal roughness of intervals are not independent of the mean frequency of the interval. A better hypothesis seems to be that they are related lo critical Imndwidth, wi•h the ntle •,[ thumb that maximal tonal dissonance
2.•/o of the critical is produced by intervals subtending bandwidlh, and lhat maximal tonal consonunce reached for interval widths of 100•, of lhc crilical bandwidth. In all experiments in which critical bands have been investigated, the width of this band repre- sents the frequency-difference limit over which simple tones cooperale. So it is not surprising that roughness appears only for t•mes at a frequent) distance not exceeding o/itical bandwidth.
III. CONSONANCE FOR COMPLEX- TONE INTERVALS
In this secti,m, the data of lhe preceding exI)eriments are nsed to explain not only why, for complex tones, consommce is related to simple frequency ratio, but also to illustrale some other well-known properties of consonant inlervals.
As Fi•s. 3 7 show, the curves, plolled on a iogarith• mic frcqucnc)' scale, have approximalely idenlical shapes. This means lhal lhev all can be subsliluled the same curve in which consonance score is represented as a function of the interval widlh with critical band- width as a unit. This stundard curve is reproduced in Fig. 10. I1 has been derived by philling in one graph lhe data points for each of the mean frequencies as a firee- tlon of critical bandwidth and drawing the curve that best fits all the dala. For small frequency differences, lhe curve is exlemled on base of lhe curves of Figs. 1 and 2. By a linear lransformation, the cwduation scale is substitnled hy a "consommce" scale, 1 corresponding wilh maxinmm and 0 wilh mininmm apl)reciulion.
The curve of l:ig. 10 can he used to get some impres-
I
[ [ . Cross and Goodw,n .... 1 .... ,_ ,
dissonance as a function o[ the mean [rcqucncy o[ the tones. The solid curve corresponds wilh 0.25 critical banduidth a• given by Zwicker, Flottorp, and Stevens?
ß I fromF•g• I to7 __ ß * Cross and Goodwin
ß Mayer
5
• I0:
5
I0 • I0 • 2 frequency ua cps •
l.'l(:. 9. Freqnency difference of smallest consonant interval of twn simple tones as a function of the mean frequency of the tones. The s, lid curve represents the critical bandwidth.
si.n of how, for complex tones, consonance varies as a function of lhe frequency difference between the funda- mentals. In this case, consonance depends not only on lhe distance between the fundamental tones, but also between the harmonics.
We assume lhat the total dissonance of such an inlerwd is equal to the sum of the dissonances of each pair of adjaccnl partials, using the right-hand scale of l"ig. 10 to compute the total dissonance. This assump- 1 ion implies that these dissonance wdues may be added. Though these presuppositions are rather speculative, t hey arc not •,nreasomtble as a first approximation, and may he justilicd for illustrating how, for complex-tone intervals, consonance depends on frequency and fre- quency ralio.
In this way, the curves of Figs. 11 and 12 were com- puted for cmnplex tones consisting of 6 harmonics. l"igure 11 illustrates in what way consonance varies as a function of interval width, whereas Fig. 12 shows how the consonance of some intervMs, given by simple frequency ratios, depends on frequency.
The curves of Figs. 11 and 12 may be considered as an illustration of the following properties of tone inlervals.
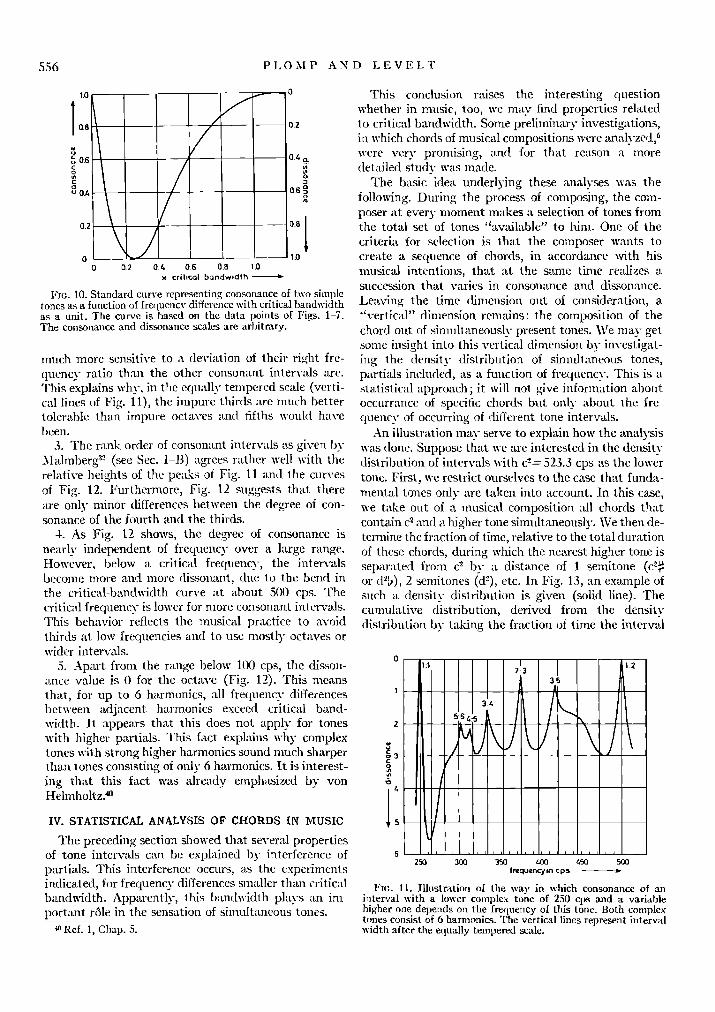
1. With simple frequency ratios of the component tones, singular points of the curve of Fig. 11 corres- pond. As we restricted lhe nnmber of harmonics to 6, only i)eaks for frequency ratios containing the numbers l-6 cmfid appear. If also the 7th and 8th harmonics were included, the curve would have shown extra peaks for 4:7, 5:7, 6:7, 5:8, and 7:8. In this w•kx- , it m%' be clear Ihal, for complex tones, as produced by musical instruments, consonance is related to simple frequency ratios.
2..More-simple frequency ratios are represented by sharper peaks. This means that octave and fifth are
556 PLOMP AND LEVELT
tO 0
//jr 0.8
0.2
õ 0.6 0.4 •.
øo 0k 0.6 •
0.2 i 0 0.2 0.4 0.6 08 1.0
X crihc•l b•ndw•dth •
•o. 10. StAndard curve •presenting consouance o[ two simple tones As • fu•ctbn of [•equencv difference w[fi critical handwidth as a unit. The cu•e is ba•d on the data points of Figs. 1-7. The con•nance and dis•nance scales are arbitrary.
much more sensitive to a deviation of their right fre- quency ratio than the other consonant intervals are. This explains why, in the eqnally tempered scale (verti- cal lines of Fig. 11), the impm'e thirds are much better tolerable than impure octaves •tnd fifths would have been.
3. The rank order of consonant interwtls as given by Malmberg • (see Sec. I-B) agrees rather well with the relative heights of the peaks of Fig. 11 and the curves of Fig. 12. Furthermore, Fig. 12 suggests that there are only minor differences between the degree of con- sonance of the fourth and the thirds.
4. As Fig. 12 shows, the degree of consonance is neath' independent of frequency over a large range. However, below a critical frequency, the inten-als become more and more dissonant, due to the bend in the critical-bandwidth curve at about 500 cps. The critical frequency is lower for more consonant intervals. This behavior reflects the musical practice to avoid thirds at low frequencies and to use mostly octaves or wider intervals.
5. Apart from the range below 100 cps, the disson- ance value is 0 for the octave (Fig. 12). This means lhat, for np to 6 harmonics, all frequency differences between adjacent harmonics exceed critical band- width. It appears that this does not apply for tones with higher partials. This fact explains why complex tones with strong higher harmonics sound nmch sharper than tones consisting of only 6 harmonics. It is interest- ing that this fact was already emphasized by yon Helmholtz?
IV. STATISTICAL ANALYSIS OF CHORDS IN MUSIC
The preceding section showed that sereral properties of tone intervals can be explained by interference of partials. This interference occurs, as the experi•nents indicated, for frequency differences smaller than critical bandwidth. Apparently, this bandwidth plays an portant r61e in the sensation of simultaneous tones.
,0 Ref. 1, Chap. 5.
This conclusion raises the interesting question whether in music, too, we may find properties related to critical bandwidth. Some preliminn D' investigations, in which chords of musical compositions were analyzed, • were very promising, and for that reason a more detailed study was made.
The basic idea tmderlying these analyses was the following. During the process of composing, the com- poser at every moment makes a selection of tones from the total set of tones "available" to him. One of the criteria for selection is lhat the composer wants to create a sequence of chords, in accordance with his nmsical intentio•m, that at the same time realizes a succession that varies in consonance and dissonance. Leaving the time dimension out of consideration, a "vertical" dimension remains: the composition of the chord out of simultaneously present tones. We may get some insight into this vertical dimension by investigat- ing the density distribution of simultaneous tones, partials included, as a function of frequency. This is a statistical approach; it will not give information about occurrance of specific chords b•tt only about the fre quency of occurring of different tone interwds.
An illustration may serve to explain how the analysis was done. Suppose that we are interested in the density distribution o[ intervals with c'-'= 523.3 cps its the lower tone. First, we restrict ozselves to the case that funda- mental tones onh- are taken into account. In this case, we take out of a musical composition all chords that contain c': and a higher tone simultaneously. We then de- termine the fraction of time, relative to the total duration of these chords, during which the neatrest higher tone is separated from c •- by a distance of 1 semitone or dS), 2 semitones (d-l, etc. In Fig. 13, an example of such a density distribution is given (solid line). The cumulative distribution, derived from the density distribution by taking the fraction of time the interval
[ I 1:2 I:$ 2:3 35
5:64:5 3'•* /1 \ 1
2
2f• 300 350 zOO 45{3 500
Fid. II. Illustration of the way in x•'hich consonance of an interval with a lower complex tone of 250 cps and a variable higher one depends on the frequency of this tone. Both complex tones consist of 6 harmonics. The vertical lines represent interval width after the equally tempered scale.

TONAL CONSONANCE AND CRITICAL BANDWIDTH 557
TAnLE [. Fundamental tones containing c-* as the 1st, 2nd, 3rd..-., 10th barmmfic, respectively. In the last colmnn, the deviations of the frequency of these harmonics from the frequency of c 2 are indicated (equally tempered scale).
Fundamental Frequency No. of tone (cps) harmonic
Frequency of l)cviation harmonic from
(cps) (cps) c*- 523.252 I 523.25 0 c t 261.626 2 523.25 0 f 174.614 3 523.84 50.59 c 130.813 4 523.25 0 G• 103.826 5 519.13 --4.12 F 87.307 6 523.84 +0.59 D 73.416 7 513.91 --9.34 C 65.44)6 8 523.25 0 -\•-• 58.270 9 524.43 +1.18 G•,• 51.913 10 519.13 --4.12
does not exceed 1 semitone, 2 Selnilones, etc., is also given (dols :red dashes).
The procedure can be repeated by including 2rid harmonics, 2ml and 3rd harmonics, etc. In general, in the case of n harmonics, we take chords that include c •- either as a fnndamental tone or as nne of the first u harmonics of a lower tone. The density distribution is lhen calcnlated for distances between c 2 and the nearest higher tone, which may also be either a fundamenhd lone or one of the first n harmonics of a lower tone. hx Fig. 13, distributions for n= 6 are plotted. It is found, as was to be expected, that the 50% point of the cunmla- live distribution for n = 6 gives a smaller interval value lhan the corresponding point in the cunmlative dis- tribution for n = 1.
Table I gives wtlues of frequencies of tones that contain c -ø as their nth harmonic, with n= 1, 2, ..., Ill. The Table also gives frequencies of the harmonics of these tones on the basis of the equally tempered scale. As is well-known, these frequencies do deviate stonewhat from the frequency of c x in some cases. These deviations are left out of consideration here.
To facilitate compution of interwd distributions for different wdues of the basic frequency and different numbers of harmonics, special equipment has been developed. It consists of (11 an apparatus to trans-
I:IG. 12. Illustration of the way in which consonance of some intervals with simple frequency ratios depends on Ihc frequency of the lower tone. Buth complex tones consist of 6 harmonics.
lOO
75 o m 50
25
0 1 2 3 5 6 7 8
ntervol width in sern tones •.
Fro. 13. Example of interval distributinns at c-ø=523.3 cps for n = 1 (solid curve) and n=6 (dashed curve). The other curves represent the cumulative distributions for n= 1 (dots and dashes) and n=6 (dots). The interval distributions were computed from the last movemcnl of J. S. Bach's Trio Sonata for Organ .Vo. 3 in c minor.
nutte the notes and duration of chords, "played" successively on a keyboard, in punch code, using an &bit tape, an([ (2) an apparatns to read out the tape and to compute the interval distribution with both basic frequency and n adjustable.
In this way, 2 nmsical compositions were analyzed, the last movement of J. S. Bach's Trio Sonata for Organ No. 3 in c minor, and the 3rd movement (Romanze) of A. I)vo•.k's Siring Quartet Op. 51 in Ev major. In both cases, interval distributions were computed for C = 65.4 cps, G=98.0 cps, c= 130.8 cps, g=196 cps, c•=261.6 cps, gt=392 cps, etc., and taking into account n har- monics with n= 1, 2• 3, ..., 10. For each of these distri- butions the Jutorval width was calcnlated (first in semitones mid from these values in cycles,/second) which is not exceeded durin• 95 c/ - o• ._ -' ,o, •0•o, and 75% of time, respectively.
In Figs. 14 and 15, lhe resttits are reprodnced as ,• function of frequency, with n as a parameter (solid lines). As the data for n= 10 were quite similar to the data for n=9, the former case has been left mtt. The dashed lines represent the critical bandwidth after Zwicker, Flottorp and Stevens, as plotted as a function of lhe lower cutoff frequency, and a quarter of this band- width, corresponding with maximum dissonance (Fig. 101. For each freqnency, the total duration of time of all chords on which the concerning interval distribution was based is indicated, using the duration of the shortest note occurring in the composition as a time unit.
To grasp the significance of the curves, it may be helpful to trace their shift as a function of the minther of harmonics. This is done on the basis of the graphs of Fig. 14. For the case that only the hmdamental tone was taken inlo accounl, most of the interwds exceed the critical bandwidlh, in particular for the lower frequencies [Fig. 14(a)•. It will be clear lb}it, as a func- tion of fi'equency-, all intervals with lhe •rme frequency ratio between the component tones correspond with a

5.58 PLOMP AND LEVELT
10 •
2
10 j
5
2
10 •
•10 •
Z- 5
2
10 • 2 5 10 • 2 5 10 *• 10 • 2 '5 10 • 2 5 10 '• frequency ,ncps •-
F•o. 14. Results of a statistical analysis of the chords of the last movement of J. S. Bach's Trio Sonata h;r Organ Yo. 3 in c minor with n (= number of harmonics taken into account) as a parameter. The solid curves represent the intervai width in cps between adjacent partials, plotted as a function of frequency, which is not exceeded in 25•, 50%, and 75% of time, respectively, computed from curves as represented in Fig. 13. The dotted curves correspond with critical bandwidth and a quarter of this bandwidth.
straight line with a positive slope of 45 ø. As for octave intervals, the frequency difference is equM to the fie- qtmncy of the lower tone; xve see that for the loxver freqnencies nearix, all intervals of Fig. 14(a) exceed the octave. This implies that, including also the 2rid harmonic, these interwds reduce to octaves, resulting in a line with a slope of 45 ø through the point A f= 100 cps for f= 100 cps f-Fig. 14(b)•. Above c= 130.8 cps, however, most interwtls are smaller than the octave. Because n=2 means that all fundamental tones are •tccompanied by their octaves, the curves of Fig. 14(b) extend to a corresponding higher frequency. The in- clusion of the 3rd harmonic manifests itself in the following ways: (1) the points corresponding with the
lower frequencies do not shift because the frequencies of the new to•xes all are above that range; (2) in the middle range, the lens•tx' of tones increases, reshiring in a shift of the curves to smaller frequency differences; (3) the curves are extended to a 50% higher frequency, compared with the curves for n= 2; (4) as most of the intervals for the highest frequencies will be fifths, cor- responding with the frequency distance between the 2nd and 3rd h•rmonics of the highest fundamental tones of the composition, this interwd will determine the course of the curves at the higher frequencies.
Every time when a further harmonic is added, a repetiti'mx of this process occurs, with the result that for increasing u (1) the frequency limit below which

TONAL CONSONANCE ANI) CRITICAl. BANDWIDTH 5.59
! !
!
! !
,/ -' - • .•' (a) n=l
10 •
$
2
10 •
5
2
i0 •
5 ß I0 • 2 5 10' •= 2 3 10 • 2 5 10' frequency in cps ---
[:m. 15. Results of a statistical analysis of the chords of the 3rd movement (Romanzc) of l)v•,•.k's SlJ'i, d Quartet Op. 51 in E) major. The curves have the .same meaning as in Fig. 14.
no new tones are added shifts to higher frequencies; :rs we saw for, = 2,this limit is about c= 130.8 cps, whereas for n=9 this limit is aboul c•=523.5 cps; (2) in the frequency range above this Illnit, lhc curves will shift to smaller frequency differences; (3) a furlher extension of the curves to higher frequencies will take place; (4) for the highest frequencies, the course of the cnrvcs will mainly be determined by the interval (n- 1) :tt.
The cnrves of Fi•. 15 s!•ow •l•e game Irend• :is :t function of the number of harmonics. However, in this case, the intcrwtl widths belwcen lhe ftmdamenhd tones are mtteh smaller than in the former case. ()nlv for Ct= 65.4 cps do the inlervals exceed the octave, as a comparison of the graphs (a) and (b) shows. As a con- sequence of this fact, also for n> 1 Ihe curves of Fig. 15
correspond with smaller intervals than_-the-'curves-of Fig. 14.
After these more genel-al remarks, we may compare the position of the curves with the critical-bandwidth curves. As we see, for increasing ,, the shape of the interval curves agrees more and more with the dashed curves. In bmh I"igures, the agreement is greatest for at)out 8 harmonics.
These results strongly snggest that critical bandwidth plays an important r61e in music. The signilicance of Ihis fact ClUl be inlerpreted in •he following way. As we saw in Sec. II, simple-tone inlervals with a frequency difi'erence exceeding crilical bandwidth are judged as consonant and do not differentiate in this respeel. ()n the other hand, for smaller frequency differences, con-

.560 PLOMP AND LEVELT
sonartec evaluation strongly depends on interval width, with a minimum for about a quarter of critical band- width. So it is not surprising that just this range is used for "modulation" between more-consonant and more-dissonant chords. However, it is surprising indeed that, for a number of harmonics representative of musicM instruments, this is achieved in about the same measure over a wide frequency range.
We have to realize that this equally deep "penetra~ tion" in the borderland between pronounced consonant and dissommt simple-tone intervals, represented by the upper and lower dashed curves in the graphs, respec- tively, is a result of many factors. As the most impor- tant ones we may consider:
1.--the fact that in the tone scale as developed in Western music, a lot of interwds agree with simple frequent3.' ratios, so that harmonics of the different component tones of a chord may coincide; otherwise, the shape of the solid curves of Figs. 14 and 15 would have been more fiat, due to more dissonant chords.
2.--the fact that the frequencies of the partials of the tones are multiples of the frequency of the funda~ mental tone. A deviation from this rule would have the same effect as mentioned under (15. This may be re- garded as one of the reasons (there are more!) why instruments with inhm'monic partials are not used to produce musical chords.
&--the way in which, as a function of frequency, the composer selects his intervMs. We saw above that in Bach's composition the frequency ratio between fundamental tones is larger at lower than at higher frequencies. As a comparison with Fig. 12 shows, in this way very dissonant chords are avoided. Though to a smaller degree, this is also the case in Dvo•&k's string quartet [intervals with the same frequency ratio between the component tones correspond with a straight line with a slope of 45 ø in Fig. 15(a)].
4.--the number of notes in a chord. It is clear that, generally, for increasing number the mean distance between adjacent partials will decrease. The fact that the solid curves of Fig. 15 correspond with smaller frequency differences than the curves of Fig. 14 be mainly due to this factor and the 3rd one.
5.--the frequency lintits between which the funda- mental tones are chosen and their distribution within
this range. So a multiplication of all frequencies by certain factor shifts all curves both horizontall 5' and vertically to the same degree. As we see, this would
influence their relation to the dashed curves much more for lower than for higher frequencies.
&--the nmnber of harmonics produced by the instru- ments on which the composition is performed. Only the intluence of this factor has been studied here, showing that the frequency range over which a typical harmonic modifies the interwd distributions shifts to higher fre- quencies for increasing n. This implies that the number of harmonics is not very critical. Most musical instru- ments produce strong harmonics up to a number that may vary from about 6 to 10, though in the last case the tone has a sharp qualit)- and is more suited for solo parts.
The mere enumeration of these factors does not give us much information about their relative importance. So it would be of interest to know more about the degree to which each factor determines the position of the horizontal and the sloping parts of the curves. Moreover, we should like to have more insight in the way in which their position depends on musical style and on the instruments for which the composition is written. Further investigations are in preparation to answer these questions.
V. CONCLUSIONS
Both the experimentM results on the evaluation of simple-tone intervals and on the statistical analysis of chords in musical compositions support the explanation, promoted by yon Helmholtz, that the singularity of intervals with frequency ratios determined by small integer numbers is due to interference of adjacent par- tials finding expression in a roughness sensation. The investigations indicate that, as a function of frequency, the transition range between consonant and dissonant simple-tone intervals is related to critical bandwidth. These intervals are evaluated as consonant for fre- queucy differences exceeding critical bandwidth, whereas the most dissonant intervals correspond with frequency differences of about a quarter of this bandwidth.
ACKNOWLEDGMENTS
The authors wish to express their thanks to A.M. Mirapen, for his cooperation in the experiments, ,'red to J. M. Schipper and E. Agterhuis, for developing the equipment used to compute interwd distributions of musical chords.
This work was supported by the Netherhinds Organization for the Advancement of Pure Research (zwo).