tonight’s targets - auburn.wednet.edu sip... · analysis of student double entry journals* to...
TRANSCRIPT


Tonight’s Targets:
• Review of Current ARHS Data
• Snapshot of Academic Interventions
• Celebrating Increased Parent Engagement

Who Attends ARHS?
0%
10%
20%
30%
40%
50%
60%
70%
80%
90%
100%
2005-2006 2006-2007 2007-2008 2008-2009 2009-2010 2010-2011 2011-2012 2012-2013 2013-2014 2014-2015
White
Hispanic
Black
Asian/PacificIslander
AmericanIndian/AlaskanNative
Multi-Racial(new to report2010-2011)

Who Attends ARHS?(% of Total Population)
0.00%
5.00%
10.00%
15.00%
20.00%
25.00%
30.00%
35.00%
40.00%
2005-2006 2006-2007 2007-2008 2008-2009 2009-2010 2010-2011 2011-2012 2012-2013 2013-2014 2014-2015
Free orReduced-PriceMeals
SpecialEducation
TransitionalBilingual

Percentage of 9th graders On Target(earned 6+ credits) - ASD Strategic Plan Goal
72.5 71.5377.19
63.33
71.65 70.5464.67
70.17 69.29
60.8766.69 67.1765.67
75.0769.5 67.21
71.27
77.48
57.32
65.85 63.52
55.8361.11 59.2
0
10
20
30
40
50
60
70
80
90
100
2009-2010 2010-2011 2011-2012 2012-2013 2013-2014 2014-2015
ARHS
District
AMHS
AHS

August ARHS SBA ELA Results
33
49
40
Did NotPass
Passed GRbut not CR
Passedboth
10th grade 11th grade
58
275
252
Did NotPass
Passed GRbut not CR
Passedboth
Zeros (not included above) 39
GR Pass rate who took it: 82.6%GR Pass rate with zeros: 73.9%
CR pass rate who took it: 75.7%CR pass rate with zeros: 67.7%
Zeros ( not included above) 328
GR Pass rate who took it: 59.8%
GR Pass rate with zeros: 12.0%
CR pass rate who took it: 48.8%
CR pass rate with zeros: 9.8%

Current 11th & 12th with State ELA
Assessment MET
97
59
276
351
0
50
100
150
200
250
300
350
400
Current 11th grade Current 12th grade
No
Yes

August ARHS
SBA 11th
Grade MATH
Results
57
108
89
Did Not Pass
Passed GR but not CR
Passed both
Zeros ( not included above) 218
GR Pass rate who took it: 65.5%GR Pass rate with zeros: 28.2%
CR pass rate who took it: 53.9%CR pass rate with zeros: 23.2%

Current 10th-12th with State MATH
Assessment MET
128
94
68
341
279
342
0
50
100
150
200
250
300
350
400
Current 10th grade Current 11th grade Current 12th grade
No
Yes

Science
34.20%
26.70%
33.60%
21.40%
38.10%
51.20%
56.10%
72.60%
76.30%
71.00%
20.00%
30.00%
40.00%
50.00%
60.00%
70.00%
80.00%
90.00%
2005-06WASL
2006-07WASL
2007-08WASL
2008-09WASL
2009-10HSPE
2010-2011HSPE
2011-2012Biology
EOC
2012-2013Biology
EOC
2013-2014Biology
EOC
2014-2015Biology
EOC
Pe
rc
en
t M
ee
tin
g S
tan
da
rd
School
District
State

ARHS Graduation Rates
88.60%88.40%
86.70%
94.70%
87.50%
90.20%
92.00%
90.80%
89.20%
94.60%
91.60%
84.00%
86.00%
88.00%
90.00%
92.00%
94.00%
96.00%
98.00%
100.00%
c/o 2009 c/o 2010 c/o 2011 c/o 2012 c/o 2013 c/o 2014
4 year Cohort Graduation Rate 5 year Cohort Graduation Rate

Reading: The percent of 10th graders meeting standard on the state reading assessment will increase by 1.5%
(AMO) each year from 86% in 2013 to 92% in 2017 (with adjustments made using baseline data from
the 2015 SBAC assessment).
Action Step 1Close reading with double entry journals (*or other best practice strategies approved by PLC’s) will be implemented in all
content classrooms
R1.1EEach teacher will plan and deliver a close reading lesson at least once a quarter in all content classrooms.
Analysis of student double entry journals* to assess comprehension of text and plan next instructional steps at least once a quarter (in SIP
Year 1 : February and May)
R1.2 Double entry journal or PLC/Admin approved close reading strategy will be integrated into a close reading lesson quarterly in all content classrooms
Analysis of classroom based assessments in PLCs, reported at Building Leadership team meetings
MAP data will indicate increased comprehension scores at 9th grade and 10th grade Flight
Action Step 2 Tier II academic vocabulary will be taught, reinforced, and assessed across content classrooms
R2.1 Each teacher will post Tier II words in classroom
Students will use and apply Tier II words correctly in formative and summative assessments.
R2.2 Tier II words will be embedded in Learning Targets and common assessments 2015-2016
Department chairs will report Tier II implementation at Building Leadership team meetings.
SIP plan on a page
Math: The percent of students meeting standard on the Algebra and Geometry EOC will increase by 2.4% (AMO) each year
from 74.1% (Algebra) and 77.8% (Geometry) in 2013 to 83.7% (Algebra) and 87.4% (Geometry) in 2017 (with adjustments
made using baseline data from the 2015 SBAC assessment).
Action Step 1 All algebra classes will implement PLC approved “34 concept” curriculum, including weekly common assessment strategies.
M1.1 All Algebra teachers follow weekly lesson plans from curriculum
Teacher will analyze student learning weekly from common assessments.
M1.2 All teachers give weekly common spiraling assessments.
Analysis of classroom based assessments in PLCs, reported at Building Leadership team meetings
Student’s weekly self assess progress toward mastery of the 34 concepts
M1.3 QR codes embedded as interventions for each of the 34 concepts are presented for additional independent practice
Student self-assessments will reflect use of QR codes for additional practice.
Map data will indicate increased skill and understanding

(Cont) Math: The percent of students meeting standard on the Algebra and Geometry EOC will increase by
2.4% (AMO) each year from 74.1% (Algebra) and 77.8% (Geometry) in 2013 to 83.7% (Algebra) and 87.4%
(Geometry) in 2017 (with adjustments made using baseline data from the 2015 SBAC assessment).
Action Step 2 Geometry and Alg./Trig teachers will create similar spiraling curriculum as Algebra to implement fully by 2015-16
M 2.1 Geometry and Alg/Trig Pilot teachers will create and share spiraling curriculum thru Google accounts and discuss in PLC’s.
M2.2 2015-16: All Algebra teachers follow weekly lesson plans from curriculum
Teacher will analyze student learning weekly from common assessments.
M2.3 All teachers give weekly common spiraling assessments.
Analysis of classroom based assessments in PLCs, reported at Building Leadership team meetings
Student’s weekly self assess progress toward mastery of the 34 concepts
M2.4 QR codes embedded as interventions for each of the 34 concepts are presented for additional independent practice
Map data will indicate increased skill and understanding
Student self-assessments will reflect use of QR codes for additional practice.
SIP plan on a page
Credit Attainment and Graduation Rate: The adjusted 5 year graduation rate will increase from 91.2% in 2013 to 94.2% in 2016.
Action Step 1 All teacher lessons will use and communicate Learning Targets that are aligned to PLC agreed upon grade level standards.
G1.1 Learning Targets aligned with standards are being developed.
G1.2 As Learning Targets are created they will be clearly communicated to students and embedded in instruction.Students will be able to communicate their understanding of what they are learning and why.Reduction in class failures, monitored by individual teachers and Building Leadership teamIncrease in On Time Graduation
Action Step 2 Learning Targets are measurable with clear criteria for success and performance tasks provided.
G2.1 Aligned formative assessment data will be reviewed regularly to inform instructional decisions both by individual teachers and PLC
G2.2 Teacher will have process in place to gather evidence of learning dataStudent achievement on formative and summative assessments

Close ReadingSolution Tree Author and Presenter
LeAnnNickelson
I. MONDAY MORNING MEMOS by Tim Wright
•What is CR again?•What is Textual Rigor?•Determining Purpose•Using SRUNR•Annotating•The role of Talk•Double Entry Journals
II. Waiver Day Trainings and Booster Sessions

School Wide Common Core Vocabulary
• Objective: Prepare our students for the common core assessment by teaching them the most important vocabulary terms released by the CCSS.
• School wide pre-test, 5 most missed words became the focus. Teachers hung up posters, directly taught and embedded those 5 words into their curriculum for the next three weeks.
• School wide post-test on those same 5 words.
• Sixty Six percent of students showed growth.

Algebra and Intervention

Parent Outreach and Engagement
• August Home Visits
▫ 15 ARHS staff members
▫ Bilingual when needed
▫ Visited over 125 homes
Welcome packets
Parent contact
Incoming connections
▫ FABULOUS FEEDBACK
• Family Engagement Liaison
▫ Bilingual/All languages
▫ Reaching out to families
▫ Reaching within to support student needs
▫ Training and supporting staff
▫ Supporting Multicultural, Interpretive needs, Family needs

Reaching Out Even Better
• Open House
▫ Newsletter in English/Spanish
▫ Calls made in Spanish/Ukrainian/Russian
▫ Title Meeting
▫ Dinner provided for families
▫ Spanish/Ukrainian informational session on Skyward, attendance, critical information regarding ARHS
• Parent Conferences
▫ Newsletters in English/Spanish
▫ Individual phone calls made by Spanish and Ukrainian translators to invite/schedule meetings with parents
▫ Schedule adjustments from the past to better accommodate our parents busy schedules
▫ Translators on hand at conferences

Hitting the Target:2015-16

SIP Template
1 | P a g e 1 1 / 1 9 / 2 0 1 3
Planning Year 2013-2014
Implementation September 2014-June 2017
Auburn Riverside High School
School Improvement Plan
School Improvement Plan Adopted by the Auburn School Board of Directors on insert school board approval date
here.

SIP Template
2 | P a g e 1 1 / 1 9 / 2 0 1 3
September 2013-June 2016
Auburn School District Strategic Plan
Aspiration:
The Auburn School District aspires to be a world-class education system preparing all students to be globally
competitive for career, for college, and for life in the twenty-first century.
District Goal 1: Student Achievement
All staff in the Auburn School District provide support, leadership, and guidance to ensure each student meets or
exceeds state and district standards, graduates on time, and is prepared for career and college.
District Goal 2: Community Engagements
All staff in the Auburn School District are accountable for engaging its diverse community as partners to support
and sustain a world-class education system.
District Goal 3: Policies and Resource Management
Auburn School District policies and resources are aligned to the strategic plan.
School:
Auburn Riverside High School
Date of SIP Team District Goal Review:
SIP Team Members:
David Halford Nola Wilson Jon Aarstad Steve Mead
Geri Rohlff Bryant Thomas Mike Van Eaton Janalyn McKeehan
Scott Husar Shawn Kilgallon Jackie DeHaven Bryce Strand
Corey Ruppert Adriane Hartness


SIP Template
5 | P a g e 1 1 / 1 9 / 2 0 1 3
Executive Summary- SWT1
COMPREHENSIVE NEEDS ASSESSMENT
Auburn School District Mission
In a safe environment, all students will achieve high standards of learning in order to become ethically
responsible decision makers and lifelong learners.
Auburn School District Vision
The vision of Auburn School District is to develop in students the skills and attitudes that will maximize their
potential for lifelong learning and ethically responsible decision making.
School Mission
ARHS: where personalized learning reaches every
R espectful, contributing citizen
A ccountable to self and others
V alued critical thinkers
E ffective at communicating
N avigators of life’s challenges and opportunities
School Vision
Reaching every R.A.V.E.N.!
Background Information
WAC 180-16-220
Requirements for School Improvement Plan Each school shall be approved annually by the school board of directors under an approval process determined by the district board
of directors and “At a minimum the annual approval shall require each school to have a school improvement plan that is data
driven, promotes a positive impact on student learning, and includes a continuous improvement process that shall mean the
ongoing process used by a school to monitor, adjust, and update its school improvement plan.” School Improvement plans must
include a brief summary of use of data to establish improvement; acknowledging the use of data which may include DIBELS,
MAP, WELPA, Credit Attainment, Enrollment in Honors/AP Courses, CEE Perceptual Data, SAT/ACT, Discipline, and MSP or
HSPE.
Stakeholder Input
School Improvement Planning began fall of 2013. A district coach, Adrienne Hartness, supported a cross
disciplinary team and administrators throughout the planning process. All staff participated in data carousels in
January 2014 and later in May and August followups. The building leadership team, made up of department
heads of every content area and additional staff such as counseling and Advanced Placement, reviewed data as

SIP Template
6 | P a g e 1 1 / 1 9 / 2 0 1 3
well as executive summaries and challenges. Data gathering and planning continued on through September with
a SIP and TITLE document being finalized, although remaining a living document, in October
Highly Qualified Staff – SWT 3
ESEA Title I, Part A Section 1119 Qualifications for Teachers and Paraprofessionals
Verification of Compliance – Principal Attestations The Elementary and Secondary Education Act (ESEA) states in Section 1119(i) that each school district shall require the principal of each school operating a program under ESEA Section 1114 - School wide Programs or Section 1115 - Targeted Assistance Schools attest annually in writing that the school is in compliance with the requirements of Section 1119 in meeting personnel requirements for teachers and paraprofessionals. In addition, copies of attestations shall be:
1. Maintained at each school operating a School wide or Targeted Assistance program. 2. Maintained at the main office of the school district. 3. Available to any member of the general public upon request.
Requirements of ESEA Section 1119 –Teachers
All teachers teaching in schools with programs supported by Title I, Part A funds are highly qualified. Requirements of Section ESEA 1119 – Paraprofessionals
All paraprofessionals funded with Title I, Part A funds or employed in a Title I, Part A school wide program and assisting with instruction meet one of the three (3) following requirements:
1. Completed at least 2 years of study at an institution of higher education. 2. Obtained an associate degree (or higher). 3. Met a rigorous standard of quality and can demonstrate through a formal state approved
assessment, the knowledge of, and the ability to assist in instructing, reading, writing and mathematics, or assisting in instructing and the readiness of above named subject areas, as appropriate.
All paraprofessionals working in a Title I, Part A funded program, including a Title I, Part A School wide program, have earned a secondary school diploma or its recognized equivalent.
Title I, Part A paraprofessionals are not assigned a duty inconsistent with duties outlined in Section 1119.
Paraprofessionals work under the direct supervision of teacher consistent with Section 1119. Statement of Verification of Compliance with Section 1119 Teacher and Paraprofessional Qualification Requirements I attest that all teachers and paraprofessionals in this Title I, Part A school meet the provisions of ESEA Section 1119–Qualifications for Teachers and Paraprofessionals for the _________________school year. __________________________________________ ________________________________ (School Name) (District Name) __________________________________________ ________________________________ (Principal’s Signature) (Date Signed)

SIP Template
7 | P a g e 1 1 / 1 9 / 2 0 1 3
High –Quality, Highly Qualified Teachers – SWT 5
In an effort to support new teachers with key building personnel we schedule a series of meetings. The
format of each meeting will be for selected staff to share information, and for you to ask questions about
their area of expertise. These meetings are intended to allow you to draw on those people experienced in
the building. This is meant to be a support and attendance is expected.
New Teacher Meeting Schedule: September 17th, 24th
o Security/5555/Fire Drill – Security Officer
o Attendance Procedures- Attendance Dean
o Office Procedures/Substitutes – Office Manager
o Discipline/Open House – VP
o Emergency Procedures- VP/Security Officer o Grading Process/Report Cards – Registrar
o Study Skills – Teacher
o Library Resources/Procedures – Librarian
October 8th
, 22nd
o Activities/Building use – Activities Coordinator
o Special ServicesTracking/ TRI Hours – VP
o Counseling/Running Start – Counselor
o Athletics – Athletics Director o Senior Fail Procedure – both semester and end of year – Counselor
o Referrals/504 – Counselor
o Career Center – Career Specialist
o Project Success – Teacher
o Evaluation Process – Principal
ARHS participates in the district mentoring program where new teachers are partnered with an
experienced staff member for support and guidance. (All year)
Online Staff Handbook tool. ARHS keeps an extensive online manual for all staff access. This tool
makes available everything from Discipline procedures and Responsibility charts to our SIP plan and
calendars. Virtually every form and procedure is found online and readily accessible to all staff so that
they are informed, equipped, and supplied with the necessary resources to instruct effectively.
Demographic data
Auburn Riverside opened in 1995. Currently our enrollment has recently hovered near 1600 students making
ARHS the largest high school in the district. Data, spanning the time from 2004-2013, reveals a general
decrease in student population while noting a significant increase in the Hispanic population from 7.5% in 2004
to 19.3% with a corresponding decrease in the population of white students from 80.2% in 2004 to 58.3% in
2013.
The number of free and reduced lunch students doubled from 18.4% in 2007 to 35.8% in 2013 however,
information from feeder middle schools indicates that these numbers may not be accurate, and indicate that we
should perhaps have up to 50% of our students receiving free and reduced lunches. Our primary middle school

SIP Template
8 | P a g e 1 1 / 1 9 / 2 0 1 3
feeder has 50% free and reduced and our secondary feeder has 73% free and reduced lunch. This discrepancy
can possibly be attributed to high school students being less willing to report this information. The percentage of
ELL and SpEd students remained fairly steady, with a low at 5.1% in 2006 and a high at 6% in 2012.
Discipline and Attendance Analysis
In 2014, the data on attendance and behavior at the schoolhouse from the past five years was reviewed by the
staff. Attendance by days present has consistently been above 90% over the past 5 years, with 91% for 2012-13.
Absences disaggregated by excused / unexcused indicate an increase in unexcused absences from 9.1% in 2008-
09 to 13.6% in 2012-13. The average number of tardies per period have remained just below 8 for the past 3
years, 2010-11 through 2012-13.
The suspension data was broken down by the state recognized ethnicities where the behavior data was broken
down by types of actions. There are concerns with the percent of black suspensions making up 20% of all
suspensions when the population of the student body is only 5% black in 2012-2013. There is also concern that
the number of weapon violations went from one infraction in both 2009-2010 and 2011-2012 to 5 infractions in
2012-2013. However, the total number of students receiving attendance/compliance suspensions decreased from
130 in 2010-2011 to 56 in 2012-2013. Also, the number of suspensions due to fights/assaults decreased from 60
to 4 between 2009-2010 and 2012-2013.
Data Analysis- MAPS
MAP Reading
Analysis of 9th
grade MAP data for reading indicates little change from fall to spring for the last 2 years.
2012-13:
64% (254 students) on target in the fall and in the spring 65% (254 students)
37% (94 students) moderately at risk in the fall and in the spring 21% (82 students)
13% (50 students) at risk in the fall and in the spring 13% (52 students)
2013-14:
66% (244 students) on target in the fall and in the spring 70% (264 students)
22% (81 students) moderately at risk in the fall and in the spring 21% (78 students)
12% (45 students at risk in the fall and in the spring 9% (36 students)
MAP Math
Analysis of 9th
grade MAP math data indicates moderate growth from fall to spring, with increases in on target
students and decreases in moderately at risk and at risk.
2012-13:
59% (237 students) on target in the fall and in the spring 69% (270 students)
24% (97 students) moderately at risk in the fall and the spring 15% (60 students)
17% (71 students) at risk in the fall and in the spring 16% (63 students)
2013-14:
61% (227 students) on target in the fall and in the spring 69% (241 students)
24% (92 students) moderately at risk in the fall and in the spring 20% (70 students)
15% (56 students) at risk in the fall and the spring 11% (38 students)

SIP Template
9 | P a g e 1 1 / 1 9 / 2 0 1 3
Data Analysis- WELPA
WELPA In both 2010-11 and 2011-12 ARHS met AMAO targets 1 and 2. The per cent of ELL students making progress
(AMAO1) was 91.2% for 2010-11 (target 66.7%) and 68.1% in 2011-12 (target 67.2%). The per cent of ELL
students transitioning out of services (AMAO2) was 35.8% for 2010-11 (target 13.9%) and 22.6% for 2011-12
(target 7.4%). However, for 2012-13 60% made progress, 7.5% fewer than the target of 67.5%.
Additionally, 5.7% transitioned out of services, 1.4% fewer than the target of 7.4% for AMAO2.
Data Analysis- Credit Attainment, Honors/AP Enrollment *-
In both 2010-11 and 2011-12 ARHS Hispanic students at risk after Sem 1 credit earned ranged between 15.1%
and 13.9% respectively and then increased to 33.3% in 2012-13. In both 2010-11 and 2011-12 ARHS Black
students at risk after Sem 1 credit earned ranged between 8.7% and 5.9% respectively and then increased to
27.3% in 2012-13.
Data Analysis- CEE Perceptual Survey
In 2014 the perceptual data was provided to the staff for analysis. The data was broken down between staff,
parent and student perception of the school for 2012-2013 and compared to previous years. The percent of staff
that felt “struggling students didn’t receive early intervention and remediation to acquire skills” went up from
20% in 2010 to 40% in 2012. In 2012, only 35% of the students say they almost always get help from teachers
or other adults in this school when they need it. Parent perception of collaboration in all seven categories
decreased from Dec 2010 to Nov 2012. The percent of teachers that believe, “all students can meet state
standards,” went up from 36% in 2008 to 52% in 2012. Combining the top two categories in 2012, 84% of
students believe that their teacher expects them to do their best . Parent’s perception that the schoolwork their
child is assigned is relevant to his/her future success has increased from 71% in 2008 to 80% in 2012
MSP/HSPE Reading
In 2014, Auburn Riverside High School reviewed data from the state assessment in reading from academic years
2002-2013. The state assessment data was disaggregated by gender, ethnicity, and special programs. The staff
identified a challenge concerning English Language Learners because their reading scores decreased from 25%
passing in 2011-12 to 12.5% in 2012-13. Generally, staff noticed females outscored males on the reading state
assessment all years except 2011-2012. Successes were noted. They include the number of AMO cells for
ARHS meeting the participation target rates in reading increased from seven cells in 2012 to nine cells in 2013.
HSPE replaced WASL in 2009-10. Generally, ARHS students have improved scores across the board in reading
since the first HSPE test.
MSP/EOC Math
In 2014, Auburn Riverside High School staff reviewed data from the state assessment in Math called the EOC
(end of course) assessment from academic years 2010-2013. The state assessment data was disaggregated by
gender, ethnicity and special programs. The staff identified several challenges in the data they reviewed. One
highlighted challenge from the data was the overall student population showed a sharp decline in the percentage

SIP Template
10 | P a g e 1 1 / 1 9 / 2 0 1 3
of students meeting standard (from the 63.1% in 2011 to 30.7% in 2013). Staff did notice that this drop was also
evident in the Washington state data (the state showed a drop from 71.1% in 2012 to 53.1% in 2013). Also,
many staff noted a widening gap between gender on the 1st year EOC (3.7% in 2011 to 6.8% in 2013). Some
celebrations included a closing gap in gender on the 2nd
year EOC (from 4.8% in 2011 to 2.9% in 2013).
MSP Science/EOC Science
In 2014, Auburn Riverside High School staff reviewed data from the state assessment in Biology from academic
years 2011-2013. The state assessment data was disaggregated by gender, ethnicity and special programs. The
staff identified a challenge in the data they reviewed in that the percentage of the ELL students on the state
biology assessment showed a decrease over time (from 11.1% in 2011-12 to 0% in 2012-2013). A closer look
also showed that Asian and Pacific Islander groups showed a similar decrease (from 82.2% in 2011-12 to 62.8%
in 2012-13). On a positive note, the overall score showed an increase in the percentage of students meeting
standards on the Biology state assessment (from 62.7% in 2011 to 70.6% in 2012-2013). Further, staff noticed
the school consistently outperformed the state when comparing the passing rate on the state assessment.
MSP/HSPE Writing
In 2014, Auburn Riverside High School reviewed data from the state assessment in writing from academic years
2002-2013. The state assessment data was disaggregated by gender, ethnicity, and special programs. The staff
identified a challenge concerning females consistently outscoring males every year from 2008-2013. They also
noted tenth grade state assessment scores in writing have barely increased from 88.4% in 2011 to 88.9% in 2013.
This suggests a flatline of concern. Successes were noted. They include the percentage of black students
meeting state assessment in writing decreased from 90.5% in 2009 to 83.3% in 2013. Also the percentage of
students in special education meeting standard increased from 42.1% in 2012 to 66.7% in 2013.

SIP Template
11 | P a g e 1 1 / 1 9 / 2 0 1 3
Parent involvement – SWT 6 As ARHS transitions to a more diverse population its parent outreach and involvement must become more
diverse. ARHS is training all of its staff including office staff, in the greater use of Trans Act Interpretive
services and document translations, parent engagement strategies, and the impact of poverty. All formal
communications including handbooks and newsletters will be transitioned to translated versions for all home
languages in the building.
Starting the Summer of 2014 teams of teachers, counselors, and administrators will reach out to parents and
families by visiting homes of students enrolled in FLIGHT and ELL within the ARHS community. These visits
will welcome, inform, and answer questions related to student success and parent involvement. A Spanish
speaking staff member will be included for Spanish speaking homes.
ARHS will begin a redesign of the traditional Open House it has had for 19 years with a move toward a
Curricular and Standards Based event. Parents will be encouraged to understand what it takes for their student to
achieve and how best to support them and/or connect with the schoolhouse for support.
With our Hispanic population growing to over 20%, ARHS will introduce a Latino advisory, encouraging
parents to grow with us and support our success.
Student Transitions – SWT 7 ARHS has tiers of transition support for all incoming students: Tier 1: Orientation Class for all 9th graders or embedded Orientation in 9th grade AP Human Geography, FLIGHT, and ELL. Course focuses on building wide academic and post high school support services, achievement goals, 5 yr plans, culminating portfolio introduction, and student success skills. To be added this year, Digital Citizenship. Raven Crew , a student based mentoring program designed to welcome and help transition 9th graders, pairs 9th graders them with upperclassmen starting the first day of school. Tier 2: FLIGHT program: ARHS reviews data (grades, MSP, etc) of all incoming 8th graders looking for those needing greater transition support. 60 students are enrolled in our specially designed FLIGHT program in which 3 teachers teach ELA, Algebra, World Studies, Orientation, and Study Skills.
Tier 3:
Beginning fall 2014, FLIGHT students will roll into an abbreviated 10th
grade FLIGHT study skills in which
ELA, Math, and Science teachers will be available each day to them for ongoing academic support.
Assessment Decisions- SWT 8 Teachers at Auburn Riverside contact and utilize data in a variety of ways and at numerous levels. The
administrative team in conjunction with the Building Leadership team (All department heads and program leaders)
review and discuss Achievement (HSPE, EOC, CEE, WLPT), credit attainment and other relevant data on a by
grading period basis. Department heads work within their department PLCs looking at F grades by grading
period, Map data, and other relevant data. Our ELL and SpEd departments work with department members and
administrators regarding WELPA, DAPE and other relevant data as well. Twice a year the entire teaching staff of
SIP Template
12 | P a g e 1 1 / 1 9 / 2 0 1 3
ARHS reviews and analyzes achievement, demographic, contextual, and perceptual data, resulting in
recommendations regarding school wide improvement and departmental decisions.
This work with data results in PLC’s being more focused on curricular changes and relevant learning targets.
Students are identified more readily for targeted support and instruction such as in math intervention courses and
Flight programs. Students are also identified for closer monitoring and support.
Effective, Timely Assistance – SWT 9 Students entering from 8th grade are screened by grades, attendance, and achievement scores to determine placement
in 9th grade At Risk FLIGHT program. All 9th are supported in transitions through Orientation program. FLIGHT
students entering 10th grade are supported another year through FLIGHT study skills course. All students have the
option to choose study skills support course as well. Math intervention is provided to students who fail Algebra or
Geometry their first semester. Students who fail LA or SS courses may qualify for Recapture courses. Flexible
grouping is provided in LA and SS courses.
Students with IEPs are served and monitored with LA, Reading, Math, and Study Skills courses. ELL students are
supported in LA and sheltered in Orientation and study skills.

SIP Template
13 | P a g e 1 1 / 1 9 / 2 0 1 3
Pyramid Response to Interventions
Support for All Students
Clear Learning Targets, Success
Criteria in all classes.
Close Reading in all classes using Double
Entry Journaling and other Close Reading
strategies.
Academic Vocabulary taught in all classes
Core Curriculum
o Identified Standards for all
courses
o Common Assessments
o SBAC stems created with in core
courses
School Structures
PLC’s use Data for
decision making
Yearly Data Carousels with
all staff involved
MAPS testing
Raven Crew and Orientation for
Transitioning 9th
Tier 1: Core Program
Targeted Supplemental Support
Study Skills courses for
individualized support.
Flight 10th
Study Skills
Testing Center
4 week progress reports
Parent Teacher conferencing
Embedded Tech intervention in
Algebra 1/2 , Geometry, Alg 3/4
Supplemental Courses
Orientation for 9th
Flight for At Risk 9th
Apex Online for credit def.
Recapture courses in LA and
SS for credit def.
Alg/Geom. 2nd
semester
intervention classes
Basic LA and SS
Tier 2: Supplemental Support
SpEd
ELl, and sheltered ELL
study skill and Orientation
ELL Lab
Tier 3: Intensive Support
Special
Education Testing
SIP Template
14 | P a g e 1 1 / 1 9 / 2 0 1 3
Prioritized Challenges
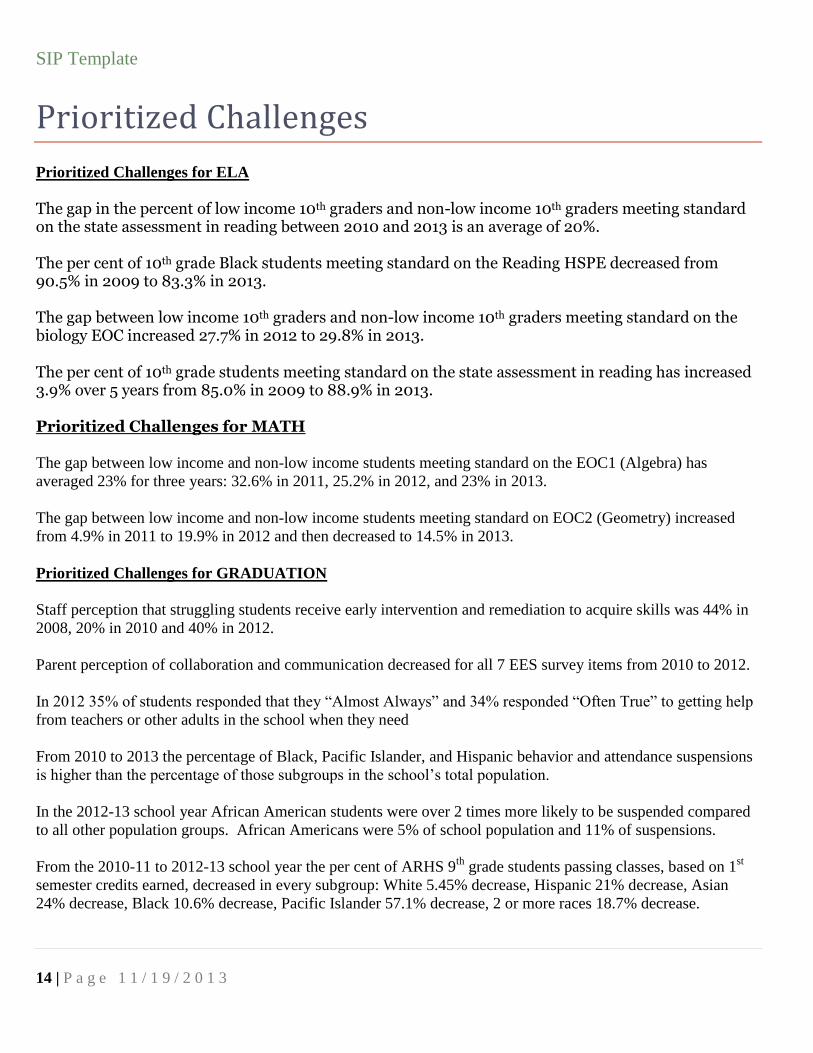
Prioritized Challenges for ELA
The gap in the percent of low income 10th graders and non-low income 10th graders meeting standard on the state assessment in reading between 2010 and 2013 is an average of 20%. The per cent of 10th grade Black students meeting standard on the Reading HSPE decreased from 90.5% in 2009 to 83.3% in 2013. The gap between low income 10th graders and non-low income 10th graders meeting standard on the biology EOC increased 27.7% in 2012 to 29.8% in 2013.
The per cent of 10th grade students meeting standard on the state assessment in reading has increased 3.9% over 5 years from 85.0% in 2009 to 88.9% in 2013. Prioritized Challenges for MATH The gap between low income and non-low income students meeting standard on the EOC1 (Algebra) has
averaged 23% for three years: 32.6% in 2011, 25.2% in 2012, and 23% in 2013.
The gap between low income and non-low income students meeting standard on EOC2 (Geometry) increased
from 4.9% in 2011 to 19.9% in 2012 and then decreased to 14.5% in 2013.
Prioritized Challenges for GRADUATION
Staff perception that struggling students receive early intervention and remediation to acquire skills was 44% in
2008, 20% in 2010 and 40% in 2012.
Parent perception of collaboration and communication decreased for all 7 EES survey items from 2010 to 2012.
In 2012 35% of students responded that they “Almost Always” and 34% responded “Often True” to getting help
from teachers or other adults in the school when they need
From 2010 to 2013 the percentage of Black, Pacific Islander, and Hispanic behavior and attendance suspensions
is higher than the percentage of those subgroups in the school’s total population.
In the 2012-13 school year African American students were over 2 times more likely to be suspended compared
to all other population groups. African Americans were 5% of school population and 11% of suspensions.
From the 2010-11 to 2012-13 school year the per cent of ARHS 9th
grade students passing classes, based on 1st
semester credits earned, decreased in every subgroup: White 5.45% decrease, Hispanic 21% decrease, Asian
24% decrease, Black 10.6% decrease, Pacific Islander 57.1% decrease, 2 or more races 18.7% decrease.

SIP Template
15 | P a g e 1 1 / 1 9 / 2 0 1 3
The total number of 9th
grade course failures increased from 192 for grad class 2014 to 539 for grad class 2016.

SIP Template
16 | P a g e 1 1 / 1 9 / 2 0 1 3
Needs Assessment Data Documents
o WELPA results
o Credit Attainment Dashboards
o Honors/AP Dashboards
o CEE results
o SAT/ACT results
o Discipline/Attendance Dashboards
o Demographic charts
o AYP Results
o HSPE/EOC Results and trend charts
o Other
o

SIP Template
17 | P a g e 1 1 / 1 9 / 2 0 1 3

SIP Template
18 | P a g e 1 1 / 1 9 / 2 0 1 3

SIP Template
19 | P a g e 1 1 / 1 9 / 2 0 1 3

SIP Template
20 | P a g e 1 1 / 1 9 / 2 0 1 3

SIP Template
21 | P a g e 1 1 / 1 9 / 2 0 1 3

SIP Template
22 | P a g e 1 1 / 1 9 / 2 0 1 3

SIP Template
23 | P a g e 1 1 / 1 9 / 2 0 1 3

SIP Template
24 | P a g e 1 1 / 1 9 / 2 0 1 3

SIP Template
25 | P a g e 1 1 / 1 9 / 2 0 1 3

SIP Template
26 | P a g e 1 1 / 1 9 / 2 0 1 3

SIP Template
27 | P a g e 1 1 / 1 9 / 2 0 1 3

SIP Template
28 | P a g e 1 1 / 1 9 / 2 0 1 3

SIP Template
29 | P a g e 1 1 / 1 9 / 2 0 1 3

SIP Template
30 | P a g e 1 1 / 1 9 / 2 0 1 3

SIP Template
31 | P a g e 1 1 / 1 9 / 2 0 1 3

SIP Template
32 | P a g e 1 1 / 1 9 / 2 0 1 3

SIP Template
33 | P a g e 1 1 / 1 9 / 2 0 1 3

SIP Template
34 | P a g e 1 1 / 1 9 / 2 0 1 3

SIP Template
35 | P a g e 1 1 / 1 9 / 2 0 1 3

SIP Template
36 | P a g e 1 1 / 1 9 / 2 0 1 3

SIP Template
37 | P a g e 1 1 / 1 9 / 2 0 1 3

SIP Template
38 | P a g e 1 1 / 1 9 / 2 0 1 3

SIP Template
39 | P a g e 1 1 / 1 9 / 2 0 1 3

SIP Template
40 | P a g e 1 1 / 1 9 / 2 0 1 3

SIP Template
41 | P a g e 1 1 / 1 9 / 2 0 1 3

SIP Template
42 | P a g e 1 1 / 1 9 / 2 0 1 3

SIP Template
43 | P a g e 1 1 / 1 9 / 2 0 1 3

SIP Template
44 | P a g e 1 1 / 1 9 / 2 0 1 3

SIP Template
45 | P a g e 1 1 / 1 9 / 2 0 1 3

SIP Template
46 | P a g e 1 1 / 1 9 / 2 0 1 3
2002-03
2003-04
2004-05
2005-06
2006-07
2007-08
2008-09
2009-10
2010-11
2011-12
2012-2013
ARHS 62.1% 59.6% 73.5% 82.7% 82.2% 82.8% 85.0% 82.0% 82.3% 87.5% 88.9%
District 60.6% 60.1% 71.4% 79.2% 79.5% 78.2% 77.9% 76.7% 78.6% 80.8% 84.3%
State 60.0% 64.5% 72.9% 82.0% 80.8% 81.8% 81.2% 78.9% 82.6% 81.3% 85.0%
62.1%
59.6%
73.5%
82.7% 82.2% 82.8% 85.0%
82.0% 82.3%
87.5% 88.9%
55.0% 60.0% 65.0% 70.0% 75.0% 80.0% 85.0% 90.0% 95.0%
%M
ee
tin
g R
ead
ing
Stan
dar
ds
Reading 10th Grade WASL/HSPE, 2002-2013
SMART Goal 1
Subject Area:
School Name: Auburn Riverside High School
Target Population- based on
demographic, discipline and attendance
data analysis:
All Students with particular focus on Hispanic, Black and Low income
Our Reality-based on assessment
data analysis:
Our SMART Goal-based on target
population and your reality:
The per cent of 10th graders meeting standard on the state reading assessment will increase by 1.5% (AMO) each year from 86% in 2013 to 92% in 2017 (with adjustments made using baseline data from the 2015 SBAC assessment).
Action Plan
Action Step Close reading with double entry journals will be implemented in all content classrooms

SIP Template
47 | P a g e 1 1 / 1 9 / 2 0 1 3
Evidence of Implementation Evidence of Impact Timeline Resources Responsibility
R1.1EEach teacher will plan and deliver a close reading lesson at least once a quarter in all content classrooms. R1.2 Double entry journal or PLC/Admin approved close reading strategy will be integrated into a close reading lesson quarterly in all content classrooms
Analysis of student double entry journals to assess comprehension of text and plan next instructional steps at least once a quarter (in Year 1 of plan February and May) MAP data will indicate increased comprehension scores at 9th
grade and 10th grade Flight Analysis of classroom based assessments in PLCs, reported at building leadership team.
PPD on close reading and double entry journals for all staff August 2014
SDE presenter August 2014 Protocol to analyze student work PLC Building Hours Principal Hours
Administrators Building Leadership Team (Content Leads) All teachers
Alignment to District Improvement Plan Objectives:
Action Step Tier II academic vocabulary will be taught, reinforced, and assessed across content classrooms
Evidence of Implementation Evidence of Impact Timeline Resources Responsibility

SIP Template
48 | P a g e 1 1 / 1 9 / 2 0 1 3
R2.1 Each teacher will post Tier II words in classroom R2.2 Tier II words will be embedded in Learning Targets and common assessments 2015-16…
Students will use and apply Tier II words correctly in formative and summative assessments. Department chairs will report Tier II implementation at Building Leadership team meetings.
Prelaunch: Sept – Dec 2014. Building Leadership to reach consensus on common Acad. vocab. Launch Jan 2015 2nd semester through Waiver day and Monday memos PD
SDE presenter August 2014 Book study PLC Bld Hours
Administrators Building Leadership Team (Content Leads) All teachers
Alignment to District Improvement Plan Objectives:

SIP Template
49 | P a g e 1 1 / 1 9 / 2 0 1 3
2010-11 2011-12 2012-13
White 67.3% 80.8% 37.5%
Hispanic 48.5% 55.6% 24.2%
Asian/Pac. Islander 67.3% 78.5% 26.1%
Black 41.7% 60.0% 12.5%
0%
10%
20%
30%
40%
50%
60%
70%
80%
90%
%o
f St
ud
en
ts M
ee
tin
g St
and
ard
Math EOC 1, All Grades By Ethnicity, 2010-2013
SMART Goal 2
Subject Area:
School Name: AUBURN RIVERSIDE HIGH SCHOOL
Target Population- based on
demographic, discipline and attendance
data analysis:
All students in Algebra, Geometry, and Advanced Algebra with a particular focus on low income and Hispanic and Black.
Our Reality-based on assessment
data analysis:
Our SMART Goal-based on target
population and your reality:
The per cent of students meeting standard on the Algebra and Geometry EOC will increase by 2.4% (AMO)
each year from 74.1% (Algebra) and 77.8% (Geometry) in 2013 to 83.7% (Algebra) and 87.4% (Geometry) in
2017 (with adjustments made using baseline data from the 2015 SBAC assessment).
SIP Template
50 | P a g e 1 1 / 1 9 / 2 0 1 3
Action Plan
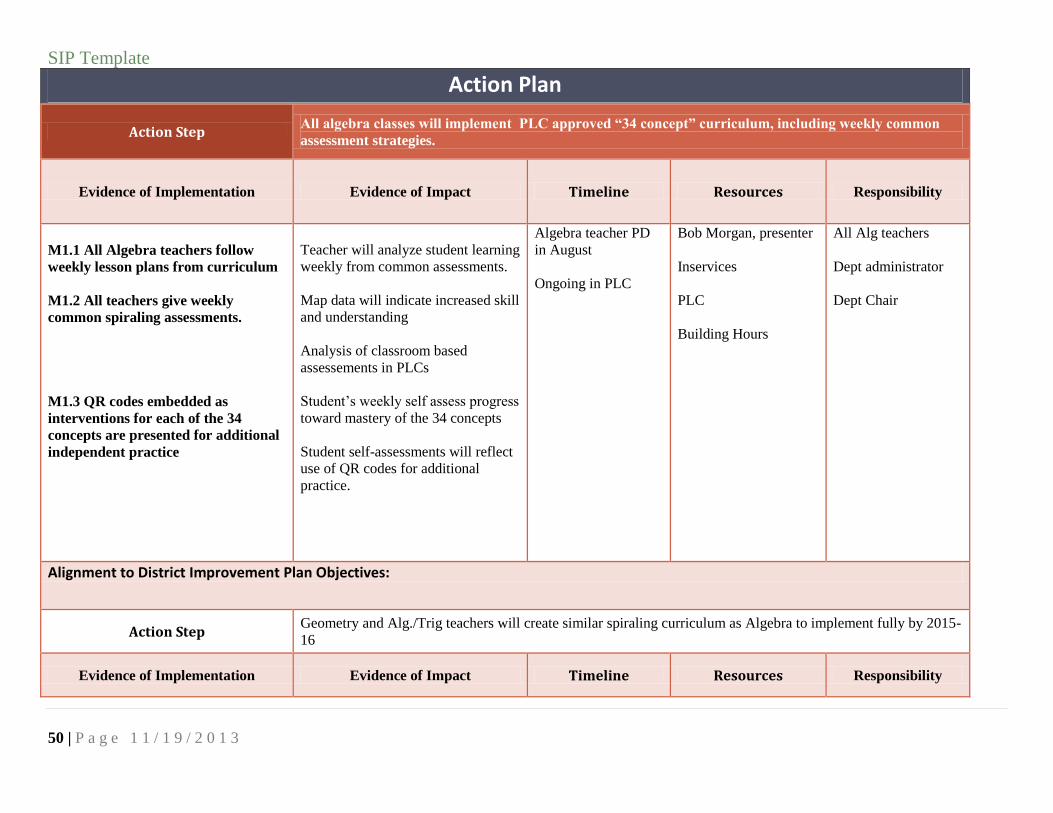
Action Step All algebra classes will implement PLC approved “34 concept” curriculum, including weekly common
assessment strategies.
Evidence of Implementation Evidence of Impact Timeline Resources Responsibility
M1.1 All Algebra teachers follow
weekly lesson plans from curriculum
M1.2 All teachers give weekly
common spiraling assessments.
M1.3 QR codes embedded as
interventions for each of the 34
concepts are presented for additional
independent practice
Teacher will analyze student learning
weekly from common assessments.
Map data will indicate increased skill
and understanding
Analysis of classroom based
assessements in PLCs
Student’s weekly self assess progress
toward mastery of the 34 concepts
Student self-assessments will reflect
use of QR codes for additional
practice.
Algebra teacher PD
in August
Ongoing in PLC
Bob Morgan, presenter
Inservices
PLC
Building Hours
All Alg teachers
Dept administrator
Dept Chair
Alignment to District Improvement Plan Objectives:
Action Step Geometry and Alg./Trig teachers will create similar spiraling curriculum as Algebra to implement fully by 2015-
16
Evidence of Implementation Evidence of Impact Timeline Resources Responsibility

SIP Template
51 | P a g e 1 1 / 1 9 / 2 0 1 3
M 2.1 Geometry and Alg/Trig Pilot
teachers will create and share
spiraling curriculum thru Google
accounts and discuss in PLC’s.
M2.2 2015-16: All Algebra teachers
follow weekly lesson plans from
curriculum
M2.3 All teachers give weekly
common spiraling assessments.
M2.4 QR codes embedded as
interventions for each of the 34
concepts are presented for additional
independent practice
Teacher will analyze student learning
weekly from common assessments.
Map data will indicate increased skill
and understanding
Analysis of classroom based
assessements in PLCs, reported at
Building Leadership team meetings
Student’s weekly self assess progress
toward mastery of the concepts
Student self-assessments will reflect
use of QR codes for additional
practice.
2014-15 School year
Launch 2015:
Geometry & Alg/Trig
teacher PD in August
Ongoing in PLC
Bob Morgan, presenter
Inservices
PLC
Building Hours
All Alg teachers
Dept administrator
Dept Chair

SIP Template
52 | P a g e 1 1 / 1 9 / 2 0 1 3
SMART Goal 3
Subject Area:
School Name: Auburn Riverside High School
Target Population- based on
demographic, discipline and
attendance data analysis:
All students with a particular focus on Hispanic and Pacific Islander.
Our Reality-based on assessment
data analysis:
2010-2011 S1 Credits Earned 2011-2012 S1 Credits Earned 2012-2013 S1 Credits Earned
Percent of students at risk Percent of students at risk Percent of students at risk
AR MR OT AR MR OT AR MR OT
AR
HS
Amr Indian/Alska Nat 44.44% 11.11% 44.44% 0.00% 0.00% 100.00% 0.00% 0.00% 0.00%
Asian 2.56% 10.26% 87.18% 4.26% 12.77% 82.98% 2.38% 14.29% 83.33%
Black 8.70% 26.09% 65.22% 5.88% 0.00% 94.12% 8.33% 29.17% 62.50%
Hispanic 15.07% 27.40% 57.53% 13.92% 27.85% 58.23% 16.84% 25.26% 57.89%
Multiracial/non-Hispanic 12.50% 12.50% 75.00% 9.52% 14.29% 76.19% 7.14% 7.14% 85.71%
Pacific Islr/Ntv Hawaiian 0.00% 100.00% 0.00% 40.00% 0.00% 60.00% 42.86% 0.00% 57.14%
White, non-Hispanic 10.49% 15.03% 74.48% 7.56% 11.11% 81.33% 4.83% 21.26% 73.91%
ALL 11.16% 17.31% 71.53% 8.77% 14.04% 77.19% 8.37% 21.18% 70.44%
AG 12.42% 21.57% 66.01% 10.34% 17.82% 71.84% 12.06% 21.11% 66.83%
Our SMART Goal-based on
target population and your reality: The adjusted 5 year graduation rate will increase from 91.2% in 2013 to 94.2% in 2016.
Action Plan
Action Step All teacher lessons will use and communicate Learning Targets that are aligned to PLC agreed upon
grade level standards.
Evidence of Implementation Evidence of Impact Timeline Resources Responsibility

SIP Template
53 | P a g e 1 1 / 1 9 / 2 0 1 3
G1.1 Learning Targets aligned with
standards are being developed.
G1.2 As Learning Targets are created
they will be clearly communicated to
students and embedded in
instruction.
Student’s will be able to
communicate their understanding of
what they are learning and why.
Reduction in class failures,
monitored by individual teachers and
Building Leadership team
Increase in On Time Graduation
PD For all staff Aug.
2014
Voluntary
participation in Book
Studies
Admin Monday
Memos will include
PD tips on LT
Building PD focus
Jan, Mar, May.
Learning Targets
PD/Presenter in August
Learning Target Book
Study
Cel5D instructional
framework
Building and Principal
hours
All teachers
Admin
Alignment to District Improvement Plan Objectives:
Action Step Learning Targets are measurable with clear criteria for success and performance tasks provided.
Evidence of Implementation Evidence of Impact Timeline Resources Responsibility
G2.1 Aligned formative assessment
data will be reviewed regularly to
inform instructional decisions both by
individual teachers and PLC
G2.2 Teacher will have process in
place to gather evidence of learning
data
Student achievement on formative
and summative assessments
PD For all staff Aug.
2015-16
Voluntary
participation in Book
Studies
Admin Monday
Memos will include
PD tips on LT
Building PD focus on
Learning Targets
PD/Presenter in August
Learning Target Book
Study
Cel5D instructional
framework
All teachers
Admin
SIP Template
54 | P a g e 1 1 / 1 9 / 2 0 1 3
waiver days
Alignment to District Improvement Plan Objectives:
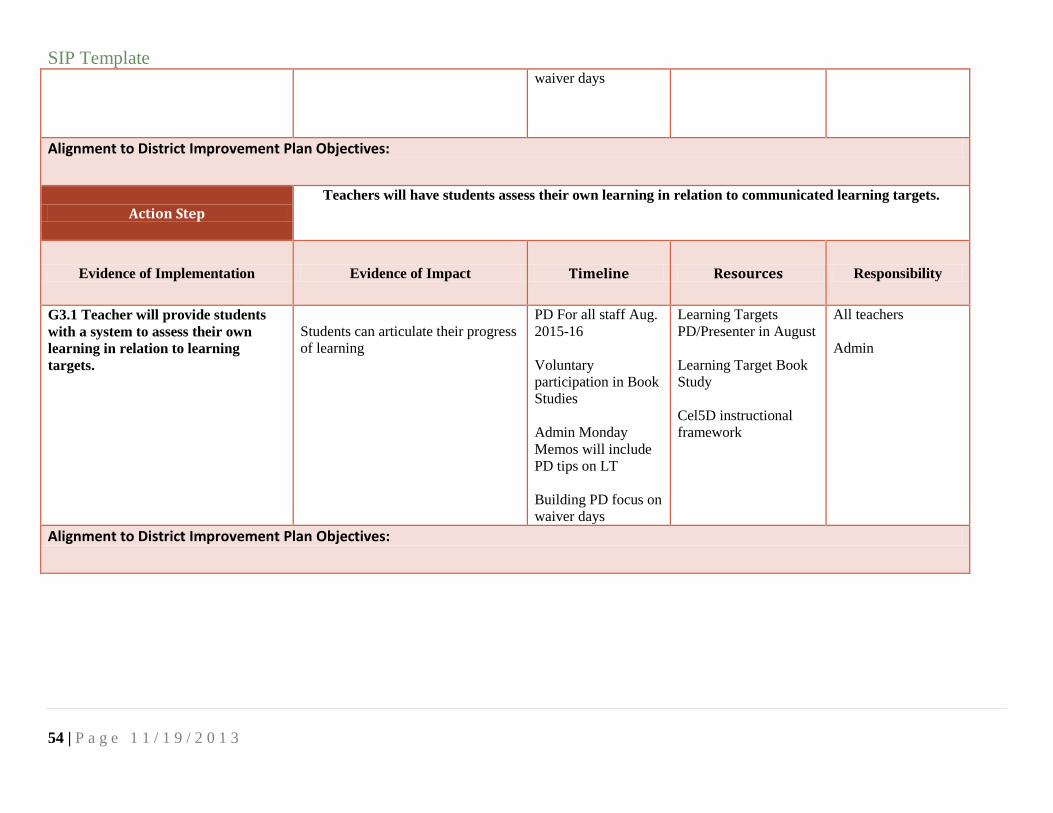
Action Step
Teachers will have students assess their own learning in relation to communicated learning targets.
Evidence of Implementation Evidence of Impact Timeline Resources Responsibility
G3.1 Teacher will provide students
with a system to assess their own
learning in relation to learning
targets.
Students can articulate their progress
of learning
PD For all staff Aug.
2015-16
Voluntary
participation in Book
Studies
Admin Monday
Memos will include
PD tips on LT
Building PD focus on
waiver days
Learning Targets
PD/Presenter in August
Learning Target Book
Study
Cel5D instructional
framework
All teachers
Admin
Alignment to District Improvement Plan Objectives:

SIP Template
55 | P a g e 1 1 / 1 9 / 2 0 1 3
Planning Implementation Calendar:
In this section develop a timeline for the SIP process for the next school year.
Timeline for Planning Process August
Staff Data and Sip Goals Meeting – All Goals – Building Staff meeting
Professional Development Close Reading, Acad. Vocab & Learning Targets – R1.1 and G1.1 – Building
Inservice
Teacher 9th
grade Outreach – Parent Involvement – Teacher Home visits
Academic vocab– R2.1 – Book Reading
September
Trans Act inservices – Parent Communication
Ongoing PD articles, Tips, examples – Goal 1 and Goal 2 – Staff Weekly Bulletin
Teacher 9th
grade Outreach – Parent Involvement – Teacher Home visits
Review of SIP goals/strategies for Final approval – all Goals – Building Leadership meeting
CTE Close Reading Inservice – R1.1 & R1.2 – PD Inservice
Spiraling Math Curriculum begins – Goal 2 – Daily and PLCs
October
Revised Open House/Curriculum Night – Parent Involvement & All Goals – Oct 1
Hispanic and Ukranian Outreach – Parent Involvement – Oct 1
Ongoing PD articles, Tips, examples – Goal 1 and Goal 2 – Staff Weekly Bulletin
All staff Review of SIP and strategies – All Goals – PLC’s and Building Leadership Team
Close Reading Inservice – R1.1 & R1.2 – Waiver Day
MAPs training – Goal 1 and Goal 2 – Waiver Day
Grade Cam and Standards Based Grading Inservice – All Goals – Waiver Day
LEAP – Parent Involvement & Goal 3 – Initial Kickoff
Spiraling Math Curriculum– Goal 2 – Daily and PLCs
November
Ongoing PD articles, Tips, examples – Goal 1 and Goal 2 – Staff Weekly Bulletin
Ongoing Spiraling curriculum creation, alignment, and review - Goal 2 – Math PLCs
One to One contact for Parent Teacher conferences- Parent Involvement – Targeted Phone Calling
SBAC inservice for SS and other depts..– R1.1 & R1.2 – Prof. Dev.
LEAP – Parent Involvement & Goal 3 – Initial Kickoff
Academic vocab– R2.1 – Book Reading
Academic Vocab Survey – R2.1 & 2.2 – Building Leadership Team
Review of SIP goals/strategies– Goal 1 – Building Leadership meeting
Spiraling Math Curriculum– Goal 2 – Daily and PLCs

SIP Template
56 | P a g e 1 1 / 1 9 / 2 0 1 3
December
Ongoing PD articles, Tips, examples – Goal 1 and Goal 2 – Staff Weekly Bulletin
Ongoing Spiraling curriculum creation, alignment, and review - Goal 2 – Math PLCs
Academic Vocab Determination and Dissemination – R2.1 & R2.2 – PD
Spiraling Math Curriculum– Goal 2 – Daily and PLCs
January
Data Review all Staff – All Goals – Building Leadership
Ongoing PD articles, Tips, examples – Goal 1 and Goal 2 – Staff Weekly Bulletin
Review of SIP goals/strategies– Goal 1 – Building Leadership meeting
Spiraling Math Curriculum– Goal 2 – Daily and PLCs
February
Ongoing PD articles, Tips, examples – Goal 1 and Goal 2 – Staff Weekly Bulletin
Review of SIP goals/strategies– Goal 1 – Building Leadership meeting
Spiraling Math Curriculum– Goal 2 – Daily and PLCs
March
Acadmic Vocab Inservice – R2.1 & R2.2 – Waiver Day
Learning Targets and Success Criteria – Goal 3 – Waiver Day
Review of SIP goals/strategies– Goal 1 – Building Leadership meeting
Spiraling Math Curriculum– Goal 2 – Daily and PLCs
Ongoing PD articles, Tips, examples – Goal 1 and Goal 2 – Staff Weekly Bulletin
April
Spiraling Math Curriculum– Goal 2 – Daily and PLCs
Ongoing PD articles, Tips, examples – Goal 1 and Goal 2 – Staff Weekly Bulletin
Review of SIP goals/strategies– Goal 1 – Building Leadership meeting
May
End of Year Review of SIP Goals – All Goals – PD Waiver Day
Spiraling Math Curriculum– Goal 2 – Daily and PLCs
Ongoing PD articles, Tips, examples – Goal 1 and Goal 2 – Staff Weekly Bulletin
Review of SIP goals/strategies– Goal 1 – Building Leadership meeting

SIP Template
57 | P a g e 1 1 / 1 9 / 2 0 1 3
Timeline 2015-16
August Staff Data and Sip Goals Meeting – All Goals – Building Staff meeting
Professional Development Learning Targets and student growth G1.1 – Building Inservice
Teacher 9th grade Outreach – Parent Involvement – Teacher Home visits
September
Trans Act and Engagement inservices – Parent Communication
Grade Cam and Standards Based Grading Inservice – All Goals – Waiver Day Ongoing PD articles, Tips, examples – Goal 3 – Staff Weekly Bulletin
Teacher 9th grade Outreach – Parent Involvement – Teacher Home visits
Spiraling Math Curriculum begins – Goal 2 – Daily and PLCs
October
Open House/Curriculum Night – Parent Involvement & All Goals
Staff inservice Student Safety
Hispanic and Ukranian Outreach – Parent Involvement Ongoing PD articles, Tips, examples – Goal 1 and Goal 2 – Staff Weekly Bulletin
All staff Review of SIP and strategies – All Goals – PLC’s and Building Leadership Team
Spiraling Math Curriculum– Goal 2 – Daily and PLCs
November
Ongoing PD articles, Tips, examples – Goal 1 and Goal 2 – Staff Weekly Bulletin
Ongoing Spiraling curriculum creation, alignment, and review - Goal 2 – Math PLCs
One to One contact for Individual Teacher conferences- Parent Involvement – Teacher Targeted Phone Calling
Parent Teacher Conferences – All School Spiraling Math Curriculum– Goal 2 – Daily and PLCs
December
Ongoing PD articles, Tips, examples – Goal 1 and Goal 2 – Staff Weekly Bulletin
Ongoing Spiraling curriculum creation, alignment, and review - Goal 2 – Math PLCs
Spiraling Math Curriculum– Goal 2 – Daily and PLCs
Academic vocab 2.0 staff initiation
January
Academic Vocab kick off Ongoing PD articles, Tips, examples – Goal 1 and Goal 2 – Staff Weekly Bulletin
Review of SIP goals/strategies– Goal 1 – Building Leadership meeting
Spiraling Math Curriculum– Goal 2 – Daily and PLCs Academic Vocab Survey – R2.1 & 2.2 – Building Leadership Team

SIP Template
58 | P a g e 1 1 / 1 9 / 2 0 1 3
Academic Vocab 2.0 Survey – R2.1 & 2.2 – Building Leadership Team
Academic Vocab 2.0 Determination and Pretest – R2.1 & R2.2 – PD
February
Data Review all Staff – All Goals – Building Leadership
Ongoing PD articles, Tips, examples – Goal 1 and Goal 2 – Staff Weekly Bulletin
Review of SIP goals/strategies– Goal 1 – Building Leadership meeting
Spiraling Math Curriculum– Goal 2 – Daily and PLCs
Academic Vocab 2.0 classroom curriculum
March
Learning Targets and Success Criteria – Goal 3 – Waiver Day
Review of SIP goals/strategies– Goal 1 – Building Leadership meeting
Spiraling Math Curriculum– Goal 2 – Daily and PLCs
Ongoing PD articles, Tips, examples – Goal 1 and Goal 2 – Staff Weekly Bulletin
Acadmic Vocab 2.0 post test and data review
April Spiraling Math Curriculum– Goal 2 – Daily and PLCs
Ongoing PD articles, Tips, examples – Goal 1 and Goal 2 – Staff Weekly Bulletin
Review of SIP goals/strategies– Goal 1 – Building Leadership meeting
May
End of Year Review of SIP Goals – All Goals – PD Waiver Day
Spiraling Math Curriculum– Goal 2 – Daily and PLCs
Ongoing PD articles, Tips, examples – Goal 1 and Goal 2 – Staff Weekly Bulletin
Review of SIP goals/strategies– Goal 1 – Building Leadership meeting