toolibin lake 2010, combining hydrogeology, remote sensing ......toolibin lake 2010, combining...
TRANSCRIPT

Toolibin Lake 2010, combining
hydrogeology, remote sensing and
plant ecophysiology to explain the
response to management
interventions. Dr Ryan Vogwill1, 2, Dr Paul Drake1, Blaire Coleman1
and Saskia Noorduijn1, 2
1WA Department of Environment and Conservation, 2University of Western
Australia
Special thanks to; Rachel Taplin, Ken Wallace, Jennifer Higbid,
Katherine Zdunic, Jim Lane, Lance Mudgway, Peter Lacey and Ray
McKnight.

Outline
Altered hydrology (salinity) impacts
Location and Toolibin Lake biological values
Toolibin Lake deep hydrogeology
Timeline of impacts, recovery actions and 1994
management goals
Response to recovery actions (vegetation and
hydrology)
Preliminary outcomes of a multidisciplinary investigation
Soil hydraulics and shallow hydrogeology
Plant ecophysiology
Coupled unsaturated zone/saturated zone modelling
New criteria
Conclusions
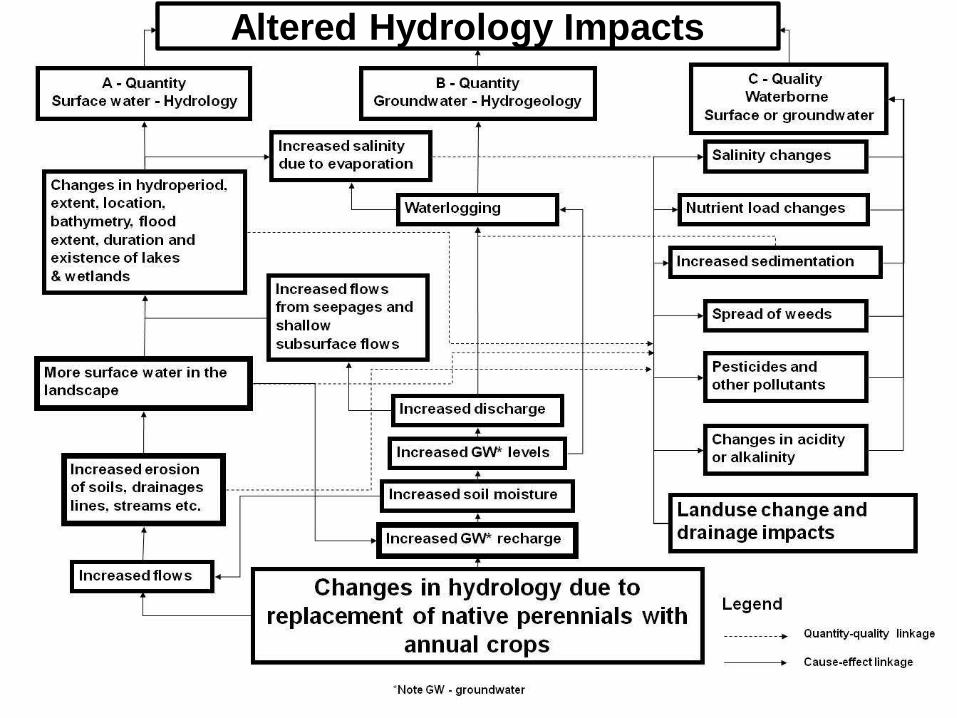
Altered Hydrology Impacts

Toolibin Lake
Conservation
Values
October 1978
Photo courtesy of Jim Lane
Ramsar listed wetland of international importance
for water birds (24 sp. breeding, 41 sp. present)
Endangered freckled duck breeding area
Last ephemeral wetland with an “intact”
vegetated lake floor in the WA wheatbelt.
Listed as a Threatened Ecological Community
(TEC) under the EPBC Act 1999.
Natural Diversity Recovery Catchment

Toolibin Hydrogeology
George R, Dogramaci S, Wyland J and Lacey P., 2005, Water engineering at Lake Toolibin,
Western Australia, Australian Journal of Water Resources, Vol 9, No.2.
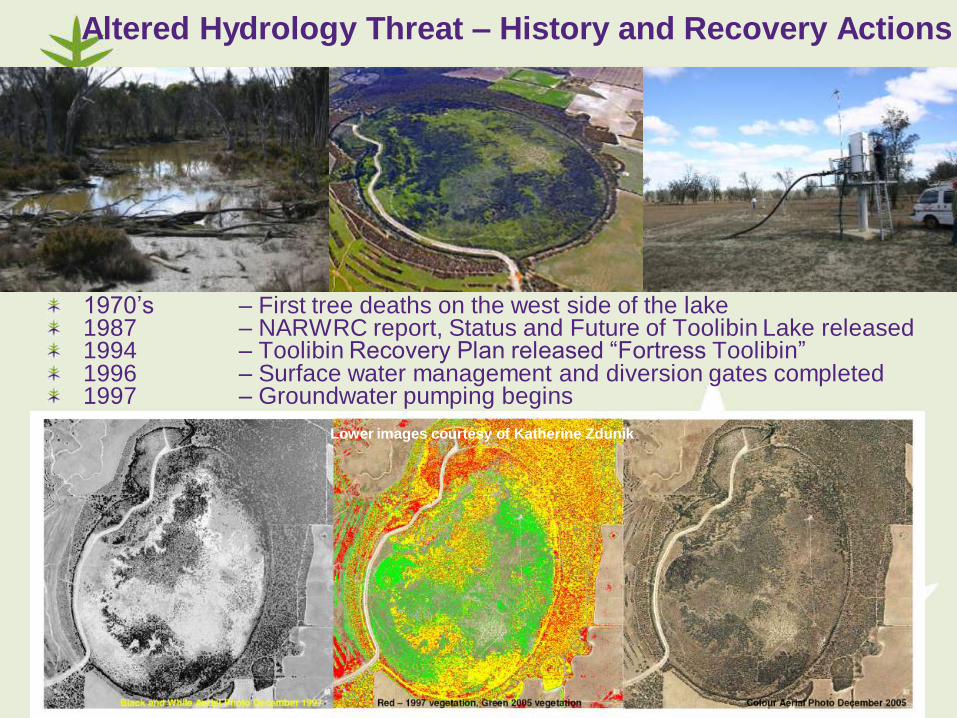
Altered Hydrology Threat – History and Recovery Actions
1970’s – First tree deaths on the west side of the lake1987 – NARWRC report, Status and Future of Toolibin Lake released1994 – Toolibin Recovery Plan released “Fortress Toolibin”1996 – Surface water management and diversion gates completed1997 – Groundwater pumping begins
Lower images courtesy of Katherine Zdunik

Vegetation Targets
No further deterioration is observed in the health of
the vegetation of the lake or the reserves
Successful tree and shrub regeneration in the lake
and reserves is established in all vegetation
associations
Hydrological Targets
More than 80% of the lake bed with greater than 1.5 m
depth to groundwater in spring (Sept-Oct) when the
lake is not full
The maximum TDS of the lake when full is 1000 mg/l
1994 Recovery Plan - Management Goals
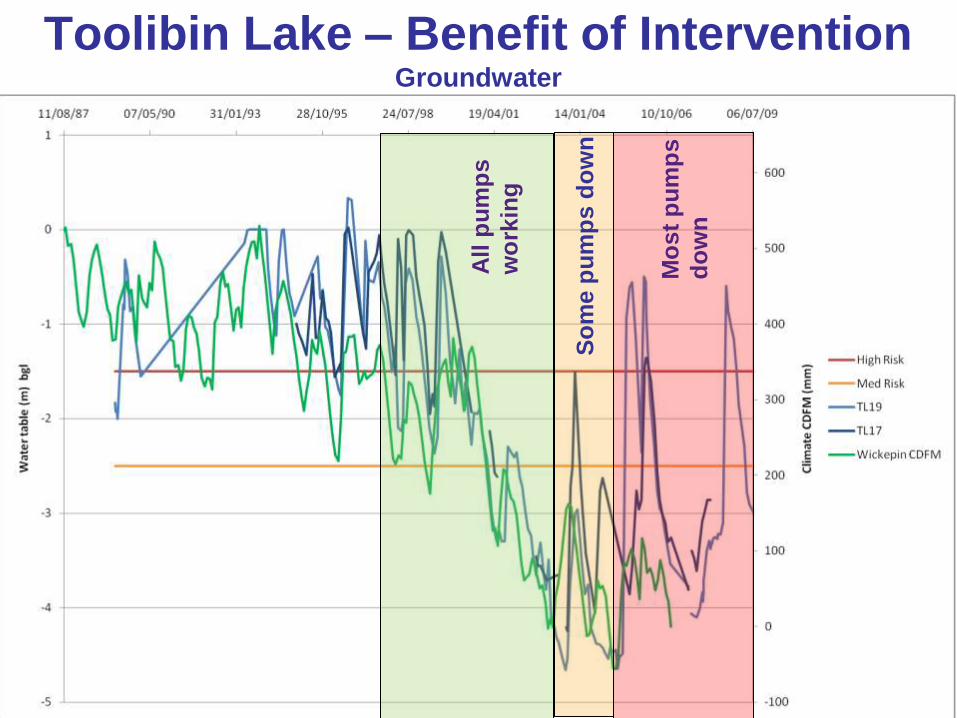
Toolibin Lake – Benefit of InterventionGroundwater
All
pu
mp
s
wo
rkin
g
So
me
pu
mp
s d
ow
n
Mo
st
pu
mp
s
do
wn

556000 556500 557000 557500
6356500
6357000
6357500
6358000
6358500
TL17
TL19
TL20
TL23
TL24
TL25
TL26TL27
TL28TL29TL30
TL31
TL32
TL33
TL34
TL36
TL20A
T1/1T1/2
T2/1T2/2
T3/1T3/2
T4/1T4/2
TL18
TL35TL35A
TL01
TL04
P1
P2
P3
P4
P7
P9
P10
P11
P15
P13
P14
September 1997
Pumping Bore
Observation Bore
Depth to Groundwater less than 1.5m
556000 556500 557000 557500
6356500
6357000
6357500
6358000
6358500
TL17
TL19
TL20
TL23
TL24
TL25
TL26TL27
TL28TL29TL30
TL31
TL32
TL33
TL34
TL36
TL20A
T1/1T1/2
T2/1T2/2
T3/1T3/2
T4/1T4/2
TL18
TL35TL35A
TL01
TL04
P1
P2
P3
P4
P7
P9
P10
P11
P15
P13
P14
September 1998
Pumping Bore
Observation Bore
Depth to Groundwater less than 1.5m
556000 556500 557000 557500
6356500
6357000
6357500
6358000
6358500
TL17
TL19
TL20
TL23
TL24
TL25
TL26TL27
TL28TL29TL30
TL31
TL32
TL33
TL34
TL36
TL20A
T1/1T1/2
T2/1T2/2
T3/1T3/2
T4/1T4/2
TL18
TL35TL35A
TL01
TL04
P1
P2
P3
P4
P7
P9
P10
P11
P15
P13
P14
September 1999
Pumping Bore
Observation Bore
Depth to Groundwater less than 1.5m
556000 556500 557000 557500
6356500
6357000
6357500
6358000
6358500
TL17
TL19
TL20
TL23
TL24
TL25
TL26TL27
TL28TL29TL30
TL31
TL32
TL33
TL34
TL36
TL20A
T1/1T1/2
T2/1T2/2
T3/1T3/2
T4/1T4/2
TL18
TL35TL35A
TL01
TL04
P1
P2
P3
P4
P7
P9
P10
P11
P15
P13
P14
October 2000
Pumping Bore
Observation Bore
Depth to Groundwater less than 1.5m
556000 556500 557000 557500
6356500
6357000
6357500
6358000
6358500
TL17
TL19
TL20
TL23
TL24
TL25
TL26TL27
TL28TL29TL30
TL31
TL32
TL33
TL34
TL36
TL20A
T1/1T1/2
T2/1T2/2
T3/1T3/2
T4/1T4/2
TL18
TL35TL35A
TL01
TL04
P1
P2
P3
P4
P7
P9
P10
P11
P15
P13
P14
September 2001
Pumping Bore
Observation Bore
Depth to Groundwater less than 1.5m
556000 556500 557000 557500
6356500
6357000
6357500
6358000
6358500
TL17
TL19
TL20
TL23
TL24
TL25
TL26TL27
TL28TL29TL30
TL31
TL32
TL33
TL34
TL36
TL20A
T1/1T1/2
T2/1T2/2
T3/1T3/2
T4/1T4/2
TL18
TL35TL35A
TL01
TL04
P1
P2
P3
P4
P7
P9
P10
P11
P15
P13
P14
October 2002
Pumping Bore
Observation Bore
Depth to Groundwater less than 1.5m
556000 556500 557000 557500
6356500
6357000
6357500
6358000
6358500
TL17
TL19
TL20
TL23
TL24
TL25
TL26TL27
TL28TL29TL30
TL31
TL32
TL33
TL34
TL36
TL20A
T1/1T1/2
T2/1T2/2
T3/1T3/2
T4/1T4/2
TL18
TL35TL35A
TL01
TL04
P1
P2
P3
P4
P7
P9
P10
P11
P15
P13
P14
October 2003
Pumping Bore
Observation Bore
Depth to Groundwater less than 1.5m
556000 556500 557000 557500
6356500
6357000
6357500
6358000
6358500
TL17
TL19
TL20
TL23
TL24
TL25
TL26TL27
TL28TL29TL30
TL31
TL32
TL33
TL34
TL36
TL20A
T1/1T1/2
T2/1T2/2
T3/1T3/2
T4/1T4/2
TL18
TL35TL35A
TL01
TL04
P1
P2
P3
P4
P7
P9
P10
P11
P15
P13
P14
September 2004
Pumping Bore
Observation Bore
Depth to Groundwater less than 1.5m
556000 556500 557000 557500
6356500
6357000
6357500
6358000
6358500
TL17
TL19
TL20
TL23
TL24
TL25
TL26TL27
TL28TL29TL30
TL31
TL32
TL33
TL34
TL36
TL20A
T1/1T1/2
T2/1T2/2
T3/1T3/2
T4/1T4/2
TL18
TL35TL35A
TL01
TL04
P1
P2
P3
P4
P7
P9
P10
P11
P15
P13
P14
October 2005
Pumping Bore
Observation Bore
Depth to Groundwater less than 1.5m
556000 556500 557000 557500
6356500
6357000
6357500
6358000
6358500
TL17
TL19
TL20
TL23
TL24
TL25
TL26TL27
TL28TL29TL30
TL31
TL32
TL33
TL34
TL36
TL20A
T1/1T1/2
T2/1T2/2
T3/1T3/2
T4/1T4/2
TL18
TL35TL35A
TL01
TL04
P1
P2
P3
P4
P7
P9
P10
P11
P15
P13
P14
October 2006
Pumping Bore
Observation Bore
Depth to Groundwater less than 1.5m
556000 556500 557000 557500
6356500
6357000
6357500
6358000
6358500
TL17
TL19
TL20
TL23
TL24
TL25
TL26TL27
TL28TL29TL30
TL31
TL32
TL33
TL34
TL36
TL20A
T1/1T1/2
T2/1T2/2
T3/1T3/2
T4/1T4/2
TL18
TL35TL35A
TL01
TL04
P1
P2
P3
P4
P7
P9
P10
P11
P15
P13
P14
October 2007
Pumping Bore
Observation Bore
Depth to Groundwater less than 1.5m
556000 556500 557000 557500
6356500
6357000
6357500
6358000
6358500
TL17
TL19
TL20
TL23
TL24
TL25
TL26TL27
TL28TL29TL30
TL31
TL32
TL33
TL34
TL36
TL20A
T1/1T1/2
T2/1T2/2
T3/1T3/2
T4/1T4/2
TL18
TL35TL35A
TL01
TL04
P1
P2
P3
P4
P7
P9
P10
P11
P15
P13
P14
September 2008
Pumping Bore
Observation Bore
Depth to Groundwater less than 1.5m
556000 556500 557000 557500
6356500
6357000
6357500
6358000
6358500
TL17
TL19
TL20
TL23
TL24
TL25
TL26TL27
TL28TL29TL30
TL31
TL32
TL33
TL34
TL36
TL20A
T1/1T1/2
T2/1T2/2
T3/1T3/2
T4/1T4/2
TL18
TL35TL35A
TL01
TL04
P1
P2
P3
P4
P7
P9
P10
P11
P15
P13
P14
September 2009
Pumping Bore
Observation Bore
Depth to Groundwater less than 1.5m
Groundwater
Goals
Performance?
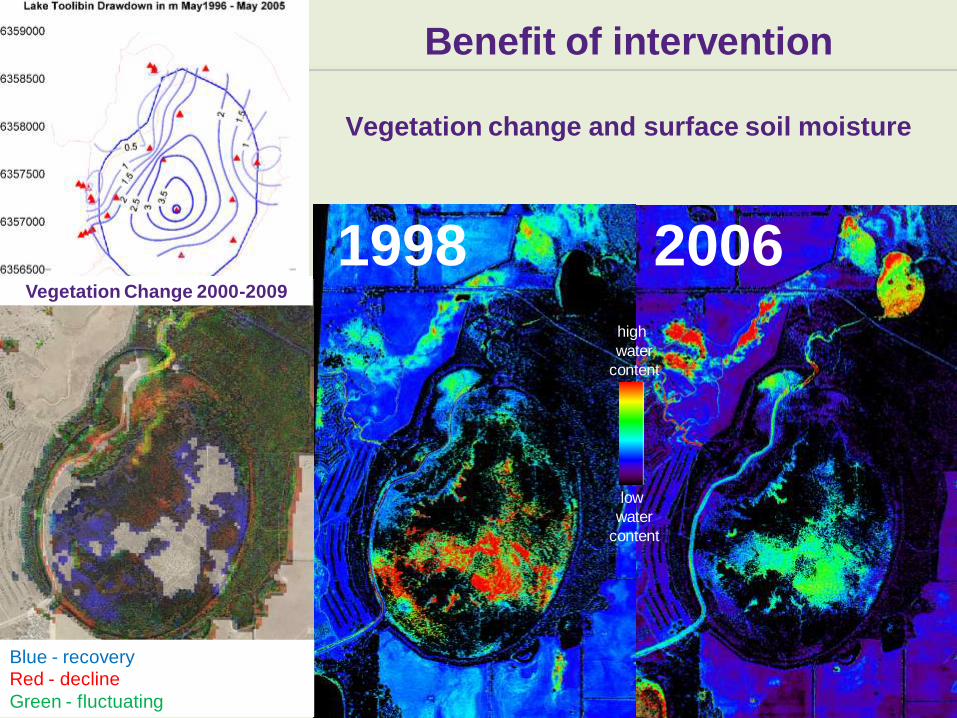
Benefit of intervention
Vegetation change and surface soil moisture
1998 2006
low
water
content
high
water
content
Vegetation Change 2000-2009
Blue - recovery
Red - decline
Green - fluctuating

0
25
50
75
100
125
150
175
200
1998 2000 2002 2004 2006 2008 2010
Nu
mb
er
of
trees
Plot 34
Casuarina obesa
0
200
400
600
800
1000
1200
1996 1998 2000 2002 2004 2006 2008 2010
Nu
mb
er
of
trees
Plot 27
Casuarina obesa
0
20
40
60
80
100
120
140
1996 1998 2000 2002 2004 2006 2008 2010
Nu
mb
er
of
trees
SAP 1
Casuarina obesa Melaleuca strobophylla
0
2
4
6
8
10
12
14
16
18
20
1975 1980 1985 1990 1995 2000 2005 2010
Nu
mb
er
of
trees
Plot 4
Casuarina obesa Melaleuca strobophylla
Vegmachine
Vegetation Change 2000-2009
Blue - recovery
Red - decline
Green - fluctuating
Vegetation Change – Success and failure
Vegetation plots compliments Jen Higbid
Vegmachine plot compliments
Katherine Zdunic
25 years
14 years14 years
12 years

s
ss
s
s
M
M
M
CC
C
Piezometer
Casuarina obesa
Melaleuca strobophylla
Sensor hole
Sap flowmonitoring
20 m
Biorisk Project – Future Farm Industries CRC

556100 556200 556300 556400 556500 556600 556700 556800 556900 557000 557100 557200 557300 557400 557500
320
322
324
320
322
324
6356600 6356800 6357000 6357200 6357400 6357600 6357800 6358000 6358200 6358400
320
322
324
320
322
324
0 400
800
1200
1600
2000
2400
2800
3200
3600
4000
4400
NS-4
EW
-12
EW
-11
EW
-10
EW
-9EW
-8
EW
-7
P3-
1NS-6
NS-5
NS-4
NS-3
NS-2 P
1-1
NW
-14
NS-1
Soil SalinityS N
W E
mA
HD
mA
HD
0 25 45dS/m
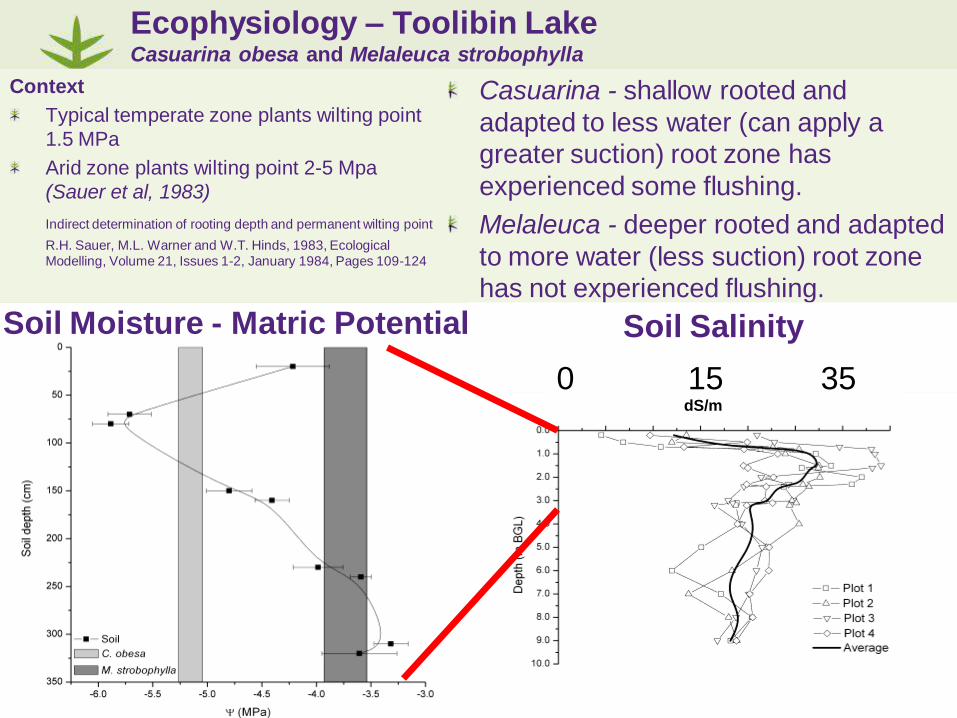
Casuarina - shallow rooted and
adapted to less water (can apply a
greater suction) root zone has
experienced some flushing.
Melaleuca - deeper rooted and adapted
to more water (less suction) root zone
has not experienced flushing.
Ecophysiology – Toolibin LakeCasuarina obesa and Melaleuca strobophylla
Soil SalinitySoil Moisture - Matric Potential
Context
Typical temperate zone plants wilting point
1.5 MPa
Arid zone plants wilting point 2-5 Mpa
(Sauer et al, 1983)
Indirect determination of rooting depth and permanent wilting point
R.H. Sauer, M.L. Warner and W.T. Hinds, 1983, Ecological
Modelling, Volume 21, Issues 1-2, January 1984, Pages 109-124
0 15 35dS/m
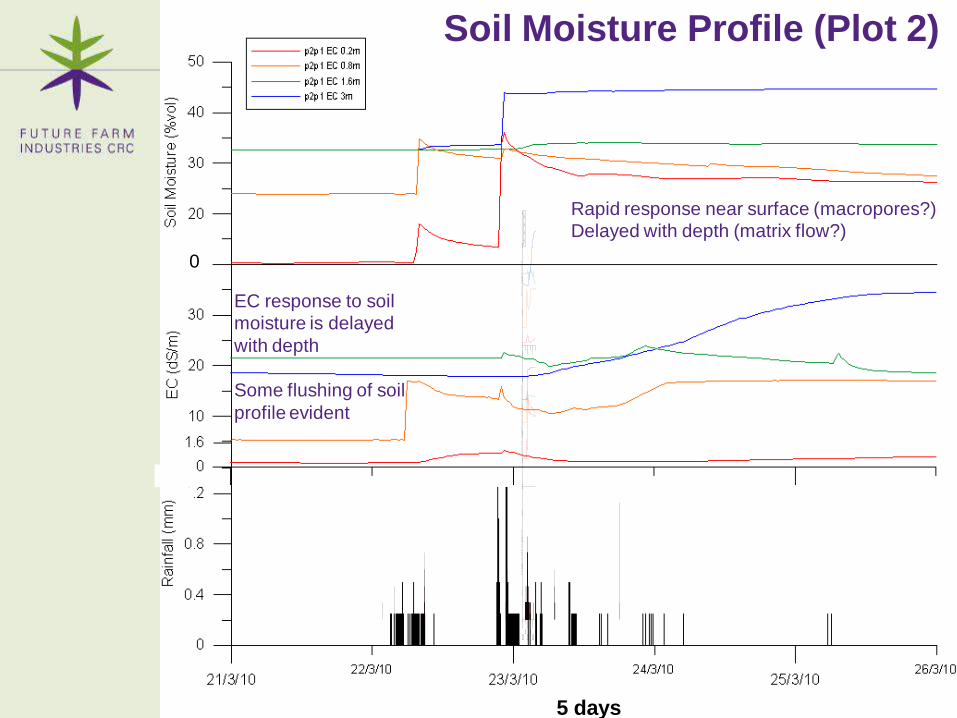
Soil Moisture Profile (Plot 2)
21/3/10 23/3/10 25/3/1022/3/10 24/3/10 26/3/10
0
0.4
0.8
1.2
1.6
2
Rainfall (m
m)
0
10
20
30
40
50
Soil M
oisture (%
vol)
0
10
20
30
40
EC
(dS
/m
)
0.2m
0.8m
1.6m
3m
Rapid response near surface (macropores?)
Delayed with depth (matrix flow?)
EC response to soil
moisture is delayed
with depth
Some flushing of soil
profile evident
0
5 days

Groundwater Levels (Plot 2)
Groundwater responds slowly (matrix flow)
45 days

What is required to achieve 1994 goals?
Downward flushing of salts in the top 4m of the profile
is required to facilitate vegetation regeneration in both
species.
Soil salinities of less than 5 dS/m are required for high
levels of recovery
Top 1.5m required for the Casuarina obesa
New individuals for both species may be able to
tolerate as little as 1.0 m but the Casuarina will
likely out compete the Melaleuca
Top 3-4m required for Melaleuca strobophylla
Long term (20 years) survival is possible between 15
and 20 dS/m for both species
Rainfall or lake filling, which is better for soil flushing?

Newest evidence of further root zone salinisation under all various climate change
scenarios – 100 years.
Climate_chagne_wetting_
100 yrs
-1000
-800
-600
-400
-200
0
0.0 0.5 1.0 1.5 2.0
Conc [mmol/c m3]
Climate_change_business
as usual_100yrs
-1000
-800
-600
-400
-200
0
0 0.5 1 1.5 2
Conc [mmol/c m3]
-1000
-800
-600
-400
-200
0
0 0.5 1 1.5 2
Conc [mmol/c m3]
Climate_change_drying_100yrsStationary climate
Climate drying Climate wetting
Hydrus 1D modelling
Rainfall alone wont flush the unsaturated
zone. Any salt flushed is reconcentrated
again rapidly by capillary effects and
transpiration
Filling events with deep groundwater can
flush the top 4m in as little as ~ 300 days
However given the possible depth to
groundwater, the relationship between filling
event magnitude (lake level) and depth to
groundwater is crucial for management.
0
10
20
30
40
50
60
0 0.5 1 1.5 2
Surface pressure head (m)
Tim
e (d
ays)
.
<4 m
4 m
5 m
6 m
7 m
8 m
Depth to
groundwater
-1000
-800
-600
-400
-200
0
0.3 0.4 0.5 0.6 0.7 0.8 0.9 1.0 1.1
Conc [mmol/c m3]
Profile Information: Concentration
-1000
-800
-600
-400
-200
0
0.3 0.4 0.5 0.6 0.7 0.8 0.9 1 1.1
Conc [mmol/c m3]
-1000
-800
-600
-400
-200
0
0.3 0.4 0.5 0.6 0.7 0.8 0.9 1.0 1.1
Conc [mmol/cm3]
T0
T1
T2
T3
T4
T5
T6
T7
T8
T9
T10
T11
T12
T13
T14
T15
T16
T17
T18
T19
T20
Profile Information: Concentration
-1000
-800
-600
-400
-200
0
0.0 0.2 0.4 0.6 0.8 1.0 1.2 1.4
Conc [mmol/c m3]
-1000
-800
-600
-400
-200
0
0.0 0.2 0.4 0.6 0.8 1.0 1.2 1.4 1.6
Conc [mmol/c m3]
Lake filling under free drainageRelationship between water table depth
Lake level and time
Soil flushing by rainfall
Time step 20 days
Images courtesy of Rachel Taplin
Time step 5 years

Early intervention by the recovery team in the 1990’s has been
crucial for Toolibin Lake protection
Preliminary hydrological targets have stabilsed the vegetation
condition but are insufficient to achieve the 1994 Recovery Plan
goals
To achieve recovery goals a much greater level of flushing is
required than can be achieved through rainfall alone, even with a
return to higher rainfall (unlikely)
However existing groundwater criteria will help Casuarina but not
Melaleuca
Inflow events need to be carefully managed in combination with
groundwater levels or they could actually make the situation
worse. An artificial discharge system is crucial for this
A high resolution multidisciplinary approach has been required to
understand the response of the system to active management
and for proposing new hydrological targets to meet recovery
goals
The next iteration of the Recovery Plan is underway
Conclusions

Thank you for listening any questions?

Climate – Long term trend
Wickepin (010654) Rainfall. Anuual, Winter and Summer Totals
0
100
200
300
400
500
600
700
1900 1920 1940 1960 1980 2000 2020
Year
Ra
infa
ll(m
m)
Annual
Winter
Summer
20 per. Mov. Avg. (Winter)
20 per. Mov. Avg. (Annual)
20 per. Mov. Avg. (Summer)

Event Volumes
0
500
1000
1500
2000
2500
3000
Ju
l-8
1
Ju
l-8
2
Ju
l-8
3
Ju
l-8
4
Ju
l-8
5
Ju
l-8
6
Ju
l-8
7
Ju
l-8
8
Ju
l-8
9
Ju
l-9
0
Ju
l-9
1
Ju
l-9
2
Ju
l-9
3
Ju
l-9
4
Ju
l-9
5
Ju
l-9
6
Ju
l-9
7
Ju
l-9
8
Ju
l-9
9
Ju
l-0
0
Ju
l-0
1
Ju
l-0
2
Ju
l-0
3
Ju
l-0
4
Ju
l-0
5
Ju
l-0
6
Ju
l-0
7
Ju
l-0
8
Vo
lum
e (
ML
)
0
500
1000
1500
2000
2500
3000
Sa
lt L
oa
d (
t)
Total Volume (ML)
Divertable Volume (ML)
Salt Load of Divertable Volume (t)