tools & maps // espon tia tool 2020-2022
TRANSCRIPT

>
TOOLS & MAPS //
ESPON TIA Tool 2020-2022 Draft Final Report // June 2021

This Tools & Maps activity is conducted within the framework of the ESPON 2020 Cooperation
Programme, partly financed by the European Regional Development Fund.
The ESPON EGTC is the Single Beneficiary of the ESPON 2020 Cooperation Programme. The
Single Operation within the programme is implemented by the ESPON EGTC and co-financed by
the European Regional Development Fund, the EU Member States, the United Kingdom and the
Partner States, Iceland, Liechtenstein, Norway and Switzerland.
This delivery does not necessarily reflect the opinions of members of the ESPON 2020 Monitoring
Committee.
Authors
Erich Dallhammer, Bernd Schuh; Roland Gaugitsch, Chien-Hui Hsiung: ÖIR GmbH (Austria)
Sergio Muñoz Gómez, Rubén Navarro: Laurentia Technologies (Spain)
Advisory group
Eleftherios Stavropoulos: DG Regio
Igor Caldeira: CoR
Marjan van Herwijnen, Zintis Hermansons: ESPON EGTC
Information on ESPON and its projects can be found at www.espon.eu.
The website provides the possibility to download and examine the most recent documents
produced by finalised and ongoing ESPON projects.
© ESPON, 2021
Layout and graphic design by BGRAPHIC, Denmark
Printing, reproduction or quotation is authorised provided the source is acknowledged and a copy
is forwarded to the ESPON EGTC in Luxembourg.
Contact: [email protected]

TOOLS & MAPS //
ESPON TIA Tool 2020-2022 Draft Final Report // June 2021
Disclaimer
This document is a draft report.
The information contained herein is subject to change and does not
commit the ESPON EGTC and the countries participating in the
ESPON 2020 Cooperation Programme.
The final version of the report will be published as soon as approved.
TOOLS & MAPS // ESPON TIA Tool 2020-2022
4 ESPON // espon.eu
Table of contents
Abbreviations ...................................................................................................................................... 6
1 Context of the report.......................................................................................................... 7
2 Updates of the Tool implemented .................................................................................... 8
2.1 Update to NUTS 2021 ................................................................................................................. 8
2.2 Update to FUA 2020 ................................................................................................................... 8
2.3 Supplementary tools for composite indicators and indicator preparation .................................... 8
2.3.1 Composite indicators .................................................................................................................. 8
2.3.2 Indicator preparation ................................................................................................................. 10
2.4 Changes to the tools interface .................................................................................................. 10
2.5 Updated version of the guidance documents for moderators .................................................... 11
2.6 Final version of the guidance documents for administrators ..................................................... 11
3 Updated datasets, typologies and NUTS 2021 version integrated in the TIA tool ..... 12
3.1 General datasets of the TIA tool ............................................................................................... 12
3.2 Dataset of the sub-tool for the Urban TIA ................................................................................. 17
3.3 Datasets of the sub-tool for the Cross-Border TIA .................................................................... 19
3.4 Typologies included in the TIA Tool .......................................................................................... 19
4 Workshops and trainings conducted ............................................................................. 24
4.1 Workshops conducted .............................................................................................................. 24
4.2 Trainings conducted .................................................................................................................. 24
5 Further developments ..................................................................................................... 26
5.1 Ongoing developments ............................................................................................................. 26
5.1.1 Fuzzy typologies ....................................................................................................................... 26
5.1.2 Composite indicators ................................................................................................................ 27
5.2 Proposed future devlopments ................................................................................................... 28
5.2.1 Cross-Border-Portal .................................................................................................................. 28
5.2.2 Concept for an Outermost Regions portal ................................................................................. 29
Annex [separately] ............................................................................................................................ 30
A.1 Draft version of the updated part of the guidance document for moderators
A.2 Draft version of the updated part of the guidance document for administrator module

TOOLS & MAPS // ESPON TIA Tool 2020-2022
ESPON // espon.eu 5
List of tables
Table 2.1: NUTS changes 2013 – 2016 – 2021 ............................................................................................ 8
Table 3.1: Updated datasets in the TIA Tool ............................................................................................... 12
Table 3.2: Potentially outdated datasets ..................................................................................................... 15
Table 3.3: Dataset integrated in the sub-tool for the Urban TIA .................................................................. 17
Table 3.4: Indicators from ESPON FUORE not included in the Urban TIA database ................................. 19
Table 3.5: Dataset currently integrated in the sub-tool for the Cross-Border TIA ........................................ 19
Table 3.6: Typologies included in the TIA Tool ........................................................................................... 20
Table 3.7: Additional Fuzzy typologies (Corine) .......................................................................................... 23
Table 4.1: Workshops conducted ................................................................................................................ 24
Table 4.2: Trainings conducted ................................................................................................................... 24
Table 5.1: Developed composite indicators ................................................................................................ 28

TOOLS & MAPS // ESPON TIA Tool 2020-2022
6 ESPON // espon.eu
Abbreviations
CB Cross Border
CoR Committee of the Regions
D Deliverable
DG REGIO Directorate General for Regional and Urban Policy
DG AGRI Directorate General for Agriculture and Rural Development
EC European Commission
EEA European Environmental Agency
ESPON European Territorial Observatory Network
EU European Union
EUROSTAT European Statistical Office
FADN Farm Accountancy Data Network
FUA Functional urban area
GAINS Greenhouse gas – Air pollution Interactions and Synergies
GDP Gross Domestic Product
GVA Gross Value Added
IA Impact Assessment
JRC Joint Research Centre
LUISA Land-Use based Integrated Sustainability Assessment modelling platform
NO2 Nitrogen dioxide
NUTS Nomenclature des unités territoriales statistiques (Nomenclature of Territorial Units for Statistics)
PM Particulate Matter
RoS Request of Service
SBS Structural Business Statistics
TIA Territorial Impact Assessment
UAA Utilised Agricultural Area
UK United Kingdom

TOOLS & MAPS // ESPON TIA Tool 2020-2022
ESPON // espon.eu 7
1 Context of the report
The current report is produced in the context of ongoing work on the ESPON TIA Webtool implementing the
TIA Quick Check methodology. The Quick Check methodology originates in the ESPON ARTS project and
aims at supporting policymakers in assessing the potential territorial impacts of legislations, policies and
directives (LPDs) ex-ante in order to improve their design in the drafting stage. The user-friendly approach
of the methodology combining quantitative data on regional sensitivity with expert judgement (gathered in a
workshop setting) on the type and strength of policy impacts (combination of “regional sensitivity” and “ex-
posure” in the vulnerability concept) allows for an uncomplicated first assessment of a policies territorial
effects in a short timeframe. To better support the practical application and to increase the user friendliness,
the Quick Check methodology has been embedded in a Webtool which allows for calculation of territorial
impact values and presents the results in impact maps as a basis for expert discussion.
The webtool has been upgraded considerably from its early stages to its current state, offering a number of
customisation methods, the possibility to upload user-generated data and dedicated portals for cross-border
assessments and urban assessments. Furthermore, new methodological elements such as enabling Fuzzy
typologies, integrating comparative indicators as well as an aggregation function have been implemented.
Numerous upgrades have been based on user requests and were tested in actual TIA workshops on their
practicability. The tool thus always was developed in close consultation with the final applicants and the
policy makers putting the results to use.
The current project follows a similar logic, with some upgrades being done to the tool as a default, some
upgrades being developed based on user requests, and all elements being tested in actual workshops which
are part of the project. Upgrades implemented in the context of the project are
▪ Updating all datasets and typologies currently included in the tool to their latest version
▪ Updating the NUTS and FUA versions used to the most recent ones
▪ Implementing updates to make the tool more user-friendly in terms of preparation and application
▪ Implementing additional indicator types (composite indicators) and fuzzy typologies
▪ Updating of all guidance material
▪ Developing concepts for future methodological updates
The draft final report outlines the work done so far in terms of technical upgrades to the tool, workshops
conducted in the context of the projects as well as an outlook on the work towards finalisation of the project.

TOOLS & MAPS // ESPON TIA Tool 2020-2022
8 ESPON // espon.eu
2 Updates of the Tool implemented
2.1 Update to NUTS 2021
As the old tool used NUTS 2013 classification, which was already is outdated, database and shapefiles of
the tool have been updated to the most recent version. Eurostat has published the NUTS 2021 shapefiles
and relevant correspondence tables, in 2020 already, and deliveries to Eurostat from 2021 onwards have to
follow the NUTS 2021 nomenclature. This is therefore the most “future proof” solution and it was decided to
implement it for the tool. It created an issue however with providing data for all regions, as several changes
between the NUTS versions 2013 – 2016 – 2021 have taken place. Table 2.1 depicts the extent of those
changes to the NUTS regions system. In case an indicator that is currently included in the tool is only avail-
able in an older NUTS version and will not be re-delivered in the NUTS 2021 version, the change types
“recoding” and “discontinued” as well as “boundary shift” if the shift is only minor pose no problems when
switching to the NUTS 2021 nomenclature. Change types “New region” and major “boundary shifts” however
led to some recalculations of the underlying datasets.
Table 2.1: NUTS changes 2013 – 2016 – 2021
Change type Number of changes 2013-2016 Number of changes 2016-
2021
Recoded 148 21
Boundary shift 19 14
New region 12 1
discontinued 7 6
Total changes 185 42
Source: Consortium based on Eurostat 2020
The methodological approach for recalculations is described in the indicator section under 3.1.
Ultimately, all existing exposure fields and typologies, as well as all new indicators added to the tool which
were not yet provided in NUTS 2021 version have been recalculated to the NUTS 2021 version. The CB-
portal has been updated as well. The tool now uses exclusively this NUTS version ensuring the maximum
extent of comparability for assessments and allowing for easy and complete future updates without the need
for recalculations for several years to come.
The update to NUTS 2021 also allows to make full use of the new “Tercet” typologies which are already
officially published.
2.2 Update to FUA 2020
The FUA nomenclature was updated to the latest version similar to the NUTS version update. The changes
are not considerable, but FUA nomenclatures are usually updated each year, thus the current version in the
tool might see considerable changes in the future. However, most indicators that are available for FUAs are
project based and not frequently updated thus loose their relevance even if there are no nomenclature up-
dates over time. Nonetheless, updates of the nomenclature have to be implemented with recalculations
where possible in order to minimise those losses. The data available via the Urban Audit is, as described in
section 3.2 is not of sufficient quality to be included in the ESPON TIA Tool. Therefore, updates to the
nomenclature are not as frequently needed to accommodate new indicators published.
All existing exposure fields and new indicators added to the tool have been updated to the latest FUA ver-
sion.
2.3 Supplementary tools for composite indicators and indicator preparation
2.3.1 Composite indicators
Composite indicators were a methodological and technical update requested for the new TIA tool They con-
sist of multiple individual sub-indicators and are designed to reflect results of a certain intervention targeting

TOOLS & MAPS // ESPON TIA Tool 2020-2022
ESPON // espon.eu 9
multiple fields in a combined manner. In the context of the Quick Check methodology, this can be especially
relevant, where no indicator specific enough to accurately reflect a certain policy action is available, however,
a combination of two or more already available yet less specific indicators can overcome this gap.
The composition of such a composite indicator is no trivial task, as consideration has to be given both to the
indicators included as well as to the respective weights applied to each sub-indicator. As the composition
can strongly influence the results of any impact calculation within the webtool, any decision has to be well
reasoned and should be linked both to the specific policy actions which need to be depicted as well as to
the properties of the sub-indicators making up the composite indicator. It is apparent, that the process of
creating such an indicator cannot be done “ad hoc” in the context of a workshop session, but rather has to
take place in advance. To support the process of calculating composite indicators in a first phase of trialling
them in the Quick Check methodology, the project team has developed an excel-tool which allows for an
easy calculation of a composite indicator with up to 5 sub-indicators. The results can be directly uploaded in
the ESPON TIA Tool.
A composite indicator is calculated with the following steps:
Normalising
Calculating the normalised regional value for each sub-indicator by feature scaling1, 2
𝑋𝑟′ =
𝑋𝑟 − 𝑋𝑚𝑖𝑛
𝑋𝑚𝑎𝑥 − 𝑋𝑚𝑖𝑛
𝑋𝑟 ’ normalised value of a region r for sub indicator X
𝑋𝑟 original value of a region r for sub indicator X
𝑋𝑚𝑎𝑥 maximum value of all regions for sub indicator X
𝑋𝑚𝑖𝑛 minimum value of all regions for sub indicator X
Before normalising, the normative direction of the indicator has to be considered, i.e. if high values are
considered “positive” (e.g. in case of GDP) or “negative” (e.g. in case of unemployment rate). If indicators
with different normative directions are used, they have to be adjusted without changing their sensitivity val-
ues. In these cases, all “positive” indicators should be left as they are, while for “negative” indicators all
values should be multiplied by -1 in order to bring them in the correct order.
Weighting
Multiplying each normalised indicator with the assigned weight3
𝑋𝑟" = 𝑋𝑟′ ∗ 𝑤𝑥
𝑋𝑟 ’ normalised value of a region r for sub indicator X
𝑋𝑟” weighted normalised value of a region r for sub indicator X
𝑤𝑥 weight assigned to sub indicator X [0; 1]
The sum of weights w across all indicators in total has to be 1.
1 No transformation to the distribution of data is applied, however, all values across indicators are brought into a compa-
rable range so they can be summed up, usually between 0 and 1
2 Calculating the indicators requires attention to which values are considered „positive“ (high or low ones). E.g. when
calculating a „quality of life“ indicator for a specific region, a high value on employment rates will be positive while a high
value on infant mortaliy will be negative. Reversing this order can be done for the calculations by simply multiplying each
value with -1 before normalising, which will be indicated in the guidance.
3 The weight is applied as a coefficient between 0 and 1, the sum of all weight has to be 1. Weights have to be assigned
by the person creating the indicator based on expert judgement or literature.

TOOLS & MAPS // ESPON TIA Tool 2020-2022
10 ESPON // espon.eu
Adding
Adding up the weighted indicators
𝐶𝑟 = 𝑋𝑟" + 𝑌𝑟" + 𝑍𝑟"
𝐶𝑟 value of a region r for composite indicator C made up of sub-indicators X, Y and Z
𝑋𝑟” weighted normalised value of a region for sub indicator X
𝑌𝑟” weighted normalised value of a region for sub indicator Y
𝑍𝑟” weighted normalised value of a region for sub indicator Z
As is apparent, not only the thematic fit but also the structure and distribution of data behind each individual
indicator has to be carefully considered. Skewed distributions or strong outliers can influence the interpret-
ability of results when combining multiple indicators. The description of calculation as well as the possibilities
and constraints of using composite indicators is added to the moderators guide alongside the Excel tool.
The Excel tool itself allows any user with basic Excel skills to add up to 5 sub-indicators to the sheet, apply
weights to each indicator and automatically create a composite indicator. The output is an excelsheet co-
herent with the upload template and allows for direct uploading into the tool.
The application of composite indicators was furthermore trialled within the workshops conducted. In each
workshop, one composite indicator was designed in the preparation phase and introduced to the participants.
Ultimately, two out of the three composite indicators designed were taken up. The experience from the
workshops showed, that participants had no methodological objections and did also not question the com-
position. The reason for rejecting one of the indicators was simply due to it being considered not close
enough to the relevant effect the experts wanted to depict.
The trial run in the three application cases can thus be considered successful and the practice of including
composite indicators in TIA workshops will be continued. The experience made by the project team regarding
the practical application is reflected in the moderators guide as well.
2.3.2 Indicator preparation
In the previous version of the tool, NUTS 2013 was the standard nomenclature implemented. This version
was at the time widely used by statistics providers on EU and on national level, by funding programmes etc.,
and thus allowed the user to easily upload their own datasets. The now implemented NUTS 2021 version is
not yet in widespread use and will take some time to be picked up universally. To assist the users in the
meantime with preparing their datasets for uploading them into the tool without individually checking e.g. the
correspondence tables published by Eurostat4, the project team developed an easy to use excel tool for
transforming data between the different NUTS versions. It covers NUTS 2010 to NUTS 2021, allows to insert
data in any given NUTS version and produces as an output the indicator upload sheet.
The easy-to-use nature of the tool however allows only for transformations in case of recodings or minor
boundary changes. Any regions which were split, merged or subject to major boundary changes cannot be
transformed with such a tool and will subsequently be included in the database as regions with “no data”.
2.4 Changes to the tools interface
The tools interface itself remained unchanged apart from the new shapefiles used implementing the
NUTS2021 and FUA 2020 nomenclature. For both users and moderators, there is no visual difference. On
the welcome page, explicit references to the Urban- and Cross-Border subtools have been made in order to
draw the users attention to those otherwise potentially overlooked functionalities.
4 https://ec.europa.eu/eurostat/web/nuts/history

TOOLS & MAPS // ESPON TIA Tool 2020-2022
ESPON // espon.eu 11
2.5 Updated version of the guidance documents for moderators
The moderators guide has received updates regarding the indicators added to the tool and the associated
voting cards and indicator postcards. Furthermore, guidance on composite indicator calculation has been
added to the report which explains the functionality of the provided excel-tool for their calculation as well.
Additional guidance has been added related to the preparation and implementation of online-workshops
which have become a frequent occurrence over the course of 2020. No updates regarding functionalities of
the tool were necessary so far.
2.6 Final version of the guidance documents for administrators
The administrators guidance has been updated to the latest format. The updates have been minor however,
as all updated functionalities have been implemented seamlessly with the existing administrators tool. Ad-
ministrators thus require no additional training if they already were familiar with the module.

TOOLS & MAPS // ESPON TIA Tool 2020-2022
12 ESPON // espon.eu
3 Updated datasets, typologies and NUTS 2021 version integrated in the TIA tool
3.1 General datasets of the TIA tool
The 85 standard indicators from the current version of the TIA tool have been reviewed by the project team
in terms of availability of updates and their completeness. As it was agreed with the Steering Group the
NUTS 2021 version was implemented instead of the NUTS 2016 version, better future-proofing the tool. As
of 1.1.2021 the NUTS 2021 version is the compulsory standard for delivering data to Eurostat, thus it is
expected that this allows for easier updates in the future as other institutions take it up as well.
The dataset of the general TIA tool now contains 85standard indicators which are listed in Table 3.1 as is
visible, no indicators were yet directly available in the NUTS 2021 version, with some even dating back to
the NUTS2006 version. The project team thus recalculated all indicators to NUTS 2021 version by means
of a script in the programming language R. When converting data into another NUTS version, there are
several change types to be considered. A list of these changes is provided by Eurostat5 and is the basis for
the recalculation. In case of boundary changes between regions, the data is assigned to the equivalents as
stated in the aforementioned list. In case of splits or mergings of regions and an indicator with absolute
values, the data is weighted and distributed based on the population data (at the moment, an update will
follow later on) of the respective (split or merged) regions. In case of mergings of regions in an indicator with
relative values, the population weighted average is used to determine the value for the merged region. In
the final delivery of the project, this recalculation method will be refined and for some indicators where this
is relevant, i.e. the area of the region will be used as recalculation proxy instead of the population. In case
of splits of regions an indicator with relative values, the same value as for the “parent” region is assigned to
both new regions. In most cases however, the data doesn’t have to be recalculated and can be directly
assigned to the region in the latest NUTS version, as in most cases only the NUTS code or NUTS name has
been changed or there have not been any changes at all.
Table 3.1: Updated datasets in the TIA Tool
Thematic Field Exposure Field Year of data
implemented
NUTS
version
Accessibility Potential accessibility by road 2014 2013
Accessibility Potential accessibility by rail 2014 2013
Accessibility Potential accessibility by air 2014 2013
Accessibility Potential accessibility multimodal 2014 2013
Demography Population density 2018 2016
Demography Economically active population per km2 2019 2016
Demography Old age dependency ratio 2019 2016
Demography Young age dependency ratio 2019 2016
Demography Average age of population 2019 2016
Demography Net migration 2019 2016
Education and Skills Educational attainment of 30-34 year olds, primary educa-
tion (levels 0-2)
2019 2016
Education and Skills Educational attainment of 30-34 year olds, secondary ed-
ucation (levels 3-4)
2019 2016
5 https://ec.europa.eu/eurostat/en/web/nuts/history

TOOLS & MAPS // ESPON TIA Tool 2020-2022
ESPON // espon.eu 13
Thematic Field Exposure Field Year of data
implemented
NUTS
version
Education and Skills Educational attainment of 30-34 year olds, tertiary educa-
tion (levels 5-8)
2019 2016
Education and Skills Share of young adults in education system 2016-2018 2016
Education and Skills Number of students in tertiary education 2019 2016
Education and Skills Early leavers from education and training 2019 2016
Education and Skills Participation rate in education and training 2019 2013
Education and Skills Quality of public education 2013 2006/10/13
Environment Protected areas (NATURA 2000) 2018 2013
Environment Recreational potential 2020 (projec-
tion)
2013
Environment Land use: Share of heavy environmental impact 2015 2013
Environment Urban population exposed to PM10 concentrations 2020 (projec-
tion)
2016
Environment Emissions of CO2 per capita (tonnes) 2020 (projec-
tion)
2016
Environment Emissions of NOx per capita (kilotonnes) 2020 (projec-
tion)
2016
Environment Water Consumption 2020 (projec-
tion)
2016
Environment Structural Green Infrastructures 2020 (projec-
tion)
2016
Environment Urban wastewater 2010 2010
Environment Municipal waste generated 2013 2010
Environment Exposure to heat waves 1995 2010
Environment Solar energy potential 2012 2013
Environment Wind energy potential 2012 2013
Environment Electricity generated from hard coal and lignite 2015 2013
Environment Electricity generated from renewable sources 2015 2013
Governance Corruption 2021 2013
Governance Quality and accountability of government services 2021 2013
Governance Impartiality of government services 2021 2013
Governance Quality of law enforcement 2013 2006/10/13
Governance Trust in the political system 2013 2013
Governance Trust in the legal system 2013 2013
Governance EAGF & EAFRD: Expenditure in share of GDP avg. 2004-
2008
2006/2010
Governance ERDF & CF Expenditure in Million Euro 2014 2006/2010
Health Life expectancy at birth 2018 2016
Health Total fertility rate 2018 2016
Health Birth rate 2018 2016
Health Quality of the public health care system 2013 2016
Health Health personnel 2017-2018 2016
Health Hospital beds 2017 2016
Infrastructure Regional ICT infrastructure 2019 2016
Infrastructure Regional transport infrastructure: navigable canals 2019 2016
Infrastructure Regional transport infrastructure: navigable rivers 2018 2016
Infrastructure Regional transport infrastructure: motorways 2018 2016

TOOLS & MAPS // ESPON TIA Tool 2020-2022
14 ESPON // espon.eu
Thematic Field Exposure Field Year of data
implemented
NUTS
version
Infrastructure Regional transport infrastructure: total railway lines 2018 2016
Innovation Patent applications/Mio inhabitants 2012 2013
Innovation Employment in technology and knowledge-intensive sec-
tors
2019 2016
Innovation Share of R&D personnel and researchers 2017 2013/2016
Natural Hazards Soil erosion by water 2016 2016
Natural Hazards Capacity of ecosystems to avoid soil erosion 2020 (projec-
tion)
2016
Natural Hazards Soil retention 2020 (projec-
tion)
2016
Natural Hazards Landslide susceptibility 2012 2010
Natural Hazards Sensitivity to floods 2012 2010
Natural Hazards Sensitivity to avalanches 2012 2010
Natural Hazards Probability of forest fire hazard 1997 – 2003 2010
Regional economy Economic performance (GDP/capita) 2018 2016
Regional economy Economic performance (GVA/capita) 2018 2016
Regional economy Ratio between emissions of CO2 and GVA 2020 2013
Regional economy GVA in industry (secondary sector) 2018 2016
Regional economy GDP loss due to cross-border obstacles 2017 2013
Regional economy Entrepreneurship (share of private enterprises) 2019 2016
Regional economy Total overnight stays per thousand inhabitants 2019 2016
Regional economy Employment in agriculture, forestry and fishing 2019 2016
Regional economy Employment in industry and construction 2018 2016
Regional economy Employment in services 2018 2016
Regional economy Employment in industry 2018 2016
Regional economy Share of full-time employments 2019 2016
Regional economy Share of part-time employments 2019 2016
Regional economy Female employment ratio 2019 2016
Social disparities Gender balance employment avg. 2017-19 2016
Social disparities Unemployment rate 2019 2016
Social disparities Disposable Income 2018 2016
Social disparities People at risk of poverty or social exclusion 2019 2016
Societal wellbeing Crimes recorded by the police 2010 2013
Societal wellbeing Housing: Number of rooms per person 2014 2013
Societal wellbeing Perceived social network support 2014 2013
Societal wellbeing Self-evaluation of life satisfaction 2014 2013
Source: Consortium (2021)
The project team revisited each indicator included in the tool and considered its necessity. Especially for
indicators older than 5 years it has to be considered if they are still relevant. Table 3.2 presents the results
of the assessment conducted.

TOOLS & MAPS // ESPON TIA Tool 2020-2022
ESPON // espon.eu 15
Table 3.2: Potentially outdated datasets
Thematic
Field
Exposure Field Year Assessment/proposal
Accessibil-
ity
Potential accessibility by
road
2014 Population development and major infrastructure projects
can distort the regional values to some extent. It is how-
ever the most comprehensive dataset of this kind availa-
ble for the EU which also applies the same methodology
to different modes of transport. This allows for compara-
bility between transport modes. The dataset is also fre-
quently used, thus it is proposed to keep it in the data-
base.
Potential accessibility by
rail
2014
Potential accessibility by
air
2014
Potential accessibility mul-
timodal
2014
Environ-
ment
Land cover: Share of agri-
cultural areas
2015 There is no significant change in agricultural areas in re-
lation to the size of a NUTS3 region. It is proposed to
keep the dataset in the database.
Land use: Share of agricul-
ture
2015 There is no significant change in agricultural areas in re-
lation to the size of a NUTS3 region. It is proposed to
keep the dataset in the database.
Land cover: Share of
Woodland, Shrubland and
Wetland
2015 There is no significant change in woodland, shrubland
and wetland areas in relation to the size of a NUTS3 re-
gion. It is proposed to keep the dataset in the database.
Relative size of built-up ar-
eas
2012 The indicator is somewhat outdated, and increase in con-
struction in the past 9 years can make a considerable dif-
ference for some regions (in particular urban ones). As
with the Corine Land Cover, a 2018 value for such an in-
dicator can be calculated, it is proposed to remove the
dataset from the database and replace it with the new in-
dicator based on CLC.
Land use: Share of heavy
environmental impact
2015 While some changes for the indicator values might have
been occurring in the past 6 years, there is no further up-
dated one available. The indicator is valuable and has
been used in several workshops in the past, thus it is
proposed to keep the dataset in the database.
Land cover: Share of Wa-
ter areas
2015 There is no significant change in water areas in relation
to the size of a NUTS3 region. It is proposed to keep the
dataset in the database.
Urban wastewater 2010 The indicator is somewhat outdated, but is the only indi-
cator available in this geographic resolution. It is thus
proposed to keep the dataset in the database.
Municipal waste generated 2013 The indicator is somewhat outdated in the light of in-
crease of circular economy practices, increased recycling
rates etc. It is however the only indicator available in this
geographic resolution, more recent indicators only cover-
ing N0 levels. It is thus proposed to keep the dataset in
the database.
Days over 30°C 1995 The indicator is considerably outdated and no update
seems to be available for the NUTS3 level. It is however
the only one collecting this kind of data. The indicator col-
lecting a comparable information which is also up to date
is “Heating degree days” from ESTAT, however is harder
to understand for workshop participants. It is proposed to
exchange those indicators.
Solar energy potential 2012 While the indicator is in need of an update (pointed out in
the inception report explicitly), it is still the best one avail-
able of its kind in Europe. It is also used on several occa-
sions in workshops, thus it is proposed to keep it in the
database.

TOOLS & MAPS // ESPON TIA Tool 2020-2022
16 ESPON // espon.eu
Thematic
Field
Exposure Field Year Assessment/proposal
Wind energy potential 2012 While the indicator is in need of an update (pointed out in
the inception report explicitly), it is still the best one avail-
able of its kind in Europe. It is also used on several occa-
sions in workshops, thus it is proposed to keep it in the
database.
Govern-
ance
Trust in the political system 2013 The indicator suffers from both the geographical level
(NUTS 2) and the fact that it is outdated. It is however
frequently used and covers a very important aspect (gov-
ernance) which is not covered by numerous indicators.
While an update also in terms of geographical resolution
would be necessary, it is proposed to keep it in the data-
base.
Trust in the legal system 2013
EAGF & EAFRD: Expendi-
ture in share of GDP
avg.
2004-
2008
The indicator is outdated and likely not to be used in fu-
ture analyses. There is no publicly available database for
the 2014-20 period available however. It is proposed to
remove it from the standard indicators.
ERDF & CF Expenditure in
million Euros
2014 The indicator is based on 2014 data, however those are
€ budgeted which are spent in the years 2014-2023. The
indicator is thus considered still relevant and should be
kept in the database.
Innovation Patent applications/mio in-
habitants
2012 The indicator is outdated and also discontinued. How-
ever, the project team has received access to OECD
data with much better thematical and geographical cover-
age. The project team is in the process of verifying if the
data can be publicised through the TIA tool. In the mean-
time it is proposed to keep the dataset in the database.
Natural
Hazards
Landslide susceptibility 2012 Due to the calculation method and the broad and qualita-
tive approach there Is likely no significant change in the
situation today compared to 2012. Potentially the indica-
tor can be updated/exchanged pending the results of the
ESPON TITAN project, which will be reviewed once
available. In the meantime it is proposed to keep the da-
taset in the database.
Sensitivity to floods 2012 In the context of climate change, there is potential for sig-
nificant changes in the last 10 years regarding those indi-
cators. They are in need of updating, however the con-
crete ones are not likely to be updated. Potentially the
ESPON TITAN project will provide similar indicators
which can replace the existing ones. They will be re-
viewed once available, in the meantime it is proposed to
keep the dataset in the database.
Sensitivity to avalanches 2012 In the context of climate change, there is potential for sig-
nificant changes in the last 10 years regarding those indi-
cators. They are in need of updating, however the con-
crete ones are not likely to be updated, and the ESPON
TITAN project will not include any indicator on ava-
lanches. Nevertheless it is proposed to keep the dataset
in the database.
Probability of forest fire
hazard
1997-
2003
The indicator is outdated and in the context of land use
changes and increased risk of droughts and fire hazard is
in urgent need of updating. Unfortunately no more recent
indicator is available. The results of ESPON TITAN re-
garding droughts will be reviewed, however it is unlikely
that there will be a comparable indicator resulting. As the
indicator has been used in the past though, and as the
calculation is broad and qualitative, it is proposed to keep
the dataset in the database.
TOOLS & MAPS // ESPON TIA Tool 2020-2022
ESPON // espon.eu 17
Thematic
Field
Exposure Field Year Assessment/proposal
Societal
wellbeing
Crimes recorded by the
police
2010 The indicator is somewhat outdated, but is the only indi-
cator available in this geographic resolution. It is thus
proposed to keep the dataset in the database.
Housing: Number of rooms
per person
2014 The indicator concerns an aspect that does not change
quickly, but rather shows slow changes over time. A
timeframe of 7 years is thus not particularly problematic
and still reflects the situation today in most regions. It is
thus proposed to keep the dataset in the database.
Perceived social network
support
2014 As the indicator is survey based and not frequently up-
dated, it is problematic to replace with a comparable one.
The broad qualitative approach and assessment method-
ology means that only major imbalanced changes would
cause an issue when trying to capture todays situation.
However, there have been considerable disruptions in
peoples social networks and physical/virtual contact with
other people in the context of the Covid-19 pandemic. It
is thus proposed to keep the dataset in the database,
however still review common sources for an updated in-
dicator.
Self-evaluation of life satis-
faction
2014 The Covid-19 pandemic has caused a major disturbance
in many peoples lives in terms of most aspects relevant
for life satisfaction, be it leisure, work, private or profes-
sional life. The indicator thus certainly does not reflect
the situation in the regions today, however no updated
one has been published so far. It is proposed to keep the
indicator in the database, however reflect on the timing
when using it within a workshop setting.
Source: Consortium (2021)
Most indicators used are either not completely outdated (e.g. within 5 years some indicators will not show
that much change, thus can still be used and considered to reflect the current situation of the regions) or are
of high thematic relevance because they have been used in several workshops, or because they cover fields
which cannot otherwise be covered by proxies. In particular Governance but also Society related indicators
suffer from slow updates (e.g. due to infrequent surveys which are the basis of multiple of those indicators),
however not a large amount of indicators is available for those fields in the first place. Therefore in many
cases, the decision was made to keep them in the database.
3.2 Dataset of the sub-tool for the Urban TIA
For the Urban TIA tool based on Functional Urban Areas, the exposure fields have been updated to the
extent possible, unfortunately many of them are project based and have not received an update so far. A
number of highly specialised datasets is available at this level, which oftentimes are only collected in relation
to specific projects. In order to keep the Urban TIA tool functioning and relevant, some more leeway was
given regarding the up-to-dateness of the datasets. Generally, most datasets are however available for 2014
or later, thus not considerably outdated at this point in time. Table 3.3 shows the 31 standard indicators for
FUA which were integrated into the TIA tool in the latest version
Table 3.3: Dataset integrated in the sub-tool for the Urban TIA
Thematic Field Exposure Field Year available
in tool
Accessibility Potential accessibility by transport infrastructure 2020 (projection)
Average travel distances 2010
Demography Population density 2020 (projection)
Population weighted density 2020 (projection)
Old age dependency ratio 2018

TOOLS & MAPS // ESPON TIA Tool 2020-2022
18 ESPON // espon.eu
Thematic Field Exposure Field Year available
in tool
Young age dependency ratio 2018
Urbanisation level 2010-2030
Net migration 2014
Economy Economic performance (GDP/capita) 2014
Economic performance (GVA/capita)* 2014
Education and
Skills
Educational attainment of 30-34-year olds, primary education 2015
Educational attainment of 30-34-year olds, secondary education 2015
Educational attainment of 30-34-year olds, tertiary education 2015
Participation rate in education and training 2015
Early leavers from education and training 2015
Environment Recreational areas 2020 (projection)
Concentration of PM10 2020 (projection)
Concentration of NO2 2020 (projection)
Removal capacity of PM10 2020 (projection)
Removal capacity of NO2 2020 (projection)
Health Crude birth rate 2018
Infrastructure Urban form efficiency 2011
Length of local roads per inhabitant 2014
Road safety 2014
Land use and
conservation
Share of green infrastructure 2020 (projection)
Hectare of green infrastructure per capita 2020 (projection)
Built-up areas per inhabitant 2011
Annual land take per inhabitant 2010-2030
Innovation Share of R&D personnel and researchers 2015
Natural Hazards Urban Flood Risk 2020 (projection)
Social dispari-
ties
Unemployment rate 2018
Source: Consortium (2021)
Apart from updates of existing datasets, the main additions to the data are made based on the ESPON
FUORE project which calculated a number of indicators. The datasets collected for the urban audit have
been screened as well. It was revealed however that none provides a consistent coverage of a sufficient
number of FUAs to fit the requirements of the TIA tool for comparative assessments. Systematically, large
parts of the EU are missing data (e.g. Germany, Hungary, parts of Poland) for almost all indicators. Further-
more, a number of highly specific indicators seems to be only provided by a few member states. It was thus
concluded by the project team, that the Urban Audit provides no source for standard datasets to be included
in the tool. It could, however, become a relevant source for some geographically limited assessments, in
which case the indicators can be added to the tool by the user. Those are in particular indicators relating to
population structure, living conditions, household structures, urban transport. labour market etc.
Further indicators which were proposed to be integrated in the initial phase of the project were dropped upon
review in the indicator collection phase. Those are listed in Table 3.4 including the reason for dropping them
from the selection.

TOOLS & MAPS // ESPON TIA Tool 2020-2022
ESPON // espon.eu 19
Table 3.4: Indicators from ESPON FUORE not included in the Urban TIA database
Thematic Field Indicator Reason
Innovation Patent applications/mio inhabitants Download of the dataset not possible
Social dispari-
ties
People at risk of poverty or social exclusion Too many unplausible values
Disposable income of private households Too many unplausible values
Gender balance employment values for (male/female) employment rate not
correct → all values are smaller than 0
Source: Consortium
3.3 Datasets of the sub-tool for the Cross-Border TIA
The core element of the Cross-Border-TIA module are the comparative indicators the project team calculated
as a basis for standard indicators. Other than stock indicators provided e.g. by Eurostat, these have to be
specifically calculated and require an in-depth understanding of the methodology. Their actual application is
strongly connected to the individual approaches of a concrete CB TIA, thus only a small set of standard
indicators was calculated (see Table 3.5) which are updated to the latest available data and the NUTS 2021
version. In most cases, indicators connected to a concrete LPDs effect however have to be calculated for
the respective workshop and the specific topic in question, as also the type of indicator (CB Product, differ-
ence, lower or higher) depends on the questions to be answered by the TIA.
Table 3.5: Dataset currently integrated in the sub-tool for the Cross-Border TIA
Thematic Field Exposure Field Year available
in tool
NUTS
Version
Accessibility CB lower: Potential accessibility multimodal 2014 2013
Environment CB product: Protected areas (NATURA 2000) 2018 2013
Governance CB lower: Quality and accountability of government ser-
vices
2017 2016
CB difference: Quality and accountability of government
services
2017 2016
Health CB difference: Hospital beds 2018 2016
Regional econ-
omy
GDP loss due to cross-border obstacles 2017 2013
Source: Consortium (2021)
So far, no specific cross-border workshop has been requested and conducted in the current project, thus no
additional CB-indicators have been calculated which can be checked for their applicability as standard indi-
cators.
The currently ongoing study Providing Public Transport in Cross-border Regions — Mapping of Existing
Services and related Legal Obstacles is expected to potentially provide additional indicators relating to the
accessibility of CB-regions. The study is in its final phase, however it is uncertain it results are available
before closing of the project at hand. The project team thus has established contact with DG REGIO regard-
ing access to the data provided by the study potentially ahead of publication. If the datasets can be received
in time they will be checked on their potential to calculate an indicator relating to public transport accessibility
for CB regions. This could significantly improve the exposure fields currently available and also likely can be
included as a standard indicator in the tool.
3.4 Typologies included in the TIA Tool
All typologies in the tool currently have been updated to the NUTS 2021 version. There are no issues linked
to region changes for those typologies, as all regions e.g. in case of splits or new regions could be clearly
assigned to the existing typologies. For fuzzy typologies, the same methodology as for recalculating expo-
sure fields has been applied. Table 3.6 presents the list of typologies and sources included in the TIA tool.
TOOLS & MAPS // ESPON TIA Tool 2020-2022
20 ESPON // espon.eu
Table 3.6: Typologies included in the TIA Tool
Typology Description Source
Predominantly ur-
ban
The typology is applied to NUTS level 3 regions of the European Un-
ion (EU) to Statistical Regions level 3 of the EFTA and Candidate
countries; A similar typology is applied by the OECD to Territorial
Level 3 (TL3) regions of its member countries. It is a based on the
share of the regional population living in rural grid cells (in other
words the rural population) and urban clusters. Based on the share
of the rural population the regions are then classified into the follow-
ing three groups: predominantly urban region: the rural population
accounts for less than 20 % of the total population
Eurostat, 2021
Intermediate The typology is applied to NUTS level 3 regions of the European Un-
ion (EU) to Statistical Regions level 3 of the EFTA and Candidate
countries; A similar typology is applied by the OECD to Territorial
Level 3 (TL3) regions of its member countries. It is a based on the
share of the regional population living in rural grid cells (in other
words the rural population) and urban clusters. Based on the share
of the rural population the regions are then classified into the follow-
ing three groups: intermediate region: the rural population accounts
for a share between 20 % and 50 % of the total population
Eurostat, 2021
Predominantly ru-
ral
The typology is applied to NUTS level 3 regions of the European Un-
ion (EU) to Statistical Regions level 3 of the EFTA and Candidate
countries; A similar typology is applied by the OECD to Territorial
Level 3 (TL3) regions of its member countries. It is a based on the
share of the regional population living in rural grid cells (in other
words the rural population) and urban clusters. Based on the share
of the rural population the regions are then classified into the follow-
ing three groups. predominantly rural region: the rural population ac-
counts for 50 % or more of the total population.
Eurostat, 2021
Metropolitan re-
gion
The NUTS-3-based typology of metro regions contains groupings of
NUTS-3 regions used as approximations of the main metropolitan
areas. No exact information on the space that has been classified
seems to be given.
Eurostat, 2021
Coastal regions Typology of regions which have a sea border and where more than
50% of the population live within 50km of the seashore
Eurostat, 2021
Island region A typology of NUTS3 regions entirely composed of islands Eurostat, 2021
Mountain region A typology of NUTS3 regions based on mountain areas (areas de-
fined in the DG REGIO study on mountain areas)
DG Regio, 2016;
updated by Euro-
stat in 2021
> 50 % of popula-
tion live in moun-
tain areas
A typology of NUTS3 regions based on mountain areas (areas de-
fined in the DG REGIO study on mountain areas)
DG Regio, 2016;
updated by Euro-
stat in 2021
> 50 % of surface
are in mountain
areas
A typology of NUTS3 regions based on mountain areas (areas de-
fined in the DG REGIO study on mountain areas)
DG Regio, 2016;
updated by Euro-
stat in 2021
> 50 % of popula-
tion and 50 % of
surface are in
mountain areas
A typology of NUTS3 regions based on mountain areas (areas de-
fined in the DG REGIO study on mountain areas)
DG Regio, 2016;
updated by Euro-
stat in 2021
Major island <
50,000 inhabit-
ants
A typology of NUTS3 regions entirely composed of islands DG Regio, 2016
Major island be-
tween 50,000
and 100,000 inh.
A typology of NUTS3 regions entirely composed of islands DG Regio, 2016

TOOLS & MAPS // ESPON TIA Tool 2020-2022
ESPON // espon.eu 21
Typology Description Source
Major island be-
tween 100,000
and 250,000 inh.
A typology of NUTS3 regions entirely composed of islands DG Regio, 2016
Island with
250,000 – 1 mil-
lion inhabitants
A typology of NUTS3 regions entirely composed of islands DG Regio, 2016
Island with >= 1
million inhabit-
ants
A typology of NUTS3 regions entirely composed of islands DG Regio, 2016
Cross-border re-
gions
Typology of cross-border regions based on DG Regio DG Regio, 2016
Fuzzy – Primary
Industries: Share
of EU Local GDP
exposed to Brexit
The measure gives the share of regional GDP contained in trade
flows between EU exporters and UK importers.
Chen, W. et al.
(2017). The conti-
nental divide?
Economic expo-
sure to Brexit in
regions and coun-
tries on both sides
of The Channel.
Fuzzy – Manu-
facturing: Share
of EU Local GDP
exposed to Brexit
The measure gives the share of regional GDP contained in trade
flows between EU exporters and UK importers.
Chen, W. et al.
(2017). The conti-
nental divide?
Economic expo-
sure to Brexit in
regions and coun-
tries on both sides
of The Channel.
Fuzzy – Con-
struction: Share
of EU Local GDP
exposed to Brexit
The measure gives the share of regional GDP contained in trade
flows between EU exporters and UK importers.
Chen, W. et al.
(2017). The conti-
nental divide?
Economic expo-
sure to Brexit in
regions and coun-
tries on both sides
of The Channel.
Fuzzy – Services:
Share of EU Lo-
cal GDP exposed
to Brexit
The measure gives the share of regional GDP contained in trade
flows between EU exporters and UK importers.
Chen, W. et al.
(2017). The conti-
nental divide?
Economic expo-
sure to Brexit in
regions and coun-
tries on both sides
of The Channel.
Fuzzy – Share of
EU Local GDP
exposed to Brexit
The measure gives the share of regional GDP contained in trade
flows between EU exporters and UK importers.
Chen, W. et al.
(2017). The conti-
nental divide?
Economic expo-
sure to Brexit in
regions and coun-
tries on both sides
of The Channel.
Fuzzy – Border
Regions (Terres-
trial, Population
within 25km)
Share of populuation within 25 km from a border region SWECO, t33,
Politecnico di Mi-
lano, Nordregio,
OIR calculation
Border Regions
(Maritime)
Typology of maritime border regions based on DG Regio study SWECO, t33,
Politecnico di Mi-
lano, Nordregio

TOOLS & MAPS // ESPON TIA Tool 2020-2022
22 ESPON // espon.eu
Typology Description Source
Border Regions
(Terrestrial)
Typology of terrestrial border regions based on DG Regio study SWECO, t33,
Politecnico di Mi-
lano, Nordregio
Fuzzy – Moun-
tainous Areas
(share of the total
area)
Fuzzy Typology: Share of a NUTS3 region that is covered by moun-
tainous terrain based on the EUROSTAT manual on territorial typol-
ogies. Calculation by using a digital elevation model (DEM).
EUROSTAT, 2016
Fuzzy – Moun-
tainous Areas
(population living
in mountainous
areas)
Fuzzy Typology: Share of the total population of a NUTS3 region
that is living in mountainous areas based on the EUROSTAT manual
on territorial typologies. Calculation by using a digital elevation
model (DEM) and population grid data.
EUROSTAT, 2016
Fuzzy – Urban
Areas (population
living in urban ar-
eas)
Fuzzy Typology: Share of the total population of a NUTS3 region
that is living in urban areas based on the EUROSTAT manual on ter-
ritorial typologies.
EUROSTAT, 2016
Fuzzy – Rural Ar-
eas (population
living in rural ar-
eas)
Fuzzy Typology: Share of the total population of a NUTS3 region
that is living in rural areas based on the EUROSTAT manual on terri-
torial typologies.
EUROSTAT, 2016
Fuzzy – Agricul-
tural Regions
Typology of regions based on the share of the Utilised Agricultural
Area (UAA) on the total area of the region
DG AGRI
Fuzzy – Border
distance
Fuzzy Typology: Normalised distance from the midpoint of a NUTS 3
region to the next closest border. In case a region is at a border, it
gets the value 1.
ÖIR calculation
Fuzzy – Urban
Fabrics
Fuzzy Typology: Share of urban fabrics (continuous and discontinu-
ous urban fabrics) on the total area of the region
Corine Land
Cover, Eurostat,
2018
Fuzzy – Indus-
trial, commercial
and transport
units
Fuzzy Typology: Share of industrial, commercial and transport units
on the total area of the region
Corine Land
Cover, Eurostat,
2018
Fuzzy – Total
residential and in-
dustrial land
Fuzzy Typology: Share of residential (continuous and discontinuous
urban fabrics) and industrial land on the total area of the region
Corine Land
Cover, Eurostat,
2018
Fuzzy – Forest
areas
Fuzzy Typology: Share of forest areas (broad leaved, coniferous or
mixed forest) on the total area of the region
Corine Land
Cover, Eurostat,
2018
Source: Consortium
For the final version of the tool, four additional fuzzy typologies are to be calculated., the Corine Land Cover
dataset which allows targeted calculations of typologies on every NUTS level has been agreed as being able
to provide some standard typologies. The 44 classes6 have been screened and based on the potential ap-
plicability to multiple TIA circumstances. The table below presents the selected classes, for which the share
of the total regions surface will be calculated as fuzzy typology.
6 https://land.copernicus.eu/user-corner/technical-library/corine-land-cover-nomenclature-guidelines/html

TOOLS & MAPS // ESPON TIA Tool 2020-2022
ESPON // espon.eu 23
Table 3.7: Additional Fuzzy typologies (Corine)
Class(es) Content Source
1.1 Urban Fabric 1.1.1 continuous urban fabric
1.1.2 discontinuous urban fabric
Corine Land Cover 2018
1.2 Industrial, commercial
and transport units
1.2.1 Industrial or commercial units
1.2.2 Road and rail networks and associated land
1.2.3 port areas
1.2.4 port areas
Corine Land Cover 2018
Total residential & industrial
land
1.1.1 continuous urban fabric
1.1.2 discontinuous urban fabric
1.2.1 Industrial or commercial units
Corine Land Cover 2018
3.1 Forest 3.1.1 broad leaved forest
3.1.2 coniferous forest
3.1.3 mixed forest
Corine Land Cover 2018
Source: Consortium

TOOLS & MAPS // ESPON TIA Tool 2020-2022
24 ESPON // espon.eu
4 Workshops and trainings conducted
4.1 Workshops conducted
In the period from the start of the project, 3 individual TIA workshops linked to the project have been con-
ducted. Due to the ongoing Covid-19 crisis, all workshops had to be held in a virtual format and no in-person
activities took place. The lessons learned for such workshops have proven valuable and allow for a more
efficient planning and implementation in the future.
The workshops were conducted based on requests from the Committee of the Regions to support the work
on several of their studies. Furthermore, within each workshop new methodological elements developed for
the current TIA tool update have been tested on their practicability in a workshop setting, on the participants
willingness to take up those elements and on the comprehensibility of more complex methods such as com-
posite indicators. Even though the methodological approaches themselves have not been discussed with
the participants, valuable feedback could be gathered.
Table 4.1: Workshops conducted
Title Client Type
Cross-border health threats Committee of the Regions General TIA
2030 climate targets Committee of the Regions General TIA
Cohesion as a value in the context of the environmental, digital
and societal transformation
Committee of the Regions General TIA
Source: Consortium
Results of the workshops in terms of input to methodological elements have been taken up in the further
development and discussions. In particular Cross-Border elements and related fuzzy typologies are relevant
for further developing the Cross-Border portal. Furthermore, the application of composite indicators has
proven that they can be meaningful for the TIA Quick Check and that participants do approve of them.
4.2 Trainings conducted
Training activities are an important element of the TIA project as they raise interest from stakeholders and
potential applicants of the TIA Quick Check. They allow for a better understanding of the methodology by
the participants and can encourage future activities. Training sessions are implemented flexibly and based
on the clients concrete requirements. While a “standard” training in the form of a half-day workshop session
has been conceptualised which covers an overview over the main elements of the TIA Quick Check and a
brief simulation in practice, this can be adapted in length, depth and topics.
Just as for the actual TIA workshops, the trainings had to be held in online format. The tools and materials
used (such as e.g. the virtual whiteboard and the voting software) are the same as for the TIA workshops.
The trainings however had to leave out some elements which are usually requested, namely the “hands on”
experience with the tool. In a physical meeting, the participants would be given access to the tool and guided
through steps for setup and tool inputs with the help of the trainers. Such a direct support could not be
implemented in a virtual setting. Participants were thus given access to the tool following the training, but
would have to explore on their own.
Table 4.2: Trainings conducted
Title Client
Training for interested audience in the Baltic Sea Region using the
revision of the TEN-T guidelines as an example
Ministry of Environmental Protection and
Regional Development of the Republic of
Latvia
Training for interested audience in the context of a 2-day confer-
ence in the context of the Territorial Agenda 2030 pilot action on
Region-focused Territorial Impact Assessment
Polish Ministry of Development Funds and
Regional Policy
Source: Consortium

TOOLS & MAPS // ESPON TIA Tool 2020-2022
ESPON // espon.eu 25
While one activity was implemented as a standard training showcasing some of the tools features and giving
some background explanations to participants, the second activity was implemented in the context of a larger
conference on Territorial Impact Assessment methodologies with presentations for all major methodologies
applied in the EU. Furthermore, topics of territorial relevance of particular regions such as Cross-Border
regions, rural regions or outermost regions were discussed, all of which are already addressed through the
ESPON TIA Tool, however to a varying degree.
TOOLS & MAPS // ESPON TIA Tool 2020-2022
26 ESPON // espon.eu
5 Further activities and developments
5.1 Ongoing developments
5.1.1 Fuzzy typologies
Implemented typologies
Fuzzy typologies as a means of better tailoring the assessments towards specific regional properties and
levels of affectedness have been added to the tool in the last development phase and were applied in several
workshops. In general they were well received, however workshops participants often shy away from using
them due to the assumed limitations of such a typology. The project team has trialled new fuzzy typologies
in the workshops conducted, however those typologies were in no case accepted by the participants, who
preferred to stick to standard typology of all regions in all cases.
The project team has however added 5 typologies as standard which were selected based on an assessment
of the assumed need or added value for such typologies. The quality criteria for typologies are more rigid
than for exposure fields, as data gaps are much more critical. A region with no data available in an exposure
field will only lose a piece of information in the assessment for a single exposure field, while a region with
no data available in a typology will lose information for the whole TIA. Therefore all datasets which were
considered as a basis for a typology were checked according to the following criteria:
▪ Completeness: Only complete datasets with no data gaps in the relevant areas are a sound basis for
creating typologies. For standard typologies in the TIA Tool, the dataset has to cover at least the EU27
(as the main application so far were assessments for EU LPDs) and preferably the entire ESPON space
without gaps.
▪ Value distribution: The value distribution for a continuous typology plays an important role. Datasets
which show a heavily skewed distribution to either side or which contain strong outliers lead to uninter-
pretable results.
▪ Content validity: A standard typology in the TIA Tool should not only be relevant for very specific use
cases but rather applicable to a wider range of possible cases.
▪ Methodological fit: As the TIA Quick Check is a methodology applying relative comparisons, a TIA
based on it always provides relative impact strength among the compared regions and not absolute
impacts. Thus, meaningful results require a certain minimum number of regions in the dataset, and in
the case of Fuzzy typologies a certain number of comparable regions (i.e. in a similar range of the
typology values). Otherwise, due to the underlying mathematical concept, the typology becomes the
main or even sole determining factor of impact values with little or no differentiation between exposure
fields.
Based on these criteria, the Corine Land Cover data turned out to be most valuable for calculating additional
Fuzzy typologies. As it is a raster dataset, values can be calculated for any geographic resolution and for
any NUTS version. The share of a specific land cover category respectively aggregate of land cover cate-
gories on the total area of a region are used for calculating the Fuzzy typology. The typologies selected are
listed in Table 3.7
Additionally, two typologies relating to often requested application cases, namely focused assessments for
Cross-Border regions as well as “rural proofing” for EU legislation have been developed as well. For Cross-
Border regions, some considerations are already outlined in section 5.2 for a particular workshop on Cross-
Border health threats, an additional typology depicting the relevance of a border for a region throughout
Europe was needed. This was not covered by the existing typologies, as they all focus on regions directly at
the border. Therefore, a typology based on the actual distance of a regions midpoint to a border was calcu-
lated, which includes all regions of Europe. The typology was not selected in the workshop, but implemented
in the tool nonetheless.
For “Agricultural Regions” a typology based on the Utilised Agricultural Area per region (as a share of the
total area) calculated by DG AGRI for the CAP context indicators has been used. This allows to address
TOOLS & MAPS // ESPON TIA Tool 2020-2022
ESPON // espon.eu 27
actual “agricultural regions” and complements the existing fuzzy typologies for rural regions, which are based
on population in rural grid cells.
Further methodological developments for fuzzy typologies
In the context of the project two new approaches to fuzzy typologies have been developed which are in-
tended to be tested in workshop settings. They pick up the concept of fuzzy typologies but take an approach
to calculating them which goes beyond what is currently done in terms of content or complexity. The two
approaches are:
▪ Index based typologies – which will be based on an index containing multiple sub indicators. There is a
number of such indices already available on the European scale (e.g. the Regional Innovation Score-
board) and furthermore they can be created similar to the methodology for calculating composite indi-
cators. This approach requires a careful consideration of the LPD assessed and furthermore a sound
judgement on which indicators will likely be used in the TIA workshop. An indicator which is used to
build the index cannot be used as an exposure field as well, thus those would have to be excluded in
the workshop. If well received, such an index-based typology could subsequently be added as a stand-
ard typology.
▪ Ordinal scale variables – which will be custom made typologies applying ranked categories. Based on
specific properties – e.g. the type of airport in driving distance for a region’s inhabitants, or the presence
of specific types of cargo hubs – a “rank” can be calculated. An example of such a variable would be a
typology for airport regions, where the “importance” of an airport could be ranked (e.g. world-wide hub
– European hub – national hub – regional hub – no relevant airport in driving distance). For the purpose
of creating a Fuzzy typology, each “rank” would be assigned a value between 0 and 1, with 1 meaning
the rank would be more exposed to the policy and 0 meaning the exposure would be minimal. Ranks in
between will be assigned values along a linear function. Such typologies will have to be created specif-
ically for an LPD and are unlikely to be included as a standard typology.
Unfortunately, all workshops conducted in the current projects did not allow for such specialized typologies,
as they either related to a rather broad topic with multiple policies involved in the assessment (workshops
on “2030 climate targets” and “cohesion as a value”) or a specialized LPD for which another type of fuzzy
typology was necessary and the two approaches would not lead to meaningful results.
There are still TIA workshops to be conducted in the context of the ongoing project though, and the project
team intends to trial the approaches in those. However as the topics of those workshops are always deter-
mined based on the request of clients (e.g. Committee of the Regions, DG REGIO), it can be the case that
the upcoming workshops are not fitting the proposed approaches. In that case, the project team proposes
to add the guidance on how to calculate such typologies to the moderators guide only. It is not advised to
include such specialized typologies as standard typologies without a concrete LPD they relate to and have
been tested on.
5.1.2 Composite indicators
Composite indicators as a methodological concept are already outlined in section 2.3.1. They are one of the
main additions in the TIA tool update project aiming at better tailored assessments for LPDs and also sup-
posed to overcome data shortages on certain issues where mainly general, but few specific indicators are
available. Similar to fuzzy typologies, they were developed and tested in practice in the TIA workshops
conducted to assess their applicability in practice. Furthermore, their acceptance by the workshop partici-
pants was assessed, as they might be not as straight forward and comprehensible as other indicators. For
each of the three workshops, at least one indicator was considered and subsequently prepared and sug-
gested in the workshop.
TOOLS & MAPS // ESPON TIA Tool 2020-2022
28 ESPON // espon.eu
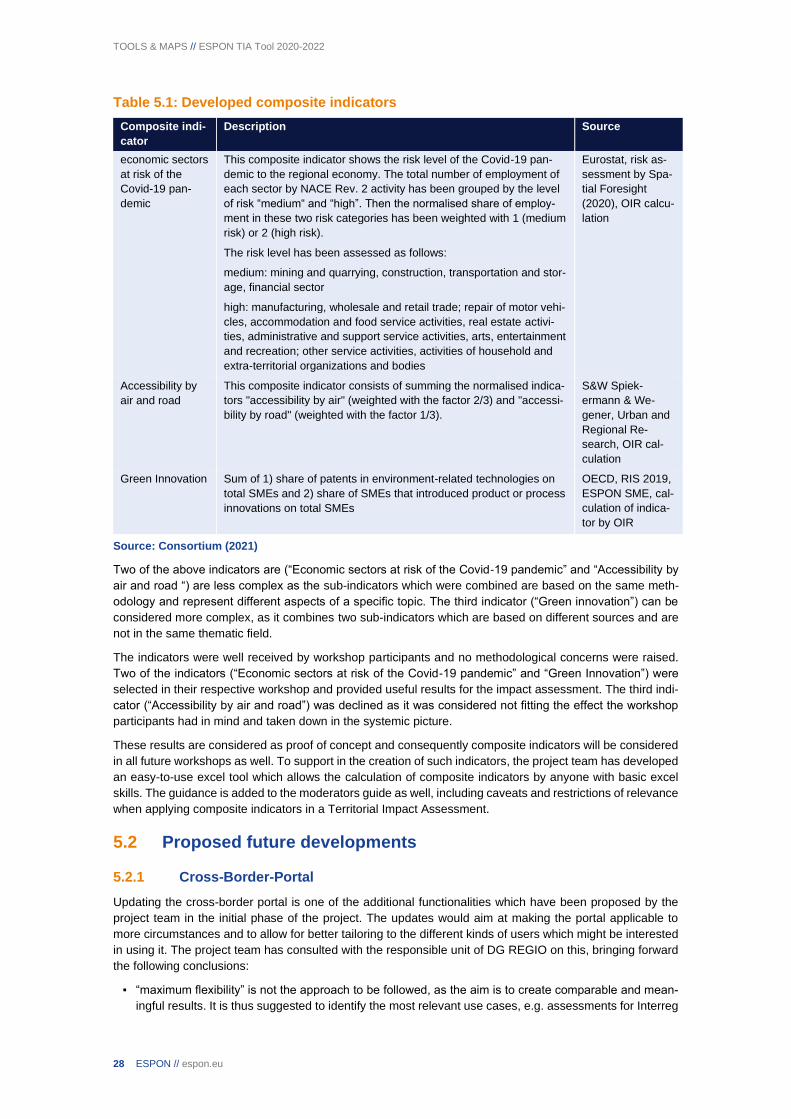
Table 5.1: Developed composite indicators
Composite indi-
cator
Description Source
economic sectors
at risk of the
Covid-19 pan-
demic
This composite indicator shows the risk level of the Covid-19 pan-
demic to the regional economy. The total number of employment of
each sector by NACE Rev. 2 activity has been grouped by the level
of risk “medium“ and “high”. Then the normalised share of employ-
ment in these two risk categories has been weighted with 1 (medium
risk) or 2 (high risk).
The risk level has been assessed as follows:
medium: mining and quarrying, construction, transportation and stor-
age, financial sector
high: manufacturing, wholesale and retail trade; repair of motor vehi-
cles, accommodation and food service activities, real estate activi-
ties, administrative and support service activities, arts, entertainment
and recreation; other service activities, activities of household and
extra-territorial organizations and bodies
Eurostat, risk as-
sessment by Spa-
tial Foresight
(2020), OIR calcu-
lation
Accessibility by
air and road
This composite indicator consists of summing the normalised indica-
tors "accessibility by air" (weighted with the factor 2/3) and "accessi-
bility by road" (weighted with the factor 1/3).
S&W Spiek-
ermann & We-
gener, Urban and
Regional Re-
search, OIR cal-
culation
Green Innovation Sum of 1) share of patents in environment-related technologies on
total SMEs and 2) share of SMEs that introduced product or process
innovations on total SMEs
OECD, RIS 2019,
ESPON SME, cal-
culation of indica-
tor by OIR
Source: Consortium (2021)
Two of the above indicators are (“Economic sectors at risk of the Covid-19 pandemic” and “Accessibility by
air and road “) are less complex as the sub-indicators which were combined are based on the same meth-
odology and represent different aspects of a specific topic. The third indicator (“Green innovation”) can be
considered more complex, as it combines two sub-indicators which are based on different sources and are
not in the same thematic field.
The indicators were well received by workshop participants and no methodological concerns were raised.
Two of the indicators (“Economic sectors at risk of the Covid-19 pandemic” and “Green Innovation”) were
selected in their respective workshop and provided useful results for the impact assessment. The third indi-
cator (“Accessibility by air and road”) was declined as it was considered not fitting the effect the workshop
participants had in mind and taken down in the systemic picture.
These results are considered as proof of concept and consequently composite indicators will be considered
in all future workshops as well. To support in the creation of such indicators, the project team has developed
an easy-to-use excel tool which allows the calculation of composite indicators by anyone with basic excel
skills. The guidance is added to the moderators guide as well, including caveats and restrictions of relevance
when applying composite indicators in a Territorial Impact Assessment.
5.2 Proposed future developments
5.2.1 Cross-Border-Portal
Updating the cross-border portal is one of the additional functionalities which have been proposed by the
project team in the initial phase of the project. The updates would aim at making the portal applicable to
more circumstances and to allow for better tailoring to the different kinds of users which might be interested
in using it. The project team has consulted with the responsible unit of DG REGIO on this, bringing forward
the following conclusions:
▪ “maximum flexibility” is not the approach to be followed, as the aim is to create comparable and mean-
ingful results. It is thus suggested to identify the most relevant use cases, e.g. assessments for Interreg

TOOLS & MAPS // ESPON TIA Tool 2020-2022
ESPON // espon.eu 29
programmes, assessments across Interreg programmes or assessments for functional border regions,
and design typologies and indicators to their needs. Individual user-created content can be used for
further tailoring the tool if an experienced user has the need for it
▪ “Functional” regions on a general, pan-European level can best be approximated by actual, physical
links between regions across borders. While functional relations such as through commuters would be
even more relevant, that data is simply not available in the spatial resolution required. Thus links such
as through border crossings, railways or roads can be used as a proxy
▪ Policy relevance is highly important for the TIA tool, thus administrative regions, programme regions
etc. form a good basis of assessments in the context of LPDs. This is especially relevant for actors such
as INTERACT, but might also be relevant on a more regional level.
There are ongoing projects which potentially can provide meaningful insights and a solid data base for such
delineations, in particular the study “Providing public transport in cross-border regions. Mapping of existing
services and related legal obstacles” launched by DG REGIO and supposed to finish this summer. As there
are no interim reports published, the project team did not receive access to the data produced. As soon as
it is available the datasets can be reviewed for input to the CB-portal. A similar project, “Comprehensive
analysis of the existing cross-border rail transport connections and missing links on the internal EU borders”
has been conducted in 2018, however with less depth and only focusing on railway connections.
Based on the above considerations, the following additional updates of the CB-Portal are proposed:
▪ In consultation with ESPON EGTC select 3 relevant cases of CB assessments (taking as a starting point
the first bulletpoint above) for which the portal shall provide standard solutions
▪ For each solution, produce a specific typology that allows to target the assessments
▪ Implement each typology into the CB-portal (other than for typologies in the general TIA tool this requires
updating the shapefiles as well)
5.2.2 Concept for an Outermost Regions portal
The concept for an outermost Regions portal has been put forward in the course of the project, and still
remains a possibility for implementing as an additional functionality. The interest in such a portal was em-
phasised in the training activity conducted on the Territorial Agenda 2030 in the context of the project. The
Outermost Regions are included in the tool already, however, due to their small number and their unique
circumstances might get “lost” in the overall picture of a TIA. A portal focusing on the Outermost Regions
would mitigate this issue, however, requires some adaption to the methodology of the Quick Check. The
application of the standard methodology would produce a comparative assessment of Outermost Regions
amongst each other, which again due to the unique circumstances (including their large geographical dis-
tances) will not provide satisfactory results. The project team has discussed some approaches to provide
relevant information about territorial impacts on Outermost Regions:
▪ Comparing them to geographically similar regions in Europe
▪ Comparing them to a cluster of regions with similar properties defined based on the relevance towards
the LPD assessed
▪ Comparing them with European averages for specific exposure fields
which by themselves or in combination can provide relevant information about impacts. Developing an elab-
orated concept for such a portal based on these first thoughts and in close consultation with DG REGIO
would be a valuable task which would lay the groundwork for a future Outermost Regions portal.

TOOLS & MAPS // ESPON TIA Tool 2020-2022
30 ESPON // espon.eu
Annex [separately]
A.1 Draft version of the updated part of the guidance document for moderators
A.2 Draft version of the updated part of the guidance document for administrator module


TOOLS & MAPS // ESPON TIA Tool 2020-2022
32 ESPON // espon.eu
ESPON 2020
ESPON EGTC
4 rue Erasme, L-1468 Luxembourg
Grand Duchy of Luxembourg
Phone: +352 20 600 280
Email: [email protected]
www.espon.eu
The ESPON EGTC is the Single Beneficiary of the
ESPON 2020 Cooperation Programme. The Single
Operation within the programme is implemented by
the ESPON EGTC and co-financed by the European
Regional Development Fund, the EU Member States,
the United Kingdom and the Partner States, Iceland,
Liechtenstein, Norway and Switzerland.
Disclaimer
This delivery does not necessarily reflect the opinion
of the members of the ESPON 2020 Monitoring
Committee.