tools development for analysis and conceptual design of · pdf file ·...
TRANSCRIPT

Tools development for analysis and conceptual design of extractive and
azeotropic distillation columns at finite reflux
LibardoEstupiñan Pérez
Universidad Nacional de Colombia Facultad de ingeniería, Departamento de Ingeniería Química y Ambiental
Bogotá, Colombia 2012

Tools development for analysis and conceptual design of extractive and
azeotropic distillation columns at finite reflux
LibardoEstupiñan Pérez
Tesis presentada como requisito parcial para optar al título de: Magister en Ingeniería Química
Director: Carlos Arturo Martínez Riascos, Dr. Ing.
Grupo de Investigación:
Grupo de Ingeniería de Sistemas de Proceso
Universidad Nacional de Colombia Facultad de ingeniería, Departamento de Ingeniería Química y Ambiental
Bogotá, Colombia 2012


In this work, when it shall be found that much is omitted, let it not be forgotten that much likewise is performed.
Dr. Samuel Johnson


Acknowledgments
Two years and a half after the beginning in the MSc. Program I am writing this section for my thesis. Many things have changed during these time and many people have influenced my life in both ways positive and negative. Therefore, it is important for me to express my gratitude to all the people who influenced this work and my life during this time. I should say these two years have been very enriching not only in the academic, but also in the personal aspect. First, I would like to express my deepest gratitude to my advisor Prof. Carlos Martínezand to the Prof. Greg P.Dechainefor their guide, orientation, and encouragement during this research.Also, Iwould like to thank Prof. Cesar Augusto Sánchez for his invaluable advice and knowledge. I have learned a lot from them. I should recognize the support, motivation, and lovefrom my family, especially my parents and my grandfather, without you this work would not be possiblenor meaningful.Also, I would like to thank my Colombian friends in Canada: Rosa, Silvia, Lina, Jose, and Luis Carlos, you were my family in Edmonton, I was fortunate for having found wonderful friends as you. I also want to express my gratitude to my study partner and friend Oscar Mauricio for his friendship and academic collaboration during these two years; I think that I have made a friend for life. In addition, I would like to thank my fellow chemical engineers at the Universidad Nacionalfor their interesting academic discussion. I would like to thank the financial support of Foreign Affairs and International Trade Canada’s Emerging Leaders in the Americas Program and the Canadian Bureau for International Education (CBIE) for funding to allow me to develop the six months internshipat the University of Alberta. Finally, I appreciate the financial assistance provided by the scholarship BecaAsistentedocente funded by Universidad Nacional de Colombia.

Abstract
In this work shortcut methods are developed for the conceptual design of azeotropic and extractive distillation. Three specific cases of azeotropic and extractive distillation are studied: single-feed homogeneous azeotropic distillation, extractive homogeneous distillation and single-feed heterogeneous distillation. To evaluate the process feasibility, to calculate design parameters and minimum energy by shortcut methods is the core of this work. Methods developed are based on the pinch concept and the use of mathematical tools for modeling the thermodynamic behavior. Continuation methods are used throughout the work in order to either devise or modify calculation algorithms that can be robust and useful for any kind of mixture. Finally, different mixtures with academic or industrial relevance were selected as case studies to demonstrate the applicability of conceptual design and shortcut methods in distillation process. Obtained results demonstrate that the use of conceptual design methods is an efficient way to avoid the trial and error design strategy carried out in simulators by engineers. Keywords:reversible distillation, distillation boundaries, finite reflux, operation leaves, continuation methods, conceptual design, azeotropic distillation

xi
Resumen
En este trabajo métodos cortos fueron desarrollados para el diseño conceptual de la destilación extractiva y azeotrópica. Tres diferentes casos de destilación azeotrópica y extractiva fueron estudiados: destilación azeotrópica homogénea en columnas con un alimento, destilación extractiva homogénea y destilación heterogénea en columnas con un alimento. La evaluación de la factibilidad del proceso, el cálculo de los parámetros de diseño y la mínima energía constituyen el núcleo del presente trabajo. Los métodos desarrollados están basados en el concepto del pinchy el uso de herramientas matemáticas para modelar el comportamiento termodinámico. Métodos de continuación son usados a lo largo del trabajo ya sea para el desarrollo o para modificar algoritmos de cálculo que sean robustos y aplicables a cualquier clase de mezcla. Finalmente, diferentes mezclas con relevancia académica o industrial fueron seleccionadas como casos de estudio para demostrar la aplicabilidad del diseño conceptual y los métodos cortos en el proceso de destilación. Los resultados obtenidos demuestran que el uso de los métodos cortos en el diseño conceptual son una forma eficiente para evitar el diseño mediante una estrategia de ensayo y error usando simuladores comerciales. Palabras clave: destilación reversible, fronteras de destilación, reflujo finito, hojas de operación, métodos de continuación, diseño conceptual, destilación azeotrópica


xiii
Contents
Page
Abstract ...................................................................................................................... IX
Resumen ..................................................................................................................... xi
Contents .................................................................................................................... xiii
List of figures .............................................................................................................. xv
1. Introduction .......................................................................................................... 1
1.1 Background and motivation ...................................................................................... 1
1.2 Problem definition ................................................................................................... 4
1.3 Objectives ................................................................................................................ 5
1.3.1 General objective ......................................................................................................................... 5
1.3.2 Specific Objectives ....................................................................................................................... 5
1.4 Methodology ........................................................................................................... 6
1.4.1 Analysis of homogeneous azeotropic and extractive distillation ................................................ 6
1.4.2 Analysis of azeotropic heterogeneous distillation ....................................................................... 7
2. Analysis of separation possibilities in homogeneous azeotropic distillation columns
operating at finite reflux .............................................................................................. 9
2.1 Previous work and scope .......................................................................................... 9
2.2 Distillation column model ........................................................................................ 11
2.3 Estimation of feasible designs for distillation columns .............................................. 13
2.3.1 Continuation methods ............................................................................................................... 13
2.3.2 Calculation of reversible distillation profiles (pinch point curves) using a new methodology. . 15
2.3.3 Construction of operation leaves............................................................................................... 17
2.3.4 Pitchfork boundary .................................................................................................................... 19
2.3.5 Minimum reflux calculation ....................................................................................................... 22
2.4 Examples and discussion ......................................................................................... 23
2.4.1 Acetone-methanol-water .......................................................................................................... 23
2.4.2 Acetone-chloroform-benzene.................................................................................................... 24

xiv
2.4.3 Acetone-chloroform-methanol .................................................................................................. 26
2.4.4 Implementation and validation in Aspen Plus® ......................................................................... 27
2.5 Conclusions ............................................................................................................. 29
3. A simplified conceptual design methodology for double-feed extractive distillation
processes .................................................................................................................... 31
3.1 Previous work and scope ......................................................................................... 31
3.2 Background ............................................................................................................. 32
3.2.1 Column model ............................................................................................................................ 32
3.2.2 Reversible distillation model for double feed columns ............................................................. 35
3.3 Conceptual Design Methodology for Double Feed Columns ...................................... 36
3.3.1 Calculation of pinch point curves............................................................................................... 36
3.3.2 Determination of minimum entrainer feed ratio ...................................................................... 39
3.3.3 Calculating isovolatility curves ................................................................................................... 41
3.3.4 Maximum reflux calculation ...................................................................................................... 44
3.3.5 Feed quality effects.................................................................................................................... 45
3.4 Case studies with the new methodology .................................................................. 46
3.4.1 Implementation and validation in Aspen Hysys® ...................................................................... 52
3.5 Conclusions ............................................................................................................. 53
4. Conceptual Analysis of Single-Feed Heterogeneous Columns ................................ 55
4.1 Previous work and scope ......................................................................................... 55
4.2 Heterogeneous column model ................................................................................. 57
4.2.1 Strategy to calculate phase equilibrium .................................................................................... 59
4.2.2 Solution strategy for heterogeneous distillation profiles .......................................................... 60
4.3 Methodology to calculate operation leaves in heterogeneous systems ..................... 63
4.4 Case studies with the new methodology .................................................................. 67
4.5 Conclusions ............................................................................................................. 70
5. Conclusions and future work ................................................................................ 71
5.1 Conclusions ............................................................................................................. 71
5.2 Future work ............................................................................................................ 71
Bibliography ............................................................................................................... 73

List of figures
Page
Figure 2-1: Schematic representation of a single-feed column. ..................................................... 11 Figure 2-2: Operation leaves for acetone-water-methanol system. ................................................ 18 Figure 2-3: Open operation leaves for acetone-chloroform-benzene system. ................................ 19 Figure 2-4: Region of product compositions that allow to cross the distillation boundary.. ............ 21 Figure 2-5: Algorithms for analysis of feasibility in homogeneous azeotropic distillation.. ............. 22 Figure 2-6: Stripping and rectification operation leaves for acetone-methanol-water system. ....... 24 Figure 2-7: Stripping and rectifying operation leaves for acetone-chloroform-benzene system..... 25 Figure 2-8: Pitchfork boundary for acetone-chloroform-benzene system. ...................................... 26 Figure 2-9: Branches of pinch points and rectifying profiles associated with a distillate composition
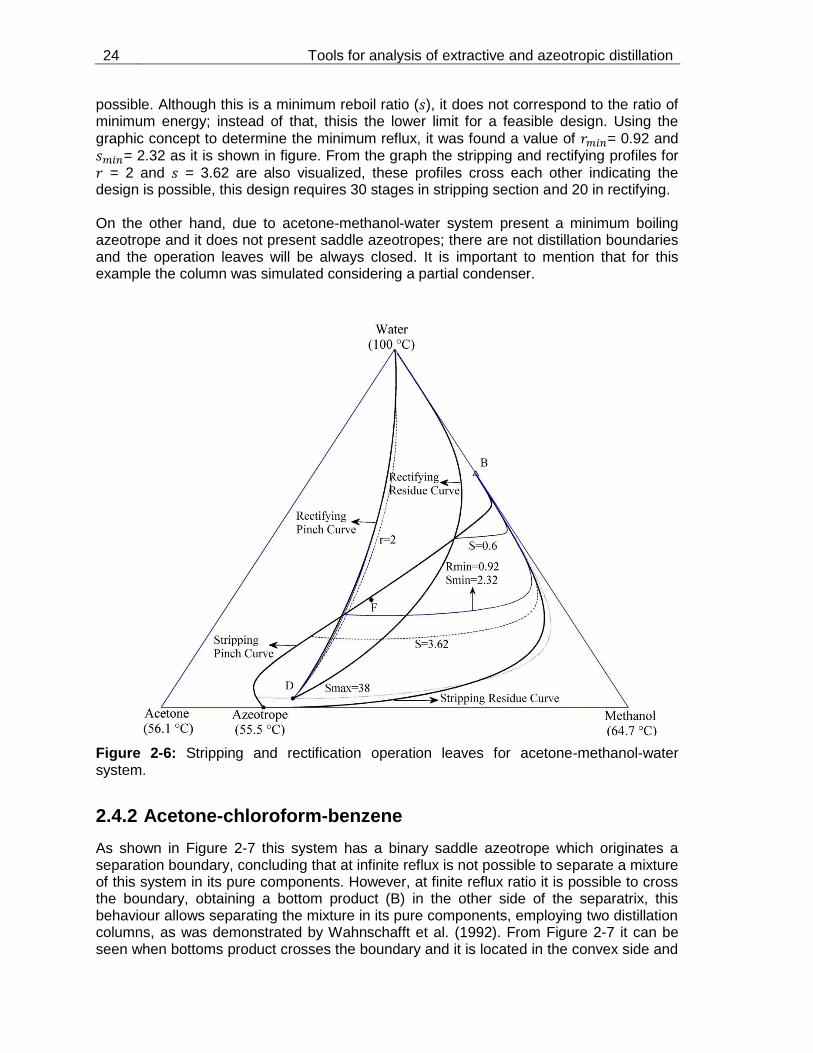
(D) for acetone-chloroform-methanol system. ......................................................................... 27 Figure 2-10: Distillation profiles for acetone-chloroform-benzene system at . ................... 28 Figure 2-11: Distillation profiles for acetone-chloroform-benzene system at . ................... 28 Figure 2-12: Results of rigorous distillation column simulated in Aspen Plus® .............................. 29 Figure 2-13: Composition profile calculated by Aspen Plus for the system acetone-chloroform-
benzene .................................................................................................................................... 30 Figure 3-1: Schematic representation of a double-feed extractive distillation column. ................... 33 Figure 3-2: Bifurcation point and first pinch point for the lower reflux pinch curve for the acetone-
methanol-water system . .......................................................................................................... 39 Figure 3-3: Minimum feed ratio for the acetone-methanol-water system at 1atm. ......................... 40 Figure 3-4. Lower reflux pinch curves and isovolatility curve for the acetone-methanol-water
system at 1 atm. ....................................................................................................................... 43 Figure 3-5: Maximum reflux controlled by a turning point for the acetone-methanol-water system.
Entrainer feed ratio = 0.6, pressure = 1 atm. ........................................................................... 44 Figure 3-6: Maximum reflux for different entrainer feed qualities, , for the acetone-methanol-
water system. ........................................................................................................................... 45 Figure 3-7. Maximum reflux for different entrainer feed qualities ( ) for the acetone-methanol-
water system. ........................................................................................................................... 46 Figure 3-8: Proximity between the isovolatility curve and the pinch curve for the EtOH-H2O-EG
system. ..................................................................................................................................... 47 Figure 3-9: Determination of the minimum feed ratio for ethanol-water-ethylene glycol system. ... 48 Figure 3-10: Comparison of the upper pinch curves with different feed ratios for the ethanol-water-
ethylene glycol system ............................................................................................................. 49 Figure 3-11: Feasible design for the acetone-methanol-water system at 1 atm and an entrainer to
feed ratio of = 0.6.. .............................................................................................................. 50 Figure 3-12: Comparison of the distillation profiles at different entrainer feed qualities. ................ 51

xvi
Figure 3-13: Results for rigorous simulation of extractive distillation of ethanol-water with ethylene
glycol performed in Aspen Hysys. ............................................................................................ 52 Figure 3-14: Distillation profiles calculated by Hysys and Matlab ................................................... 53 Figure 4-1: Schematic representation of a heterogeneous distillation column. .............................. 58 Figure 4-2: Topological behavior of water-acetic acid-amyl acetate system. ................................. 61 Figure 4-3: Compositions for a heterogeneous azeotropic column. ............................................... 62 Figure 4-4: Distillation profiles for water-acetic acid-amyl acetate system. .................................... 63 Figure 4-5: Algorithm for design feasibility of heterogeneous systems. ......................................... 66 Figure 4-6: Topological behavior of ethanol-benzene-water system.. ............................................ 67 Figure 4-7: Operation leaves for water-acetic acid-amyl acetate ................................................... 68 Figure 4-8: Operation leaves for ethanol-benzene-water system. .................................................. 69

1. Introduction
Shortcut design methods are fundamental tools in the process design of separation units due to they allow identifyingthe viability of a proposed separation, generate limits for some designand operation parameters (i.e. reflux ratio, number of stages, and for extractive distillation columns feed ratio between solvent and mixture). The number of conceptual design methods, especially for distillation, has increased with the evolution of numerical methods and software programming. Developing shortcut methods for the conceptual design of distillation process is the core of this work; the research project is focus on three different distillation processes such as single-feed azeotropic distillation, double-feed azeotropic distillation, and single-feed heterogeneous azeotropic distillation. This chapter presents, in a general way, the basis ideas, motivations and objectives ofthe work. Finally, it is important to mention that chapters two to four were written in an independent way; therefore, each one contain its own background, framework and methodology.
1.1 Background and motivation
Conceptual analysis of distillation systems had been developed from several decades ago by researchers such as Zharov y Serafimov (1975), Van Dongen and Doherty (1985), Petlyuk (2004) who laid the foundation about the conceptual design and have developed the topological thermodynamic which tools are essential part in the conceptual design. These methods were conceive as a powerful tool that helps engineers to know the constraints and limitations imposed by thermodynamic on a separation process, namely, conceptual analysis through topological thermodynamic determines the separation possibilities and distillation regions at infinite reflux for a mixture. The barriers imposed by thermodynamic are related to the singular or fixed points in the mixture. Singular points are azeotropes, pinch points and pure components; their existence in a mixture originates both distillation boundaries and distillation regions. Determination of these points is an important step in conceptual process design because it allows knowing the distillation regions and the separation possibilities. Since the beginning of XX century the concept and practical application of residue curves was developed; this curves are useful to describe the thermodynamic behavior; a residue curves classification for ternary systems was presented by Zharov ySerafimov (1975), they classified ternary diagrams based on the number of fixed points and distillation regions. Subsequently, Doherty and Caldarola (1985) developed a new classification where more ternary diagrams were included. Classification of ternary diagrams provides to designer with knowledge about distillation regions, azeotropes and potential distillate and bottom products, prior to simulation process. The characterization of phase diagrams in ternary and quaternary systems makes possible the synthesis of separation sequences at infinite reflux. The sequences are

2 Tools for analysis of extractive and azeotropic distillation
synthetized at infinite both reflux and stages since analysis were made using residue curves that represent the profile of the liquid composition remaining in an only stagebatch distillation process. Before to the 80’s there were not shortcut methods for determining the minimum energy conditions. Thus, it was necessary to perform simplified methods that required calculating the entire column until minimum energy parameters were found using a trial and error procedure. From the 80’s methods that did not need to calculate the entire column were developed. Van Dongen and Doherty (1985) presented the boundary value method for calculating the distillation profiles. The method is based on the Taylor series expansion of the distillation column equations for each section (stripping and rectifying). Thus, the column equations are solved through numerical integration. Also, using a graphical criteria, minimum reflux is calculated. Julka and Doherty (1990) presented the zero volume method; for this method, a discretization of the column equations along with linear algebra tools is used in order to determine minimum reflux. Koehler et al. (1991) published an empiric method based on reversible distillation and the minimization of the formed angle by specific fixed points of mixtures, this procedure allows calculating the minimum operation conditions. Poellmann et al. (1994) presented a method based on the eigenvalues theory and their relation with the fixed points. Lucia et al. (2008) developed an optimization algorithm known as the stripping shortest line. These concepts are supported on the residue curves length: longest residue curve represents the design with the highest consumption and energy cost. Conversely, the shortest line corresponds to the design with the lowest energy consumption. Within the development of tools and methods that allow engineers to design distillation columns,there always exist a dichotomy between methods that determine the feasibility and design parameters for a separation process and methods that carry out simulations in order to evaluate the design proposed by the conceptual design. Sometimes simulators are used in a wrong way: calculating design parameters through a trial and error strategy. This procedure is tedious and inefficient because it requires performing simulations as many times as possible until values for design parameters are found. Fidkowski et al. (1991) pointed out that in evaluation stage (simulation) the design parameters along with the feed composition are input variables given to the program, so the objective consist of calculating the composition of product streams. This is the function that simulators are able to accomplish in an efficient way. When the task required is to design, composition of feed and desired products are the input variables and in this case the goal is to determine if these specifications achieve a feasible design. If the goal is achieved, the design parameters and the process configuration are found and the separation process is accomplished. According to aforementioned ideas, distillation column design could be carry out either through trial and error strategy or through conceptual design methods, in both cases it must be calculated the design parameters such as minimum reflux, number of stages, and feed stage. The conceptual designmethods are known as shortcut methods because they do not require rigorous and complete simulation using the MESH equations. In non-ideal systems either homogeneous or heterogeneous, to calculate values for design parameters is difficult. Koehler et al. (1991) mentioned as an example the determination of minimum reflux and they said this parameter is important, but difficult to calculate for

Introduction 3
the correct designbecause it is very sensitive to the composition of product stream. Therefore, it is necessary to use robust calculation methods since a little excess in reflux ratio will generatean increase of energy consumption and excessive column diameter. Although nowadays there are methods to determine design parameters, these methods present some calculation problems that were mentioned by Felbab et al. (2011); Lucia et al.(2008); Sánchez (2011)and are detailed as follows:
Do not consider design of multiple feed columns,
Do not localize all pinch points,
Localize only one pinch point class,
Show convergence problems when complex thermodynamic models are used. On the other hand, Sánchez (2011)highlightedsome benefits of existing methods and the possible solutions to the problems mentioned above:
Multiple feed columns (i.e. extractive and azeotropic columns) can be treated in their design step using the pseudoproduct concept also pointed out by Wahnschafft and Westerberg (1993),
In design step is not necessary to determine all pinch branches as was demonstrated by Julka and Doherty (1990),
Homotopy continuation methods can locate all pinch point types. At the last decade new methods for the designand synthesis of extractive and azeotropic distillation columns have been developed. Bruggemann and Marquardt (2004) and Lucia et al. (2008) presented the rectification body method and the stripping shortest line method, respectively. The recent efforts for developing shortcut methods show the current relevance of thesemethods and the necessity to develop tools and methodologies for distillation conceptual design on single and multiple feed columns at finite reflux. This work focuses on search, improving and development of theoretical tools for conceptual design of distillation columns and sequences of columns. Advances in this area will allow application to industrial an academic problems. Additionally, these tools may be employed as complementation to commercial simulators thatare useful for evaluation (simulation) of design parameters by calculation of product streams for a set of defined conditions of feed streams. The project development is theoretical, implementation and experimental verification is a work for future researches. Limitation to theoretical development is due to some conditions: available time for master research, advantages of general methods instead of solution of specific problems –in present work tools for non-ideal systems, homogeneous and heterogeneous with azeotropic behaviour, are studied–; additionally, limitations on resources and time for designing, construction and operation were considered. For analyzing capabilities of developed methods and to demonstrate the gain with their application, there were selected case studies with academic and industrial relevance, specifically for national chemical industry. Ethanol-water system which azeotrope can be separate by extractive distillation with ethylene glycol or by heterogeneous azeotropicdistillation using benzene as entrainer was considered. Water-acetic acid system does not present azeotrope, but requires a separation agent due to its non-ideality
4 Tools for analysis of extractive and azeotropic distillation
and low volatility. In this case study amyl acetate was used as entrainer. Other systems with academic and industrial relevance employed in the study were: acetone-methanol-water, acetone-chloroform-methanol and acetone-chloroform-benzene. The first one is an example of extractive distillation; the second one of multiple boundaries system and the last one is a case of systems where distillation boundary can be crossed during distillation. The review of existing methods for conceptual analysis of distillation processes confirmed the effort for developing shortcut methods as an alternative to avoid the estimation of parameters by multiple rigorous simulations into trial and error strategies. The importance of these methods is the motivation for developing the present research in the way of searching for robust methods to design of distillation columns for azeotropic systems with different characteristics, as results the consolidation of conceptual tools is expected. Columns with single and double feed, and homogeneous and heterogeneous systems are considered. Developed shortcut methods must employ mathematical tools applied for analysis in chemical engineering. In academic and research areas, the present work is justified on generation of new knowledge, formed by mathematical methods and concepts applied in conceptual analysis of distillation processes, as well as characterization of these separation processes; identification of feasibility and limitations are some important characteristics to be developed.
1.2 Problem definition
Distillation is one of the most studied, developed, and usedseparation processes, in chemical industry. In spite of many studies and research about distillation, there are unresolved issues in this field. Nowadays distillation process has been coupled with other separation and reaction processes such as reactive distillation or coupled units reaction-separation. These innovative configurations involve new scientific and academic problems that chemicals engineers must solve. Other challenging problem is the improving of efficiency, especially in energy use. One of the most relevant distillation problems is related with conceptual analysis or static analysis as is known in Russian literature (Petlyuk, 2004). McCabe and Thiele (1925) were the first authors to use graphical tools, supported in thermodynamic and mass balances,fordetermining the feasibility and design parameters such as number of stages, reflux ratio and feed stage for a binary distillation process. Subsequently, graphical methods for ternary systems were developed (Zharov y Serafimov, 1975) and currently they are a powerful tool used in pre-synthesis step. The set of graphical tools supported on mathematical and thermodynamic concepts is the core of topological thermodynamic, which described the behavior of a mixture on the composition diagrams. Using thermodynamic tools such as residue curves, isovolatility lines, and distillation lines is possible to calculate and locate all theazeotropes, partial miscibility regions, distillation boundaries and regions at infinite reflux for a specific mixture. These tools along with mass balances make possible to synthetize separation sequences. Topological thermodynamic allows determining the restrictions and separation possibilities for a mixture using a distillation column or a separation sequence at infinite reflux condition. In contrast to aforementioned, Laroche et al. (1991) proved that distillation of azeotropic mixtures, where an entrainer is used (extractive and azeotropic distillation), reach the highest separation degree at finite reflux condition. That condition is
Introduction 5
totally different for zeotropic mixtures where the highest separation degree reached at infinite reflux conditions. For azeotropic and extractive distillation, conceptual analysis predicts the interaction between entrainer and original components of the azeotropic mixture; also, it is possible to calculate the thermodynamic efficiency ofan entrainer,the comparison of efficiencies supports the entrainer selection;on that way, the selection of entrainer is one of the most important aspects for the conceptual design that should be approached using finite reflux condition. Furthermore, entrainer selection and conceptual design at finite reflux must be complemented with the reduction of energy consumption in the separation process because multiple-feed columns will demand additional energy requirement for entrainer stream. Energy cost reduction in separation processes is one of the main challenges that engineers must solve. Distillation is a separation process that requires high energy supply; there is an estimate that distillation consumes 18% of all of the energy in the manufacturing sector in the U.S.(Lucia et al., 2008). Therefore, it is necessary to look for methods in order to design optimum separation processes and try to reduce the energy consumption.In addition to reduce energy consumption, determination of optimal operation parameters (reflux and reboil ratio, number of stages, feed tray, and feed quality) is very important since it allows carrying out the separation process according to separation components degree. Minimum energy determination has grown in importance not only for the above mentioned analysis, but also because it describes the thermodynamic behavior of mixtures and separation restrictions under this condition. From minimum energy calculation it is possible to determine pinch points; also, separation regions and process feasibility at finite reflux conditions.
1.3 Objectives
1.3.1 General objective
To develop conceptual methods for designingof extractive and azeotropic distillation systems in single and double-feed columns at finite reflux conditionthat can be applied to homogeneous and heterogeneous mixtures using as case studies mixtures with academic or industrial relevance.
1.3.2 Specific Objectives
To develop, using both continuation and shortcut methods, algorithms that helps to improve methodologies developed previously, and reported in literature.
To apply conceptual design theory and topological thermodynamic tools for developing a more robust methodology that allows determining design parameters and process feasibility for distillation of azeotropic systemsin single-feed columns.
To develop a shortcut method for double-feed columns in order to determine the process feasibility and design parameters.

6 Tools for analysis of extractive and azeotropic distillation
To establish a simple and robust methodology for evaluating the process feasibility in heterogeneous azeotropic single-feed columns.
1.4 Methodology
This work is focus on theoretical and conceptual research, and exploration of extractive and azeotropic distillation through shortcut design methods. Thisclass of methods evaluates the process feasibility and determines the design parameters in distillation columns through topological thermodynamic and mathematical tools. Using these toolsit is possible to develop robust design methods in order to avoid the use of simulators in the design step, since it needs a trial and error strategy. Different shortcut methods for homogeneous single-feed columns have been presented in literature. In contrast, methods for double-feed columns are scarce and the application is limited. A common factor in shortcut methods is the use of pinch concept to develop the methodology. Pinch concept has been the most used for solving the conceptual design problem in distillation; most of articles about shortcut methods are based on this concept. Using pinch concept is possible to determine mathematically fixed points (azeotropes and pinch points) through the use of differential equations theory and discrete dynamical systems. Advances found in literature and detailed in section 1.1 about the pinch concept and mathematical modeling are a suitable starting point for this work. Therefore, research carried out in this work about the conceptual design and shortcut methods are based on pinch concept. Applying this concept a more robust methodology for single-feed columns tries to be developed since point of view of calculation speed, and reliability. According to mentioned above, this work is focused on three types of distillation processes: single-feed homogeneous azeotropic distillation, double-feed homogeneous extractive distillation, and single-feed heterogeneous azeotropic distillation. Each topic will be developed in an independent chapter where methodology used in each case will be explained in detail along with the results. Therefore, this chapter just tries to explain, in a general way, the purpose and methodology used in this work and described in next section. This thesis has been written in a manuscript format. Chapter 2 is published in proceedings of the 2011 Colombian conference of chemical engineering. Chapter 3 has been submitted to the journal Industrial & Engineering Chemistry Research, and is under review. Chapter 4 is under preparation to be submitted to an international journal.The principal aspects of methodology for developing of analysis toolsfor homogeneous and heterogeneous systems are presented right after.
1.4.1 Analysis of homogeneous azeotropic and extractive distillation
In chapters 2 and 3 design tools will be developed for analysis and conceptual design of single and double-feed homogeneous distillation columns. In both configurationsthe necessary analysis and design parameters to be calculated are detailed below:
Introduction 7
Topological thermodynamic characterization
Computation of distillation profiles at infinite an finite reflux
Calculation of minimum energy and pinch point branches
Determination of design parameters for distillation columns at finite reflux Although the results proposed seem similar for single and double-feed columns, it is important to mention that there is agreatdifference each other because for chapter 2 issues,there are accurate methodologies reported in literature which provide reliable results; therefore, the goal is to improve the application of mathematical tools forone of the calculation algorithms proposed in literature. As for double-feed columns, the objective is to develop a methodology based on pinch concept for both: evaluating process feasibility, and calculating the design parameters and minimum energy. Also, using the isovolatility lines a fast and simple methodology will be described in order to carry out the entrainer screening. The previous calculations allow to know the limitations imposed by thermodynamic to the separation process. Also, it is possible to determine the distillation regions and boundaries which arevery important for the synthesis of separation sequences. Although there is a lot of information about this topic, the possibility of developing new conceptual tools in order to make more efficient the calculation algorithms, especially at finite reflux condition, becomes an interesting topic for trying to understand more thoroughly the conceptual design of azeotropichomogeneous columns.
1.4.2 Analysis of azeotropic heterogeneous distillation
Taking into account methods developed for homogeneous distillation, tools for designing heterogeneous columns (using shortcut methods) will be developed. In this case the main condition to be determined is the process feasibility; also, design parameters mentioned in section 1.4.1 will be taken into account. The difference with homogeneous conceptual design methods is the complexity of description of phase equilibrium when two liquid phases are in equilibrium with a vapor one. For this reason,it is necessary to use different algorithms to calculate phase equilibrium and to detect partial miscibility. Finally, it is important to mention that just a specific kind of heteregeneousdistillation column will be studied. Based on previous researches and papers (Pham et al., 1989;Ryan and Doherty, 1989;Taylor, 2007), it is possible to conclude, forthe most of heterogeneous distillation systems,thehigher efficient process is one where the only heterogeneous stages are condenser and decanter. Therefore, whole distillation column will operate in homogeneous region. This type of operation requires knowing in detailed the thermodynamic behavior of mixtures, since some parameters need to be carefully chosen in order to achieve this kind of operation. Conceptual design method will be developed for this operation policy. Developing methods require the use of mathematical tools that play an important role in this work; most of the algorithms developed use continuation methods due to they are robust methods for solving nonlinear systems of equations. In addition, Matlab software will be used for programming the shortcut methods.


2. Analysis of separation possibilities in homogeneous azeotropic distillation columns operating at finite reflux
1
Azeotropic distillation presents special characteristics as distillation boundaries, and in some systems maximum separation is not attained at infinite reflux. This chapter presents a methodology to determine the separation possibilities and the product composition regions for homogeneous mixtures with distillation boundaries originated by the azeotropes presence. The main concepts applied are: reversible distillation (Koehler et al., 1991), distillation boundaries, and the geometry of profiles distillation at finite reflux. Three systems of industrial and academic importance were studied (acetone-chloroform-benzene, acetone-chloroform-methanol and acetone-chloroform-water) and two contributions were generated: numerical tools based on homotopy continuation methods in order to trace out both pinch point curves and Pitchfork boundaries (Davydyan et al., 1997), new perspectives about the synthesis of distillation sequences oriented by the knowledge of the geometry of the distillation curves at finite reflux.
2.1 Previous work and scope
Design task of homogeneous azeotropic distillation columns has been studied by researchers as Doherty and coworkers whom in the 80’s decade presented a simplified method (Van Dongen and Doherty, 1985) which describe the composition profiles of both sections for columns with single-feed and two products streams by means of the numerical integration of Taylor series expansion of mass balances. This method called as boundary value (BVM) defines the process feasibility under specific conditions of feed, purity, and reflux for either condenser or reboiler. Later, Fidkowski et al. (1991) presented a strategy supported in continuation methods in order to trace out the profiles of reversible distillation and determine minimum reflux ratio in single feed columns using a modification of the zero volume criteria (Julka and Doherty, 1990). Castillo et al. (1998) published a design method for distillation single feed columns, which uses the pinch curves and total reflux profiles, this procedure could be understood as a generalization of the boundary value method (Van Dongen and Doherty, 1985) since it determines the column operation region and the process feasibility. This region is known as the operation leaf whose limits correspond to the pinch and residue curves. When both curves –pinch ones and infinite reflux ones–begin and end in the same points, the column
1 Chapter presented in the Colombian Conference of Chemical Engineering, Barrancabermeja,
Colombia, (Estupiñán et al., 2011).

10 Tools for analysis of extractive and azeotropic distillation
operation leaf is closed; but when both curves begin or end in different points of the simplex of compositions the operation leaf is open. This last kind of operation leaf has received great attention because of its design implications. Castillo et al. (1998) demonstrated that, for some operational conditions, it is possible to cross the distillation boundaries (separatrix) when the separation process operates at finite reflux and the operation leaf is open, whereas if the operation leaf is closed it is impossible to cross the separatrix. Davydyan et al.(1997) demonstrated mathematically that there is another distillation boundary in the convex side of a total reflux separatrix; this boundary defines composition regions that can cross the distillation boundary. This region was strictly defined by those authors, and its implications and properties are widely described by Krolikowski(2006) who called this boundary as Pitchfork, because of the type of bifurcation that it presents. There are two different ways to propose and to solve the task of design. Onthe one hand, the designer is interested in determining the feed composition region that allows obtaining products under certain purity specifications; in this case the use of operation leaves generates the final solution to this problem. On the other hand, the designer has a specific feed stream composition and wants to define the product composition region. This region is called ―bow-tie‖ and was described by Van Dongen and Doherty (1985) through a parametric analysis and, later, by Wahnschafft et al. (1992) through the composition diagrams geometry. This chapter explains, in detail, the feasibility analysis employing operation leaves and, with less detail, the determination of product composition region. As well as the tasks of design, minimum energy calculation has been one of the most difficult problems to solve in distillation analysis. This calculation has been developed widely for sharp separations, namely, to obtain distillate product without the most volatile component present in the bottom product (or with its composition close to zero); or vice versa: the bottom product without the less volatile component present in distillate. The feature of sharp separations has supported the formulation of methods for the calculation of minimum reflux as the zero volume method(Julka and Doherty, 1990), the angle minimization criterion(Koehler et al., 1991), the eigenvalues method(Poellmann et al., 1994)and so on. These methods have a common feature: they are limited in their applications, some ones are exact for ideal mixtures and approximated for azeotropic mixtures, but they have implicit the sharp separation specification. The eigenvalues method works even for non-sharp separations but it is limited by the number of components (≤4). Danilov et al. (2007) developed a method based on the geometrical distillation theory that overcomes the problems of the previous methods; it allows calculating the minimum energy for any type of separation and number of components. Accordingly, in this work minimum energy was determined using the angle minimization criteria (Koehler et al., 1991) because it is a robust method and its implementation is easier than the other ones. Through the pinch equation deformation and the application of continuation methods, reversible distillation profiles were calculated for determining operation leaves and subsequently to find out feasible designs and the implications about the presence of open operation leaves, and its influence in the synthesis of separation sequences at finite reflux. Furthermore, the product composition region for one of the case study systems was determined.

Homogeneous azeotropic columns at finite reflux 11
2.2 Distillation column model
The column model used in this work is based on the model proposed by Van Dongen and Doherty (1985) in which some assumptions were made: 1) saturated liquid feed, 2) constant molar flow rates for liquid in each section of the column –rectifying and stripping– 3) constant molar vapor flow rate throughout the whole column, and 4) 100% efficient or theoretical plates. A schematic diagram of the distillation column is depicted in Figure 2-1.
BxB,
n
m
Stripping Section
Rectifying Section
2
1
DyD,1Ny
1my
my
mx
1mx
V TL
ny 1nx
VBL
By
1N
F
Fx
1nynx
TL
2xV
Figure 2-1: Schematic representation of a single-feed column.
In analysis and design of distillation processes, it is common to make use of the following simplifying assumptions: (1) constant molar flow rates of liquid in both rectifying and stripping sections of the column, (2) constant molar vapor flow rate throughout the column, (3) saturated liquid feed, and (4) 100% efficient, or theoretical, plates. We recognize this design approach as the constant molar overflow model (CMO) in which the enthalpy balances can be discarded. It is known that the enthalpy of mixing for nonideal mixtures can deviate considerably from zero, and models that do include the enthalpy balances are more accurate than the constant molar overflow model. However, in general the more complete model frequently yields results that are qualitatively similar to those obtained from the simple model. The constant molar overflow (CMO) assumption allows the material and energy balances to be decoupled, thereby permitting the composition profiles for the distillation column to be calculated using only the material balance equations (Julka and Doherty, 1990). It is

12 Tools for analysis of extractive and azeotropic distillation
important to mention that, though the model is simplified, it maintain all the important qualitative features of the distillation process. The differential equations for the stripping and rectifying sections are described below, whereas the column model equations are derived completely inVan Dongen and Doherty (1985).
(2-1)
(2-2)
where and are molar fractions in liquid and vapor phases for component . and are the reflux and reboil ratios, is a continuous plate number, and index are related to
bottom and distillate product. The reboil ratio ( ) can be obtained from mass balance column equations:
(2-3)
(2-4)
One of the main advantages of this model is that all the equations are described in terms of molar fractions and reflux or reboil ratio; therefore, it is not necessary to specify flow rates. According to the column model, for calculating distillation profiles using equations (2-1) and (2-2) it is required to specify, prior to the calculation, composition of one product either bottom or distillate, the reflux ratio, the fraction of lightest component in bottom or heaviest in distillate, and the feed composition. The calculated distillation profiles are useful for determining the process feasibility when all the specifications are defined. A distillation design is feasible when the stripping and rectifying profiles are intersected. Levy et al. (1985) proved that minimum reflux condition is achieved if one of the profiles just ends where it reaches (intersect) the other profile. Although the minimum reflux condition is impossible in practice because the number of stages become infinite, this condition allows determining the minimum requirements for the process feasibility. By integration of differential equations (2-1) and (2-2) a curve for each column section is generated, end points of the curve correspond to zero values of (2-1) and (2-2), these points are known as pinch points or constant composition points. At infinite reflux mode, pinch points correspond to compositions of azeotropes or pure component. On the other hand, at finite reflux, operation pinch points can be any one inside the simplex of composition. For reaching a pinch point, in a real process, infinite number of plates would be required. The importance of these points in the conceptual design will be demonstrated, in detail, in section 2.3.2.
Homogeneous azeotropic columns at finite reflux 13
2.3 Estimation of feasible designs for distillation columns
Distillation columns design includes a set of steps that in general way can be divided in two stages: 1) Determination of both feasibility and design parameters by means of shortcut methods, and 2) Evaluation of the obtained design through the rigorous simulation (equilibrium or non-equilibrium models) using either commercial simulators or mathematical programming. The first design stageconsiders two analyses; the first one is a searching for feasible distillation designs, and after that, a calculation of minimum energy conditions is developed. It is known that commercial simulators present limitations regarding conceptual design parameters such as minimum reflux, possible splits and minimum number of trays (Petlyuk et al., 2011). For example, employing a simulator it is difficult to determine which components will be removed in each product stream when an azeotropic or extractive distillation is performed; this case presents complicated issues related to the entrainer (solvent), their molecular interactions with the original components, and the no ideality of the system that prevents to anticipate possible separation sequences. Therefore, the only one solution for this problem, using commercial software, is to perform exhaustive simulations until to find suitable parameters for a specific design, this procedure is commonly called as trial and error. Accordingly, it is necessary to establish good design procedures that allow working out the problem concerning the process feasibility, minimum energy and design parameters. The method illustrated in this chapter tries to be general, robust and more efficient than methods published in literature for most of the homogeneous separation cases. Process feasibility and design parameters are obtained as results of method implementation.
2.3.1 Continuation methods
Continuation methods have been used widely in chemical engineering, for example in the analysis of chemical reactions and reactors (Seydel, 2010), distillation column calculations (Vickery and Taylor, 1986;Wayburn and Seader, 1987), material stability (Bausa and Marquardt, 2000;Sun and Seider, 1995), reversible distillation(Sánchez, 2011), and isovolatility curves calculation (Sánchez et al., 2010). Predictor-Corrector continuation methods were chosen for this work because of their past success in similar applications (Seydel, 2010). Continuation methods are used to solve a system of nonlinear algebraic equations as:
(2-5)
where is an n-dimensional vector. The solution of (2-5) results in a series of curves with as an independent parameter, this parameter can be either a natural variable of the
system or an artificial one. Both alternatives have advantages and disadvantages; the selection of an artificial variable requires the addition of a new equation to the system, whereas the use of a natural parameter has more physical significance although at the expense of potential problems at turning points. Hence, it is necessary to apply other classes of parameterization such as arclength(Allgower and Georg, 2003) and pseudo arclength(Keller, 1977) parameterizations. These procedures avoid the singularity that

14 Tools for analysis of extractive and azeotropic distillation
appears at the turning points and permit to trace out the full curve. A detailed analysis on these parameterizations can be found in the works of Keller (1977), Seydel (2010), and Allgower and Georg (2003). The arclength parameterization was used in this work as explained in detail by Sanchez et al. (2010) and will only be briefly introduced here. The transpose vector, , groups the
parameter and the variables into a single vector:
(2-6)
The new system of equations using the arclength ( ) parameterization is:
(2-7) Differentiation of equation (2-7) gives:
(2-8)
Allgower and Georg (2003) showed that the tangent vector to the parametric curve has a norm equal to 1:
(2-9)
Equations (2-8) and (2-9) can be combined and expressed in matrix form giving:
(2-10)
The solution of equation (2-10) with the initial condition is the main goal of continuation methods. Many different numerical methods can be used to solve this system of equations. In this work the Euler method was used as the predictor with Newton’s Method as the corrector. For calculating the prediction step it is necessary to first calculate the tangent vector for the parametric curve. In our case, a Jacobian decomposition using the QR factorization with the Householder algorithm was applied (Kincaid and Cheney, 2009).
(2-11)
where is an mxm matrix and is an mxn upper triangular matrix. The last column of
is the tangent vector satisfying the following conditions:
(2-12)
Therefore, the tangent vector is given by:

Homogeneous azeotropic columns at finite reflux 15
(2-13)
After the tangent vector is calculated, it is possible to perform the prediction step using the Euler method. For correcting the predictor values, is linearized and Newton’s Method is applied as follows:
(2-14)
The solution of equation (2-14) can be obtained using least squares and using the QR factorization. Substituting equation (2-11) into equation (2-14) gives:
(2-15)
If the last row of is eliminated to give a new matrix , the solution of equation (2-15) becomes,
(2-16) Rearranging Equation (2-16)for ,
(2-17)
Finally can be obtained,
(2-18)
The value obtained in the correction step is a real point on the curve and becomes the new initial value for the next prediction step.
2.3.2 Calculation of reversible distillation profiles (pinch point curves) using a new methodology.
Determination of feasible designs from the operation leaves involves the calculation of reversible distillation profiles. Pinch points make up the line of infinite stages that can be interpreted as the profiles of liquid compositions associated with a distillate and bottom product, under some theoretical conditions as infinitesimal changes in molar composition, infinite trays number, negligible pressure drop, and continuously distributed energy supply or withdrawal (Poellmann and Blass, 1994). Despite reversible distillation profiles are only theoretical and have no direct practical application, they are very important for the following reasons: 1) they show the real direction process in order to achieve an economic design, 2) the analysis under this concept is an important stage in the develop of a general theory about the multicomponent azeotropic distillation (Petlyuk, 2004). During the last decades, different methods for calculating reversible distillation profiles have been developed. Wahnschafft et al. (1992) presented a graphic method based on

16 Tools for analysis of extractive and azeotropic distillation
the geometry of the residue curves, this method provides good results, but because of its graphical nature, the computer implementation is tedious and the execution speed is low. Castillo et al. (1998) stated the concept of operation leaf, but their calculation methodology for pinch curves is based on the method developed by Wahnschafft et al. (1992). Calculation of pinch points including the reversibility constraint in the mass balances for both column sections and using a continuation method was proposed by Fidkowski et al. (1991). It is important to point out that mass balances have implicit the constant molar overflow (CMO) condition. A pinch occurs when there is no change in composition for successive stages of a column section. The pinch condition and both rectifying and stripping section equations modified with the reversibility constraints are:
(2-19)
(2-20)
(2-21)
Fidkowski et al. (1991) determined the reversible distillation profiles using a continuation method based on pseudo arclength and including the corresponding map section equations, the arclength equation and the continuation parameter. In this work the profiles were calculated using an explicit arclength continuation method (Allgower and Georg, 2003), using the QR factorization in order to determine the tangent vector and taking as equations the corresponding distillation map and the phase equilibrium equations; therefore, the system of equations is larger but avoids the recurrent calculation of equilibrium at each point. Like an example, the set of equations for the stripping section is presented:
(2-22)
(2-23)
(2-24)
where is the number of component. From equations (2-19) to (2-24) it is possible to form the vectors that represent the pinch points of stripping section. Equation (2-22) represents the stripping section map at the pinch condition; equation (2-23) represents the phase equilibrium relationships, whereas equation (2-24) is the molar fraction constraint. The group of equations and unknowns can be represented in terms of a parametric curve,
taking as parameter the reboil ratio ( ), as follows:
(2-25)
(2-26)

Homogeneous azeotropic columns at finite reflux 17
(2-27)
As a result, for a ternary system it is necessary to solve simultaneously a system of 7 equations. The parametric curves that satisfy (2-25) correspond to the pinch point trajectories associated with a specific column section.
2.3.3 Construction of operation leaves
The solution of the equations (2-22) to (2-24) by a continuation method generates as a result the reversible distillation curve associated to the products. Besides the pinch points curve, it is necessary to calculate a distillation or residue line for completing the operation leaf. On this matter Castillo et al. (1998) emphasize on the differences that exist between operation leaves using residue or distillation lines, and they demonstrate that selection of curve depends on the type of column to be analyzed. For packed columns residue curves must be used, whereas for plate columns, distillation lines are the best option. For qualitative and geometrical purposes the use of either residue curves or distillation ones is not an issue that affect the conceptual analysis. In this work residue curves were considered, these curves are represented by the equation:
(2-28)
where ( ) is the dimensionless time. Integration of equation (2-28) produces a residue curve, which end points are both bottom or distillate compositions. Depending on system topology, residue curves for each column section will end in a fixed point either azeotrope or pure component. The operation leaf delimits all possible operation profiles after specification of feed, and distillate and bottom products. Each column section has one operation leaf that should overlap the other section leaf for the design to be feasible (Castillo et al., 1998). Therefore, to construct an operation leaf is necessary to specify one product either bottoms or distillate, and feed composition. After that, reversible distillation trajectory could be calculated and the operation curve at infinite reflux is traced out, starting at the specified product. For a feasible design is not only important that the leaves overlap, the column mass balances should be accomplished as well. Figure 2-2 shows the rectifying and stripping operation leaves for the acetone-methanol-water mixture. For the defined compositions, the leaves do not overlap; thus, there is not a feasible design.

18 Tools for analysis of extractive and azeotropic distillation
Figure 2-2: Operation leaves for acetone-water-methanol system. Operation leaves depicted in Figure 2-2 have another feature, for each product, residue and pinch point curves start and end at the same points, inside the simplex composition. Operation leaves with this feature are called closed operation leaf. This class of operation leaf does not allow obtaining products in different distillation regions since there is only one branch of pinch points. The other class of operation leaf, open operation leaf, is very useful, especially in systems with saddle azeotropes because of it allows obtaining products in different distillation regions. For systems with this behavior, there are two branches of pinch points that are determined for the reflux ratio; one branch corresponds to lower reflux values, whereas the other one corresponds to higher refluxvalues. Figure 2-3 depicts the pinch point curves for a specific bottom composition in acetone-chloroform-benzene system. According to Figure 2-3 two pinch points branches are formed in the stripping section when the bottom composition is at the convex side of the distillation boundary and close to it. In practice, for these bottom product compositions, depending on reflux ratio, it is possible to obtain a distillate stream in both distillation regions. For instance, lower reflux ratios allow obtaining distillate products close to the acetone vertex whereas for higher reflux ratios the distillate stream will be located in the chloroform vertex. In this case, it is clear that there is a bifurcation of stripping profiles.

Homogeneous azeotropic columns at finite reflux 19
Figure 2-3: Open operation leaves for acetone-chloroform-benzene system. There must be a maximum value of the energy provided to the column, above which the separation is not feasible. If the reflux (or reboil) ratio is too high, the composition profile originating from the product cannot traverse into the distillation region of the feed any more. The composition profile calculated starting from the hypothetical product composition will always terminate at a stationary point in the wrong simple distillation region if more than the amount of energy is provided which is needed for the composition profile to reach the disjoint branch of the pinch point curve. The existence of this bifurcation on the separation process depends on the geometrical location of the bottom composition. This geometrical location and its boundary will be detailed in section 2.3.4.
2.3.4 Pitchfork boundary
As mentioned in last section, product specifications that generate an open operation leaf allowcarrying out the separation process in two different distillation regions. Castillo et al. (1998) showed that the products located at the convex side of the separatrix and close to this distillation boundary generate open operation leaves. This conclusion, although true, is incomplete because product compositions with this feature are limited in a space inside the simplex composition and the authors did not determine this new region limited by the distillation boundary and the pitchfork boundary. Davydyan et al. (1997) strictly defined in mathematical terms the pitchfork boundary and Krolikowski(2006) described the properties of this region and its implications in the conceptual design. In order to define the pitchfork equation Krolikowski(2006) proposed the next modification to equations (2-20) and (2-21)
20 Tools for analysis of extractive and azeotropic distillation
(2-29)
where for stripping section and for rectifying section. A relation that describes a set of pitchfork solutions was obtained by Davydyan et al. (1997)
(2-30)
where is the unit matrix, is the phase equilibrium derivative, and is the independent parameter that in this case is related to the thermodynamic feed quality. Krolikowski(2006) modify the independent parameter and used the equation:
(2-31)
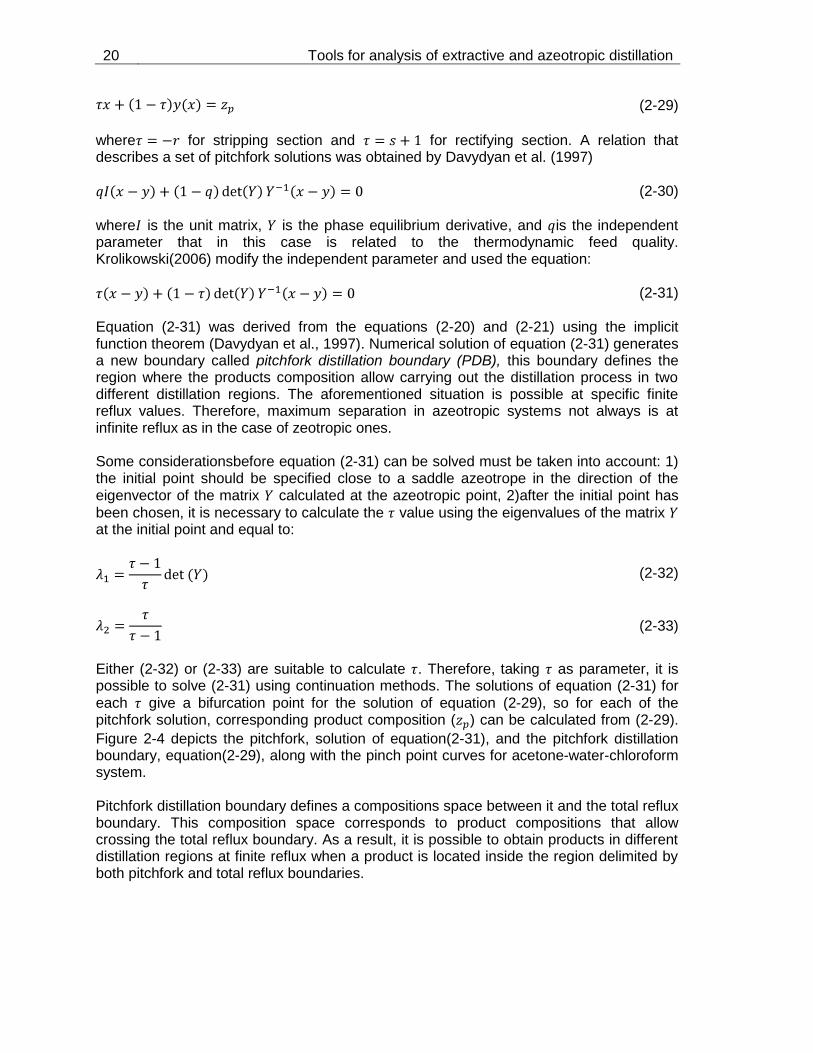
Equation (2-31) was derived from the equations (2-20) and (2-21) using the implicit function theorem (Davydyan et al., 1997). Numerical solution of equation (2-31) generates a new boundary called pitchfork distillation boundary (PDB), this boundary defines the region where the products composition allow carrying out the distillation process in two different distillation regions. The aforementioned situation is possible at specific finite reflux values. Therefore, maximum separation in azeotropic systems not always is at infinite reflux as in the case of zeotropic ones. Some considerationsbefore equation (2-31) can be solved must be taken into account: 1) the initial point should be specified close to a saddle azeotrope in the direction of the eigenvector of the matrix calculated at the azeotropic point, 2)after the initial point has
been chosen, it is necessary to calculate the value using the eigenvalues of the matrix at the initial point and equal to:
(2-32)
(2-33)
Either (2-32) or (2-33) are suitable to calculate . Therefore, taking as parameter, it is possible to solve (2-31) using continuation methods. The solutions of equation (2-31) for
each give a bifurcation point for the solution of equation (2-29), so for each of the pitchfork solution, corresponding product composition ( ) can be calculated from (2-29).
Figure 2-4 depicts the pitchfork, solution of equation(2-31), and the pitchfork distillation boundary, equation(2-29), along with the pinch point curves for acetone-water-chloroform system. Pitchfork distillation boundary defines a compositions space between it and the total reflux boundary. This composition space corresponds to product compositions that allow crossing the total reflux boundary. As a result, it is possible to obtain products in different distillation regions at finite reflux when a product is located inside the region delimited by both pitchfork and total reflux boundaries.

Homogeneous azeotropic columns at finite reflux 21
Figure 2-4:Region of product compositions that allow to cross the distillation boundary. Pitchfork solution (PS), Pitchfork Distillation Boundary (PDB) and Pinch Point Curve (PPC)(Krolikowski, 2006). The proposed algorithms for analysis of feasibility in homogeneous azeotropic distillation are condensed in figure 2-5.

22 Tools for analysis of extractive and azeotropic distillation
Are the operation leaves overlaped?
To specify D,B,F and r
To solve distillation profiles until (2-1) and (2-2) are equal to zero
(Pinch condition)
To trace out D and B pinch curves using (2-24) and (2-25)
To calculate s using equation (2-3)
To calculate D and B residue curves (Eq. 2-27)
THE DESIGN IS FEASIBLE
NO
YES
Are the operation leaves overlaped?
To specify r and F in the concave side
To solve distillation profiles until (2-1) and (2-2) are equal to zero
(Pinch condition)
To trace out D and B pinch curves using (2-25) and (2-26)
To calculate s using equation (2-3)
To calculate D and B residue curves (Eq. 2-28)
Yes
NO
To determine Pitchfork Boundary Using (2-30) and (2-28)
To specify B inside the Pitchfork region
THE DESIGN IS FEASIBLE
To calculate D using equation (2-4)
Figure 2-5:Algorithms for analysis of feasibility in homogeneous azeotropic distillation. Left, system without distillation boundaries.Right, systems with distillation boundaries.
2.3.5 Minimum reflux calculation
Different methods for calculating minimum reflux in single-feed columns have been proposed in literature and they were mentioned in section 2.1. Minimum reflux calculation using reversible distillation model and the pinch point concept was presented by Koehler et al. (1991). Their method known as Angle Minimization Criterion (AMC) uses the pinch point curves for determining the minimum reflux. Although this method does not have
Homogeneous azeotropic columns at finite reflux 23
theoretical foundation because of it is based on empirical concepts, the results obtained are consistent and accurate. Some reviews presented in literature (Bausa et al., 1998;Lucia et al., 2008) stated that the AMC method produces suitable results but it always requires the existence of a feed pinch point; therefore, systems where the feed is not introduced as a boiling liquid the AMC cannot be implemented. The AMC criterion was chose for this work because it uses the reversible distillation concept/profile; thus, it continues with the methodology and concepts applied and explained in this chapter for the conceptual design. The AMC method proposes that the angle formed by feed composition and one pinch point in one out of two column section should be minimal at minimum reflux. Hence, it is necessary to calculate the pinch point curves for both column sections and through the angle formed between the composition vectors (pinch points) for both column sections to determine the minimum angle. When the minimum angle is achieved, the minimum value for the reflux is attained. Equation for determining the angle is the dot product between two pinch points:
(2-34)
where and correspond to pinch composition in the stripping and rectifying section
respectively, and is the feed composition. Although the calculation of the reversible profiles is independent each other, it is necessary that the column mass balances to be satisfied in order to guarantee than the minimum reflux is the real value for a specific design (product and feed compositions fixed). In section 2.4 a minimum reflux calculation with the AMC method will be shown.
2.4 Examples and discussion
To show the application of operation leaves in distillation columns design, three azeotropic ternary mixtures were chosen as case studies. The first one is the acetone-methanol-water mixture that has a minimum boiling azeotrope and no distillation boundaries. The second one is the acetone-chloroform-benzene mixture that presents a saddle azeotrope which induces one distillation boundary; this example has been very studied in literature because of it confirms that, at finite reflux, it is possible to obtain distillation products into different distillation regions. Finally, the mixture acetone-chloroform-methanol is considered, the importance of this system is due to it presents four azeotropes (three binary ones and a ternary) that generates four distillation regions. For all the examples the vapor phase was considered as an ideal one whereas the liquid phase was modeled using Unifac Dortmund (Gmehling et al., 1993), calculations were performed at 1 atm of pressure, and the MatLab software was used for programming.
2.4.1 Acetone-methanol-water
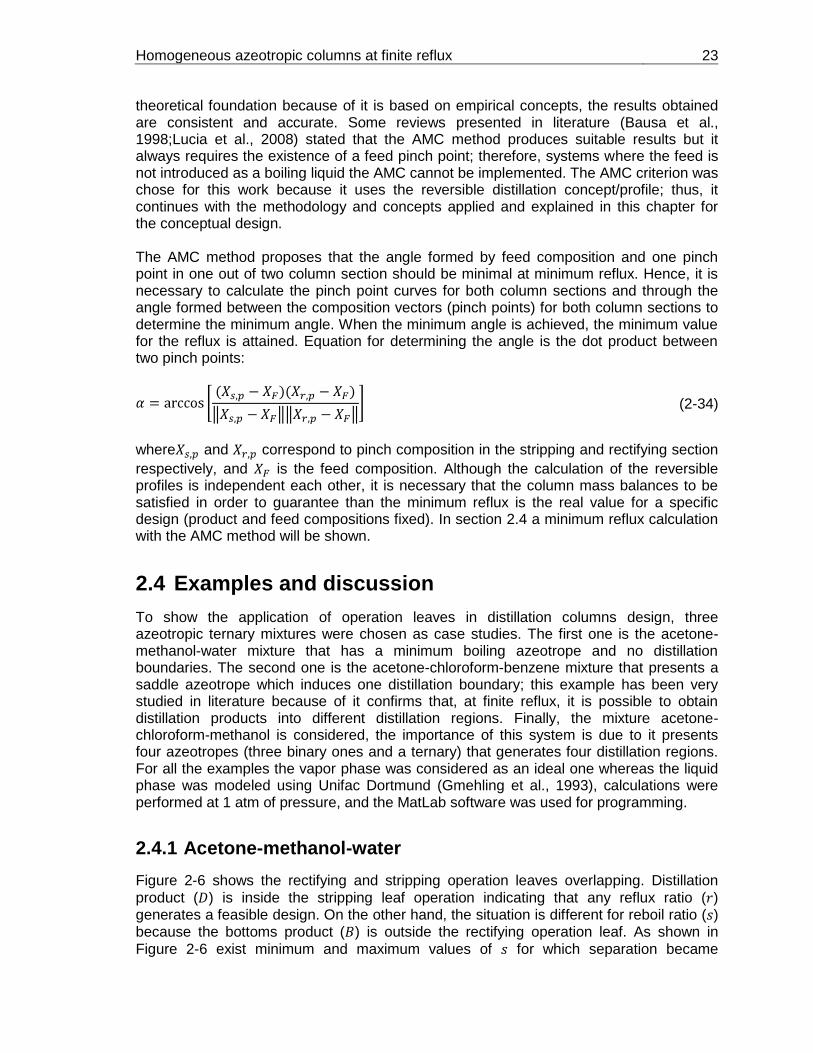
Figure 2-6 shows the rectifying and stripping operation leaves overlapping. Distillation
product ( ) is inside the stripping leaf operation indicating that any reflux ratio ( ) generates a feasible design. On the other hand, the situation is different for reboil ratio ( ) because the bottoms product ( ) is outside the rectifying operation leaf. As shown in
Figure 2-6 exist minimum and maximum values of for which separation became
24 Tools for analysis of extractive and azeotropic distillation
possible. Although this is a minimum reboil ratio ( ), it does not correspond to the ratio of minimum energy; instead of that, thisis the lower limit for a feasible design. Using the
graphic concept to determine the minimum reflux, it was found a value of = 0.92 and = 2.32 as it is shown in figure. From the graph the stripping and rectifying profiles for
= 2 and = 3.62 are also visualized, these profiles cross each other indicating the design is possible, this design requires 30 stages in stripping section and 20 in rectifying. On the other hand, due to acetone-methanol-water system present a minimum boiling azeotrope and it does not present saddle azeotropes; there are not distillation boundaries and the operation leaves will be always closed. It is important to mention that for this example the column was simulated considering a partial condenser.
Figure 2-6: Stripping and rectification operation leaves for acetone-methanol-water system.
2.4.2 Acetone-chloroform-benzene
As shown in Figure 2-7 this system has a binary saddle azeotrope which originates a separation boundary, concluding that at infinite reflux is not possible to separate a mixture of this system in its pure components. However, at finite reflux ratio it is possible to cross the boundary, obtaining a bottom product (B) in the other side of the separatrix, this behaviour allows separating the mixture in its pure components, employing two distillation columns, as was demonstrated by Wahnschafft et al. (1992). From Figure 2-7 it can be seen when bottoms product crosses the boundary and it is located in the convex side and

Homogeneous azeotropic columns at finite reflux 25
close to the separatrix an open operation leaf is created, in which, the trajectory of pinch points and residue curves end in different points inside the compositions space. The open shape of the operation leaf for this system is due to the bifurcation of the stripping section profiles. This bifurcation generates a second branch of pinch points linking the chloroform to the binary azeotrope. Depending on reboil ratio, stripping profiles end in different distillation regions. In the case of Figure 2-7 lower reboil ratios make that the stripping profile crosses the separatrix and ends in the concave side. On the other hand, higher reboil ratios make that the stripping profile ends in the same distillation region of the bottom product. As a result, for the system acetone-chloroform-benzene is more convenient to carry out the process at lower reboil ratios for obtaining products in different distillation regions. Also, this example shows that in systems with separation boundaries the best separation is achieved at finite reflux. Furthermore, the reversible profile in the convex side ends in the saddle azeotrope; therefore, it can be a method for determining, with accuracy, the existence and location of saddle azeotropes in multicomponent systems.
Figure 2-7: Stripping and rectifying operation leaves for acetone-chloroform-benzene system. At this point, it is necessary to mark out the exact region that allows obtaining products in different distillation regions. As was detailed in section 2.3.4, pitchfork boundary delimits a region where this process can happen. Figure 2-8 shows that products in the convex side, close to separatrix, and located between two boundaries (total reflux and pitchfork) allow that a distillation column can operatewith products in two different distillation regions.

26 Tools for analysis of extractive and azeotropic distillation
Figure 2-8: Pitchfork boundary for acetone-chloroform-benzene system.
2.4.3 Acetone-chloroform-methanol
Figure 2-9 shows the structure of the composition space for this system: four thermodynamic boundaries and four distillation regions exist. It is not possible to separate an acetone-chloroform-methanol mixture into its pure components, operating at infinite or finite reflux. Nevertheless, it must be seen that the separation possibilities at finite reflux are wider than at infinite reflux. As an example, Figure 2-9 illustrates a case in which the first branch of pinch points associated with the distillate (D) crosses twice the separatrix; therefore, this distillate can be obtained with feeds in three different regions. Because of the simulated column has a total condenser, the first branch of pinch points does not start with the distillate composition but with the liquid composition in stage 2 (denoted by X2 in Figure 2-9) indicating that the process would only be consider as reversible starting from stage 2 due to in stage 1 the mixture is not at the phase equilibrium condition. In this system, the bifurcation of the profile occurs on the rectifying section; this behaviour depends on the reflux ratio, in this way, reflux allows controlling the region of the obtained products. Figure 2-9 shows that three different bottom products could be obtained in a distillation column for defined feed, due to rectifying profiles end in three different distillation regions. Although separate this system in its pure components requires more than one column, it is possible, using this topological feature, to synthesize a separation system with a lower number of separation units.

Homogeneous azeotropic columns at finite reflux 27
Figure 2-9: Branches of pinch points and rectifying profiles associated with a distillate composition(D) for acetone-chloroform-methanol system.
2.4.4 Implementation and validation in Aspen Plus®
To verify the results obtained through the shortcut method and to demonstrate that it is possible to cross the distillation boundary at finite reflux, a distillation column with the obtained product and feed specifications were implemented in Aspen Plus® using the RadFrac® module and the UNIFAC thermodynamic model. Table 2-1 shows the product compositions used in the simulation. Table 2-1:Feed and product streams specification
Components Feed
(mole Fraction) Distillate
(mole Fraction) Bottom
(mole Fraction)
Acetone 0.38 0.80 0.02
Chloroform 0.24 0.19 0.28
Benzene 0.38 0.01 0.70
The bottom composition is located inside the region bounded by the pitchfork boundary and the distillation boundary. Prior to rigorous simulation using RadFrac® column, the ConSep® distillation column was used to determine some operation parameters and to verify the results obtained inMatlab. Figure 2-10 and Figure 2-11 show the behavior of the stripping profile when the reflux ratio is increased. For a reflux ratio equal to 4.2, it is clear that stripping profile cross the boundary and the proposed design is feasible as is shown in Figure 2-10.
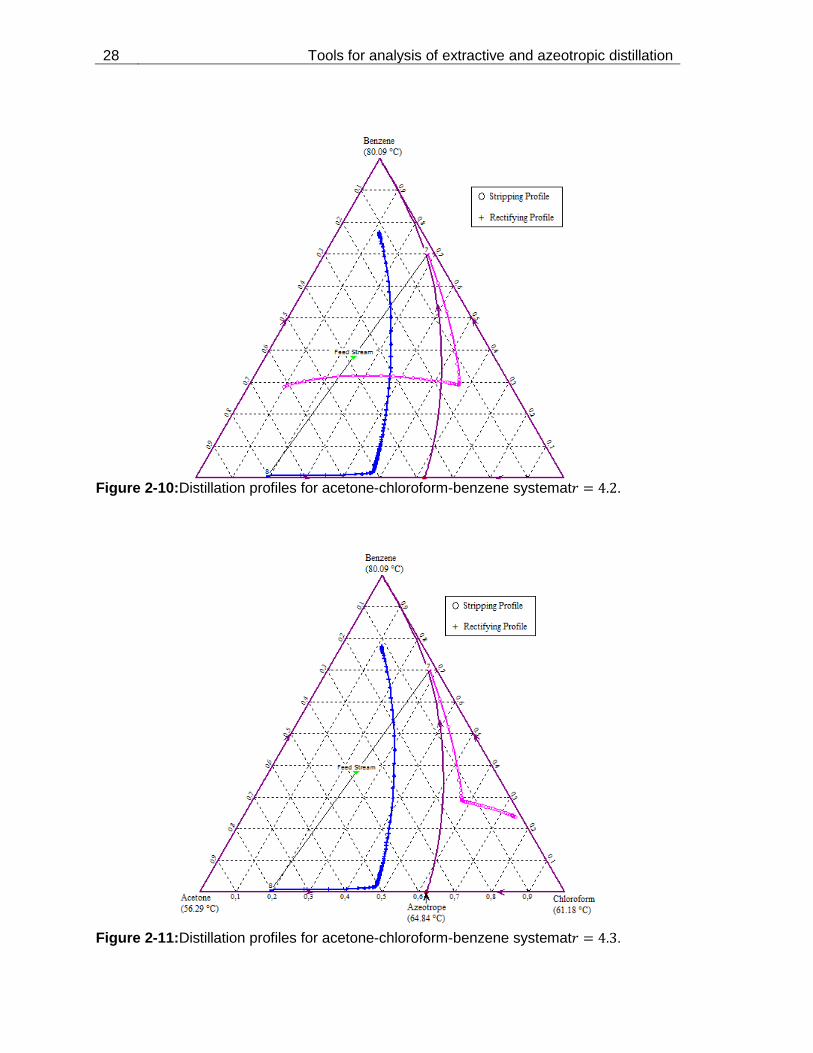
28 Tools for analysis of extractive and azeotropic distillation
Figure 2-10:Distillation profiles for acetone-chloroform-benzene systemat .
Figure 2-11:Distillation profiles for acetone-chloroform-benzene systemat .

Homogeneous azeotropic columns at finite reflux 29
On the other hand, when the reflux ratio is increased up to 4.3 the stripping profile does not cross the boundary and it finish close to the benzene-chloroform edge as is shown in Figure 2-11.These figures and calculations confirm the results obtained inMatlab and validate the methodology proposed throughout the chapter. Finally, a rigorous calculation was carried out using the RadFrac® module and taking the design parameters and streams composition predicted from the conceptual analysis.Figure 2-12 depicts the distillation column along with the streams composition, the number of stages, and reflux ratio. The use of these specifications avoids the trial and error methodology making faster the convergence of the simulation process.
Figure 2-12: Results of rigorous distillation column simulated in Aspen Plus® The results obtained by the rigorous simulation agree with the conceptual design, and the product compositions are equal to values specified in the conceptual design. Composition profiles obtained by the rigorous simulation were plotted in the triangular diagram as is shown in Figure 2-13. The composition profile proves the possibility to obtain products in different distillation regions under specific values of reflux ratio.
2.5 Conclusions
Using continuation methods the pinch point curves were drawn, these profiles associated to the lines at infinite reflux define the operation leaves, which determine the feasibility regions of distillation columns; considering the condition that the operation leaves of both sections must be partially overlapped, a shortcut method to evaluate the viability of the separation process has been consolidate. It was demonstrated the possibility to obtain products into distillation regions at different sides of a separatrix, which is possible operating the distillation column at certain finite values of reflux. In this regard is interesting in later investigations to study the region where these products can be obtained, which is defined by the line that Krolikowski (2006) calls the Pitchfork separatrix.
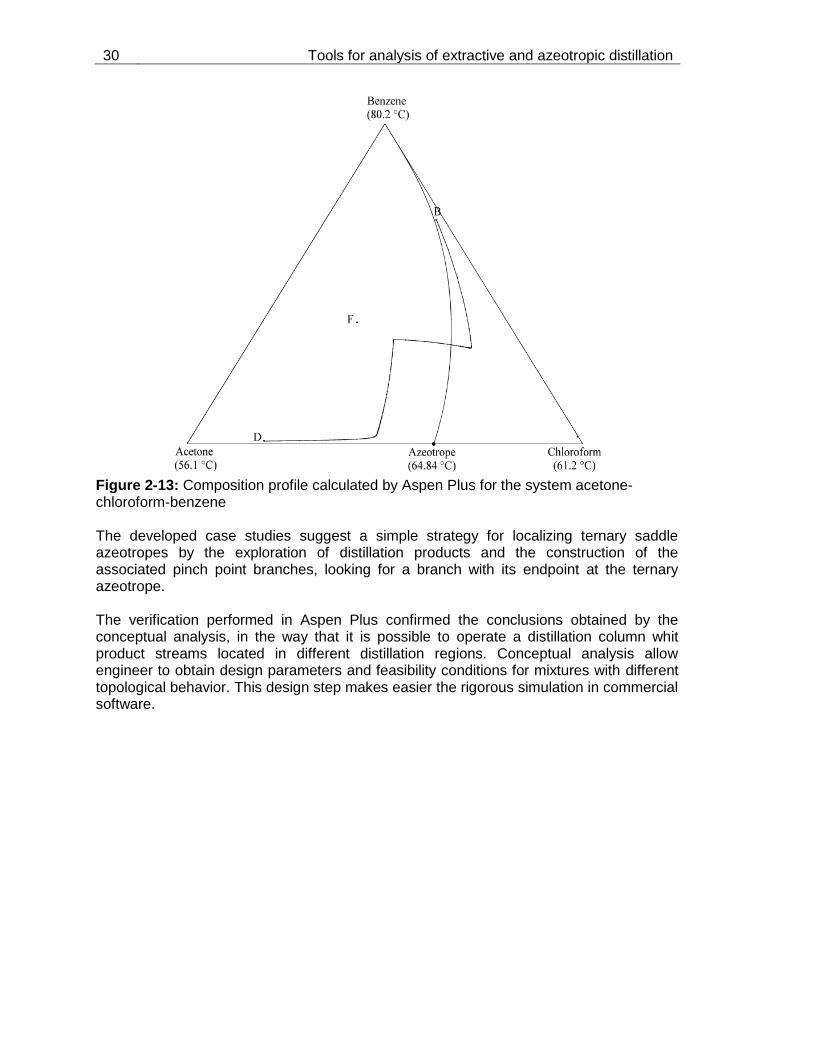
30 Tools for analysis of extractive and azeotropic distillation
Figure 2-13: Composition profile calculated by Aspen Plus for the system acetone-chloroform-benzene The developed case studies suggest a simple strategy for localizing ternary saddle azeotropes by the exploration of distillation products and the construction of the associated pinch point branches, looking for a branch with its endpoint at the ternary azeotrope. The verification performed in Aspen Plus confirmed the conclusions obtained by the conceptual analysis, in the way that it is possible to operate a distillation column whit product streams located in different distillation regions. Conceptual analysis allow engineer to obtain design parameters and feasibility conditions for mixtures with different topological behavior. This design step makes easier the rigorous simulation in commercial software.

3. A simplified conceptual design methodology for double-feed extractive distillation processes
Shortcut methods have an important role in the conceptual design of distillation processes because they rapidly provide constraints for important design parameters such as minimum reflux ratio, number of stages, process feasibility, possible splits, and, specifically for extractive distillation, minimum solvent feed ratio and maximum reflux ratio. In this chapter, a simplified method using reversible distillation models has been applied to the conceptual design of double feed extractive distillation columns. This work uses continuation methods for calculating the curves that determine the feasibility region and all of the resulting design parameters. Combining continuation methods with the column equations yields a simple method for calculating the pinch curves that border the feasibility region. We have found that these extractive distillation pinch curves, in addition to determining the feasibility region, are also useful for calculating an approximate minimum entrainer feed ratio independent of other parameters, as well as accurately pinpointing the minimum and maximum reflux ratios. Applications to example extractive distillation systems allow us to conclude that the method is reliable, fast, and much easier to implement than other methods presented previously in the literature.
3.1 Previous work and scope
The popularity of shortcut design methods for distillation processes stems from their ability to provide preliminary information and constraints on the design parameters for distillation columns. Unfortunately, commercial modeling software is not suitable for both the detailed and conceptual design tasks (Petlyuk et al., 2011). Commercial simulators perform processes evaluations using design parameters supplied by the user (Fidkowski et al., 1991) and as such the design task should be done in combination with efficient shortcut methods capable of providing the necessary design input parameters for each specific process. In the case of simpler single feed distillation columns, shortcut methods are available to determine the minimum number of stages, possible bottom and overhead product compositions, minimum reflux and boilup rates, feasible separation regions, and feed stage location. In the case of extractive distillation with a separate feed of the entrainer (i.e. double feed columns), however, the problem is more difficult since it is necessary to find two additional parameters, namely the upper and lower feed locations as well as the minimum entrainer feed ratio ( ).
Levy and Doherty (1986a) presented an extended Boundary Value Method (BVM) along with a method to calculate the minimum reflux for double feed columns. Their method only applies to sharp separations and it does not predict the minimum entrainer feed ratio

32 Tools for analysis of extractive and azeotropic distillation
( ), although it does provide important ideas about the conceptual design of the
separation sequences. Wahnschafft and Westerberg (1993) presented a generalized method for calculating the product composition region in double feed columns using pinch point curves in order to determine the region where the extractive section must lie for a feasible separation. Their method is suitable for estimating the minimum reflux ratio ( ) and the number of stages ( ) at a fixed entrainer feed rate. The inability to estimate ( ), however, is a major weakness of Wahnschafft and Westerberg’s method.
Laroche et al. (1991) demonstrated that there is a direct connection between the minimum reflux ratio and the isovolatility curve. Unfortunately, rather than calculating
directly, Laroche et al. (1991) graphically traced out the relationship between the
entrainer feed ratio ( ) and . With their method it is necessary to calculate at
each value of , which constitutes a tedious parametric search. Knapp and Doherty (1994) presented a method for determining the minimum entrainer flows for extractive distillation using bifurcation theory. This method is more robust than the previous ones, at the expense of added complexity, using a continuation method in two parameters to determine and . Authors found that these parameters are
located at a pitchfork bifurcation. Bruggemann and Marquardt (2004) applied an extension of the rectification bodies’ method to extractive distillation using a combination of eigenvalues and fixed points theory to estimate and . Although these methods
are robust, they are very complex and difficult to implement. The current work builds on and extends the above methods in order to develop simplified shortcut design techniques specifically for extractive distillation processes with a separate entrainer feed (i.e. double feed columns). A method based on a combination of system topology with continuation methods has been developed in order to estimate the necessary parameters for a feasible process design. The main issues addressed in this work include: the maximum and minimum reflux in extractive distillation, estimating the minimum feed ratio of entrainer that will break the binary azeotrope, the direct connection between fixed and bifurcation points in the middle section with feed ratio, minimum and maximum reflux, and the feasibility region. A variation of the method presented by Levy and Doherty (1986b) is used to calculate the first point of the pinch curve for the middle section, while the concept of isovolatility curves is applied to determine the feasible product compositions and the volatility order. A direct relation between the feasibility region, feed ratio, and isovolatility curves was observed and will be explored in detail.
3.2 Background
3.2.1 Column model
The column model for this work is based primarily on the Boundary Value Method (BVM) for double feed columns (Levy and Doherty, 1986a); with variations taking into account the column model proposed by Knapp and Doherty (1994). In the current model the column equations are approximated by continuous differential equations rather than a set of discrete, stage-wise equations. The location of the lower feed is specified and the middle section trays are counted upward starting from lower feed tray. A partial condenser is used and the feed qualities are taken into account. A conceptual schematic for the column is shown in Figure 3-1.
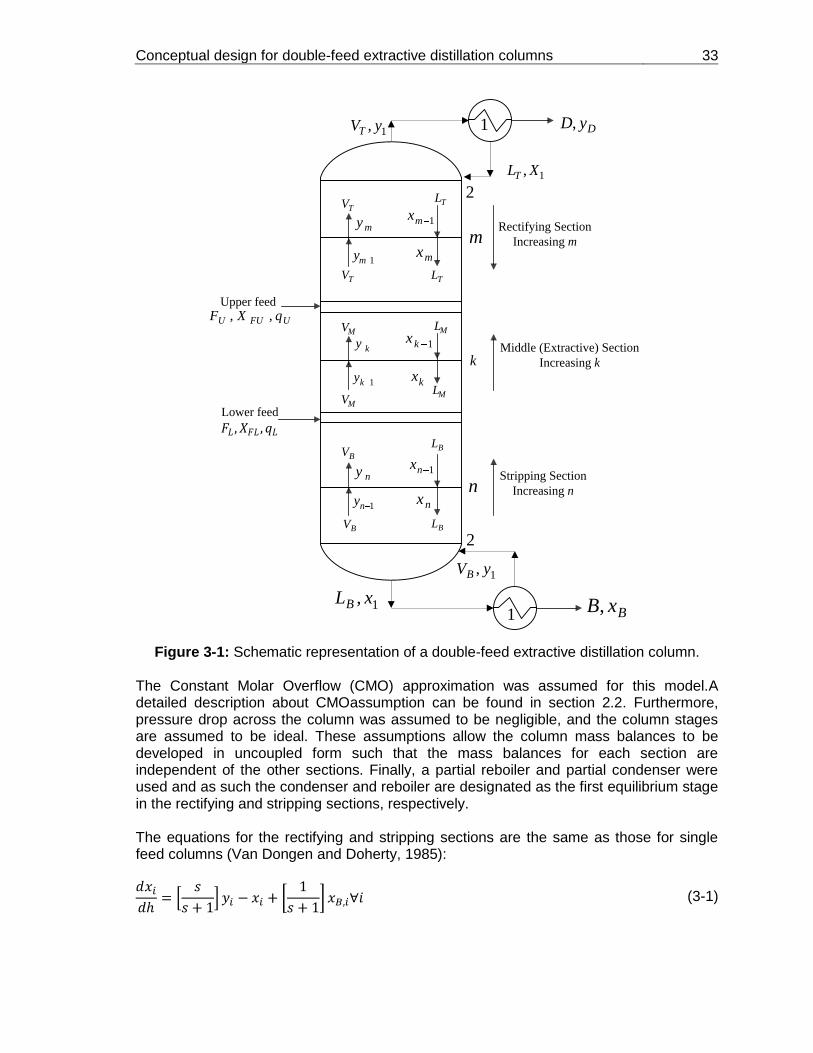
Conceptual design for double-feed extractive distillation columns 33
Upper feed
UFUU qXF ,,
Lower feed
𝐹𝐿 ,𝑋𝐹𝐿 ,𝑞𝐿
DyD,
BxB,
n
k
m
1, XLT
1, yVB
1, xLB
1, yVT
BL
BL
ML
ML
TL
TL
BV
BV
MV
MV
TV
TV
ny
1ny
1ky
ky
my
1my
nx
1nx
1kx
kx
mx
1mx
Stripping Section
Increasing n
Middle (Extractive) Section
Increasing k
Rectifying Section
Increasing m
2
2
1
1
Figure 3-1: Schematic representation of a double-feed extractive distillation column.
The Constant Molar Overflow (CMO) approximation was assumed for this model.A detailed description about CMOassumption can be found in section 2.2. Furthermore, pressure drop across the column was assumed to be negligible, and the column stages are assumed to be ideal. These assumptions allow the column mass balances to be developed in uncoupled form such that the mass balances for each section are independent of the other sections. Finally, a partial reboiler and partial condenser were used and as such the condenser and reboiler are designated as the first equilibrium stage in the rectifying and stripping sections, respectively. The equations for the rectifying and stripping sections are the same as those for single feed columns (Van Dongen and Doherty, 1985):
(3-1)
34 Tools for analysis of extractive and azeotropic distillation
(3-2)
where the reflux and reboil ratios (r and s, respectively) are defined by:
(3-3)
(3-4)
In the current model, the middle section equations were described in terms of the reflux ratio, although they could just as easily be written in terms of the reboil ratio. A mass balance around the entire column gives
(3-5)
with the overall feed rate ( ) defined by:
(3-6)
The feed ratio ( ) is defined in terms of the two feed flow rates:
(3-7)
Defining an overall global feed composition, , in terms of the feed ratio and the individual feed stream compositions gives:
(3-8)
Rearranging the global column mass balance equation (3-5) and combining with equation (3-8) gives the distillate to bottoms ratio:
(3-9)
The overall column mass balance can also be written in terms of the individual feed flowrates, which upon rearrangement gives:
(3-10)
Using a similar development, equation (3-10) can be recast in terms of the upper feed flowrate:
(3-11)
Conceptual design for double-feed extractive distillation columns 35
Equations (3-10) and (3-11) allow the column calculations to be done without defining the flowrates since they are written in terms of feed ratios. A mass balance around the top half of the column, including the upper feed and ending at tray gives:
(3-12)
The internal flows for the column assuming constant molar overflow (CMO) then become (Knapp and Doherty, 1994):
(3-13)
(3-14) where and are the upper and lower feed qualities, respectively. Substituting equations (3-13) and (3-14) into equation (3-12) and rearranging gives:
(3-15)
where = the ratio of upper feed flow to distillate flow. Expanding equation (3-15) in a Taylor series with step size about the known liquid composition and truncating at the first term gives:
(3-16)
The initial condition for the middle section is the composition on the last tray, , of the stripping section:
(3-17) The general equations for the reboil ratio can be obtained by combining the internal flow (equation (3-14)) and the definitions for reflux and reboil ratio given in equations (3-3) and (3-4):
(3-18)
Equation (3-18) is completely general for double feed columns. If the feed ratio, , is zero, then there is only one feed stream to the column and equation (3-18) reduces to the general equation for the reboil ratio in single feed columns as derived by Julka and Doherty (1990)
3.2.2 Reversible distillation model for double feed columns
The reversible distillation model can be used to assess the feasibility of a real process. The reversible distillation profile indicates the direction that the real process must follow (Petlyuk, 2004) because it defines the lower limit of the separation in terms of reflux. The reversible distillation trajectories are paths that depict the column profile at minimum

36 Tools for analysis of extractive and azeotropic distillation
reflux and an infinite number of stages. This problem was studied by Koehler et al. (1991) who formulated a method for calculating the minimum reflux using the reversible distillation trajectories. Fidkowski et al. (1991) presented a model based on continuation methods for tracing out the reversible distillation trajectories assuming CMO, and the resulting curves are called pinch point curves. Wahnschafft et al. (1992) developed a method based on reversible distillation for determining the product composition regions in single feed columns. All the models mentioned in the preceding paragraph were developed for single feed columns. The application of the reversible distillation model for dual feed columns was presented by Wahnschafft and Westerberg (1993) using the mass balances for the middle section. They found that the middle section has two pinch point trajectories defining both a lower and an upper bound for the reflux ratio. Therefore, for a specified design to be feasible it is necessary that the stripping profile ends inside the region limited by these two pinch point curves. Although Wahnschafft and Westerberg (1993) showed the importance of the pinch curves for double feed columns, some analysis was omitted. Wahnschafft and Westerberg’s (1993) method used residue curve analysis for calculating the pinch points, which is a tedious and computationally expensive method. The reversible distillation model and concepts outlined by Wahnschafft and Westerberg (1993) will be used in this work along with a novel, simplified algorithm for calculating the pinch point curves as outlined in section 3.3.1 of this manuscript.
3.3 Conceptual Design Methodology for Double Feed Columns
3.3.1 Calculation of pinch point curves
Continuation methods were used by Fidkowsky et al. (1991), Estupiñán et al. (2011), and Sanchez (2011) for calculating pinch point curves for single feed columns. Fidkwoski et al. (1991) used a pseudo-arclength parameterization whereas Estupiñan et al. (2011) and Sanchez (2011) used an arclength parameterization. These methods, as well as the method applied in the current work, are based on the deformation of the column equations for each section under the constant molar overflow (CMO) assumption. The column model can be consider either as a discrete system (Julka and Doherty, 1990) or in terms of an approximate set of nonlinear ordinary differential equations (Van Dongen and Doherty, 1985), with both approaches yielding the same results. The approach proposed by Fidkowsky et al. (1991) does not include the phaseequilibria in the deformation, yielding a smaller system of equations. However, this approach has two main problems (Sánchez, 2011): 1) the phase equilibrium must be solved on each column stage, and; 2) it is necessary to solve the phase equilibrium problem at least twice in order to calculate the numerical derivatives. These issues were overcome in the current methodology by including the equilibrium equations in the deformation as follows: Middle section column equations:
(3-19)
Conceptual design for double-feed extractive distillation columns 37
Phase equilibrium equations:
(3-20)
Molar fraction summations
(3-21)
Accordingly, with the reflux ratio as the parameter, the set of equations in the parametric curve definition are represented by:
(3-22)
(3-23)
(3-24)
Grouping the parameter and the unknowns in a new vector, :
(3-25)
And parameterizing in the arclength ( ):
(3-26) The solution of this system of equations was carried out using the method outlined in section 2.3.1 An extension of the methods of Fidkowski et al. (1991) and Estupiñan et al. (2011) for single feed columns based on continuation methods and the deformation of the middle section equation was implemented in this work. Unfortunately, by definition continuation methods require at least one point on the pinch curve a priori in order to solve for all other points on the curve, which for double feed columns is significantly more difficult to locate than for the simpler single feed columns. As was already mentioned, the middle section has two pinch point curves representing the upper and lower bound for the reflux ratio, respectively. In the case of the upper reflux pinch curve, the calculation of the first point is straightforward using the middle section equations (3-16) with a high reflux ratio (r→∞). In this form the middle section equation will always end in a pinch point on the upper reflux curve. This methodology is similar to the one presented inEstupiñan et al. (2011) for determining the first pinch point in single feed columns. In the case of the lower reflux pinch curve, the need for an initial point was addressed by recognizing that the lower reflux pinch point curve is a saddle point as long as the upper reflux pinch curve is a node. When the mass balance equation for the middle section is solved using low reflux ratios, the middle section distillation profile suffers a bifurcation depending on the value of the reflux ratio. If the reflux ratio is below the critical value the middle profile will be situated on the heavy-intermediate edge of the ternary diagram. If the reflux ratio is above a critical value the middle profile will be situated on the light-

38 Tools for analysis of extractive and azeotropic distillation
heavy edge of the ternary diagram. It is the latter case which implies feasible designs. The point which generates this bifurcation corresponds to a saddle point and a turning point, and determines the minimum reflux ratio for a set of product specifications and feed ratio. This saddle point is also part of the middle section lower reflux pinch curve, and therefore, its exact location provides an initial seed point for the continuation method. Figure 3-2 illustrates the bifurcation of the middle section profile for the acetone-methanol-water ternary system and demonstrates that this point is indeed a part of the pinch point curve. Unfortunately, integrating the middle section operating equation does not provide the exact location of this saddle point. Two alternative methods were considered for determining the first saddle point on the lower reflux pinch curve. The first approach was to vary the reflux ratio, and calculate the extractive section profile at each value until the derivative given by equation (3-27) approaches zero.
(3-27)
This method is cumbersome and computationally tedious and therefore not desirable. A second more sophisticated method uses bifurcation theory (Levy and Doherty, 1986b) to calculate tangent pinch points in the rectification section of multicomponent systems. Since tangent pinch points are always saddle nodes, the rectifying section may or may not contain any such tangent points (Levy and Doherty, 1986b). However, because the lower reflux pinch curve is formed by saddle points, the presence of a tangent pinch in this region is guaranteed and the use of a modified method for locating these points in the middle section can be used. By definition, equation (3-27) is equal to zero at a pinch point. Also, according to bifurcation theory, for turning points the augmented matrix is non-singular while for pitchfork bifurcations the augmented matrix is singular (Seydel,
2010). As such, the Jacobian matrix ( ) of the first order derivatives will be singular at the bifurcation point and (Levy and Doherty, 1986b). The Jacobian of the middle section equation is given by:
(3-28)
where
(3-29)
So
(3-30)
Using equations (3-27) and (3-30) it is possible to construct a method for locating saddle points. The method generates a system of three equations in three unknowns that can be solved using any numerical method for nonlinear systems. The phase equilibrium
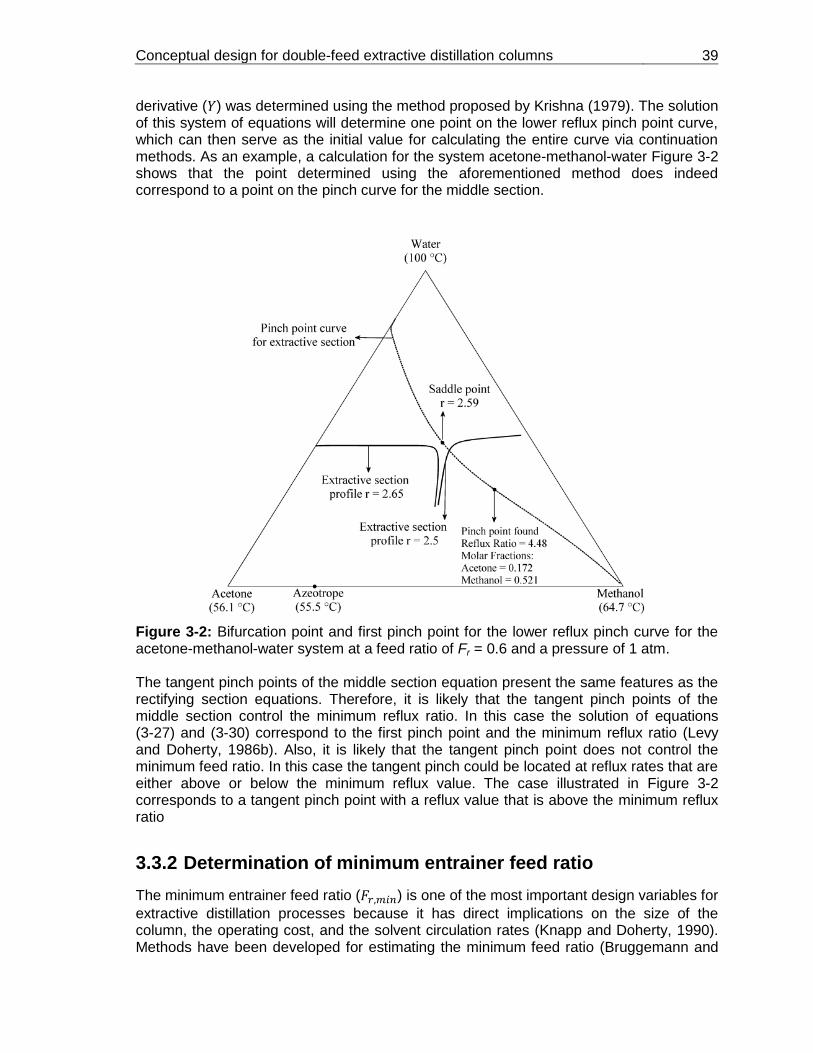
Conceptual design for double-feed extractive distillation columns 39
derivative ( ) was determined using the method proposed by Krishna (1979). The solution of this system of equations will determine one point on the lower reflux pinch point curve, which can then serve as the initial value for calculating the entire curve via continuation methods. As an example, a calculation for the system acetone-methanol-water Figure 3-2 shows that the point determined using the aforementioned method does indeed correspond to a point on the pinch curve for the middle section.
Figure 3-2: Bifurcation point and first pinch point for the lower reflux pinch curve for the acetone-methanol-water system at a feed ratio of Fr = 0.6 and a pressure of 1 atm. The tangent pinch points of the middle section equation present the same features as the rectifying section equations. Therefore, it is likely that the tangent pinch points of the middle section control the minimum reflux ratio. In this case the solution of equations (3-27) and (3-30) correspond to the first pinch point and the minimum reflux ratio (Levy and Doherty, 1986b). Also, it is likely that the tangent pinch point does not control the minimum feed ratio. In this case the tangent pinch could be located at reflux rates that are either above or below the minimum reflux value. The case illustrated in Figure 3-2 corresponds to a tangent pinch point with a reflux value that is above the minimum reflux ratio
3.3.2 Determination of minimum entrainer feed ratio
The minimum entrainer feed ratio ( ) is one of the most important design variables for
extractive distillation processes because it has direct implications on the size of the column, the operating cost, and the solvent circulation rates (Knapp and Doherty, 1990). Methods have been developed for estimating the minimum feed ratio (Bruggemann and

40 Tools for analysis of extractive and azeotropic distillation
Marquardt, 2004;Knapp and Doherty, 1994) although these methods are tedious and complicated. Such complicated methods are unlikely to find widespread use among chemical engineering practitioners and as such, a simpler algorithm for determining ( ) is desirable.
Using the pinch curves for the middle section, it is possible to find an approximate solution for the minimum feed ratio. The pinch point curves for the extractive section of the acetone-methanol-water system at two different feed ratios in the vicinity of the minimum are shown in Figure 3-3. Upon inspection of this figure it is apparent that a bifurcation point exists at a specific feed ratio. Wahnschafft and Westerberg (1993) pointed out that as the feed ratio approaches its minimum value ( ) the region between the upper and
lower pinch curves decreases. In this work it was observed that once the limiting value has been reached or exceeded ( ) the upper and lower reflux pinch curves
merge into a single curve. Consequently, only one pinch point curve will exist, thus indicating that the design is no longer feasible. As Figure 3-3 shows for the system acetone-methanol-water, the minimum feed ratio for this set of column specifications is 0.163. This point corresponds to a pitchfork bifurcation point (Knapp and Doherty, 1994) for the map of the upper reflux pinch curves.
Figure 3-3: Minimum feed ratio for the acetone-methanol-water system at 1atm.
The method proposed by Knapp and Doherty (1994) accurately determines the minimum reflux ratio ( ) and the minimum feed ratio simultaneously, using a very
complex and mathematically intense algorithm. The current manuscript presents an easier, albeit approximate method for determining these parameters using the maximum reflux pinch curve. When the feed ratio is lower than , the maximum reflux pinch
Conceptual design for double-feed extractive distillation columns 41
curve changes direction and will instead move towards the opposite vertex as shown in Figure 3-3. Therefore, it is possible to determine the approximate minimum feed and reflux ratio by varying the feed ratio and determining the value at which the curve ―flips‖. Many attempts were made to devise a simplified algorithm that would allow for the exact determination of this ―flipping‖ point. Unfortunately, however, such an exact calculation is not possible, since as both Knapp and Doherty (1994) and Bruggemann and Marquardt (2004) point out, the problem requires the simultaneous calculation of both parameters ( , ) when the exact values are desired. Therefore, this approximate method
employs a trial and error type search. An effective method for reducing the number of iterations and/or calculations required to locate the approximate minimum feed ratio is to use the isovolatility line as a guide, as outlined in the following section.
3.3.3 Calculating isovolatility curves
Equivolatility curves are defined as the curves along which the relative volatility ( ) of
two components is constant (Laroche et al., 1991). A special type of equivolatility curve is the isovolatility curve, where the relative volatility of two components is equal to one. Isovolatility curves have received attention because of their importance in the conceptual design of extractive distillation processes, in particular for screening solvents. Laroche et al. (1991) demonstrated that these curves define the possible products in an extractive distillation process, and subsequently used them for estimating the minimum reflux and feed ratios. Mathematically, the equivolatility (and in turn isovolatility) curves are defined using phase equilibrium distribution coefficients, , as follows:
(3-31)
Assuming an ideal vapor phase and a non-ideal liquid phase described by an appropriate activity coefficient model, equation (3-31) becomes:
(3-32)
where is the activity coefficient and is the saturation pressure. From equation (3-32)
it is evident that in ideal systems the volatility order of the components (
) is the same throughout the composition diagram because of the absence of both azeotropes and distillation boundaries (Petlyuk, 2004). In the case of azeotropic systems the situation is very different because the volatility order depends on the number of isovolatility curves, which is equivalent to the number of binary azeotropes in the system. The isovolatility curve begins and ends at the binary edges of the ternary diagram, and therefore, divides the composition space into two regions, such that one of the components is the most volatile in one region while the other component is the most volatile in the other region. Also, by definition, each isovolatility curve for two components A and B must contain the azeotrope for these two components (if there is one). For a ternary azeotrope there can be three isovolatility curves, one for each binary system, with all three isovolatility curves connected at the ternary azeotrope.
42 Tools for analysis of extractive and azeotropic distillation
The use of continuation methods for calculating isovolatility curves has only one precedent in the open literature. Sanchez et al. (2010) detailed a procedure for tracing out isovolatility curves using continuation methods. In order to generate these curves it is necessary to transform the phase equilibrium equations, the relative volatility equation, and the molar fraction summations as follows:
(3-33)
(3-34)
(3-35)
(3-36)
The function that comprises the system of equations taking as a parameter the arclength along with the variables vector is:
(3-37)
The vector in equation (3-37) comprises the vector of variables and the natural parameter, which in this case is the molar fraction of the first component:
(3-38)
(3-39)
(3-40) The relative volatility and the pressure are part of the specification problem and are excluded from the vector of variables. In this form, the problem is completely specified and the solution is obtained using the methods outlined in section 2.3.1. The focus of the present work, and that of Laroche et al. (1991) is on homogeneous azeotropic distillation where the addition of an entrainer to an azeotropic mixture is intended to modify the relative volatility of the mixture without forming any new azeotropes or additional liquid phases such that the separation is possible in a two-column sequence. The first column is the extractive column producing one of the azeotropic components as a pure product and the second column is the solvent recovery column producing the second component in pure form. The pure products are removed from the bottom or top of these two columns depending on the class of solvent used as entrainer and the volatility of the entrainer relative to the other components (i.e. is the entrainer the heaviest, lightest, or intermediate of the three components). Laroche et al. (1991) pointed out that the edge where the isovolatility curve ends defines the component which will be recovered as a distillate in the first column. Figure 3-4 shows the isovolatility curve for acetone-water in the acetone-methanol-water system. This isovolatility line begins at the
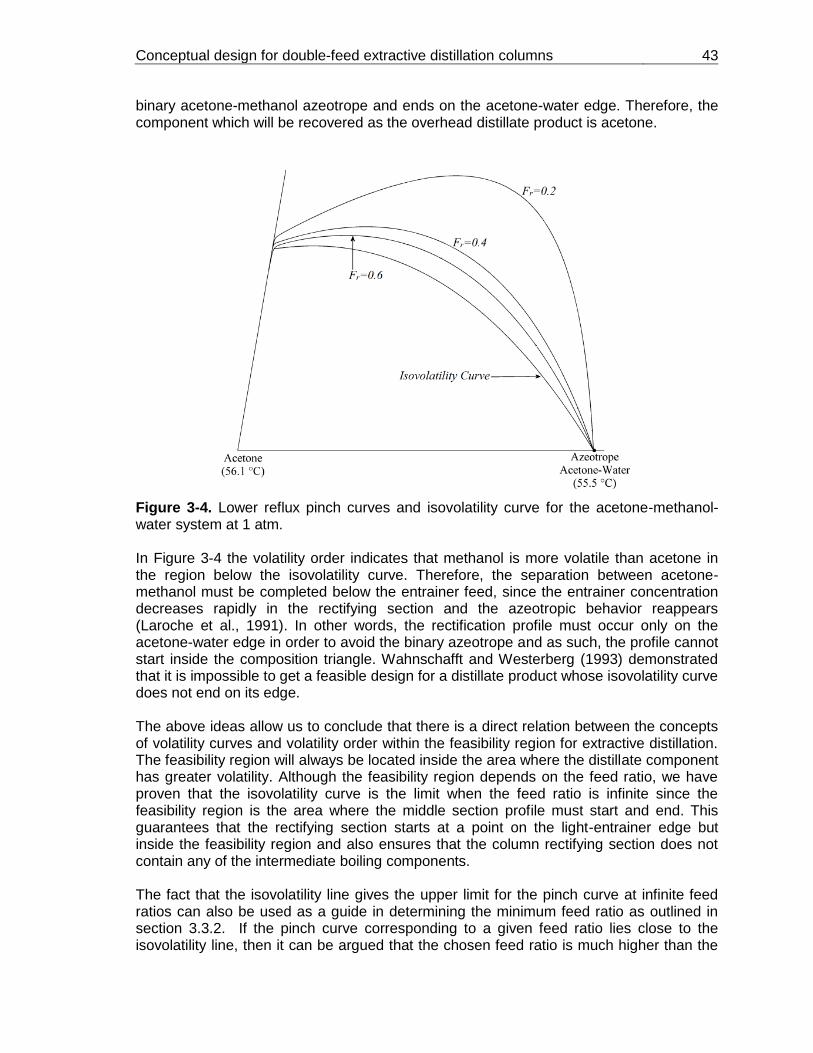
Conceptual design for double-feed extractive distillation columns 43
binary acetone-methanol azeotrope and ends on the acetone-water edge. Therefore, the component which will be recovered as the overhead distillate product is acetone.
Figure 3-4. Lower reflux pinch curves and isovolatility curve for the acetone-methanol-water system at 1 atm. In Figure 3-4 the volatility order indicates that methanol is more volatile than acetone in the region below the isovolatility curve. Therefore, the separation between acetone-methanol must be completed below the entrainer feed, since the entrainer concentration decreases rapidly in the rectifying section and the azeotropic behavior reappears (Laroche et al., 1991). In other words, the rectification profile must occur only on the acetone-water edge in order to avoid the binary azeotrope and as such, the profile cannot start inside the composition triangle. Wahnschafft and Westerberg (1993) demonstrated that it is impossible to get a feasible design for a distillate product whose isovolatility curve does not end on its edge. The above ideas allow us to conclude that there is a direct relation between the concepts of volatility curves and volatility order within the feasibility region for extractive distillation. The feasibility region will always be located inside the area where the distillate component has greater volatility. Although the feasibility region depends on the feed ratio, we have proven that the isovolatility curve is the limit when the feed ratio is infinite since the feasibility region is the area where the middle section profile must start and end. This guarantees that the rectifying section starts at a point on the light-entrainer edge but inside the feasibility region and also ensures that the column rectifying section does not contain any of the intermediate boiling components. The fact that the isovolatility line gives the upper limit for the pinch curve at infinite feed ratios can also be used as a guide in determining the minimum feed ratio as outlined in section 3.3.2. If the pinch curve corresponding to a given feed ratio lies close to the isovolatility line, then it can be argued that the chosen feed ratio is much higher than the
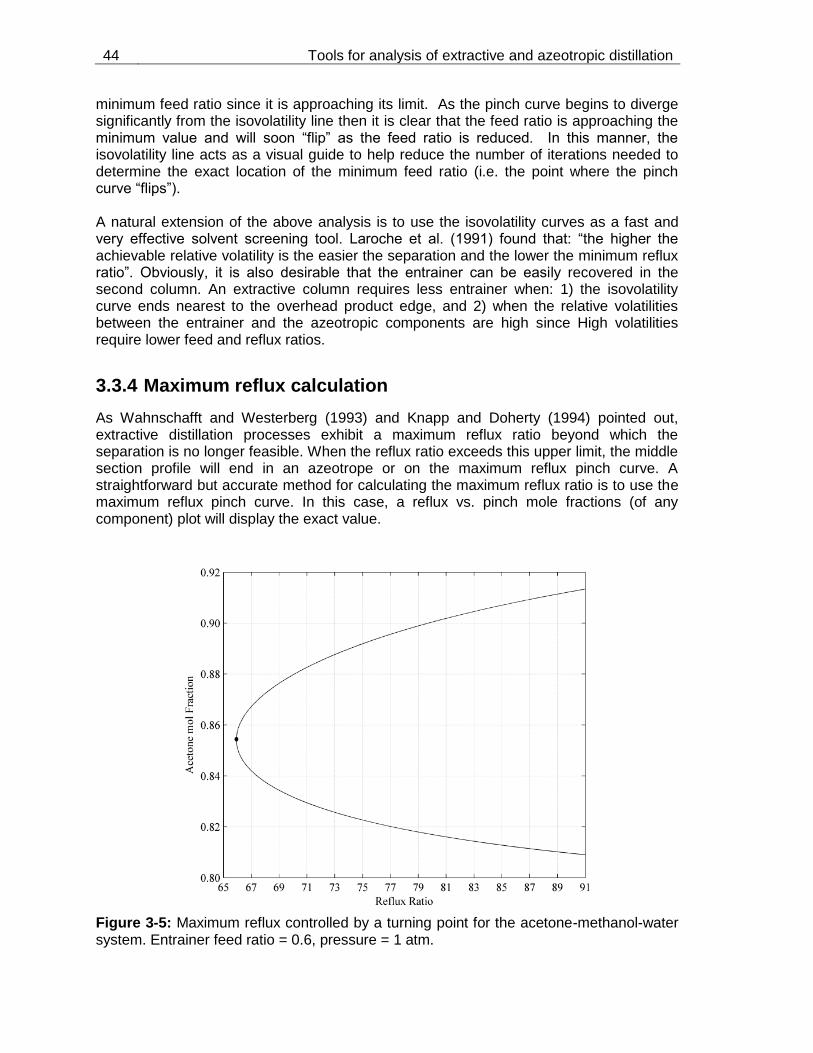
44 Tools for analysis of extractive and azeotropic distillation
minimum feed ratio since it is approaching its limit. As the pinch curve begins to diverge significantly from the isovolatility line then it is clear that the feed ratio is approaching the minimum value and will soon ―flip‖ as the feed ratio is reduced. In this manner, the isovolatility line acts as a visual guide to help reduce the number of iterations needed to determine the exact location of the minimum feed ratio (i.e. the point where the pinch curve ―flips‖). A natural extension of the above analysis is to use the isovolatility curves as a fast and very effective solvent screening tool. Laroche et al. (1991) found that: ―the higher the achievable relative volatility is the easier the separation and the lower the minimum reflux ratio‖. Obviously, it is also desirable that the entrainer can be easily recovered in the second column. An extractive column requires less entrainer when: 1) the isovolatility curve ends nearest to the overhead product edge, and 2) when the relative volatilities between the entrainer and the azeotropic components are high since High volatilities require lower feed and reflux ratios.
3.3.4 Maximum reflux calculation
As Wahnschafft and Westerberg (1993) and Knapp and Doherty (1994) pointed out, extractive distillation processes exhibit a maximum reflux ratio beyond which the separation is no longer feasible. When the reflux ratio exceeds this upper limit, the middle section profile will end in an azeotrope or on the maximum reflux pinch curve. A straightforward but accurate method for calculating the maximum reflux ratio is to use the maximum reflux pinch curve. In this case, a reflux vs. pinch mole fractions (of any component) plot will display the exact value.
Figure 3-5: Maximum reflux controlled by a turning point for the acetone-methanol-water system. Entrainer feed ratio = 0.6, pressure = 1 atm.

Conceptual design for double-feed extractive distillation columns 45
The existence of a maximum reflux ratio for extractive distillation in order to achieve a feasible design is a confirmation that residual curves are not a suitable tool for the conceptual design for this type of separations. The maximum reflux ratio is only a theoretical limit because its value is too high compared with real operational values; because of that, this value is not useful as operational limit.
Two possible scenarios can arise during this analysis. The simplest case is when the maximum reflux corresponds to the intersection between the maximum reflux pinch curve and one of the edges of the ternary composition diagram, using the azeotropic composition as the starting point. In contrast, there are non-ideal mixtures for which the maximum reflux is controlled by a tangent pinch (turning point). Therefore, the maximum reflux is located by any point on the maximum reflux pinch curve. For example, the acetone-methanol-water system shown in Figure 3-5 exhibits this behavior and the pinch point determines the maximum reflux ratio ( ) for this separation. The existence of tangent pinch points on the maximum reflux pinch curve is evident on curves such as Figure 3-5. In contrast, this phenomenon is not evident in the ternary composition diagram. Thus, the determination of the maximum reflux is easier in the reflux vs. molar fraction plot.
3.3.5 Feed quality effects
So far, the analysis has been restricted to the case where both feeds had a quality of one (e.g. saturated liquid). In industry it is more common to use a subcooled entrainer (qu>1). Therefore, some analysis on the effects of feed quality is warranted. Previous analysis (Knapp and Doherty, 1994) has demonstrated that the quality of the upper feed directly affects the maximum reflux ratio. When increases ( ) the maximum reflux ratio
Figure 3-6: Maximum reflux for different entrainer feed qualities, , for the acetone-methanol-water system at a feed ratio of Fr = 0.6 and a system pressure of 1 atm.(--)
, ( ) .
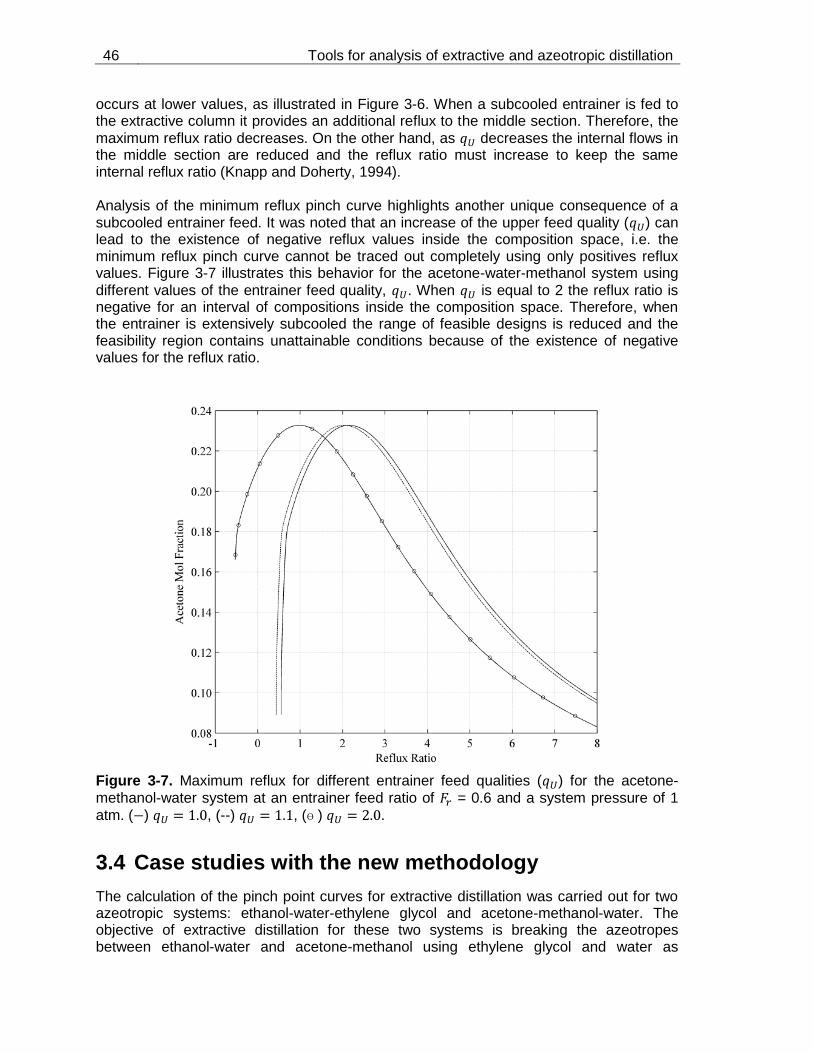
46 Tools for analysis of extractive and azeotropic distillation
occurs at lower values, as illustrated in Figure 3-6. When a subcooled entrainer is fed to the extractive column it provides an additional reflux to the middle section. Therefore, the
maximum reflux ratio decreases. On the other hand, as decreases the internal flows in the middle section are reduced and the reflux ratio must increase to keep the same internal reflux ratio (Knapp and Doherty, 1994). Analysis of the minimum reflux pinch curve highlights another unique consequence of a subcooled entrainer feed. It was noted that an increase of the upper feed quality ( ) can lead to the existence of negative reflux values inside the composition space, i.e. the minimum reflux pinch curve cannot be traced out completely using only positives reflux values. Figure 3-7 illustrates this behavior for the acetone-water-methanol system using
different values of the entrainer feed quality, . When is equal to 2 the reflux ratio is negative for an interval of compositions inside the composition space. Therefore, when the entrainer is extensively subcooled the range of feasible designs is reduced and the feasibility region contains unattainable conditions because of the existence of negative values for the reflux ratio.
Figure 3-7. Maximum reflux for different entrainer feed qualities ( ) for the acetone-
methanol-water system at an entrainer feed ratio of = 0.6 and a system pressure of 1
atm. ( ) , (--) , (ɵ ) .
3.4 Case studies with the new methodology
The calculation of the pinch point curves for extractive distillation was carried out for two azeotropic systems: ethanol-water-ethylene glycol and acetone-methanol-water. The objective of extractive distillation for these two systems is breaking the azeotropes between ethanol-water and acetone-methanol using ethylene glycol and water as

Conceptual design for double-feed extractive distillation columns 47
entrainers, respectively. The design procedure is laid out in a step by step manner yielding a feasible design including its design parameters. The design specifications for both systems are listed in the Table 3-1. It is important to mention that all the calculations herein were carried out at 1 atm of pressure using the Unifac Dortmund model (Gmehling et al., 1993) for the liquid phase, whereas the an ideal vapor phase. Table 3-1: Design Specifications. .
System Feed Mole Fractions Product Mole Fractions
Lower Feed (XFL)
Heavy entrainer (XFU)
Distillate (yD) Bottoms (xB)
Acetone Methanol Water
0.5 0.5 0
0 0 1
0.98 1x10⁻⁴
0.0199
0.00048 0.45964 0.53988
Ethanol Water Ethylene glycol
0.89 0.11 0
0 0 1
0.999 1x10⁻⁶ 9.99x10⁻⁴
4.8x10⁻⁴ 0.11701 0.88241
The starting point in the extractive distillation design procedure is to perform the isovolatility curve calculation because it provides the necessary knowledge for determining which components will be removed as either a bottom or distillate product. Furthermore, the isovolatility curves provide a rapid and easy means for screening through a list of candidate entrainers in order to select the best one without take into account economics. Finally, as was explained previously the isovolatility curve provides an upper limit when the feed ratio tends to infinite values and therefore, it provides a guide for the calculation of the minimum feed ratio.
Figure 3-8: Proximity between the isovolatility curve and the pinch curve for the EtOH-H2O-EG system. In the case of the ethanol-water-ethylene glycol system the isovolatility line and the lower reflux pinch curves are illustrated in Figure 3-8. The isovolatility line ends on the ethanol-ethylene glycol edge, and therefore ethanol is the overhead product in the extractive column. Ethanol is more volatile than water in the region above the isovolatility curve
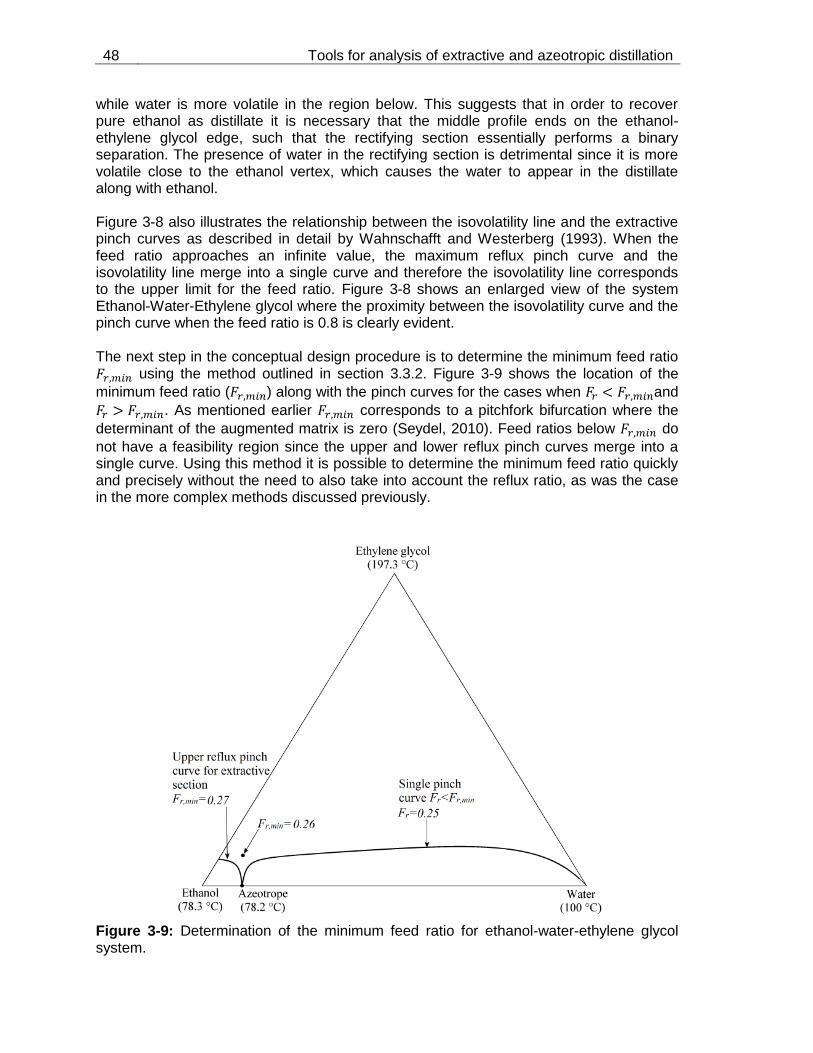
48 Tools for analysis of extractive and azeotropic distillation
while water is more volatile in the region below. This suggests that in order to recover pure ethanol as distillate it is necessary that the middle profile ends on the ethanol-ethylene glycol edge, such that the rectifying section essentially performs a binary separation. The presence of water in the rectifying section is detrimental since it is more volatile close to the ethanol vertex, which causes the water to appear in the distillate along with ethanol. Figure 3-8 also illustrates the relationship between the isovolatility line and the extractive pinch curves as described in detail by Wahnschafft and Westerberg (1993). When the feed ratio approaches an infinite value, the maximum reflux pinch curve and the isovolatility line merge into a single curve and therefore the isovolatility line corresponds to the upper limit for the feed ratio. Figure 3-8 shows an enlarged view of the system Ethanol-Water-Ethylene glycol where the proximity between the isovolatility curve and the pinch curve when the feed ratio is 0.8 is clearly evident. The next step in the conceptual design procedure is to determine the minimum feed ratio
using the method outlined in section 3.3.2. Figure 3-9 shows the location of the
minimum feed ratio ( ) along with the pinch curves for the cases when and
. As mentioned earlier corresponds to a pitchfork bifurcation where the
determinant of the augmented matrix is zero (Seydel, 2010). Feed ratios below do
not have a feasibility region since the upper and lower reflux pinch curves merge into a single curve. Using this method it is possible to determine the minimum feed ratio quickly and precisely without the need to also take into account the reflux ratio, as was the case in the more complex methods discussed previously.
Figure 3-9: Determination of the minimum feed ratio for ethanol-water-ethylene glycol system.

Conceptual design for double-feed extractive distillation columns 49
Now that the minimum feed ratio is known, it is necessary to specify a feed ratio for the column operation. Unfortunately, there are not heuristic rules for determining the feed ratio as a multiple of the minimum such as can be found for the reflux ratio since many variables are affected. Therefore, it is instructive to probe the behavior of the feasibility region with changes in the feed ratio. The impact of decreasing the feed ratio (i.e. adding less entrainer to the column) is to narrow the feasibility region as illustrated in the Figure 3-10. As such, a reduction in the amount of entrainer comes at the expense of a reduced range of feasible column designs and/or operating conditions. A trade off will also exist between the amount of solvent and the column height since low entrainer addition rates result in a greater column height and vice versa. Managing these tradeoffs becomes part of the optimization process and is beyond the scope of shortcut methods. Shortcut methods are intended to provide a feasibility evaluation for a specific process, to provide the minimum conditions for the correct operation, and to provide input parameters and constraints for rigorous simulations.
Figure 3-10: Comparison of the upper pinch curves with different feed ratios for the ethanol-water-ethylene glycol system Based on previous experience (Knapp and Doherty, 1994) one feed ratio for each system was chosen for finishing the conceptual design and the values are reported in the Table 3-1. Using these feed ratios the pinch point curves for the middle section were generated. The reflux pinch curves were generated using the methods described in section 3.3.1. The region bound by the two pinch point curves defines the feasibility region. A feasible design requires that the stripping section composition profile end inside the feasibility region. Note that both pinch point curves for the middle section are independent of the reflux ratio, reboil ratio, and the feed tray location since they only depend on the feed ratio

50 Tools for analysis of extractive and azeotropic distillation
and the product composition specifications. Other notable characteristics of a feasible design include the fact that the middle section profile acts as a bridge between the stripping and rectifying profiles, and the rectifying profile is parallel to the distillate-entrainer edge. Figure 3-11 demonstrates the feasibility region calculated using the method outlined in section 3.3.1 for the system acetone-methanol-water. It is important to note that each set
of pinch curves requires that the feed ratio ( ) be specified. As discussed previously, the rectifying profile must be parallel to the binary edge since methanol is more volatile than acetone, which would cause the distillate to be contaminated by methanol.
Figure 3-11: Feasible design for the acetone-methanol-water system at 1 atm and an
entrainer to feed ratio of = 0.6. Temperatures in brackets are the boiling point for each component at the given operating pressure. (-) Extractive pinch curves. (+) Stripping, (∙) Extractive, and (*) rectifying profiles. Increasing the upper feed quality ( ) could change the column design parameters. When the upper feed quality is increased to 1.1 while maintaining the same product and feed ratio specifications as in Table 3-1, most of the design parameters for the ethanol-water-ethylene glycol system decrease. For example, Table 3-2 shows a reduction in reflux ratio, maximum reflux ratio, and number of middle stages when the upper feed quality is 1.1. In contrast, the boilup ratio increases because the entrainer is subcooled and more energy is necessary to vaporize the components. This also leads to a decrease in both the condenser duty and the number of stages. The maximum reflux displays a similar behavior for the system acetone-methanol-water (see section 3.3.5). In the case of the mixture ethanol-water-ethylene glycol the maximum reflux ratio is not controlled by a
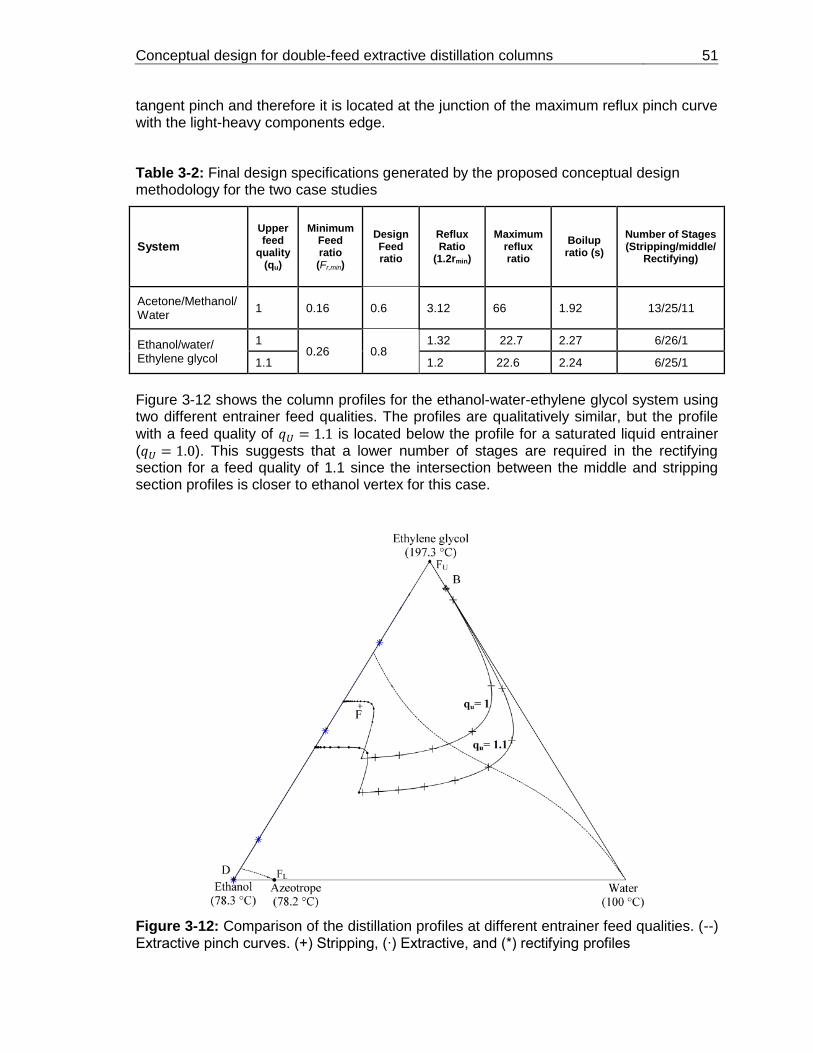
Conceptual design for double-feed extractive distillation columns 51
tangent pinch and therefore it is located at the junction of the maximum reflux pinch curve with the light-heavy components edge. Table 3-2: Final design specifications generated by the proposed conceptual design methodology for the two case studies
System
Upper feed
quality (qu)
Minimum Feed ratio (Fr,min)
Design Feed ratio
Reflux Ratio
(1.2rmin)
Maximum reflux ratio
Boilup ratio (s)
Number of Stages (Stripping/middle/
Rectifying)
Acetone/Methanol/Water
1 0.16 0.6 3.12 66 1.92 13/25/11
Ethanol/water/ Ethylene glycol
1 0.26 0.8
1.32 22.7 2.27 6/26/1
1.1 1.2 22.6 2.24 6/25/1
Figure 3-12 shows the column profiles for the ethanol-water-ethylene glycol system using two different entrainer feed qualities. The profiles are qualitatively similar, but the profile
with a feed quality of is located below the profile for a saturated liquid entrainer ( ). This suggests that a lower number of stages are required in the rectifying section for a feed quality of 1.1 since the intersection between the middle and stripping section profiles is closer to ethanol vertex for this case.
Figure 3-12: Comparison of the distillation profiles at different entrainer feed qualities. (--) Extractive pinch curves. (+) Stripping, (∙) Extractive, and (*) rectifying profiles
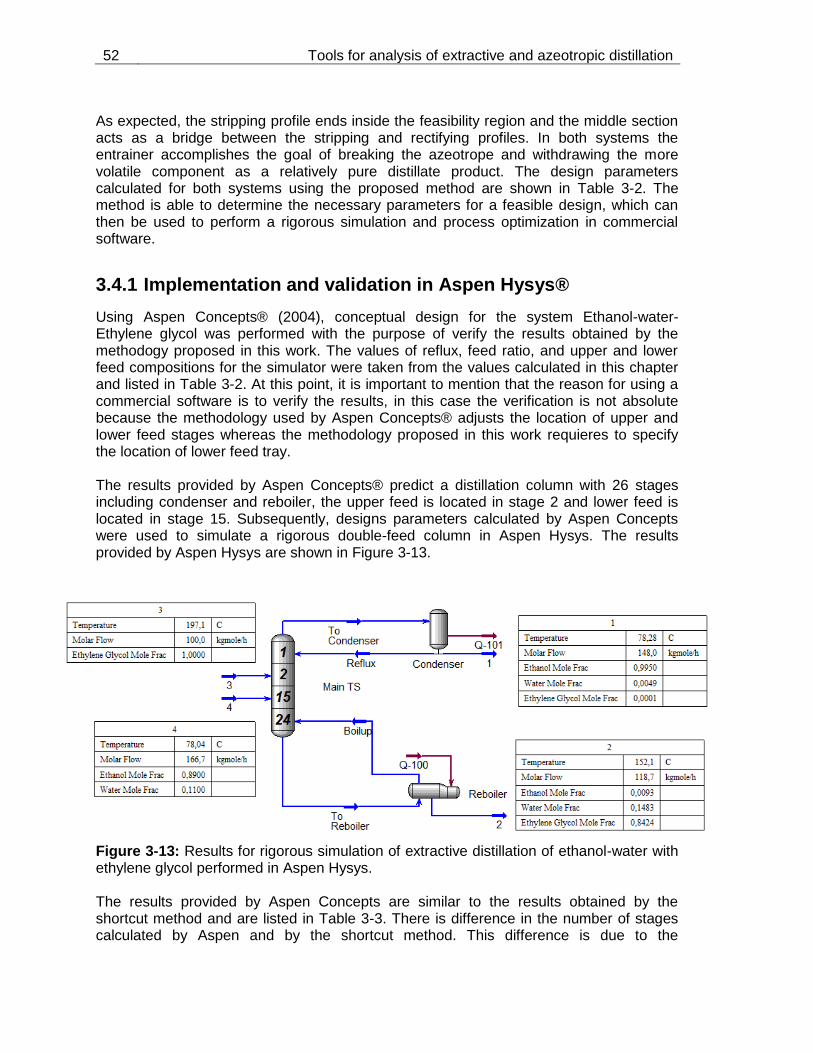
52 Tools for analysis of extractive and azeotropic distillation
As expected, the stripping profile ends inside the feasibility region and the middle section acts as a bridge between the stripping and rectifying profiles. In both systems the entrainer accomplishes the goal of breaking the azeotrope and withdrawing the more volatile component as a relatively pure distillate product. The design parameters calculated for both systems using the proposed method are shown in Table 3-2. The method is able to determine the necessary parameters for a feasible design, which can then be used to perform a rigorous simulation and process optimization in commercial software.
3.4.1 Implementation and validation in Aspen Hysys®
Using Aspen Concepts® (2004), conceptual design for the system Ethanol-water-Ethylene glycol was performed with the purpose of verify the results obtained by the methodogy proposed in this work. The values of reflux, feed ratio, and upper and lower feed compositions for the simulator were taken from the values calculated in this chapter and listed in Table 3-2. At this point, it is important to mention that the reason for using a commercial software is to verify the results, in this case the verification is not absolute because the methodology used by Aspen Concepts® adjusts the location of upper and lower feed stages whereas the methodology proposed in this work requieres to specify the location of lower feed tray. The results provided by Aspen Concepts® predict a distillation column with 26 stages including condenser and reboiler, the upper feed is located in stage 2 and lower feed is located in stage 15. Subsequently, designs parameters calculated by Aspen Concepts were used to simulate a rigorous double-feed column in Aspen Hysys. The results provided by Aspen Hysys are shown in Figure 3-13.
Figure 3-13: Results for rigorous simulation of extractive distillation of ethanol-water with ethylene glycol performed in Aspen Hysys. The results provided by Aspen Concepts are similar to the results obtained by the shortcut method and are listed in Table 3-3. There is difference in the number of stages calculated by Aspen and by the shortcut method. This difference is due to the

Conceptual design for double-feed extractive distillation columns 53
methodology used for both programs. In the case of methodology developed in this chapter it cannot optimize the location of feed stages as mixture as entrainer. Table 3-3:Design parameters and number of stages obtainedby the simulation process
System Program (Fr,min) Fr Reflux Ratio
(1.2rmin)
Boilup Ratio (s)
Number of Stages (Strip/midd/Rect)
Ethanol Water
Ethylene glycol
Hysys 0.26 0.6 1.32 2.27
9/13/2
MatLab 13/12/2
Finally, distillation profiles calculated using both shortcut method and Aspen Hysys were plotted in the composition diagram and shown in Figure 3-14. It can be noted that the distillation profiles follow (qualitatively) the same path. Both profiles accomplish the feasibility condition; stripping profiles must end inside the region bounded by pinch curves. The quantitative difference in the sttriping profile shown for the shortcut method is due to assumptions such as CMO, ideal stages, and negligible drop pressure.
Figure 3-14: Distillation profiles calculated by Hysys and Matlab
3.5 Conclusions
A method for the conceptual design of dual feed columns was presented. The method extends the concepts proposed by Wahnschafft and Westerberg (1993) and generates a
54 Tools for analysis of extractive and azeotropic distillation
new calculation methodology based on continuation methods for tracing out the extractive pinch point curves. Using the middle section pinch curves it is possible to determine the feasibility region for extractive distillation. Mathematical algorithms have been developed for determining the topological features of both reflux pinch point curves. The location of an initial point is the first step for tracing out the lower reflux pinch curve using continuation methods. As was demonstrated in the present paper, continuation methods combined with bifurcation theory represent a powerful tool for shortcut distillation calculation methods. The concept of isovolatility curves is exploited to determine a priori which components can be recovered as distillate and bottoms products. Furthermore, the isovolatility concept is very important in the screening of potential entrainers for extractive distillation because it shows which entrainer(s) will result in increased relative volatility of the azeotropic components. The methods developed in this work facilitate the direct determination of the minimum feed ratio, which in turn can be used to determine the minimum reflux ratio, the number of stages, and the feed tray location for a given set of product and operating specifications. Using bifurcation theory and the features of the extractive pinch curves, the current method is considerably more efficient and less complex than previously published methods. The verification process performed in Aspen Hysys using the design parameters calculated from the developed shortcut method agree with the results obtained by the methodology proposed in this chapter. Some quantitative differences in the distillation profiles can be noted due to the assumptions (CMO model) made in the shortcut method. It is important to mention that regardless the method used (shortcut or rigorous) for the simulation process, the geometry of the profiles and the feasibility conditions are exactly the same. Therefore, the methodology proposed in this chapter provides the suitable design parametersthat can be used in the rigorous simulation in commercial software.

4. Conceptual Analysis of Single-Feed Heterogeneous Columns
Liquid-Liquid-Vapor equilibrium has special complexities in calculation and equipment operation because of interaction of three phases; nevertheless, the Liquid-Liquid equilibrium allows developing separations that may be impossible by Liquid-Vapor equilibrium, in this way heterogeneous distillation is a useful operation for azeotropic systems separation. A new methodology for evaluating the feasibility in heterogeneous processes has been developed. The methodology could be taken as an extension of the method proposed by Castillo et al. (1998) for homogeneous systems. Operation leaves for heterogeneous systems were calculated using the concept of pinch point curves in order to establish the process feasibility. The method considers heterogeneous columns which decanter is the only heterogeneous stage; therefore, the whole distillation column operates in the homogeneous phase. The initialization process for the column calculation under this feature requires choosing the distillate with some thermodynamic criteria that will be explained throughout the chapter. Two systems with industrial and academic relevance were considered, 1) ethanol-water-benzene and 2) acetic acid-water-amyl acetate.
4.1 Previous work and scope
Separation of heterogeneous systems by distillation is a common operation in the industry since it takes advantage of partial miscibility for achieving the separation of an azeotropic mixture. Although it is a common operation, heterogeneous distillation has not received quite attention in the conceptual design because of its complexity. Taylor (2007) presented a state of art about the distillation and absorption modeling where it is evident that the three phases distillation remains relative poorly understood,if compared to distillation with just one liquid phase. The main reason for that is the complexity of modeling more than one liquid phase throughout the distillation column. As a consequence, the quantity of academic publications about heterogeneous distillation is moderated, it does not exceed 88 articles from 1997 to 2007; in contrast, papers about homogenous azeotropic and extractive distillation during the same time period were more than the double(Taylor, 2007). Pham et al. (1989) presented a methodology based on the boundary value method (Van Dongen and Doherty, 1985) for calculating both distillation profiles and minimum reflux in heterogeneous columns. The method was elaborated taking into account two important assumptions: 1) constant molar overflow (CMO) and 2) partial miscibility in both condenser and decanter; distillation column operates in homogeneous region. The first assumption is not correct for nonideal mixtures, but in this case it can be accepted because the main purpose is to describe the geometry of distillation profiles for the
56 Tools for analysis of extractive and azeotropic distillation
subsequent conceptual design. As support of the second assumption, it is known, with exception of some systems (Prayoonyong and Jobson, 2011; Urdaneta et al., 2002) that separation processes in heterogeneous systems are easier to model when the column is operated in the homogeneous region since heterogeneous trays in the column complicate minimum energy demand analysis and conceptual column design, because of the resulting multiparametric design problem formulation. Therefore, this assumption is correct for most of the heterogeneous systems, but requires selecting carefully the vapor comes from the top of the column. Wasylkiewicz (1999) developed a design method for distillation columns with heterogeneous trays. The method uses a tray by tray calculation for solving the separation problem. Because of that, it can be used for designing columns with heterogeneous trays; unfortunately, a lack of explanation in the method developing does not allow to use it and to analyze the design implications. The most recently research in heterogeneous systems has been focused on determination of minimum reflux using the methods developed for homogeneous systems. Kraemer et al. (2011) presented two novel shortcut methods, the feed pinch method (FPM) and the feed angle method (FAM). The first one is based on the rectification body and the shortest stripping line methods, it is useful for separations characterized by a feed pinch, and it does not require the calculation tray by tray; however, FPM requires calculating all the pinch points for the minimum reflux determination. Also, it is necessary that the separation is direct or indirect for guarantying the feed pinch existence, direct separation generates a pure component as distillate, while indirect one as bottom. The feed angle method (FAM) is based on the method proposed by Koehler et al. (1991) and explained in chapter 2. FAM is suitable for direct, indirect, and intermediate splits. Also, FAM takes conceptual elements from other methods such as zero volume criteria (Julka and Doherty, 1990) and Petlyuk’s methodology (Petlyuk, 2004). FAM is faster that the FPM because of it does not requires tray by tray calculation, but it is necessary to perform a pinch analysis using the Rectification Body Method (RBM) in the initialization process, in order to determine the relevant pinch points such as tangent pinches or the initial value for the minimum energy demand. The main advantage of FAM is the ability for solving columns with different types of splits. Królikowski et al. (2011) studied the behavior of the rectifying profiles in heterogeneous systems with distillation boundaries; also, they extended the pitchfork boundary analysis to heterogeneous systems. As a result, they stated that the behavior is similar as in heterogeneous systems as in homogeneous systems, the main difference is the parametric sensibility presented in systems with partial miscibility. As was shown above, different methods for heterogeneous distillation have been developed; unfortunately, methods developed are focused on simplified calculations of column and do not analyze the process feasibility. In this chapter a method for evaluating the feasibility in single-feed heterogeneous columns is presented. The method is based on the ideas developed in chapter 2 and 3 where both pinch and reversible distillation concepts are the foundations of the work. Pinch points curves are used in heterogeneous systems along with residue curves in order to evaluate the feasibility process through the operation leaves concept (Castillo et al., 1998). To trace out pinch curves in heterogeneous systems is a difficult task since it requires the knowledge about the

Conceptual design for double-feed extractive distillation 57
heterogeneous region in order to carry out the correct phase equilibrium calculations. Keeping in mind the idea of a fast, simple, and efficient shortcut method a strategy based on the previous determination of the partial miscibility region was used in this work. This strategy tries avoiding the material stability analysis that is the most robust strategy but the complexity and calculation time is higher. The strategy for solving the phase equilibrium problem will be explained in section 4.2.1. Continuation methods for calculating the pinch curves were used. The complexity is higher in heterogeneous systems because the system of equations is bigger and the determination of number of phases in each iteration step is complex.
4.2 Heterogeneous column model
Pham et al. (1989) presented a methodology for heterogeneous columns based on the boundary value method (BVM). In addition to the assumptions made in the BVM for homogeneous columns, the model for heterogeneous ones has as main restriction that the process throughout the column is carried out in the homogeneous region. Therefore, there is only one heterogeneous stage in the equipment, the decanter. As was pointed out by Pham and Doherty (1990b) columns which the only heterogeneous stage is the decanter are both more efficient and easy to control in practice. In addition, (Taylor, 2007) pointed out that for three-phase systems the efficiency is around 25% and 50% or so. Therefore, the most reliable and general operation policy for heterogeneous distillation is to limit the liquid-liquid equilibrium to condenser and decanter. A strategy that guarantees the column operates in homogeneous region was developed by Pham et al. (1989) and is used in this work. Because of the column operates in homogeneous region, the column equations are the same that for homogeneous ones. The difference between the BVM for homogeneous and heterogeneous systems is the initialization process that must be carried out in the rectifying section for heterogeneous systems in order to ensure that the column will operate in homogeneous region. On the other hand, CMO assumption was taken into account. Although CMO assumption is not correct for highly nonideal mixtures, in this work was used since the main focus is the geometrical features exhibited by heterogeneous systems; furthermore, a simplified methodology to evaluate the process feasibility is another important focus in this work. A conceptual schema for the column is shown in Figure 4-1. A mass balance around the plate in the rectifying section generates:
(4-1)
where is the overall liquid-phase mole fraction in distillate, defining an overall liquid
flow into the column, , and its fraction, :
(4-2)
Equation (4-1) can be rewritten as:
(4-3)
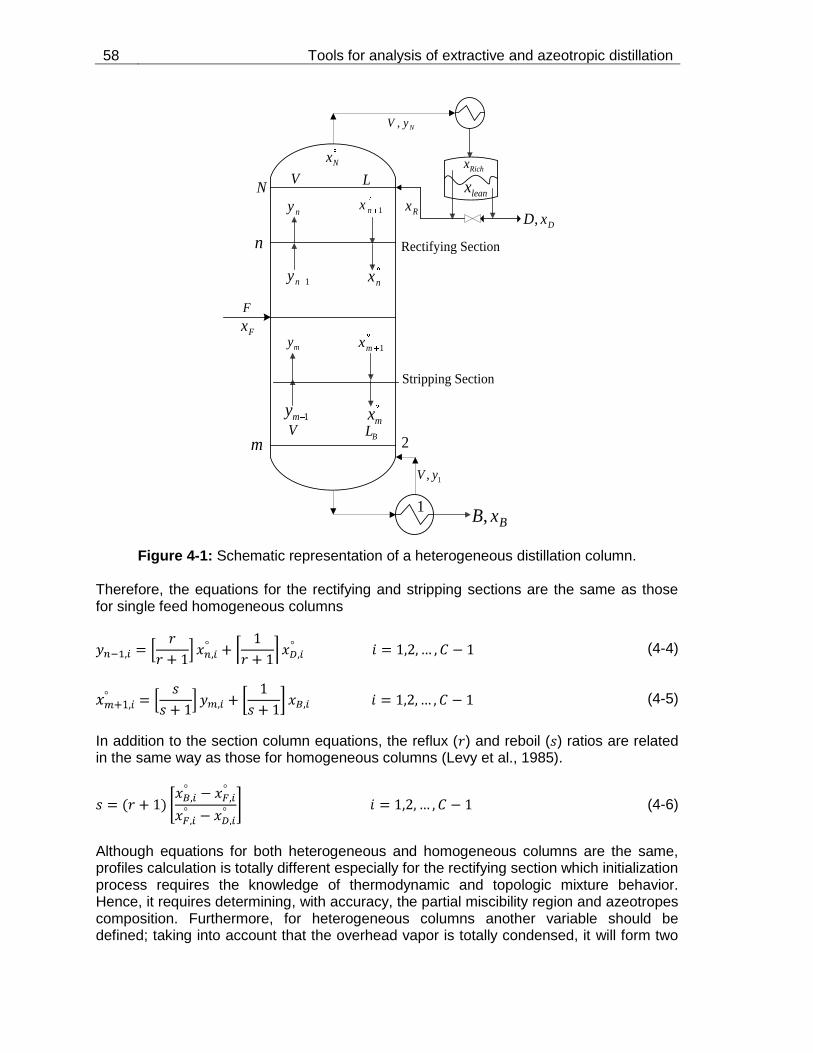
58 Tools for analysis of extractive and azeotropic distillation
BxB,
n
m
Stripping Section
Rectifying Section
2
1
Richx
leanx
DxD,
NyV ,
1ny
ny
nx
1nx
V L
my1mx
VBL
Rx
1, yV
Nx
N
F
Fx
1mymx
Figure 4-1: Schematic representation of a heterogeneous distillation column.
Therefore, the equations for the rectifying and stripping sections are the same as those for single feed homogeneous columns
(4-4)
(4-5)
In addition to the section column equations, the reflux ( ) and reboil ( ) ratios are related in the same way as those for homogeneous columns (Levy et al., 1985).
(4-6)
Although equations for both heterogeneous and homogeneous columns are the same, profiles calculation is totally different especially for the rectifying section which initialization process requires the knowledge of thermodynamic and topologic mixture behavior. Hence, it requires determining, with accuracy, the partial miscibility region and azeotropes composition. Furthermore, for heterogeneous columns another variable should be defined; taking into account that the overhead vapor is totally condensed, it will form two
Conceptual design for double-feed extractive distillation 59
immiscible liquid phases in the decanter, one of them will be an entrainer-rich phase of
composition ( ) and the other one will be an entrainer-lean phase of composition ( ). As result, a new variable, , must be defined in order to calculate the relative proportion of these two liquid phases in the decanter. The relative proportion can be obtained through the lever rule as follows (Pham and Doherty, 1990b):
(4-7)
The variable is an important design variable in heterogeneous columns because it provides the values for both distillate and reflux streams. As Pham and Doherty (1990) pointed out, there are two possible reflux ratios ( ) to configure the decanter. The first option is that , namely, the reflux rate is greater than the condensation rate of entrainer-rich phase whereas the distillate rate is less than the condensation rate of entrainer-lean phase. This condition implies the distillate stream consists ofa fraction of entrainer-lean phase, and the reflux stream consists of all the entrainer-rich phase plus the other fraction of the entrainer-lean phase; therefore, this policy allows manipulating
the reflux ratio with flexibility. When is defined the composition of the reflux stream ( ) is automatically determined.
The second reflux policy, , does not allow to manipulate the reflux ratio and composition as in the case explained above. In this case the reflux rate is less than the
condensation rate of entrainer-rich phase, i.e., the reflux stream ( ) consists of a fraction of entrainer-rich phase. Also, this policy requires that the distillate rate be greater than condensation rate of entrainer-lean phase; thus, the distillate stream consists of all the entrainer-lean phase plus the balance of the entrainer-rich phase. As a result, this reflux policy presents two weaknesses; one of them is the inability to manipulate the reflux ratio
due to there is an unique value of the distillate composition ( ), and therefore an unique
value of , that achieves to satisfy the column mass balances and accomplishes the
collinearity criteria between and . It is clear that this policy generates a lack of
flexibility in the manipulation.
4.2.1 Strategy to calculate phase equilibrium
One of the main challenges in heterogeneous distillation is to determine with accuracy the number of phases present under specific conditions of temperature, pressure and composition. Due to the mixture composition change throughout distillation column, it is necessary to verify in each column stage the number of phases in thermodynamic equilibrium. Robust Algorithms such as tangent plane criteria (Michelsen, 1982) have been proposed to determine the number of phases present in a mixture. A shortcoming of this method, and in general of all methods based on free Gibbs energy minimization, is the calculation time is long and the programming is not an easy task; also, after material stability analysis is performed and an answer is obtained, it is necessary to calculate the phase equilibrium with the number of phases predicted by stability analysis. Due to stability analysis adds complexity and calculation time to the shortcut method, a simpler strategy to solve the phase equilibrium calculation without use the material stability was developed in this work. The strategy is based on the previous knowledge of heterogeneous regions. For this purpose, it is necessary to calculate the binodal curve for
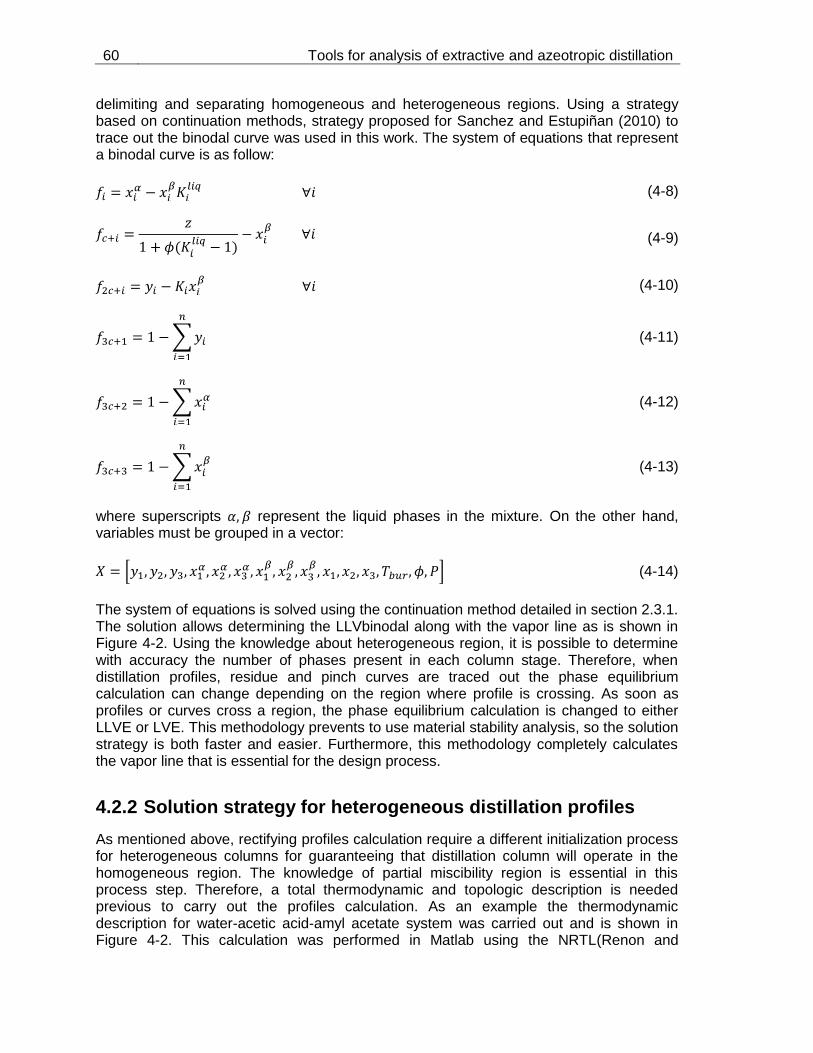
60 Tools for analysis of extractive and azeotropic distillation
delimiting and separating homogeneous and heterogeneous regions. Using a strategy based on continuation methods, strategy proposed for Sanchez and Estupiñan (2010) to trace out the binodal curve was used in this work. The system of equations that represent a binodal curve is as follow:
(4-8)
(4-9)
(4-10)
(4-11)
(4-12)
(4-13)
where superscripts represent the liquid phases in the mixture. On the other hand, variables must be grouped in a vector:
(4-14)
The system of equations is solved using the continuation method detailed in section 2.3.1. The solution allows determining the LLVbinodal along with the vapor line as is shown in Figure 4-2. Using the knowledge about heterogeneous region, it is possible to determine with accuracy the number of phases present in each column stage. Therefore, when distillation profiles, residue and pinch curves are traced out the phase equilibrium calculation can change depending on the region where profile is crossing. As soon as profiles or curves cross a region, the phase equilibrium calculation is changed to either LLVE or LVE. This methodology prevents to use material stability analysis, so the solution strategy is both faster and easier. Furthermore, this methodology completely calculates the vapor line that is essential for the design process.
4.2.2 Solution strategy for heterogeneous distillation profiles
As mentioned above, rectifying profiles calculation require a different initialization process for heterogeneous columns for guaranteeing that distillation column will operate in the homogeneous region. The knowledge of partial miscibility region is essential in this process step. Therefore, a total thermodynamic and topologic description is needed previous to carry out the profiles calculation. As an example the thermodynamic description for water-acetic acid-amyl acetate system was carried out and is shown in Figure 4-2. This calculation was performed in Matlab using the NRTL(Renon and
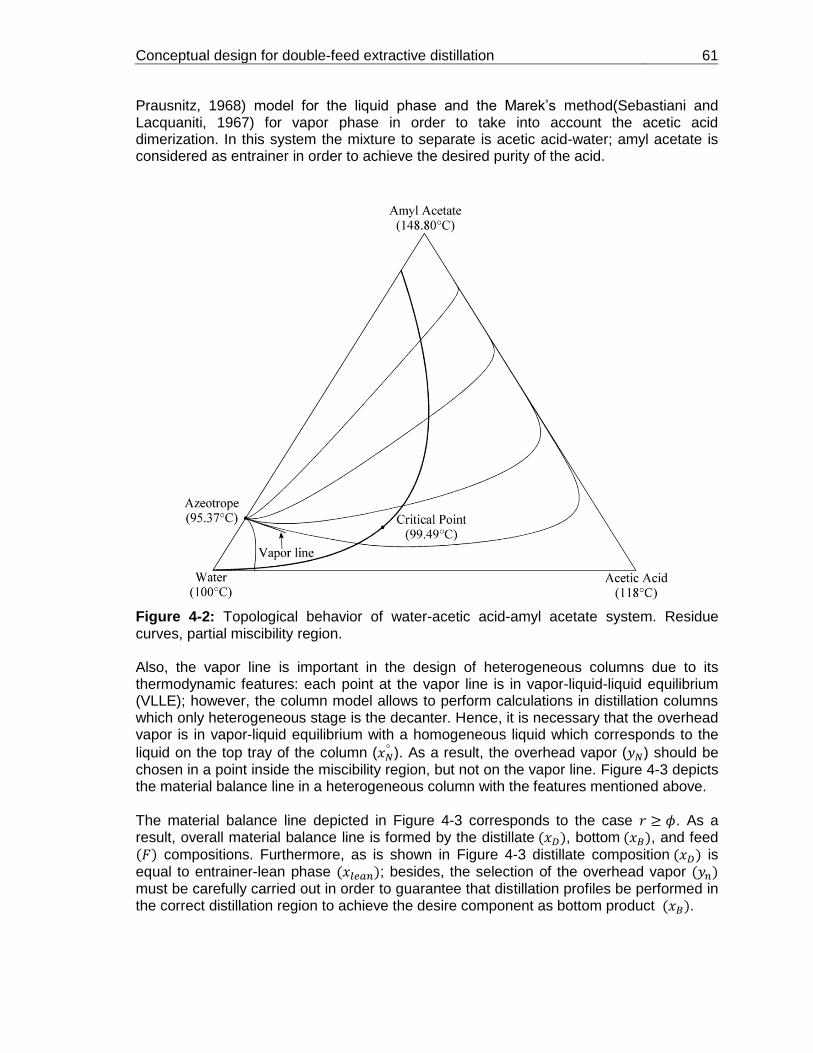
Conceptual design for double-feed extractive distillation 61
Prausnitz, 1968) model for the liquid phase and the Marek’s method(Sebastiani and Lacquaniti, 1967) for vapor phase in order to take into account the acetic acid dimerization. In this system the mixture to separate is acetic acid-water; amyl acetate is considered as entrainer in order to achieve the desired purity of the acid.
Figure 4-2: Topological behavior of water-acetic acid-amyl acetate system. Residue curves, partial miscibility region. Also, the vapor line is important in the design of heterogeneous columns due to its thermodynamic features: each point at the vapor line is in vapor-liquid-liquid equilibrium (VLLE); however, the column model allows to perform calculations in distillation columns which only heterogeneous stage is the decanter. Hence, it is necessary that the overhead vapor is in vapor-liquid equilibrium with a homogeneous liquid which corresponds to the
liquid on the top tray of the column ( ). As a result, the overhead vapor ( ) should be chosen in a point inside the miscibility region, but not on the vapor line. Figure 4-3 depicts the material balance line in a heterogeneous column with the features mentioned above.
The material balance line depicted in Figure 4-3 corresponds to the case . As a result, overall material balance line is formed by the distillate , bottom , and feed
compositions. Furthermore, as is shown in Figure 4-3 distillate composition is equal to entrainer-lean phase ; besides, the selection of the overhead vapor must be carefully carried out in order to guarantee that distillation profiles be performed in the correct distillation region to achieve the desire component as bottom product .
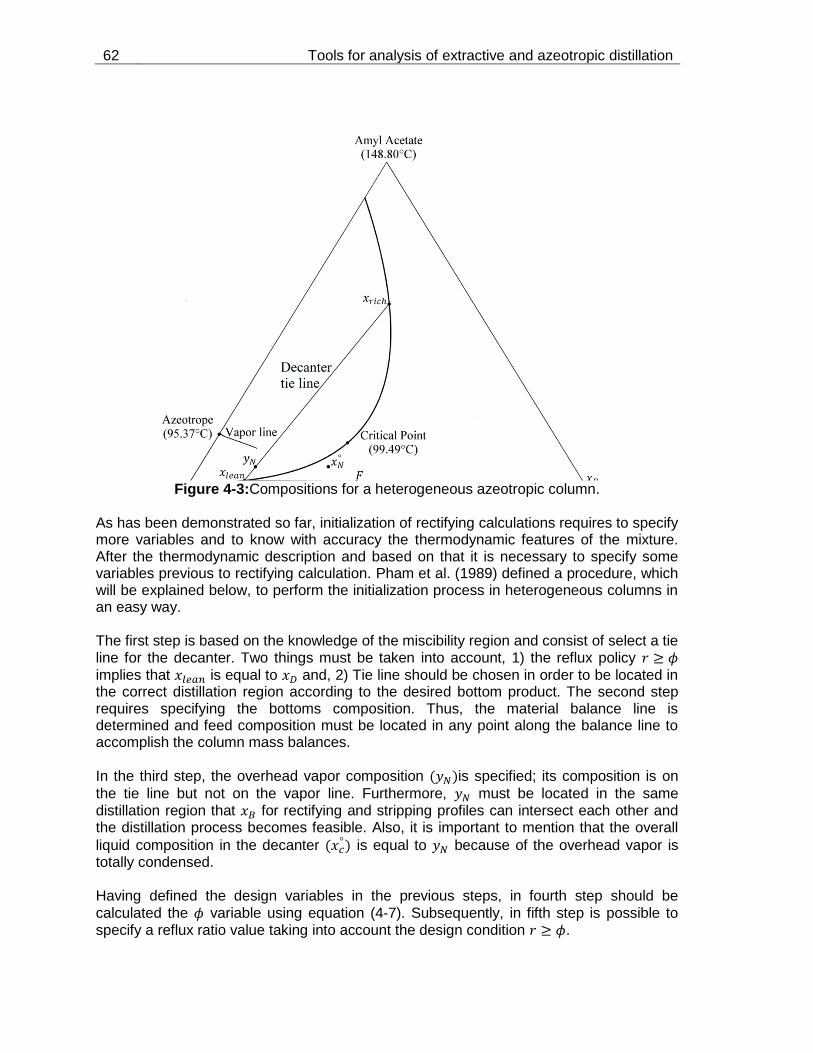
62 Tools for analysis of extractive and azeotropic distillation
Figure 4-3:Compositions for a heterogeneous azeotropic column.
As has been demonstrated so far, initialization of rectifying calculations requires to specify more variables and to know with accuracy the thermodynamic features of the mixture. After the thermodynamic description and based on that it is necessary to specify some variables previous to rectifying calculation. Pham et al. (1989) defined a procedure, which will be explained below, to perform the initialization process in heterogeneous columns in an easy way. The first step is based on the knowledge of the miscibility region and consist of select a tie line for the decanter. Two things must be taken into account, 1) the reflux policy
implies that is equal to and, 2) Tie line should be chosen in order to be located in the correct distillation region according to the desired bottom product. The second step requires specifying the bottoms composition. Thus, the material balance line is determined and feed composition must be located in any point along the balance line to accomplish the column mass balances. In the third step, the overhead vapor composition is specified; its composition is on
the tie line but not on the vapor line. Furthermore, must be located in the same distillation region that for rectifying and stripping profiles can intersect each other and the distillation process becomes feasible. Also, it is important to mention that the overall
liquid composition in the decanter is equal to because of the overhead vapor is totally condensed. Having defined the design variables in the previous steps, in fourth step should be
calculated the variable using equation (4-7). Subsequently, in fifth step is possible to specify a reflux ratio value taking into account the design condition .

Conceptual design for double-feed extractive distillation 63
Finally, the design specifications are fulfilled when the reboil ratio ( ) is calculated from equation (4-6). In this way, after the initialization of profile calculations both rectifying and stripping profiles must be calculated with the same methodology used in single feed homogeneous columns and explained in chapter 2. Therefore, the first calculation in the rectifying section should be a dew point calculation in order to determine the liquid
composition in equilibrium with the overhead vapor. After that, equation (4-5) is solved until the profile reaches its fixed point. As for the stripping profile, the calculation is exactly the same as in homogeneous systems. As an example, distillation profiles for water-acetic acid-amyl acetate were calculated and are shown in Figure 4-4.
Figure 4-4: Distillation profiles for water-acetic acid-amyl acetate system. Up to this point, heterogeneous column calculations have been explained and shown without taking into account the phase equilibrium calculation in heterogeneous systems. Calculations of heterogeneous systems imply to determine the number of phases present in the mixture under specific conditions of pressure, temperature and composition. This analysis mustbe carried out for determining the partial miscibility region, calculating residue and pinch curves, and finding the heteroazeotropes.
4.3 Methodology to calculate operation leaves in heterogeneous systems
As mentioned in chapter 1, operation leaves are formed by pinch point curves and residue curves. Calculation of pinch curves in heterogeneous systems requires the tools explained in previous chapters and in the sections discussed earlier in this chapter.

64 Tools for analysis of extractive and azeotropic distillation
Bycontinuation methods along with stability analysis was possible to develop a method for both calculating and tracing out operation leaves in heterogeneous systems. The calculation methodology is similar as for homogeneous systems; main differences are based on the complexity of the correct description of phase equilibrium and the number of phases. System of Equations which describe a pinch point in a heterogeneous region is bigger; therefore, for a three components system, in heterogeneous regions 14 equations are necessary forcomplete description of a pinch point and phase equilibrium. On the other hand, calculation of heterogeneous pinch curves is computationally more expensive than for homogeneous systems. The main reason for this drawback is the material stability calculation in each iteration step. In order to decrease the calculation time and taking into account that the thermodynamic and topologic behavior is known with accuracy the method explained in section 4.2.1 was selected instead of material stability analysis. After the calculation ofbinodal curve that allows to known the number of phases, phase equilibrium calculation must be performed for determining the composition of each phase. Equilibrium calculations for homogeneous systems are widely explained in literature (Henley and Rosen, 1969;Henley and Seader, 1981). As for heterogeneous systems, a modification of Rachford and Rice algorithm for liquid-vapor calculations (Henley and Seader, 1981)was proposed in this work for calculating the liquid-liquid-vapor equilibrium (LLVE). The calculation methodology for LLVE is based on the principle of chemical potential equality at the equilibrium state; thus, at the condition of LLVE three phases coexists and can be represented as follows:
(4-15)
where and are the liquid phases and the vapor one at the equilibrium. Therefore, two phase equilibrium relationships describe the LLVE. The first equation corresponds to liquid-liquid equilibrium while second equation corresponds to liquid-vapor equilibrium. Obtaining the LLVE condition requires that two equilibrium equations must be fulfilled at the same time. Assuming vapor phase ideality, equations that represent LLVE are shown as follows:
(4-16)
(4-17)
It is clear that in the case of the liquid-vapor equilibrium (LVE) is enough with use only one liquid phase because of at the equilibrium condition represented by equation (4-15)if a liquid phase is at equilibrium with a vapor phase implicitly the other liquid phase is at equilibrium with the vapor as well. With the correct description of the VLLE is possible both to calculate and to trace out pinch curves in heterogeneous systems. In this case again, continuation methods proposed in chapter 2 were used in order to solve the system of equations. The only one difference with the method used for homogeneous systems is the number of equations. For heterogeneous mixtures 14 equations are required to describe correctly the thermodynamic behavior, so the system of equations for the stripping section is as follows:

Conceptual design for double-feed extractive distillation 65
(4-18)
(4-19)
(4-20)
(4-21)
(4-22)
(4-23)
The subscript corresponds to the number of components in the mixture. Equations (4-20) and (4-21) represent the liquid-liquid equilibrium (LLE). The other equations describe the column section profile, liquid-vapor equilibrium (LVE) and molar fraction summation; these equations are the same as for homogeneous systems. Furthermore, it is important to mention that the equations described above must be only used in heterogeneous region. For homogeneous regions the calculation is carried out in the same way as chapter 2. For applying of continuations method, the equations and variables are grouped as follows:
(4-24)
(4-25)
(4-26) Material stability analysis must identify the transition of phases, namely, the point where the number of phases change. In this point the calculation algorithm must be changed. In this case the first pinch point is calculated in the same way as was determined in chapter 2; stripping and rectifying profiles are traced out until these reach a pinch point; this pinch point is the initial point for tracing out the curve using the continuation method. As for residue curves, a methodology to calculate these in heterogeneous systems was developed by Pham and Doherty (1990a). In this work, this methodology was used with the variation in determination of heterogeneous region and LLVE calculation. Just like pinch curves, strategy for detecting heterogeneous regions explained in section 4.2.1 was used to trace out residue curves. The equation to calculate residue curves in heterogeneous systems (Pham and Doherty, 1990a) is as follows:
(4-27)

66 Tools for analysis of extractive and azeotropic distillation
where is the overall liquid fraction and is the vapor fraction. Performing a numerical
integration of (4-27) the heterogeneous residue curves are traced out. Finally, in homogeneous regions the residue curves calculation is carried out with the methodology explained in chapter 2. The algorithm for analysis of heterogeneous systems is presented in next figure.
Are the operation leaves overlaped?
To specify B
To solve distillation profiles until (4-5) and (4-6) are equal to zero
(Pinch condition)
To trace out Xn and B pinch curves using (4-28)
To calculate s using equation (4-7)
To calculate Xn and B residue curves (Eq. 4-29)
Yes
NO
To choose a decanter tie line and the vapor overhead (Yn) in the same distillation region that B
To calculate Xn using VLE
THE DESIGN IS FEASIBLE
To calculate LLV binodal
Figure 4-5: Algorithm for design feasibility of heterogeneous systems.

Conceptual design for double-feed extractive distillation 67
4.4 Case studies with the new methodology
Two case studies were selected to apply the methodology proposed and to demonstrate the methodology utility in the determination of the process feasibility. Water-acetic acid-amyl acetate and ethanol-water-benzene were chosen due to its topological and thermodynamics features, and the industrial impact. Acetic acid separation of mixtures with water is possible to achieve using heterogeneous azeotropic distillation; amyl acetate forms a partial miscibility region and an azeotrope with water. The thermodynamic characterization is shown in figure (4-2). Although water-acetic acid mixture does not form azeotropes, the mixture separation is difficult because of its low volatility. On the other hand, ethanol-water mixture is very common in the industry due to the use of ethanol as additive for the gasoline. For this purpose it is necessary that the ethanol has purity higher than 99.9%, but the minimum boiling point azeotrope in the mixture does not allow obtaining the ethanol under this specification. Therefore, a material separation agent must be added to the mixture in order to modify the mixture topology and to obtain ethanol with the necessary purity. One of the most common strategies to separate ethanol-water is using benzene as heterogeneous entrainer. Benzene addition induces a partial miscibility region and three new azeotropes depicting the thermodynamic and topological behavior for ethanol-benzene-water system. Four azeotropes are present in this mixture and three distillation regions are originated (Figure 4-6). In order to obtain high purity ethanol just one distillation region allows achieving this purpose; for this region, residue curves end on the ethanol vertex in the composition diagram.
Figure 4-6:Topological behavior of ethanol-benzene-water system. residue curves, partial miscibility region.
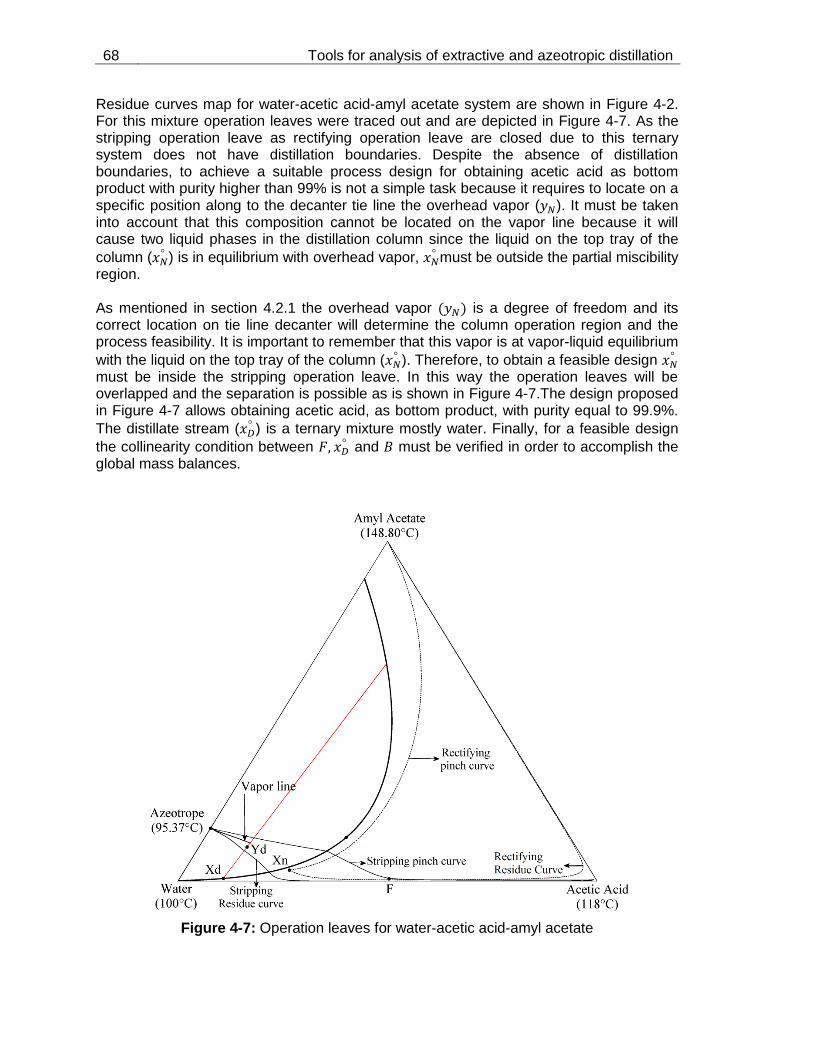
68 Tools for analysis of extractive and azeotropic distillation
Residue curves map for water-acetic acid-amyl acetate system are shown in Figure 4-2. For this mixture operation leaves were traced out and are depicted in Figure 4-7. As the stripping operation leave as rectifying operation leave are closed due to this ternary system does not have distillation boundaries. Despite the absence of distillation boundaries, to achieve a suitable process design for obtaining acetic acid as bottom product with purity higher than 99% is not a simple task because it requires to locate on a specific position along to the decanter tie line the overhead vapor ( ). It must be taken into account that this composition cannot be located on the vapor line because it will cause two liquid phases in the distillation column since the liquid on the top tray of the
column ( ) is in equilibrium with overhead vapor, must be outside the partial miscibility region. As mentioned in section 4.2.1 the overhead vapor is a degree of freedom and its correct location on tie line decanter will determine the column operation region and the process feasibility. It is important to remember that this vapor is at vapor-liquid equilibrium
with the liquid on the top tray of the column ( ). Therefore, to obtain a feasible design must be inside the stripping operation leave. In this way the operation leaves will be overlapped and the separation is possible as is shown in Figure 4-7.The design proposed in Figure 4-7 allows obtaining acetic acid, as bottom product, with purity equal to 99.9%.
The distillate stream ( ) is a ternary mixture mostly water. Finally, for a feasible design
the collinearity condition between and must be verified in order to accomplish the global mass balances.
Figure 4-7: Operation leaves for water-acetic acid-amyl acetate
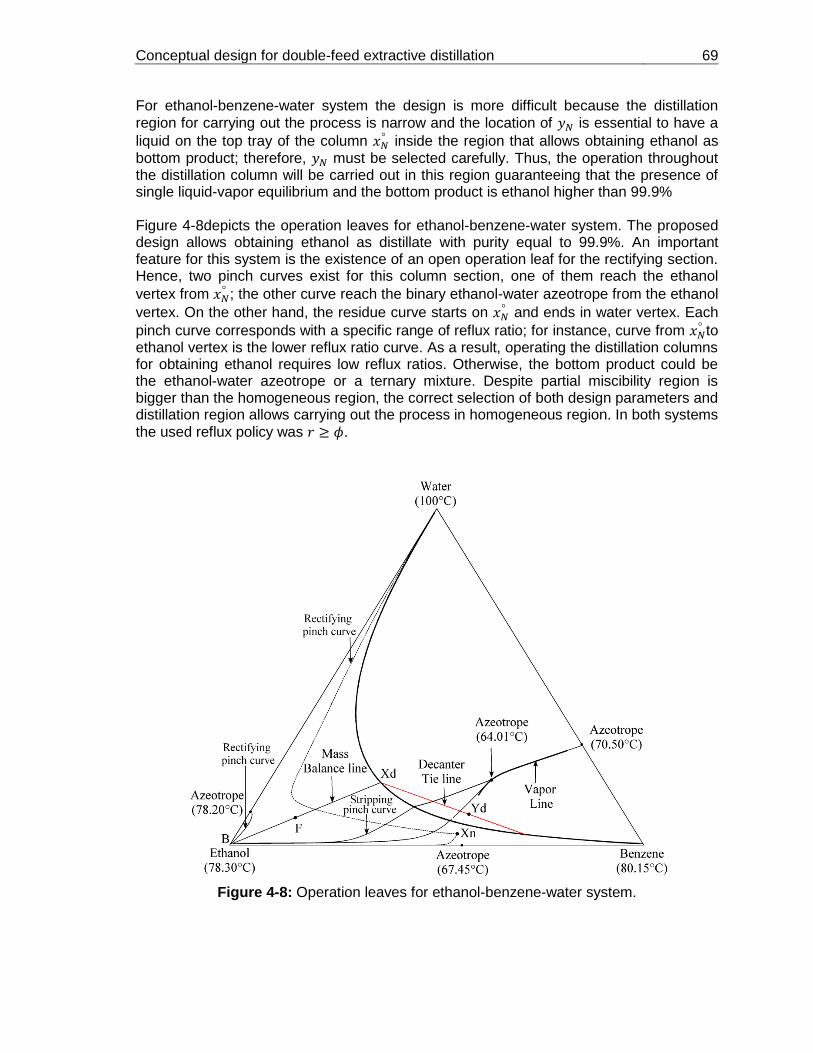
Conceptual design for double-feed extractive distillation 69
For ethanol-benzene-water system the design is more difficult because the distillation
region for carrying out the process is narrow and the location of is essential to have a
liquid on the top tray of the column inside the region that allows obtaining ethanol as
bottom product; therefore, must be selected carefully. Thus, the operation throughout the distillation column will be carried out in this region guaranteeing that the presence of single liquid-vapor equilibrium and the bottom product is ethanol higher than 99.9% Figure 4-8depicts the operation leaves for ethanol-benzene-water system. The proposed design allows obtaining ethanol as distillate with purity equal to 99.9%. An important feature for this system is the existence of an open operation leaf for the rectifying section. Hence, two pinch curves exist for this column section, one of them reach the ethanol
vertex from ; the other curve reach the binary ethanol-water azeotrope from the ethanol
vertex. On the other hand, the residue curve starts on and ends in water vertex. Each
pinch curve corresponds with a specific range of reflux ratio; for instance, curve from to ethanol vertex is the lower reflux ratio curve. As a result, operating the distillation columns for obtaining ethanol requires low reflux ratios. Otherwise, the bottom product could be the ethanol-water azeotrope or a ternary mixture. Despite partial miscibility region is bigger than the homogeneous region, the correct selection of both design parameters and distillation region allows carrying out the process in homogeneous region. In both systems
the used reflux policy was .
Figure 4-8: Operation leaves for ethanol-benzene-water system.

70 Tools for analysis of extractive and azeotropic distillation
4.5 Conclusions
The methodology used allows evaluating the feasibility for a specific design. Fixing products and feed stream, the feasibility can be evaluated through the operation leaves concept. For both examples shown, it is evident that the separation of the main component (acetic acid and ethanol in each case) is accomplished under this operation conditions. One of the main advantages of this method is the acquired knowledge about the thermodynamic and topological behavior of heterogeneous mixtures. On the other hand, the conceptual design avoids using the simulators for determining the design parameters. Determining design parameters through simulators requires trial and error procedures; instead, simulators can be used as a complement of the conceptual design in order to evaluate the process performance with the calculated parameters by the shortcut method. Finally, it is clear that heterogeneous azeotropic distillation is more sensitive to the initial parameters than homogeneous one. Therefore, to achieve that heterogeneous process be successful requires the accurate specification of variables such as the vapor overhead
. For example, ethanol-benzene-water system has a narrow operation range when ethanol is the desire bottom product. Although is a difficult process synthesis, the conceptual design provides the necessary tools for determining the distillation regions, thermodynamic boundaries, and azeotropes. These thermodynamic features allows determining the exact and convenient point where must be located. Without these tools the design process would be so difficult and inaccurate and it would require a trial and error procedure for calculating the design parameters.

5. Conclusions and future work
5.1 Conclusions
Shortcut method for homogeneous single-feed columns was improved using the continuation methods for tracing out pinch curves, and the reversible distillation concept. The method determines the process feasibility through the operation leaves strategy and subsequently design parameters and minimum energy can be calculated. In addition, it was demonstrated that is possible to cross distillation boundaries at finite reflux when bottom product composition is localized inside the region limited by the distillation boundary and the pitchfork boundary. Finally, it was discovered that pinch curves are useful to calculate saddle azeotropes. A conceptual design methodology for homogeneous double-feed columns was developed. Through developed shortcut method process feasibility can be determinate and design parameters can be calculated. A simpler solution to the calculation of minimum feed ratio was proposed; it uses topological tools such as volatility lines and pinch curves along with graphical features that allow calculating minimum feed ratio. On the other hand, a fast and easy method that uses isovolatility lines for evaluating the entrainer thermodynamic efficiency was applied. Shortcut method for evaluating the process feasibility in heterogeneous single-feed distillation was developed. The concept of operation leaves was extended with success to heterogeneous mixtures for distillation columns with only heterogeneous stages incondenser and decanter. According to the results obtained, it is clear that this operation policy is efficient since desired separation is achieved. A simpler algorithm to calculate phase equilibrium with not necessity of material stability analysis was used. The algorithm uses continuation methods for calculating liquid-liquid-vapor binodal curve. With the accurate delimitation of heterogeneous region was possible to determine the phase equilibrium,it should be used when pinch and residue curves are calculated.
5.2 Future work
Conceptual design methods developed in this work have some assumptions regard to the distillation column model with the objective of simplify the calculation algorithms and to define the geometrical and topological features in azeotropic systems. Future work should be focused on develop conceptual methods withless assumptions for the column model in order to increase de accuracy of shortcut methods. Furthermore, heterogeneous distillation is a field of knowledge that requires more research as in theoretical as experimental analysis. For instance, it should be extended
72 Tools for analysis of extractive and azeotropic distillation
the conceptual design to double-feed columns and distillation columns with heterogeneous stages. Finally, focus on future research should consider the combination between conceptual design and experimental work. For example, design parameters calculated by conceptual analysis could be used for designing and assembling of separation units such as extractive and azeotropic distillation columns. On the other hand, experimental advances could be taken into account in order to calculate the thermodynamic models parameters and to achieve an accurate and correct description about phase equilibrium especially in heterogeneous systems.

Bibliography
Allgower, E. L., Georg, K., 2003. Introduction to Numerical Continuation Methods: Society for Industrial and Applied Mathematics.
Bausa, J., Von Watzdorf, R., Marquardt, W., 1998. Shortcut methods for nonideal multicomponent distillation: 1. Simple columns, AICHE Journal 44(10), 2181-2198.
Bausa, J., Marquardt, W., 2000. Quick and reliable phase stability test in VLLE flash calculations by homotopy continuation, Computers & Chemical Engineering 24(11), 2447-2456.
Bruggemann, S., Marquardt, W., 2004. Shortcut methods for nonideal multicomponent distillation: 3. Extractive distillation columns, AICHE Journal 50(6), 1129-1149.
Castillo, F. J. L., Thong, D. Y. -., Towler, G. P., 1998. Homogeneous Azeotropic Distillation. 1. Design Procedure for Single-Feed Columns at Nontotal Reflux, Industrial & Engineering Chemistry Research 37(3), 987-997.
Danilov, R. Y., Petlyuk, F. B., Serafimov, L. A., 2007. Minimum-reflux regime of simple distillation columns, Theoretical Foundations of Chemical Engineering 41(4), 371-383.
Davydyan, A. G., Malone, M. F., Doherty, M. F., 1997. Boundary Modes in a Single Feed Distillation Column for the Separation of Azeotropic Mixtures, Theoretical foundations of chemical engineering. 31(4), 327.
Doherty, M. F., Caldarola, G. A., 1985. Design and synthesis of homogeneous azeotropic distillations. 3. The sequencing of columns for azeotropic and extractive distillations, Industrial & Engineering Chemistry Fundamentals 24(4), 474-485.
Estupiñán, L., Sánchez, C. A., Martínez Riascos, C., Arturo Calvache, J., 2011. Análisis de las Posibilidades de Separación en Columnas de Destilación Azeotrópica Homogénea Operando a Reflujo Finito.
Felbab, N., Hildebrandt, D., Glasser, D., 2011. A new method of locating all pinch points in nonideal distillation systems, and its application to pinch point loci and distillation boundaries, Computers & Chemical Engineering 35(6), 1072-1087.
Fidkowski, Z. T., Malone, M. F., Doherty, M. F., 1991. Nonideal multicomponent distillation: Use of bifurcation theory for design, AICHE Journal 37(12), 1761-1779.

74
Gmehling, J., Li, J., Schiller, M., 1993. A modified UNIFAC model. 2. Present parameter matrix and results for different thermodynamic properties, Industrial & Engineering Chemistry Research 32(1), 178-193.
Henley, E. J., Rosen, E. M., 1969. Material and Energy Balance Computations. New York: Wiley.
Henley, E. J., Seader, J. D., 1981. Equilibrium-Stage Separation Operations in Chemical Engineering. New York: J. Wiley.
Julka, V., Doherty, M. F., 1990. Geometric behavior and minimum flows for nonideal multicomponent distillation, Chemical Engineering Science 45(7), 1801-1822.
Keller, H. B., 1977. Numerical solution of bifurcation and nonlinear eigenvalue problems, 359-384.
Kincaid, D. R., Cheney, E. W., 2009. Numerical Analysis: Mathematics of Scientific Computing. : Cengage Learning.
Knapp, J. P., Doherty, M. F., 1994. Minimum Entrainer Flows for Extractive Distillation - a Bifurcation Theoretic Approach, AICHE Journal 40(2), 243-268.
Knapp, J. P., Doherty, M. F., 1990. Thermal Integration of Homogeneous Azeotropic Distillation Sequences, AICHE Journal 36(7), 969-984.
Koehler, J., Aguirre, P., Blass, E., 1991. Minimum Reflux Calculations for Nonideal Mixtures using the Reversible Distillation Model, Chemical Engineering Science 46(12), 3007-3021.
Kraemer, K., Harwardt, A., Skiborowski, M., Mitra, S., Marquardt, W., 2011. Shortcut-based design of multicomponent heteroazeotropic distillation, Chemical Engineering Research and Design 89(8), 1168-1189.
Krishna, R., 1979. A simplied film model description of multicomponent interphase mass transfer, Chemical Engineering Communications 3(1), 29-39.
Królikowski, A. R., Królikowski, L. J., Wasylkiewicz, S. K., 2011. Distillation profiles in ternary heterogeneous mixtures with distillation boundaries, Chemical Engineering Research and Design 89(7), 879-893.
Krolikowski, L. J., 2006. Determination of distillation regions for non-ideal ternary mixtures, AICHE Journal 52(2), 532-544.
Laroche, L., Bekiaris, N., Andersen, H. W., Morari, M., 1991. Homogeneous Azeotropic Distillation - Comparing Entrainers, Canadian Journal of Chemical Engineering 69(6), 1302-1319.

Bibliografía 75
Levy, S. G., Doherty, M. F., 1986a. Design and synthesis of homogeneous azeotropic distillations. 4. Minimum reflux calculations for multiple-feed columns, Industrial & Engineering Chemistry Fundamentals 25(2), 269-279.
Levy, S. G., Doherty, M. F., 1986b. A simple exact method for calculating tangent pinch points in multicomponent nonideal mixtures by bifurcation theory, Chemical Engineering Science 41(12), 3155-3160.
Levy, S. G., Van Dongen, D. B., Doherty, M. F., 1985. Design and synthesis of homogeneous azeotropic distillations. 2. Minimum reflux calculations for nonideal and azeotropic columns, Industrial & Engineering Chemistry Fundamentals 24(4), 463-474.
Lucia, A., Amale, A., Taylor, R., 2008. Distillation pinch points and more, Computers & Chemical Engineering 32(6), 1342-1364.
McCabe, W. L., Thiele, E. W., 1925. Graphical Design of Fractionating Columns, Industrial & Engineering Chemistry 17(6), 605-611.
Michelsen, M. L., 1982. The isothermal flash problem. Part I. Stability, Fluid Phase Equilibria 9(1), 1-19.
Petlyuk, F. B., 2004. Distillation Theory and its Application to Optimal Design of Separation Units. Cambridge, U.K: Cambridge University Press.
Petlyuk, F., Danilov, R., Skouras, S., Skogestad, S., 2011. Identification and analysis of possible splits for azeotropic mixtures-1. Method for column sections, Chemical Engineering Science 66(12), 2512-2522.
Pham, H. N., Doherty, M. F., 1990a. Design and synthesis of heterogeneous azeotropic distillations—II. Residue curve maps, Chemical Engineering Science 45(7), 1837-1843.
Pham, H. N., Doherty, M. F., 1990b. Design and synthesis of heterogeneous azeotropic distillations—III. Column sequences, Chemical Engineering Science 45(7), 1845-1854.
Pham, H. N., Ryan, P. J., Doherty, M. F., 1989. Design and minimum reflux for heterogeneous azeotropic distillation columns, AICHE Journal 35(10), 1585-1591.
Poellmann, P., Blass, E., 1994. Best Products of Homogeneous Azeotropic Distillations, Gas Separation & Purification 8(4), 194-228.
Poellmann, P., Glanz, S., Blass, E., 1994. Calculating Minimum Reflux of Nonideal Multicomponent Distillation using Eigenvalue Theory, Computers & Chemical Engineering 18, S49-S53.

76
Prayoonyong, P., Jobson, M., 2011. Flowsheet synthesis and complex distillation column design for separating ternary heterogeneous azeotropic mixtures, Chemical Engineering Research and Design 89(8), 1362-1376.
Renon, H., Prausnitz, J. M., 1968. Local compositions in thermodynamic excess functions for liquid mixtures, AICHE Journal 14(1), 135-144.
Ryan, P. J., Doherty, M. F., 1989. Design/optimization of ternary heterogeneous azeotropic distillation sequences, AICHE Journal 35(10), 1592-1601.
Sánchez, C. A., 2011. Cálculo e interpretación de las trayectorias de puntos de composición constante (Pinch) en columnas simples de destilación para mezclas azeotrópicas homogéneas. (Spanish), Revista EIA (16), 77-92.
Sánchez, C. A., Estupiñán, L., Salazar, M. A., 2010. Herramientas para la caracterización termodinámica de sistemas ternarios en destilación. (Spanish), Revista EIA (13), 77-91.
Sebastiani, E., Lacquaniti, L., 1967. Acetic acid—water system thermodynamical correlation of vapor—liquid equilibrium data, Chemical Engineering Science 22(9), 1155-1162.
Seydel, R., 2010. Practical Bifurcation and Stability Analysis. New York: Springer Verlag.
Sun, A. C., Seider, W. D., 1995. Homotopy-continuation method for stability analysis in the global minimization of the Gibbs free energy, Fluid Phase Equilibria 103(2), 213-249.
Taylor, R., 2007. (Di)Still Modeling after All These Years: A View of the State of the Art, Industrial & Engineering Chemistry Research 46(13), 4349-4357.
Urdaneta, R. Y., Bausa, J., Bruggemann, S., Marquardt, W., 2002. Analysis and conceptual design of ternary heterogeneous azeotropic distillation processes, Industrial & Engineering Chemistry Research 41(16), 3849-3866.
Van Dongen, D. B., Doherty, M. F., 1985. Design and synthesis of homogeneous azeotropic distillations. 1. Problem formulation for a single column, Industrial & Engineering Chemistry Fundamentals 24(4), 454-463.
Vickery, D. J., Taylor, R., 1986. Path-following approaches to the solution of multicomponent, multistage separation process problems, AICHE Journal 32(4), 547-556.
Wahnschafft, O. M., Koehler, J. W., Blass, E., Westerberg, A. W., 1992. The Product Composition Regions of Single-Feed Azeotropic Distillation-Columns, Industrial & Engineering Chemistry Research 31(10), 2345-2362.

Bibliografía 77
Wahnschafft, O. M., Westerberg, A. W., 1993. The Product Composition Regions of Azeotropic Distillation-Columns .2. Separability in 2-Feed Columns and Entrainer Selection, Industrial & Engineering Chemistry Research 32(6), 1108-1120.
Wasylkiewicz, S. K., 1999. Design of heterogeneous distillation columns for separation of azeotropic non-reactive and reactive mixtures, Computers & Chemical Engineering; European Symposium on Computer Aided Process Engineering Proceedings of the European Symposium 23, Supplement(0), 125-S128.
Wayburn, T. L., Seader, J. D., 1987. Homotopy continuation methods for computer-aided process design, Computers & Chemical Engineering 11(1), 7-25.