tools in data science for better processing · 2017-08-22 · analysing a data set to get the...
TRANSCRIPT

TOOLS IN DATA SCIENCE FOR BETTER
PROCESSING
Nur Syahela Hussiena, Sarina Sulaimanb and Siti Mariyam Shamsuddinc
a,b,cUTM Big Data Centre, Ibnu Sina Institute for Scientific and Industrial Research
Faculty of Computing, Universiti Teknologi Malaysia, 81310 Johor Bahru, Johor, Malaysia
[email protected], [email protected], [email protected]
Abstract. Analysing the data is an important part of a research in data science. There are many tools that can be used in
analysing a data set to get the experiment results for classification, clustering and others. However, the researchers are
concerned about how to increase the efficiency in analysing a data set. In this paper, three open source tools which are the
Waikato Environment for Knowledge Analysis (WEKA), Konstanz Information Miner (KNIME) and Salford Predictive
Modular (SPM) were compared to identify the better processing tools in evaluating the presented data. All of these tools
have their own different characteristics. WEKA can handle pre-processing of data and then analyses it based on different
algorithms. It is suitable to be used for classification, regression, clustering, association rules, and visualisation. The
algorithms can be applied directly to a data set or called from its own Java code. KNIME is more inclined towards
producing graphical view, while SPM is a highly accurate and ultra-fast analytics which also data mines platforms for
any sizes, complexity or organisation. The results illustrate the tools capability in analysing data sets and evaluators in an
efficient and effective manner.
Keywords: data science; efficiency processing; WEKA; KNIME; SPM
INTRODUCTION
The interactive analysis is a circular analytic procedure comprising assumption, verification, and calibration by the
analysis to achieve the effective computation goal. There are many tools for data processing in data science, but with
different criteria and complexity. Tools ease the access to information about tests or testing. Visually presented
information is much easier for the human mind to understand and interpret.
Since there are so many tools for interactive analysis that no one would have the entire knowledge of, this paper
only focuses on and compares the three most common tools which are the Waikato Environment for Knowledge
Analysis (WEKA), Konstanz Information Miner (KNIME) and Salford Predictive Modular (SPM). Since it is a
comparison of the interactive analysis tools, the comparison must be typical and relevant correspondingly. All of the
three tools consist of Machine Learning (ML) techniques to analyse some data sets. WEKA and KNIME have
multiple kinds of ML techniques but SPM only offers four ML techniques, which are CART, MARS, Tree Net and
Random Forest (RF).
This paper presents the analysis of data sets based on tools in data science for better processing. Three tools namely
WEKA, KNIME and SPM are proposed in this paper with the details of their background, followed by the material
and method of data processing. Finally, the results are presented, followed by a discussion that ends with a
conclusion.
TOOLS BACKGROUND
This section explains the background of each tool including WEKA, KNIME and SPM that have been used for this
research.
A. WEKA
Waikato Environment for Knowledge Analysis (WEKA) is a Machine Learning (ML) and data mining software
written in Java that is distributed under the GNU Public License. WEKA is a collection of ML algorithms for data
mining tasks. The algorithms can either be applied directly to a data set or called from your own Java code [1].

WEKA contains tools for data pre-processing, classification, regression, clustering, association rules, and
visualisation. The key feature of WEKA provides many different algorithms for data mining and machine learning,
WEKA is an open source that is freely available and easily usable by people who are not data mining specialists. It
has been kept up-to-date, with new algorithms being added as they appear in the research literature. In addition, it
provides flexible facilities for scripting experiments. Patil and Sherekar in [2] studied performance analysis of naive
bayes and J48 classification algorithm for data classification based on WEKA tool. Then in 2014, Maglogiannis and
Doukas [3] used WEKA tool in their research work for intelligent health monitoring based on pervasive
technologies and cloud computing.
The functions in WEKA supports the following:
i. Data pre-processing and visualisation
ii. Attribute selection
iii. Classification (Decision trees)
iv. Prediction (Nearest neighbour)
v. Model evaluation
vi. Clustering (K-means)
vii. Association rules
B. KNIME
KNIME is an open source data analytics, reporting and integration platform that is written in Java and based on
Eclipse. It is freely available via www.knime.org for unrestricted use on the desktop and with versions that operate
under MS-Windows, Linux and Mac OSX. It allows analysis of 300 million customer addresses, 20 million cell
images and 10 million molecular structures. Additional plug-in allows the integration of methods of text mining,
image mining, as well as time series analysis. KNIME integrates various other open-source projects, for example the
ML algorithms from WEKA, the statistics package R project, as well as LIBSVM, JFreeChart, ImageJ, and the
Chemistry Development Kit. Tiwari et al., in [4] reviewed on predictive models and classification of inhibitors using
bioinformatics approach using the KNIME tools. Bioinformatics approach is a cost effective method for
classification of inhibitors and can be used for development of new drugs and their testing using predictive models.
Moorthy and Poongavanam in [5] who published their paper on the KNIME-based classification models for yellow
fever virus inhibition used KNIME for the classification model of yellow fever inhibition.
Most of the functions provided by KNIME are located in node repository area. Basically it consists of 14 elements
including the input output - a list of several input-output nodes, a database - a set of nodes for the interaction with a
DBMS, data manipulation - a list of nodes for the ETL, data views - a set of nodes allowing the visualisation of
results, statistics - a list of nodes for obtaining statistics on data mining, the KNIME nodes - for performing data
mining tasks, meta - a set of meta nodes like a nodes containing sub-workflows, misc - a miscellaneous node, time
series - a list of nodes to handle time during the analysis task, WEKA - a list of nodes available after the installation
of WEKA extension, which contains the nodes performing WEKA functionalities. KNIME also supports WEKA
functions and is more inclined towards graphical view. The difference between WEKA and KNIME in inserting the
data set is WEKA must only use arff or csv format. However, as problems may usually occur for csv format, it must
be ensured that the data set is properly pre-processed. KNIME can be used together with file reader so it can process
the data sets in both, arff or csv format.
C. SPM
Founded in 1983, Salford Systems introduces Salford Predictive Modeler (SPM) specialises in providing new-
generation data mining and predictive modelling software and consulting services for industries such as banking,
insurance, healthcare, pharmaceutical, telecommunications, transportation, manufacturing, retail and catalogue sales,
and education. The company’s software is currently installed in over 3,500 sites worldwide, including 300 major
universities. The SPM aims to provide users with a platform for developing predictive, descriptive, analytical model
using large and complex database. Sulaiman et al. in [6] studied on intelligent web caching using ML methods. In
their research, they proposed a scheme that integrated data mining techniques into a cache server for Web object
classification, thus improving its performance. Through a simulation environment using the Salford Systems and a

real data set, the proposed scheme could be an effective way in improving the performance of the Web caching
environment. Moreover, Magness, et al. in [7] proposed to use RF to provide predicted species distribution maps as
a metric for ecological inventory and monitoring programmes based on SPM tools.
The SPM software suite includes CART, MARS, TreeNet, Random Forests. The details of this software suite as one
of data mining tools are as listed below:
i. CART
Salford Systems' CART is the only decision-tree system based on the original CART code developed by world-
renowned Stanford University and University of California at Berkeley statisticians Breiman, Friedman, Olshen
and Stone.
ii. MARS
MARS stands for Multivariate adaptive Regression Splines, which can be used to produce results in a form
similar to traditional regression while capturing essential non-linearities and interactions.
iii. TreeNet
It can handle both classification and regression problems and has been proven to be remarkably effective in
traditional numeric data mining and text mining.
iv. Random Forests
RF is the best for analysing complex data structures embedded in small-to-moderate data sets for deep
understanding. It is a powerful new approach to data exploration, data analysis, and predictive modelling.
MATERIALS AND METHODS
Four data sets were used to be analysed based on WEKA, KNIME; while another three data sets were used for SPM.
The first data set is Iris Plant that contains 3 classes of 50 instances each, where each class refers to a type of iris
plant. One class is linearly separable from the other 2; the latter are NOT linearly separable from each other.
Predicted attribute is a class of iris plant. The total number of instances are 150 (50 in each of three classes,
respectively) and the number of attributes is 4 numeric, predictive attributes and the class. The attributes information
is the sepal length, sepal width, petal length and petal width in cm. Then the three classes are Iris Setosa, Iris
Versicolour and Iris Virginica. Iris dataset has been used by other researchers.
The second data set is a breast cancer database which was obtained from the University of Wisconsin Hospitals,
Madison from Dr. William H. Wolberg. The number of Instances is 699 and the number of attributes including the
class attribute is 10. The details of attribute (class attribute has been moved to last column) include the sample code
number, Clump Thickness, Uniformity of Cell Size, Uniformity of Cell Shape, Marginal Adhesion, Single Epithelial
Cell Size, Bare Nuclei, Bland Chromatin, Normal Nucleoli and Mitoses. The class is categorised into 2 for benign
and 4 for malignant [8, 9, 10].
Then, the third data set which is vehicle silhouette was used to classify a given silhouette as one of four types of
vehicles, using a set of features extracted from the silhouette. The vehicle may be viewed from one of many
different angles. It consists of 18 attributes, which are compactness, circularity, distance circularity, radius ratio,
pr.axis aspect ratio, maximum length aspect ratio, scatter ratio, elongatedness, pr.axis rectangularity, maximum
length rectangularity, scaled variance, scaled radius of gyration, skewness about, skewness, kurtosis about, kurtosis,
and hollows ratio. There are 4 classes in this data set namely the Opel, Saab, Bus and Van.
The last data set is Pima Indians diabetes database, the diagnostic binary-valued variable that investigates whether a
patient shows signs of diabetes according to World Health Organization criteria. For instance, if the 2 hour post-load
plasma glucose is at least 200 mg/dl at any survey examination or if found during routine medical care. Pima
Indians diabetes database consists of 768 instances. It has 8 attributes, which are, number of times pregnant, plasma
glucose concentration, a 2 hours in an oral glucose tolerance test, diastolic blood pressure (mm Hg), triceps skin fold
thickness (mm), 2 hour serum insulin (mu U/ml), body mass index (weight in kg/(height in m)^2), diabetes pedigree

function, and age (years). Their result algorithm makes a real-valued prediction between 0 and 1. Class value 1 is
interpreted as tested positive for diabetes.
Figure 1, shows the main interface for the WEKA that can function for explorer, experimenter, knowledge flow and
simple CLI. The explorer can be used to analyse data including the pre-processing of the data set. In addition, it
classifies cluster associate, selects attributes, and visualises a data set. The analysis can be done one by one data set.
For an experimenter, it makes analysis on multiple data sets with multiple algorithms at one time. So it is easier for
the users to test and compare many data with multiple algorithms. Figure 2 illustrates the interface of the knowledge
flow, which its application uses diagram to visualise the results. The benefit of using this knowledge flow is to make
it easier for users to view the flow of data set analysis. However, this paper does not cover simple CLI which is
based on commands prompt.
FIGURE 1. WEKA main interface FIGURE 2. Knowledge flow environment on WEKA
Figure 3 represents the main work area for KNIME and almost all functions are in node repository area on the left.
KNIME is the second tools which are used to analyse the data sets in this paper. Figure 4 shows the interface of
SPM tool. Users can see the decision tree on the main interface based on the different colours that are mentioned
before. All the details of data analysis results are provided on the SPM tools, whereby they can be explored one by
one using the application provided by tools. In this paper WEKA, KNIME and SPM tools are used for data
processing. Next section clarifies on results and discussions.
FIGURE 3. KNIME interface for working area FIGURE 4. Sample interface using SPM based on CART
There are some steps involved in processing the data in this paper beginning with data collection. The data was
collected from UCI Machine Learning repository center for ML and intelligent systems. Then, it underwent data
pre-processing process to clean and remove useless data. For data processing, users can use Microsoft Excel,
Matlab, WEKA, KNIME and SPM by themselves. Tools that are proposed in this paper support for the pre-
processing function. After that, users need to set the parameter setting on each tool. The details for parameter
setting are as follow:

A. WEKA
Choose Explorer, Experimenter or Knowledge Flow.
Explorer
i. Select data set to be tested.
ii. Then, in processing part users can filter and remove useless attributes.
iii. User experimenter can choose to classify, cluster, associate, select attributes or visualise.
iv. To classify, choose the classify menu tab, then choose the classifier (same as cluster, associate and select
attributes).
v. Select target class.
vi. Run the tool by clicking on start button.
vii. Display results.
viii. To view decision tree, users can right-click and choose visualise tree.
Experimenter
i. Choose the data by selecting New and add data set button.
ii. Set the result destination.
iii. Choose experiment type.
iv. Set the number of repetition.
v. Select algorithm at least one, user can select more than one algorithms at one time.
vi. Select Run on top menu, then start the programme.
vii. Select analyse menu at the top, then click on experiment button.
viii. Configure test results.
ix. Perform test, display results.
Knowledge Flow
i. Select data sources format as input by clicking and dragging into knowledge flow layout (do the same for
others).
ii. User is allowed to select classifiers, clusters or associations.
iii. Select the evaluation form to produce a result analysis.
iv. Select visualisation to view the data.
v. Click on each function, then select instance. Subsequently, click on another function symbol to connect the
relation between those functions.
vi. Right click on each symbol to setup the experiment by clicking on configure.
vii. Right click on classifier, then choose load model to run the analysis of WEKA.
viii. Display results by clicking on visualisation system and choose show results.
B. KNIME
i. Select on workspace.
ii. Select all the functions on node repository on left side in KNIME. For more details on selected function, the
node description is provided on the side.
iii. In KNIME, user is allowed to select input output, the data manipulation, data view or evaluation. It is quick and
the same as WEKA knowledge work flow.
iv. Then, click the triangle symbol on each of the end of the symbol. Subsequently, drag to another triangle to
connect the relation between those functions.
v. Right click on each symbol to setup the experiment by clicking on configure.
vi. Run analyse data by clicking on execute.
C. SPM
i. Choose data set.
ii. Select target class.
iii. Select predictors.
iv. Choose analyse; type either classification or regression.
v. Choose analyse method; type either, CART, MARS, Tree Net or RF.
vi. Select testing menu to choose method for testing.
vii. Click start on bottom button on the right-side.
viii. Results are displayed on SPM navigator.

Then analyse the data sets based on each tool and the results are produced. Figure 5 presents the flow of processing
data.
FIGURE 5. Flow of processing data
RESULTS AND DISCUSSIONS
This section explains and discusses the results gained during the analysis using the WEKA, KNIME and SPM tools.
A. WEKA
WEKA tool was used in the analysis of four data sets which are the Iris, Breast Cancer Wisconsin, Vehicle and
Diabetes. In this paper, five techniques were used for data analysis using the WEKA tool. Although there are other
techniques available, this paper only tested the techniques that are commonly used by other researches. On average,
the RF produced more accurate results compared to other techniques as illustrated in Table 1. Three out of five data
sets and RF presented the highest accuracy. Iris data set, using the NN techniques provided the highest accuracy
compared to other techniques supported by other performance measurements including the Cohen’s Kappa, ROC
and F-measure that provided high values results. There were some performance measurements used to validate the
results analysis including the accuracy, Cohen’s Kappa, F-measure, ROC, recall and precision. The following are
the sample calculation of the performance measurements. All of these performance measurements are automatically
calculated by the tools. Hence, tools help users to get the results faster compared to manual calculation. The
calculation for accuracy is as in equation 1.
Accuracy = (Σ True positive + Σ True negative) / Σ Total population (1)
Cohen’s Kappa is a means for evaluating the prediction performance of classifiers. It is a metric that compares an
observed accuracy with an expected accuracy (random chance). The calculation of Cohen’s Kappa is as in equation
2,
Data Collection
Data pre-processing
Sets parameter setting
Analyse the
data sets:
Succeed or not
Results
No
Yes
Cohen’s Kappa = (observed accuracy - expected accuracy) / (1 - expected accuracy) (2)
F-measure considers both the precision and the recall. The calculation of F-measure is as in equation 3,
F-measure = 2 x ((precision x recall) / (precision + recall)) (3)
While precision is the number of correct results divided by the number of all returned results as in equation 4. Recall
is the number of correct results divided by the number of results that should have been returned as in equation 5.
Precision = Σ True positive / Σ Test outcome positive (4)
Recall = Σ True positive / Σ Condition positive (5)
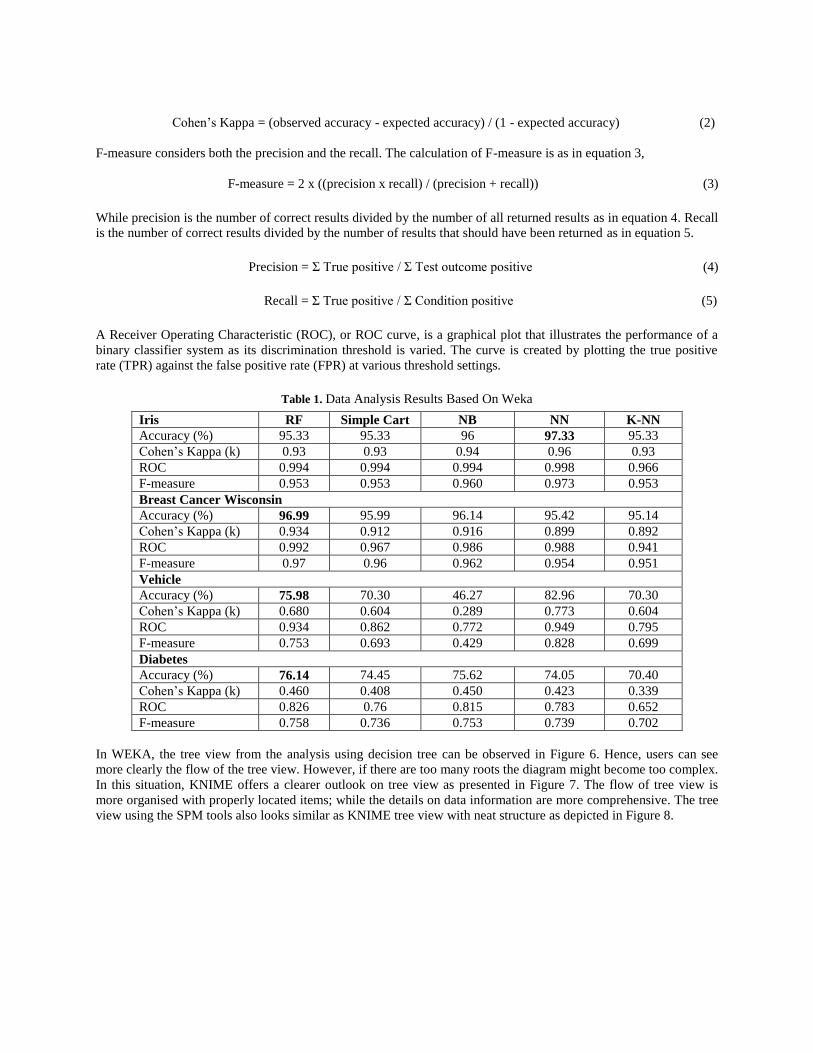
A Receiver Operating Characteristic (ROC), or ROC curve, is a graphical plot that illustrates the performance of a
binary classifier system as its discrimination threshold is varied. The curve is created by plotting the true positive
rate (TPR) against the false positive rate (FPR) at various threshold settings.
Table 1. Data Analysis Results Based On Weka
In WEKA, the tree view from the analysis using decision tree can be observed in Figure 6. Hence, users can see
more clearly the flow of the tree view. However, if there are too many roots the diagram might become too complex.
In this situation, KNIME offers a clearer outlook on tree view as presented in Figure 7. The flow of tree view is
more organised with properly located items; while the details on data information are more comprehensive. The tree
view using the SPM tools also looks similar as KNIME tree view with neat structure as depicted in Figure 8.
Iris RF Simple Cart NB NN K-NN
Accuracy (%) 95.33 95.33 96 97.33 95.33
Cohen’s Kappa (k) 0.93 0.93 0.94 0.96 0.93
ROC 0.994 0.994 0.994 0.998 0.966
F-measure 0.953 0.953 0.960 0.973 0.953
Breast Cancer Wisconsin
Accuracy (%) 96.99 95.99 96.14 95.42 95.14
Cohen’s Kappa (k) 0.934 0.912 0.916 0.899 0.892
ROC 0.992 0.967 0.986 0.988 0.941
F-measure 0.97 0.96 0.962 0.954 0.951
Vehicle
Accuracy (%) 75.98 70.30 46.27 82.96 70.30
Cohen’s Kappa (k) 0.680 0.604 0.289 0.773 0.604
ROC 0.934 0.862 0.772 0.949 0.795
F-measure 0.753 0.693 0.429 0.828 0.699
Diabetes
Accuracy (%) 76.14 74.45 75.62 74.05 70.40
Cohen’s Kappa (k) 0.460 0.408 0.450 0.423 0.339
ROC 0.826 0.76 0.815 0.783 0.652
F-measure 0.758 0.736 0.753 0.739 0.702

FIGURE 6. Sample of tree view in WEKA
B. KNIME
KNIME tool was used to test the four data sets namely, the Iris, Breast Cancer Wisconsin, vehicle and diabetes. In
KNIME, all four data sets were compared based on four techniques, which are decision tree, Naïve Bayes, Neural
Network and K-NN. Table 2, reveals the results of accuracy and value of Cohen’s Kappa. Based on the results,
decision tree is the best technique compared to others. It provides high accuracy for all data sets except for Iris using
decision tree. Cohen’s Kappa values are the highest on all the three data sets except for Iris. Based on Table 2, NN
technique supported with high value of Kappa and ROC is more suitable for Iris data set. It can be concluded that
the decision tree is one of the best techniques to produce high accuracy.
TABLE 2. Data analysis results based on KNIME
Iris Decision tree NB NN K-NN
Accuracy (%) 98 94.67 98.67 96
Cohen’s Kappa (k) 0.970 0.920 0.980 0.940
ROC 0.501 0.497 0.599 0.498
Breast Cancer Wisconsin
Accuracy (%) 98.86 95.14 65.52 79.40
Cohen’s Kappa (k) 0.975 0.896 0.511 0.520
ROC 0.860 0.852 0.859 0.702
Vehicle
Accuracy (%) 95.75 54.87 80.85 84.99
Cohen’s Kappa (k) 0.943 0.399 0.745 0.800
ROC 0.499 0.511 0.503 0.499
Diabetes
Accuracy (%) 96.35 72.92 78.52 85.81
Cohen’s Kappa (k) 0.92 0.443 0.515 0.681
ROC 0.694 0.697 0.682 0.654
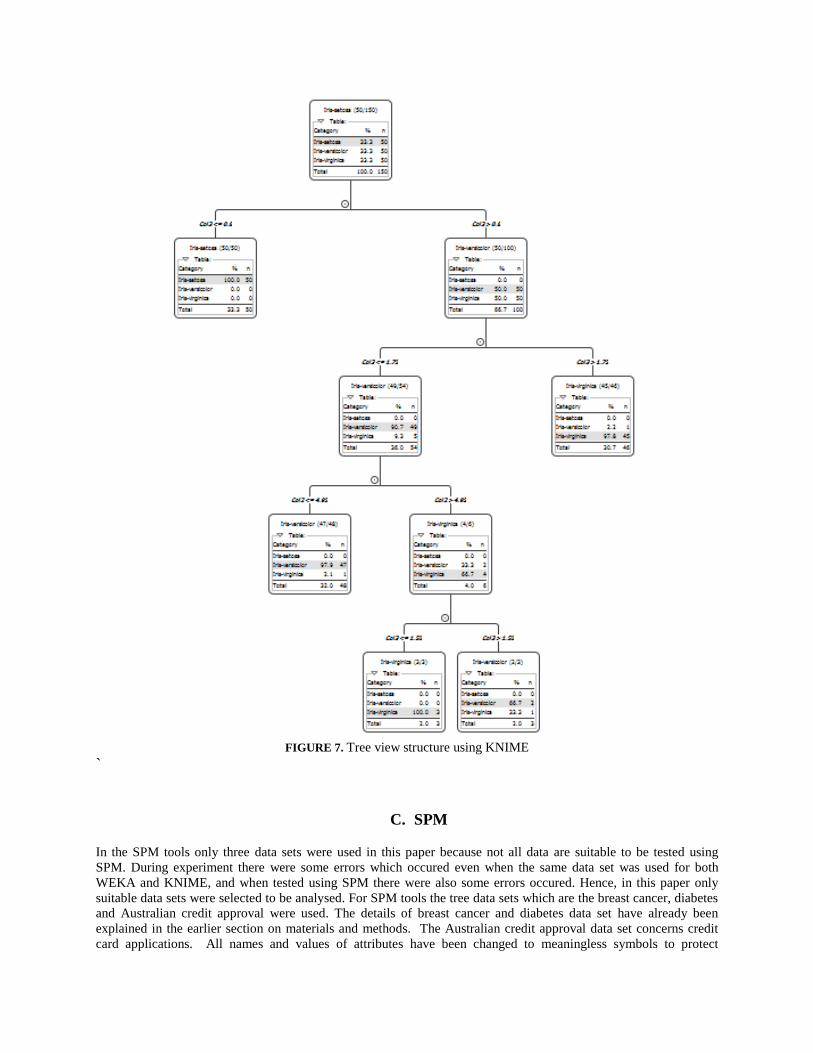
FIGURE 7. Tree view structure using KNIME
`
C. SPM
In the SPM tools only three data sets were used in this paper because not all data are suitable to be tested using
SPM. During experiment there were some errors which occured even when the same data set was used for both
WEKA and KNIME, and when tested using SPM there were also some errors occured. Hence, in this paper only
suitable data sets were selected to be analysed. For SPM tools the tree data sets which are the breast cancer, diabetes
and Australian credit approval were used. The details of breast cancer and diabetes data set have already been
explained in the earlier section on materials and methods. The Australian credit approval data set concerns credit
card applications. All names and values of attributes have been changed to meaningless symbols to protect

confidentiality of the data. This data set is interesting because there is a good mix of attributes including a
continuous, nominal with small numbers of values, and nominal with larger numbers of values. It consists of 690
number of instances and 14 attributes. The SPM tools allow users to save the navigator as a grove file, email it to
others, or just use it temporarily. The navigator will offer many views of the model and its findings, allow scoring
new data, and generation of formatted text reports, tables, charts, and comparative performance summaries of
competing models [11]. The initial navigator display is just a simple overview of the shape of the tree or its topology
in the top panel, and a predictive performance curve in the bottom panel. The tree topology, displayed in the top
panel of the Navigator window provides an immediate snapshot of the size and depth of the tree. The colour-coding
helps locate interesting terminal nodes. Bright red nodes isolate defaulters (target class 1) and deep blue nodes are
heavily populated with good borrowers. Other colours indicate more mixed results.
Table 3 presents the data analysis of this paper and selected data sets. It shows that MARS gives high accuracy for
Breast Cancer Wisconsin data set and Diabetes data set supported by ROC value. Tree Net provides a high accuracy
for the Australian credit approval data set. Other performance measurements like recall, precision and ROC are
provided using SPM tools. However, there are errors occurred in some data sets so they need to be pre-processed by
using other tools.
TABLE 3. Data analysis results based on SPM
Breast Cancer Wisconsin CART MARS Tree Net RF
Accuracy (%) 94.65 97.50 97.28 97.06
Recall 95.85 99.59 99.59 99.59
precision 88.51 91.95 91.25 90.57
ROC 0.947 0.991 0.989 0.991
Diabetes
Accuracy (%) 76.49 77.31 76.10 73.77
Recall 79.78 82.02 76.40 89.14
precision 61.38 61.52 62.77 53.36
ROC 0.800 0.849 0.835 0.824
Australian Credit Approval
Accuracy (%) 86.34 86.23 87.31 86.83
Recall 88.60 92.83 89.25 86.97
precision 81.68 78.51 83.03 83.96
ROC 0.908 0.937 0.939 0.935

FIGURE 8. Tree view structure using SPM
_CLU
MP_
THIC
KNES
S_ <
= 6.
50
Term
inal
Node
1
Clas
s =
nega
tive
Clas
sCa
ses
%
nega
tive
414
99.5
posi
tive
20.
5
W =
416
.00
N =
416
_CLU
MP_
THIC
KNES
S_ >
6.5
0
Term
inal
Node
2
Clas
s =
posi
tive
Clas
sCa
ses
%
nega
tive
240
.0
posi
tive
360
.0 W =
5.0
0
N =
5
_BAR
E_NU
CLEI
__ <
= 5.
50
Node
3
Clas
s =
nega
tive
_CLU
MP_
THIC
KNES
S_ <
= 6.
50
Clas
sCa
ses
%
nega
tive
416
98.8
posi
tive
51.
2
W =
421
.00
N =
421
_BAR
E_NU
CLEI
__ >
5.5
0
Term
inal
Node
3
Clas
s =
posi
tive
Clas
sCa
ses
%
nega
tive
112
.5
posi
tive
787
.5 W =
8.0
0
N =
8
_UNI
FORM
ITY_
OF_C
ELL_
SIZE
__ <
= 2.
50
Node
2
Clas
s =
nega
tive
_BAR
E_NU
CLEI
__ <
= 5.
50
Clas
sCa
ses
%
nega
tive
417
97.2
posi
tive
122.
8
W =
429
.00
N =
429
_BLA
ND_C
HROM
ATIN
__ <
= 3.
50
Term
inal
Node
4
Clas
s =
nega
tive
Clas
sCa
ses
%
nega
tive
1610
0.0
posi
tive
00.
0
W =
16.
00
N =
16
_BLA
ND_C
HROM
ATIN
__ >
3.5
0
Term
inal
Node
5
Clas
s =
posi
tive
Clas
sCa
ses
%
nega
tive
228
.6
posi
tive
571
.4 W =
7.0
0
N =
7
_UNI
FORM
ITY_
OF_C
ELL_
SHAP
E__
<= 2
.50
Node
5
Clas
s =
nega
tive
_BLA
ND_C
HROM
ATIN
__ <
= 3.
50
Clas
sCa
ses
%
nega
tive
1878
.3
posi
tive
521
.7 W =
23.
00
N =
23
_NOR
MAL
_NUC
LEOL
I_ <
= 1.
50
Term
inal
Node
6
Clas
s =
nega
tive
Clas
sCa
ses
%
nega
tive
610
0.0
posi
tive
00.
0
W =
6.0
0
N =
6
_SAM
PLE_
CODE
_NUM
BER_
<=
1171
198.
00
Term
inal
Node
7
Clas
s =
posi
tive
Clas
sCa
ses
%
nega
tive
325
.0
posi
tive
975
.0 W =
12.
00
N =
12
_SAM
PLE_
CODE
_NUM
BER_
> 1
1711
98.0
0
Term
inal
Node
8
Clas
s =
nega
tive
Clas
sCa
ses
%
nega
tive
480
.0
posi
tive
120
.0 W =
5.0
0
N =
5
_NOR
MAL
_NUC
LEOL
I_ >
1.5
0
Node
9
Clas
s =
posi
tive
_SAM
PLE_
CODE
_NUM
BER_
<=
1171
198.
00
Clas
sCa
ses
%
nega
tive
741
.2
posi
tive
1058
.8 W =
17.
00
N =
17
_UNI
FORM
ITY_
OF_C
ELL_
SIZE
__ <
= 4.
50
Node
8
Clas
s =
posi
tive
_NOR
MAL
_NUC
LEOL
I_ <
= 1.
50
Clas
sCa
ses
%
nega
tive
1356
.5
posi
tive
1043
.5 W =
23.
00
N =
23
_UNI
FORM
ITY_
OF_C
ELL_
SIZE
__ >
4.5
0
Term
inal
Node
9
Clas
s =
posi
tive
Clas
sCa
ses
%
nega
tive
27.
1
posi
tive
2692
.9
W =
28.
00
N =
28
_BAR
E_NU
CLEI
__ <
= 3.
77
Node
7
Clas
s =
posi
tive
_UNI
FORM
ITY_
OF_C
ELL_
SIZE
__ <
= 4.
50
Clas
sCa
ses
%
nega
tive
1529
.4
posi
tive
3670
.6 W =
51.
00
N =
51
_BAR
E_NU
CLEI
__ >
3.7
7
Term
inal
Node
10
Clas
s =
posi
tive
Clas
sCa
ses
%
nega
tive
84.
1
posi
tive
188
95.9
W =
196
.00
N =
196
_UNI
FORM
ITY_
OF_C
ELL_
SHAP
E__
> 2
.50
Node
6
Clas
s =
posi
tive
_BAR
E_NU
CLEI
__ <
= 3.
77
Clas
sCa
ses
%
nega
tive
239.
3
posi
tive
224
90.7
W =
247
.00
N =
247
_UNI
FORM
ITY_
OF_C
ELL_
SIZE
__ >
2.5
0
Node
4
Clas
s =
posi
tive
_UNI
FORM
ITY_
OF_C
ELL_
SHAP
E__
<= 2
.50
Clas
sCa
ses
%
nega
tive
4115
.2
posi
tive
229
84.8
W =
270
.00
N =
270
Node
1
Clas
s =
nega
tive
_UNI
FORM
ITY_
OF_C
ELL_
SIZE
__ <
= 2.
50
Clas
sCa
ses
%
nega
tive
458
65.5
posi
tive
241
34.5
W =
699
.00
N =
699

Table 4 summarises the proposed tools based on different criteria. After analysis process were conducted, a
summary on those tools was made. All of the tools are User Interface (UI) friendly which makes them easy to use
and understand. The data sets should be in correct data format as they have been processed by tools. The KNIME
provided extension installation, hence KNIME can add on the functions. The benefit of using the WEKA is it can
save users’ time by processing multiple data sets at the same time. However, WEKA can process data sets one by
one, as KNIME and SPM. Tree view is quite important for data classification for easy understanding and clear view.
Nevertheless, WEKA is weak in tree view interface because the tree-view cannot be clearly viewed as the tree is too
large. On the other hand, if users use the KNIME and SPM, they can view it more clearly and the details on the tree
can be viewed one by one. WEKA and KNIME provide a variety of ML techniques, while SPM only focuses on
four techniques.
TABLE 4. Summary on tools in data science for better processing
WEKA KNIME SPM
UI friendliness Yes Yes Yes
Types of data sets arff, csv arff, csv csv, dat, txt
Graphical view diagram Yes Yes Yes
Pre-processing Yes No Yes
Extension installation No Yes No
Multiple processing data
sets on same time
Yes No No
Tree view interface Weak Strong Strong
Multiple techniques Yes Yes Limited
Focuses only 4 techniques
Tools License Open source Open source Trial version (request
permission)
CONCLUSION
Tools can help users in data processing and analysis more efficiently and with reduced errors. Based on the results
of this paper, we can conclude that there is no perfect tool but the tool that suits us best, and sometimes we would
need to grasp several tools to use them in combination. It depends on users’ data sets, and the kind of results users
want. Users can refer to Table 4 to get an idea on which tools suitable for their research based on categories. If users
intend to use the tools to enhance understanding on graphical view, they can choose KNIME which functions are
mostly useful for graphical view. For users who focus on ML of CART, MARS, Tree Net and RF, and have large
data sets, SPM are proposed because it is more suitable and provides the details of explanation on the results.
WEKA is recommended for users who need multiple ML techniques to be tested, without much graphical view.
Many previous researchers used WEKA in their study. However, if users prefer WEKA functions but need graphical
view, they can use KNIME because KNIME can install extension for WEKA. Hence, users can use WEKA function
in KNIME. Tools help users to enhance data processing including speed up the data process analysis and produce
accurate results. The tools are normally open sources, which users can get it for free. Besides, by using tools the data
analysis can be viewed clearly in forms of graphical view or diagram. Hence, tools assist users to easily manage
their data processing and data sets analysis with multiple algorithms.
ACKNOWLEDGMENTS
This work is supported by the Ministry of Education and Universiti Teknologi Malaysia (UTM). This paper is
financially supported by MyBrain15, UTM Flagship Grant Q.J130000.2428.02G70, FRGS Grant,
R.J130000.7828.4F634 and E-Science Fund, R.J130000.7928.4S117. The authors would like to express their
deepest thank to the Research Management Centre (RMC), UTM for the support in this research and development,
and Soft Computing Research Group (SCRG) for the motivation in making this research accomplishment.

REFERENCES
[1] N. Sobti and K. Arora, Implementation of Data Mining Decision Tree Algorithms on Mobile Computing Environment, Int.
J. Recent Technol. Eng., vol. 3, no. 2, pp. 28–31, 2014.
[2] T. R. Patil and S. S. Sherekar, Performance Analysis of Naive Bayes and J48 Classification Algorithm for Data
Classification, Int. J. Comput. Sci. Appl., vol. 6, no. 2, pp. 256–261, 2013.
[3] I. Maglogiannis and C. Doukas, Intelligent Health Monitoring Based on Pervasive Technologies and Cloud Computing,
Int. J. Artif. Intell. Tools, vol. 23, no. 03, p. 1460001, Jun. 2014.
[4] M. Tiwari, S. Govil, and S. Kumar, A Review on Predictive Models and Classification of Inhibitors using Bioinformatics
Approach, Int. J. Pharm. Technol. Biotechnol., vol. 2, no. 1, pp. 26–32, 2015.
[5] N. S. H. N. Moorthy and V. Poongavanam, The KNIME based classification models for yellow fever virus inhibition, RSC
Adv. R. Soc. Chem., vol. 5, no. 19, pp. 14663–14669, 2015.
[6] S. Sulaiman, S. M. Shamsuddin, A. Abraham, and S. Sulaiman, Inteligent Web Caching Using Machine Learning
Methods., Neural Netw. World, ISSN 1210-0552, vol. 21, no. 5, pp. 429–452, 2011.
[7] D. R. Magness, F. Huettmann, and J. M. Morton, Using Random Forests to Provide Predicted Species Distribution Maps as
a Metric for Ecological Inventory & Monitoring Programs, Springer-Verlag Berlin Heidelb. 2008, vol. 229, pp. 209–229,
2008.
[8] H. Wolberg and O.L. Mangasarian, Multisurface method of pattern separation for medical diagnosis applied to breast
cytology, Proceedings of the National Academy of Sciences, U.S.A., Volume 87, December 1990, pp 9193-9196.
[9] O. L. Mangasarian, R. Setiono, and W.H. Wolberg, Pattern recognition via linear programming: Theory and application to
medical diagnosis, in: Large-scale numerical optimization, Thomas F. Coleman and YuyingLi, editors, SIAM Publications,
Philadelphia 1990, pp 22-30.
[10] K. P. Bennett and O. L. Mangasarian, Robust linear programming discrimination of two linearly inseparable sets,
Optimization Methods and Software 1, 1992, 23-34 (Gordon & Breach Science Publishers).
[11] Salford System, SPM Users Guide, pp. 1–30, 2013.