top-down approach to estimation of the regional carbon...
TRANSCRIPT
1
Top-down approach to estimation of the regional carbon budget in West Siberia
Study of the regional carbon fluxes through inverse modeling of the Siberian atmospheric CO2 observation
S.Maksyutov, T. Machida, K. Shimoyama, N. Kadygrov (1), G. Inoue(1,2) , P. Patra (3) , M. Arshinov, O. Krasov, B. Belan (4) , N. Fedoseev (5),
(1) NIES, Tsukuba (2)now at Nagoya, Univ. (3) FRCGC, Yokohama, Japan, (4) IAO, Tomsk (5) PI, Yakutsk, Russia

2
Top-down approach to estimation of the regional carbon budget in West Siberia
Contents:
• What do we know from bottom up data
• Atmospheric observations
• Inverse modeling of the Siberian surface CO2 fluxes

3
Bottom up. Empirical modeling of the forest carbon stock inventory and dynamicsForest state account (FSA) based: provides observations of the wood stock and
annual change in forest area by category (felling, fire, etc),
Top-down approach to estimation of the regional carbon budget in West Siberia
FSA: regions and enterprises
FSA data for each unit: wood stock, area - by species, age class
Net Primary ProductionPinus sibirica
0100200300400500600700800
0 100 200 300Age, Year
IIIIIIIVVVa
Carbon, g/m
2/yr
Empirical dynamic model
NPP map
Region Average NBP, t C/ha yr in 1961-2003
Alt Kray 0.54 Rep Altai 0.89 Kemerovo 0.43 Kurgan 0.92 Novosib 0.76 Omsk 0.72 Sverdlovsk 0.49 Tomsk 0.35 Tjumen 0.47 Khanty- Mansi 0.25 Jamalo-Nenetsk 0.18 Cheljabinsk 0.76 Shvidenko et al 2006

4
Surgut1993 -
Novosibirsk-1997 Yakutsk-1998
Top-down approach to estimation of the regional carbon budget in West Siberia
1. Observations: airborne air sampling and analysis
5
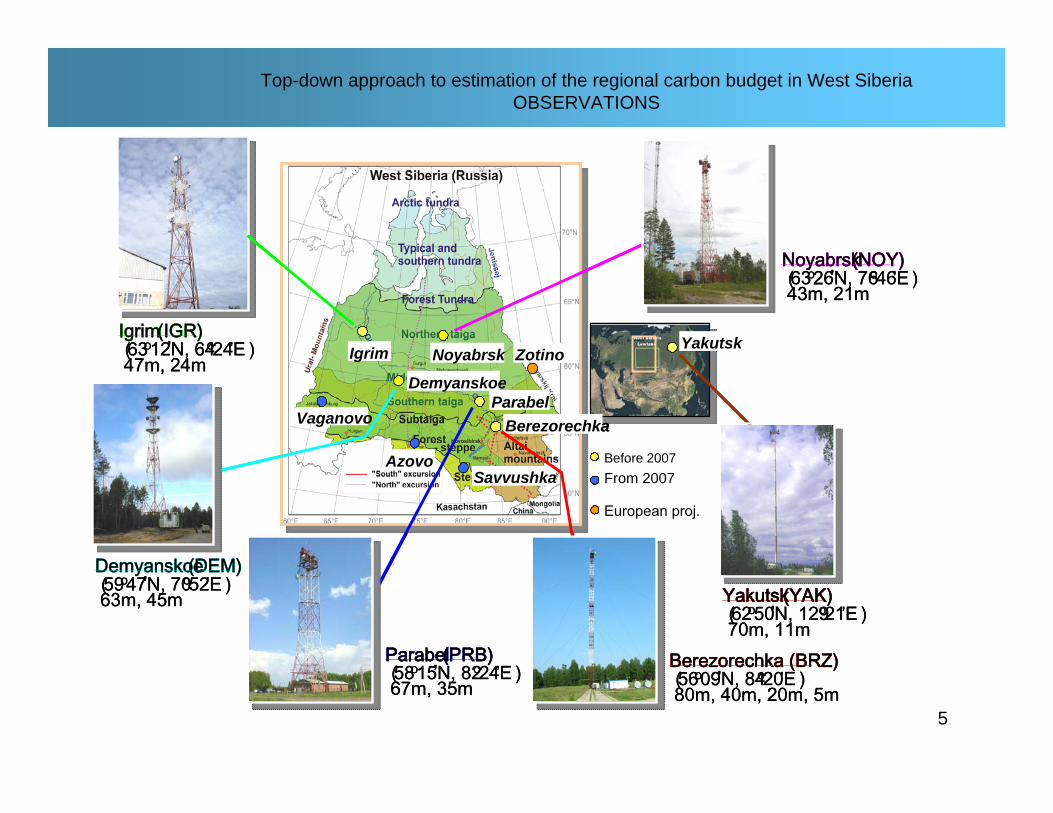
Top-down approach to estimation of the regional carbon budget in West SiberiaOBSERVATIONS
Igrim(IGR)(63o12’N, 64o24’E)47m, 24m
Demyanskoe(DEM)(59o47’N, 70o52’E)63m, 45m
Parabel(PRB)(58o15’N, 82o24’E)67m, 35m
Berezorechka (BRZ)(56o09’N, 84o20’E)80m, 40m, 20m, 5m
Yakutsk(YAK)(62o50’N, 129o21’E)70m, 11m
Noyabrsk(NOY)(63o26’N, 76o46’E)43m, 21m
Before 2007From 2007
European proj.
NoyabrskIgrim
Beloretsk
Demyanskoe
Azovo
ParabelBerezorechka
Savuushka
ZotinoYakutsk
Igrim(IGR)(63o12’N, 64o24’E)47m, 24m
Demyanskoe(DEM)(59o47’N, 70o52’E)63m, 45m
Parabel(PRB)(58o15’N, 82o24’E)67m, 35m
Berezorechka (BRZ)(56o09’N, 84o20’E)80m, 40m, 20m, 5m
Yakutsk(YAK)(62o50’N, 129o21’E)70m, 11m
Noyabrsk(NOY)(63o26’N, 76o46’E)43m, 21m
NoyabrskIgrim
Vaganovo
Demyanskoe
Azovo
ParabelBerezorechka
Savvushka
ZotinoYakutsk
6
350375400425
350375400425
CO
2 [p
pm]
63m 45m
350375400425
350375400425
43m 21m
350375400425
350375400425
47m 24m
350375400425
350375400425
67m 35m
2002 2003 2004 2005 2006 2007350375400425
350375400425
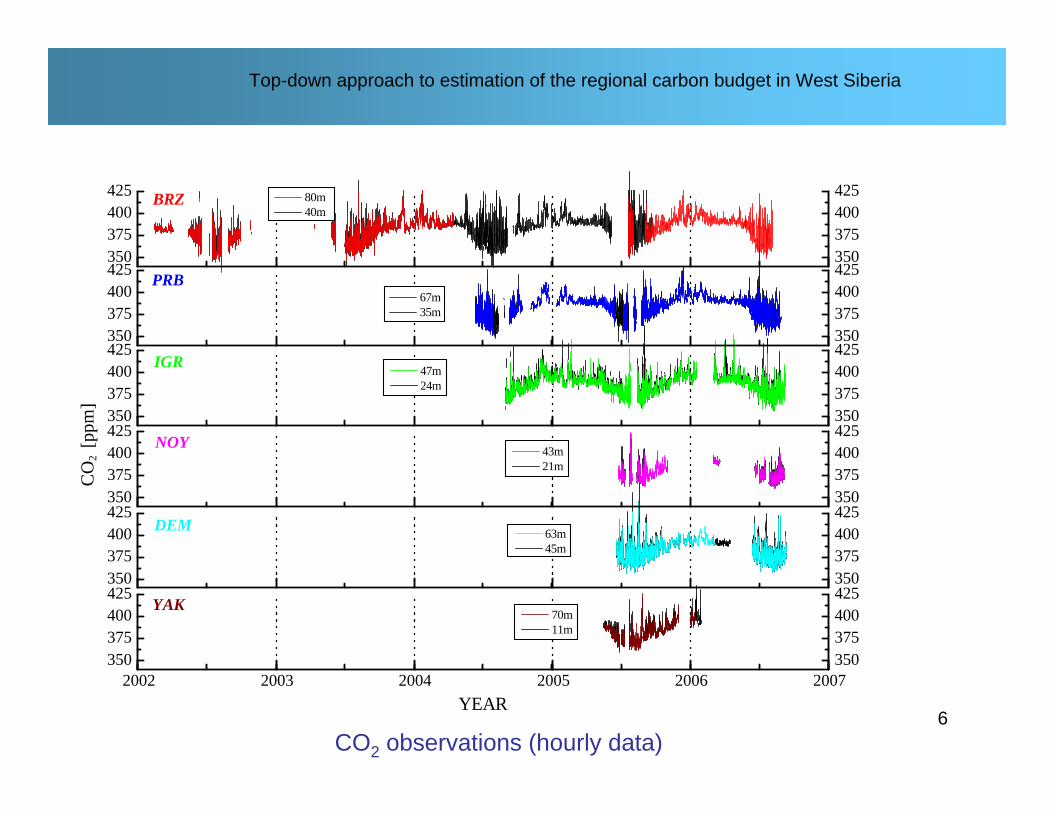
BRZ
DEM
NOY
IGR
PRB
YEAR
70m 11m
YAK
350375400425
350375400425
80m 40m
CO2 observations (hourly data)
Top-down approach to estimation of the regional carbon budget in West Siberia
7
Method: Inverse model of the atmospheric CO2 transport is applied to constrain surface CO2 fluxes by the observed patterns of the atmospheric CO2 (with seasonal cycles)
Components:
1. Forward models: terrestrial ecosystem flux model (hourly to seasonal scale): coupled to atmospheric transport model.
2. Inverse model of atmospheric transport, finding optimal corrections to the surface fluxes
Top-down approach to estimation of the regional carbon budget in West Siberia

8
Gurney et al Nature 2002
Inverse modeling of regional CO2 fluxes with annual mean observations.
West ----- Longitude ------ East
Observations (North of 30N)
Higher CO2 over emitting regions: N.America, Europe, East Asia
Coarse resolution inverse model, with annual mean observation used to constrain annual mean fluxes.
9
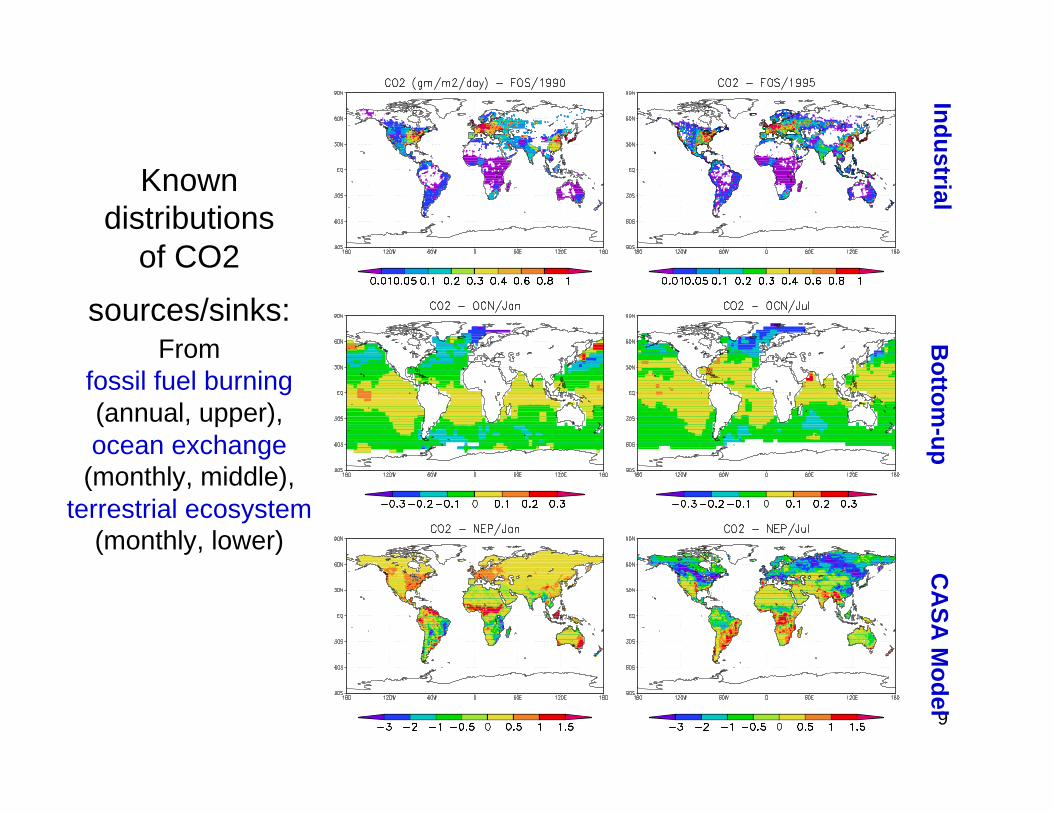
Known distributions
of CO2
sources/sinks:From
fossil fuel burning(annual, upper), ocean exchange
(monthly, middle),terrestrial ecosystem
(monthly, lower)
IndustrialB
ottom-up
CA
SA M
odel

10
Asian flux estimates, improved by recent observations.
-30 0 30 60 90 120 150 180
0
30
60
90
Tokyo-Sydney
HaterumaSendai
Ohchi-Ishi
Yakutsk
Novosibirsk
Surgut la la
-2
-1.5
-1
-0.5
0
0.5
1
1.5
Bor
NA
mer
ica
Tem
p N
Am
eric
a
Bor
eal
Asi
a
Tem
pera
teA
sia
SE
Asi
a
Euro
pe
W P
acifi
cO
cn
Pg
C /
year
basic inversionour estimate
Changes in estimated annual mean fluxes (left) due to adding the observations ( right )
Maksyutov et al., Tellus, 2003

11
Observation network optimization
Maksyutov et al., EOS, AGU Fall, 2002Patra & Maksyutov, GRL, 2002
Adding new observations reduces uncertainty of the flux estimates

12
Observation system optimization
Estimated impact of JAL vertical profiles only
Tem
pAm
er.a
T.Eu
ras.b
T.Eu
ras.c
T.Eu
ras.d
SEAs
ia.a
SEAs
ia.b
Aust
ral.b
Aust
ral.c
Euro
pe.a
N.Pa
cific
W.P
acifi
c
S.Pa
cific
Tr.In
dian
jal-all 54 42 19 35 66 35 43 16 37 11 12 12 12beijing 1 2 11 22 1 0 0 0 0 2 0 0 0pusan 1 6 6 14 1 0 0 0 0 3 1 0 0seoul 1 2 8 17 1 0 0 0 0 3 0 0 0shanghai 1 38 3 6 2 2 0 0 0 2 1 0 0hongkong 1 2 0 2 3 20 0 0 0 1 1 0 0manila 0 1 0 1 1 4 0 0 0 0 0 0 0denpasar 0 0 0 0 9 1 1 11 0 0 1 0 3jakarta 0 0 0 0 22 1 0 4 0 0 3 0 4kuala 0 1 0 0 37 1 0 0 0 0 3 0 0singapore 0 0 0 0 60 2 0 0 0 0 3 0 0brisbane 0 0 0 0 0 0 13 1 0 0 1 5 0sydney 0 0 0 0 0 0 39 1 0 0 1 11 1london 0 0 0 0 0 0 0 0 2 1 0 0 0amsterdam 0 0 0 0 0 0 0 0 5 1 0 0 0paris 0 0 0 0 0 0 0 0 10 1 0 0 0milano 0 0 0 0 0 0 0 0 29 1 0 0 0rome 0 0 0 0 0 0 0 0 9 1 0 0 0losangeles 44 2 1 2 2 0 0 0 0 4 2 0 0honolulu 1 4 0 2 2 0 0 0 0 3 1 0 0lasvegas 42 2 1 2 1 0 0 0 0 4 1 0 0eastasia 2 41 17 34 4 30 0 0 0 5 1 0 1seasia 1 2 0 1 64 12 1 15 0 0 5 2 9europe 0 0 0 0 1 0 0 0 37 3 0 0 0usa 54 5 1 3 3 0 0 0 0 8 2 0 0austral 1 0 0 0 1 0 42 1 0 0 1 12 1
JAL continuous observations(CONTRAIL)5 aircrafts (747, 777)FAA certified equipment
Moderate resolution inversion42 land, 11 oceanSame as (Patra et al JGR 2005)-SOFIS paper
Percent flux uncertainty reduction
Maksyutov et al 2004, report to JAL project advisory board meeting
13
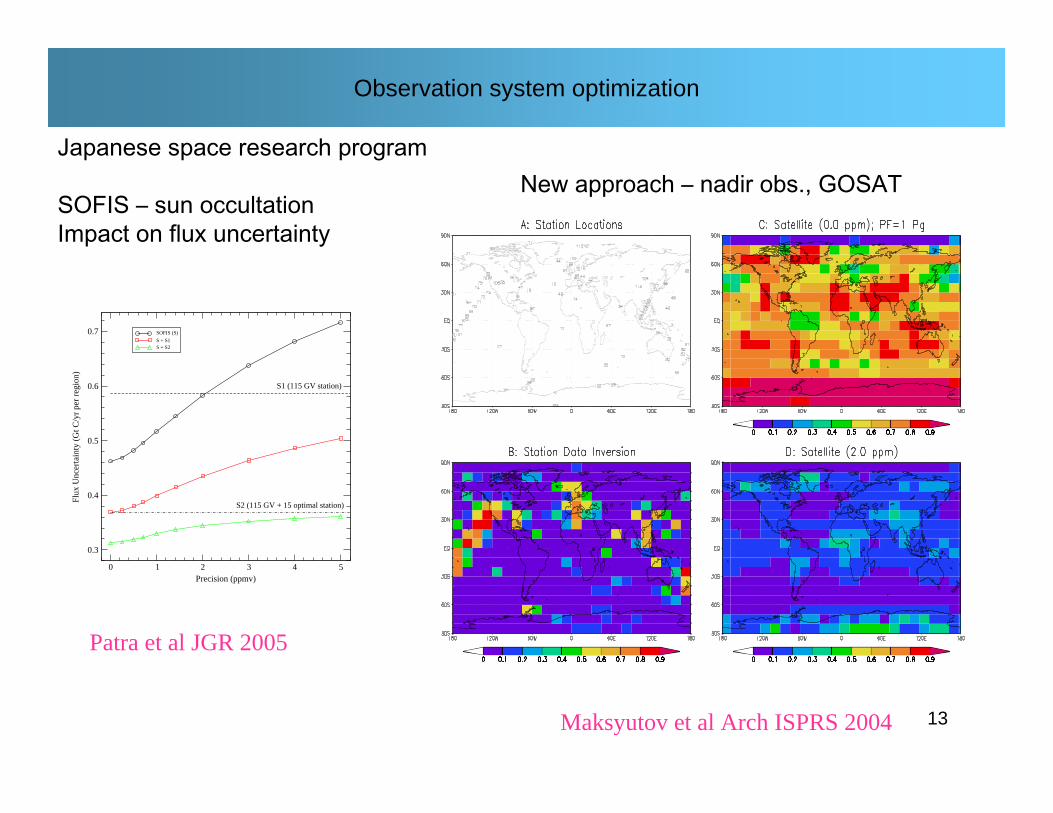
Observation system optimization
0 1 2 3 4 5Precision (ppmv)
0.3
0.4
0.5
0.6
0.7
Flux
Unc
erta
inty
(G
t C/y
r pe
r re
gion
)
S2 (115 GV + 15 optimal station)
S1 (115 GV station)
SOFIS (S)
S + S1S + S2
Japanese space research program
SOFIS – sun occultationImpact on flux uncertainty
Patra et al JGR 2005
New approach – nadir obs., GOSAT
Maksyutov et al Arch ISPRS 2004

14
Top down: atmospheric transport and inverse modeling
Region based inversion FRCGC Japanglobal 2.5deg transport, monthly fluxes
Planned: grid based inversion LSCE France,Global 3x4 deg, weekly fluxes
340
360
380
400
CO
2 [ppm
]
Berezorechka Aircraft (1km)
2002 2003 2004 2005
Monthly flux pulses from each region are used to fit monthly average observations weekly fluxes at each grid are constrained
by each separate afternoon average concentrations (night-time excluded), 4-D var asiimilation to be used

15
without Siberian dataCASA model + inversion
with Siberian data
Use of the tower dataReduces uncertainty
Earlier drawdown of sink
Seasonal variation of CO2 Flux (South half of the WS) with 64 regioninversion and 1 year (2005) of tower data

16
W. Siberian inverse model fluxes with 66 region inversion
Red - inverse model, green – CASA, blue – Sim-Cycle Inverse model 2004 – spin-up, 2005 - use actual data
West Siberia North
West Siberia South
Several sites No observations
Central Siberia North
Central Siberia South
17
Top-down approach to estimation of the regional carbon budget in West Siberia
Summary
Inverse model study of seasonal flux variability suggests the observational data are useful for estimating the regional CO2 flux seasonality, provided there are enough observations, adjusting and validating large scale flux simulations with biogeochemical models at monthly and daily time scale. The annual mean flux estimation requires more accurate analysis and is relatively less robust.
Using the tower observations we confirmed that earlier flux drawdown simulated by Sim-Cycle model in northern West Siberia is fitting the observed CO2 better than with CASA model. Amplitude-wise both models agree with inversion within model uncertainty range during warm season.
18
Top-down approach to estimation of the regional carbon budget in West Siberia
Acknowledgements
LeadershipG. Inoue (NIES), T. Nakazawa (Tohoku Univ)
Observations and data analysis conducted byT. Watai, A. Shinohara (NIES)
M. Arshinov, O. Krasnov, D. Davidov, A. Fofonov (IAO), N.Fedoseev (PI) N.Vinnichenko(CAO)
Inverse modeling designed byP. Rayner (LSCE) and Transcom collaborators