top-picks - february 2018 · plyboards india, dewan housing finance, gic housing, siyaram silk...
TRANSCRIPT

Please refer to important disclosures at the end of this report (01 February 2018) 1
Union Budget 2018 -19 Review
Top-Picks - February 2018
Angel top-picks updated post budget 2018-19
Budget Highlight: The budget for 2018-19 has reinforced the government’s
agenda to bring reforms and improve macros. The FM maintained FY2018 fiscal deficit
target of 3.5% and has set a target of 3.3% for FY2019, which is slightly higher than
the earlier target of 3%. However, with improving tax compliance and GST collection,
the target looks achievable. In this Budget, FM has particularly focused on
strengthening agriculture and rural economy by way of MSP support and fund
allocation for various rural related infrastructure programs to boost the distressed rural
economy. In the budget, FM has announced 10% long term capital gain tax on equity
investments over `1lakh, which is slightly negative for market in the near term.
However, in our view, equity investments still remain the most attractive asset class
compared to others like fixed deposits.
Our View: We believe that this budget is overall neutral for markets. However, on the
positive side, the FM has not stretched Fiscal deficit target by announcing unproductive
measures like loan waiver schemes, as the previous government did in past budget.
Going forward, we expect the market would perform better on the back of growth in
corporate earnings. Further, credit growth is showing recovery, inflation is looking
manageable and global economy continues to be buoyant. Moreover, current
government has initiated many other reforms likes GST, Jan Dhan Accounts, IBC and
recapitalization of PSU banks which should be overall positive for Indian economy.
Angel top-picks conviction remains intact post budget: In this Budget, we
have observed that government remained mainly in focus on rural, housing and
infrastructure. Angel Top-Picks portfolio already has exposure in these sector stocks
which are well placed to capture the budget benefits (like Asian Granito, Century
Plyboards India, Dewan Housing Finance, GIC Housing, Siyaram Silk Mills).
Going ahead, we expect GDP growth would be more visible due to strong reforms
taken by government, in addition to buoyant global economy. We expect the strong
growth in consumption sectors to benefit the stocks in our Top-Picks like LT Foods, Blue
Star, KEI Industries and Maruti Suzuki.
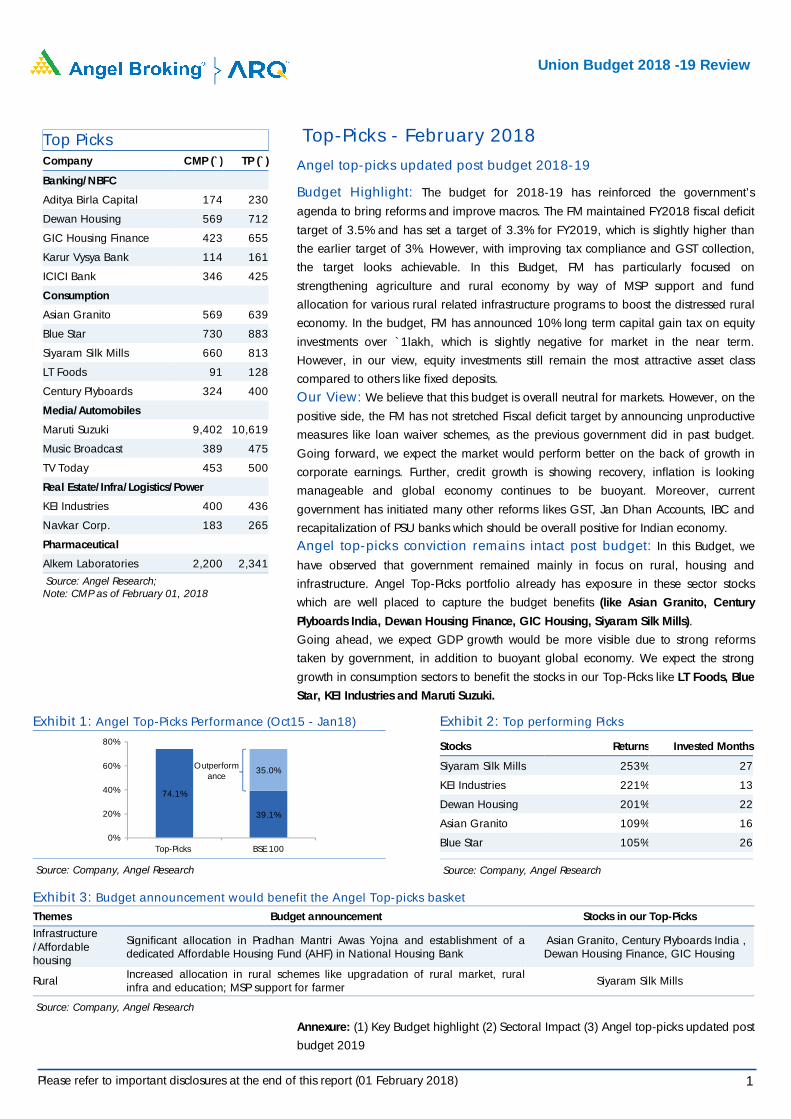
Exhibit 1: Angel Top-Picks Performance (Oct15 - Jan18)
Source: Company, Angel Research
Exhibit 2: Top performing Picks
Stocks Returns Invested Months
Siyaram Silk Mills 253% 27
KEI Industries 221% 13
Dewan Housing 201% 22
Asian Granito 109% 16
Blue Star 105% 26
Source: Company, Angel Research
Exhibit 3: Budget announcement would benefit the Angel Top-picks basket
Themes Budget announcement Stocks in our Top-Picks
Infrastructure /Affordable housing
Significant allocation in Pradhan Mantri Awas Yojna and establishment of a dedicated Affordable Housing Fund (AHF) in National Housing Bank
Asian Granito, Century Plyboards India , Dewan Housing Finance, GIC Housing
Rural Increased allocation in rural schemes like upgradation of rural market, rural infra and education; MSP support for farmer
Siyaram Silk Mills
Source: Company, Angel Research
Annexure: (1) Key Budget highlight (2) Sectoral Impact (3) Angel top-picks updated post
budget 2019
74.1%
39.1%
35.0%
0%
20%
40%
60%
80%
Top-Picks BSE 100
Outperformance
Top Picks Company CMP (`) TP (`)
Banking/NBFC
Aditya Birla Capital 174 230
Dewan Housing 569 712
GIC Housing Finance 423 655
Karur Vysya Bank 114 161
ICICI Bank 346 425
Consumption
Asian Granito 569 639
Blue Star 730 883
Siyaram Silk Mills 660 813
LT Foods 91 128
Century Plyboards 324 400
Media/Automobiles
Maruti Suzuki 9,402 10,619
Music Broadcast 389 475
TV Today 453 500
Real Estate/Infra/Logistics/Power
KEI Industries 400 436
Navkar Corp. 183 265
Pharmaceutical
Alkem Laboratories 2,200 2,341
Source: Angel Research; Note: CMP as of February 01, 2018
Please refer to important disclosures at the end of this report (01 February 2018)
2
Union Budget 2018 -19 Review
Key Budget Highlights Fiscal deficit target for FY2019 under comfortable range
The FM has revised FY2018 fiscal deficit target to 3.5% and set a target of 3.3% for FY2019, which is slightly higher than the earlier target of 3%. However, with improving tax compliance and GST collection, the target looks achievable in spite of rising bond yields. Moreover, the continued focus on reducing the fiscal deficit while improving ease of doing business, transparency in governance and bringing bigger reforms will benefit the country. Government has given a lofty disinvestment target of `100,000cr for FY18 and `80,000cr for FY19 to support its fiscal maths.
Budget Maths
While the tax-to-GDP ratio would increase in FY19E by 56 bps as compared to FY18, the total expenditure as a % of GDP is likely to remain stable at 13% level. In FY2018, government saw strong indirect tax collections (5.9% of GDP/ 9% yoy growth), which is further expected to increase by 20% in FY19E on account of better GST collections. Dividend and other receipts have fallen by ~`36000cr, leading to a fall in non tax revenues by 30% yoy. Any failure to undertake disinvestments would lead to fiscal slippages.
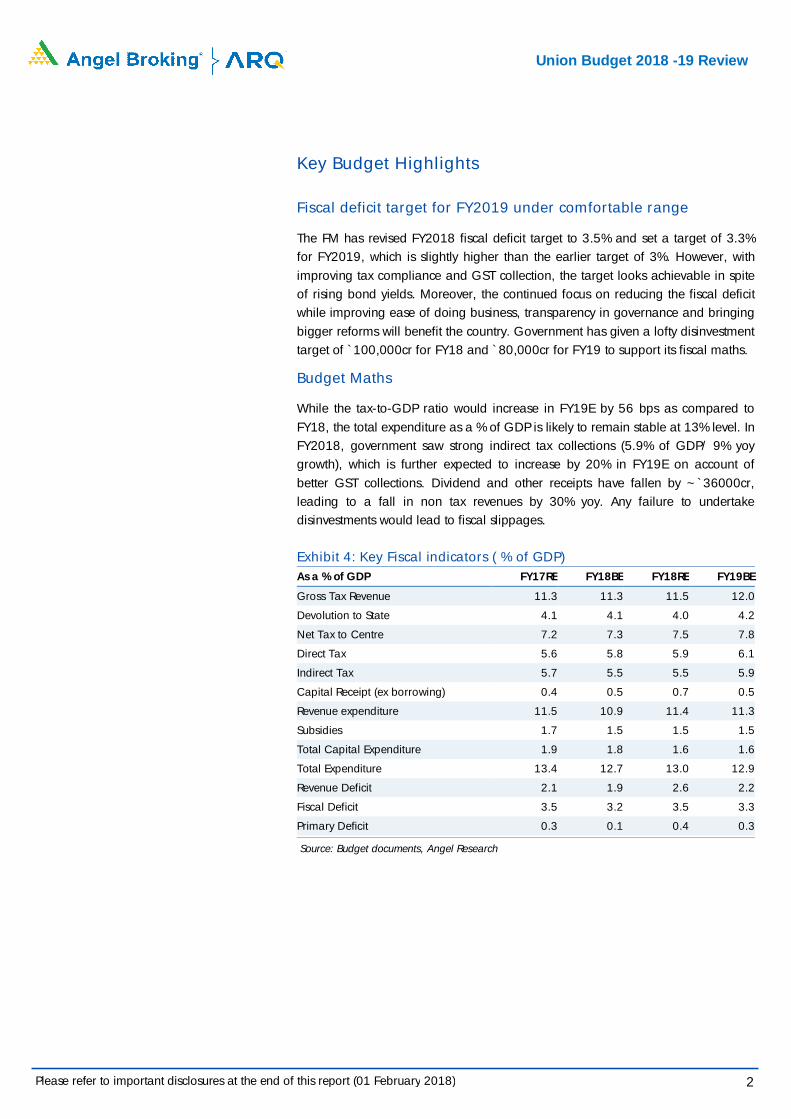
Exhibit 4: Key Fiscal indicators ( % of GDP) As a % of GDP FY17RE FY18BE FY18RE FY19BE
Gross Tax Revenue 11.3 11.3 11.5 12.0
Devolution to State 4.1 4.1 4.0 4.2
Net Tax to Centre 7.2 7.3 7.5 7.8
Direct Tax 5.6 5.8 5.9 6.1
Indirect Tax 5.7 5.5 5.5 5.9
Capital Receipt (ex borrowing) 0.4 0.5 0.7 0.5
Revenue expenditure 11.5 10.9 11.4 11.3
Subsidies 1.7 1.5 1.5 1.5
Total Capital Expenditure 1.9 1.8 1.6 1.6
Total Expenditure 13.4 12.7 13.0 12.9
Revenue Deficit 2.1 1.9 2.6 2.2
Fiscal Deficit 3.5 3.2 3.5 3.3
Primary Deficit 0.3 0.1 0.4 0.3
Source: Budget documents, Angel Research
Please refer to important disclosures at the end of this report (01 February 2018)
3
Union Budget 2018 -19 Review
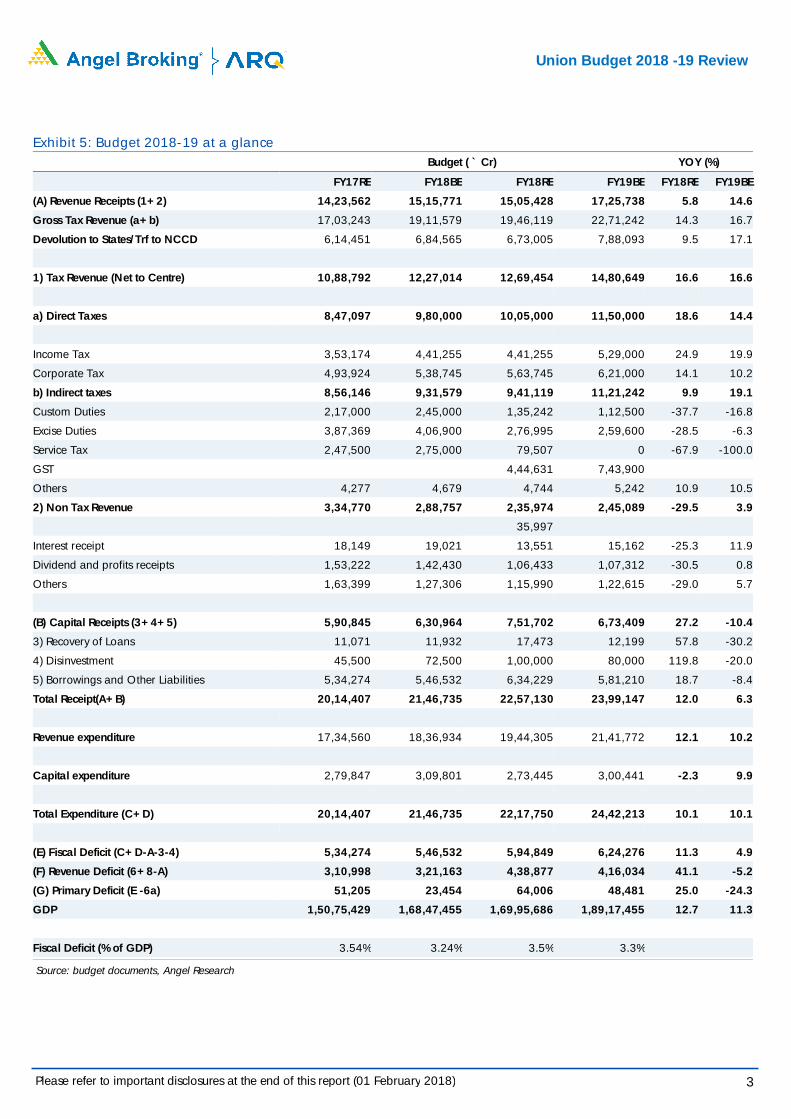
Exhibit 5: Budget 2018-19 at a glance
Budget ( ` Cr) YOY (%)
FY17RE FY18BE FY18RE FY19BE FY18RE FY19BE
(A) Revenue Receipts (1+2) 14,23,562 15,15,771 15,05,428 17,25,738 5.8 14.6
Gross Tax Revenue (a+b) 17,03,243 19,11,579 19,46,119 22,71,242 14.3 16.7
Devolution to States/Trf to NCCD 6,14,451 6,84,565 6,73,005 7,88,093 9.5 17.1
1) Tax Revenue (Net to Centre) 10,88,792 12,27,014 12,69,454 14,80,649 16.6 16.6
a) Direct Taxes 8,47,097 9,80,000 10,05,000 11,50,000 18.6 14.4
Income Tax 3,53,174 4,41,255 4,41,255 5,29,000 24.9 19.9
Corporate Tax 4,93,924 5,38,745 5,63,745 6,21,000 14.1 10.2
b) Indirect taxes 8,56,146 9,31,579 9,41,119 11,21,242 9.9 19.1
Custom Duties 2,17,000 2,45,000 1,35,242 1,12,500 -37.7 -16.8
Excise Duties 3,87,369 4,06,900 2,76,995 2,59,600 -28.5 -6.3
Service Tax 2,47,500 2,75,000 79,507 0 -67.9 -100.0
GST 4,44,631 7,43,900
Others 4,277 4,679 4,744 5,242 10.9 10.5
2) Non Tax Revenue 3,34,770 2,88,757 2,35,974 2,45,089 -29.5 3.9
35,997
Interest receipt 18,149 19,021 13,551 15,162 -25.3 11.9
Dividend and profits receipts 1,53,222 1,42,430 1,06,433 1,07,312 -30.5 0.8
Others 1,63,399 1,27,306 1,15,990 1,22,615 -29.0 5.7
(B) Capital Receipts (3+4+5) 5,90,845 6,30,964 7,51,702 6,73,409 27.2 -10.4
3) Recovery of Loans 11,071 11,932 17,473 12,199 57.8 -30.2
4) Disinvestment 45,500 72,500 1,00,000 80,000 119.8 -20.0
5) Borrowings and Other Liabilities 5,34,274 5,46,532 6,34,229 5,81,210 18.7 -8.4
Total Receipt(A+B) 20,14,407 21,46,735 22,57,130 23,99,147 12.0 6.3
Revenue expenditure 17,34,560 18,36,934 19,44,305 21,41,772 12.1 10.2
Capital expenditure 2,79,847 3,09,801 2,73,445 3,00,441 -2.3 9.9
Total Expenditure (C+D) 20,14,407 21,46,735 22,17,750 24,42,213 10.1 10.1
(E) Fiscal Deficit (C+D-A-3-4) 5,34,274 5,46,532 5,94,849 6,24,276 11.3 4.9
(F) Revenue Deficit (6+8-A) 3,10,998 3,21,163 4,38,877 4,16,034 41.1 -5.2
(G) Primary Deficit (E -6a) 51,205 23,454 64,006 48,481 25.0 -24.3
GDP 1,50,75,429 1,68,47,455 1,69,95,686 1,89,17,455 12.7 11.3
Fiscal Deficit (% of GDP) 3.54% 3.24% 3.5% 3.3%
Source: budget documents, Angel Research
Please refer to important disclosures at the end of this report (01 February 2018)
4
Union Budget 2018 -19 Review
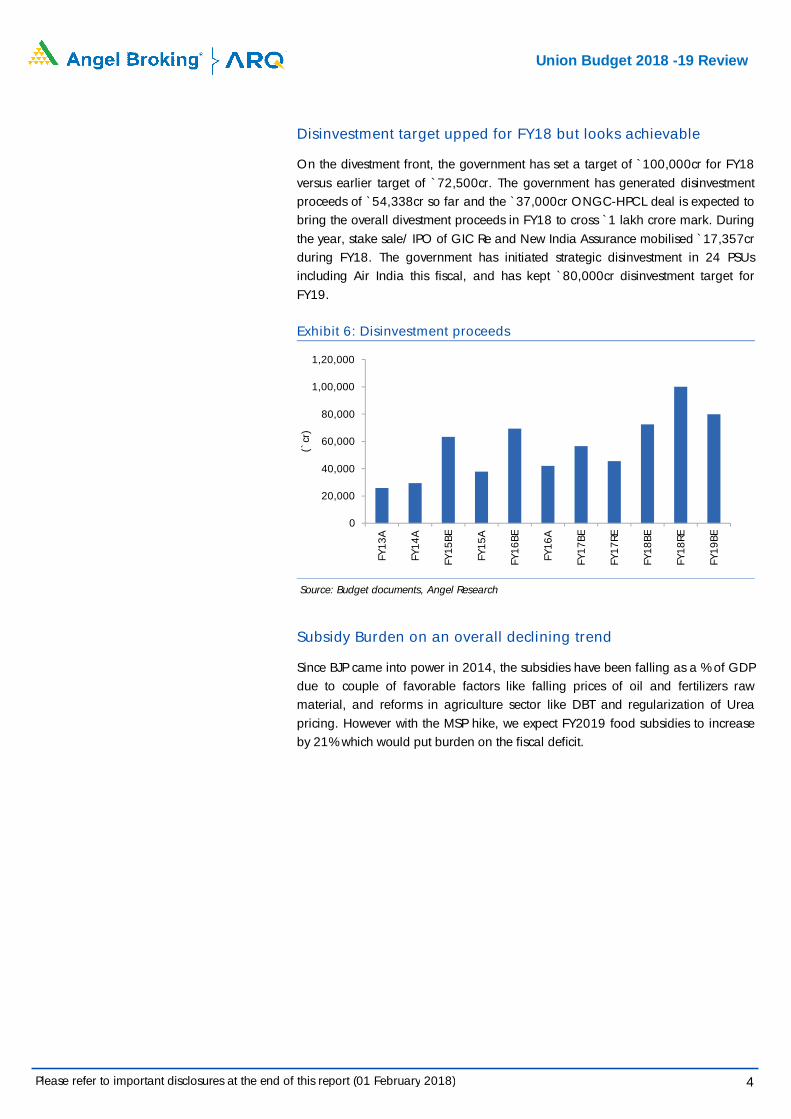
Disinvestment target upped for FY18 but looks achievable
On the divestment front, the government has set a target of `100,000cr for FY18 versus earlier target of `72,500cr. The government has generated disinvestment proceeds of `54,338cr so far and the `37,000cr ONGC-HPCL deal is expected to bring the overall divestment proceeds in FY18 to cross `1 lakh crore mark. During the year, stake sale/ IPO of GIC Re and New India Assurance mobilised `17,357cr during FY18. The government has initiated strategic disinvestment in 24 PSUs including Air India this fiscal, and has kept `80,000cr disinvestment target for FY19.
Exhibit 6: Disinvestment proceeds
Source: Budget documents, Angel Research
Subsidy Burden on an overall declining trend
Since BJP came into power in 2014, the subsidies have been falling as a % of GDP due to couple of favorable factors like falling prices of oil and fertilizers raw material, and reforms in agriculture sector like DBT and regularization of Urea pricing. However with the MSP hike, we expect FY2019 food subsidies to increase by 21% which would put burden on the fiscal deficit.
0
20,000
40,000
60,000
80,000
1,00,000
1,20,000
FY13
A
FY14
A
FY15
BE
FY15
A
FY16
BE
FY16
A
FY17
BE
FY17
RE
FY18
BE
FY18
RE
FY19
BE
(`cr
)
Please refer to important disclosures at the end of this report (01 February 2018)
5
Union Budget 2018 -19 Review
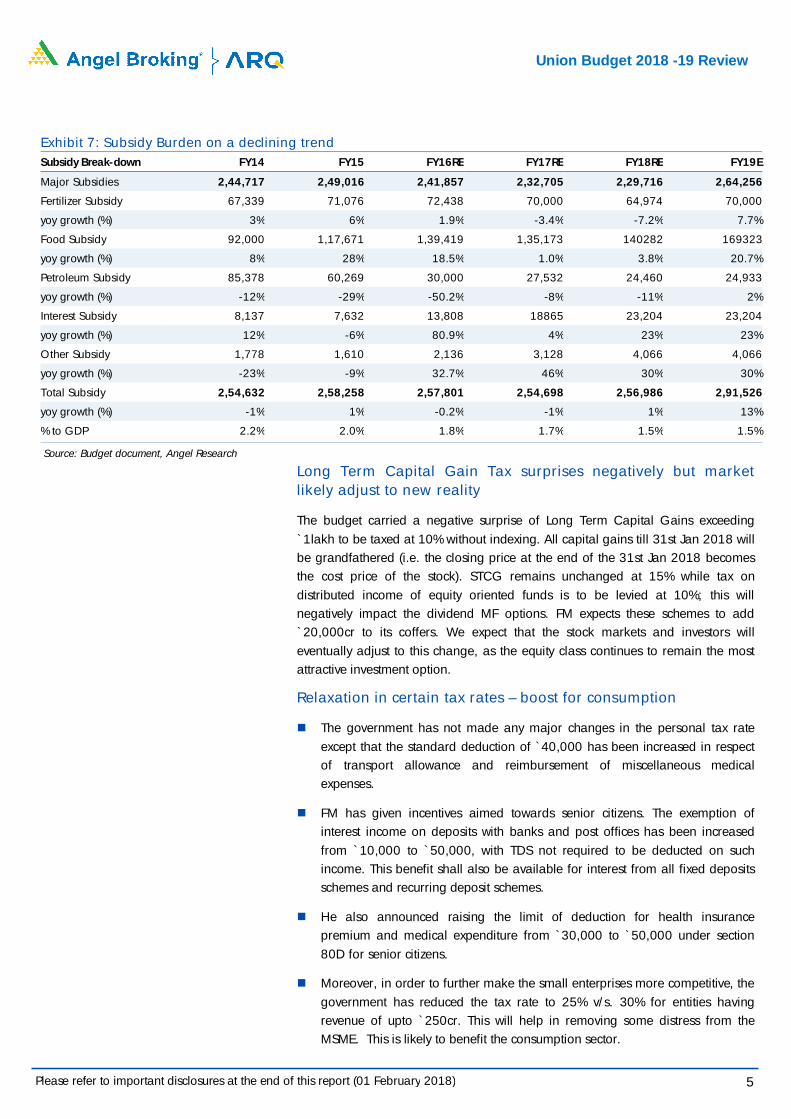
Exhibit 7: Subsidy Burden on a declining trend Subsidy Break-down FY14 FY15 FY16RE FY17RE FY18RE FY19E
Major Subsidies 2,44,717 2,49,016 2,41,857 2,32,705 2,29,716 2,64,256
Fertilizer Subsidy 67,339 71,076 72,438 70,000 64,974 70,000
yoy growth (%) 3% 6% 1.9% -3.4% -7.2% 7.7%
Food Subsidy 92,000 1,17,671 1,39,419 1,35,173 140282 169323
yoy growth (%) 8% 28% 18.5% 1.0% 3.8% 20.7%
Petroleum Subsidy 85,378 60,269 30,000 27,532 24,460 24,933
yoy growth (%) -12% -29% -50.2% -8% -11% 2%
Interest Subsidy 8,137 7,632 13,808 18865 23,204 23,204
yoy growth (%) 12% -6% 80.9% 4% 23% 23%
Other Subsidy 1,778 1,610 2,136 3,128 4,066 4,066
yoy growth (%) -23% -9% 32.7% 46% 30% 30%
Total Subsidy 2,54,632 2,58,258 2,57,801 2,54,698 2,56,986 2,91,526
yoy growth (%) -1% 1% -0.2% -1% 1% 13%
% to GDP 2.2% 2.0% 1.8% 1.7% 1.5% 1.5%
Source: Budget document, Angel Research
Long Term Capital Gain Tax surprises negatively but market likely adjust to new reality
The budget carried a negative surprise of Long Term Capital Gains exceeding `1lakh to be taxed at 10% without indexing. All capital gains till 31st Jan 2018 will be grandfathered (i.e. the closing price at the end of the 31st Jan 2018 becomes the cost price of the stock). STCG remains unchanged at 15% while tax on distributed income of equity oriented funds is to be levied at 10%; this will negatively impact the dividend MF options. FM expects these schemes to add `20,000cr to its coffers. We expect that the stock markets and investors will eventually adjust to this change, as the equity class continues to remain the most attractive investment option.
Relaxation in certain tax rates – boost for consumption
The government has not made any major changes in the personal tax rate except that the standard deduction of `40,000 has been increased in respect of transport allowance and reimbursement of miscellaneous medical expenses.
FM has given incentives aimed towards senior citizens. The exemption of interest income on deposits with banks and post offices has been increased from `10,000 to `50,000, with TDS not required to be deducted on such income. This benefit shall also be available for interest from all fixed deposits schemes and recurring deposit schemes.
He also announced raising the limit of deduction for health insurance premium and medical expenditure from `30,000 to `50,000 under section 80D for senior citizens.
Moreover, in order to further make the small enterprises more competitive, the government has reduced the tax rate to 25% v/s. 30% for entities having revenue of upto `250cr. This will help in removing some distress from the MSME. This is likely to benefit the consumption sector.

Please refer to important disclosures at the end of this report (01 February 2018)
6
Union Budget 2018 -19 Review
Sectoral Impact
Please refer to important disclosures at the end of this report (01 February 2018)
7
Union Budget 2018 -19 Review
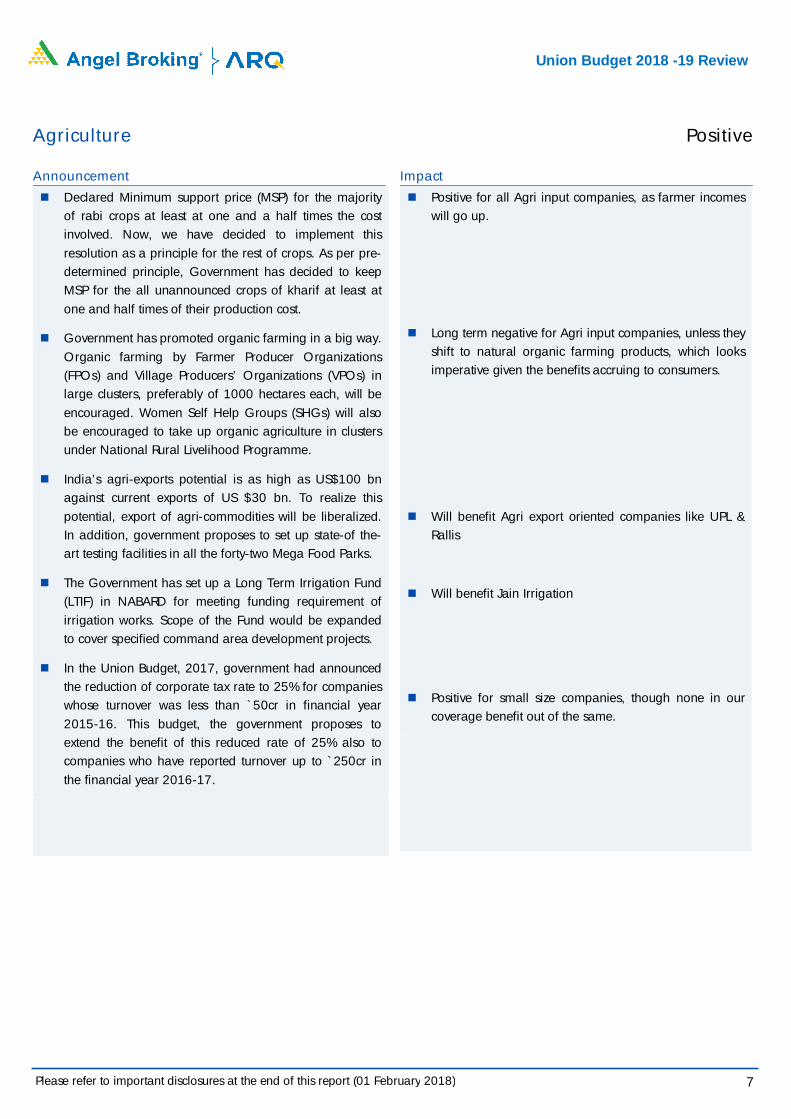
Agriculture Positive
Announcement
Declared Minimum support price (MSP) for the majority of rabi crops at least at one and a half times the cost involved. Now, we have decided to implement this resolution as a principle for the rest of crops. As per pre-determined principle, Government has decided to keep MSP for the all unannounced crops of kharif at least at one and half times of their production cost.
Government has promoted organic farming in a big way. Organic farming by Farmer Producer Organizations (FPOs) and Village Producers’ Organizations (VPOs) in large clusters, preferably of 1000 hectares each, will be encouraged. Women Self Help Groups (SHGs) will also be encouraged to take up organic agriculture in clusters under National Rural Livelihood Programme.
India’s agri-exports potential is as high as US$100 bn against current exports of US $30 bn. To realize this potential, export of agri-commodities will be liberalized. In addition, government proposes to set up state-of the- art testing facilities in all the forty-two Mega Food Parks.
The Government has set up a Long Term Irrigation Fund (LTIF) in NABARD for meeting funding requirement of irrigation works. Scope of the Fund would be expanded to cover specified command area development projects.
In the Union Budget, 2017, government had announced the reduction of corporate tax rate to 25% for companies whose turnover was less than `50cr in financial year 2015-16. This budget, the government proposes to extend the benefit of this reduced rate of 25% also to companies who have reported turnover up to `250cr in the financial year 2016-17.
Impact
Positive for all Agri input companies, as farmer incomes will go up.
Long term negative for Agri input companies, unless they shift to natural organic farming products, which looks imperative given the benefits accruing to consumers.
Will benefit Agri export oriented companies like UPL & Rallis
Will benefit Jain Irrigation
Positive for small size companies, though none in our coverage benefit out of the same.
Please refer to important disclosures at the end of this report (01 February 2018)
8
Union Budget 2018 -19 Review
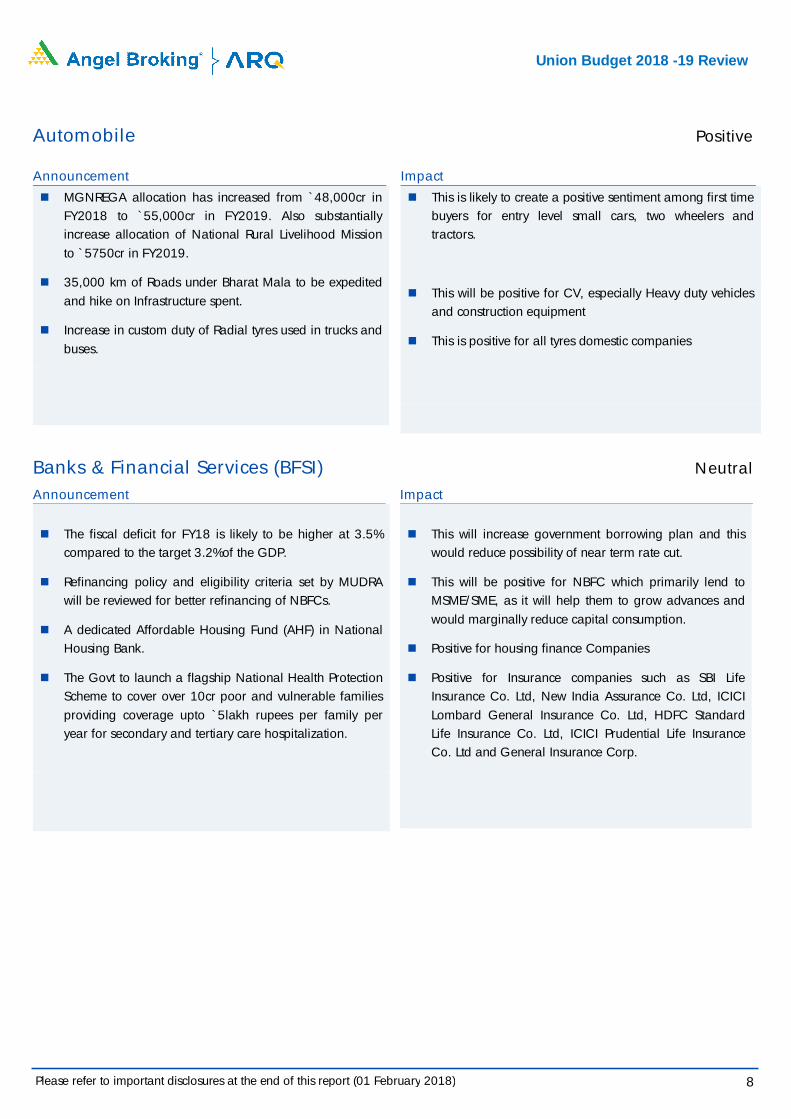
Automobile Positive
Announcement
MGNREGA allocation has increased from `48,000cr in FY2018 to `55,000cr in FY2019. Also substantially increase allocation of National Rural Livelihood Mission to `5750cr in FY2019.
35,000 km of Roads under Bharat Mala to be expedited and hike on Infrastructure spent.
Increase in custom duty of Radial tyres used in trucks and buses.
Impact
This is likely to create a positive sentiment among first time buyers for entry level small cars, two wheelers and tractors.
This will be positive for CV, especially Heavy duty vehicles and construction equipment
This is positive for all tyres domestic companies
Banks & Financial Services (BFSI) Neutral
Announcement
The fiscal deficit for FY18 is likely to be higher at 3.5%
compared to the target 3.2%of the GDP.
Refinancing policy and eligibility criteria set by MUDRA will be reviewed for better refinancing of NBFCs.
A dedicated Affordable Housing Fund (AHF) in National Housing Bank.
The Govt to launch a flagship National Health Protection Scheme to cover over 10cr poor and vulnerable families providing coverage upto `5lakh rupees per family per year for secondary and tertiary care hospitalization.
Impact
This will increase government borrowing plan and this
would reduce possibility of near term rate cut.
This will be positive for NBFC which primarily lend to MSME/SME, as it will help them to grow advances and would marginally reduce capital consumption.
Positive for housing finance Companies
Positive for Insurance companies such as SBI Life Insurance Co. Ltd, New India Assurance Co. Ltd, ICICI Lombard General Insurance Co. Ltd, HDFC Standard Life Insurance Co. Ltd, ICICI Prudential Life Insurance Co. Ltd and General Insurance Corp.
Please refer to important disclosures at the end of this report (01 February 2018)
9
Union Budget 2018 -19 Review
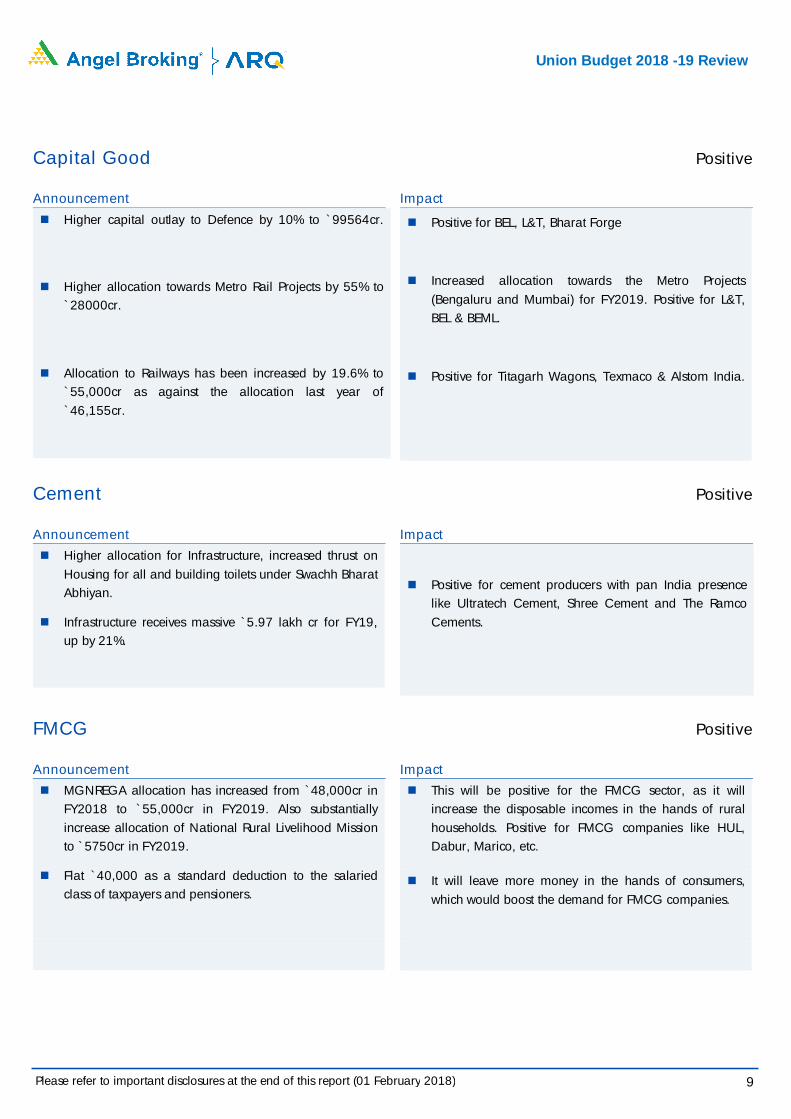
Capital Good Positive
Announcement
Higher capital outlay to Defence by 10% to `99564cr.
Higher allocation towards Metro Rail Projects by 55% to `28000cr.
Allocation to Railways has been increased by 19.6% to `55,000cr as against the allocation last year of `46,155cr.
Impact
Positive for BEL, L&T, Bharat Forge
Increased allocation towards the Metro Projects (Bengaluru and Mumbai) for FY2019. Positive for L&T, BEL & BEML.
Positive for Titagarh Wagons, Texmaco & Alstom India.
Cement Positive
Announcement
Higher allocation for Infrastructure, increased thrust on Housing for all and building toilets under Swachh Bharat Abhiyan.
Infrastructure receives massive `5.97 lakh cr for FY19, up by 21%.
Impact
Positive for cement producers with pan India presence like Ultratech Cement, Shree Cement and The Ramco Cements.
FMCG Positive
Announcement
MGNREGA allocation has increased from `48,000cr in FY2018 to `55,000cr in FY2019. Also substantially increase allocation of National Rural Livelihood Mission to `5750cr in FY2019.
Flat `40,000 as a standard deduction to the salaried class of taxpayers and pensioners.
Impact
This will be positive for the FMCG sector, as it will increase the disposable incomes in the hands of rural households. Positive for FMCG companies like HUL, Dabur, Marico, etc.
It will leave more money in the hands of consumers, which would boost the demand for FMCG companies.
Please refer to important disclosures at the end of this report (01 February 2018)
10
Union Budget 2018 -19 Review
Infrastructure Positive
Announcement
Higher allocation towards the Roads & Highways sector up ~16% yoy to `71,000cr. Further, allocated `19,000cr for construction of roads in the rural areas under Pradhan Mantri Gram Sadak Yojana (PMGSY).
Infrastructure receives massive `5.97lakh cr for FY19, up by 21%.
`600cr allocated to the Sagarmala & Inland Water Transport projects.
Impact
Positive for Road EPC players like KNR Constructions, Sadbhav Engineering, IRB Infra & J Kumar Infra project
This will benefit diversified EPC players like L&T, Bhel, HCC, NBCC
Positive for EPC players like MBL Infrastructure and
others focused on inland waterways projects like Mercator & Dredging Corp.
Information Technology Positive
Announcement
In the Union Budget, 2017, government had announced the reduction of corporate tax rate to 25% for companies whose turnover was less than `50cr in financial year 2015-16. This budget, the government proposes to extend the benefit of this reduced rate of 25% also to companies who have reported turnover up to `250cr in the financial year 2016-17.
Impact
Positive for small size companies, though none in our coverage benefit out of the same.
Please refer to important disclosures at the end of this report (01 February 2018)
11
Union Budget 2018 -19 Review
Metals & Mining Positive
Announcement
Rise in allocation to infra space.
Impact
Marginally positive for steel producers, as it would lead to incrementally better demand for steel.
Pharmaceutical Positive
Announcement
The National Health Policy, 2017 has envisioned Health and Wellness Centres as the foundation of India’s health system. These 1.5 lakh centres will bring health care system closer to the homes of people. The Budget has committed `1200cr in this budget for this flagship programme, which will also include free essential drugs and diagnostic services.
Government plans to launch a flagship National Health Protection Scheme to cover over 10cr poor and vulnerable families (approximately 50cr beneficiaries) providing coverage upto 5 lakh rupees per family per year for secondary and tertiary care hospitalization.
Government has estimated that the schematic budgetary expenditure on health, education and social protection for 2018-19 is `1.38 lakh cr against estimated expenditure of `1.22 lakh cr in BE 2017-18. The same for Health & Family welfare is estimated to be `52,800cr V/s `47,353cr in FY2018.
In the Union Budget, 2017, government had announced the reduction of corporate tax rate to 25% for companies whose turnover was less than `50cr in financial year 2015-16. This budget, the government proposes to extend the benefit of this reduced rate of 25% also to companies who have reported turnover up to `250cr in the financial year 2016-17.
Impact
Positive for the sector, though given government will be low margin business.
Positive for the sector
Positive for the sector
Positive for small size companies, though none in our coverage benefit out of the same.
Please refer to important disclosures at the end of this report (01 February 2018)
12
Union Budget 2018 -19 Review
Angel top-picks updated post budget 2018-19
Please refer to important disclosures at the end of this report (01 February 2018)
13
Union Budget 2018 -19 Review
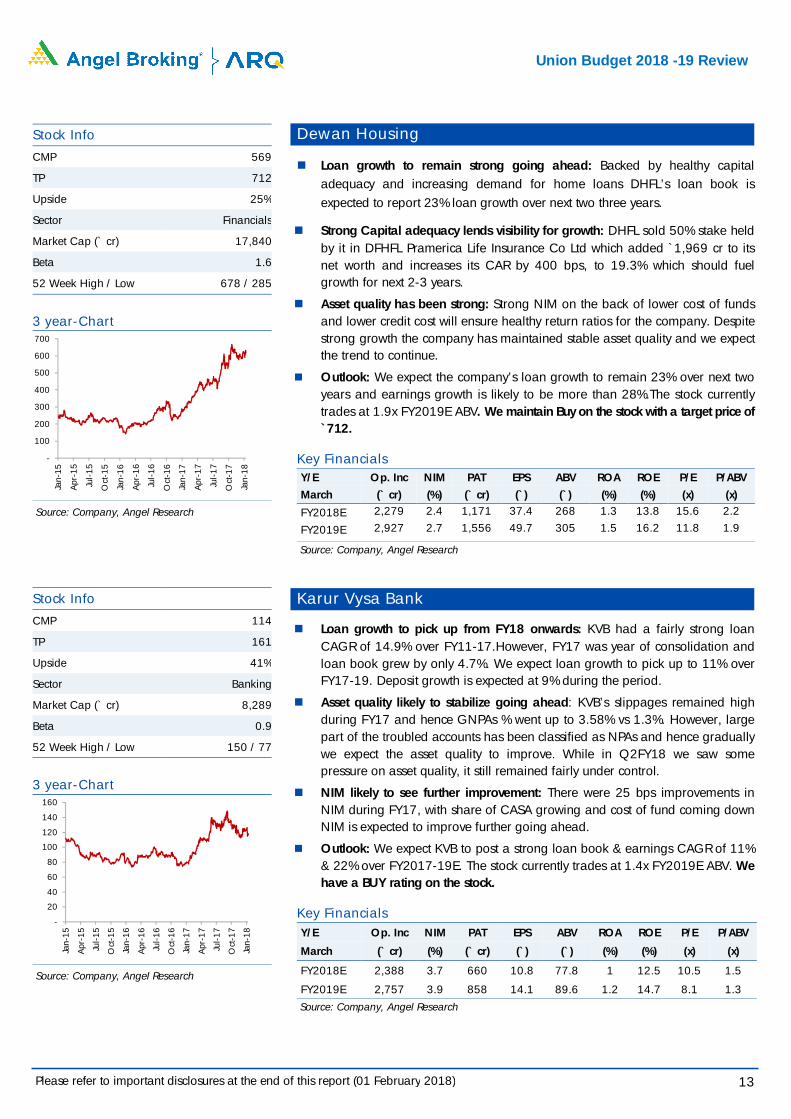
Dewan Housing
Loan growth to remain strong going ahead: Backed by healthy capital adequacy and increasing demand for home loans DHFL’s loan book is expected to report 23% loan growth over next two three years.
Strong Capital adequacy lends visibility for growth: DHFL sold 50% stake held by it in DFHFL Pramerica Life Insurance Co Ltd which added `1,969 cr to its net worth and increases its CAR by 400 bps, to 19.3% which should fuel growth for next 2-3 years.
Asset quality has been strong: Strong NIM on the back of lower cost of funds and lower credit cost will ensure healthy return ratios for the company. Despite strong growth the company has maintained stable asset quality and we expect the trend to continue.
Outlook: We expect the company’s loan growth to remain 23% over next two years and earnings growth is likely to be more than 28%.The stock currently trades at 1.9x FY2019E ABV. We maintain Buy on the stock with a target price of `712.
Key Financials Y/E Op. Inc NIM PAT EPS ABV ROA ROE P/E P/ABV
March (` cr) (%) (` cr) (`) (`) (%) (%) (x) (x)
FY2018E 2,279 2.4 1,171 37.4 268 1.3 13.8 15.6 2.2
FY2019E 2,927 2.7 1,556 49.7 305 1.5 16.2 11.8 1.9
Source: Company, Angel Research
Karur Vysa Bank
Loan growth to pick up from FY18 onwards: KVB had a fairly strong loan CAGR of 14.9% over FY11-17.However, FY17 was year of consolidation and loan book grew by only 4.7%. We expect loan growth to pick up to 11% over FY17-19. Deposit growth is expected at 9% during the period.
Asset quality likely to stabilize going ahead: KVB’s slippages remained high during FY17 and hence GNPAs % went up to 3.58% vs 1.3%. However, large part of the troubled accounts has been classified as NPAs and hence gradually we expect the asset quality to improve. While in Q2FY18 we saw some pressure on asset quality, it still remained fairly under control.
NIM likely to see further improvement: There were 25 bps improvements in NIM during FY17, with share of CASA growing and cost of fund coming down NIM is expected to improve further going ahead.
Outlook: We expect KVB to post a strong loan book & earnings CAGR of 11% & 22% over FY2017-19E. The stock currently trades at 1.4x FY2019E ABV. We have a BUY rating on the stock.
Key Financials Y/E Op. Inc NIM PAT EPS ABV ROA ROE P/E P/ABV
March (` cr) (%) (` cr) (`) (`) (%) (%) (x) (x)
FY2018E 2,388 3.7 660 10.8 77.8 1 12.5 10.5 1.5
FY2019E 2,757 3.9 858 14.1 89.6 1.2 14.7 8.1 1.3
Source: Company, Angel Research
Stock Info
CMP 114
TP 161
Upside 41%
Sector Banking
Market Cap (` cr) 8,289
Beta 0.9
52 Week High / Low 150 / 77
3 year-Chart
Source: Company, Angel Research
-
20
40
60
80
100
120
140
160
Jan-
15
Apr
-15
Jul-
15
Oct
-15
Jan-
16
Apr
-16
Jul-
16
Oct
-16
Jan-
17
Apr
-17
Jul-
17
Oct
-17
Jan-
18
Stock Info
CMP 569
TP 712
Upside 25%
Sector Financials
Market Cap (` cr) 17,840
Beta 1.6
52 Week High / Low 678 / 285
3 year-Chart
Source: Company, Angel Research
-
100
200
300
400
500
600
700
Jan-
15
Apr
-15
Jul-
15
Oct
-15
Jan-
16
Apr
-16
Jul-
16
Oct
-16
Jan-
17
Apr
-17
Jul-
17
Oct
-17
Jan-
18
Please refer to important disclosures at the end of this report (01 February 2018)
14
Union Budget 2018 -19 Review
Asian Granito
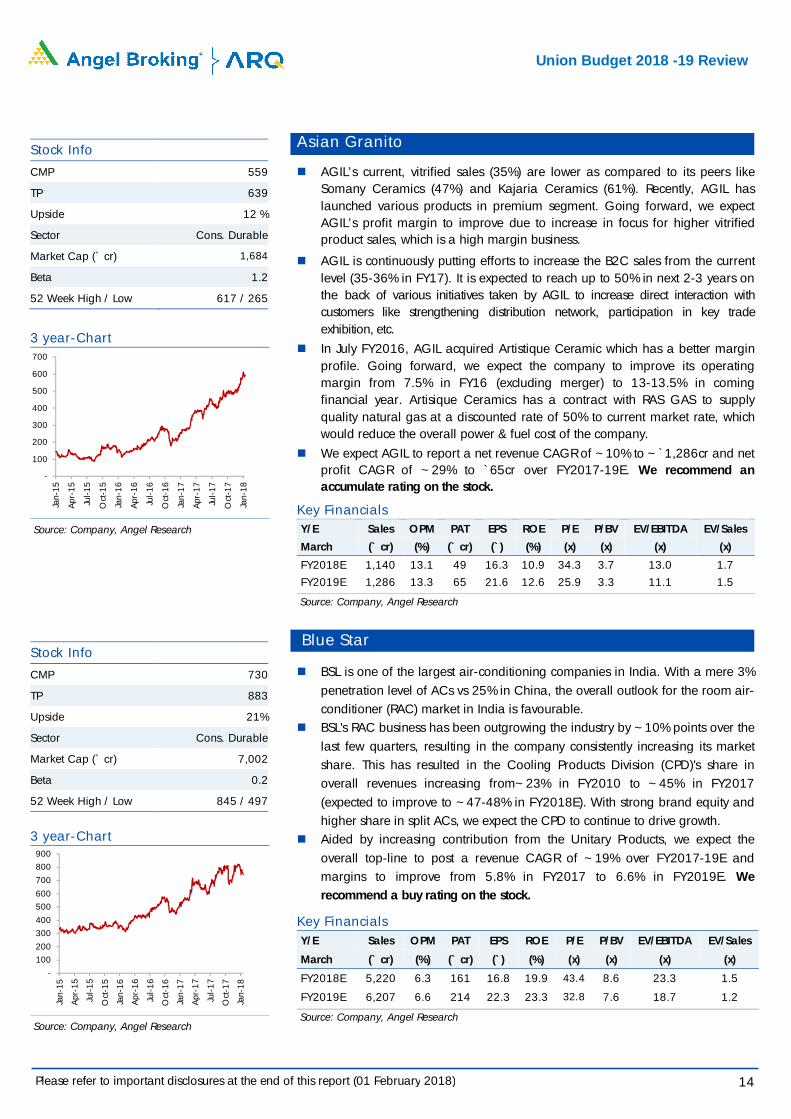
AGIL’s current, vitrified sales (35%) are lower as compared to its peers like Somany Ceramics (47%) and Kajaria Ceramics (61%). Recently, AGIL has launched various products in premium segment. Going forward, we expect AGIL’s profit margin to improve due to increase in focus for higher vitrified product sales, which is a high margin business.
AGIL is continuously putting efforts to increase the B2C sales from the current level (35-36% in FY17). It is expected to reach up to 50% in next 2-3 years on the back of various initiatives taken by AGIL to increase direct interaction with customers like strengthening distribution network, participation in key trade exhibition, etc.
In July FY2016, AGIL acquired Artistique Ceramic which has a better margin profile. Going forward, we expect the company to improve its operating margin from 7.5% in FY16 (excluding merger) to 13-13.5% in coming financial year. Artisique Ceramics has a contract with RAS GAS to supply quality natural gas at a discounted rate of 50% to current market rate, which would reduce the overall power & fuel cost of the company.
We expect AGIL to report a net revenue CAGR of ~10% to ~`1,286cr and net profit CAGR of ~29% to `65cr over FY2017-19E. We recommend an accumulate rating on the stock.
Key Financials Y/E Sales OPM PAT EPS ROE P/E P/BV EV/EBITDA EV/Sales
March (` cr) (%) (` cr) (`) (%) (x) (x) (x) (x)
FY2018E 1,140 13.1 49 16.3 10.9 34.3 3.7 13.0 1.7
FY2019E 1,286 13.3 65 21.6 12.6 25.9 3.3 11.1 1.5
Source: Company, Angel Research
Blue Star
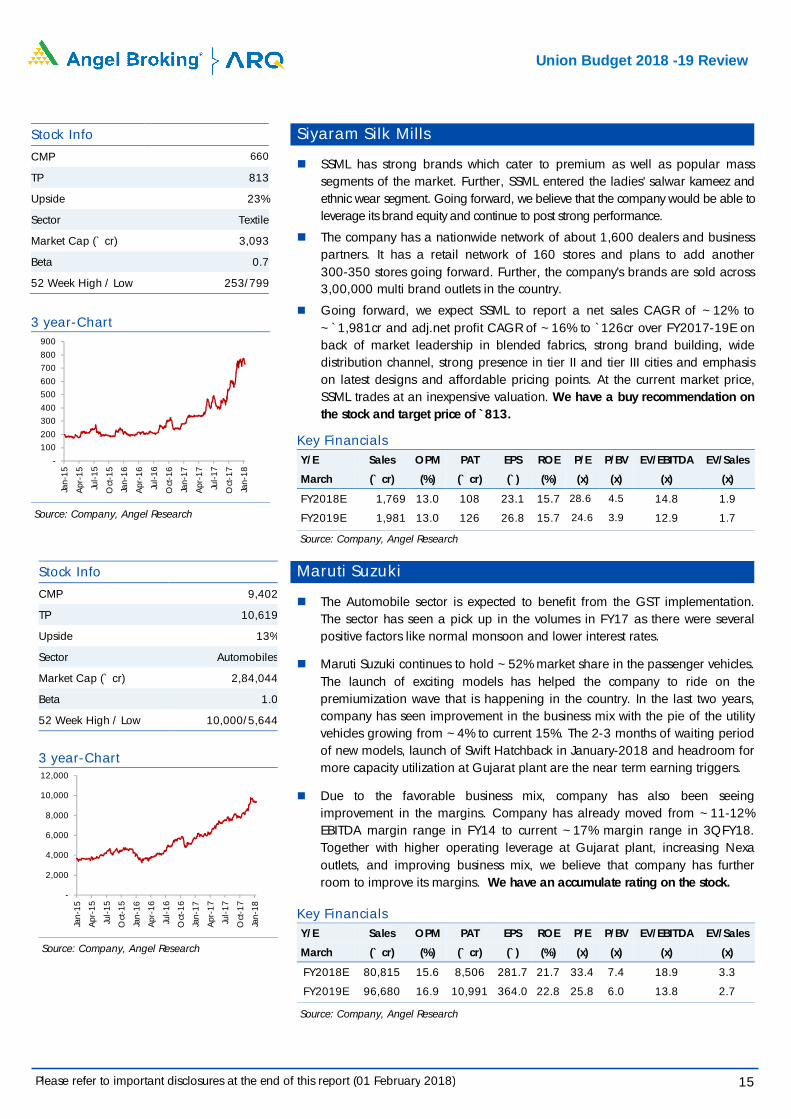
BSL is one of the largest air-conditioning companies in India. With a mere 3% penetration level of ACs vs 25% in China, the overall outlook for the room air-conditioner (RAC) market in India is favourable.
BSL's RAC business has been outgrowing the industry by ~10% points over the last few quarters, resulting in the company consistently increasing its market share. This has resulted in the Cooling Products Division (CPD)'s share in overall revenues increasing from~23% in FY2010 to ~45% in FY2017 (expected to improve to ~47-48% in FY2018E). With strong brand equity and higher share in split ACs, we expect the CPD to continue to drive growth.
Aided by increasing contribution from the Unitary Products, we expect the overall top-line to post a revenue CAGR of ~19% over FY2017-19E and margins to improve from 5.8% in FY2017 to 6.6% in FY2019E. We recommend a buy rating on the stock.
Key Financials Y/E Sales OPM PAT EPS ROE P/E P/BV EV/EBITDA EV/Sales
March (` cr) (%) (` cr) (`) (%) (x) (x) (x) (x)
FY2018E 5,220 6.3 161 16.8 19.9 43.4 8.6 23.3 1.5
FY2019E 6,207 6.6 214 22.3 23.3 32.8 7.6 18.7 1.2
Source: Company, Angel Research
Stock Info
CMP 730
TP 883
Upside 21%
Sector Cons. Durable
Market Cap (` cr) 7,002
Beta 0.2
52 Week High / Low 845 / 497
3 year-Chart
Source: Company, Angel Research
-
100
200
300
400
500
600
700
800
900
Jan-
15
Apr
-15
Jul-
15
Oct
-15
Jan-
16
Apr
-16
Jul-
16
Oct
-16
Jan-
17
Apr
-17
Jul-
17
Oct
-17
Jan-
18
Stock Info
CMP 559
TP 639
Upside 12 %
Sector Cons. Durable
Market Cap (` cr) 1,684
Beta 1.2
52 Week High / Low 617 / 265
3 year-Chart
Source: Company, Angel Research
-
100
200
300
400
500
600
700
Jan-
15
Apr
-15
Jul-
15
Oct
-15
Jan-
16
Apr
-16
Jul-
16
Oct
-16
Jan-
17
Apr
-17
Jul-
17
Oct
-17
Jan-
18
Please refer to important disclosures at the end of this report (01 February 2018)
15
Union Budget 2018 -19 Review
Siyaram Silk Mills
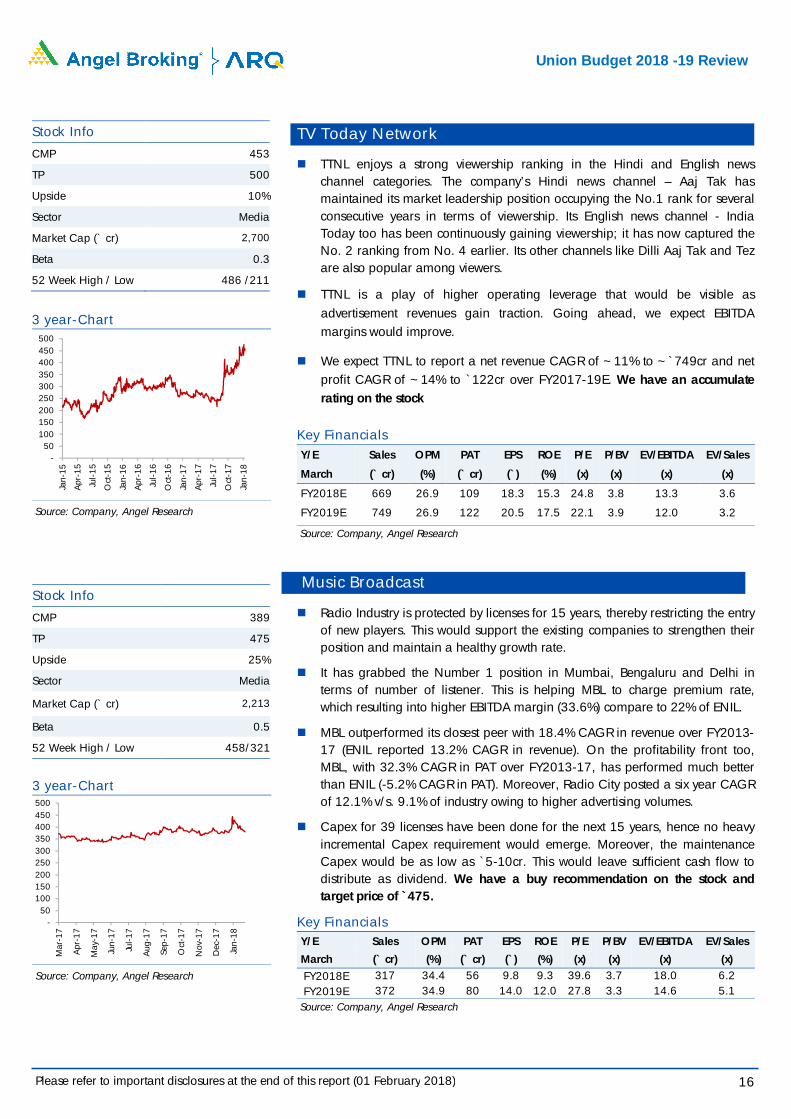
SSML has strong brands which cater to premium as well as popular mass segments of the market. Further, SSML entered the ladies' salwar kameez and ethnic wear segment. Going forward, we believe that the company would be able to leverage its brand equity and continue to post strong performance.
The company has a nationwide network of about 1,600 dealers and business partners. It has a retail network of 160 stores and plans to add another 300-350 stores going forward. Further, the company's brands are sold across 3,00,000 multi brand outlets in the country.
Going forward, we expect SSML to report a net sales CAGR of ~12% to ~`1,981cr and adj.net profit CAGR of ~16% to `126cr over FY2017-19E on back of market leadership in blended fabrics, strong brand building, wide distribution channel, strong presence in tier II and tier III cities and emphasis on latest designs and affordable pricing points. At the current market price, SSML trades at an inexpensive valuation. We have a buy recommendation on the stock and target price of `813.
Key Financials Y/E Sales OPM PAT EPS ROE P/E P/BV EV/EBITDA EV/Sales
March (` cr) (%) (` cr) (`) (%) (x) (x) (x) (x)
FY2018E 1,769 13.0 108 23.1 15.7 28.6 4.5 14.8 1.9
FY2019E 1,981 13.0 126 26.8 15.7 24.6 3.9 12.9 1.7
Source: Company, Angel Research
Maruti Suzuki
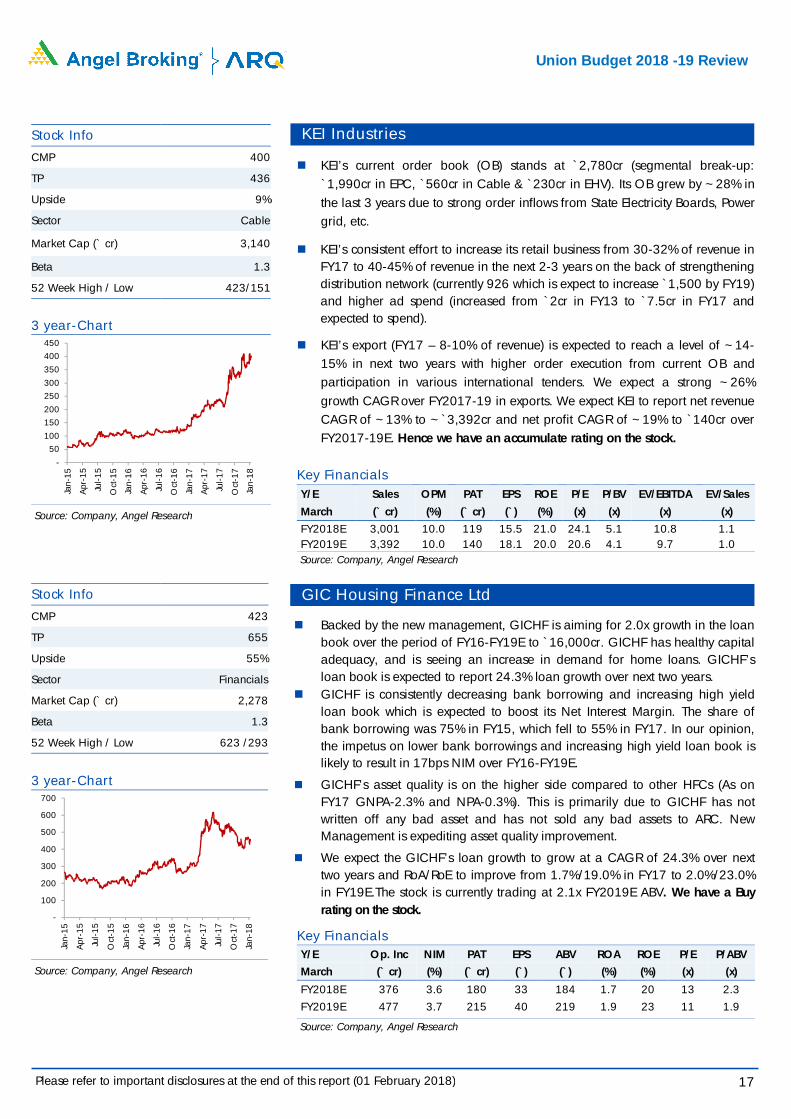
The Automobile sector is expected to benefit from the GST implementation. The sector has seen a pick up in the volumes in FY17 as there were several positive factors like normal monsoon and lower interest rates.
Maruti Suzuki continues to hold ~52% market share in the passenger vehicles. The launch of exciting models has helped the company to ride on the premiumization wave that is happening in the country. In the last two years, company has seen improvement in the business mix with the pie of the utility vehicles growing from ~4% to current 15%. The 2-3 months of waiting period of new models, launch of Swift Hatchback in January-2018 and headroom for more capacity utilization at Gujarat plant are the near term earning triggers.
Due to the favorable business mix, company has also been seeing improvement in the margins. Company has already moved from ~11-12% EBITDA margin range in FY14 to current ~17% margin range in 3QFY18. Together with higher operating leverage at Gujarat plant, increasing Nexa outlets, and improving business mix, we believe that company has further room to improve its margins. We have an accumulate rating on the stock.
Key Financials Y/E Sales OPM PAT EPS ROE P/E P/BV EV/EBITDA EV/Sales
March (` cr) (%) (` cr) (`) (%) (x) (x) (x) (x)
FY2018E 80,815 15.6 8,506 281.7 21.7 33.4 7.4 18.9 3.3
FY2019E 96,680 16.9 10,991 364.0 22.8 25.8 6.0 13.8 2.7
Source: Company, Angel Research
Stock Info
CMP 9,402
TP 10,619
Upside 13%
Sector Automobiles
Market Cap (` cr) 2,84,044
Beta 1.0
52 Week High / Low 10,000/5,644
3 year-Chart
Source: Company, Angel Research
-
2,000
4,000
6,000
8,000
10,000
12,000
Jan-
15
Apr
-15
Jul-
15
Oct
-15
Jan-
16
Apr
-16
Jul-
16
Oct
-16
Jan-
17
Apr
-17
Jul-
17
Oct
-17
Jan-
18
Stock Info
CMP 660
TP 813
Upside 23%
Sector Textile
Market Cap (` cr) 3,093
Beta 0.7
52 Week High / Low 253/799
3 year-Chart
Source: Company, Angel Research
-
100
200
300
400
500
600
700
800
900
Jan-
15
Apr
-15
Jul-
15
Oct
-15
Jan-
16
Apr
-16
Jul-
16
Oct
-16
Jan-
17
Apr
-17
Jul-
17
Oct
-17
Jan-
18
Please refer to important disclosures at the end of this report (01 February 2018)
16
Union Budget 2018 -19 Review
TV Today Network
TTNL enjoys a strong viewership ranking in the Hindi and English news channel categories. The company’s Hindi news channel – Aaj Tak has maintained its market leadership position occupying the No.1 rank for several consecutive years in terms of viewership. Its English news channel - India Today too has been continuously gaining viewership; it has now captured the No. 2 ranking from No. 4 earlier. Its other channels like Dilli Aaj Tak and Tez are also popular among viewers.
TTNL is a play of higher operating leverage that would be visible as advertisement revenues gain traction. Going ahead, we expect EBITDA margins would improve.
We expect TTNL to report a net revenue CAGR of ~11% to ~`749cr and net profit CAGR of ~14% to `122cr over FY2017-19E. We have an accumulate rating on the stock
Key Financials Y/E Sales OPM PAT EPS ROE P/E P/BV EV/EBITDA EV/Sales
March (` cr) (%) (` cr) (`) (%) (x) (x) (x) (x)
FY2018E 669 26.9 109 18.3 15.3 24.8 3.8 13.3 3.6
FY2019E 749 26.9 122 20.5 17.5 22.1 3.9 12.0 3.2
Source: Company, Angel Research
Music Broadcast
Radio Industry is protected by licenses for 15 years, thereby restricting the entry of new players. This would support the existing companies to strengthen their position and maintain a healthy growth rate.
It has grabbed the Number 1 position in Mumbai, Bengaluru and Delhi in terms of number of listener. This is helping MBL to charge premium rate, which resulting into higher EBITDA margin (33.6%) compare to 22% of ENIL.
MBL outperformed its closest peer with 18.4% CAGR in revenue over FY2013-17 (ENIL reported 13.2% CAGR in revenue). On the profitability front too, MBL, with 32.3% CAGR in PAT over FY2013-17, has performed much better than ENIL (-5.2% CAGR in PAT). Moreover, Radio City posted a six year CAGR of 12.1% v/s. 9.1% of industry owing to higher advertising volumes.
Capex for 39 licenses have been done for the next 15 years, hence no heavy incremental Capex requirement would emerge. Moreover, the maintenance Capex would be as low as `5-10cr. This would leave sufficient cash flow to distribute as dividend. We have a buy recommendation on the stock and target price of `475.
Key Financials Y/E Sales OPM PAT EPS ROE P/E P/BV EV/EBITDA EV/Sales
March (` cr) (%) (` cr) (`) (%) (x) (x) (x) (x)
FY2018E 317 34.4 56 9.8 9.3 39.6 3.7 18.0 6.2 FY2019E 372 34.9 80 14.0 12.0 27.8 3.3 14.6 5.1
Source: Company, Angel Research
Stock Info
CMP 389
TP 475
Upside 25%
Sector Media
Market Cap (` cr) 2,213
Beta 0.5
52 Week High / Low 458/321
3 year-Chart
Source: Company, Angel Research
-50
100150200250300350400450500
Mar
-17
Apr
-17
May
-17
Jun-
17
Jul-
17
Aug
-17
Sep-
17
Oct
-17
Nov
-17
Dec
-17
Jan-
18
Stock Info
CMP 453
TP 500
Upside 10%
Sector Media
Market Cap (` cr) 2,700
Beta 0.3
52 Week High / Low 486 /211
3 year-Chart
Source: Company, Angel Research
-50
100150200250300350400450500
Jan-
15
Apr
-15
Jul-
15
Oct
-15
Jan-
16
Apr
-16
Jul-
16
Oct
-16
Jan-
17
Apr
-17
Jul-
17
Oct
-17
Jan-
18
Please refer to important disclosures at the end of this report (01 February 2018)
17
Union Budget 2018 -19 Review
KEI Industries
KEI’s current order book (OB) stands at `2,780cr (segmental break-up: `1,990cr in EPC, `560cr in Cable & `230cr in EHV). Its OB grew by ~28% in the last 3 years due to strong order inflows from State Electricity Boards, Power grid, etc.
KEI’s consistent effort to increase its retail business from 30-32% of revenue in FY17 to 40-45% of revenue in the next 2-3 years on the back of strengthening distribution network (currently 926 which is expect to increase `1,500 by FY19) and higher ad spend (increased from `2cr in FY13 to `7.5cr in FY17 and expected to spend).
KEI’s export (FY17 – 8-10% of revenue) is expected to reach a level of ~14-15% in next two years with higher order execution from current OB and participation in various international tenders. We expect a strong ~26% growth CAGR over FY2017-19 in exports. We expect KEI to report net revenue CAGR of ~13% to ~`3,392cr and net profit CAGR of ~19% to `140cr over FY2017-19E. Hence we have an accumulate rating on the stock.
Key Financials Y/E Sales OPM PAT EPS ROE P/E P/BV EV/EBITDA EV/Sales
March (` cr) (%) (` cr) (`) (%) (x) (x) (x) (x)
FY2018E 3,001 10.0 119 15.5 21.0 24.1 5.1 10.8 1.1 FY2019E 3,392 10.0 140 18.1 20.0 20.6 4.1 9.7 1.0
Source: Company, Angel Research
GIC Housing Finance Ltd
Backed by the new management, GICHF is aiming for 2.0x growth in the loan book over the period of FY16-FY19E to `16,000cr. GICHF has healthy capital adequacy, and is seeing an increase in demand for home loans. GICHF’s loan book is expected to report 24.3% loan growth over next two years.
GICHF is consistently decreasing bank borrowing and increasing high yield loan book which is expected to boost its Net Interest Margin. The share of bank borrowing was 75% in FY15, which fell to 55% in FY17. In our opinion, the impetus on lower bank borrowings and increasing high yield loan book is likely to result in 17bps NIM over FY16-FY19E.
GICHF’s asset quality is on the higher side compared to other HFCs (As on FY17 GNPA-2.3% and NPA-0.3%). This is primarily due to GICHF has not written off any bad asset and has not sold any bad assets to ARC. New Management is expediting asset quality improvement.
We expect the GICHF’s loan growth to grow at a CAGR of 24.3% over next two years and RoA/RoE to improve from 1.7%/19.0% in FY17 to 2.0%/23.0% in FY19E.The stock is currently trading at 2.1x FY2019E ABV. We have a Buy rating on the stock.
Key Financials Y/E Op. Inc NIM PAT EPS ABV ROA ROE P/E P/ABV
March (` cr) (%) (` cr) (`) (`) (%) (%) (x) (x)
FY2018E 376 3.6 180 33 184 1.7 20 13 2.3
FY2019E 477 3.7 215 40 219 1.9 23 11 1.9
Source: Company, Angel Research
Stock Info
CMP 338
TP 419
Upside 24%
Sector cable
Market Cap (` cr) 2,629
Beta 1.7
52 Week High / Low 371 / 106
3 year-Chart
Source: Company, Angel Research
-
50
100
150
200
250
300
350
400
Nov
-14
Feb-
15
May
-15
Jul-
15
Oct
-15
Jan-
16
Apr
-16
Jul-
16
Oct
-16
Jan-
17
Apr
-17
Jul-
17
Oct
-17
Stock Info
CMP 430
TP
Upside %
Sector Real Estate
Market Cap (` cr) 2,156
Beta 1.1
52 Week High / Low 530 / 318
3 year-Chart
Source: Company, Angel Research
-
100
200
300
400
500
600
Nov
-14
Feb-
15
May
-15
Jul-
15
Oct
-15
Jan-
16
Apr
-16
Jul-
16
Oct
-16
Jan-
17
Apr
-17
Jul-
17
Oct
-17
Stock Info CMP 400
TP 436
Upside 9%
Sector Cable
Market Cap (` cr) 3,140
Beta 1.3
52 Week High / Low 423/151
3 year-Chart
Source: Company, Angel Research
-
50
100
150
200
250
300
350
400
450
Jan-
15
Apr
-15
Jul-
15
Oct
-15
Jan-
16
Apr
-16
Jul-
16
Oct
-16
Jan-
17
Apr
-17
Jul-
17
Oct
-17
Jan-
18
Stock Info
CMP 423
TP 655
Upside 55%
Sector Financials
Market Cap (` cr) 2,278
Beta 1.3
52 Week High / Low 623 /293
3 year-Chart
Source: Company, Angel Research
-
100
200
300
400
500
600
700
Jan-
15
Apr
-15
Jul-
15
Oct
-15
Jan-
16
Apr
-16
Jul-
16
Oct
-16
Jan-
17
Apr
-17
Jul-
17
Oct
-17
Jan-
18
Please refer to important disclosures at the end of this report (01 February 2018)
18
Union Budget 2018 -19 Review
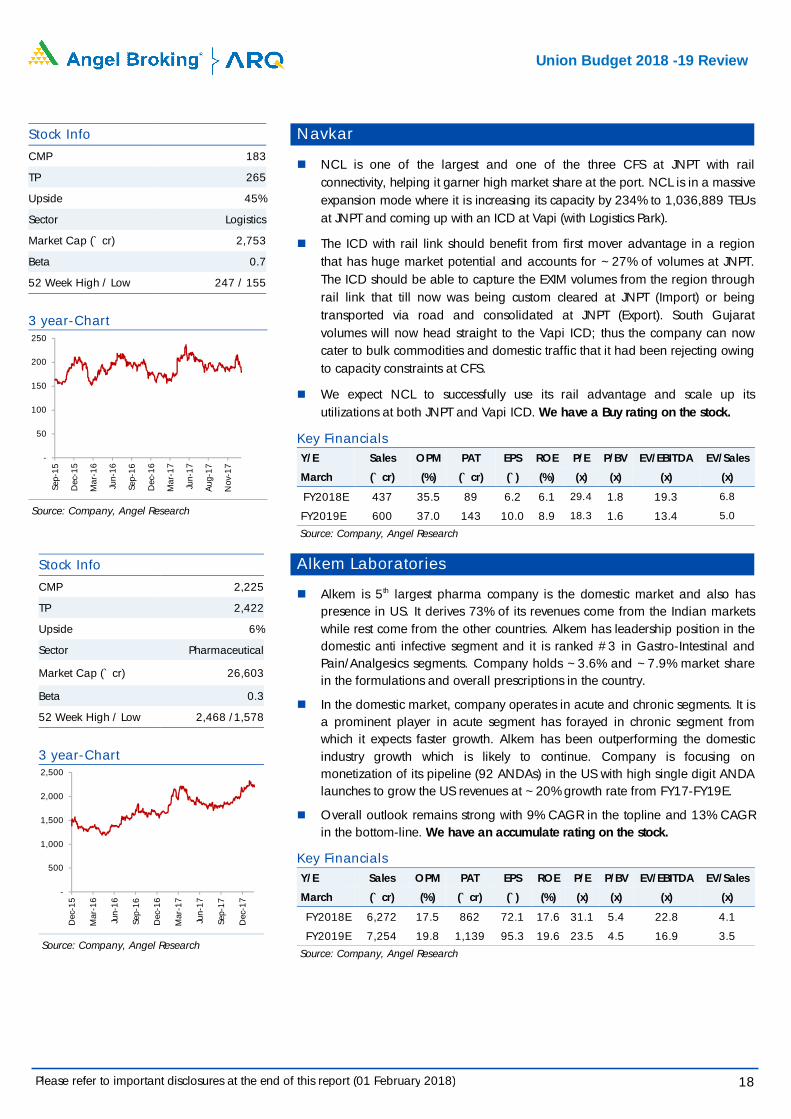
Navkar
NCL is one of the largest and one of the three CFS at JNPT with rail connectivity, helping it garner high market share at the port. NCL is in a massive expansion mode where it is increasing its capacity by 234% to 1,036,889 TEUs at JNPT and coming up with an ICD at Vapi (with Logistics Park).
The ICD with rail link should benefit from first mover advantage in a region that has huge market potential and accounts for ~27% of volumes at JNPT. The ICD should be able to capture the EXIM volumes from the region through rail link that till now was being custom cleared at JNPT (Import) or being transported via road and consolidated at JNPT (Export). South Gujarat volumes will now head straight to the Vapi ICD; thus the company can now cater to bulk commodities and domestic traffic that it had been rejecting owing to capacity constraints at CFS.
We expect NCL to successfully use its rail advantage and scale up its utilizations at both JNPT and Vapi ICD. We have a Buy rating on the stock.
Key Financials Y/E Sales OPM PAT EPS ROE P/E P/BV EV/EBITDA EV/Sales
March (` cr) (%) (` cr) (`) (%) (x) (x) (x) (x)
FY2018E 437 35.5 89 6.2 6.1 29.4 1.8 19.3 6.8
FY2019E 600 37.0 143 10.0 8.9 18.3 1.6 13.4 5.0
Source: Company, Angel Research
Alkem Laboratories
Alkem is 5th largest pharma company is the domestic market and also has presence in US. It derives 73% of its revenues come from the Indian markets while rest come from the other countries. Alkem has leadership position in the domestic anti infective segment and it is ranked #3 in Gastro-Intestinal and Pain/Analgesics segments. Company holds ~3.6% and ~7.9% market share in the formulations and overall prescriptions in the country.
In the domestic market, company operates in acute and chronic segments. It is a prominent player in acute segment has forayed in chronic segment from which it expects faster growth. Alkem has been outperforming the domestic industry growth which is likely to continue. Company is focusing on monetization of its pipeline (92 ANDAs) in the US with high single digit ANDA launches to grow the US revenues at ~20% growth rate from FY17-FY19E.
Overall outlook remains strong with 9% CAGR in the topline and 13% CAGR in the bottom-line. We have an accumulate rating on the stock.
Key Financials Y/E Sales OPM PAT EPS ROE P/E P/BV EV/EBITDA EV/Sales
March (` cr) (%) (` cr) (`) (%) (x) (x) (x) (x)
FY2018E 6,272 17.5 862 72.1 17.6 31.1 5.4 22.8 4.1
FY2019E 7,254 19.8 1,139 95.3 19.6 23.5 4.5 16.9 3.5
Source: Company, Angel Research
Stock Info
CMP 183
TP 265
Upside 45%
Sector Logistics
Market Cap (` cr) 2,753
Beta 0.7
52 Week High / Low 247 / 155
3 year-Chart
Source: Company, Angel Research
-
50
100
150
200
250
Sep-
15
Dec
-15
Mar
-16
Jun-
16
Sep-
16
Dec
-16
Mar
-17
Jun-
17
Aug
-17
Nov
-17
Stock Info
CMP 2,225
TP 2,422
Upside 6%
Sector Pharmaceutical
Market Cap (` cr) 26,603
Beta 0.3
52 Week High / Low 2,468 /1,578
3 year-Chart
Source: Company, Angel Research
-
500
1,000
1,500
2,000
2,500
Dec
-15
Mar
-16
Jun-
16
Sep-
16
Dec
-16
Mar
-17
Jun-
17
Sep-
17
Dec
-17
Please refer to important disclosures at the end of this report (01 February 2018)
19
Union Budget 2018 -19 Review
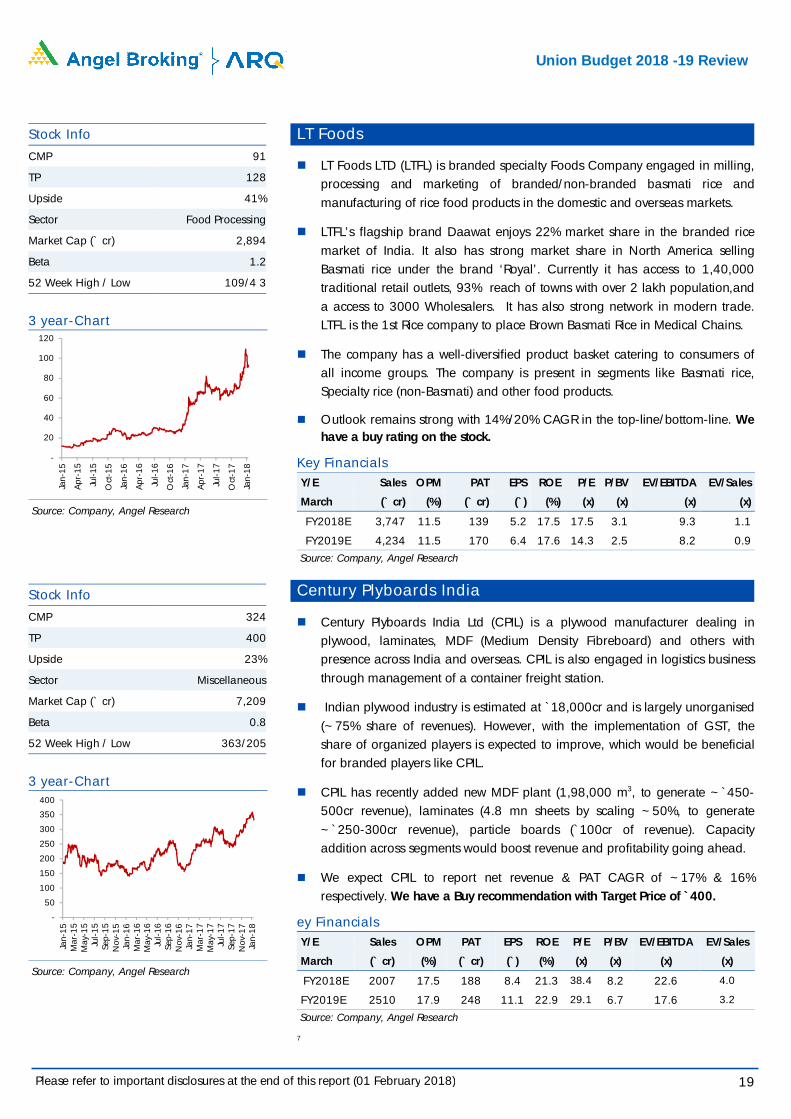
LT Foods
LT Foods LTD (LTFL) is branded specialty Foods Company engaged in milling, processing and marketing of branded/non-branded basmati rice and manufacturing of rice food products in the domestic and overseas markets.
LTFL’s flagship brand Daawat enjoys 22% market share in the branded rice market of India. It also has strong market share in North America selling Basmati rice under the brand ‘Royal’. Currently it has access to 1,40,000 traditional retail outlets, 93% reach of towns with over 2 lakh population,and a access to 3000 Wholesalers. It has also strong network in modern trade. LTFL is the 1st Rice company to place Brown Basmati Rice in Medical Chains.
The company has a well-diversified product basket catering to consumers of all income groups. The company is present in segments like Basmati rice, Specialty rice (non-Basmati) and other food products.
Outlook remains strong with 14%/20% CAGR in the top-line/bottom-line. We have a buy rating on the stock.
Key Financials Y/E Sales OPM PAT EPS ROE P/E P/BV EV/EBITDA EV/Sales
March (` cr) (%) (` cr) (`) (%) (x) (x) (x) (x)
FY2018E 3,747 11.5 139 5.2 17.5 17.5 3.1 9.3 1.1
FY2019E 4,234 11.5 170 6.4 17.6 14.3 2.5 8.2 0.9
Source: Company, Angel Research
Century Plyboards India
Century Plyboards India Ltd (CPIL) is a plywood manufacturer dealing in plywood, laminates, MDF (Medium Density Fibreboard) and others with presence across India and overseas. CPIL is also engaged in logistics business through management of a container freight station.
Indian plywood industry is estimated at `18,000cr and is largely unorganised (~75% share of revenues). However, with the implementation of GST, the share of organized players is expected to improve, which would be beneficial for branded players like CPIL.
CPIL has recently added new MDF plant (1,98,000 m3, to generate ~`450-500cr revenue), laminates (4.8 mn sheets by scaling ~50%, to generate ~`250-300cr revenue), particle boards (`100cr of revenue). Capacity addition across segments would boost revenue and profitability going ahead.
We expect CPIL to report net revenue & PAT CAGR of ~17% & 16% respectively. We have a Buy recommendation with Target Price of `400.
ey Financials Y/E Sales OPM PAT EPS ROE P/E P/BV EV/EBITDA EV/Sales
March (` cr) (%) (` cr) (`) (%) (x) (x) (x) (x)
FY2018E 2007 17.5 188 8.4 21.3 38.4 8.2 22.6 4.0
FY2019E 2510 17.9 248 11.1 22.9 29.1 6.7 17.6 3.2
Source: Company, Angel Research
7
Stock Info
CMP 91
TP 128
Upside 41%
Sector Food Processing
Market Cap (` cr) 2,894
Beta 1.2
52 Week High / Low 109/4 3
3 year-Chart
Source: Company, Angel Research
-
20
40
60
80
100
120
Jan-
15
Apr
-15
Jul-
15
Oct
-15
Jan-
16
Apr
-16
Jul-
16
Oct
-16
Jan-
17
Apr
-17
Jul-
17
Oct
-17
Jan-
18
Stock Info
CMP 324
TP 400
Upside 23%
Sector Miscellaneous
Market Cap (` cr) 7,209
Beta 0.8
52 Week High / Low 363/205
3 year-Chart
Source: Company, Angel Research
-
50
100
150
200
250
300
350
400
Jan-
15M
ar-1
5M
ay-1
5Ju
l-15
Sep-
15N
ov-1
5Ja
n-16
Mar
-16
May
-16
Jul-
16Se
p-16
Nov
-16
Jan-
17M
ar-1
7M
ay-1
7Ju
l-17
Sep-
17N
ov-1
7Ja
n-18
Please refer to important disclosures at the end of this report (01 February 2018)
20
Union Budget 2018 -19 Review
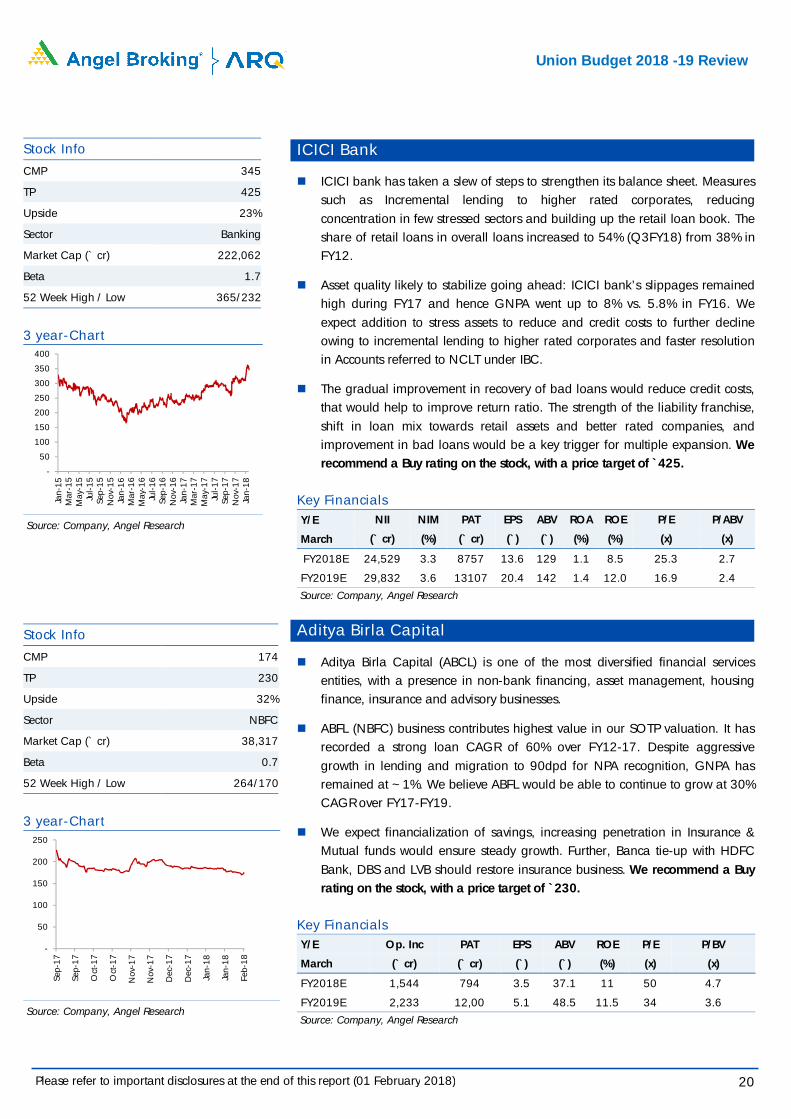
ICICI Bank
ICICI bank has taken a slew of steps to strengthen its balance sheet. Measures such as Incremental lending to higher rated corporates, reducing concentration in few stressed sectors and building up the retail loan book. The share of retail loans in overall loans increased to 54% (Q3FY18) from 38% in FY12.
Asset quality likely to stabilize going ahead: ICICI bank’s slippages remained high during FY17 and hence GNPA went up to 8% vs. 5.8% in FY16. We expect addition to stress assets to reduce and credit costs to further decline owing to incremental lending to higher rated corporates and faster resolution in Accounts referred to NCLT under IBC.
The gradual improvement in recovery of bad loans would reduce credit costs, that would help to improve return ratio. The strength of the liability franchise, shift in loan mix towards retail assets and better rated companies, and improvement in bad loans would be a key trigger for multiple expansion. We recommend a Buy rating on the stock, with a price target of `425.
Key Financials Y/E NII NIM PAT EPS ABV ROA ROE P/E P/ABV
March (` cr) (%) (` cr) (`) (`) (%) (%) (x) (x)
FY2018E 24,529 3.3 8757 13.6 129 1.1 8.5 25.3 2.7
FY2019E 29,832 3.6 13107 20.4 142 1.4 12.0 16.9 2.4
Source: Company, Angel Research
Aditya Birla Capital
Aditya Birla Capital (ABCL) is one of the most diversified financial services entities, with a presence in non-bank financing, asset management, housing finance, insurance and advisory businesses.
ABFL (NBFC) business contributes highest value in our SOTP valuation. It has recorded a strong loan CAGR of 60% over FY12-17. Despite aggressive growth in lending and migration to 90dpd for NPA recognition, GNPA has remained at ~1%. We believe ABFL would be able to continue to grow at 30% CAGR over FY17-FY19.
We expect financialization of savings, increasing penetration in Insurance & Mutual funds would ensure steady growth. Further, Banca tie-up with HDFC Bank, DBS and LVB should restore insurance business. We recommend a Buy rating on the stock, with a price target of `230.
Key Financials Y/E Op. Inc PAT EPS ABV ROE P/E P/BV
March (` cr) (` cr) (`) (`) (%) (x) (x)
FY2018E 1,544 794 3.5 37.1 11 50 4.7
FY2019E 2,233 12,00 5.1 48.5 11.5 34 3.6
Source: Company, Angel Research
Stock Info
CMP 863
TP 1091
Upside 26.4%
Sector Pharmaceutical
Market Cap (` cr) 39025
Beta 0.7
52 Week High / Low 1572/807
3 year-Chart
Source: Company, Angel Research
Stock Info CMP 174
TP 230
Upside 32%
Sector NBFC
Market Cap (` cr) 38,317
Beta 0.7
52 Week High / Low 264/170
3 year-Chart
Source: Company, Angel Research
-
50
100
150
200
250
Sep-
17
Sep-
17
Oct
-17
Oct
-17
Nov
-17
Nov
-17
Dec
-17
Dec
-17
Jan-
18
Jan-
18
Feb-
18
Stock Info
CMP 345
TP 425
Upside 23%
Sector Banking
Market Cap (` cr) 222,062
Beta 1.7
52 Week High / Low 365/232
3 year-Chart
Source: Company, Angel Research
-
50
100
150
200
250
300
350
400
Jan-
15M
ar-1
5M
ay-1
5Ju
l-15
Sep-
15N
ov-1
5Ja
n-16
Mar
-16
May
-16
Jul-
16Se
p-16
Nov
-16
Jan-
17M
ar-1
7M
ay-1
7Ju
l-17
Sep-
17N
ov-1
7Ja
n-18
Please refer to important disclosures at the end of this report (01 February 2018)
21
Union Budget 2018 -19 Review
Research Team Tel: 022 - 39357800 E-mail: [email protected] Website: www.angelbroking.com
DISCLAIMER
Angel Broking Private Limited (hereinafter referred to as “Angel”) is a registered Member of National Stock Exchange of India Limited, Bombay Stock Exchange Limited and Metropolitan Stock Exchange Limited. It is also registered as a Depository Participant with CDSL and Portfolio Manager and investment advisor with SEBI. It also has registration with AMFI as a Mutual Fund Distributor. Angel Broking Private Limited is a registered entity with SEBI for Research Analyst in terms of SEBI (Research Analyst) Regulations, 2014 vide registration number INH000000164. Angel or its associates has not been debarred/ suspended by SEBI or any other regulatory authority for accessing /dealing in securities Market. Angel or its associates/analyst has not received any compensation / managed or co-managed public offering of securities of the company covered by Analyst during the past twelve months.
This document is solely for the personal information of the recipient, and must not be singularly used as the basis of any investment decision. Nothing in this document should be construed as investment or financial advice. Each recipient of this document should make such investigations as they deem necessary to arrive at an independent evaluation of an investment in the securities of the companies referred to in this document (including the merits and risks involved), and should consult their own advisors to determine the merits and risks of such an investment.
Reports based on technical and derivative analysis center on studying charts of a stock's price movement, outstanding positions and trading volume, as opposed to focusing on a company's fundamentals and, as such, may not match with a report on a company's fundamentals. Investors are advised to refer the Fundamental and Technical Research Reports available on our website to evaluate the contrary view, if any.
The information in this document has been printed on the basis of publicly available information, internal data and other reliable sources believed to be true, but we do not represent that it is accurate or complete and it should not be relied on as such, as this document is for general guidance only. Angel Broking Pvt. Limited or any of its affiliates/ group companies shall not be in any way responsible for any loss or damage that may arise to any person from any inadvertent error in the information contained in this report. Angel Broking Pvt. Limited has not independently verified all the information contained within this document. Accordingly, we cannot testify, nor make any representation or warranty, express or implied, to the accuracy, contents or data contained within this document. While Angel Broking Pvt. Limited endeavors to update on a reasonable basis the information discussed in this material, there may be regulatory, compliance, or other reasons that prevent us from doing so.
This document is being supplied to you solely for your information, and its contents, information or data may not be reproduced, redistributed or passed on, directly or indirectly.
Neither Angel Broking Pvt. Limited, nor its directors, employees or affiliates shall be liable for any loss or damage that may arise from or in connection with the use of this information
Ratings (Based on expected returns Buy (> 15%) Accumulate (5% to 15%) Neutral (-5 to 5%) over 12 months investment period): Reduce (-5% to -15%) Sell (< -15)
Please refer to important disclosures at the end of this report