topgolf thornton a watercad results ... the topgolf thornton project will be constructed according...
TRANSCRIPT

FINAL UTILITY REPORT
Topgolf Thornton Thornton, Colorado
Prepared for: ARCO/Murray National Construction Company, Inc.
3110 Woodcreek Drive
Downers Grove, IL 60515
Prepared by: Baseline Engineering Corporation
1950 Ford Street
Golden, CO 80401
Project #: CO-3223
REVISED 7/22/16

Final Utility Report
Topgolf Thornton – Thornton, Colorado
1
RESPONSIBLE PARTY CERTIFICATION .............................................................................................. 2
ENGINEER’S NOTE ........................................................................................................................... 3
REPORT INTENT AND PROJECT LOCATION ...................................................................................... 4
Location ....................................................................................................................................... 4
Vicinity Map (Not to Scale) .......................................................................................................... 4
DESCRIPTION OF PROJECT AND PROPERTY ..................................................................................... 5
WATER AND SANITARY SEWER CRITERIA AND DESIGN .................................................................. 5
Regulatory Information ............................................................................................................... 5
Water System Design Criteria...................................................................................................... 5
Water System Design Information .............................................................................................. 6
Sanitary Sewer System Design Criteria ........................................................................................ 7
Sanitary Sewer System Design Information ................................................................................ 8
REFERENCES .................................................................................................................................... 9
APPENDIX A WaterCAD Results ................................................................................................... 10
APPENDIX B Sanitary Sewer Calculations ...................................................................................... 11
APPENDIX C Lift Station Design ..................................................................................................... 12

Final Utility Report
Topgolf Thornton – Thornton, Colorado
2
RESPONSIBLE PARTY CERTIFICATION
“ARCO/Murray Construction Company, Inc. hereby certifies that the sewer and water system for
the Topgolf Thornton project will be constructed according to the design presented in this report.
I understand that the City of Thornton does not and shall not assume liability for the sewer and
water system designed and/or certified by my engineer. I understand that the City of Thornton
reviews utility plans but cannot, on behalf of the Topgolf Thornton project, guarantee that final
utility design review will absolve Topgolf Thornton and/or their successors and/or assigns of
future liability for improper design. I further understand that approval of the Plat and/or
Development Permit does not imply approval of my engineer’s utility design.”
Attest: _____________________________________________________________________
Bill Krol, ARCO/Murray Construction Company, Inc.
________________________________ _______________________________________
Notary Public Authorized Signature

Final Utility Report
Topgolf Thornton – Thornton, Colorado
3
ENGINEER’S NOTE
“I hereby state that this Final Utility Report for the Topgolf Thornton facility was prepared by me
(or under my direct supervision) in general accordance with the provisions of the City of
Thornton Standards and Specifications for the Design and Construction of Public and Private
Improvements. I understand that the City of Thornton does not assume liability for utilities
design by others.”
_____________________________________________
Chris Manning, P.E.
Baseline Engineering Corporation
State of Colorado Registration No. 43840

Final Utility Report
Topgolf Thornton – Thornton, Colorado
4
REPORT INTENT AND PROJECT LOCATION
The intent of this report is to summarize the overall analysis and design that was specifically
prepared for the water and sewer services at the proposed Topgolf Thornton facility.
Location The project site is located on a portion of the northeast ¼ of Section 27, Township 1 South,
Range 68 West of the 6th Principal Meridian, City of Thornton, County of Adams, State of
Colorado.
More specifically, the project site is located at the southeast corner of Interstate 25 and East 136th
Avenue as shown on the Vicinity Map below. The site is bordered to the west by Interstate 25, to
the south by Thorncreek golf course, to the east by Big Dry Creek, and to the north by
undeveloped land abutting East 136th Avenue.
Vicinity Map (Not to Scale)
Source: Google Maps 2015
Project Site

Final Utility Report
Topgolf Thornton – Thornton, Colorado
5
DESCRIPTION OF PROJECT AND PROPERTY
The project consists of a 64,000 square foot golf entertainment complex, which will include 102
hitting bays, an outdoor outfield, restaurant, bar, lounges, corporate/event meeting space and a
family entertainment area. Also included on the project site will include the support facilities for
the complex including roads, parking lot, detention pond(s), and landscaping.
The project site consists of approximately 15 acres that are currently vacant and part of a larger
planned commercial mixed use development identified as the Rolling Hills Thorncreek
Commons. The site is currently designated as “Gateway Mixed Use”. Existing groundcover
includes sparse native vegetation. A small portion of the southeast corner of the property falls
within the current 100-year floodplain.
WATER AND SANITARY SEWER CRITERIA AND DESIGN
Regulatory Information The current “City of Thornton Standards and Specifications for the Design and Construction of
Public and Private Improvements” dated October 2012, specifically Section 200: Water System
Standards and Section 300: Sanitary Sewer System Standards was utilized to establish the design
criteria. In addition to the standards and specifications, applicable review comments from the
Pre-Application submittal were used as supplemental design criteria.
Water System Design Criteria Section 200: Water System Standards of the standards and specifications outlines the following
applicable criteria for the evaluation and design of the water system (not all-inclusive):
Commercial Demands
o Shopping Center 680 gallons per 1,000 square feet of building area per day
o Restaurants/Fast Food 1,000 gallons per 1,000 square feet of building area per day
o Professional Centers 800 gallons per 1,000 square feet of building area per day
Demand Factors/Allowed Flows
o The High HGL of the zone with no demands on the system. The maximum pressure in
this scenario is 100 psi.
o The Low HGL of the zone with no demands of the system. The minimum pressure in
this scenario is 50 psi.
o The Low HGL of the zone with the peak hour demands (Demand Factor of 3.24 for
commercial) added to the system. The minimum pressure under this scenario shall be 40
psi, with a maximum velocity permitted of 5 fps.
o The Low HGL of the zone with the maximum daily demands (Demand Factor of 1.8 shall
be utilized for Office/Commercial) in addition to the required fire flow. The minimum
pressure under this scenario is 20 psi. The maximum velocity under this scenario shall
not exceed 11.2 fps for eight (8) inch lines, and 10 fps for all other lines.

Final Utility Report
Topgolf Thornton – Thornton, Colorado
6
Water System Layout and Main Sizing
o Sizing of on-site mains shall be accomplished by utilizing WaterCAD or approved equal.
Results shall be submitted to Development Engineering together with engineered
drawings.
o The diameter for water mains supplying hydrants shall be a minimum of eight (8) inches.
o Water services for non-residential facilities shall be constructed from looped mains.
o The number, location and spacing of fire hydrants shall be determined by the City of
Thornton Fire Department in accordance with the City’s currently adopted and effective
International Fire Code.
The following Pre-Application review comments were utilized as design criteria for the water
system:
Comments from Thornton Fire Department
o “The required fire flow is 2,625 gpm. Three Fire hydrants shall be provided on site. The
maximum spacing is 400 feet and one fire hydrant shall be provided within 225 of
building frontage.”
Water System Design Information The water main will loop around the Topgolf site, with two connections to the proposed
development 8” water main west of the project site and north of the project site (refer to
Appendix A – Utility Layout). The water system will consist of an 8” water main supplying
domestic and fire flow to the facility and three on-site hydrants. Refer to Appendix B – Water
System Design Calculations for the WaterCAD model and simulation results of the proposed
system under the specified criteria.
The calculated system average daily demand of the facility based on the previously identified
criteria would be 64,000 gallons per day (gpd) (or 44 gallons per minute gpm) utilizing the
Restaurants and Fast Food demand of 1,000 gallons per 1,000 square feet of building area per day
with a building area of 64,000 square feet (sf). As a result of other Topgolf facilities being in
operation and that all of the facilities are nearly identical in terms of floor space, layout, fixture
count, landscaping, etc., utilizing actual flows compared to general assumption factors will prove
more accurate.
As shown in the Topgolf utility bills included in Appendix C – Example Utility Bills, the
average daily flows range from 10,000 to 13,000 gpd. Conservatively, we will estimate an
average daily flow of 15,000 gpm for the Thornton Topgolf facility. The maximum daily demand
would then be 27,000 gpd (or 18.8 gpm) based on a Demand Factor of 1.8 and the peak hour
demand is 33.8 gpm based on a Demand Factor of 3.24. The calculations for these demands are
as follows:
𝑆𝑦𝑠𝑡𝑒𝑚 𝐷𝑒𝑚𝑎𝑛𝑑 (𝑔𝑝𝑑) = 15,000 𝑔𝑝𝑑 = 10.42 𝑔𝑝𝑚
𝑀𝑎𝑥𝑖𝑚𝑢𝑚 𝐷𝑎𝑖𝑙𝑦 𝐷𝑒𝑚𝑎𝑛𝑑 (𝑔𝑝𝑑) = 15,000 𝑔𝑝𝑑 ∗ 1.8 (𝐷𝑒𝑚𝑎𝑛𝑑 𝐹𝑎𝑐𝑡𝑜𝑟) = 27,000 𝑔𝑝𝑑 = 18.8 𝑔𝑝𝑚
𝑃𝑒𝑎𝑘 𝐻𝑜𝑢𝑟 𝐷𝑒𝑚𝑎𝑛𝑑 (𝑔𝑝𝑚) = 15,000 𝑔𝑝𝑑 ∗1 𝑑𝑎𝑦
24 ℎ𝑟∗
1 ℎ𝑟
60 𝑚𝑖𝑛∗ 3.24 (𝐷𝑒𝑚𝑎𝑛𝑑 𝐹𝑎𝑐𝑡𝑜𝑟) = 33.8 𝑔𝑝𝑚
Section 203.2.C lists standard daily demands based on use. A variance from this Criteria is
requested. Per the code, a restaurant the size of the Topgolf facility (64,000sf) indicates a demand

Final Utility Report
Topgolf Thornton – Thornton, Colorado
7
of 64,000 gpd. As noted above, usage records from other Topgolf facilities inidicate a much
lower demand (15,000 gpd).
This site falls within City of Thornton pressure Zone 1, which has a High and Low HGL of 5,375
ft and 5,351 ft and High and Low Service Elevations of 5,250 ft and 5,104 ft, respectively. The
High Service Pressure for Zone 1 is 117 psi while the Low Service Pressure is 44 psi (Reference:
City of Thornton Water and Wastewater Systems Master Plan, May 2010). The high and low
finished grades for the Topgolf facility are 5,168 ft and 5,196 ft, respectively. Complete
WaterCAD results are available in the appendices of this report.
The Topgolf facility will be constructed per the 2012 International Building Code (IBC) and the
2012 International Fire Code (IFC). Fire flows will be supplied as required by the IFC.
The model and simulation results provided in Appendix B identify that the system will provide all
of the flow and pressures required by the City and Fire Department during all operational
scenarios. The only minor variance from the City criteria is the maximum velocity of 11.2 fps in
an 8” line. During one scenario where the max daily flow of the facility and fire hydrant 1 were
run at the low HGL, the maximum velocity in one run of pipe at the connection to the main
reached 11.63 fps. This is a direct result of the required water main routing and the vicinity of
fire hydrant 1 to one of the connection points. We do not feel that this slight exceedance of the
City’s specified maximum velocity under one specific scenario is justification for a redesign that
would not provide optimal fire protection due to hydrant locations.
Sanitary Sewer System Design Criteria Section 300: Sanitary Sewer System Standards of the standards and specifications outlines the
following applicable criteria for the evaluation and design of the sanitary sewer system (not all-
inclusive):
Commercial Flow Calculations
o 600 gallons per acre per day
Pipe Sizing and Slope Criteria
o Sanitary sewers must be designed to carry the peak discharge with the pipe being no
more than 50% of maximum flow capacity for mains smaller than 15 inches in diameter.
o It is essential that the sewer have capacity for peak hourly sewage flow and adequate
velocity at minimum sewage flows.
o The Manning formula, with an “n” value of 0.013, shall be utilized for the sizing of
sanitary sewer mains.
o Peaking Factor for commercial flows is a minimum of 2.6 and a maximum of 3.5 (3.5
will be used based on projected flows)
o The minimum and maximum slopes for services and mains are as follows:
Pipe Size Min. Slope Max. Slope
4” 2.0% 8.0%
6” 1.0% 8.0%

Final Utility Report
Topgolf Thornton – Thornton, Colorado
8
Sanitary Sewer System Design Information Based on the City of Thornton commercial flow calculations, the estimated average daily flow in
the sanitary sewer from the Topgolf facility will be 9,000 gallons per day (gpd). The peak flow
based on a 3.5 Peaking Factor is 31,500 gpd or 21.88 gpm.
As a result of the substantial distance between the Topgolf facility and the proposed sanitary
sewer main, and the elevation of the site sitting lower than the rest of the development, a full
gravity system will not work. The distance between the proposed grease interceptor and the
sewer service tap is approximately 700 lf. The slope required to provide a minimum scouring
velocity at average daily flows is 4.0%, which would necessitate a 28 ft drop across the service
(not including drops in manholes).
The design will include a sanitary sewer lift station downstream of the grease interceptor that will
pump the sewage up to a manhole near the new sewer main at which point the fluid will gravity
flow to the sewer tap location. The lift station will be a duplex system with dual 2” force mains.
The pumps will be sized to exceed the hourly peak flow with a capacity of 40 gpm per pump.
The force mains will discharge at a 4’ manhole with a 6” effluent pipe at 4.0% slope running to
the service tap at the main.
DETAILED DESIGN INFORMATION FOR THE SANITARY LIFT STATION WILL BE
INCLUDED IN SUBSQUENT REVISIONS OF THIS DOCUMENT.
Refer to Appendix A – Utility Layout for detailed layout of the proposed sanitary sewer. The
following summarizes the sanitary sewer flow and capacity calculations provided in Appendix C
– Sanitary Sewer System Design Calculations:
Average Daily Flow (ADF) = 9,000 gpd (600 gpd per acre, 15 acre parcel)
Hourly Peak Flow (HPF) = 21.88 gpm (3.5 Peaking Factor)
Pipe Size and Slope = 6” @ 4% slope
Flow Velocity at ADF = 2.0 feet per second (fps)
Flow Velocity at HPF = 2.9 fps
Percent of Sanitary Sewer Service Capacity* Utilized at ADF = 1.24%
Percent of Sanitary Sewer Service Capacity* Utilized at HPF = 4.33%
Percent of Sanitary Sewer Main Capacity* at ADF (assumes 8” @ 0.4%) = 1.87%
Percent of Sanitary Sewer Main Capacity* at HPF (assumes 8” @ 0.4%) = 6.53%
* Pipe capacity based on pipe at 100% full

Final Utility Report
Topgolf Thornton – Thornton, Colorado
9
REFERENCES
City of Thornton Volume 1: Water and Wastewater Systems Master Plan, City of Thornton; May,
2010.
City of Thornton - Standards and Specifications, Section 200 – Water System Standards, City of
Thornton; October 2012.
City of Thornton - Standards and Specifications, Section 300 – Sanitary Sewer System Standards,
City of Thornton; October 2012.

Final Utility Report
Topgolf Thornton – Thornton, Colorado
10
APPENDIX A Utility Layout


Final Utility Report
Topgolf Thornton – Thornton, Colorado
11
APPENDIX B Sanitary Sewer Calculations and WaterCAD Results

Topgolf Thornton
Final Utility Report
Sanitary Sewer System Calculations
System Flow Calculations
Average Daily Flowrate = Commercial Flow Factor x Site Acreage = 600 gpd/acre x 14 acres
Average Daily Flowrate = 8,400 gpd = 5.83 gpm
Peaking Factor = 3.5
Peak Hourly Flowrate = 20.42 gpm
Pipe Sizing Calculations
Manning Factor = 0.013
Pipe Type = PVC ‐ SDR 35
Pipe Velocity (fps) @ 8,400 gpd
Pipe Size 1.0% 2.0% 3.0% 4.0% 5.0% 6.0% 7.0% 8.0%
4" (Actual ID = 3.975") 1.59 1.83 2.03 2.2 2.34 2.47 2.59
6" (Actual ID = 5.915") 1.19 1.5 1.74 1.92 2.08 2.21 2.33 2.44
Pipe Velocity (fps) @ 20.42 gpm
Pipe Size 1.0% 2.0% 3.0% 4.0% 5.0% 6.0% 7.0% 8.0%
4" (Actual ID = 3.975") 2.29 2.65 2.94 3.18 3.4 3.58 3.76
6" (Actual ID = 5.915") 1.73 2.2 2.53 2.8 3.03 3.23 3.41 3.57
Sanitary Sewer Service Pipe Dia. Water Depth Slope Flow Flow Velocity
Pipe Capacity ‐ 4" @ 4.0% D (ft) h (ft) S (ft/ft) Q (cfs) Q (gpm) V (fps)
Full Pipe Capacity 0.33 0.33 0.040 0.38 168.44 4.36
50% Pipe Capacity 0.33 0.17 0.040 0.19 84.22 4.36
Sanitary Sewer Main Pipe Dia. Water Depth Slope Flow Flow Velocity
Pipe Capacity ‐ 8" @ 0.4% D (ft) h (ft) S (ft/ft) Q (cfs) Q (gpm) V (fps)
Full Pipe Capacity 0.66 0.66 0.004 0.75 334.82 2.18
50% Pipe Capacity 0.66 0.33 0.004 0.37 167.41 2.18
Topgolf Flow Percentage of Service and Main Capacity
Average Daily Flowrate = 5.83 gpm
Peak Hourly Flowrate = 20.42 gpmCapacity of Sewer Service
(@ 100% Full) = 168 gpmCapacity of Sewer Main
(@ 100% Full) = 335 gpm
Pipe Slope
Pipe Slope
% of Sewer Service
3.46%
12.12%
% of Sewer Main
1.74%
6.10%

Active Scenario: High HGL No DemandScenario: High HGL No Demand
Page 1 of 127 Siemon Company Drive Suite 200 W Watertown, CT 06795 USA +1-203-755-1666
2/24/2016
Bentley WaterCAD V8i (SELECTseries 5)[08.11.05.61]
Bentley Systems, Inc. Haestad Methods Solution Center3223 WaterCAD.wtg

Active Scenario: Low HGL No DemandScenario: Low HGL No Demand
Page 1 of 127 Siemon Company Drive Suite 200 W Watertown, CT 06795 USA +1-203-755-1666
2/24/2016
Bentley WaterCAD V8i (SELECTseries 5)[08.11.05.61]
Bentley Systems, Inc. Haestad Methods Solution Center3223 WaterCAD.wtg

Active Scenario: High HGL No DemandFlexTable: Junction Table
Pressure(psi)
Hydraulic Grade(ft)
Demand(gpm)
Elevation(ft)
Label
925,375.0005,162.30J-1895,375.0005,168.20J-2875,375.0005,174.70J-3905,375.0005,167.30J-4905,375.0005,167.30J-5905,375.0005,167.30J-6875,375.0005,174.80FH-2905,375.0005,167.80FH-3905,375.0005,168.00J-9905,375.0005,168.00J-10895,375.0005,168.50FH-1925,375.0005,162.89J-12
Page 1 of 127 Siemon Company Drive Suite 200 W Watertown, CT 06795 USA +1-203-755-1666
2/24/2016
Bentley WaterCAD V8i (SELECTseries 5)[08.11.05.61]
Bentley Systems, Inc. Haestad Methods Solution Center3223 WaterCAD.wtg

Active Scenario: High HGL No DemandFlexTable: Pipe Table
Headloss Gradient
(ft/ft)
Velocity
(ft/s)
Flow(gpm)
Hazen-Williams
C
MaterialDiameter(in)
Stop Node
Start Node
Length (Scaled)
(ft)
Label
0.0000.000150.0PVC8.0J-1R-180P-10.0000.000150.0PVC8.0J-3J-2460P-30.0000.000150.0PVC8.0J-4J-3432P-40.0000.000150.0PVC8.0J-5J-47P-50.0000.000150.0PVC8.0J-6J-58P-60.0000.000150.0PVC8.0J-1J-61,276P-70.0000.000150.0PVC6.0FH-2J-328FH-20.0000.000150.0PVC6.0FH-3J-425FH-3
0.0000.000140.0Type K Copper3.0J-9J-51033" SVC
0.0000.000140.0Ductile Iron6.0J-10J-61036" FIRE
0.0000.000150.0PVC6.0FH-1J-233FH-10.0000.000150.0PVC8.0J-12J-128P-140.0000.000150.0PVC8.0J-2J-12487P-150.0000.000150.0PVC8.0R-2J-12123P-2
Page 1 of 127 Siemon Company Drive Suite 200 W Watertown, CT 06795 USA +1-203-755-1666
2/24/2016
Bentley WaterCAD V8i (SELECTseries 5)[08.11.05.61]
Bentley Systems, Inc. Haestad Methods Solution Center3223 WaterCAD.wtg

Active Scenario: Low HGL No DemandFlexTable: Junction Table
Pressure(psi)
Hydraulic Grade(ft)
Demand(gpm)
Elevation(ft)
Label
825,351.0005,162.30J-1795,351.0005,168.20J-2765,351.0005,174.70J-3795,351.0005,167.30J-4795,351.0005,167.30J-5795,351.0005,167.30J-6765,351.0005,174.80FH-2795,351.0005,167.80FH-3795,351.0005,168.00J-9795,351.0005,168.00J-10795,351.0005,168.50FH-1815,351.0005,162.89J-12
Page 1 of 127 Siemon Company Drive Suite 200 W Watertown, CT 06795 USA +1-203-755-1666
2/24/2016
Bentley WaterCAD V8i (SELECTseries 5)[08.11.05.61]
Bentley Systems, Inc. Haestad Methods Solution Center3223 WaterCAD.wtg

Active Scenario: Low HGL No DemandFlexTable: Pipe Table
Headloss Gradient
(ft/ft)
Velocity
(ft/s)
Flow(gpm)
Hazen-Williams
C
MaterialDiameter(in)
Stop Node
Start Node
Length (Scaled)
(ft)
Label
0.0000.000150.0PVC8.0J-1R-180P-10.0000.000150.0PVC8.0J-3J-2460P-30.0000.000150.0PVC8.0J-4J-3432P-40.0000.000150.0PVC8.0J-5J-47P-50.0000.000150.0PVC8.0J-6J-58P-60.0000.000150.0PVC8.0J-1J-61,276P-70.0000.000150.0PVC6.0FH-2J-328FH-20.0000.000150.0PVC6.0FH-3J-425FH-3
0.0000.000140.0Type K Copper3.0J-9J-51033" SVC
0.0000.000140.0Ductile Iron6.0J-10J-61036" FIRE
0.0000.000150.0PVC6.0FH-1J-233FH-10.0000.000150.0PVC8.0J-12J-128P-140.0000.000150.0PVC8.0J-2J-12487P-150.0000.000150.0PVC8.0R-2J-12123P-2
Page 1 of 127 Siemon Company Drive Suite 200 W Watertown, CT 06795 USA +1-203-755-1666
2/24/2016
Bentley WaterCAD V8i (SELECTseries 5)[08.11.05.61]
Bentley Systems, Inc. Haestad Methods Solution Center3223 WaterCAD.wtg

Active Scenario: Low HGL Peak HourFlexTable: Junction Table
Pressure(psi)
Hydraulic Grade(ft)
Demand(gpm)
Elevation(ft)
Label
825,351.0005,162.30J-1795,351.0005,168.20J-2765,350.9905,174.70J-3795,350.9905,167.30J-4795,350.9905,167.30J-5795,350.9905,167.30J-6765,350.9905,174.80FH-2795,350.9905,167.80FH-3795,350.62345,168.00J-9795,350.9905,168.00J-10795,351.0005,168.50FH-1815,351.0005,162.89J-12
Page 1 of 127 Siemon Company Drive Suite 200 W Watertown, CT 06795 USA +1-203-755-1666
2/24/2016
Bentley WaterCAD V8i (SELECTseries 5)[08.11.05.61]
Bentley Systems, Inc. Haestad Methods Solution Center3223 WaterCAD.wtg
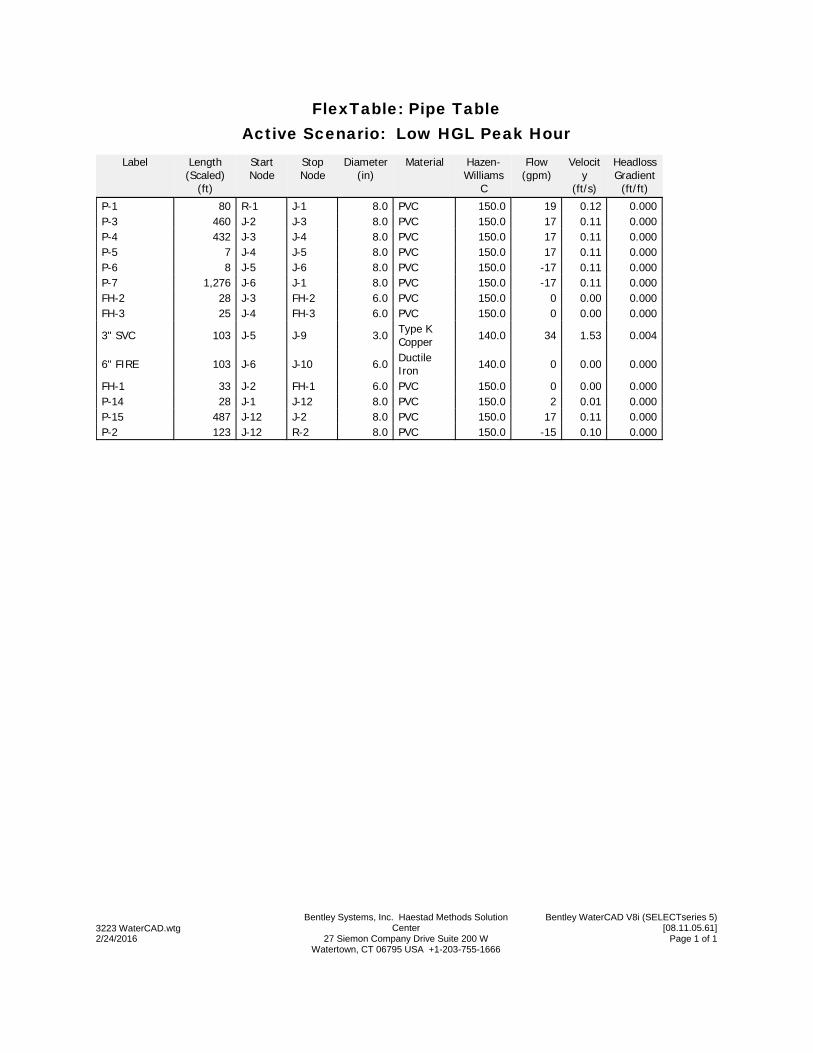
Active Scenario: Low HGL Peak HourFlexTable: Pipe Table
Headloss Gradient
(ft/ft)
Velocity
(ft/s)
Flow(gpm)
Hazen-Williams
C
MaterialDiameter(in)
Stop Node
Start Node
Length (Scaled)
(ft)
Label
0.0000.1219150.0PVC8.0J-1R-180P-10.0000.1117150.0PVC8.0J-3J-2460P-30.0000.1117150.0PVC8.0J-4J-3432P-40.0000.1117150.0PVC8.0J-5J-47P-50.0000.11-17150.0PVC8.0J-6J-58P-60.0000.11-17150.0PVC8.0J-1J-61,276P-70.0000.000150.0PVC6.0FH-2J-328FH-20.0000.000150.0PVC6.0FH-3J-425FH-3
0.0041.5334140.0Type K Copper3.0J-9J-51033" SVC
0.0000.000140.0Ductile Iron6.0J-10J-61036" FIRE
0.0000.000150.0PVC6.0FH-1J-233FH-10.0000.012150.0PVC8.0J-12J-128P-140.0000.1117150.0PVC8.0J-2J-12487P-150.0000.10-15150.0PVC8.0R-2J-12123P-2
Page 1 of 127 Siemon Company Drive Suite 200 W Watertown, CT 06795 USA +1-203-755-1666
2/24/2016
Bentley WaterCAD V8i (SELECTseries 5)[08.11.05.61]
Bentley Systems, Inc. Haestad Methods Solution Center3223 WaterCAD.wtg

Active Scenario: Low HGL Max Daily + FH-1FlexTable: Junction Table
Pressure(psi)
Hydraulic Grade(ft)
Demand(gpm)
Elevation(ft)
Label
815,348.7705,162.30J-1695,327.8805,168.20J-2685,332.1705,174.70J-3735,336.2005,167.30J-4735,336.2705,167.30J-5735,336.3505,167.30J-6685,332.1705,174.80FH-2735,336.2005,167.80FH-3735,336.15195,168.00J-9735,336.3505,168.00J-10645,316.512,6255,168.50FH-1805,348.6105,162.89J-12
Page 1 of 127 Siemon Company Drive Suite 200 W Watertown, CT 06795 USA +1-203-755-1666
2/24/2016
Bentley WaterCAD V8i (SELECTseries 5)[08.11.05.61]
Bentley Systems, Inc. Haestad Methods Solution Center3223 WaterCAD.wtg

Active Scenario: Low HGL Max Daily + FH-1FlexTable: Pipe Table
Headloss Gradient
(ft/ft)
Velocity
(ft/s)
Flow(gpm)
Hazen-Williams
C
MaterialDiameter(in)
Stop Node
Start Node
Length (Scaled)
(ft)
Label
0.0289.271,452150.0PVC8.0J-1R-180P-10.0095.12-803150.0PVC8.0J-3J-2460P-30.0095.12-803150.0PVC8.0J-4J-3432P-40.0095.12-803150.0PVC8.0J-5J-47P-50.0105.24-822150.0PVC8.0J-6J-58P-60.0105.24-822150.0PVC8.0J-1J-61,276P-70.0000.000150.0PVC6.0FH-2J-328FH-20.0000.000150.0PVC6.0FH-3J-425FH-3
0.0010.8519140.0Type K Copper3.0J-9J-51033" SVC
0.0000.000140.0Ductile Iron6.0J-10J-61036" FIRE
0.34029.792,625150.0PVC6.0FH-1J-233FH-10.0064.02630150.0PVC8.0J-12J-128P-140.04311.631,822150.0PVC8.0J-2J-12487P-150.0197.61-1,192150.0PVC8.0R-2J-12123P-2
Page 1 of 127 Siemon Company Drive Suite 200 W Watertown, CT 06795 USA +1-203-755-1666
2/24/2016
Bentley WaterCAD V8i (SELECTseries 5)[08.11.05.61]
Bentley Systems, Inc. Haestad Methods Solution Center3223 WaterCAD.wtg

Active Scenario: Low HGL Max Daily + FH-2FlexTable: Junction Table
Pressure(psi)
Hydraulic Grade(ft)
Demand(gpm)
Elevation(ft)
Label
815,348.7305,162.30J-1725,333.6705,168.20J-2635,319.4905,174.70J-3695,326.6505,167.30J-4695,326.7705,167.30J-5695,326.9105,167.30J-6595,310.042,6255,174.80FH-2695,326.6505,167.80FH-3695,326.64195,168.00J-9695,326.9105,168.00J-10715,333.6705,168.50FH-1805,348.6705,162.89J-12
Page 1 of 127 Siemon Company Drive Suite 200 W Watertown, CT 06795 USA +1-203-755-1666
2/24/2016
Bentley WaterCAD V8i (SELECTseries 5)[08.11.05.61]
Bentley Systems, Inc. Haestad Methods Solution Center3223 WaterCAD.wtg

Active Scenario: Low HGL Max Daily + FH-2FlexTable: Pipe Table
Headloss Gradient
(ft/ft)
Velocity
(ft/s)
Flow(gpm)
Hazen-Williams
C
MaterialDiameter(in)
Stop Node
Start Node
Length (Scaled)
(ft)
Label
0.0299.371,469150.0PVC8.0J-1R-180P-10.0319.771,530150.0PVC8.0J-3J-2460P-30.0176.99-1,095150.0PVC8.0J-4J-3432P-40.0176.99-1,095150.0PVC8.0J-5J-47P-50.0177.11-1,114150.0PVC8.0J-6J-58P-60.0177.11-1,114150.0PVC8.0J-1J-61,276P-70.34029.792,625150.0PVC6.0FH-2J-328FH-20.0000.000150.0PVC6.0FH-3J-425FH-3
0.0010.8519140.0Type K Copper3.0J-9J-51033" SVC
0.0000.000140.0Ductile Iron6.0J-10J-61036" FIRE
0.0000.000150.0PVC6.0FH-1J-233FH-10.0022.27355150.0PVC8.0J-12J-128P-140.0319.771,530150.0PVC8.0J-2J-12487P-150.0197.50-1,175150.0PVC8.0R-2J-12123P-2
Page 1 of 127 Siemon Company Drive Suite 200 W Watertown, CT 06795 USA +1-203-755-1666
2/24/2016
Bentley WaterCAD V8i (SELECTseries 5)[08.11.05.61]
Bentley Systems, Inc. Haestad Methods Solution Center3223 WaterCAD.wtg

Active Scenario: Low HGL Max Daily + FH-3FlexTable: Junction Table
Pressure(psi)
Hydraulic Grade(ft)
Demand(gpm)
Elevation(ft)
Label
815,348.7005,162.30J-1735,337.6305,168.20J-2665,327.1705,174.70J-3655,317.3605,167.30J-4655,317.5305,167.30J-5655,317.7405,167.30J-6665,327.1705,174.80FH-2615,308.862,6255,167.80FH-3655,317.41195,168.00J-9655,317.7405,168.00J-10735,337.6305,168.50FH-1805,348.7005,162.89J-12
Page 1 of 127 Siemon Company Drive Suite 200 W Watertown, CT 06795 USA +1-203-755-1666
2/24/2016
Bentley WaterCAD V8i (SELECTseries 5)[08.11.05.61]
Bentley Systems, Inc. Haestad Methods Solution Center3223 WaterCAD.wtg

Active Scenario: Low HGL Max Daily + FH-3FlexTable: Pipe Table
Headloss Gradient
(ft/ft)
Velocity
(ft/s)
Flow(gpm)
Hazen-Williams
C
MaterialDiameter(in)
Stop Node
Start Node
Length (Scaled)
(ft)
Label
0.0299.421,476150.0PVC8.0J-1R-180P-10.0238.291,298150.0PVC8.0J-3J-2460P-30.0238.291,298150.0PVC8.0J-4J-3432P-40.0248.47-1,327150.0PVC8.0J-5J-47P-50.0248.59-1,345150.0PVC8.0J-6J-58P-60.0248.59-1,345150.0PVC8.0J-1J-61,276P-70.0000.000150.0PVC6.0FH-2J-328FH-20.34029.792,625150.0PVC6.0FH-3J-425FH-3
0.0010.8519140.0Type K Copper3.0J-9J-51033" SVC
0.0000.000140.0Ductile Iron6.0J-10J-61036" FIRE
0.0000.000150.0PVC6.0FH-1J-233FH-10.0000.83131150.0PVC8.0J-12J-128P-140.0238.291,298150.0PVC8.0J-2J-12487P-150.0197.45-1,168150.0PVC8.0R-2J-12123P-2
Page 1 of 127 Siemon Company Drive Suite 200 W Watertown, CT 06795 USA +1-203-755-1666
2/24/2016
Bentley WaterCAD V8i (SELECTseries 5)[08.11.05.61]
Bentley Systems, Inc. Haestad Methods Solution Center3223 WaterCAD.wtg

Final Utility Report
Topgolf Thornton – Thornton, Colorado
12
APPENDIX C Sanitary Lift Station Design
