topic 10: integration · producer surplus q supply curve: p = g(q) q1 p p1 0 a y producer surplus...
TRANSCRIPT

1
Topic 10: Topic 10: IntegrationIntegration
Jacques Jacques IndefinateIndefinate Integration 6.1Integration 6.1DefinateDefinate Integration 6.2Integration 6.2
2
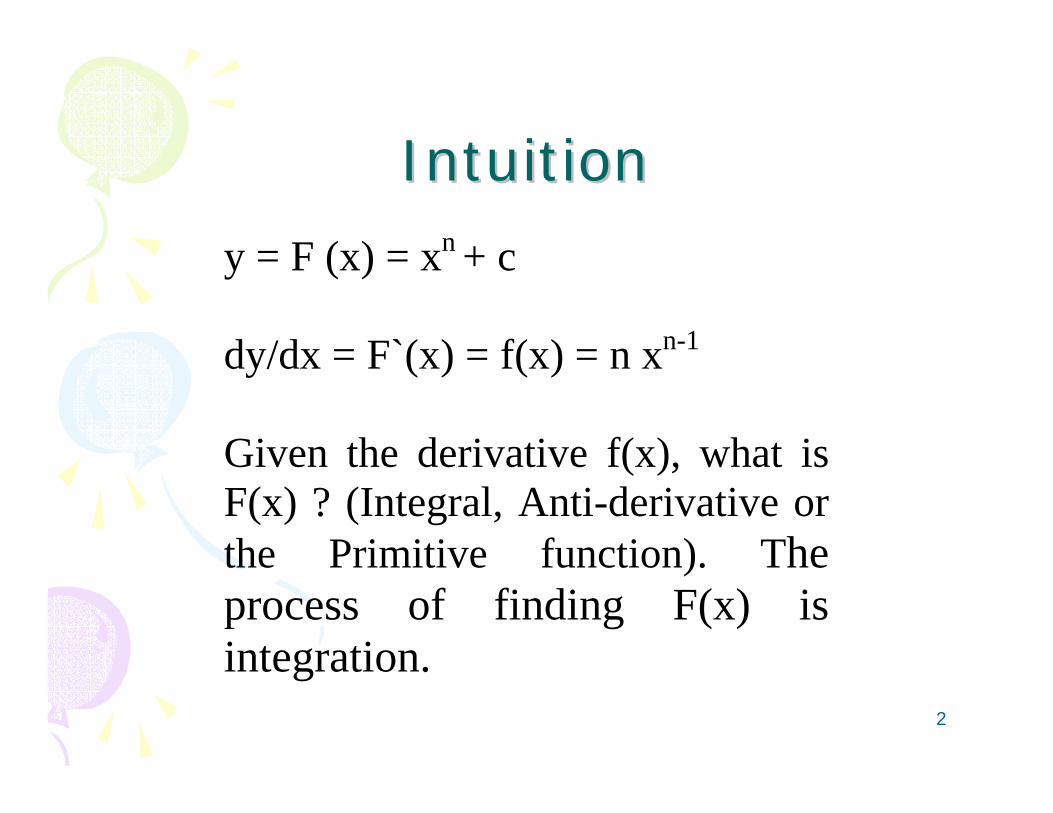
IntuitionIntuition
y = F (x) = xn + c
dy/dx = F`(x) = f(x) = n xn-1 Given the derivative f(x), what isF(x) ? (Integral, Anti-derivative orthe Primitive function). The process of finding F(x) isintegration.
3
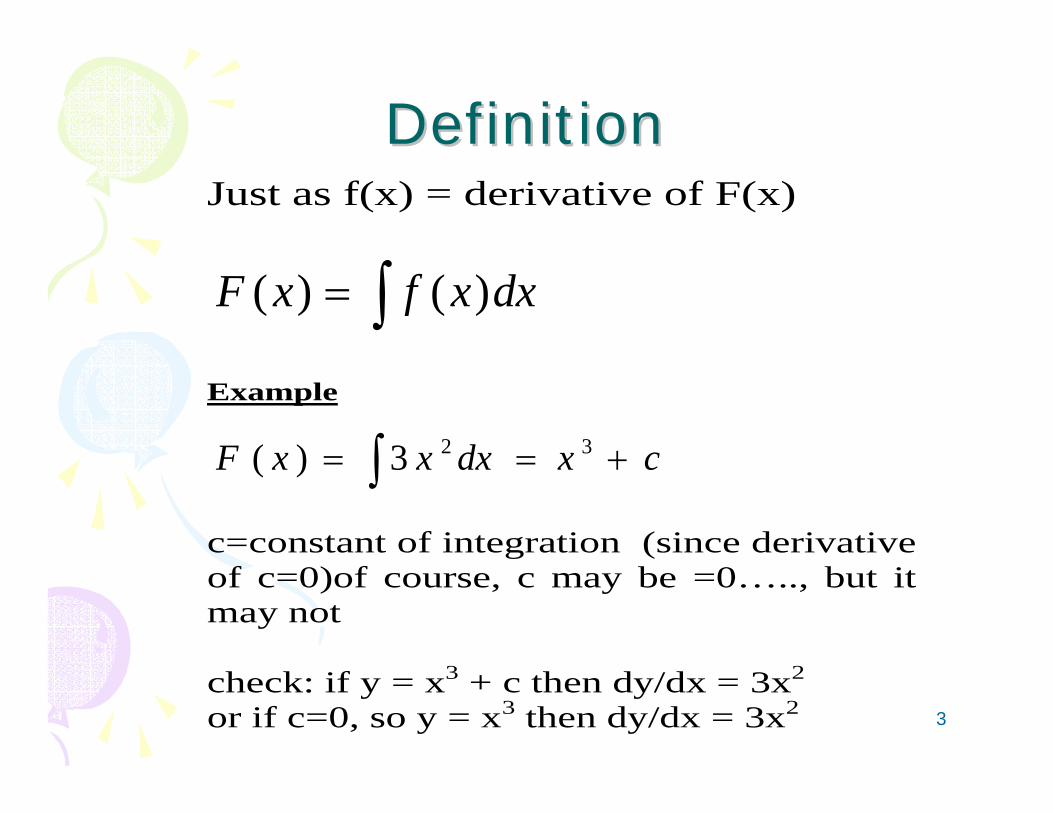
DefinitionDefinitionJust as f(x) = derivative of F(x)
∫= dxxfxF )()(
Example
cxdxxxF +== ∫ 323)(
c=constant of integration (since derivativeof c=0)of course, c may be =0….., but itmay not check: if y = x3 + c then dy/dx = 3x2
or if c=0, so y = x3 then dy/dx = 3x2
4
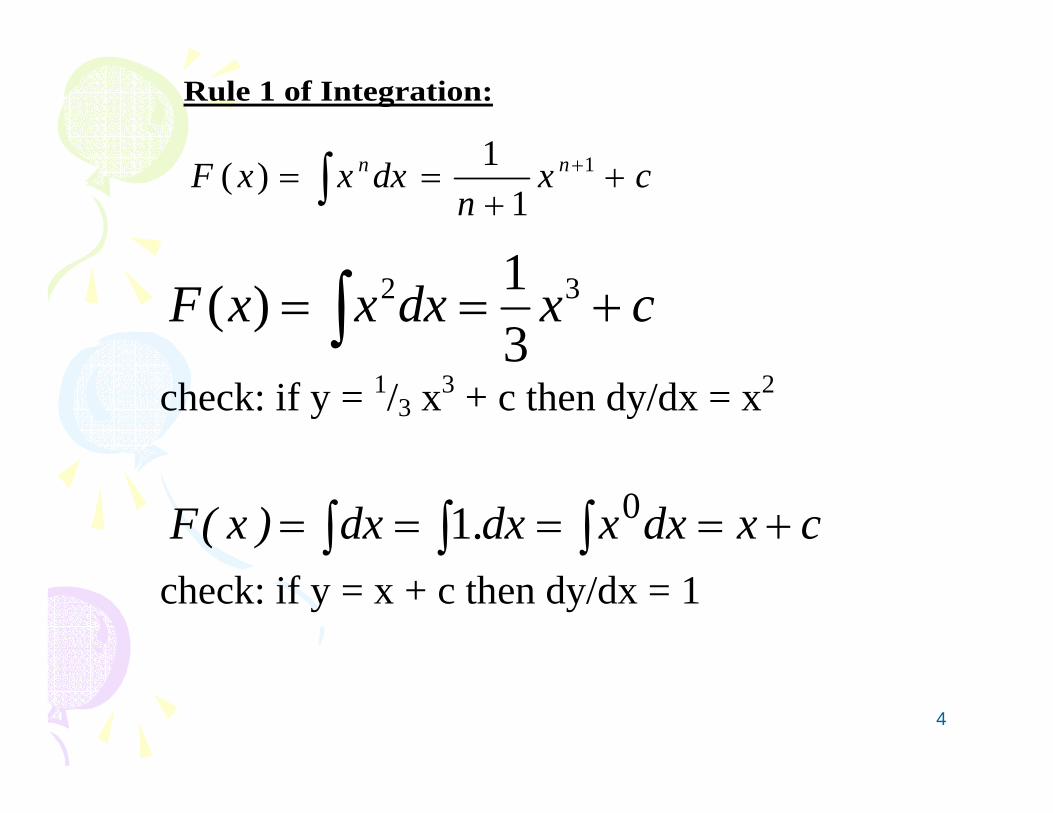
Rule 1 of Integration:
cxn
dxxxF nn ++
== +∫ 1
11)(
cxdxxxF +== ∫ 32
31)(
check: if y = 1/3 x3 + c then dy/dx = x2
cxdxxdx.dx)x(F +==== ∫∫∫ 01 check: if y = x + c then dy/dx = 1
5
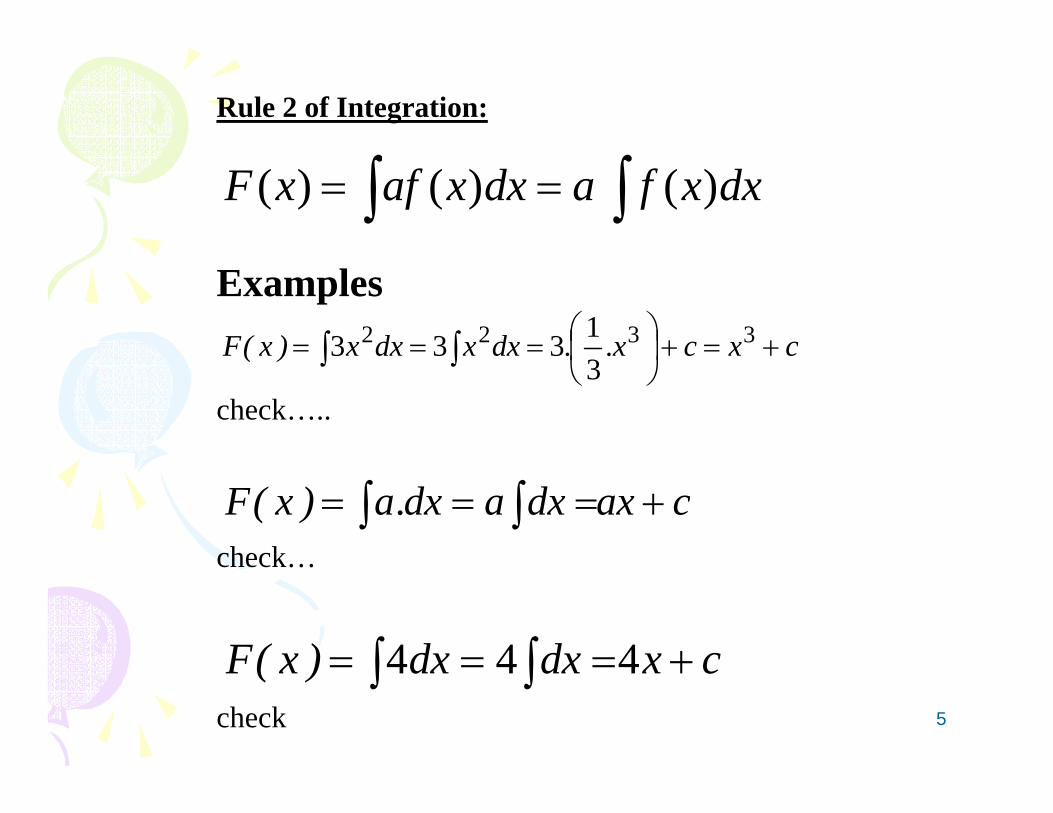
Rule 2 of Integration:
∫∫ == dxxfadxxafxF )()()(
Examples cxcx..dxxdxx)x(F +=+⎟
⎠⎞
⎜⎝⎛=== ∫∫ 3322
31333
check…..
caxdxadx.a)x(F +=== ∫∫
check…
cxdxdx)x(F +=== ∫∫ 444 check
6
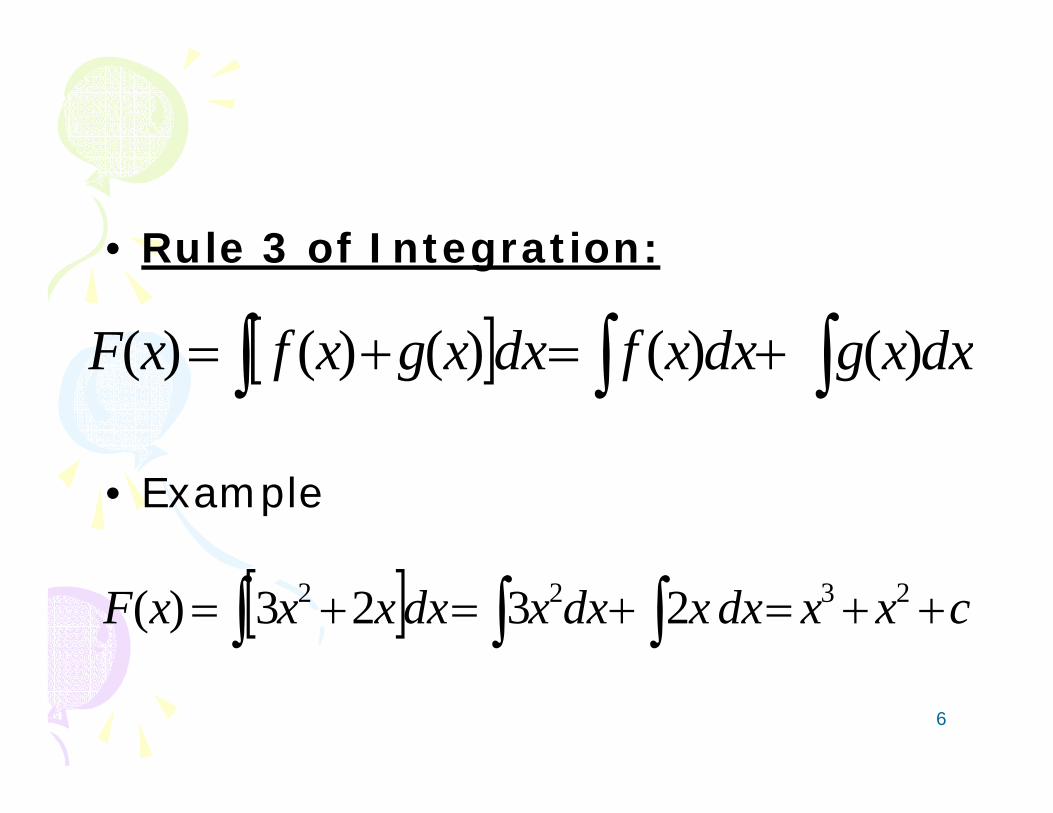
• Rule 3 of Integration:
• Example
[ ] ∫∫∫ +=+= dxxgdxxfdxxgxfxF )()()()()(
[ ] cxxdxxdxxdxxxxF ++=+=+= ∫∫∫ 2322 2323)(
7
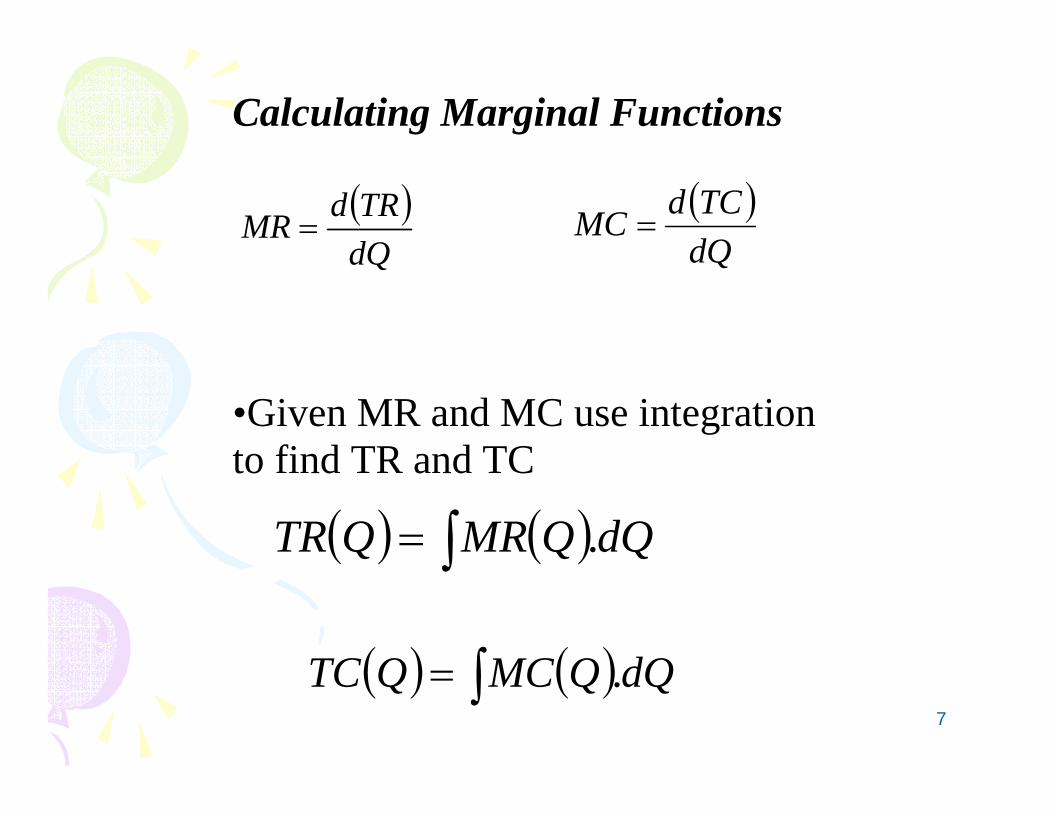
Calculating Marginal Functions
•Given MR and MC use integration to find TR and TC
( )dQTRdMR =
( )dQTCdMC =
( ) ( )∫= dQQMRQTR .
( ) ( )∫= dQQMCQTC .
8
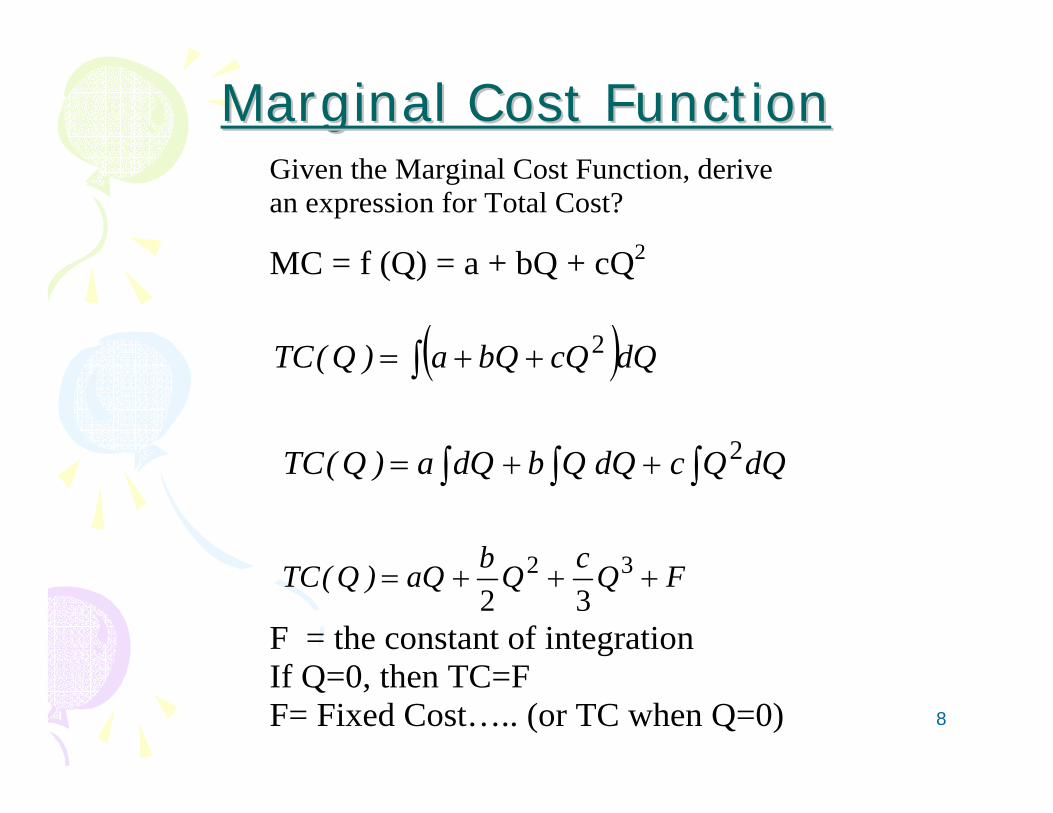
Marginal Cost FunctionMarginal Cost FunctionGiven the Marginal Cost Function, derive an expression for Total Cost?
MC = f (Q) = a + bQ + cQ2
( )∫ ++= dQcQbQa)Q(TC 2
∫∫∫ ++= dQQcdQQbdQa)Q(TC 2
FQcQbaQ)Q(TC +++= 32
32 F = the constant of integration If Q=0, then TC=F F= Fixed Cost….. (or TC when Q=0)
9
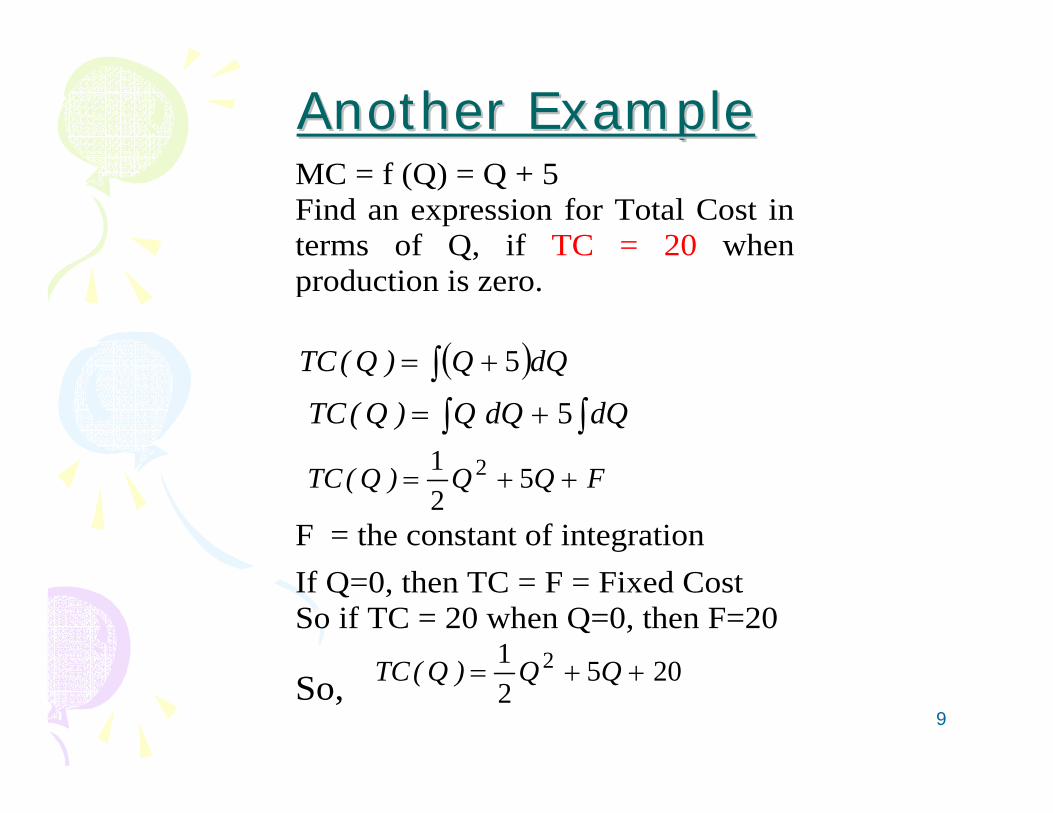
Another ExampleAnother ExampleMC = f (Q) = Q + 5 Find an expression for Total Cost interms of Q, if TC = 20 when production is zero.
( )∫ += dQQ)Q(TC 5 ∫∫ += dQdQQ)Q(TC 5 FQQ)Q(TC ++= 5
21 2
F = the constant of integration If Q=0, then TC = F = Fixed Cost So if TC = 20 when Q=0, then F=20
So, 20521 2 ++= QQ)Q(TC
10
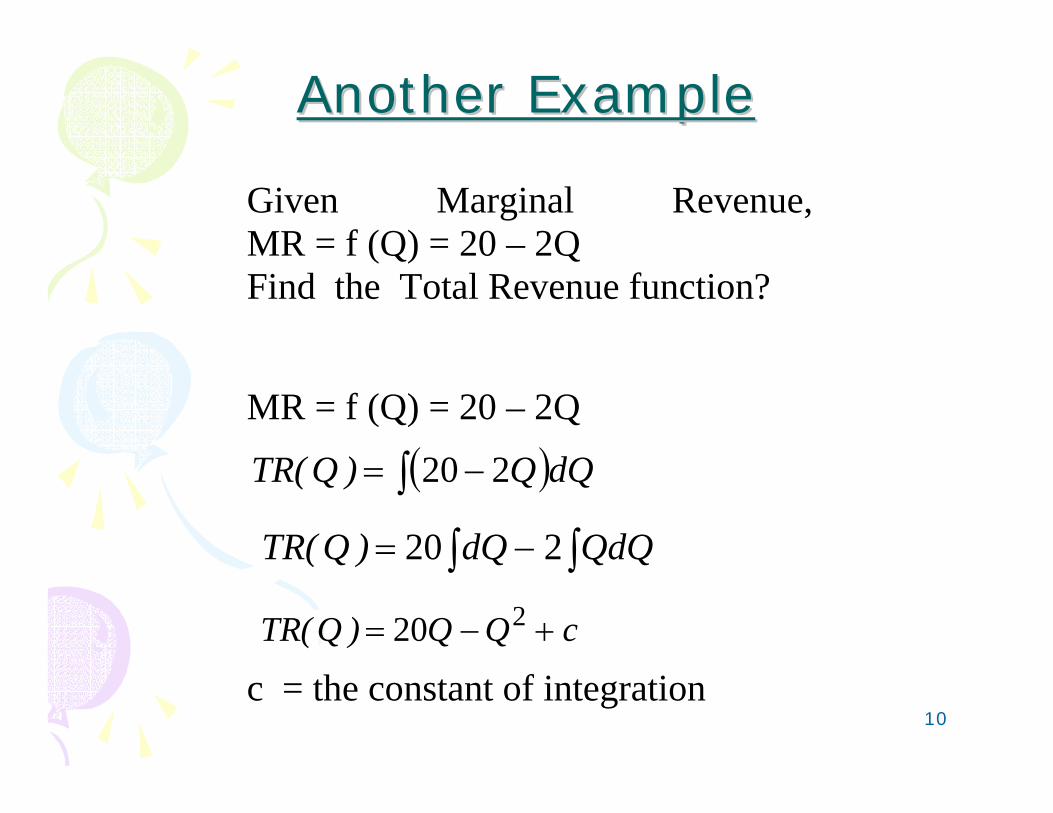
Another ExampleAnother Example
Given Marginal Revenue,MR = f (Q) = 20 – 2Q Find the Total Revenue function?
MR = f (Q) = 20 – 2Q
( )∫ −= dQQ)Q(TR 220
∫∫ −= QdQdQ)Q(TR 220 cQQ)Q(TR +−= 220
c = the constant of integration
11
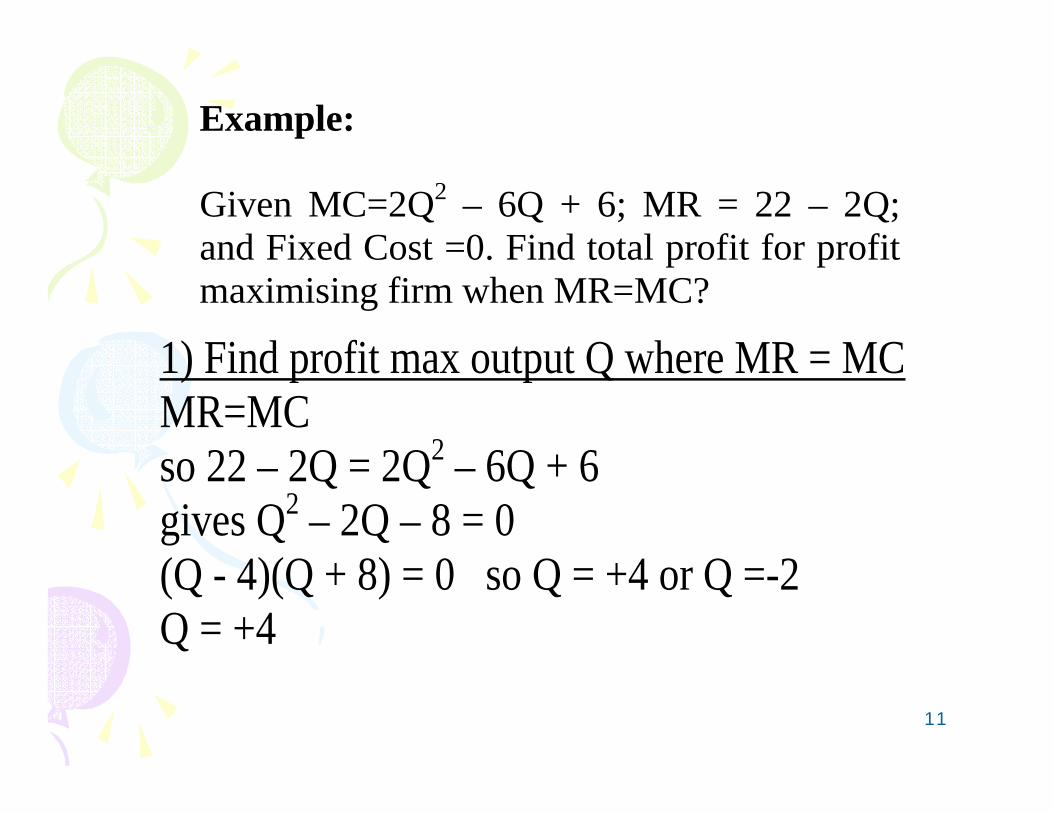
Example: Given MC=2Q2 – 6Q + 6; MR = 22 – 2Q; and Fixed Cost =0. Find total profit for profitmaximising firm when MR=MC?
1) Find profit max output Q where MR = MC MR=MC so 22 – 2Q = 2Q2 – 6Q + 6 gives Q2 – 2Q – 8 = 0 (Q - 4)(Q + 8) = 0 so Q = +4 or Q =-2 Q = +4
12
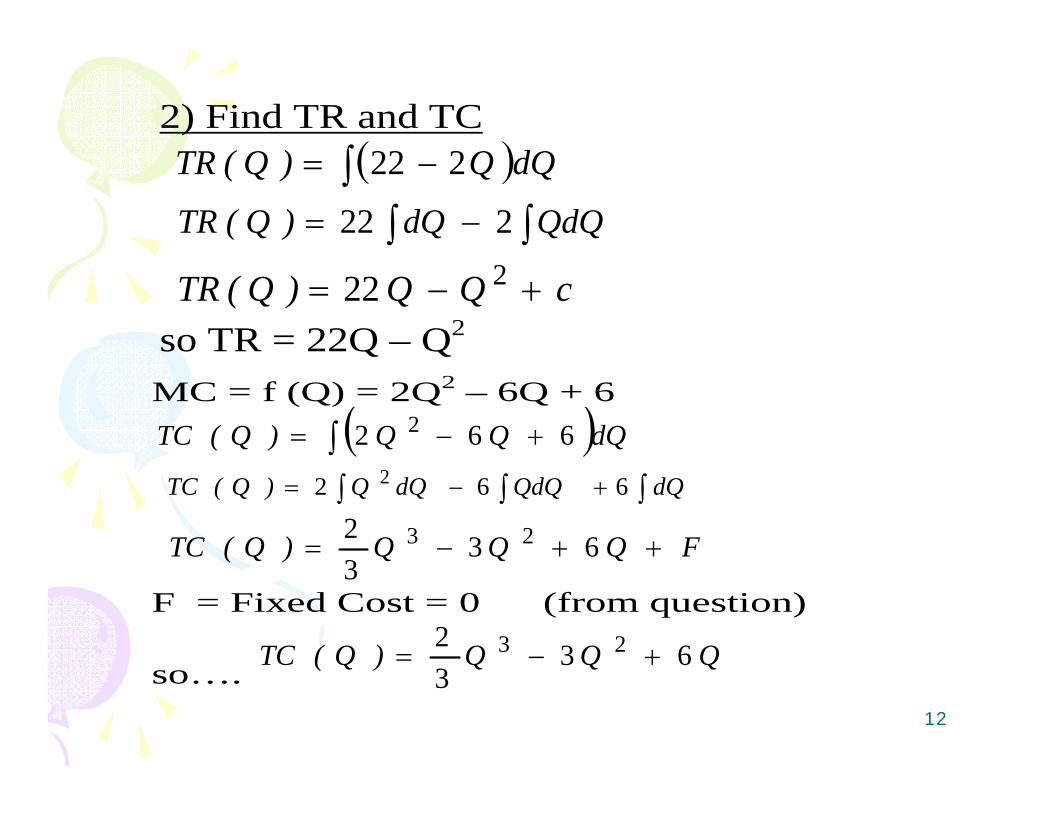
2) Find TR and TC
( )∫ −= dQQ)Q(TR 222 ∫∫ −= QdQdQ)Q(TR 222
cQQ)Q(TR +−= 222 so TR = 22Q – Q2 MC = f (Q) = 2Q2 – 6Q + 6
( )∫ +−= dQQQ)Q(TC 662 2
∫∫∫ +−= dQQdQdQQ)Q(TC 662 2
FQQQ)Q(TC ++−= 6332 23
F = Fixed Cost = 0 (from question)
so….QQQ)Q(TC 63
32 23 +−=
13
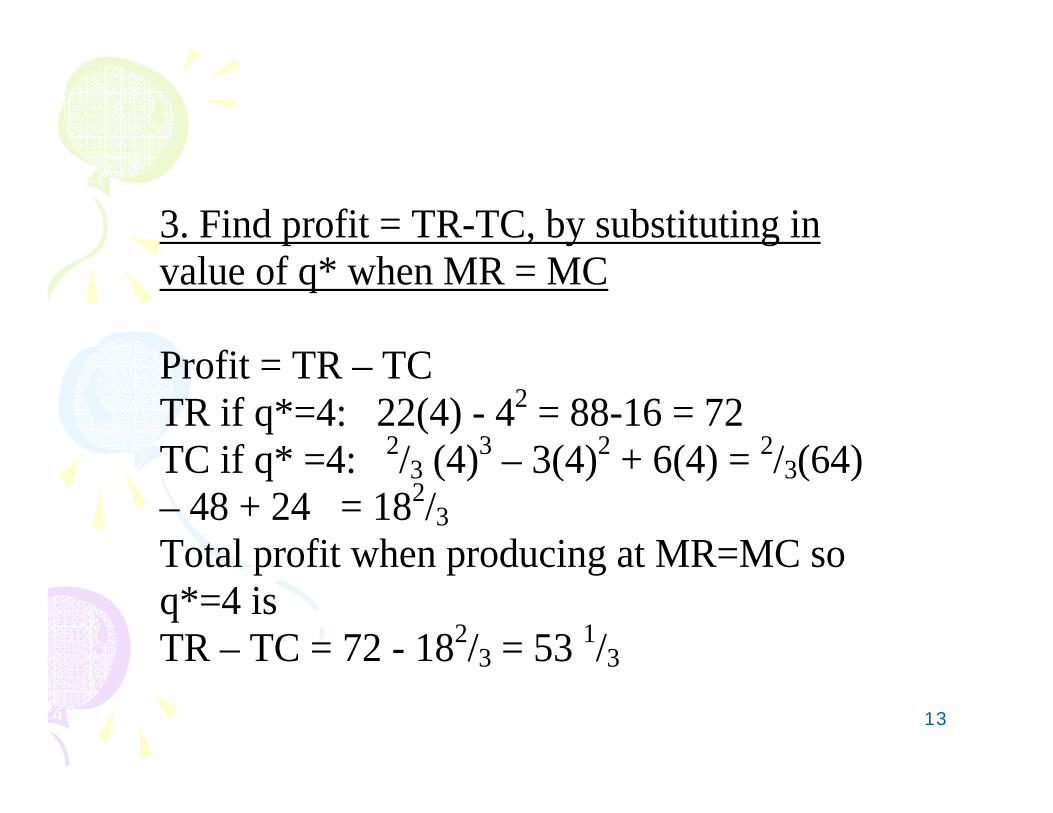
3. Find profit = TR-TC, by substituting in value of q* when MR = MC Profit = TR – TC TR if q*=4: 22(4) - 42 = 88-16 = 72 TC if q* =4: 2/3 (4)3 – 3(4)2 + 6(4) = 2/3(64) – 48 + 24 = 182/3 Total profit when producing at MR=MC so q*=4 is TR – TC = 72 - 182/3 = 53 1/3
14
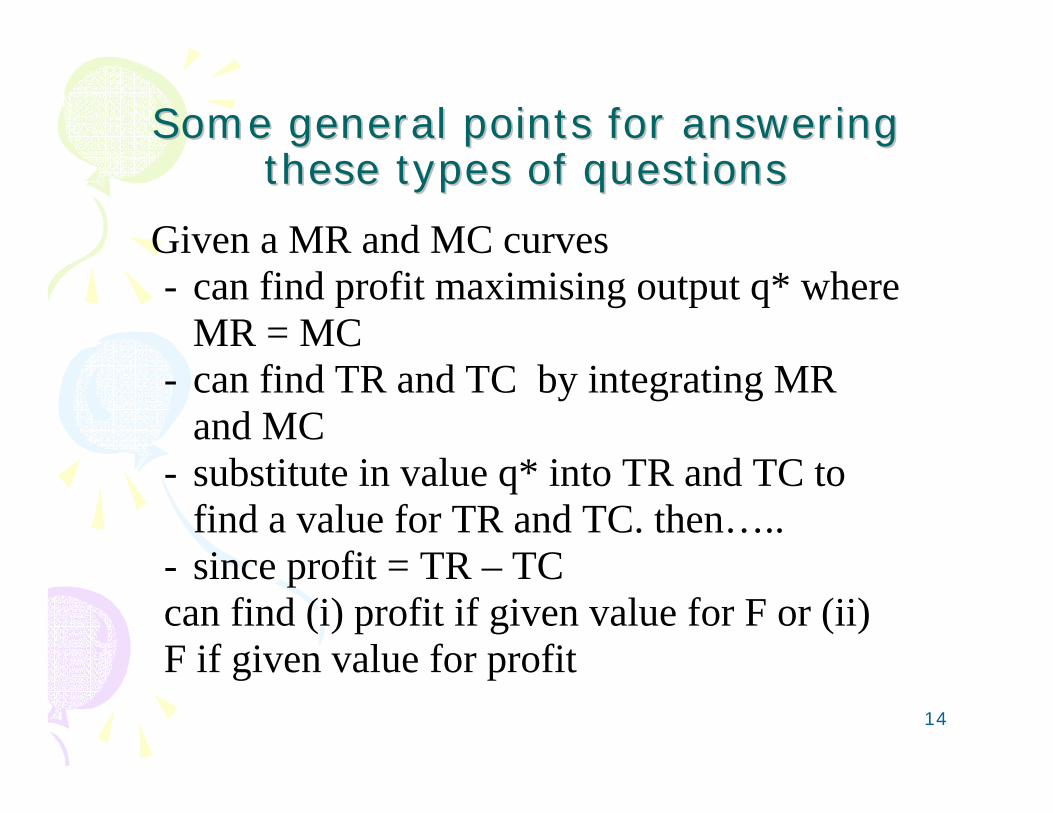
Some general points for answering Some general points for answering these types of questionsthese types of questions
Given a MR and MC curves - can find profit maximising output q* where
MR = MC - can find TR and TC by integrating MR
and MC - substitute in value q* into TR and TC to
find a value for TR and TC. then….. - since profit = TR – TC can find (i) profit if given value for F or (ii) F if given value for profit
15
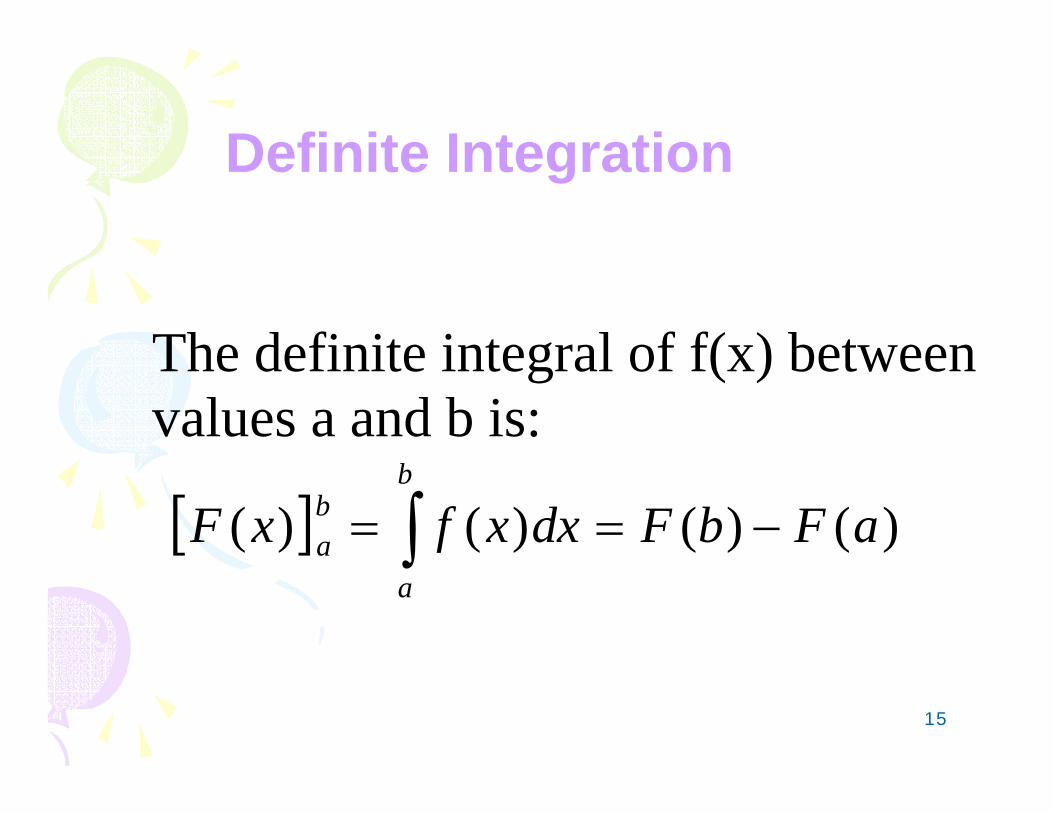
The definite integral of f(x) between values a and b is:
[ ] )()()()( aFbFdxxfxFb
a
ba −== ∫
Definite Integration
16
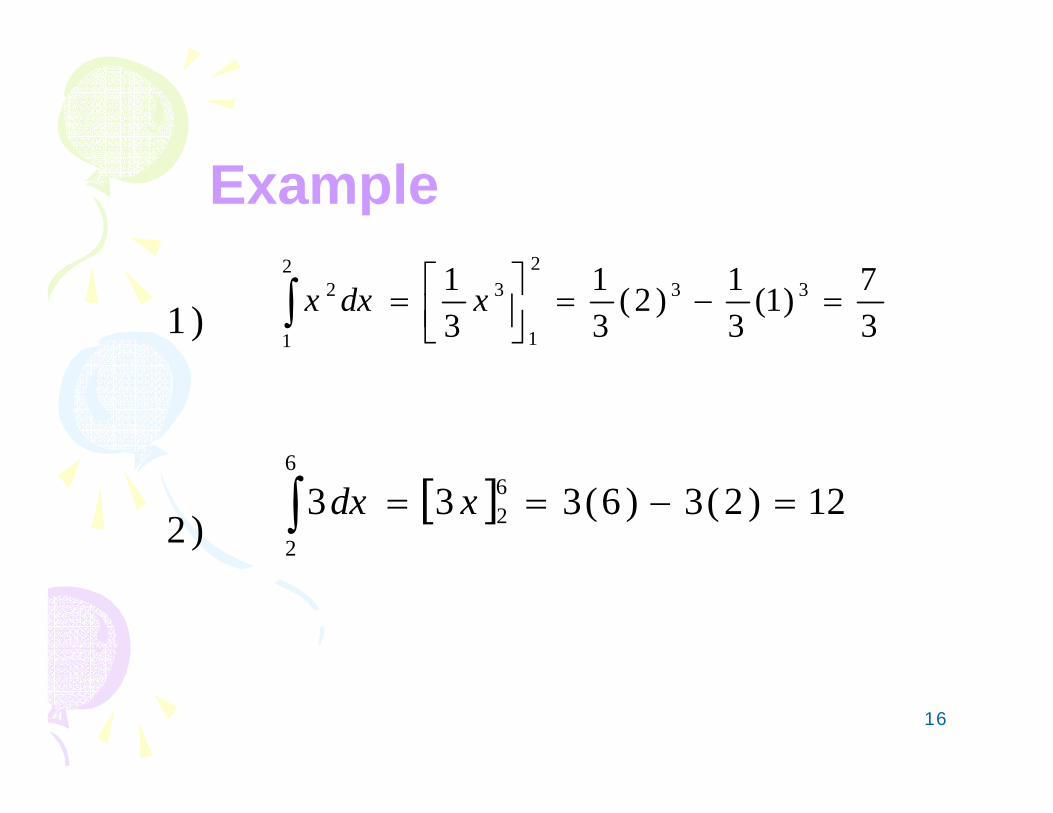
1 ) 37)1(
31)2(
31
31 33
2
1
32
1
2 =−=⎥⎦⎤
⎢⎣⎡=∫ xdxx
2 ) [ ] 12)2(3)6(333 6
2
6
2
=−==∫ xdx
Example
17
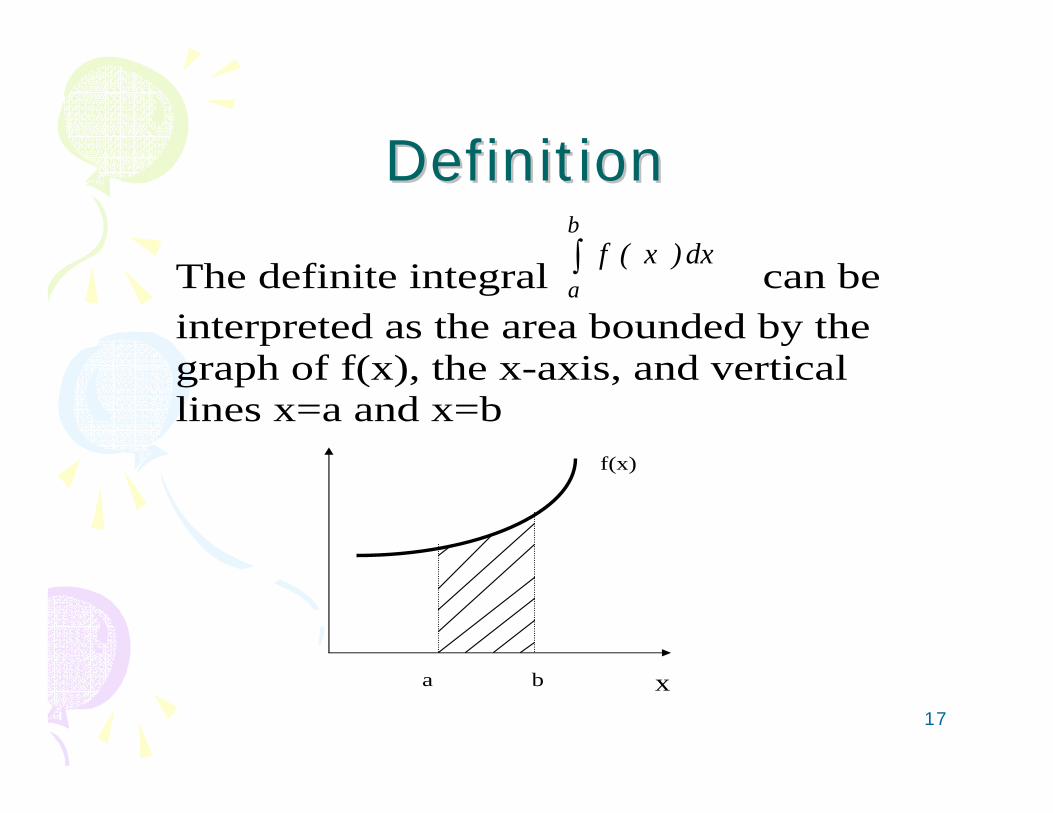
DefinitionDefinition
The definite integral ∫b
adx)x(f
can be interpreted as the area bounded by the graph of f(x), the x-axis, and vertical lines x=a and x=b
x
f(x)
a b
18
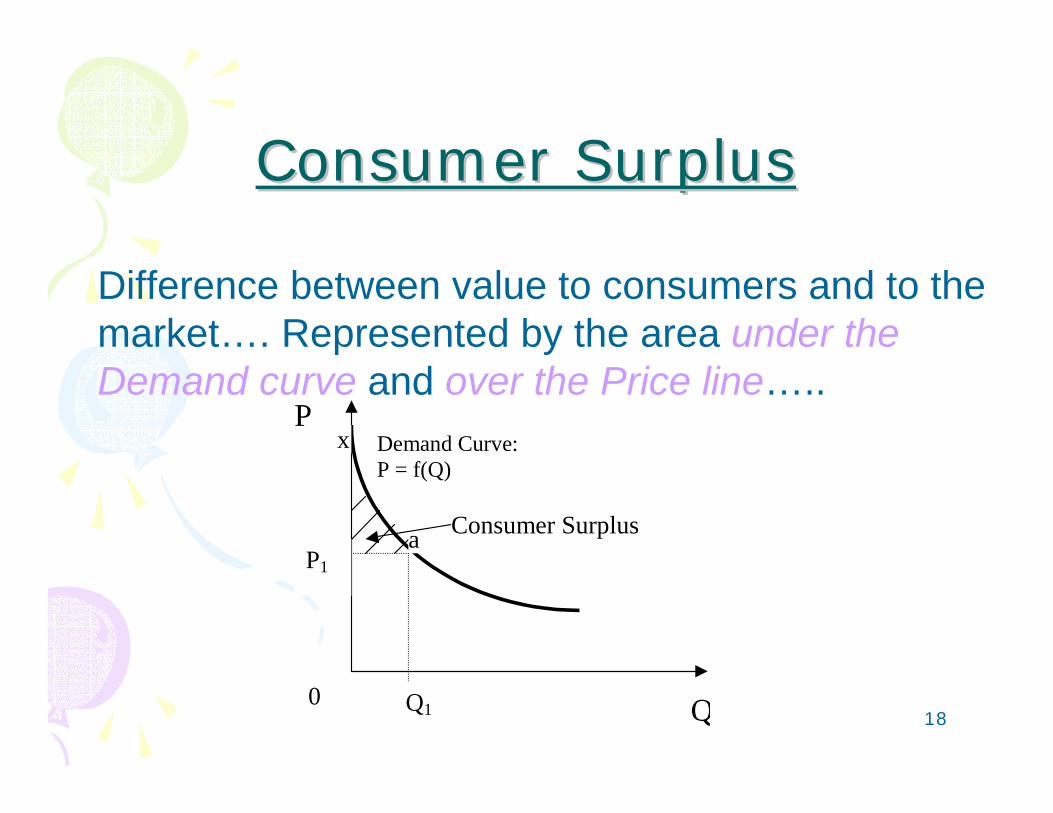
Consumer SurplusConsumer Surplus
Q
Demand Curve: P = f(Q)
Q1
P
P1
0
a
x
Consumer Surplus
Difference between value to consumers and to the market…. Represented by the area under the Demand curve and over the Price line…..
19
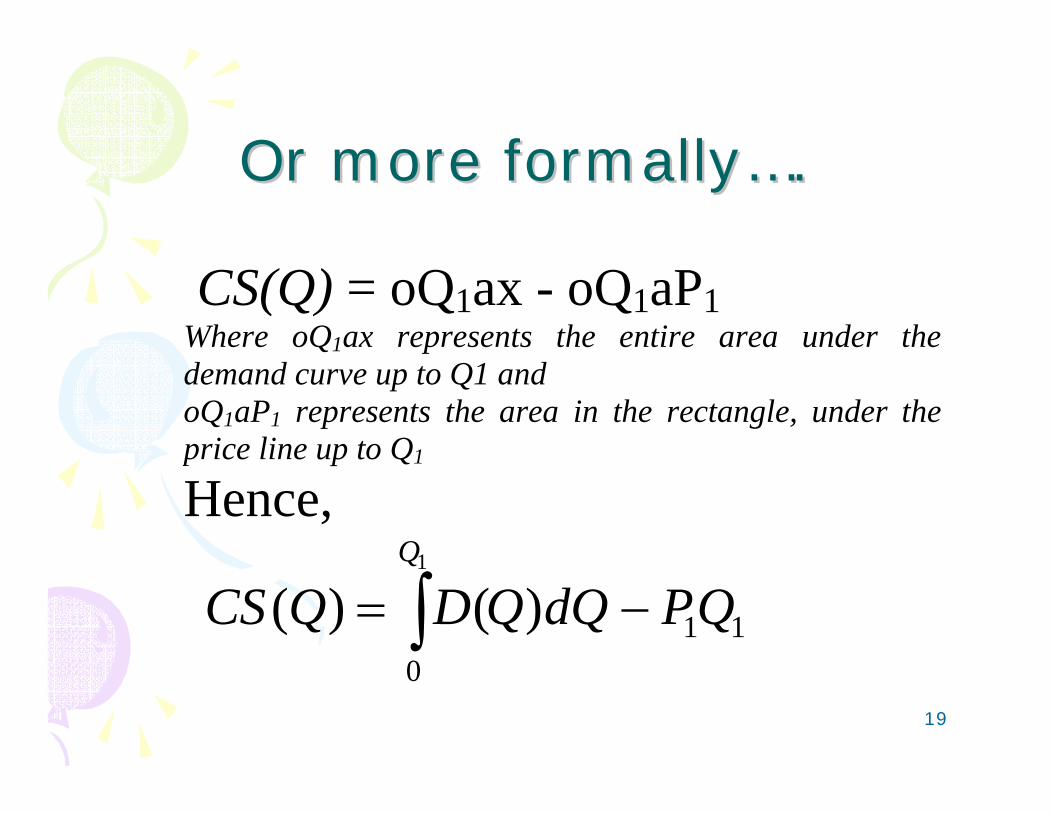
Or more formally….Or more formally….
CS(Q) = oQ1ax - oQ1aP1 Where oQ1ax represents the entire area under thedemand curve up to Q1 and oQ1aP1 represents the area in the rectangle, under theprice line up to Q1 Hence,
110
)()(1
QPdQQDQCSQ
−= ∫
20
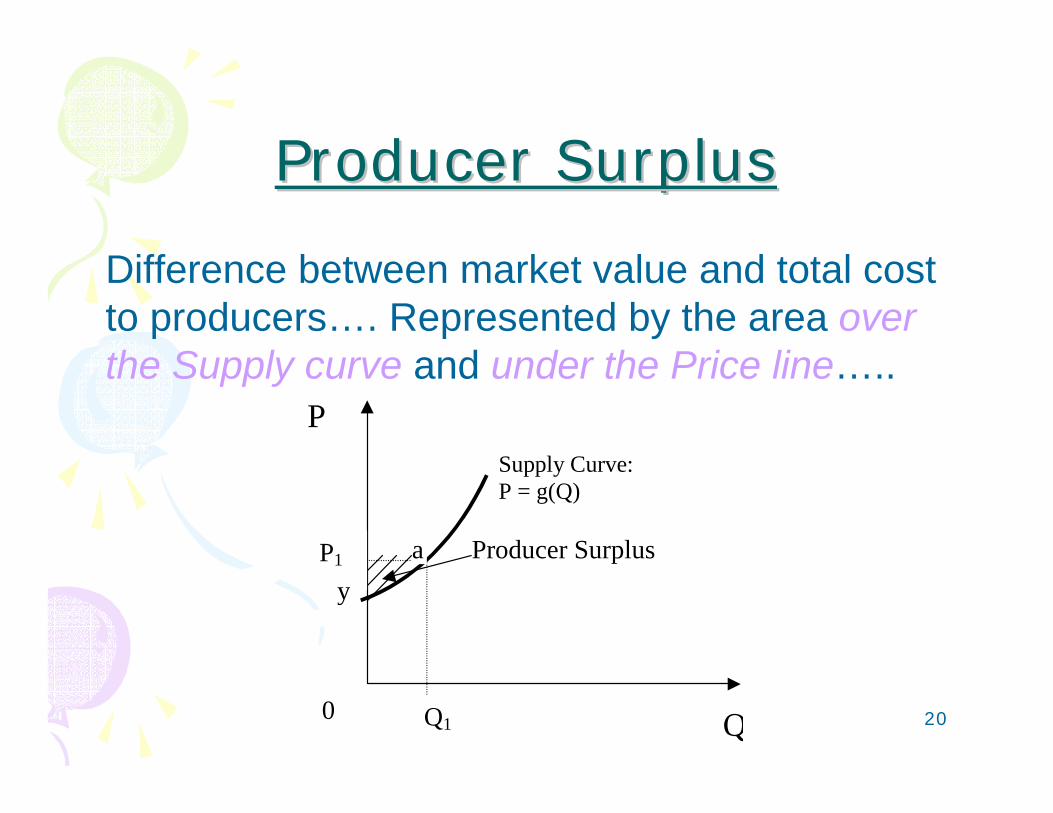
Producer SurplusProducer Surplus
Q
Supply Curve: P = g(Q)
Q1
P
P1
0
ay
Producer Surplus
Difference between market value and total cost to producers…. Represented by the area over the Supply curve and under the Price line…..
21
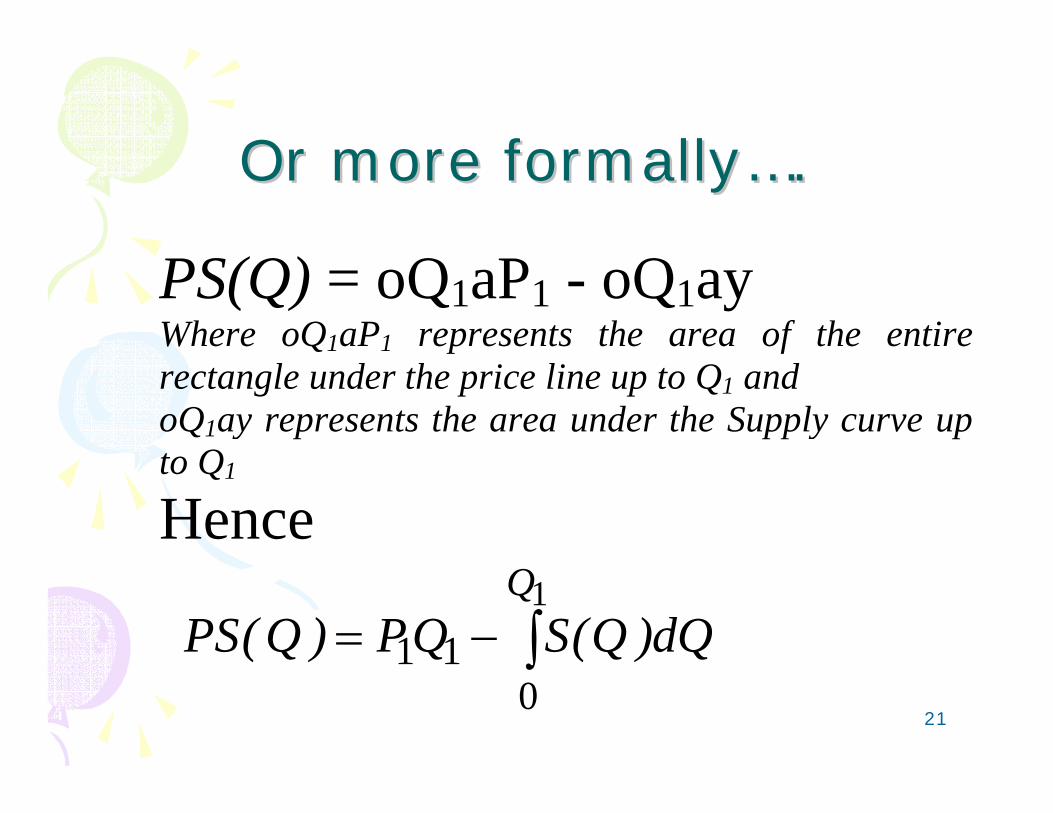
Or more formally….Or more formally….
PS(Q) = oQ1aP1 - oQ1ay Where oQ1aP1 represents the area of the entirerectangle under the price line up to Q1 and oQ1ay represents the area under the Supply curve upto Q1 Hence
dQ)Q(SQP)Q(PSQ
∫−=1
011
22
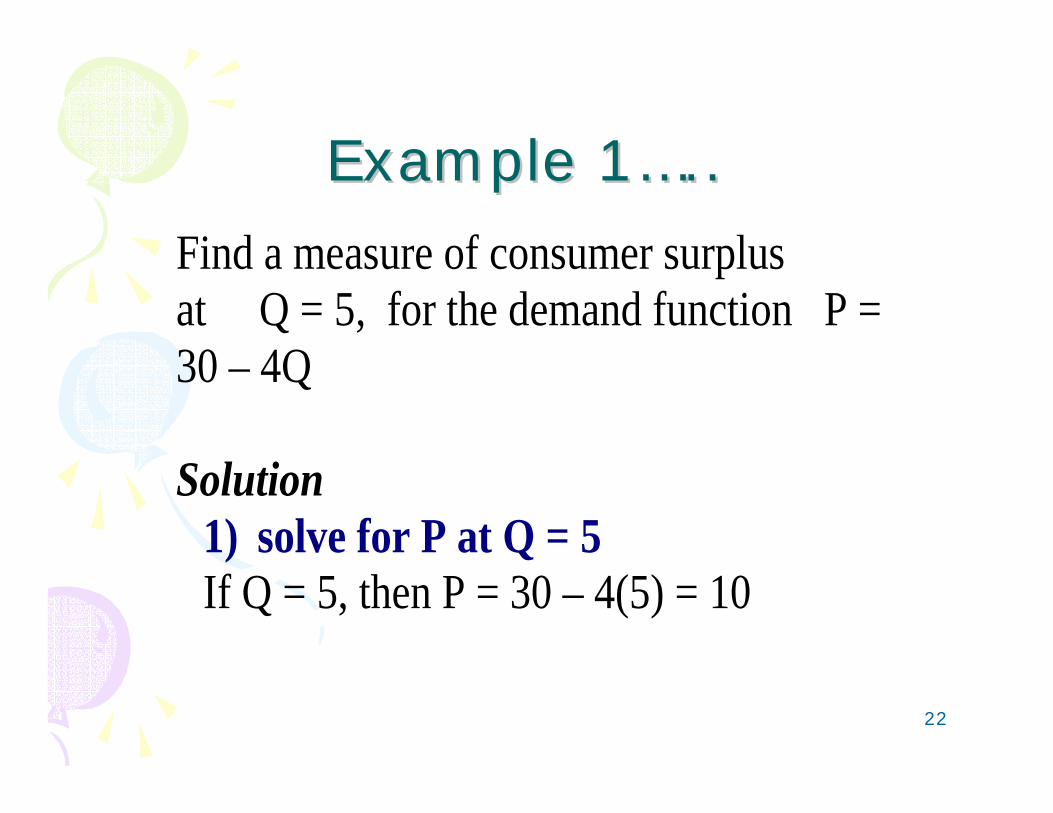
Example 1…..Example 1…..
Find a measure of consumer surplus at Q = 5, for the demand function P = 30 – 4Q Solution
1) solve for P at Q = 5 If Q = 5, then P = 30 – 4(5) = 10
23
Q
Demand Curve: P = f(Q) = 30 – 4Q
Q1 = 5
P
P1=10
0
30
Consumer Surplus
7.5
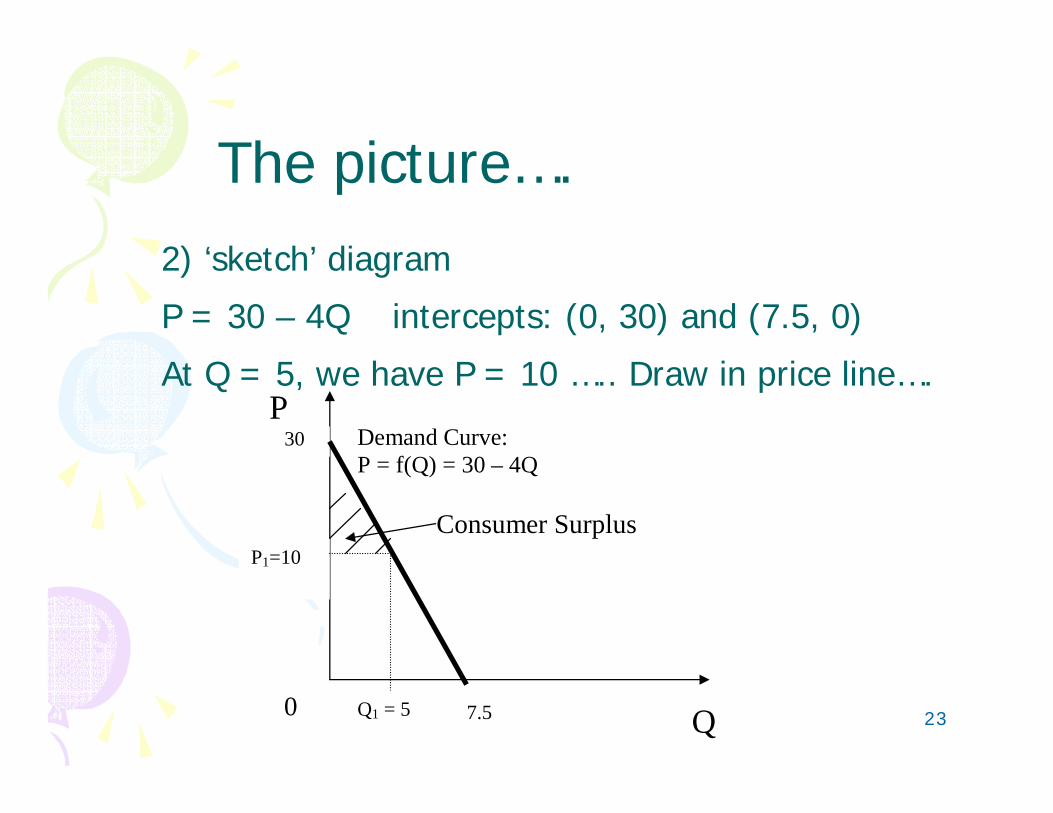
The picture….2) ‘sketch’ diagram
P = 30 – 4Q intercepts: (0, 30) and (7.5, 0)
At Q = 5, we have P = 10 ….. Draw in price line….
24
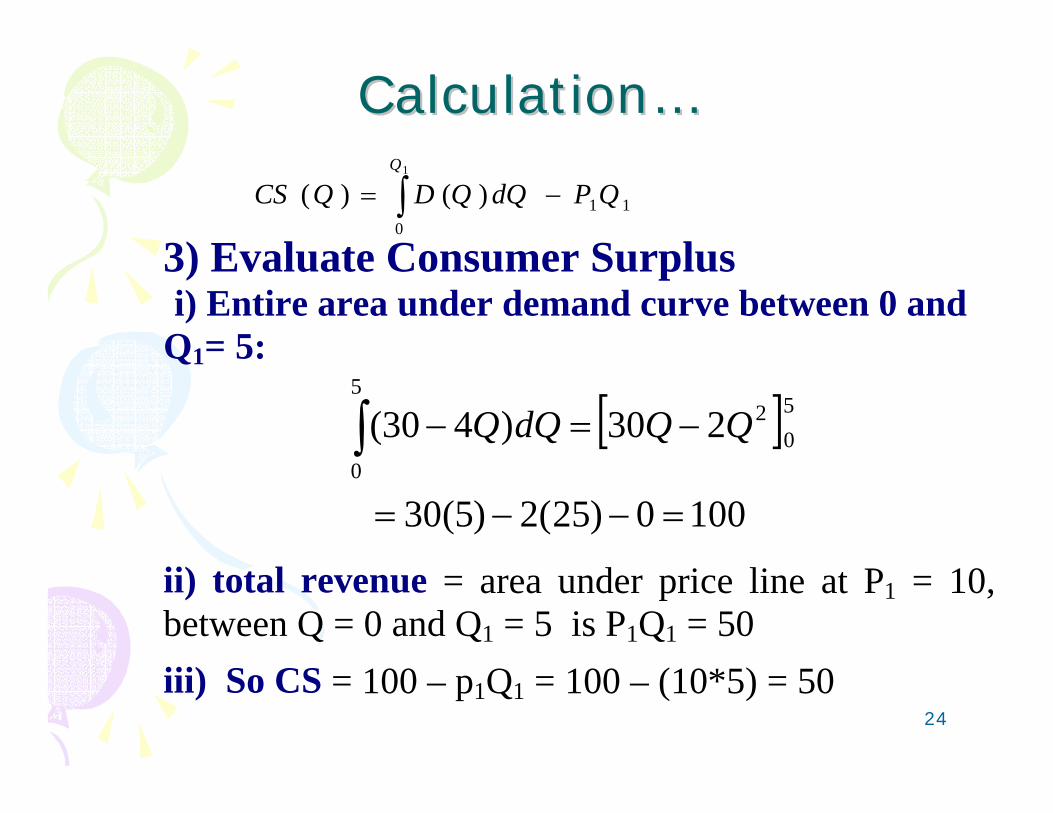
Calculation… Calculation…
3) Evaluate Consumer Surplus i) Entire area under demand curve between 0 and Q1= 5:
[ ]1000)25(2)5(30
230)430( 50
25
0
=−−=
−=−∫ QQdQQ
ii) total revenue = area under price line at P1 = 10, between Q = 0 and Q1 = 5 is P1Q1 = 50
iii) So CS = 100 – p1Q1 = 100 – (10*5) = 50
110
)()(1
QPdQQDQCSQ
−= ∫
25
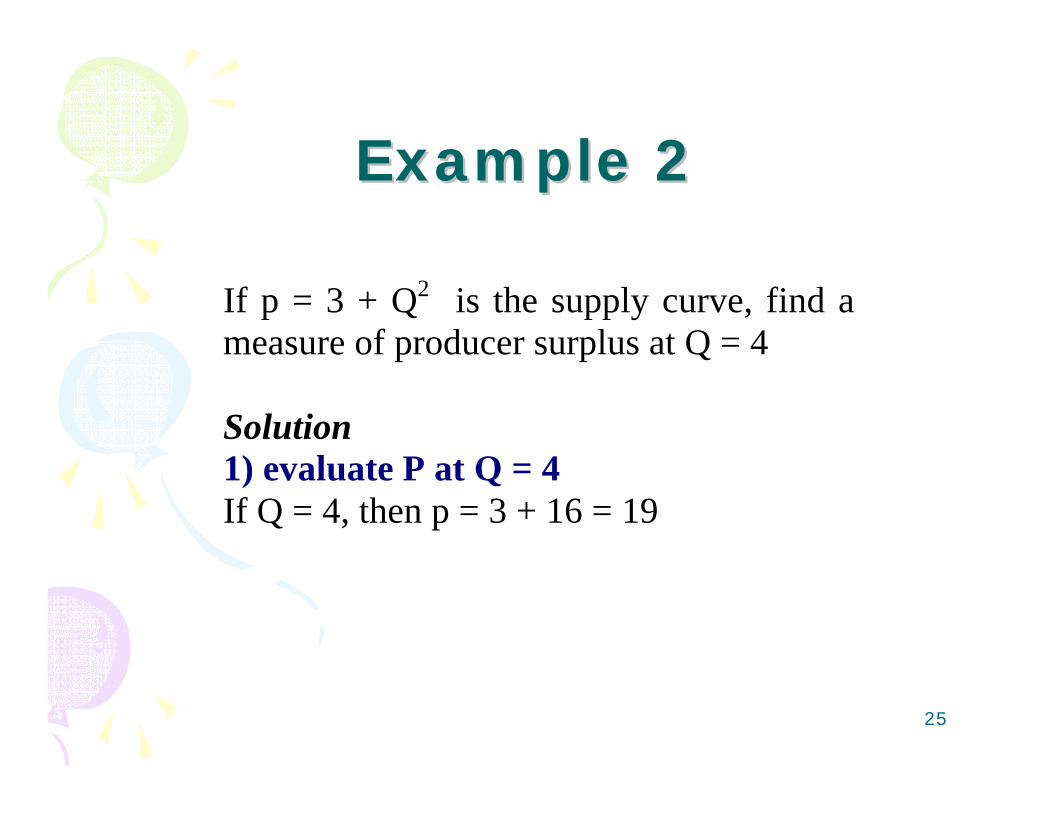
Example 2Example 2
If p = 3 + Q2 is the supply curve, find ameasure of producer surplus at Q = 4 Solution 1) evaluate P at Q = 4 If Q = 4, then p = 3 + 16 = 19
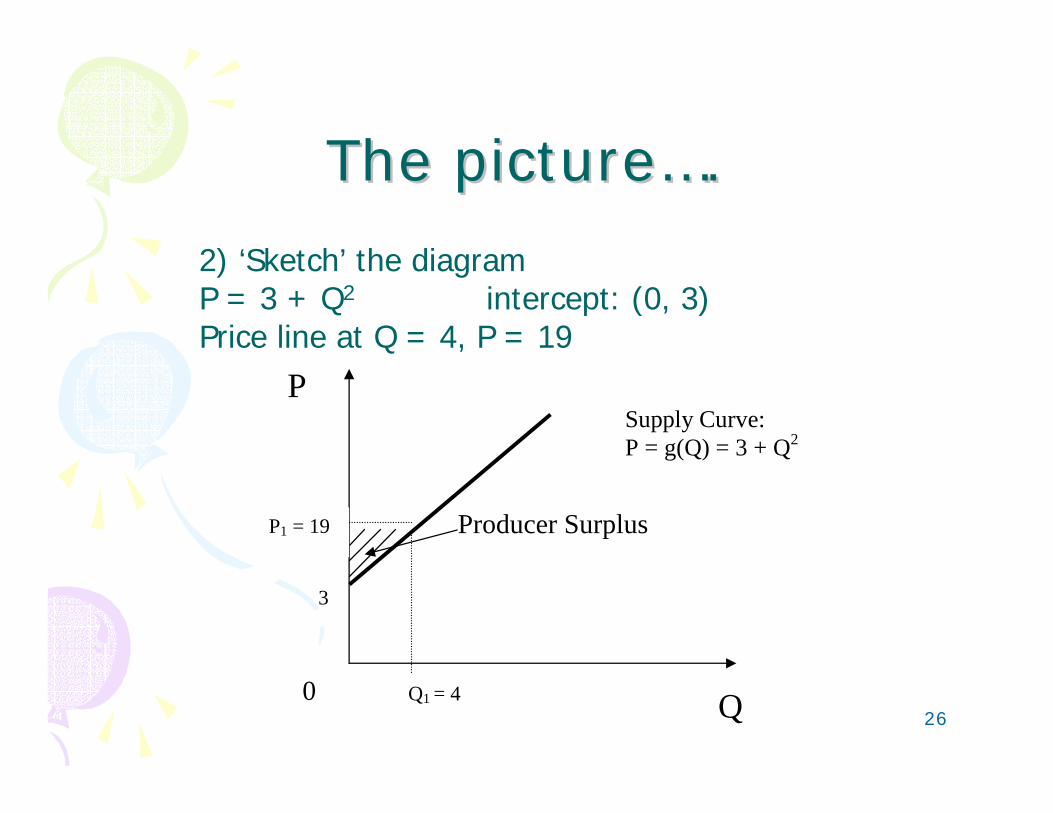
26
The picture….The picture….
Q
Supply Curve: P = g(Q) = 3 + Q2
Q1 = 4
P
P1 = 19
0
3
Producer Surplus
2) ‘Sketch’ the diagramP = 3 + Q2 intercept: (0, 3) Price line at Q = 4, P = 19
27
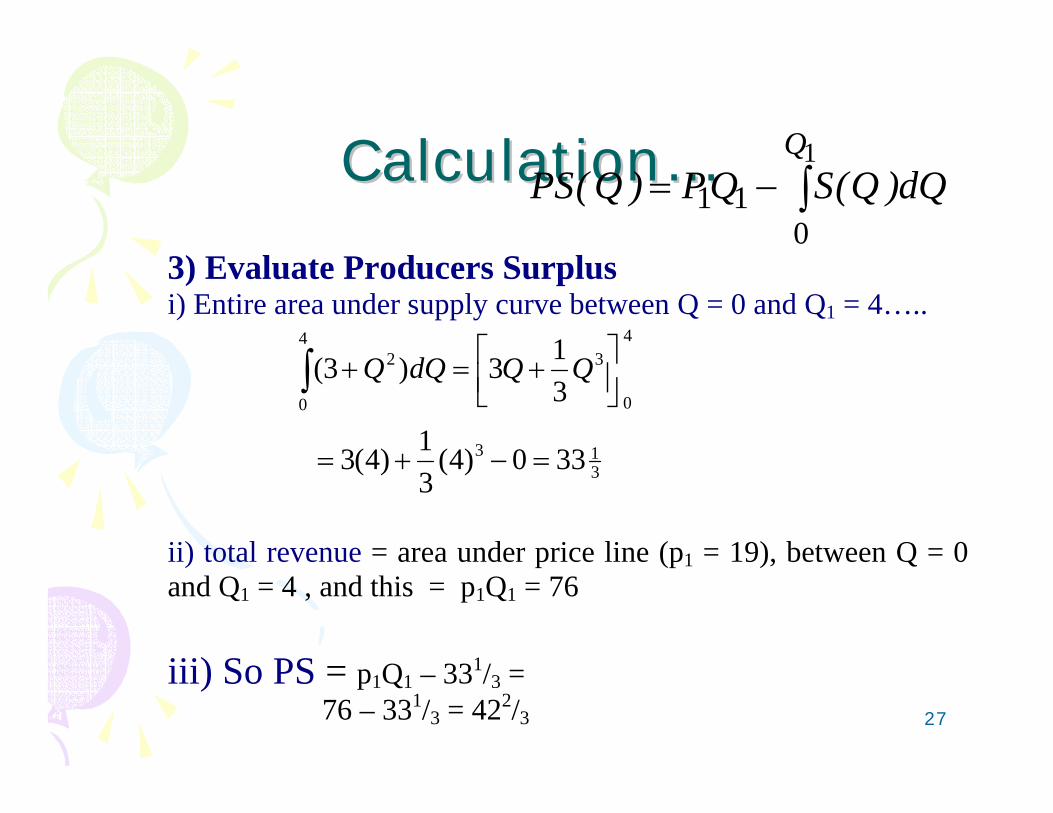
Calculation…Calculation…
3) Evaluate Producers Surplus i) Entire area under supply curve between Q = 0 and Q1 = 4…..
313
4
0
34
0
2
330)4(31)4(3
313)3(
=−+=
⎥⎦⎤
⎢⎣⎡ +=+∫ QQdQQ
ii) total revenue = area under price line (p1 = 19), between Q = 0 and Q1 = 4 , and this = p1Q1 = 76 iii) So PS = p1Q1 – 331/3 =
76 – 331/3 = 422/3
dQ)Q(SQP)Q(PSQ
∫−=1
011
28
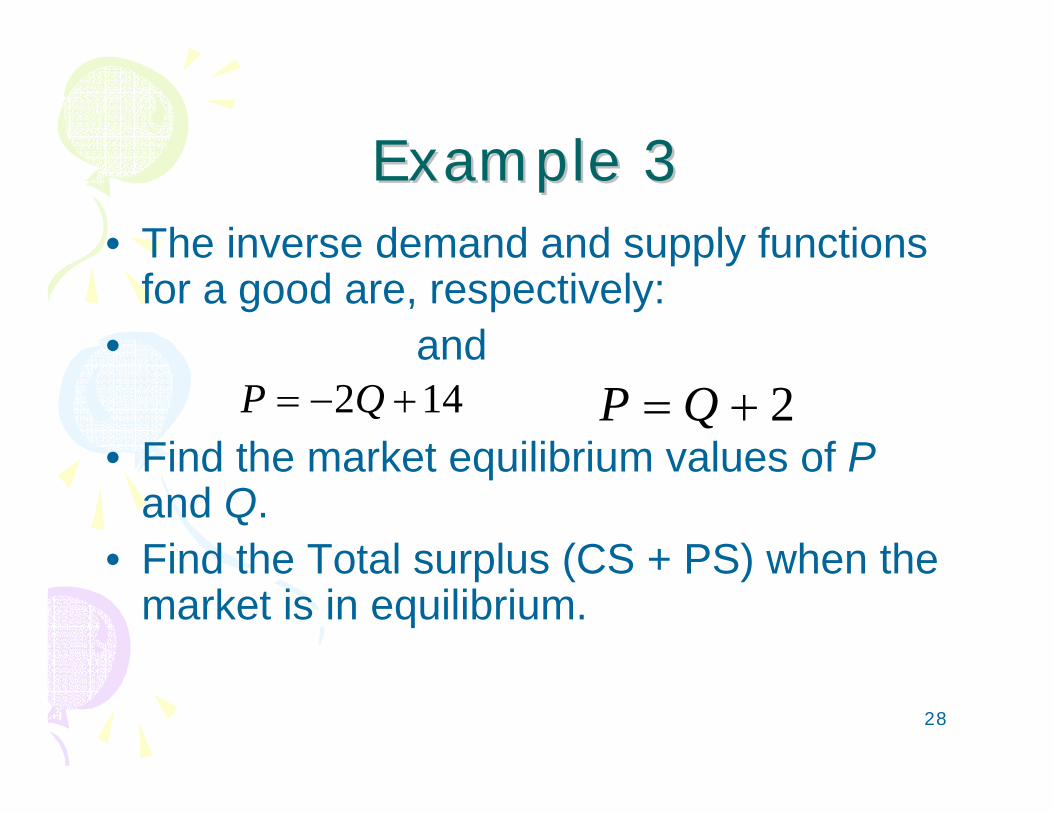
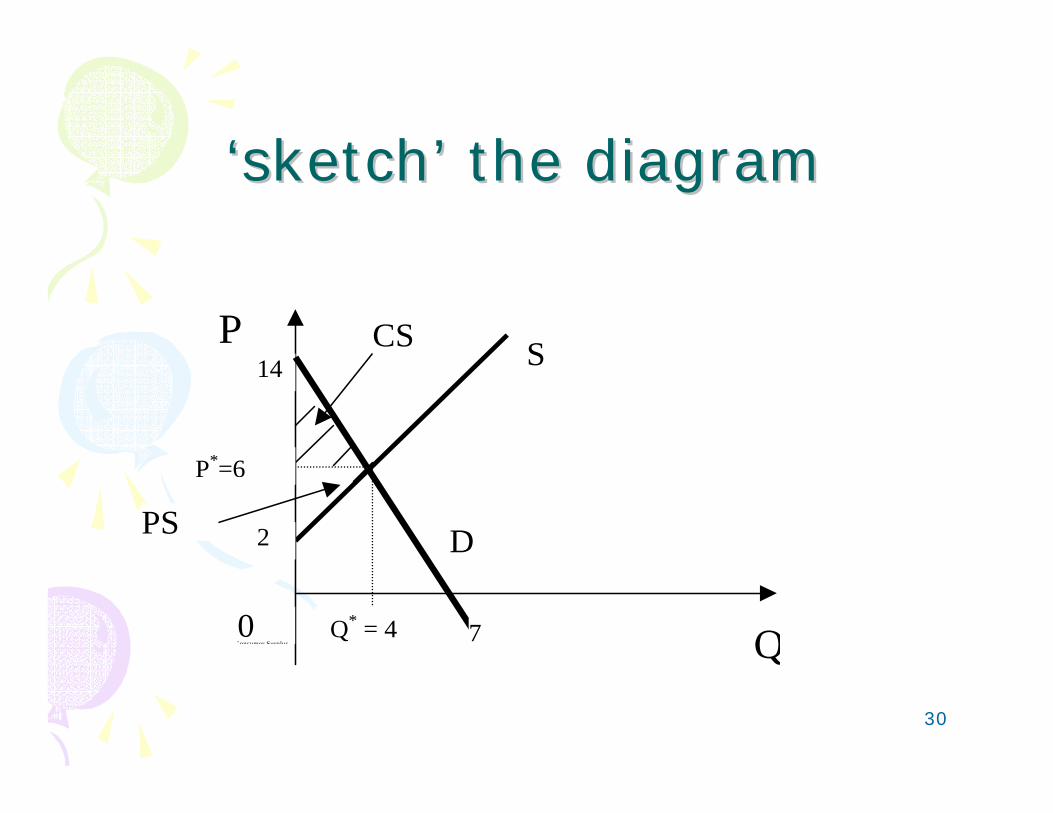
Example 3Example 3• The inverse demand and supply functions
for a good are, respectively:• and
• Find the market equilibrium values of Pand Q.
• Find the Total surplus (CS + PS) when the market is in equilibrium.
142 +−= QP 2+= QP
29
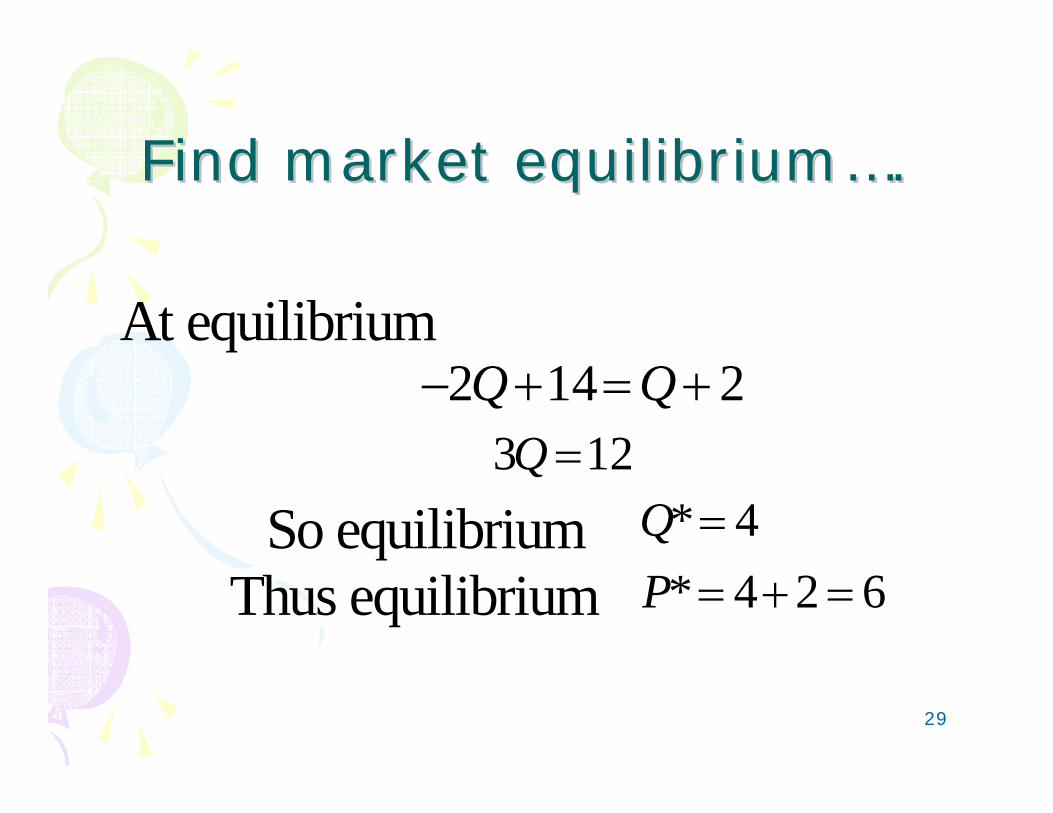
Find market equilibrium….Find market equilibrium….
At equilibrium 2142 +=+− QQ 123 =Q So equilibrium 4*=Q Thus equilibrium 624* =+=P
30
‘‘sketch’ the diagramsketch’ the diagram
QQ* = 4
P
P*=6
0Consumer Surplus
14 CS
7
PS D
S
2
31
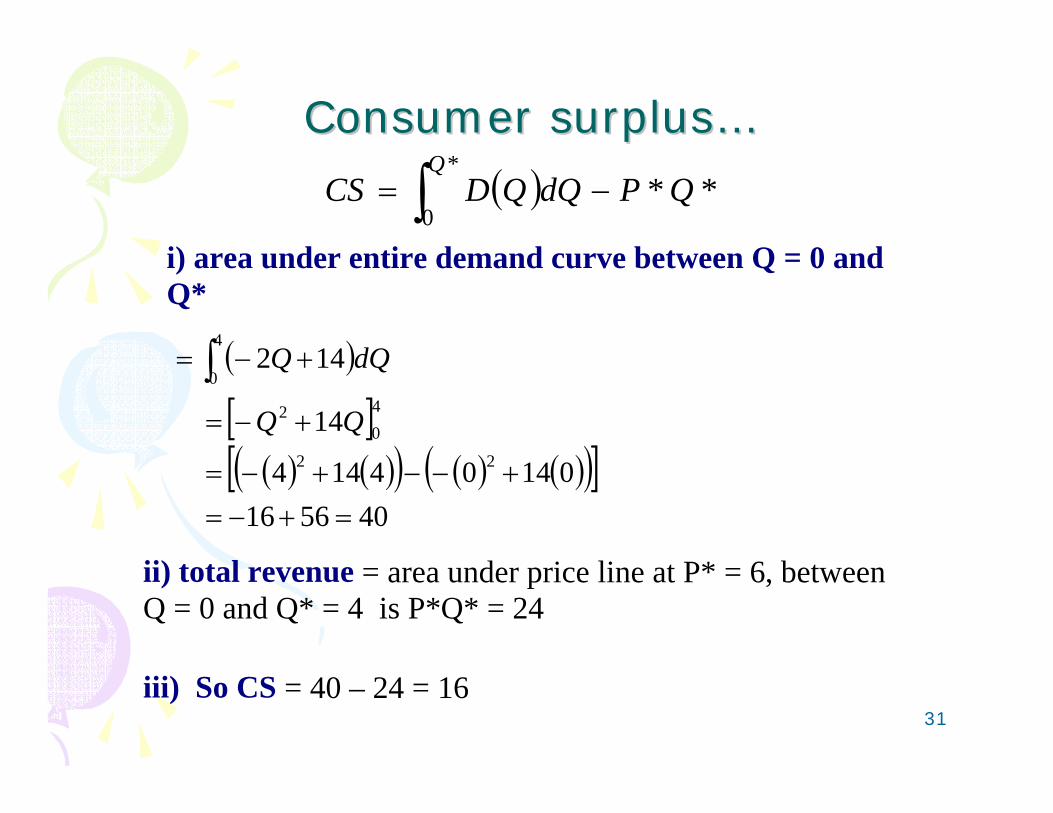
Consumer surplus…Consumer surplus…( ) **
*
0QPdQQDCS
Q−= ∫
i) area under entire demand curve between Q = 0 and Q*
( )
[ ]( ) ( )( ) ( ) ( )( )[ ]
40561601404144
14
142
22
40
2
4
0
=+−=+−−+−=
+−=
dQQ
ii) total revenue = area under price line at P* = 6, between Q = 0 and Q* = 4 is P*Q* = 24
iii) So CS = 40 – 24 = 16
32
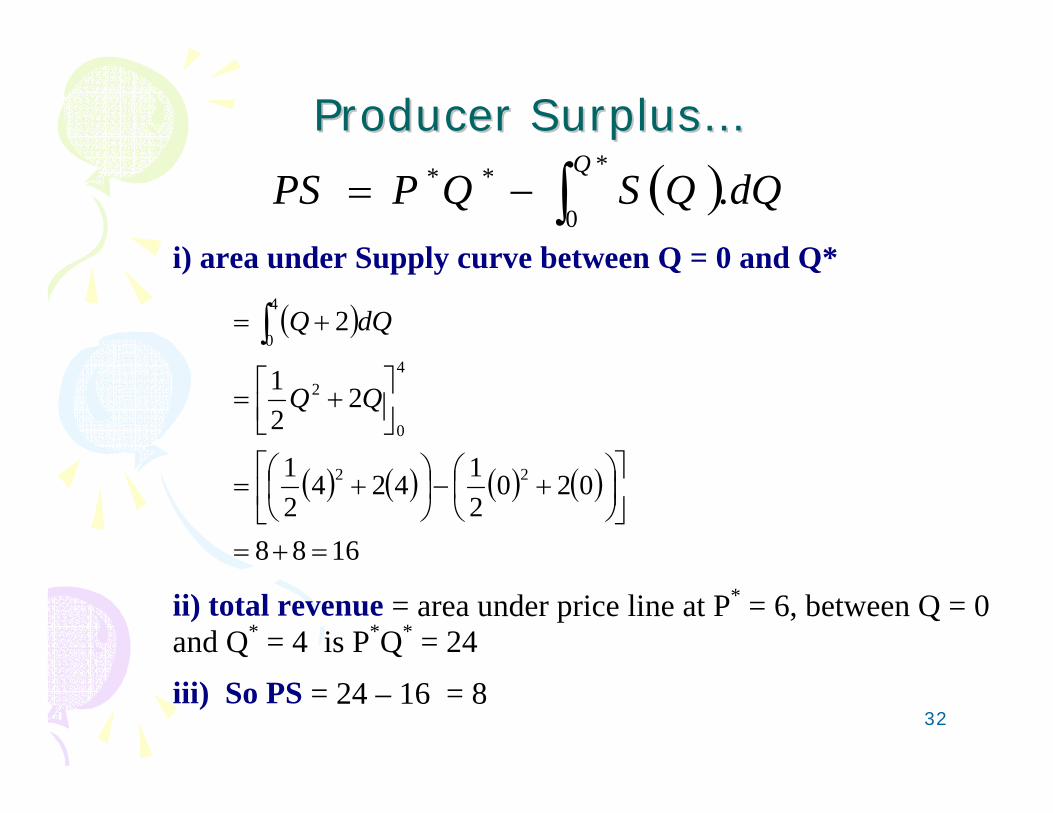
Producer Surplus…Producer Surplus…
( )∫−=*
0
** .Q
dQQSQPPSi) area under Supply curve between Q = 0 and Q*
( )
( ) ( ) ( ) ( )
1688
02021424
21
221
2
22
4
0
2
4
0
=+=
⎥⎦
⎤⎢⎣
⎡⎟⎠⎞
⎜⎝⎛ +−⎟
⎠⎞
⎜⎝⎛ +=
⎥⎦⎤
⎢⎣⎡ +=
+= ∫
dQQ
ii) total revenue = area under price line at P* = 6, between Q = 0 and Q* = 4 is P*Q* = 24
iii) So PS = 24 – 16 = 8
33
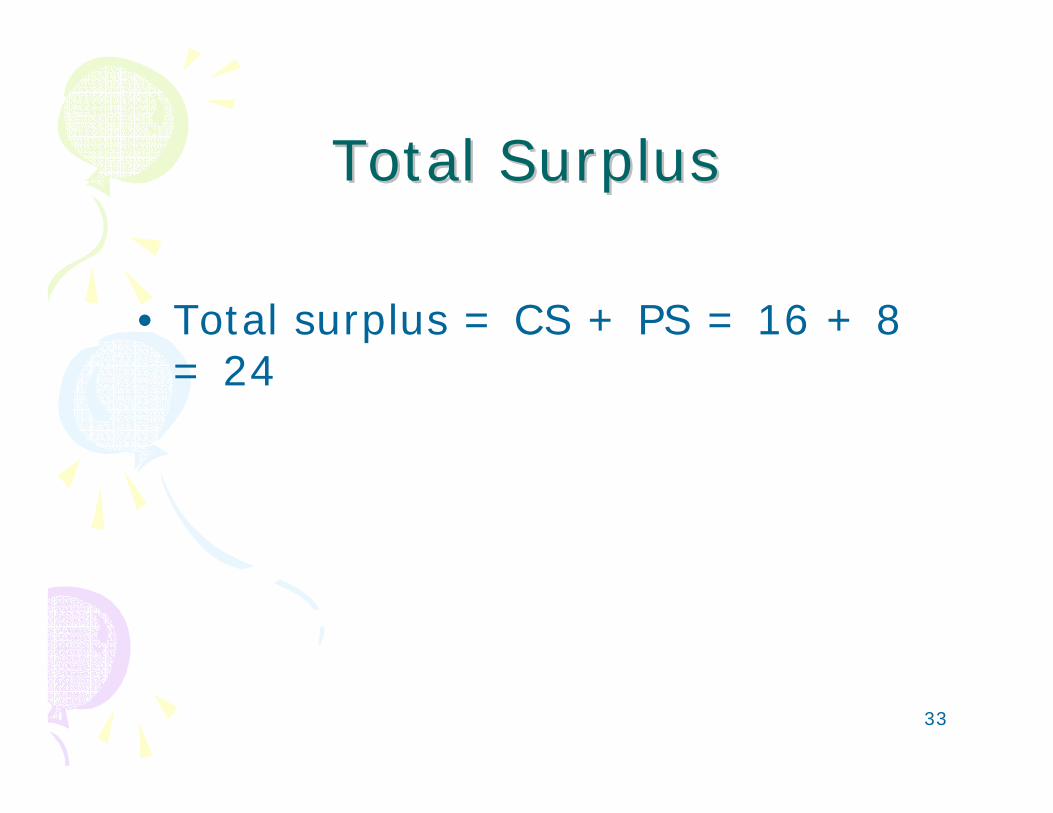
Total SurplusTotal Surplus
• Total surplus = CS + PS = 16 + 8 = 24