topic 2 - ess answers - msmccrindle.weebly.com · no it is not in contradiction with the first law...
TRANSCRIPT

1
W I T H I N T O P I C Q U E S T I O N S
© Oxford University Press 2014: this may be reproduced for class use solely for the purchaser’s institute
Topic 2 - ESS answers Page 62
1. Type of Interaction
Description Species A Species B Example
Competition Neither species benefits, both species suffer - -
Species A: Lion
Species B: HyenaPredation One species kills the other
species for food + -Species A: Lion
Species B: Zebra Parasitism The parasite benefits at the
cost of the host + -Species A: Tapeworm
Species B: HumanMutualism Both species benefit
+ +Species A: Clownfish
Species B: Sea anemone
2. Animals – food, air, water, shelter Plants – air, water, light, nutrients
3. Intraspecific competition is
● Between members of the same species.
● When the numbers of a population are small, there is little real competition between individuals for resources.
● Provided the numbers are not too small for individuals to find mates, population growth will be high.
Interspecific competition:
● Between individuals of different species
● Could be competing for the same resource.
● May result in a balance, in which both species share the resource. OR one species may totally out-compete the other: this is the principle of competitive exclusion.
4. As the population grows, so does the competition between individuals for the resources until eventually the carrying capacity of the ecosystem is reached. In this situation, often the stronger individuals claim the larger share of the resources. Intraspecific competition tends to stabilize population numbers and produces a sigmoid growth curve which is S-shaped. Some species deal with intraspecific competition by being territorial, eg deer. An individual or pair holds an area and fends off rivals. Individuals that are the most successful reproductively will hold the biggest territory and hence have access to more resources, and will be more successful at breeding.
5. Competition can increase or decrease species diversity.
Decrease in diversity: If one species outcompetes another species the species diversity is decreased. As in an untended garden – weeds increase and may co-exist but the original domestic plants are excluded.
Increase in diversity: Competition may force one group of organisms to evolve into a different species – as with Darwin’s Finches on the Galapagos Islands.
6. ● Higher diversity means greater stability for an ecosystem. For instance - if one species dies out there are other food sources.
● Diversity boosts productivity - more species means more primary productivity = greater secondary productivity.
● The higher the diversity, the higher the resilience – greater ability to withstand and recover from disasters.

2
W I T H I N T O P I C Q U E S T I O N S
© Oxford University Press 2014: this may be reproduced for class use solely for the purchaser’s institute
Page 66
photosynthesis
6CO2 + 6H2O + energy energy in
C6H12O6 + 6O2
aerobic respiration
C6H12O6 + 6O2 energy out
6CO2 + 6H2O + energy
Page 69
Food chain Food webShows a single straight pathway Displays all feeding relationships and thus the
interconnected nature of ecosystems Organisms can only be shown at one trophic level Can show organisms occupying different trophic levelsNot always practical as organisms rarely have only one food source
Integrates numerous food chains
Page 70
1.
lemming
arctic fox
wolves
snowy owl
insects
kodiak bear
polar bear
bat shrews�sh
otters
caribou
�oweringplants
grasses sedges willows lichen
2. Lemming numbers fall in the coldest time, they do not decompose due to the temperature. Owl chicks are born and the frozen lemming bodies provide food for snowy owl chicks so numbers increase.
Page 71
1. 6: vegetation – herbivorous insects – carnivorous insects – spiders – toads and lizards – foxes What is the longest food chain in this food web?
2. Spiders; toads and lizards.
3. a) Vole numbers will increase as there is one less predator to eat them.
b) Short-eared owl numbers may increase as there are more voles for the stoats so more stoats = more short-eared owls.
4. a) Numbers of rabbit predators increase due to a greater supply of food.
b) The vegetation decreases as there are more rabbits eating it.
5. The impact would probably be limited because toads and lizards have a variety of other sources of food so their numbers would not be affected much. Also foxes have a number of different sources of food. This is a good illustration of why complex ecosystems are more stable.

3
W I T H I N T O P I C Q U E S T I O N S
© Oxford University Press 2014: this may be reproduced for class use solely for the purchaser’s institute
Page 74
top consumers
secondary consumers
primary consumers
primary producers
Number pyramid
100,000
10,000
2,000
500
Biomass pyramid/kJm–2
2,500
200
15
1
Productivity pyramid/000 kJm–2yr–1
500
50
5
Comments (these are examples – other comments will be relevant):
● All are pyramid shape with longer bars at the bottom – due to energy loss in higher trophic levels.
● Numbers of primary producers – huge as probably very small plants/plankton.
● Top consumers are rare as so much energy is lost.
Page 75
1. Four: plankton – small fish – large fish – top carnivores.
2. Nearly 53,000. This is because the minnow eats the phytoplankton that has a chemical in its tissues – the amount of the chemical that is taken in by the minnow is greater than that in the phytoplankton that is eaten because the minnow eats many phytoplankton over time. If pickerel eats the minnow, it too will take in more of the chemical than each minnow contained as it eats several minnows over time. In this way the chemical’s concentration is magnified from trophic level to trophic level. While the concentration of the chemical may not affect organisms lower in the food chain, the top trophic levels may take in so much of the chemical that it causes disease or their death.
3. Plankton
4. All other species in the food chain.
Page 76
a), b) birds
spiders and carnivorous insects
herbivores
oak tree
(a) (b)
1
10,000
500
3
4,000
5,00
100
30
c) The pyramid of numbers is not pyramid shaped because the organisms are counted and size is not considered – so a single tree supports many herbivores but is still only one organism.
In the pyramid of biomass the quantity of organic material at each trophic level is estimated so the size of a large single organism such as a tree is reflected in the amount of biomass.
2. No it is not in contradiction with the first law of thermodynamics because energy is not actually lost it is simply converted into movement, heat, waste products etc. This means it will not be available to the next trophic level so is lost from the food chain.
3. Trophic level 1 = 90,000 kJ m−2 yr−1
10% of the energy goes to the herbivores: that is, 90000 _ 100
× 10 = 9000
Trophic level 2 = 9,000 kJ m−2 yr−1
5% of the energy passes to the carnivores: that is, 9000 _ 100
× 5 = 450
Trophic level 3 = 450 kJ m−2 yr−1
20% of the energy passes to the top carnivore: that is, 450 _ 100
× 20 = 90
Trophic level 4 = 90 kJ m−2 yr−1 : that is, only 0.1% of the initial NPP

4
W I T H I N T O P I C Q U E S T I O N S
© Oxford University Press 2014: this may be reproduced for class use solely for the purchaser’s institute
Page 78
List
Plants AnimalsAzolla golden snailblue green algae insect pestsweeds ducksrice roach (fish)plankton daphnia
worms
ducks
man
cattle
roach(�sh) feces
daphnia
warms
goldensnail
insects
riceplankton
waste grain
Azolla+
bluegreen algae
To do: page 87
Example of one below:
CO2 in atmosphere
consumers
organic matter
fossilization
deat
h an
d de
com
post
ion
photosynthesis
feeding
respiration
respiration
respiration
com
bust
ion
carbon in organic componds in producers
fossils andsediments

5
W I T H I N T O P I C Q U E S T I O N S
© Oxford University Press 2014: this may be reproduced for class use solely for the purchaser’s institute
Page 90
Copy and complete:
Nitrogen fixation is: a process in which atmospheric nitrogen is converted to ammonium ions.
Nitrification is: a process in which ammonium ions are converted to nitrites and then nitrates which can be taken up by organisms.
Denitrification is: a process in which nitrates are reduced to nitrogen gas, mostly by anaerobic bacteria.
Assimilation (or protein formation) is: a process of absorption of nutrients after digestion and their transformation into plant or animal tissues.
The diagram below shows the flow of energy through a food web, and should be used for the three questions (right).
Exam style questions: page 91
1. A2. A3. C
feeding
decay bybacteria
excretion
decomposition
assimilation
assimilation
nitrogen�xation
death
nitrogen inanimal proteins
Nitrogen gas (N2) in air
egestion
ammonium ions and nitrates in soil
nitri�cation
nitrogen inplant proteins
�xation bylightning �xation by bacteria in
root nodules of leguminousplants
�xation by theHaber process
conversion of nitratesto nitrogen bydenitrifying bacteria
absorption byplant roots denitri�cation

6
W I T H I N T O P I C Q U E S T I O N S
© Oxford University Press 2014: this may be reproduced for class use solely for the purchaser’s institute
Page 93
1. a) Meat/muscle is much easier to digest than vegetation and has high energy content.
b) Ruminants would be at the top of the range because they have a four-compartment stomach. A specialized stomach ferments the food prior to digestion. The vegetation is chewed and swallowed (cud) several times before passing in to the proper stomach to release the nutrients. Chewing the cud will further breakdown the plant matter to aid digestion. This process means more of the energy in grass is converted into animal tissue and less is lost a waste.
c) Bamboo shoots are very low in nutritional value and very fibrous so hard to break down both physically (through chewing) and chemically (through digestion).
Units are KJ m-2y-1
respiration – unknown but allow calculation of incoming energy minus living plants + dead material + roots respiration 1794
4659
DOM (dead organic matter)
6053
dung132
1940 + 326301storage3960
solar energy21158
Page 94
1. Because energy is lost from the system in the form of heat so it is no longer available to the next trophic level. Entropy in the system increases (second law of thermodynamics).
2. Too much energy has been lost in preceding trophic levels so there is not enough left for any more levels.
3. As chemical energy in the form of plant material and then animal tissue.
4. It is reflected or not absorbed by the chloroplasts or passes through the leaf.
5. Respiration of plants – all living things respire all the time to stay alive.
6. NPP = GPP - R
8833 = 20810 - 11977
GPP = 20810
Respiratory losses = 11977
NPP = 8833
7. top carnivore
carnivore
herbivore
plant 8833
1478
67
kcal m−2 yr−1
6

7
W I T H I N T O P I C Q U E S T I O N S
© Oxford University Press 2014: this may be reproduced for class use solely for the purchaser’s institute
8. No because it just gives the productivity.
9. Inputs = outputs therefore energy is neither created nor destroyed.
INPUTS OUTPUTSInsolation 1700000 1290000 Light not absorbed by plants: Import 486 389190 Not named
18796 Community respiration2500 Downstream export
TOTALS 1700486 1700486
10. Energy starts as high-quality, low-entropy light entering the system. It is converted into chemical energy via photosynthesis (the carbon bonds in glucose). Then it is converted by respiration into low-quality, high-entropy heat energy.
Page 95
1. ● Humans farm the natural environment
● And we live in it
Also allow responses such as: more humans, more impact due to technology – larger machines
2. ● Simplifying ecosystems and making them less diverse
● Deforestation
● Use of more and more fossil fuels
Also allow: soil erosion/overgrazing/energy removed in form of crops so ecosystems degraded
Pages 96–97
a) NP is the gain in biomass in g C m−2 yr−1 (per unit area per unit time) that remains after deductions due to respiration.
Gross productivity of phytoplankton − Respiratory loss by phytoplankton
132 - 35 = 97 g C m−2 yr−1
b) GSP (gross secondary productivity) is the total biomass in g C m-2 yr−1 (per unit area per unit time) assimilated (taken up) by consumers and is calculated by subtracting the mass of fecal loss from the mass of food eaten.
GSP = food eaten - fecal loss
31 - 6 = 25 g C m−2 yr−1
c) Total gain in biomass in g C m−2 yr−1 (per unit area per unit time) after losses of respiration.
So NSP (net secondary productivity of zooplankton) is
GSP - respiration
25 - 12 = 13 g C m−2 yr−1
d) Zooplankton eat 31 g C m−2 yr−1 phytoplankton to produce 13 g C m−2 yr−1 more zooplankton.
13 _ 31
× 100 = 41.9%
e) 97 _ 132
× 100 = 73.5%.

8© Oxford University Press 2014: this may be reproduced for class use solely for the purchaser’s institute
Here are two more energy flow diagrams
a)
decomposers
energy inputE1
E2
D1B5
D2
D3
D4
E3
E4
R4
R3
R2
R1
biomass of the various trophic levelsarea of box is proportional to biomass
heat lossR5
respiratoryloss
etc.
dead remains
dead remains
feces etc.
B1 etc
energy �ow through grazing chainE1 etc
energy �ow to decomposersD1 etc
respiratory loss to abiotic environmentR1 etc
producers B1
Sun
key to symbols
tertiary B4 consumers
secondary B3 consumers
primary B2 consumers
b) ● The second law of thermodynamics comes into play and the energy entering the systems becomes more and more degraded (entropy increases) and is lost from the food chain as heat.
● Some energy is stored as chemical energy in the organisms but much is changed and lost as heat through respiration/to environment.
● Efficiency of photosynthesis/conversion of solar to chemical energy is less than 100%/(often) only 10% is passed on/90% is lost before next trophic level.
c) Fungi, bacteria, worms are decomposers that lose heat through respiration and movement.
d) For ecosystem II, identify from the diagram the letter(s) referring to the following energy flow processes and explain what happens to this energy at each stage as it passes through the ecosphere:
(i) Process A: incoming solar radiation is:
● used to heat the atmosphere (absorption)
● used to make ozone
● reflected/scattered by clouds and gases in the atmosphere
● absorbed by bare soil/buildings/roads.
(ii) B: Photosynthesis: Primary producers take solar energy (light) and use it to make chemical energy
Light energy
Water + carbon dioxide → glucose + oxygen
(iii) D: Fecal loss
As animals defecate and the chemical energy is lost form the main food chain but passes into the decomposer food chain.
(iv) B: photosynthesis
E: Absorbed
G,H: food consumed
As energy passes through the food chain it is absorbed by the organisms and converted into animal body parts.
W I T H I N T O P I C Q U E S T I O N S
9© Oxford University Press 2014: this may be reproduced for class use solely for the purchaser’s institute
(v) B,E,G,H: Photosynthesis and Food consumed. Once the plants (primary producers) have converted light energy into chemical energy it is passed along the food chain and used by the animals for life process. Movement generates heat for heat is lost to the atmosphere.
(vi) F: respiration
Respiration converts chemical energy into heat energy which is used by the organisms for life processes and eventually lost to the atmosphere.
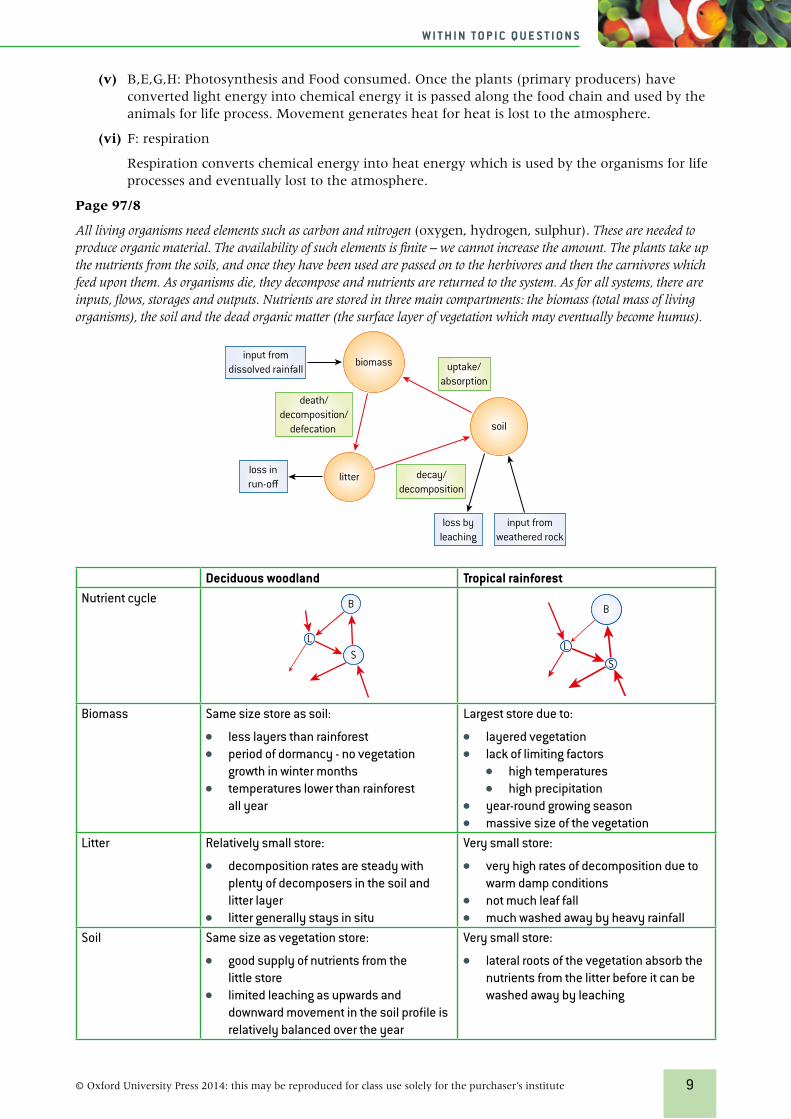
Page 97/8
All living organisms need elements such as carbon and nitrogen (oxygen, hydrogen, sulphur). These are needed to produce organic material. The availability of such elements is finite – we cannot increase the amount. The plants take up the nutrients from the soils, and once they have been used are passed on to the herbivores and then the carnivores which feed upon them. As organisms die, they decompose and nutrients are returned to the system. As for all systems, there are inputs, flows, storages and outputs. Nutrients are stored in three main compartments: the biomass (total mass of living organisms), the soil and the dead organic matter (the surface layer of vegetation which may eventually become humus).
input fromweathered rock
loss byleaching
loss inrun-o�
biomass uptake/absorption
decay/decomposition
death/decomposition/
defecation
litter
soil
input fromdissolved rainfall
Deciduous woodland Tropical rainforestNutrient cycle
S
B
L
B
L
S
Biomass Same size store as soil:
● less layers than rainforest ● period of dormancy - no vegetation
growth in winter months ● temperatures lower than rainforest
all year
Largest store due to:
● layered vegetation ● lack of limiting factors
● high temperatures ● high precipitation
● year-round growing season ● massive size of the vegetation
Litter Relatively small store:
● decomposition rates are steady with plenty of decomposers in the soil and litter layer
● litter generally stays in situ
Very small store:
● very high rates of decomposition due to warm damp conditions
● not much leaf fall ● much washed away by heavy rainfall
Soil Same size as vegetation store:
● good supply of nutrients from the little store
● limited leaching as upwards and downward movement in the soil profile is relatively balanced over the year
Very small store:
● lateral roots of the vegetation absorb the nutrients from the litter before it can be washed away by leaching
W I T H I N T O P I C Q U E S T I O N S

10© Oxford University Press 2014: this may be reproduced for class use solely for the purchaser’s institute
Grassland ecosystem
1. ● Soil is not eroded or washed away and builds up over time.
● Litter is not removed or decomposed rapidly so also accumulates.
● Biomass could be removed (cropped) to keep it at a lower level.
2. Uptake by biomass (plants) with minimal loss through leaching due to e.g. fast growing plants/crops planted.
3. A transfer (see p239 of course companion).
Biological mixing, translocation (movement of soil particles in suspension).
Leaching (minerals dissolved in water moved through soil).
4. a = Tropical rainforest
b = Continental grassland
5. Comparison Ecosystem ExplanationWhich ecosystem stores most nutrients in biomass?
A ● This is a forest ecosystem so the vegetation is large and layered
● Lack of limiting factors ● High temperatures ● High precipitation
● Year-round growing season ● Forest ecosystem – some large trees and
high biodiversity Which ecosystem has most undecomposed detritus?
B Cooler conditions than in the rainforest – takes longer for the DOM (dead organic matter) to decompose
Which ecosystem has least humus? A DOM decomposes very rapidly and is not left as humusIn which ecosystem is plant uptake of nutrients greater?
A Large vegetation with lateral roots captures most of the nutrients as they enter the soil
In which ecosystem is decomposition slower?
B Cooler climate slows chemical reactions and thus decomposition is slower
Which ecosystem loses nutrients from biomass quickest?
B Continental grasslands have a dormant season when all the vegetation dies back so nutrients go quickly to the litter store
In which ecosystem are most nutrients lost due to heavy rain?
A Rainforest has very heavy rainfall and high humidity so the dominant direction of water movement through the soil is downwards – leaching the nutrients out of the soil
In which ecosystem does rainfall supply many nutrients
A Rainforest has very heavy rainfall which delivers many nutrients
W I T H I N T O P I C Q U E S T I O N S
11© Oxford University Press 2014: this may be reproduced for class use solely for the purchaser’s institute
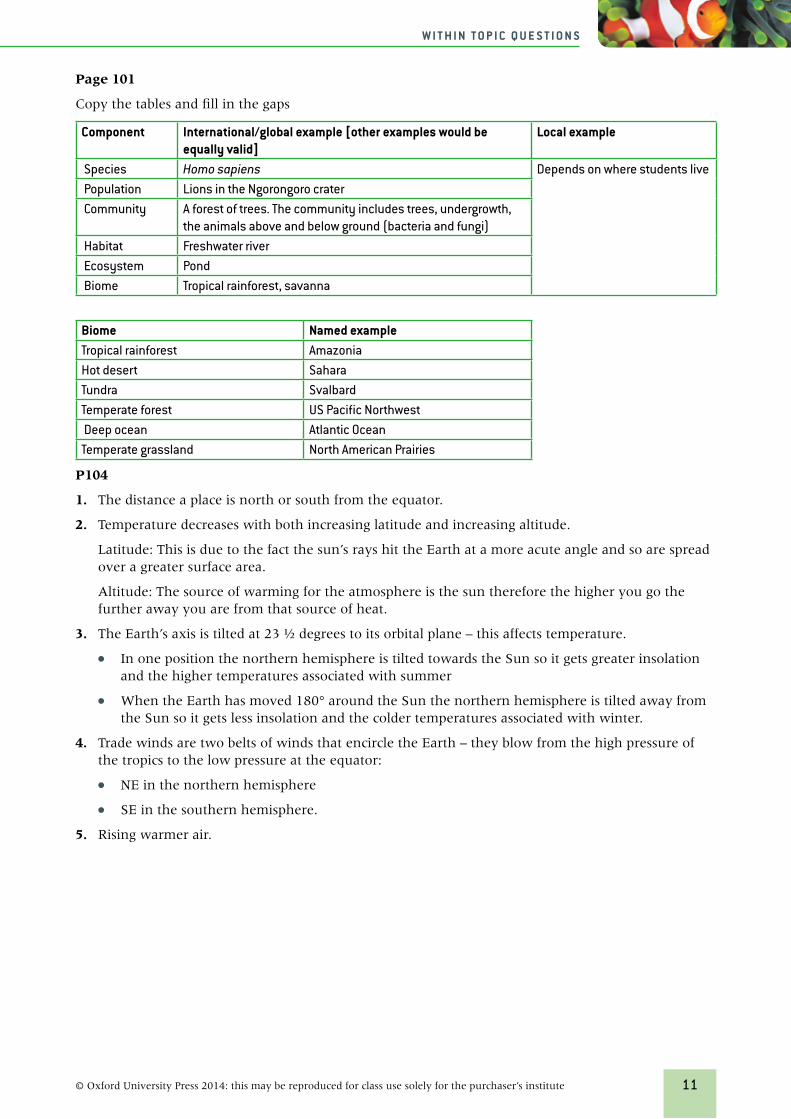
Page 101
Copy the tables and fill in the gaps
Component International/global example [other examples would be equally valid]
Local example
Species Homo sapiens Depends on where students live Population Lions in the Ngorongoro crater Community A forest of trees. The community includes trees, undergrowth,
the animals above and below ground (bacteria and fungi) Habitat Freshwater river Ecosystem Pond Biome Tropical rainforest, savanna
Biome Named exampleTropical rainforest AmazoniaHot desert SaharaTundra SvalbardTemperate forest US Pacific Northwest Deep ocean Atlantic OceanTemperate grassland North American Prairies
P104
1. The distance a place is north or south from the equator.
2. Temperature decreases with both increasing latitude and increasing altitude.
Latitude: This is due to the fact the sun’s rays hit the Earth at a more acute angle and so are spread over a greater surface area.
Altitude: The source of warming for the atmosphere is the sun therefore the higher you go the further away you are from that source of heat.
3. The Earth’s axis is tilted at 23 ½ degrees to its orbital plane – this affects temperature.
● In one position the northern hemisphere is tilted towards the Sun so it gets greater insolation and the higher temperatures associated with summer
● When the Earth has moved 180° around the Sun the northern hemisphere is tilted away from the Sun so it gets less insolation and the colder temperatures associated with winter.
4. Trade winds are two belts of winds that encircle the Earth – they blow from the high pressure of the tropics to the low pressure at the equator:
● NE in the northern hemisphere
● SE in the southern hemisphere.
5. Rising warmer air.
W I T H I N T O P I C Q U E S T I O N S

12© Oxford University Press 2014: this may be reproduced for class use solely for the purchaser’s institute
To Review: Page 114
1. Any plant that sheds its leaves at the end of the growing season; mostly it refers to trees.
2. The total gain in energy or biomass per unit area per unit time by green plants after allowing for losses to respiration. This is:
● the increase in biomass of the plant (how much it grows)
● the biomass that is potentially available to consumers (animals) that eat the plant.
NPP = GPP - R where R = respiratory loss
3. Tropical rainforest:
● Estimated to produce 40% of NPP of terrestrial ecosystems.
● Growing season all year round, fast rate of decomposition and respiration and photosynthesis.
● Plants grow faster - respiration is also high and for a large mature tree in the rainforest, all the glucose made in photosynthesis is used in respiration so there is no net gain. However, when rainforest plants are immature, their growth rates are huge and biomass gain very high.
● Rapid recycling of nutrients.
4. Oceans – they cover 70+% of the earth and have a very wide range of habitats, deep ocean trenches, coral reefs, shallow coastal waters.
5. Both primary (plants) and secondary (animals) productivity is low because water is limiting and plant biomass cannot build up to large amounts.
Limited habitats due to limited plant biomass therefore fewer animals and lower biodiversity Food chains tend to be short because of this.
Usually evaporation exceeds precipitation - E>P.
6. There are no major landmasses at the correct latitude for deciduous forests or tundra.
7. ● The harsh winter season is too dry and cold for vegetation growth so they go into a state of dormancy.
● Shedding leaves conserves water and energy.
● The nutrients in the leaves are re-absorbed ready for winter then the leaves are shed.
8. Tropical rainforests:
● depending on the source you use, figures are usually around 750 species per hectare
● located within 5–10° north and south of the equator.
Temperate rainforests:
● far fewer species, around 10–20 per hectare
● located along the NW coast of North America, Southern Chile, New Zealand and Australia – where warm offshore currents affect the climate.
9. Latitude, ocean currents and winds, P/E ratio, climate, slope aspect.
10. Tropical rainforest.
The problem is that more than 50% of the world’s human population lives in the tropics and subtropics, and one in eight of us live in or near a tropical rainforest. With fewer humans, the forest could provide enough resources for the population but there are now too many exploiting the forest and it does not have time to recover. This is not sustainable. In addition, commercial logging of valuable timber, eg mahogany, and clear felling to convert the land to grazing cattle all destroy the forest.
11. Temperate grassland/woodland: this area has been taken over for human agricultural production.
W I T H I N T O P I C Q U E S T I O N S

13© Oxford University Press 2014: this may be reproduced for class use solely for the purchaser’s institute
12. With increase in mean global temperature and changes in precipitation, there is evidence that biomes are moving. These changes are happening very fast, within decades, and organisms change slowly, over many generations through evolutionary adaptation. All they can do to adapt to fast change is to move and that is what they are doing.
These moves are:
● towards the poles where it is cooler
● higher up mountains where it is cooler – 500 m of altitude decreases temperature about 3°C
● towards the equator where it is wetter.
Examples of biomes shifting are:
● in Africa in the Sahel region, woodlands are becoming savannas
● in the Arctic, tundra is becoming shrubland.
P117
GPP: Total gain in energy or biomass per unit area per unit time by green plants. It is the energy fixed (or converted from light to chemical energy) by green plants by photosynthesis. But, some of this is used in respiration so...
NPP: Total gain in energy or biomass per unit area per unit time by green plants after allowing for losses to respiration. This is the increase in biomass of the plant – how much it grows – and is the biomass that is potentially available to consumers (animals) that eat the plant.
NPP = GPP − R where R = respiratory loss
Respiration: Respiration involves breaking down food, often in the form of glucose, to release energy which is used in living processes:
Glucose + oxygen Energy + water + carbon dioxide
Species: Aa group of organisms (living things) sharing common characteristics that interbreed and produce fertile offspring.
Biodiversity: The variety of all life on Earth.
Page 123
GPP
NPP
respiration
early stages middle stagestime
late stages
W I T H I N T O P I C Q U E S T I O N S

14© Oxford University Press 2014: this may be reproduced for class use solely for the purchaser’s institute
Page 124
Look at the diagram of a theoretical survival model of a small bird population.
Figure 2.4.32 A theoretical survival model of a small bird population
1. 4 years
2. 200
3. 100
4. 50%
5. 75%
6. 87.5%
7. Leaning towards r-strategists.
also p124
1. Rats, invertebrates, fish.
2. Short lifespan
High death rate at an early age
Fast growth rate
3. r-strategists
4. ● Has a very gentle slope for the majority of the curve – showing high survival rates/low death rates in the early years.
● Steep slope later in the graph showing that the majority of the organisms survive into old age and then die.
Quick review questions
1 D2 A3 B4 C5 C
W I T H I N T O P I C Q U E S T I O N S