topic 4 economic ef˜ciency and equity as contemporary ... · pdf fileeconomic...
TRANSCRIPT
c04EconomicEf�ciencyAndEquityAsContemporaryEconomicIssues 169 4 October 2016 1:18 PM
Economic ef�ciency and equity as contemporary economic issues
TOPIC 4
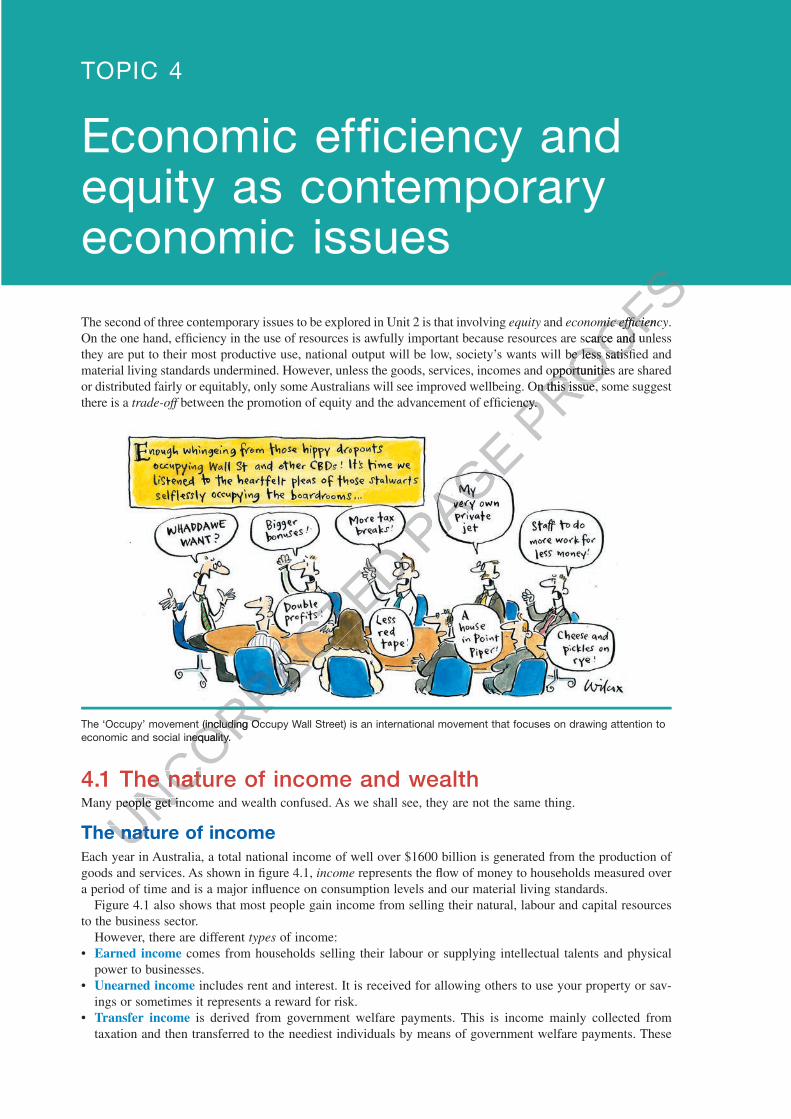
The second of three contemporary issues to be explored in Unit 2 is that involving equity and economic ef�ciency. On the one hand, ef�ciency in the use of resources is awfully important because resources are scarce and unless they are put to their most productive use, national output will be low, society’s wants will be less satis�ed and material living standards undermined. However, unless the goods, services, incomes and opportunities are shared or distributed fairly or equitably, only some Australians will see improved wellbeing. On this issue, some suggest there is a trade-off between the promotion of equity and the advancement of ef�ciency.
The ‘Occupy’ movement (including Occupy Wall Street) is an international movement that focuses on drawing attention to economic and social inequality.
4.1 The nature of income and wealthMany people get income and wealth confused. As we shall see, they are not the same thing.
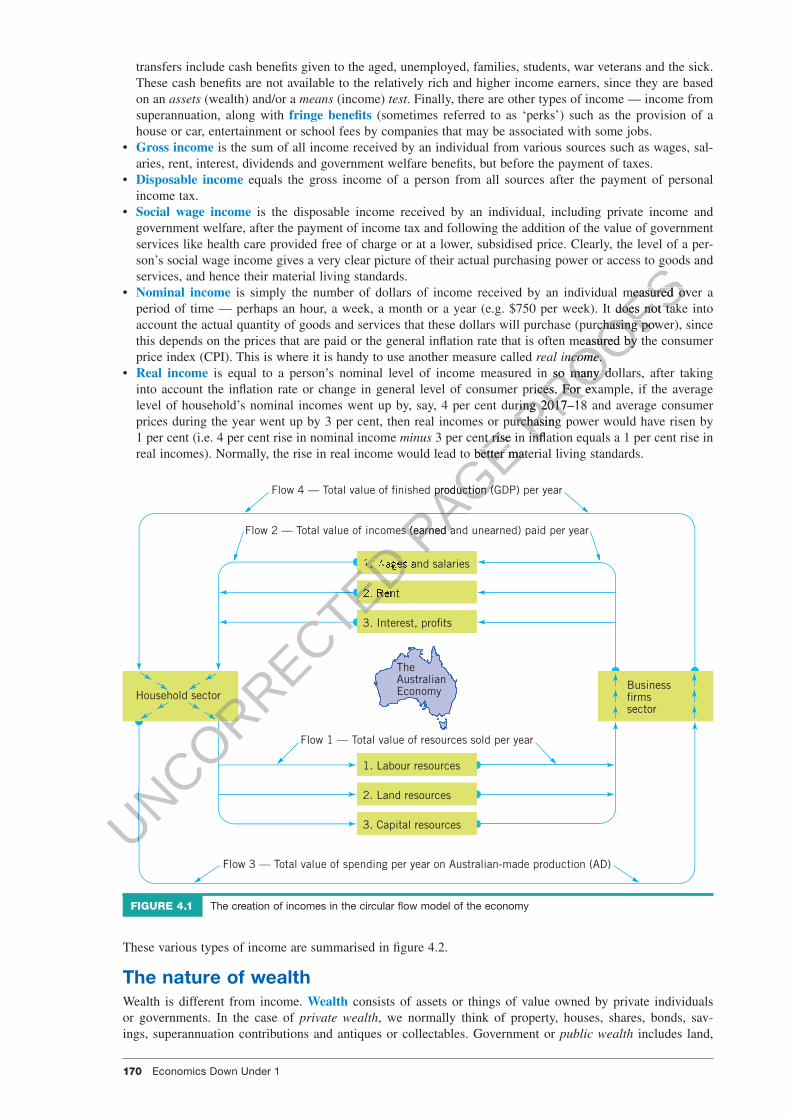
The nature of incomeEach year in Australia, a total national income of well over $1600 billion is generated from the production of goods and services. As shown in �gure 4.1, income represents the �ow of money to households measured over a period of time and is a major in�uence on consumption levels and our material living standards.
Figure 4.1 also shows that most people gain income from selling their natural, labour and capital resources to the business sector.
However, there are different types of income: • Earned income comes from households selling their labour or supplying intellectual talents and physical
power to businesses. • Unearned income includes rent and interest. It is received for allowing others to use your property or sav-
ings or sometimes it represents a reward for risk. • Transfer income is derived from government welfare payments. This is income mainly collected from
taxation and then transferred to the neediest individuals by means of government welfare payments. These
UNCORRECTED
UNCORRECTED
UNCORRECTED
The ‘Occupy’ movement (including Occupy Wall Street) is an international movement that focuses on drawing attention to
UNCORRECTED
The ‘Occupy’ movement (including Occupy Wall Street) is an international movement that focuses on drawing attention to economic and social inequality.
UNCORRECTED
economic and social inequality.
UNCORRECTED
4.1 The nature of income and wealth
UNCORRECTED
4.1 The nature of income and wealthMany people get income and wealth confused. As we shall see, they are not the same thing.
UNCORRECTED
Many people get income and wealth confused. As we shall see, they are not the same thing.
UNCORRECTED
The nature of incomeUNCORRECTED
The nature of income
PAGE
PAGE PROOFS
PROOFS economic ef�ciency
PROOFS economic ef�ciency
On the one hand, ef�ciency in the use of resources is awfully important because resources are scarce and unless
PROOFSOn the one hand, ef�ciency in the use of resources is awfully important because resources are scarce and unless they are put to their most productive use, national output will be low, society’s wants will be less satis�ed and
PROOFSthey are put to their most productive use, national output will be low, society’s wants will be less satis�ed and material living standards undermined. However, unless the goods, services, incomes and opportunities are shared
PROOFSmaterial living standards undermined. However, unless the goods, services, incomes and opportunities are shared or distributed fairly or equitably, only some Australians will see improved wellbeing. On this issue, some suggest
PROOFSor distributed fairly or equitably, only some Australians will see improved wellbeing. On this issue, some suggest
between the promotion of equity and the advancement of ef�ciency.
PROOFS
between the promotion of equity and the advancement of ef�ciency.
PROOFS
170 Economics Down Under 1
c04EconomicEf�ciencyAndEquityAsContemporaryEconomicIssues 170 4 October 2016 1:18 PM
transfers include cash bene�ts given to the aged, unemployed, families, students, war veterans and the sick. These cash bene�ts are not available to the relatively rich and higher income earners, since they are based on an assets (wealth) and/or a means (income) test. Finally, there are other types of income — income from superannuation, along with fringe bene�ts (sometimes referred to as ‘perks’) such as the provision of a house or car, entertainment or school fees by companies that may be associated with some jobs.
• Gross income is the sum of all income received by an individual from various sources such as wages, sal-aries, rent, interest, dividends and government welfare bene�ts, but before the payment of taxes.
• Disposable income equals the gross income of a person from all sources after the payment of personal income tax.
• Social wage income is the disposable income received by an individual, including private income and government welfare, after the payment of income tax and following the addition of the value of government services like health care provided free of charge or at a lower, subsidised price. Clearly, the level of a per-son’s social wage income gives a very clear picture of their actual purchasing power or access to goods and services, and hence their material living standards.
• Nominal income is simply the number of dollars of income received by an individual measured over a period of time — perhaps an hour, a week, a month or a year (e.g. $750 per week). It does not take into account the actual quantity of goods and services that these dollars will purchase (purchasing power), since this depends on the prices that are paid or the general in�ation rate that is often measured by the consumer price index (CPI). This is where it is handy to use another measure called real income.
• Real income is equal to a person’s nominal level of income measured in so many dollars, after taking into account the in�ation rate or change in general level of consumer prices. For example, if the average level of household’s nominal incomes went up by, say, 4 per cent during 2017–18 and average consumer prices during the year went up by 3 per cent, then real incomes or purchasing power would have risen by 1 per cent (i.e. 4 per cent rise in nominal income minus 3 per cent rise in in�ation equals a 1 per cent rise in real incomes). Normally, the rise in real income would lead to better material living standards.
TheAustralianEconomy
Flow 3 — Total value of spending per year on Australian-made production (AD)
Flow 1 — Total value of resources sold per year
Flow 2 — Total value of incomes (earned and unearned) paid per year
Flow 4 — Total value of �nished production (GDP) per year
1. Wages and salaries
2. Rent
3. Interest, pro�ts
1. Labour resources
2. Land resources
3. Capital resources
Business�rmssector
Household sector
FIGURE 4.1 The creation of incomes in the circular �ow model of the economy
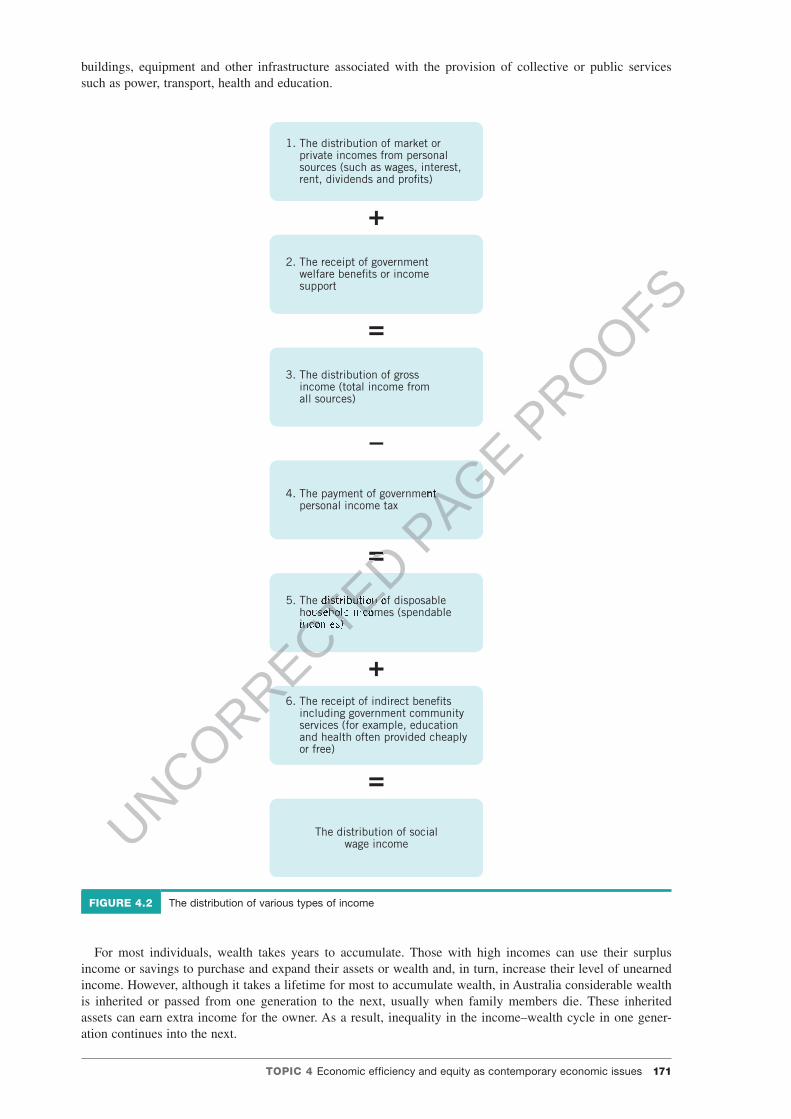
These various types of income are summarised in �gure 4.2.
The nature of wealthWealth is different from income. Wealth consists of assets or things of value owned by private individuals or governments. In the case of private wealth, we normally think of property, houses, shares, bonds, sav-ings, superannuation contributions and antiques or collectables. Government or public wealth includes land,
UNCORRECTED
UNCORRECTED
UNCORRECTED
UNCORRECTED
UNCORRECTED
UNCORRECTED
UNCORRECTED
UNCORRECTED
UNCORRECTED
UNCORRECTED
UNCORRECTED
UNCORRECTED 1. Wages and salaries
UNCORRECTED 1. Wages and salaries
UNCORRECTED 2. Rent
UNCORRECTED 2. Rent
UNCORRECTED
UNCORRECTED
UNCORRECTED PAGE prices during the year went up by 3 per cent, then real incomes or purchasing power would have risen by
PAGE prices during the year went up by 3 per cent, then real incomes or purchasing power would have risen by 3 per cent rise in in�ation equals a 1 per cent rise in
PAGE 3 per cent rise in in�ation equals a 1 per cent rise in real incomes). Normally, the rise in real income would lead to better material living standards.
PAGE real incomes). Normally, the rise in real income would lead to better material living standards.
PAGE
PAGE
PAGE Flow 2 — Total value of incomes (earned and unearned) paid per yearPAGE Flow 2 — Total value of incomes (earned and unearned) paid per year
Flow 4 — Total value of �nished production (GDP) per year
PAGE Flow 4 — Total value of �nished production (GDP) per year
PAGE PROOFS
son’s social wage income gives a very clear picture of their actual purchasing power or access to goods and
PROOFSson’s social wage income gives a very clear picture of their actual purchasing power or access to goods and
is simply the number of dollars of income received by an individual measured over a
PROOFSis simply the number of dollars of income received by an individual measured over a period of time — perhaps an hour, a week, a month or a year (e.g. $750 per week). It does not take into
PROOFSperiod of time — perhaps an hour, a week, a month or a year (e.g. $750 per week). It does not take into account the actual quantity of goods and services that these dollars will purchase (purchasing power), since
PROOFSaccount the actual quantity of goods and services that these dollars will purchase (purchasing power), since this depends on the prices that are paid or the general in�ation rate that is often measured by the consumer
PROOFSthis depends on the prices that are paid or the general in�ation rate that is often measured by the consumer
real income
PROOFSreal income.
PROOFS.
is equal to a person’s nominal level of income measured in so many dollars, after taking
PROOFSis equal to a person’s nominal level of income measured in so many dollars, after taking
into account the in�ation rate or change in general level of consumer prices. For example, if the average
PROOFSinto account the in�ation rate or change in general level of consumer prices. For example, if the average level of household’s nominal incomes went up by, say, 4 per cent during 2017–18 and average consumer
PROOFS
level of household’s nominal incomes went up by, say, 4 per cent during 2017–18 and average consumer prices during the year went up by 3 per cent, then real incomes or purchasing power would have risen by PROOFS
prices during the year went up by 3 per cent, then real incomes or purchasing power would have risen by 3 per cent rise in in�ation equals a 1 per cent rise in PROOFS
3 per cent rise in in�ation equals a 1 per cent rise in
TOPIC 4 Economic ef�ciency and equity as contemporary economic issues 171
c04EconomicEf�ciencyAndEquityAsContemporaryEconomicIssues 171 4 October 2016 1:18 PM
buildings, equipment and other infrastructure associated with the provision of collective or public services such as power, transport, health and education.
2. The receipt of government welfare bene�ts or income support
3. The distribution of gross income (total income from all sources)
1. The distribution of market or private incomes from personal sources (such as wages, interest, rent, dividends and pro�ts)
5. The distribution of disposable household incomes (spendable incomes)
4. The payment of government personal income tax
The distribution of socialwage income
6. The receipt of indirect bene�ts including government community services (for example, education and health often provided cheaply or free)
FIGURE 4.2 The distribution of various types of income
For most individuals, wealth takes years to accumulate. Those with high incomes can use their surplus income or savings to purchase and expand their assets or wealth and, in turn, increase their level of unearned income. However, although it takes a lifetime for most to accumulate wealth, in Australia considerable wealth is inherited or passed from one generation to the next, usually when family members die. These inherited assets can earn extra income for the owner. As a result, inequality in the income–wealth cycle in one gener-ation continues into the next.
UNCORRECTED
UNCORRECTED
UNCORRECTED 5. The distribution of disposable
UNCORRECTED 5. The distribution of disposable household incomes (spendable
UNCORRECTED household incomes (spendable incomes)
UNCORRECTED incomes)
UNCORRECTED PAGE
PAGE 4. The payment of government
PAGE 4. The payment of government
PROOFS
172 Economics Down Under 1
c04EconomicEf�ciencyAndEquityAsContemporaryEconomicIssues 172 4 October 2016 1:18 PM
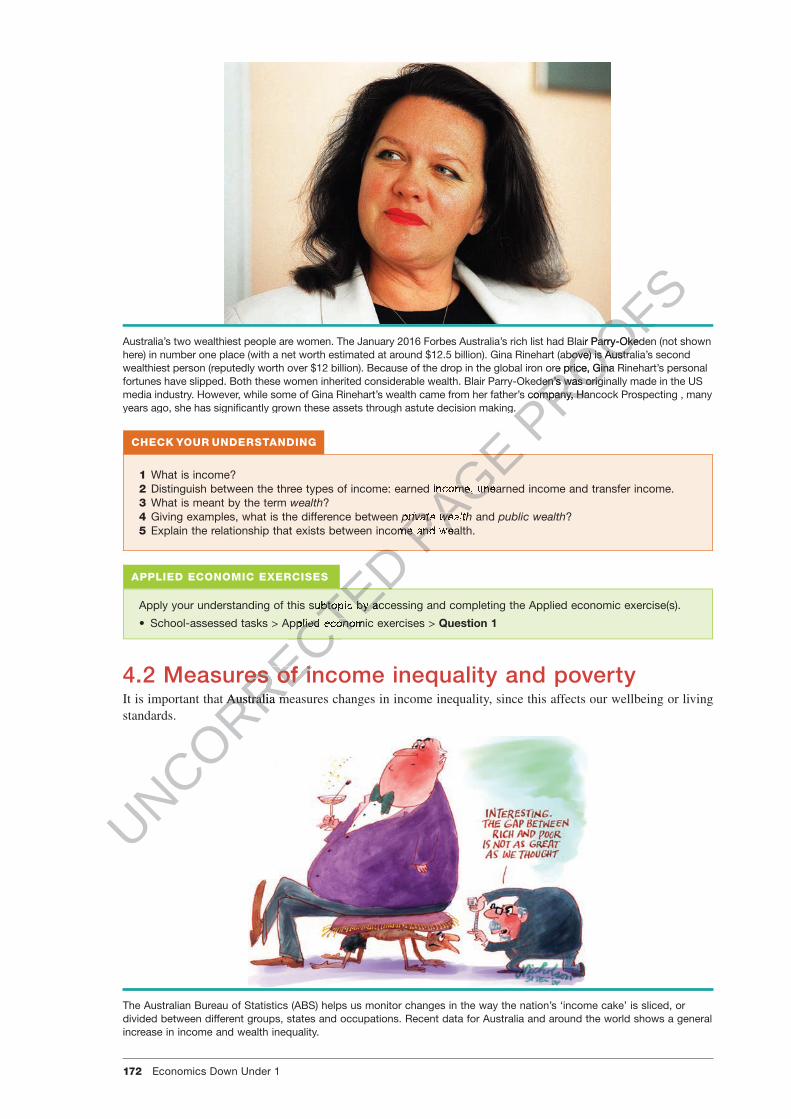
Australia’s two wealthiest people are women. The January 2016 Forbes Australia’s rich list had Blair Parry-Okeden (not shown here) in number one place (with a net worth estimated at around $12.5 billion). Gina Rinehart (above) is Australia’s second wealthiest person (reputedly worth over $12 billion). Because of the drop in the global iron ore price, Gina Rinehart’s personal fortunes have slipped. Both these women inherited considerable wealth. Blair Parry-Okeden’s was originally made in the US media industry. However, while some of Gina Rinehart’s wealth came from her father’s company, Hancock Prospecting , many years ago, she has signi�cantly grown these assets through astute decision making.
CHECK YOUR UNDERSTANDING
1 What is income?2 Distinguish between the three types of income: earned income, unearned income and transfer income.3 What is meant by the term wealth?4 Giving examples, what is the difference between private wealth and public wealth?5 Explain the relationship that exists between income and wealth.
APPLIED ECONOMIC EXERCISES
Apply your understanding of this subtopic by accessing and completing the Applied economic exercise(s).
• School-assessed tasks > Applied economic exercises > Question 1
4.2 Measures of income inequality and povertyIt is important that Australia measures changes in income inequality, since this affects our wellbeing or living standards.
The Australian Bureau of Statistics (ABS) helps us monitor changes in the way the nation’s ‘income cake’ is sliced, or divided between different groups, states and occupations. Recent data for Australia and around the world shows a general increase in income and wealth inequality.
UNCORRECTED
UNCORRECTED
UNCORRECTED
UNCORRECTED
UNCORRECTED
UNCORRECTED
UNCORRECTED
UNCORRECTED
UNCORRECTED Apply your understanding of this subtopic by accessing and completing the Applied economic exercise(s).
UNCORRECTED Apply your understanding of this subtopic by accessing and completing the Applied economic exercise(s).
School-assessed tasks > Applied economic exercises >
UNCORRECTED School-assessed tasks > Applied economic exercises >
4.2 Measures of income inequality and poverty
UNCORRECTED
4.2 Measures of income inequality and povertyIt is important that Australia measures changes in income inequality, since this affects our wellbeing or living
UNCORRECTED
It is important that Australia measures changes in income inequality, since this affects our wellbeing or living
PAGE
PAGE
PAGE
PAGE ee types of income: earned income, unearned income and transfer income.
PAGE ee types of income: earned income, unearned income and transfer income.
private wealth
PAGE private wealth
elationship that exists between income and wealth.PAGE elationship that exists between income and wealth.
PROOFS
PROOFS
PROOFSAustralia’s two wealthiest people are women. The January 2016 Forbes Australia’s rich list had Blair Parry-Okeden (not shown
PROOFSAustralia’s two wealthiest people are women. The January 2016 Forbes Australia’s rich list had Blair Parry-Okeden (not shown here) in number one place (with a net worth estimated at around $12.5 billion). Gina Rinehart (above) is Australia’s second
PROOFShere) in number one place (with a net worth estimated at around $12.5 billion). Gina Rinehart (above) is Australia’s second wealthiest person (reputedly worth over $12 billion). Because of the drop in the global iron ore price, Gina Rinehart’s personal
PROOFSwealthiest person (reputedly worth over $12 billion). Because of the drop in the global iron ore price, Gina Rinehart’s personal fortunes have slipped. Both these women inherited considerable wealth. Blair Parry-Okeden’s was originally made in the US
PROOFSfortunes have slipped. Both these women inherited considerable wealth. Blair Parry-Okeden’s was originally made in the US media industry. However, while some of Gina Rinehart’s wealth came from her father’s company, Hancock Prospecting , many
PROOFSmedia industry. However, while some of Gina Rinehart’s wealth came from her father’s company, Hancock Prospecting , many years ago, she has signi�cantly grown these assets through astute decision making. PROOFS
years ago, she has signi�cantly grown these assets through astute decision making.
TOPIC 4 Economic ef�ciency and equity as contemporary economic issues 173
c04EconomicEf�ciencyAndEquityAsContemporaryEconomicIssues 173 4 October 2016 1:18 PM
Measurement of Australia’s income distributionIncome distribution refers to the way the nation’s ‘income cake’ (or ‘income pie’ as it is often called) is divided or shared between individuals and income units making up the population. The pattern of income distribution is regarded as fairly even if all people receive similar-sized slices of the income cake. However, in Australia, the distribution pattern is uneven because people receive vastly different percentage shares of total national income. Despite this inequality, there would be even more unevenness if the Australian government did not use redistribution policies to reduce inequality.
The Australian Bureau of Statistics (ABS) measures income distribution every few years (the last in 2013–14, released in late 2015) using a survey of income units (i.e. family or other groupings of people living in the same household) in private dwellings throughout Australia. Trained interviewers go around to a small but representative cross-section of the population (i.e. about 0.2 per cent of the population). Typically, the interviewers collect a range of statistical data that measure the distribution of different types of incomes.
Some common measures of income distribution include the following: • The distribution of market or private income refers to how equally or unequally personal incomes of
all types (wages, salaries, pro�ts of the self-employed, rent, interest, dividends) are divided, prior to any government efforts to redistribute income more evenly.
• The distribution of disposable weekly income refers to how personal or private incomes (wages, salaries, pro�ts of the self-employed, rent, interest and dividends, plus the receipt of government welfare bene�ts, and after the payment of personal income tax) are divided between individuals.
• The distribution of equivalised disposable income is a similar measure to disposable income (outlined above), except that special statistical adjustments have been made (i.e. equivalence scales have been applied) to the disposable incomes of households. This allows for clearer comparisons to be made of the economic wellbeing or living standards of households of different sizes and composition. For example, to enjoy the same living standards, a household consisting of three people would normally need more income than a household with only one person. The resulting measure is a far better indicator of actual income distri-bution, and it is the main one to which we will refer.
• The distribution of �nal income takes full account of the impact of government policies — including the payment of welfare, income tax, provision of free or subsidised services, and the payment of indirect taxes such as the GST — on the level of market or private incomes. This measure best indicates how evenly or unevenly incomes are ultimately divided and whether individuals can consume or have access to basic goods and services.
For Australia, the most common measure of how income is shared or divided up is the distribution of equiva-lised disposable weekly income. There are �ve main steps involved in the measurement of this.
Step 1: Conduct the income surveyThe ABS conducts a household survey of income and wealth in which it collects data about the sources and level of weekly income based on a representative cross section or sample of the population.
Step 2: Rank income recipients by income levelOnce the information is collected, the ABS ranks income recipients from the lowest to the highest weekly income in ascending order. This establishes the spread or range of all weekly incomes.
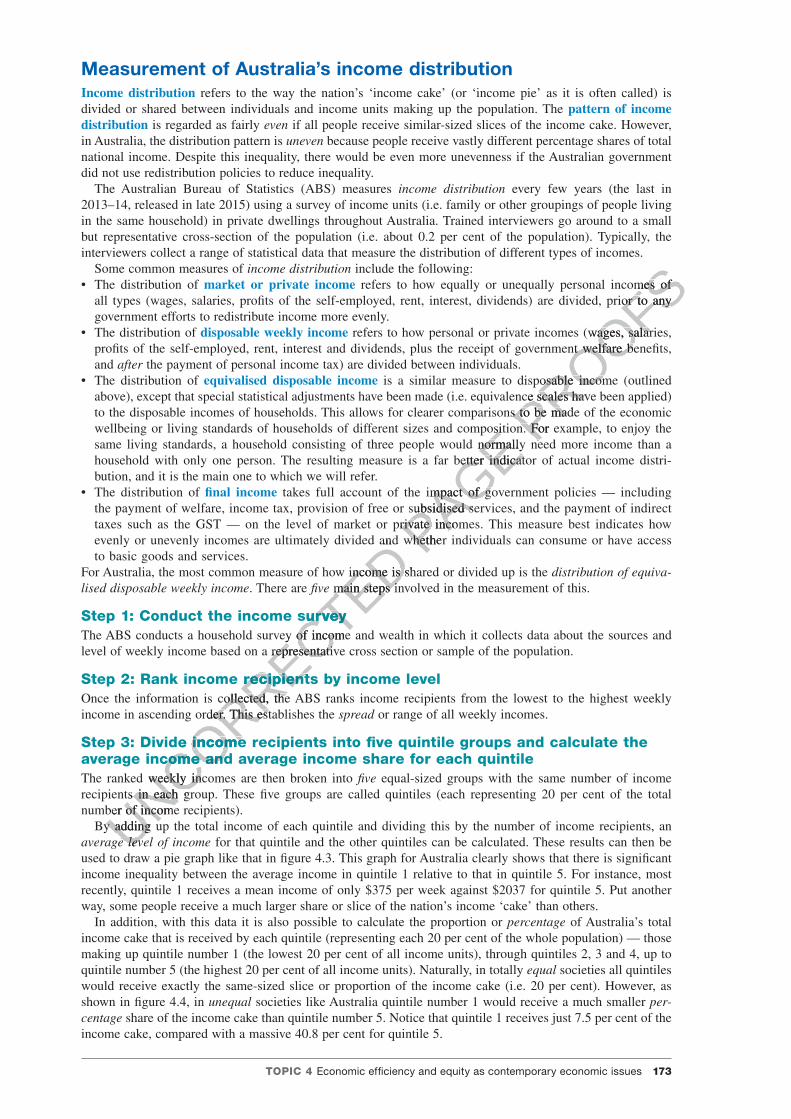
Step 3: Divide income recipients into �ve quintile groups and calculate the average income and average income share for each quintileThe ranked weekly incomes are then broken into �ve equal-sized groups with the same number of income recipients in each group. These �ve groups are called quintiles (each representing 20 per cent of the total number of income recipients).
By adding up the total income of each quintile and dividing this by the number of income recipients, an average level of income for that quintile and the other quintiles can be calculated. These results can then be used to draw a pie graph like that in �gure 4.3. This graph for Australia clearly shows that there is signi�cant income inequality between the average income in quintile 1 relative to that in quintile 5. For instance, most recently, quintile 1 receives a mean income of only $375 per week against $2037 for quintile 5. Put another way, some people receive a much larger share or slice of the nation’s income ‘cake’ than others.
In addition, with this data it is also possible to calculate the proportion or percentage of Australia’s total income cake that is received by each quintile (representing each 20 per cent of the whole population) — those making up quintile number 1 (the lowest 20 per cent of all income units), through quintiles 2, 3 and 4, up to quintile number 5 (the highest 20 per cent of all income units). Naturally, in totally equal societies all quintiles would receive exactly the same-sized slice or proportion of the income cake (i.e. 20 per cent). However, as shown in �gure 4.4, in unequal societies like Australia quintile number 1 would receive a much smaller per-centage share of the income cake than quintile number 5. Notice that quintile 1 receives just 7.5 per cent of the income cake, compared with a massive 40.8 per cent for quintile 5.
UNCORRECTED evenly or unevenly incomes are ultimately divided and whether individuals can consume or have access
UNCORRECTED evenly or unevenly incomes are ultimately divided and whether individuals can consume or have access
For Australia, the most common measure of how income is shared or divided up is the
UNCORRECTED For Australia, the most common measure of how income is shared or divided up is the
UNCORRECTED main steps involved in the measurement of this.
UNCORRECTED main steps involved in the measurement of this.
nduct the income survey
UNCORRECTED nduct the income survey
The ABS conducts a household survey of income and wealth in which it collects data about the sources and
UNCORRECTED The ABS conducts a household survey of income and wealth in which it collects data about the sources and level of weekly income based on a representative cross section or sample of the population.
UNCORRECTED
level of weekly income based on a representative cross section or sample of the population.
nk income recipients by income level
UNCORRECTED
nk income recipients by income levelOnce the information is collected, the ABS ranks income recipients from the lowest to the highest weekly
UNCORRECTED
Once the information is collected, the ABS ranks income recipients from the lowest to the highest weekly income in ascending order. This establishes the
UNCORRECTED
income in ascending order. This establishes the
vide income recipients into �ve quintile groups and calculate the
UNCORRECTED
vide income recipients into �ve quintile groups and calculate the
UNCORRECTED
average income and average income share for each quintile
UNCORRECTED
average income and average income share for each quintileThe ranked weekly incomes are then broken into
UNCORRECTED
The ranked weekly incomes are then broken into recipients in each group. These �ve groups are called quintiles (each representing 20 per cent of the total
UNCORRECTED
recipients in each group. These �ve groups are called quintiles (each representing 20 per cent of the total number of income recipients).
UNCORRECTED
number of income recipients).
UNCORRECTED
By adding up the total income of each quintile and dividing this by the number of income recipients, an UNCORRECTED
By adding up the total income of each quintile and dividing this by the number of income recipients, an average level of incomeUNCORRECTED
average level of income
PAGE wellbeing or living standards of households of different sizes and composition. For example, to enjoy the
PAGE wellbeing or living standards of households of different sizes and composition. For example, to enjoy the same living standards, a household consisting of three people would normally need more income than a
PAGE same living standards, a household consisting of three people would normally need more income than a household with only one person. The resulting measure is a far better indicator of actual income distri
PAGE household with only one person. The resulting measure is a far better indicator of actual income distri
takes full account of the impact of government policies — including
PAGE takes full account of the impact of government policies — including
the payment of welfare, income tax, provision of free or subsidised services, and the payment of indirect
PAGE the payment of welfare, income tax, provision of free or subsidised services, and the payment of indirect taxes such as the GST — on the level of market or private incomes. This measure best indicates how PAGE taxes such as the GST — on the level of market or private incomes. This measure best indicates how evenly or unevenly incomes are ultimately divided and whether individuals can consume or have access PAGE
evenly or unevenly incomes are ultimately divided and whether individuals can consume or have access
PROOFSrefers to how equally or unequally personal incomes of
PROOFSrefers to how equally or unequally personal incomes of all types (wages, salaries, pro�ts of the self-employed, rent, interest, dividends) are divided, prior to any
PROOFSall types (wages, salaries, pro�ts of the self-employed, rent, interest, dividends) are divided, prior to any
refers to how personal or private incomes (wages, salaries,
PROOFS refers to how personal or private incomes (wages, salaries,
pro�ts of the self-employed, rent, interest and dividends, plus the receipt of government welfare bene�ts,
PROOFSpro�ts of the self-employed, rent, interest and dividends, plus the receipt of government welfare bene�ts,
is a similar measure to disposable income (outlined
PROOFSis a similar measure to disposable income (outlined
above), except that special statistical adjustments have been made (i.e. equivalence scales have been applied)
PROOFS
above), except that special statistical adjustments have been made (i.e. equivalence scales have been applied) to the disposable incomes of households. This allows for clearer comparisons to be made of the economic PROOFS
to the disposable incomes of households. This allows for clearer comparisons to be made of the economic wellbeing or living standards of households of different sizes and composition. For example, to enjoy the PROOFS
wellbeing or living standards of households of different sizes and composition. For example, to enjoy the same living standards, a household consisting of three people would normally need more income than a PROOFS
same living standards, a household consisting of three people would normally need more income than a
174 Economics Down Under 1
c04EconomicEf�ciencyAndEquityAsContemporaryEconomicIssues 174 4 October 2016 1:18 PM
Cutting up or distributing Australia’s income cake
375
615
843
1119
2037
0
500
1000
1500
2000
2500
Incomequintile1 ($) —lowest
Incomequintile2 ($)
Incomequintile3 ($)
Incomequintile4 ($)
Incomequintile5 ($) —highest
Leve
l of
equi
valis
ed d
ispo
sabl
e w
eekl
y in
com
e ($
)
Quintile 2$615
Quintile 3$843
Quintile 4$1119
Quintile 5$2037
Quintile 1$375
FIGURE 4.3 Mean equivalised weekly disposable income by quintile, Australia, 2013–14
Source: Data derived from ABS 6523.0 (Table 1.1).
7.5 12.316.9
22.4
40.8
0
10
20
30
40
50
Non-cumulativequintile 1 (20%)
Non-cumulativequintile 2 (40%)
Non-cumulativequintile 3 (60%)
Non-cumulativequintile 4 (80%)
Non-cumulativequintile 5 (100%)
Per
cent
age
shar
e of
the
tot
alin
com
e ca
ke b
y ea
ch q
uint
ile
Individual income quintile
Percentage share of Australia’s equivalised weekly disposable income cake by eachindividual quintile, 2013–14
FIGURE 4.4 Inequality in the share of Australia’s equivalised weekly income received by each quintile
Source: Data derived from ABS 6523.0 (Table 1).
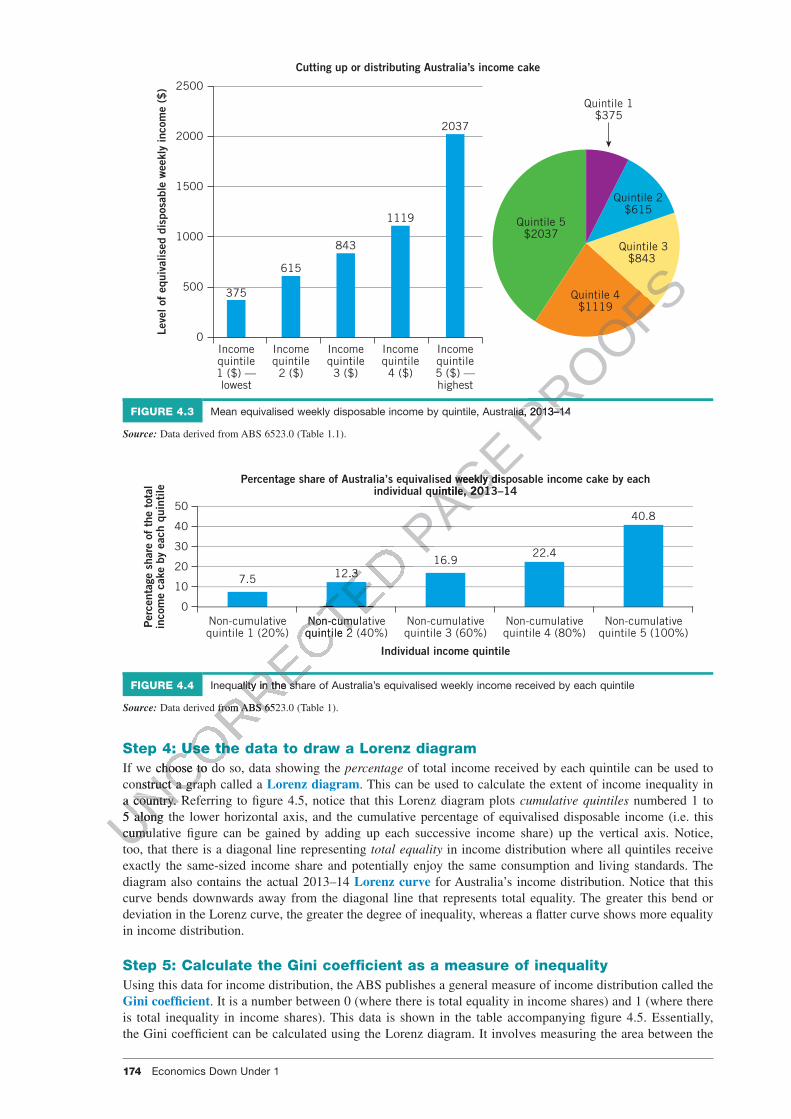
Step 4: Use the data to draw a Lorenz diagramIf we choose to do so, data showing the percentage of total income received by each quintile can be used to construct a graph called a Lorenz diagram. This can be used to calculate the extent of income inequality in a country. Referring to �gure 4.5, notice that this Lorenz diagram plots cumulative quintiles numbered 1 to 5 along the lower horizontal axis, and the cumulative percentage of equivalised disposable income (i.e. this cumulative �gure can be gained by adding up each successive income share) up the vertical axis. Notice, too, that there is a diagonal line representing total equality in income distribution where all quintiles receive exactly the same-sized income share and potentially enjoy the same consumption and living standards. The diagram also contains the actual 2013–14 Lorenz curve for Australia’s income distribution. Notice that this curve bends downwards away from the diagonal line that represents total equality. The greater this bend or deviation in the Lorenz curve, the greater the degree of inequality, whereas a �atter curve shows more equality in income distribution.
Step 5: Calculate the Gini coef�cient as a measure of inequalityUsing this data for income distribution, the ABS publishes a general measure of income distribution called the Gini coef�cient. It is a number between 0 (where there is total equality in income shares) and 1 (where there is total inequality in income shares). This data is shown in the table accompanying �gure 4.5. Essentially, the Gini coef�cient can be calculated using the Lorenz diagram. It involves measuring the area between the
UNCORRECTED
UNCORRECTED
UNCORRECTED
UNCORRECTED
UNCORRECTED
UNCORRECTED
UNCORRECTED
UNCORRECTED 12.3
UNCORRECTED 12.3
quintile 1 (20%)
UNCORRECTED quintile 1 (20%)
Non-cumulative
UNCORRECTED Non-cumulativequintile 2 (40%)
UNCORRECTED quintile 2 (40%)
Inequality in the share of Australia’s equivalised weekly income received by each quintile
UNCORRECTED
Inequality in the share of Australia’s equivalised weekly income received by each quintile
Data derived from ABS 6523.0 (Table 1).
UNCORRECTED
Data derived from ABS 6523.0 (Table 1).
ep 4:
UNCORRECTED
ep 4: U
UNCORRECTED
Us
UNCORRECTED
se the data to draw a
UNCORRECTED
e the data to draw a
UNCORRECTED
If we choose to do so, data showing the
UNCORRECTED
If we choose to do so, data showing the construct a graph called a
UNCORRECTED
construct a graph called a a country. Referring to �gure 4.5, notice that this Lorenz diagram plots
UNCORRECTED
a country. Referring to �gure 4.5, notice that this Lorenz diagram plots 5 along the lower horizontal axis, and the cumulative percentage of equivalised disposable income (i.e. this UNCORRECTED
5 along the lower horizontal axis, and the cumulative percentage of equivalised disposable income (i.e. this UNCORRECTED
cumulative �gure can be gained by adding up each successive income share) up the vertical axis. Notice, UNCORRECTED
cumulative �gure can be gained by adding up each successive income share) up the vertical axis. Notice, too, that there is a diagonal line representing UNCORRECTED
too, that there is a diagonal line representing
PAGE
PAGE
PAGE
PAGE Percentage share of Australia’s equivalised weekly disposable income cake by each
PAGE Percentage share of Australia’s equivalised weekly disposable income cake by each
individual quintile, 2013–14
PAGE individual quintile, 2013–14
PROOFS
PROOFS
PROOFS
PROOFS
Mean equivalised weekly disposable income by quintile, Australia, 2013–14PROOFS
Mean equivalised weekly disposable income by quintile, Australia, 2013–14
TOPIC 4 Economic ef�ciency and equity as contemporary economic issues 175
c04EconomicEf�ciencyAndEquityAsContemporaryEconomicIssues 175 4 October 2016 1:18 PM
diagonal line of absolute equality and the actual Lorenz curve. The resulting �gure is then expressed as a proportion of the total triangular area below the diagonal. This is illustrated in �gure 4.6 below. Gini �gures collected over a number of years can also be compared, to determine whether Australia’s inequality in income distribution is increasing or decreasing.
7.50
19.8
36.7
59.1
100
20
40
60
80
100
0
10
20
30
40
50
60
70
80
90
100
Cumulativequintile 0
(0%)
Cumulativequintile 1
(20%)
Cumulativequintile 2
(40%)
Cumulativequintile 3
(60%)
Cumulativequintile 4
(80%)
Cumulativequintile 5(100%)
Cum
ulat
ive
shar
e of
tot
al e
quiv
alis
ed d
ispo
sabl
e in
com
e(p
erce
ntag
e)
Australia’s Lorenz curve showing the distribution of income
Equivalisedincome share bycumulativequintile 2013–14
Total equality inincomedistribution
Total inequality inincomedistribution0
Australia’s Lorenzcurve for the cumulative distribution of income, 2013–14
Diagonal line represents the line of total equality in income distribution
Area betw
een th
e two l
ines dete
rmines
the Gini c
oef�cie
nt = 0.333
Quintile
Cumulative quintile 0
(0%)
Cumulative quintile 1
(20%)
Cumulative quintile 2
(40%)
Cumulative quintile 3
(60%)
Cumulative quintile 4
(80%)
Cumulative quintile 5 (100%)
Gini coef�cient
Australia’s cumulative equivalised share (percentage) of the total income cake received by cumulative quintile, 2013–14 0 7.5 19.8 36.7 59.1 100 0.333
Cumulative share (percentage) of total income cake if there is total equality in income distribution 0 20 40 60 80 100 0
Cumulative share (percentage) of total income cake if there is total inequality in income distribution 0 0 0 0 0 100 1
FIGURE 4.5 Lorenz diagram showing inequality in Australia’s distribution of equivalised weekly disposable income received by cumulative quintile, 2013–14
Source: Data derived from ABS 6523.0 (Table 1.1). Note: Cumulative shares of income are calculated by working out a running total of individual quintiles. Cumulative quintile 2, for instance, is the sum of the individual percentage shares for quintiles 1 and 2.
Sha
re o
f in
com
e (%
)
Gini coef�cient = Area A(Area A + Area B)
Cumulative quintile
Area BArea A
Line of totalequality
Line of totalinequality
Lorenz curve
FIGURE 4.6 Calculating the Gini coef�cient using a Lorenz diagram
UNCORRECTED
UNCORRECTED
UNCORRECTED
UNCORRECTED
UNCORRECTED
UNCORRECTED
UNCORRECTED
UNCORRECTED
UNCORRECTED
UNCORRECTED
UNCORRECTED 7.5 19.8 36.7 59.1 100 0.333
UNCORRECTED 7.5 19.8 36.7 59.1 100 0.333
0 20
UNCORRECTED
0 20
income cake if there
UNCORRECTED
income cake if there is total inequality in
UNCORRECTED
is total inequality in income distribution
UNCORRECTED
income distribution
FIGURE 4.5
UNCORRECTED
FIGURE 4.5 Lorenz diagram showing inequality in Australia’s distribution of equivalised weekly disposable income
UNCORRECTED
Lorenz diagram showing inequality in Australia’s distribution of equivalised weekly disposable income
UNCORRECTED
received by cumulative quintile, 2013–14
UNCORRECTED
received by cumulative quintile, 2013–14
Source: UNCORRECTED
Source: Data derived from ABS 6523.0 (Table 1.1). UNCORRECTED
Data derived from ABS 6523.0 (Table 1.1). individual quintiles. Cumulative quintile 2, for instance, is the sum of the individual percentage shares for quintiles 1 and 2.UNCORRECTED
individual quintiles. Cumulative quintile 2, for instance, is the sum of the individual percentage shares for quintiles 1 and 2.
PAGE quintile 5
PAGE quintile 5(100%)
PAGE (100%)
PAGE
PAGE Cumulative
PAGE Cumulative quintile 3
PAGE quintile 3
(60%)
PAGE (60%)
Cumulative
PAGE Cumulative quintile 4
PAGE quintile 4
PROOFS
PROOFS
PROOFS
PROOFS
CumulativePROOFS
Cumulativequintile 5PROOFS
quintile 5
Total equality in
PROOFSTotal equality in
distribution
PROOFSdistribution
Total inequality in
PROOFSTotal inequality inincome
PROOFSincomedistribution
PROOFSdistribution
PROOFS
176 Economics Down Under 1
c04EconomicEf�ciencyAndEquityAsContemporaryEconomicIssues 176 4 October 2016 1:18 PM
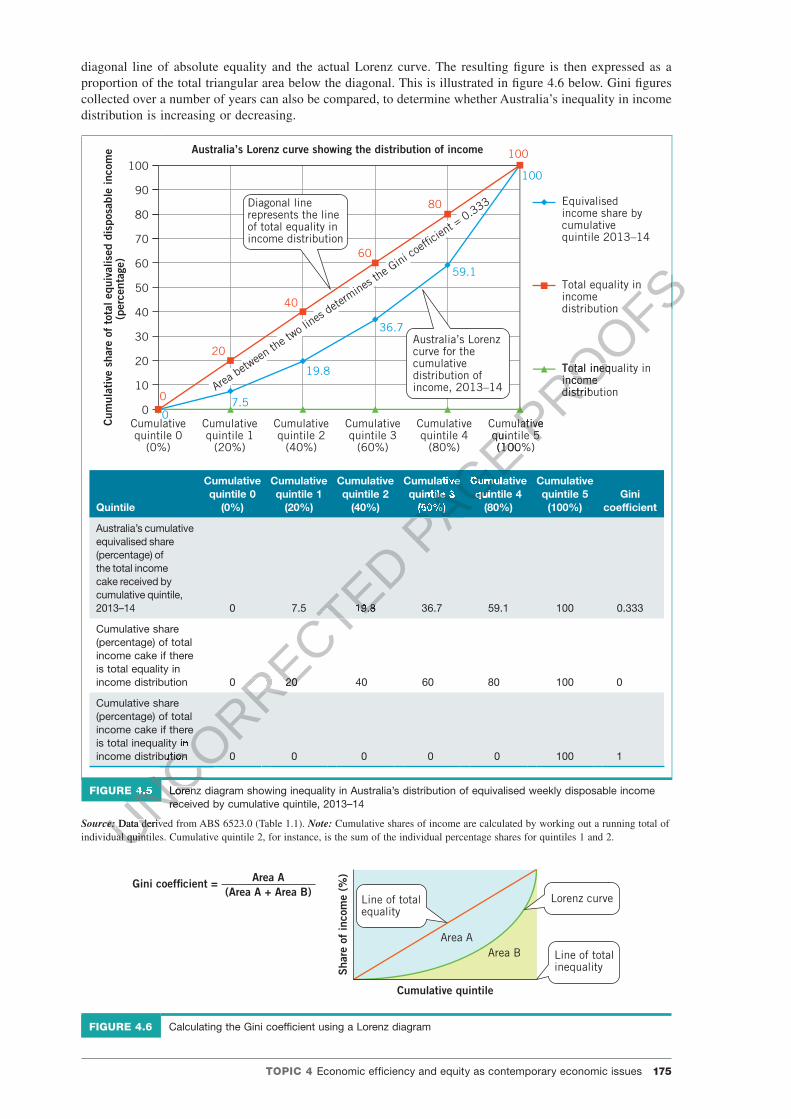
Figure 4.7 shows that between 1994–95 and 2013–14, there was a general upward trend (see the broken trend line in marked in green) in Australia’s Gini coef�cient for equivalised disposable weekly income. We will investigate the possible reasons for this rise in inequality later in this topic.
0.3020.292
0.31 0.311 0.3090.297
0.314
0.3360.329
0.32
0.333
19
94
–95
19
96
–97
19
99
–00
20
00
–01
20
01
–02
20
02
–03
20
03
–04
20
04
–05
20
05
–06
20
06
–07
20
07
–08
20
08
–09
20
09
–10
20
10
–11
20
11
–12
20
12
–13
20
13
–14
20
14
–15
20
15
–16
20
16
–17
0.270.26
0.280.290.300.310.320.330.340.35
Gin
i coe
f�ci
ent
Australia’s Gini coef�cient for equivalised household disposable income
FIGURE 4.7 Trends in Australia’s Gini coef�cient, 1994–95 to 2013–14
Source: Data derived from ABS 6523.0, Table 1.1
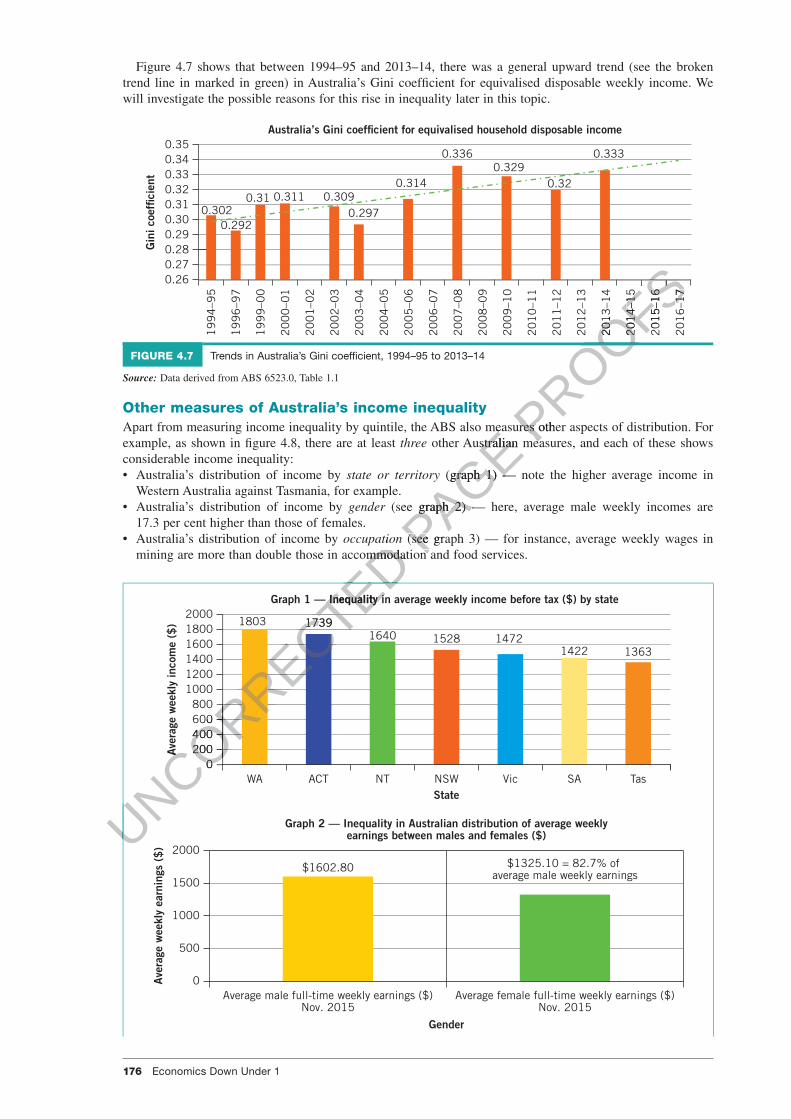
Other measures of Australia’s income inequalityApart from measuring income inequality by quintile, the ABS also measures other aspects of distribution. For example, as shown in �gure 4.8, there are at least three other Australian measures, and each of these shows considerable income inequality: • Australia’s distribution of income by state or territory (graph 1) — note the higher average income in
Western Australia against Tasmania, for example. • Australia’s distribution of income by gender (see graph 2) — here, average male weekly incomes are
17.3 per cent higher than those of females. • Australia’s distribution of income by occupation (see graph 3) — for instance, average weekly wages in
mining are more than double those in accommodation and food services.
1803 17391640 1528 1472
1422 1363
0200400600800
100012001400160018002000
WA ACT NT NSW Vic SA Tas
Aver
age
wee
kly
inco
me
($)
State
Graph 1 — Inequality in average weekly income before tax ($) by state
$1602.80 $1325.10 = 82.7% of average male weekly earnings
0
500
1000
1500
2000
Average male full-time weekly earnings ($)Nov. 2015
Average female full-time weekly earnings ($)Nov. 2015
Ave
rage
wee
kly
earn
ings
($
)
Gender
Graph 2 — Inequality in Australian distribution of average weeklyearnings between males and females ($)UNCORRECTED occupation
UNCORRECTED occupationmining are more than double those in accommodation and food services.
UNCORRECTED mining are more than double those in accommodation and food services.
UNCORRECTED
UNCORRECTED
UNCORRECTED
UNCORRECTED
UNCORRECTED
UNCORRECTED
UNCORRECTED
UNCORRECTED
UNCORRECTED
UNCORRECTED
UNCORRECTED
UNCORRECTED
UNCORRECTED
UNCORRECTED
UNCORRECTED
UNCORRECTED
UNCORRECTED
UNCORRECTED
UNCORRECTED
UNCORRECTED
UNCORRECTED
UNCORRECTED
UNCORRECTED
UNCORRECTED
UNCORRECTED
UNCORRECTED
UNCORRECTED
UNCORRECTED
UNCORRECTED
UNCORRECTED
UNCORRECTED
UNCORRECTED 1739
UNCORRECTED 1739
0
UNCORRECTED
0200
UNCORRECTED
200400
UNCORRECTED
400600
UNCORRECTED
600
Aver
age
wee
kly
inco
me
($)
UNCORRECTED
Aver
age
wee
kly
inco
me
($)
Graph 1 — Inequality in average weekly income before tax ($) by state
UNCORRECTED Graph 1 — Inequality in average weekly income before tax ($) by state
PAGE Apart from measuring income inequality by quintile, the ABS also measures other aspects of distribution. For
PAGE Apart from measuring income inequality by quintile, the ABS also measures other aspects of distribution. For other Australian measures, and each of these shows
PAGE other Australian measures, and each of these shows
(graph 1) — note the higher average income in
PAGE (graph 1) — note the higher average income in
(see graph 2) — here, average male weekly incomes are
PAGE (see graph 2) — here, average male weekly incomes are
(see graph 3) — for instance, average weekly wages in PAGE
(see graph 3) — for instance, average weekly wages in mining are more than double those in accommodation and food services.PAGE
mining are more than double those in accommodation and food services.
PROOFS
PROOFS
PROOFS
PROOFS
PROOFS
20
13
–14
PROOFS
20
13
–14
20
14
–15
PROOFS
20
14
–15
20
15
–16
PROOFS
20
15
–16
20
16
–17
PROOFS
20
16
–17
PROOFS
Apart from measuring income inequality by quintile, the ABS also measures other aspects of distribution. For PROOFS
Apart from measuring income inequality by quintile, the ABS also measures other aspects of distribution. For other Australian measures, and each of these shows PROOFS
other Australian measures, and each of these shows

TOPIC 4 Economic ef�ciency and equity as contemporary economic issues 177
c04EconomicEf�ciencyAndEquityAsContemporaryEconomicIssues 177 4 October 2016 1:18 PM
Graph 3 — Inequality in Australian average weekly income by occupation ($)
25762110
19171863
17661741
16251689
158415441540
148414161406
12951188
1121
0 500 1000 1500 2000 2500 3000
MiningFinance and insurance
Professional, scienti�c and technical servicesInformation media and telecommunications
Health care and social assistanceEducation and training
Public administrative and safetyAustralian average
Transport, postal and warehousingRental, hiring and real estate
ConstructionWholesale trade
Arts and recreation servicesManufacturing
Administrative and support servicesRetail trade
Accommodation and food services
Average weekly income ($)
FIGURE 4.8 Three other measures of Australia’s income inequality
Sources: All data derived from ABS 6302.0 (Table 10G), 6523.0 (Tables 11A to 11 H) and other.
Measurement of Australia’s wealth distributionEvery couple of years, the ABS also estimates the distribution of Australia’s wealth, which is called net worth. Net worth is positive when there is an excess of assets owned by households over their liabilities. These data are compiled in the same way as those for the distribution of income by quintile.
As shown in �gure 4.9, a Lorenz diagram and curve for the distribution of Australia’s wealth can be drawn. You may notice here that the Lorenz curve for wealth deviates further from the diagonal line of total equality than the curve for disposable income. This suggests that Australia’s wealth is divided very unevenly. Indeed, the Gini coef�cient for wealth is 0.606 whereas that for equivalised disposable income is just 0.333. In our country, the wealthiest 20 per cent own more than 62 per cent of all wealth.
However, while you might think that this seems highly unequal, globally the richest 1 per cent are estimated to own around half of the world’s wealth! Surprisingly, a net worth or assets equal to just $68 000 (2016) would put an individual in the top 10 per cent of the world’s wealthiest!
0
1.1 6.117.2
37.2
100
0
20
40
60
80
100
0
Cumulativequintile 0
(0%)
Cumulativequintile 1
(20%)
Cumulativequintile 2
(40%)
Cumulativequintile 3
(60%)
Cumulativequintile 4
(80%)
Cumulativequintile 5(100%)
20
40
60
80
100
Sha
re o
f to
tal w
ealt
h (p
erce
ntag
e)
Australia’s Lorenz curve showing the distribution of wealth
This area determines the Gini coef�cient for wealth = 0.606
FIGURE 4.9 How evenly does Australia distribute its wealth (net worth) and how has this changed in recent times?
Source: Data derived from ABS 6523.0, Table 2.2. Note: Cumulative shares of wealth are calculated by working out a running total of individual quintiles. Cumulative quintile 2, for instance, is the sum of the individual percentage shares for quintiles 1 and 2
UNCORRECTED You may notice here that the Lorenz curve for wealth deviates further from the diagonal line of total equality
UNCORRECTED You may notice here that the Lorenz curve for wealth deviates further from the diagonal line of total equality than the curve for disposable income. This suggests that Australia’s wealth is divided very unevenly. Indeed,
UNCORRECTED than the curve for disposable income. This suggests that Australia’s wealth is divided very unevenly. Indeed, the Gini coef�cient for wealth is 0.606 whereas that for equivalised disposable income is just 0.333. In our
UNCORRECTED the Gini coef�cient for wealth is 0.606 whereas that for equivalised disposable income is just 0.333. In our country, the wealthiest 20 per cent own more than 62 per cent of all wealth.
UNCORRECTED country, the wealthiest 20 per cent own more than 62 per cent of all wealth.
However, while you might think that this seems highly unequal, globally the richest 1 per cent are estimated
UNCORRECTED However, while you might think that this seems highly unequal, globally the richest 1 per cent are estimated
to own around half of the world’s wealth! Surprisingly, a net worth or assets equal to just $68
UNCORRECTED to own around half of the world’s wealth! Surprisingly, a net worth or assets equal to just $68
ould put an individual in the top 10 per cent of the world’s wealthiest!
UNCORRECTED ould put an individual in the top 10 per cent of the world’s wealthiest!
UNCORRECTED
UNCORRECTED
UNCORRECTED
UNCORRECTED
UNCORRECTED
UNCORRECTED
UNCORRECTED
UNCORRECTED
UNCORRECTED
UNCORRECTED
UNCORRECTED
UNCORRECTED
UNCORRECTED
40 UNCORRECTED
40
Australia’s Lorenz curve showing the distribution of wealth
UNCORRECTED
Australia’s Lorenz curve showing the distribution of wealth
PAGE Measurement of Australia’s wealth distribution
PAGE Measurement of Australia’s wealth distributionEvery couple of years, the ABS also estimates the distribution of Australia’s
PAGE Every couple of years, the ABS also estimates the distribution of Australia’s wealth
PAGE wealth
Net worth is positive when there is an excess of assets owned by households over their liabilities. These data
PAGE Net worth is positive when there is an excess of assets owned by households over their liabilities. These data are compiled in the same way as those for the distribution of income by quintile.
PAGE are compiled in the same way as those for the distribution of income by quintile.
As shown in �gure 4.9, a Lorenz diagram and curve for the distribution of Australia’s wealth can be drawn. PAGE As shown in �gure 4.9, a Lorenz diagram and curve for the distribution of Australia’s wealth can be drawn.
You may notice here that the Lorenz curve for wealth deviates further from the diagonal line of total equality PAGE
You may notice here that the Lorenz curve for wealth deviates further from the diagonal line of total equality
PROOFS
PROOFS
PROOFS
PROOFS
PROOFS
PROOFS
PROOFS
PROOFS
PROOFS
PROOFS257
PROOFS2576
PROOFS6
0 500 1000 1500 2000 2500 3000
PROOFS0 500 1000 1500 2000 2500 3000
178 Economics Down Under 1
c04EconomicEf�ciencyAndEquityAsContemporaryEconomicIssues 178 4 October 2016 1:18 PM
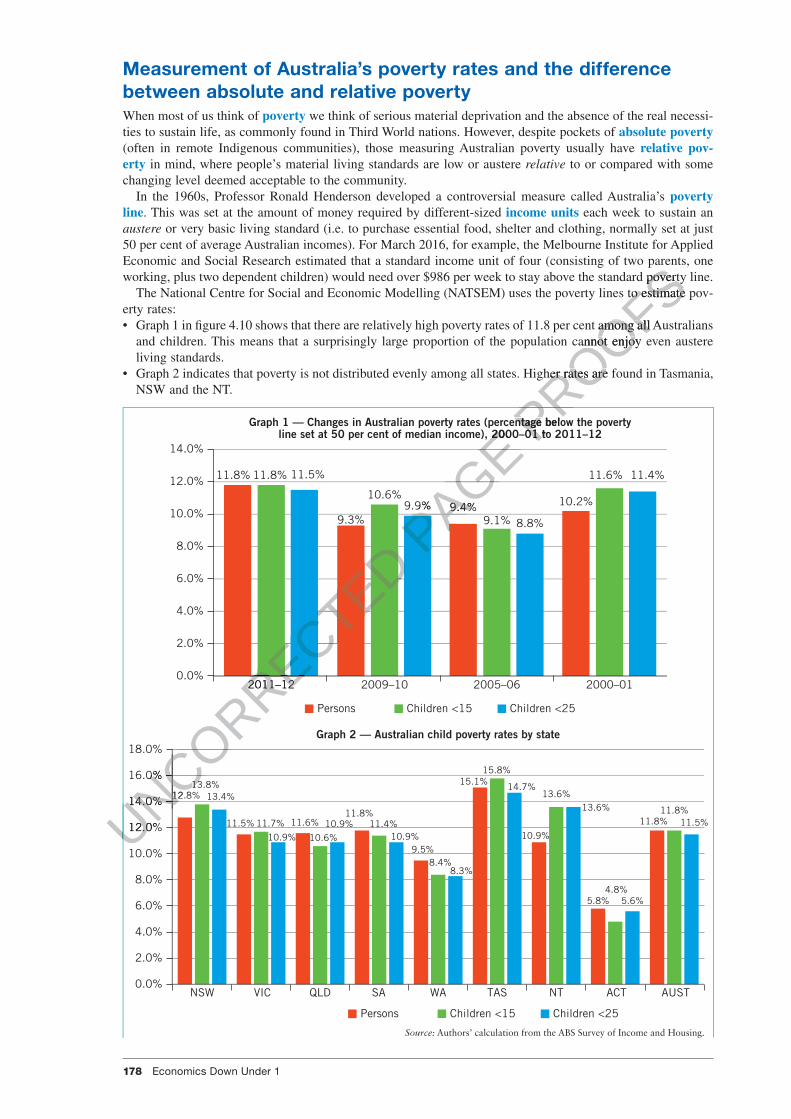
Measurement of Australia’s poverty rates and the difference between absolute and relative povertyWhen most of us think of poverty we think of serious material deprivation and the absence of the real necessi-ties to sustain life, as commonly found in Third World nations. However, despite pockets of absolute poverty (often in remote Indigenous communities), those measuring Australian poverty usually have relative pov-erty in mind, where people’s material living standards are low or austere relative to or compared with some changing level deemed acceptable to the community.
In the 1960s, Professor Ronald Henderson developed a controversial measure called Australia’s poverty line. This was set at the amount of money required by different-sized income units each week to sustain an austere or very basic living standard (i.e. to purchase essential food, shelter and clothing, normally set at just 50 per cent of average Australian incomes). For March 2016, for example, the Melbourne Institute for Applied Economic and Social Research estimated that a standard income unit of four (consisting of two parents, one working, plus two dependent children) would need over $986 per week to stay above the standard poverty line.
The National Centre for Social and Economic Modelling (NATSEM) uses the poverty lines to estimate pov-erty rates: • Graph 1 in �gure 4.10 shows that there are relatively high poverty rates of 11.8 per cent among all Australians
and children. This means that a surprisingly large proportion of the population cannot enjoy even austere living standards.
• Graph 2 indicates that poverty is not distributed evenly among all states. Higher rates are found in Tasmania, NSW and the NT.
11.8%
14.0%
Graph 1 — Changes in Australian poverty rates (percentage below the povertyline set at 50 per cent of median income), 2000–01 to 2011–12
12.0%
10.0%
8.0%
6.0%
4.0%
2.0%
0.0%2011–12 2009–10 2005–06 2000–01
11.8% 11.5%
9.3%
10.6%9.9% 9.4%
9.1% 8.8%
10.2%
11.6% 11.4%
Persons Children <15 Children <25
12.8%13.8%
13.4%
11.5% 11.7% 11.6%
10.9%10.9%
10.6%
11.8%11.4%
10.9%9.5%
8.4%8.3%
15.1%15.8%
14.7%13.6%
10.9%
13.6%
5.8% 5.6%
11.8%11.8% 11.5%
4.8%
14.0%
16.0%
18.0%Graph 2 — Australian child poverty rates by state
12.0%
10.0%
8.0%
6.0%
4.0%
2.0%
0.0%
Source: Authors’ calculation from the ABS Survey of Income and Housing.
NSW VIC QLD SA WA TAS NT ACT AUST
Persons Children <15 Children <25
UNCORRECTED
UNCORRECTED
UNCORRECTED
UNCORRECTED
UNCORRECTED
UNCORRECTED
UNCORRECTED
UNCORRECTED
UNCORRECTED
UNCORRECTED
UNCORRECTED
UNCORRECTED
UNCORRECTED
UNCORRECTED
UNCORRECTED
UNCORRECTED
UNCORRECTED
2011–12
UNCORRECTED
2011–12
UNCORRECTED
UNCORRECTED
UNCORRECTED
UNCORRECTED
12.8%
UNCORRECTED
12.8%13.8%
UNCORRECTED
13.8%
14.0%
UNCORRECTED
14.0%
16.0%
UNCORRECTED
16.0%
12.0%UNCORRECTED
12.0%UNCORRECTED
UNCORRECTED PAGE
PAGE
PAGE
PAGE
PAGE
PAGE
PAGE Graph 1 — Changes in Australian poverty rates (percentage below the poverty
PAGE Graph 1 — Changes in Australian poverty rates (percentage below the povertyline set at 50 per cent of median income), 2000–01 to 2011–12
PAGE line set at 50 per cent of median income), 2000–01 to 2011–12
9.9%
PAGE 9.9% 9.4%
PAGE 9.4%
PROOFSEconomic and Social Research estimated that a standard income unit of four (consisting of two parents, one
PROOFSEconomic and Social Research estimated that a standard income unit of four (consisting of two parents, one working, plus two dependent children) would need over $986 per week to stay above the standard poverty line.
PROOFSworking, plus two dependent children) would need over $986 per week to stay above the standard poverty line.The National Centre for Social and Economic Modelling (NATSEM) uses the poverty lines to estimate pov
PROOFSThe National Centre for Social and Economic Modelling (NATSEM) uses the poverty lines to estimate pov
ws that there are relatively high poverty rates of 11.8 per cent among all Australians
PROOFSws that there are relatively high poverty rates of 11.8 per cent among all Australians
and children. This means that a surprisingly large proportion of the population cannot enjoy even austere
PROOFSand children. This means that a surprisingly large proportion of the population cannot enjoy even austere
verty is not distributed evenly among all states. Higher rates are found in Tasmania,
PROOFSverty is not distributed evenly among all states. Higher rates are found in Tasmania,
PROOFS
PROOFS
Graph 1 — Changes in Australian poverty rates (percentage below the povertyPROOFS
Graph 1 — Changes in Australian poverty rates (percentage below the povertyline set at 50 per cent of median income), 2000–01 to 2011–12PROOFS
line set at 50 per cent of median income), 2000–01 to 2011–12
TOPIC 4 Economic ef�ciency and equity as contemporary economic issues 179
c04EconomicEf�ciencyAndEquityAsContemporaryEconomicIssues 179 4 October 2016 1:18 PM
61
40.1
3327.4
19.3 18.8 17.715.1 14.7 14 11.8
0
Une
mpl
oyed
Inco
me
supp
ort
reci
pien
ts
Sol
e pa
rent
s
Dis
able
d
Indi
geno
us
Bor
n ov
erse
as in
non-
Eng
lish
spea
king
cou
ntry
Chi
ldre
n an
dol
der
peop
le
Tasm
ania
ns
Wom
en
Livi
ng o
utsi
deca
pita
l cit
ies
All
Aus
tral
ians
10
20
30
40
50
60
70
Pov
erty
rat
e (p
erce
ntag
e)
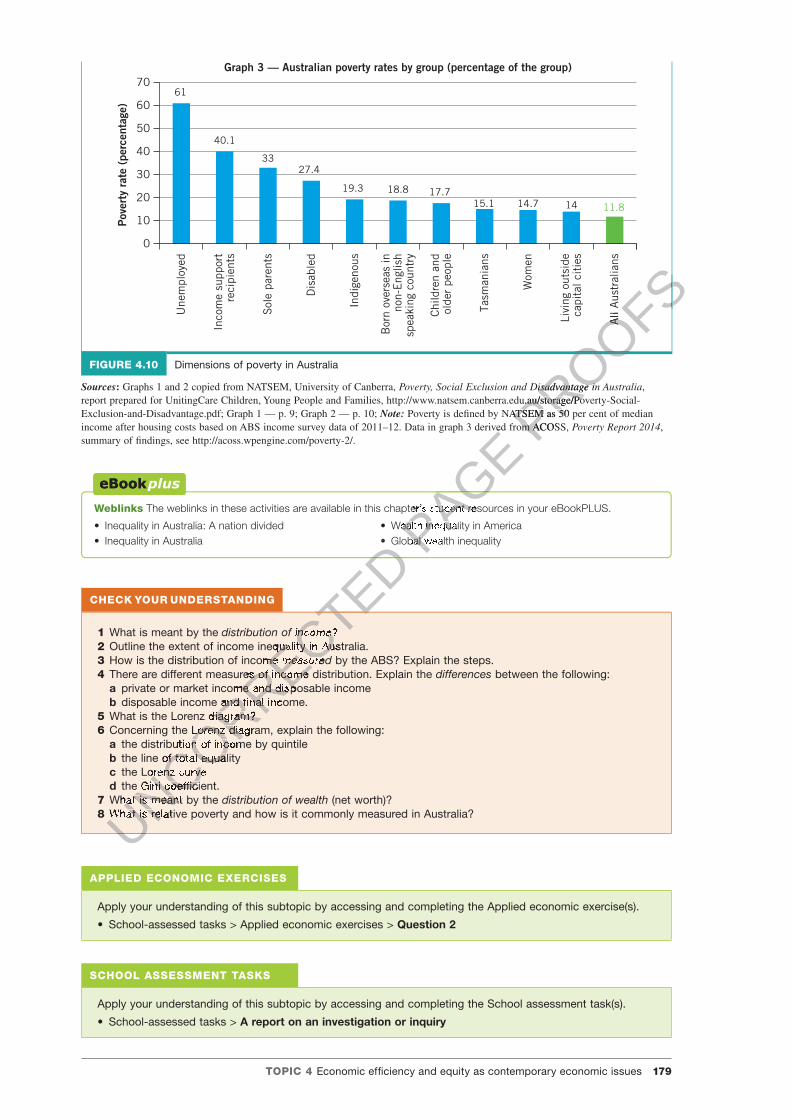
Graph 3 — Australian poverty rates by group (percentage of the group)
FIGURE 4.10 Dimensions of poverty in Australia
Sources: Graphs 1 and 2 copied from NATSEM, University of Canberra, Poverty, Social Exclusion and Disadvantage in Australia, report prepared for UnitingCare Children, Young People and Families, http://www.natsem.canberra.edu.au/storage/Poverty-Social-Exclusion-and-Disadvantage.pdf; Graph 1 — p. 9; Graph 2 — p. 10; Note: Poverty is de�ned by NATSEM as 50 per cent of median income after housing costs based on ABS income survey data of 2011–12. Data in graph 3 derived from ACOSS, Poverty Report 2014, summary of �ndings, see http://acoss.wpengine.com/poverty-2/.
Weblinks The weblinks in these activities are available in this chapter’s student resources in your eBookPLUS.
• Inequality in Australia: A nation divided• Inequality in Australia
• Wealth inequality in America• Global wealth inequality
CHECK YOUR UNDERSTANDING
1 What is meant by the distribution of income?2 Outline the extent of income inequality in Australia.3 How is the distribution of income measured by the ABS? Explain the steps.4 There are different measures of income distribution. Explain the differences between the following:
a private or market income and disposable incomeb disposable income and �nal income.
5 What is the Lorenz diagram?6 Concerning the Lorenz diagram, explain the following:
a the distribution of income by quintileb the line of total equalityc the Lorenz curved the Gini coef�cient.
7 What is meant by the distribution of wealth (net worth)?8 What is relative poverty and how is it commonly measured in Australia?
APPLIED ECONOMIC EXERCISES
Apply your understanding of this subtopic by accessing and completing the Applied economic exercise(s).
• School-assessed tasks > Applied economic exercises > Question 2
SCHOOL ASSESSMENT TASKS
Apply your understanding of this subtopic by accessing and completing the School assessment task(s).
• School-assessed tasks > A report on an investigation or inquiry
UNCORRECTED
UNCORRECTED •
UNCORRECTED • Global wealth inequality
UNCORRECTED Global wealth inequality
UNCORRECTED
UNCORRECTED
UNCORRECTED distribution of income
UNCORRECTED distribution of income?
UNCORRECTED ?
Outline the extent of income inequality in Australia.
UNCORRECTED Outline the extent of income inequality in Australia.How is the distribution of income
UNCORRECTED
How is the distribution of income measured
UNCORRECTED
measurede are different measures of income distribution. Explain the
UNCORRECTED
e are different measures of income distribution. Explain the private or market income and disposable income
UNCORRECTED
private or market income and disposable incomedisposable income and �nal income.
UNCORRECTED
disposable income and �nal income.enz diagram?
UNCORRECTED
enz diagram?ning the Lorenz diagram, explain the following:
UNCORRECTED
ning the Lorenz diagram, explain the following:the distribution of income by quintile
UNCORRECTED
the distribution of income by quintilethe line of total equality
UNCORRECTED
the line of total equalitythe Lor
UNCORRECTED
the Lor
UNCORRECTED
UNCORRECTED
UNCORRECTED
UNCORRECTED
enz curve
UNCORRECTED
enz curvethe Gini coef
UNCORRECTED
the Gini coef�cient.
UNCORRECTED
�cient.the Gini coef�cient.the Gini coef
UNCORRECTED
the Gini coef�cient.the Gini coefWhat is meant by the
UNCORRECTED
What is meant by the What is rUNCORRECTED
What is relative poverty and how is it commonly measured in Australia?UNCORRECTED
elative poverty and how is it commonly measured in Australia?
PAGE income after housing costs based on ABS income survey data of 2011–12. Data in graph 3 derived from ACOSS,
PAGE income after housing costs based on ABS income survey data of 2011–12. Data in graph 3 derived from ACOSS,
PAGE The weblinks in these activities are available in this chapter’s student resources in your eBookPLUS.
PAGE The weblinks in these activities are available in this chapter’s student resources in your eBookPLUS.
Wealth inequality in AmericaPAGE Wealth inequality in AmericaGlobal wealth inequalityPAGE
Global wealth inequalityPAGE PROOFS
PROOFS
PROOFS
All
Aus
tral
ians
PROOFS
All
Aus
tral
ians
Poverty, Social Exclusion and Disadvantage in Australia
PROOFSPoverty, Social Exclusion and Disadvantage in Australia
report prepared for UnitingCare Children, Young People and Families, http://www.natsem.canberra.edu.au/storage/Poverty-Social-
PROOFS
report prepared for UnitingCare Children, Young People and Families, http://www.natsem.canberra.edu.au/storage/Poverty-Social- Poverty is de�ned by NATSEM as 50 per cent of median PROOFS
Poverty is de�ned by NATSEM as 50 per cent of median income after housing costs based on ABS income survey data of 2011–12. Data in graph 3 derived from ACOSS, PROOFS
income after housing costs based on ABS income survey data of 2011–12. Data in graph 3 derived from ACOSS,
180 Economics Down Under 1
c04EconomicEf�ciencyAndEquityAsContemporaryEconomicIssues 180 4 October 2016 1:18 PM
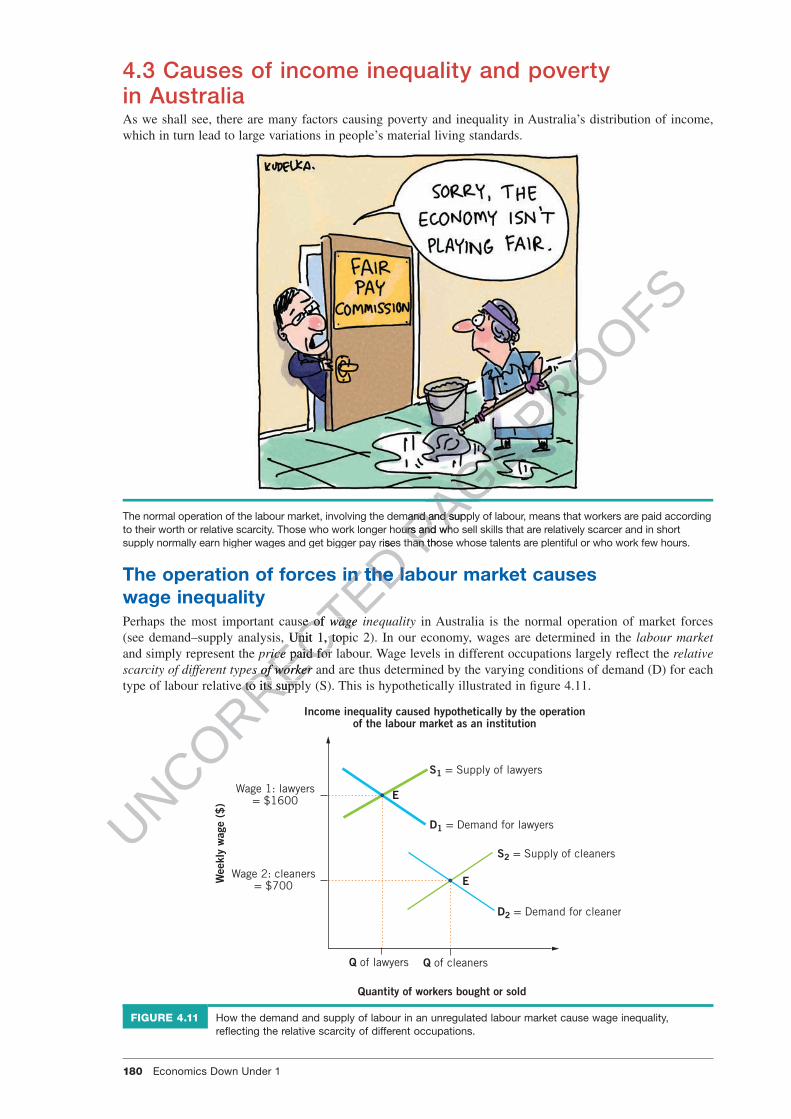
4.3 Causes of income inequality and poverty in AustraliaAs we shall see, there are many factors causing poverty and inequality in Australia’s distribution of income, which in turn lead to large variations in people’s material living standards.
The normal operation of the labour market, involving the demand and supply of labour, means that workers are paid according to their worth or relative scarcity. Those who work longer hours and who sell skills that are relatively scarcer and in short supply normally earn higher wages and get bigger pay rises than those whose talents are plentiful or who work few hours.
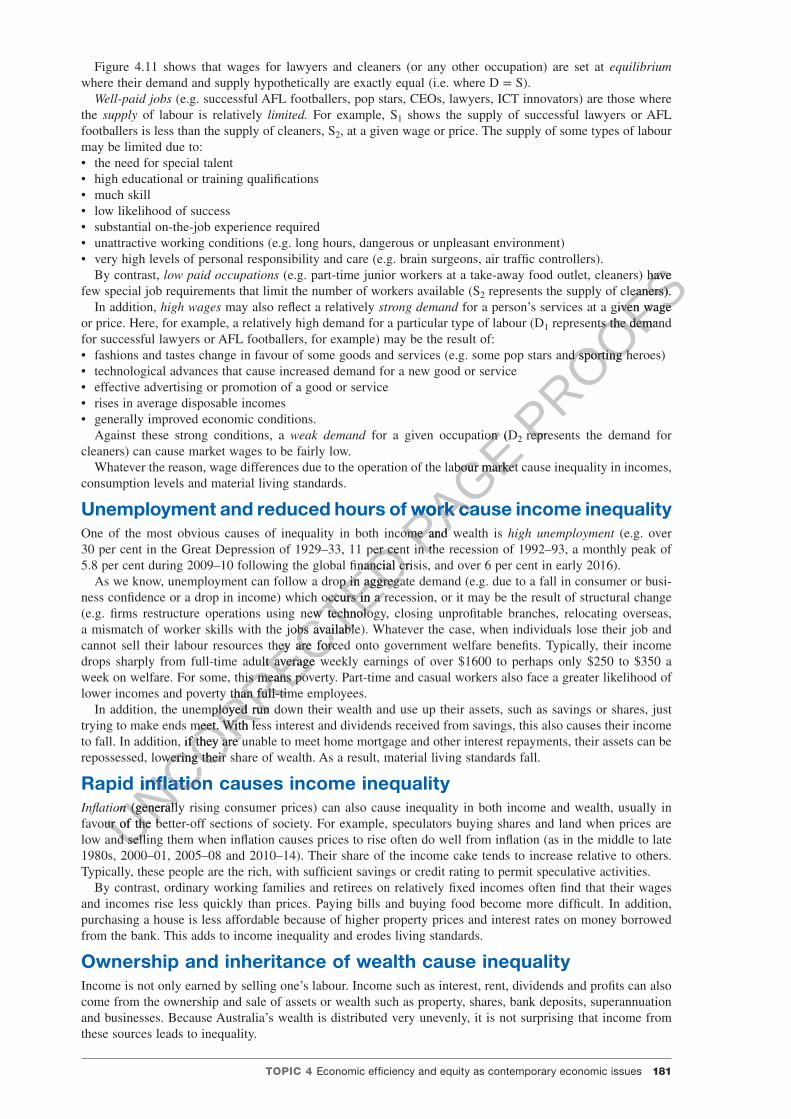
The operation of forces in the labour market causes wage inequalityPerhaps the most important cause of wage inequality in Australia is the normal operation of market forces (see demand–supply analysis, Unit 1, topic 2). In our economy, wages are determined in the labour market and simply represent the price paid for labour. Wage levels in different occupations largely re�ect the relative scarcity of different types of worker and are thus determined by the varying conditions of demand (D) for each type of labour relative to its supply (S). This is hypothetically illustrated in �gure 4.11.
Wee
kly
wag
e ($
)
Q of cleanersQ of lawyers
S1 = Supply of lawyers
Wage 1: lawyers= $1600
Wage 2: cleaners= $700
E
E
S2 = Supply of cleaners
D2 = Demand for cleaner
D1 = Demand for lawyers
Quantity of workers bought or sold
Income inequality caused hypothetically by the operationof the labour market as an institution
FIGURE 4.11 How the demand and supply of labour in an unregulated labour market cause wage inequality, re�ecting the relative scarcity of different occupations.
UNCORRECTED supply normally earn higher wages and get bigger pay rises than those whose talents are plentiful or who work few hours.
UNCORRECTED supply normally earn higher wages and get bigger pay rises than those whose talents are plentiful or who work few hours.
The operation of forces in the labour market causes
UNCORRECTED The operation of forces in the labour market causes
Perhaps the most important cause of
UNCORRECTED Perhaps the most important cause of wage inequality
UNCORRECTED wage inequality
(see demand–supply analysis, Unit 1, topic 2). In our economy, wages are determined in the
UNCORRECTED (see demand–supply analysis, Unit 1, topic 2). In our economy, wages are determined in the
UNCORRECTED
price
UNCORRECTED
price paid for labour. Wage levels in different occupations largely re�ect the
UNCORRECTED
paid for labour. Wage levels in different occupations largely re�ect the scarcity of different types of worker
UNCORRECTED
scarcity of different types of worker and are thus determined by the varying conditions of demand (D) for each
UNCORRECTED
and are thus determined by the varying conditions of demand (D) for each scarcity of different types of worker and are thus determined by the varying conditions of demand (D) for each scarcity of different types of worker
UNCORRECTED
scarcity of different types of worker and are thus determined by the varying conditions of demand (D) for each scarcity of different types of worker
UNCORRECTED
type of labour relative to its supply (S). This is hypothetically illustrated in �gure 4.11.
UNCORRECTED
type of labour relative to its supply (S). This is hypothetically illustrated in �gure 4.11.
PAGE
PAGE
PAGE The normal operation of the labour market, involving the demand and supply of labour, means that workers are paid according
PAGE The normal operation of the labour market, involving the demand and supply of labour, means that workers are paid according to their worth or relative scarcity. Those who work longer hours and who sell skills that are relatively scarcer and in short PAGE to their worth or relative scarcity. Those who work longer hours and who sell skills that are relatively scarcer and in short supply normally earn higher wages and get bigger pay rises than those whose talents are plentiful or who work few hours.PAGE
supply normally earn higher wages and get bigger pay rises than those whose talents are plentiful or who work few hours.
PROOFS
PROOFS
TOPIC 4 Economic ef�ciency and equity as contemporary economic issues 181
c04EconomicEf�ciencyAndEquityAsContemporaryEconomicIssues 181 4 October 2016 1:18 PM
Figure 4.11 shows that wages for lawyers and cleaners (or any other occupation) are set at equilibrium where their demand and supply hypothetically are exactly equal (i.e. where D = S).
Well-paid jobs (e.g. successful AFL footballers, pop stars, CEOs, lawyers, ICT innovators) are those where the supply of labour is relatively limited. For example, S1 shows the supply of successful lawyers or AFL footballers is less than the supply of cleaners, S2, at a given wage or price. The supply of some types of labour may be limited due to: • the need for special talent • high educational or training quali�cations • much skill • low likelihood of success • substantial on-the-job experience required • unattractive working conditions (e.g. long hours, dangerous or unpleasant environment) • very high levels of personal responsibility and care (e.g. brain surgeons, air traf�c controllers).
By contrast, low paid occupations (e.g. part-time junior workers at a take-away food outlet, cleaners) have few special job requirements that limit the number of workers available (S2 represents the supply of cleaners).
In addition, high wages may also re�ect a relatively strong demand for a person’s services at a given wage or price. Here, for example, a relatively high demand for a particular type of labour (D1 represents the demand for successful lawyers or AFL footballers, for example) may be the result of: • fashions and tastes change in favour of some goods and services (e.g. some pop stars and sporting heroes) • technological advances that cause increased demand for a new good or service • effective advertising or promotion of a good or service • rises in average disposable incomes • generally improved economic conditions.
Against these strong conditions, a weak demand for a given occupation (D2 represents the demand for cleaners) can cause market wages to be fairly low.
Whatever the reason, wage differences due to the operation of the labour market cause inequality in incomes, consumption levels and material living standards.
Unemployment and reduced hours of work cause income inequalityOne of the most obvious causes of inequality in both income and wealth is high unemployment (e.g. over 30 per cent in the Great Depression of 1929–33, 11 per cent in the recession of 1992–93, a monthly peak of 5.8 per cent during 2009–10 following the global �nancial crisis, and over 6 per cent in early 2016).
As we know, unemployment can follow a drop in aggregate demand (e.g. due to a fall in consumer or busi-ness con�dence or a drop in income) which occurs in a recession, or it may be the result of structural change (e.g. �rms restructure operations using new technology, closing unpro�table branches, relocating overseas, a mismatch of worker skills with the jobs available). Whatever the case, when individuals lose their job and cannot sell their labour resources they are forced onto government welfare bene�ts. Typically, their income drops sharply from full-time adult average weekly earnings of over $1600 to perhaps only $250 to $350 a week on welfare. For some, this means poverty. Part-time and casual workers also face a greater likelihood of lower incomes and poverty than full-time employees.
In addition, the unemployed run down their wealth and use up their assets, such as savings or shares, just trying to make ends meet. With less interest and dividends received from savings, this also causes their income to fall. In addition, if they are unable to meet home mortgage and other interest repayments, their assets can be repossessed, lowering their share of wealth. As a result, material living standards fall.
Rapid in�ation causes income inequalityIn�ation (generally rising consumer prices) can also cause inequality in both income and wealth, usually in favour of the better-off sections of society. For example, speculators buying shares and land when prices are low and selling them when in�ation causes prices to rise often do well from in�ation (as in the middle to late 1980s, 2000–01, 2005–08 and 2010–14). Their share of the income cake tends to increase relative to others. Typically, these people are the rich, with suf�cient savings or credit rating to permit speculative activities.
By contrast, ordinary working families and retirees on relatively �xed incomes often �nd that their wages and incomes rise less quickly than prices. Paying bills and buying food become more dif�cult. In addition, purchasing a house is less affordable because of higher property prices and interest rates on money borrowed from the bank. This adds to income inequality and erodes living standards.
Ownership and inheritance of wealth cause inequalityIncome is not only earned by selling one’s labour. Income such as interest, rent, dividends and pro�ts can also come from the ownership and sale of assets or wealth such as property, shares, bank deposits, superannuation and businesses. Because Australia’s wealth is distributed very unevenly, it is not surprising that income from these sources leads to inequality.
UNCORRECTED One of the most obvious causes of inequality in both income and wealth is
UNCORRECTED One of the most obvious causes of inequality in both income and wealth is 30 per cent in the Great Depression of 1929–33, 11 per cent in the recession of 1992–93, a monthly peak of
UNCORRECTED 30 per cent in the Great Depression of 1929–33, 11 per cent in the recession of 1992–93, a monthly peak of 5.8 per cent during 2009–10 following the global �nancial crisis, and over 6 per cent in early 2016).
UNCORRECTED 5.8 per cent during 2009–10 following the global �nancial crisis, and over 6 per cent in early 2016).As we know, unemployment can follow a drop in aggregate demand (e.g. due to a fall in consumer or busi
UNCORRECTED As we know, unemployment can follow a drop in aggregate demand (e.g. due to a fall in consumer or busi
ness con�dence or a drop in income) which occurs in a recession, or it may be the result of structural change
UNCORRECTED ness con�dence or a drop in income) which occurs in a recession, or it may be the result of structural change (e.g. �rms restructure operations using new technology, closing unpro�table branches, relocating overseas,
UNCORRECTED (e.g. �rms restructure operations using new technology, closing unpro�table branches, relocating overseas, a mismatch of worker skills with the jobs available). Whatever the case, when individuals lose their job and
UNCORRECTED a mismatch of worker skills with the jobs available). Whatever the case, when individuals lose their job and
UNCORRECTED cannot sell their labour resources they are forced onto government welfare bene�ts. Typically, their income
UNCORRECTED cannot sell their labour resources they are forced onto government welfare bene�ts. Typically, their income drops sharply from full-time adult average weekly earnings of over $1600 to perhaps only $250 to $350 a
UNCORRECTED
drops sharply from full-time adult average weekly earnings of over $1600 to perhaps only $250 to $350 a week on welfare. For some, this means poverty. Part-time and casual workers also face a greater likelihood of
UNCORRECTED
week on welfare. For some, this means poverty. Part-time and casual workers also face a greater likelihood of lower incomes and poverty than full-time employees.
UNCORRECTED
lower incomes and poverty than full-time employees.In addition, the unemployed run down their wealth and use up their assets, such as savings or shares, just
UNCORRECTED
In addition, the unemployed run down their wealth and use up their assets, such as savings or shares, just trying to make ends meet. With less interest and dividends received from savings, this also causes their income
UNCORRECTED
trying to make ends meet. With less interest and dividends received from savings, this also causes their income to fall. In addition, if they are unable to meet home mortgage and other interest repayments, their assets can be
UNCORRECTED
to fall. In addition, if they are unable to meet home mortgage and other interest repayments, their assets can be repossessed, lowering their share of wealth. As a result, material living standards fall.
UNCORRECTED
repossessed, lowering their share of wealth. As a result, material living standards fall.
UNCORRECTED
Rapid in�ation causes income inequality
UNCORRECTED
Rapid in�ation causes income inequalityIn�ation
UNCORRECTED
In�ation (generally rising consumer prices) can also cause inequality in both income and wealth, usually in
UNCORRECTED
(generally rising consumer prices) can also cause inequality in both income and wealth, usually in favour of the better-off sections of society. For example, speculators buying shares and land when prices are UNCORRECTED
favour of the better-off sections of society. For example, speculators buying shares and land when prices are UNCORRECTED
low and selling them when in�ation causes prices to rise often do well from in�ation (as in the middle to late UNCORRECTED
low and selling them when in�ation causes prices to rise often do well from in�ation (as in the middle to late
PAGE for a given occupation (D
PAGE for a given occupation (D
Whatever the reason, wage differences due to the operation of the labour market cause inequality in incomes,
PAGE Whatever the reason, wage differences due to the operation of the labour market cause inequality in incomes,
Unemployment and reduced hours of work cause income inequality
PAGE Unemployment and reduced hours of work cause income inequalityOne of the most obvious causes of inequality in both income and wealth is PAGE One of the most obvious causes of inequality in both income and wealth is 30 per cent in the Great Depression of 1929–33, 11 per cent in the recession of 1992–93, a monthly peak of PAGE
30 per cent in the Great Depression of 1929–33, 11 per cent in the recession of 1992–93, a monthly peak of
PROOFS (e.g. part-time junior workers at a take-away food outlet, cleaners) have
PROOFS (e.g. part-time junior workers at a take-away food outlet, cleaners) have
represents the supply of cleaners).
PROOFS represents the supply of cleaners). for a person’s services at a given wage
PROOFS for a person’s services at a given wage represents the demand
PROOFS represents the demand
ashions and tastes change in favour of some goods and services (e.g. some pop stars and sporting heroes)
PROOFSashions and tastes change in favour of some goods and services (e.g. some pop stars and sporting heroes)
represents the demand for PROOFS
represents the demand for
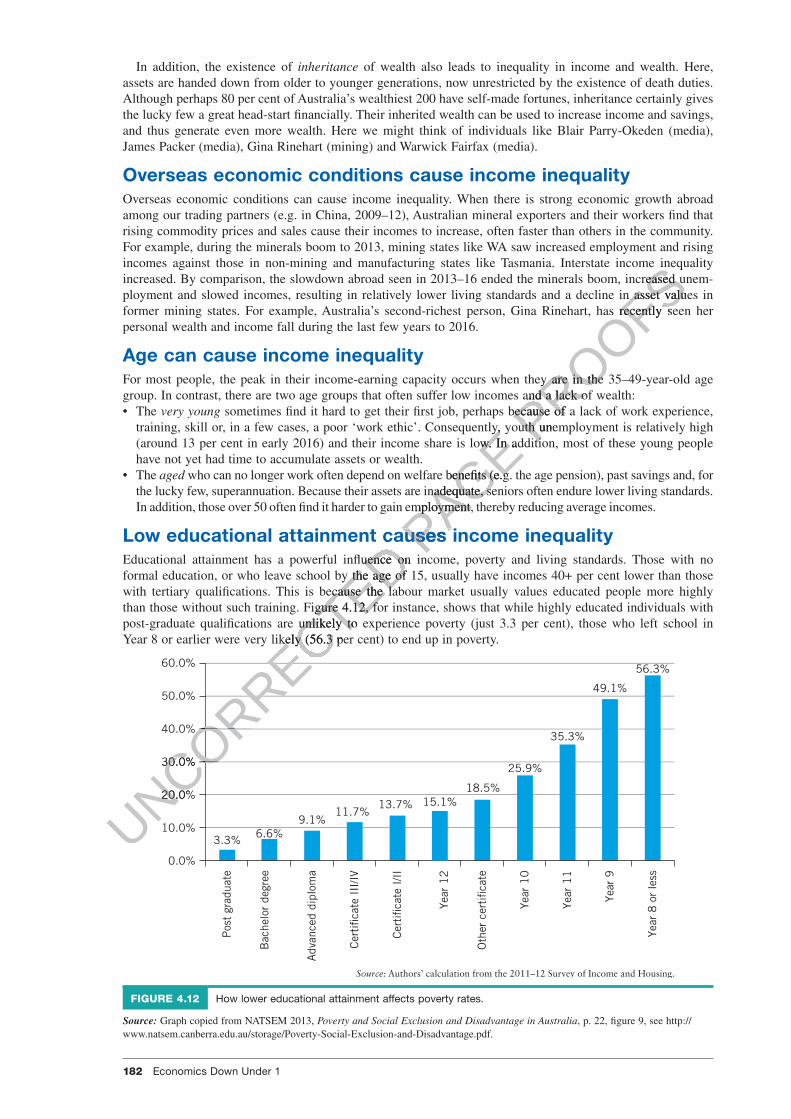
182 Economics Down Under 1
c04EconomicEf�ciencyAndEquityAsContemporaryEconomicIssues 182 4 October 2016 1:18 PM
In addition, the existence of inheritance of wealth also leads to inequality in income and wealth. Here, assets are handed down from older to younger generations, now unrestricted by the existence of death duties. Although perhaps 80 per cent of Australia’s wealthiest 200 have self-made fortunes, inheritance certainly gives the lucky few a great head-start �nancially. Their inherited wealth can be used to increase income and savings, and thus generate even more wealth. Here we might think of individuals like Blair Parry-Okeden (media), James Packer (media), Gina Rinehart (mining) and Warwick Fairfax (media).
Overseas economic conditions cause income inequalityOverseas economic conditions can cause income inequality. When there is strong economic growth abroad among our trading partners (e.g. in China, 2009–12), Australian mineral exporters and their workers �nd that rising commodity prices and sales cause their incomes to increase, often faster than others in the community. For example, during the minerals boom to 2013, mining states like WA saw increased employment and rising incomes against those in non-mining and manufacturing states like Tasmania. Interstate income inequality increased. By comparison, the slowdown abroad seen in 2013–16 ended the minerals boom, increased unem-ployment and slowed incomes, resulting in relatively lower living standards and a decline in asset values in former mining states. For example, Australia’s second-richest person, Gina Rinehart, has recently seen her personal wealth and income fall during the last few years to 2016.
Age can cause income inequalityFor most people, the peak in their income-earning capacity occurs when they are in the 35–49-year-old age group. In contrast, there are two age groups that often suffer low incomes and a lack of wealth: • The very young sometimes �nd it hard to get their �rst job, perhaps because of a lack of work experience,
training, skill or, in a few cases, a poor ‘work ethic’. Consequently, youth unemployment is relatively high (around 13 per cent in early 2016) and their income share is low. In addition, most of these young people have not yet had time to accumulate assets or wealth.
• The aged who can no longer work often depend on welfare bene�ts (e.g. the age pension), past savings and, for the lucky few, superannuation. Because their assets are inadequate, seniors often endure lower living standards. In addition, those over 50 often �nd it harder to gain employment, thereby reducing average incomes.
Low educational attainment causes income inequalityEducational attainment has a powerful in�uence on income, poverty and living standards. Those with no formal education, or who leave school by the age of 15, usually have incomes 40+ per cent lower than those with tertiary quali�cations. This is because the labour market usually values educated people more highly than those without such training. Figure 4.12, for instance, shows that while highly educated individuals with post-graduate quali�cations are unlikely to experience poverty (just 3.3 per cent), those who left school in Year 8 or earlier were very likely (56.3 per cent) to end up in poverty.
60.0%
50.0%
40.0%
30.0%
20.0%
10.0%3.3% 6.6%
9.1%11.7%
13.7%18.5%
35.3%
49.1%
56.3%
0.0%
Source: Authors’ calculation from the 2011–12 Survey of Income and Housing.
Pos
t gr
adua
te
Bac
helo
r de
gree
Adv
ance
d di
plom
a
Cer
ti�c
ate
III/
IV
Cer
ti�c
ate
I/II
Oth
er c
erti
�cat
e
15.1%
Year
12
Year
11
25.9%
Year
10
Year
9
Year
8 o
r le
ss
FIGURE 4.12 How lower educational attainment affects poverty rates.
Source: Graph copied from NATSEM 2013, Poverty and Social Exclusion and Disadvantage in Australia, p. 22, �gure 9, see http://www.natsem.canberra.edu.au/storage/Poverty-Social-Exclusion-and-Disadvantage.pdf.
UNCORRECTED Low educational attainment causes income inequality
UNCORRECTED Low educational attainment causes income inequalityEducational attainment has a powerful in�uence on income, poverty and living standards. Those with no
UNCORRECTED Educational attainment has a powerful in�uence on income, poverty and living standards. Those with no formal education, or who leave school by the age of 15, usually have incomes 40+ per cent lower than those
UNCORRECTED formal education, or who leave school by the age of 15, usually have incomes 40+ per cent lower than those with tertiary quali�cations. This is because the labour market usually values educated people more highly
UNCORRECTED with tertiary quali�cations. This is because the labour market usually values educated people more highly than those without such training. Figure 4.12, for instance, shows that while highly educated individuals with
UNCORRECTED than those without such training. Figure 4.12, for instance, shows that while highly educated individuals with post-graduate quali�cations are unlikely to experience poverty (just 3.3 per cent), those who left school in
UNCORRECTED post-graduate quali�cations are unlikely to experience poverty (just 3.3 per cent), those who left school in Year 8 or earlier were very likely (56.3 per cent) to end up in poverty.
UNCORRECTED Year 8 or earlier were very likely (56.3 per cent) to end up in poverty.
UNCORRECTED
UNCORRECTED
UNCORRECTED
UNCORRECTED
UNCORRECTED
UNCORRECTED
UNCORRECTED
UNCORRECTED
UNCORRECTED
UNCORRECTED
UNCORRECTED
UNCORRECTED
40.0%
UNCORRECTED
40.0%
30.0%
UNCORRECTED
30.0%
20.0%
UNCORRECTED
20.0%
PAGE training, skill or, in a few cases, a poor ‘work ethic’. Consequently, youth unemployment is relatively high
PAGE training, skill or, in a few cases, a poor ‘work ethic’. Consequently, youth unemployment is relatively high (around 13 per cent in early 2016) and their income share is low. In addition, most of these young people
PAGE (around 13 per cent in early 2016) and their income share is low. In addition, most of these young people
who can no longer work often depend on welfare bene�ts (e.g. the age pension), past savings and, for
PAGE who can no longer work often depend on welfare bene�ts (e.g. the age pension), past savings and, for
the lucky few, superannuation. Because their assets are inadequate, seniors often endure lower living standards.
PAGE the lucky few, superannuation. Because their assets are inadequate, seniors often endure lower living standards. In addition, those over 50 often �nd it harder to gain employment, thereby reducing average incomes.
PAGE In addition, those over 50 often �nd it harder to gain employment, thereby reducing average incomes.
Low educational attainment causes income inequalityPAGE
Low educational attainment causes income inequality
PROOFSincomes against those in non-mining and manufacturing states like Tasmania. Interstate income inequality
PROOFSincomes against those in non-mining and manufacturing states like Tasmania. Interstate income inequality increased. By comparison, the slowdown abroad seen in 2013–16 ended the minerals boom, increased unem
PROOFSincreased. By comparison, the slowdown abroad seen in 2013–16 ended the minerals boom, increased unemployment and slowed incomes, resulting in relatively lower living standards and a decline in asset values in
PROOFSployment and slowed incomes, resulting in relatively lower living standards and a decline in asset values in former mining states. For example, Australia’s second-richest person, Gina Rinehart, has recently seen her
PROOFSformer mining states. For example, Australia’s second-richest person, Gina Rinehart, has recently seen her
For most people, the peak in their income-earning capacity occurs when they are in the 35–49-year-old age
PROOFSFor most people, the peak in their income-earning capacity occurs when they are in the 35–49-year-old age group. In contrast, there are two age groups that often suffer low incomes and a lack of wealth:
PROOFSgroup. In contrast, there are two age groups that often suffer low incomes and a lack of wealth:
sometimes �nd it hard to get their �rst job, perhaps because of a lack of work experience, PROOFS
sometimes �nd it hard to get their �rst job, perhaps because of a lack of work experience, training, skill or, in a few cases, a poor ‘work ethic’. Consequently, youth unemployment is relatively high PROOFS
training, skill or, in a few cases, a poor ‘work ethic’. Consequently, youth unemployment is relatively high (around 13 per cent in early 2016) and their income share is low. In addition, most of these young people PROOFS
(around 13 per cent in early 2016) and their income share is low. In addition, most of these young people
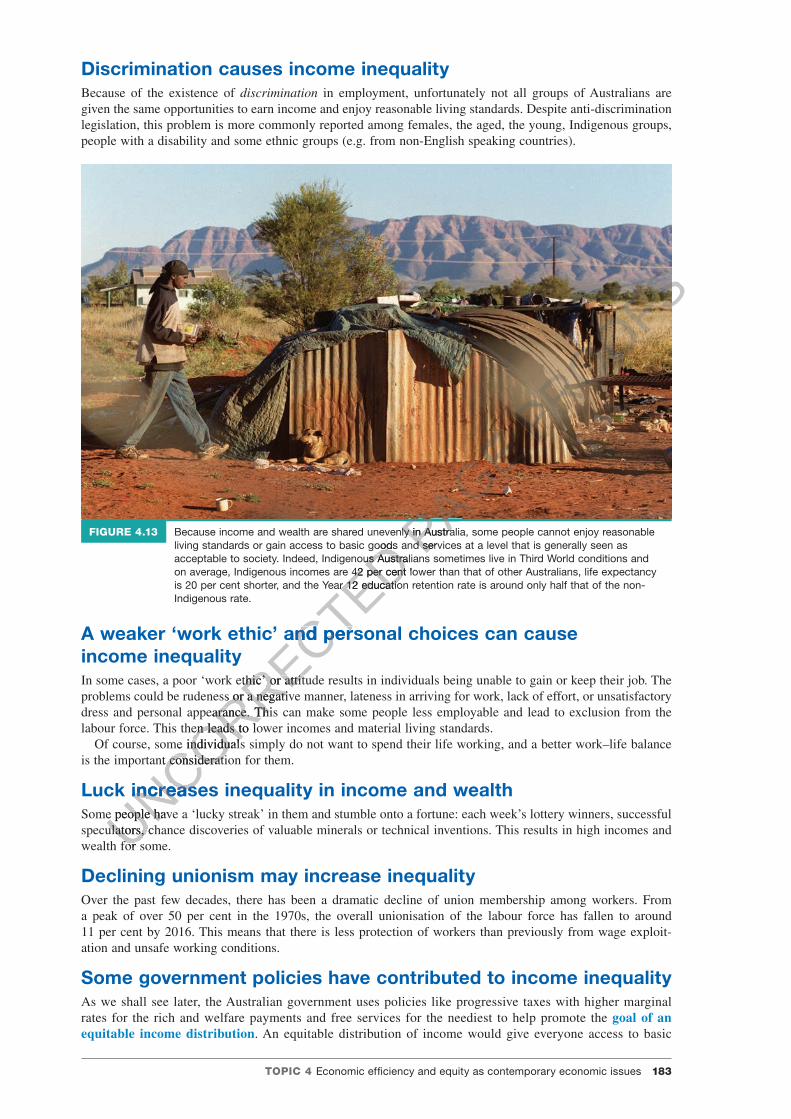
TOPIC 4 Economic ef�ciency and equity as contemporary economic issues 183
c04EconomicEf�ciencyAndEquityAsContemporaryEconomicIssues 183 4 October 2016 1:18 PM
Discrimination causes income inequalityBecause of the existence of discrimination in employment, unfortunately not all groups of Australians are given the same opportunities to earn income and enjoy reasonable living standards. Despite anti-discrimination legislation, this problem is more commonly reported among females, the aged, the young, Indigenous groups, people with a disability and some ethnic groups (e.g. from non-English speaking countries).
FIGURE 4.13 Because income and wealth are shared unevenly in Australia, some people cannot enjoy reasonable living standards or gain access to basic goods and services at a level that is generally seen as acceptable to society. Indeed, Indigenous Australians sometimes live in Third World conditions and on average, Indigenous incomes are 42 per cent lower than that of other Australians, life expectancy is 20 per cent shorter, and the Year 12 education retention rate is around only half that of the non-Indigenous rate.
A weaker ‘work ethic’ and personal choices can cause income inequalityIn some cases, a poor ‘work ethic’ or attitude results in individuals being unable to gain or keep their job. The problems could be rudeness or a negative manner, lateness in arriving for work, lack of effort, or unsatisfactory dress and personal appearance. This can make some people less employable and lead to exclusion from the labour force. This then leads to lower incomes and material living standards.
Of course, some individuals simply do not want to spend their life working, and a better work–life balance is the important consideration for them.
Luck increases inequality in income and wealthSome people have a ‘lucky streak’ in them and stumble onto a fortune: each week’s lottery winners, successful speculators, chance discoveries of valuable minerals or technical inventions. This results in high incomes and wealth for some.
Declining unionism may increase inequalityOver the past few decades, there has been a dramatic decline of union membership among workers. From a peak of over 50 per cent in the 1970s, the overall unionisation of the labour force has fallen to around 11 per cent by 2016. This means that there is less protection of workers than previously from wage exploit-ation and unsafe working conditions.
Some government policies have contributed to income inequalityAs we shall see later, the Australian government uses policies like progressive taxes with higher marginal rates for the rich and welfare payments and free services for the neediest to help promote the goal of an equitable income distribution. An equitable distribution of income would give everyone access to basic
UNCORRECTED living standards or gain access to basic goods and services at a level that is generally seen as
UNCORRECTED living standards or gain access to basic goods and services at a level that is generally seen as acceptable to society. Indeed, Indigenous Australians sometimes live in Third World conditions and
UNCORRECTED acceptable to society. Indeed, Indigenous Australians sometimes live in Third World conditions and on average, Indigenous incomes are 42 per cent lower than that of other Australians, life expectancy
UNCORRECTED on average, Indigenous incomes are 42 per cent lower than that of other Australians, life expectancy is 20 per cent shorter, and the Year 12 education retention rate is around only half that of the non-
UNCORRECTED is 20 per cent shorter, and the Year 12 education retention rate is around only half that of the non-
A weaker ‘work ethic’ and personal choices can cause
UNCORRECTED A weaker ‘work ethic’ and personal choices can cause
In some cases, a poor ‘work ethic’ or attitude results in individuals being unable to gain or keep their job. The
UNCORRECTED
In some cases, a poor ‘work ethic’ or attitude results in individuals being unable to gain or keep their job. The problems could be rudeness or a negative manner, lateness in arriving for work, lack of effort, or unsatisfactory
UNCORRECTED
problems could be rudeness or a negative manner, lateness in arriving for work, lack of effort, or unsatisfactory dress and personal appearance. This can make some people less employable and lead to exclusion from the
UNCORRECTED
dress and personal appearance. This can make some people less employable and lead to exclusion from the labour force. This then leads to lower incomes and material living standards.
UNCORRECTED
labour force. This then leads to lower incomes and material living standards.Of course, some individuals simply do not want to spend their life working, and a better work–life balance
UNCORRECTED
Of course, some individuals simply do not want to spend their life working, and a better work–life balance is the important consideration for them.
UNCORRECTED
is the important consideration for them.
UNCORRECTED
Luck increases inequality in income and wealth
UNCORRECTED
Luck increases inequality in income and wealthSome people have a ‘lucky streak’ in them and stumble onto a fortune: each week’s lottery winners, successful UNCORRECTED
Some people have a ‘lucky streak’ in them and stumble onto a fortune: each week’s lottery winners, successful speculators, chance discoveries of valuable minerals or technical inventions. This results in high incomes and UNCORRECTED
speculators, chance discoveries of valuable minerals or technical inventions. This results in high incomes and wealth for some.UNCORRECTED
wealth for some.
PAGE
PAGE
PAGE Because income and wealth are shared unevenly in Australia, some people cannot enjoy reasonable PAGE Because income and wealth are shared unevenly in Australia, some people cannot enjoy reasonable living standards or gain access to basic goods and services at a level that is generally seen as PAGE
living standards or gain access to basic goods and services at a level that is generally seen as
PROOFS
PROOFS
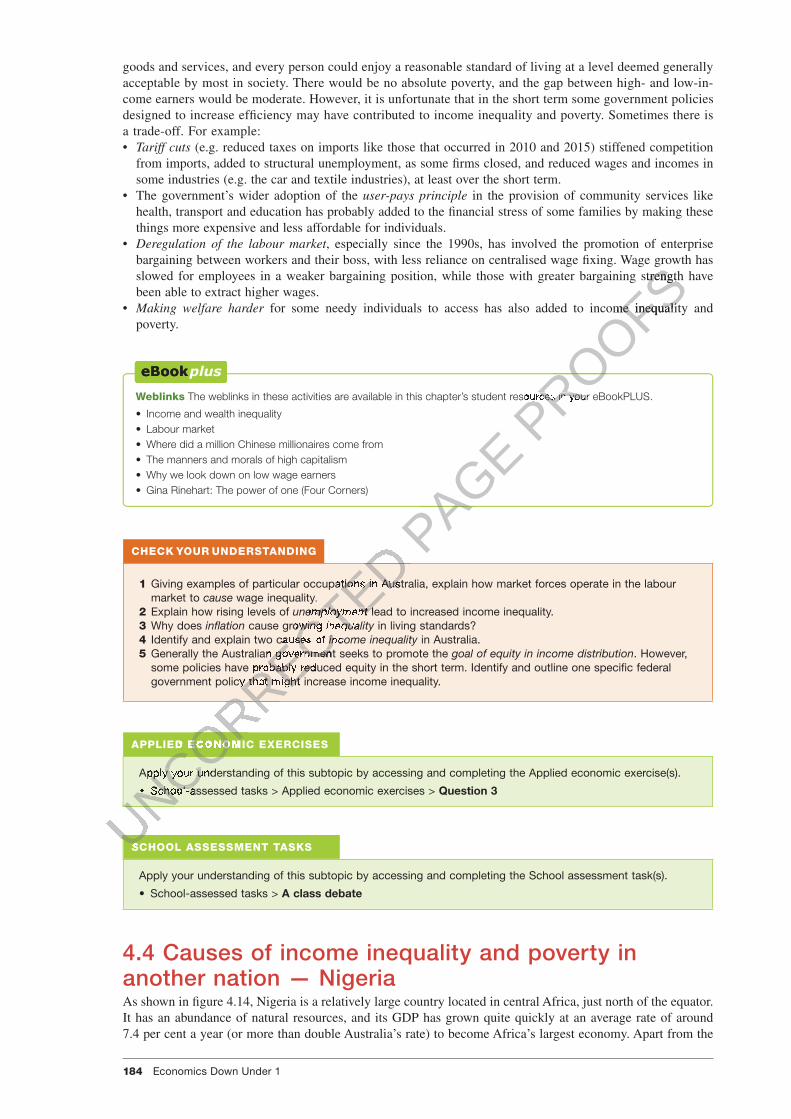
184 Economics Down Under 1
c04EconomicEf�ciencyAndEquityAsContemporaryEconomicIssues 184 4 October 2016 1:18 PM
goods and services, and every person could enjoy a reasonable standard of living at a level deemed generally acceptable by most in society. There would be no absolute poverty, and the gap between high- and low-in-come earners would be moderate. However, it is unfortunate that in the short term some government policies designed to increase ef�ciency may have contributed to income inequality and poverty. Sometimes there is a trade-off. For example: • Tariff cuts (e.g. reduced taxes on imports like those that occurred in 2010 and 2015) stiffened competition
from imports, added to structural unemployment, as some �rms closed, and reduced wages and incomes in some industries (e.g. the car and textile industries), at least over the short term.
• The government’s wider adoption of the user-pays principle in the provision of community services like health, transport and education has probably added to the �nancial stress of some families by making these things more expensive and less affordable for individuals.
• Deregulation of the labour market, especially since the 1990s, has involved the promotion of enterprise bargaining between workers and their boss, with less reliance on centralised wage �xing. Wage growth has slowed for employees in a weaker bargaining position, while those with greater bargaining strength have been able to extract higher wages.
• Making welfare harder for some needy individuals to access has also added to income inequality and poverty.
Weblinks The weblinks in these activities are available in this chapter’s student resources in your eBookPLUS.
• Income and wealth inequality• Labour market• Where did a million Chinese millionaires come from• The manners and morals of high capitalism• Why we look down on low wage earners• Gina Rinehart: The power of one (Four Corners)
CHECK YOUR UNDERSTANDING
1 Giving examples of particular occupations in Australia, explain how market forces operate in the labour market to cause wage inequality.
2 Explain how rising levels of unemployment lead to increased income inequality.3 Why does in�ation cause growing inequality in living standards?4 Identify and explain two causes of income inequality in Australia.5 Generally the Australian government seeks to promote the goal of equity in income distribution. However,
some policies have probably reduced equity in the short term. Identify and outline one speci�c federal government policy that might increase income inequality.
APPLIED ECONOMIC EXERCISES
Apply your understanding of this subtopic by accessing and completing the Applied economic exercise(s).
• School-assessed tasks > Applied economic exercises > Question 3
SCHOOL ASSESSMENT TASKS
Apply your understanding of this subtopic by accessing and completing the School assessment task(s).
• School-assessed tasks > A class debate
4.4 Causes of income inequality and poverty in another nation — NigeriaAs shown in �gure 4.14, Nigeria is a relatively large country located in central Africa, just north of the equator. It has an abundance of natural resources, and its GDP has grown quite quickly at an average rate of around 7.4 per cent a year (or more than double Australia’s rate) to become Africa’s largest economy. Apart from the
UNCORRECTED
UNCORRECTED
UNCORRECTED
UNCORRECTED Giving examples of particular occupations in Australia, explain how market for
UNCORRECTED Giving examples of particular occupations in Australia, explain how market for
unemployment
UNCORRECTED unemployment lead to increased income inequality.
UNCORRECTED lead to increased income inequality.unemployment lead to increased income inequality.unemployment
UNCORRECTED unemployment lead to increased income inequality.unemployment
cause growing
UNCORRECTED cause growing inequality
UNCORRECTED inequality
Identify and explain two causes of
UNCORRECTED Identify and explain two causes of income inequality
UNCORRECTED income inequality
Generally the Australian gover
UNCORRECTED
Generally the Australian government seeks to promote the
UNCORRECTED
nment seeks to promote the some policies have probably reduced equity in the short term. Identify and outline one speci�c federal
UNCORRECTED
some policies have probably reduced equity in the short term. Identify and outline one speci�c federal government policy that might increase income inequality.
UNCORRECTED
government policy that might increase income inequality.
UNCORRECTED
UNCORRECTED
UNCORRECTED
UNCORRECTED
UNCORRECTED
APPLIED ECONOMIC EXERCISES
UNCORRECTED
APPLIED ECONOMIC EXERCISES
Apply your understanding of this subtopic by accessing and completing the Applied economic exercise(s).
UNCORRECTED
Apply your understanding of this subtopic by accessing and completing the Applied economic exercise(s).
•
UNCORRECTED
• School-assessed tasks > Applied economic exercises >
UNCORRECTED
School-assessed tasks > Applied economic exercises >
UNCORRECTED
UNCORRECTED
SCHOOLUNCORRECTED
SCHOOL
PAGE
PAGE
PAGE PROOFS
bargaining between workers and their boss, with less reliance on centralised wage �xing. Wage growth has
PROOFSbargaining between workers and their boss, with less reliance on centralised wage �xing. Wage growth has slowed for employees in a weaker bargaining position, while those with greater bargaining strength have
PROOFSslowed for employees in a weaker bargaining position, while those with greater bargaining strength have
for some needy individuals to access has also added to income inequality and
PROOFS for some needy individuals to access has also added to income inequality and
PROOFS
The weblinks in these activities are available in this chapter’s student resources in your eBookPLUS.
PROOFS
The weblinks in these activities are available in this chapter’s student resources in your eBookPLUS.
PROOFS
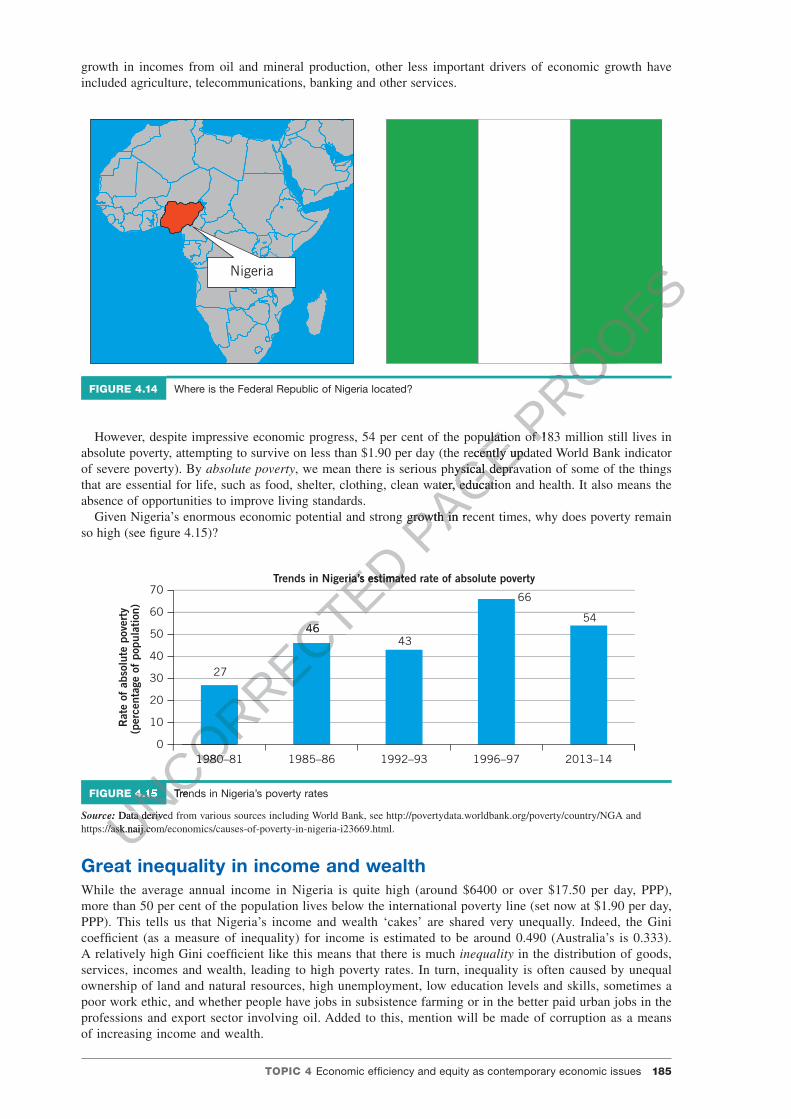
TOPIC 4 Economic ef�ciency and equity as contemporary economic issues 185
c04EconomicEf�ciencyAndEquityAsContemporaryEconomicIssues 185 4 October 2016 1:18 PM
growth in incomes from oil and mineral production, other less important drivers of economic growth have included agriculture, telecommunications, banking and other services.
Nigeria
FIGURE 4.14 Where is the Federal Republic of Nigeria located?
However, despite impressive economic progress, 54 per cent of the population of 183 million still lives in absolute poverty, attempting to survive on less than $1.90 per day (the recently updated World Bank indicator of severe poverty). By absolute poverty, we mean there is serious physical depravation of some of the things that are essential for life, such as food, shelter, clothing, clean water, education and health. It also means the absence of opportunities to improve living standards.
Given Nigeria’s enormous economic potential and strong growth in recent times, why does poverty remain so high (see �gure 4.15)?
27
4643
66
54
0
10
20
30
40
50
60
70
1980–81 1985–86 1992–93 1996–97 2013–14
Rat
e of
abs
olut
e po
vert
y(p
erce
ntag
e of
pop
ulat
ion)
Trends in Nigeria’s estimated rate of absolute poverty
FIGURE 4.15 Trends in Nigeria’s poverty rates
Source: Data derived from various sources including World Bank, see http://povertydata.worldbank.org/poverty/country/NGA and https://ask.naij.com/economics/causes-of-poverty-in-nigeria-i23669.html.
Great inequality in income and wealthWhile the average annual income in Nigeria is quite high (around $6400 or over $17.50 per day, PPP), more than 50 per cent of the population lives below the international poverty line (set now at $1.90 per day, PPP). This tells us that Nigeria’s income and wealth ‘cakes’ are shared very unequally. Indeed, the Gini coef�cient (as a measure of inequality) for income is estimated to be around 0.490 (Australia’s is 0.333). A relatively high Gini coef�cient like this means that there is much inequality in the distribution of goods, services, incomes and wealth, leading to high poverty rates. In turn, inequality is often caused by unequal ownership of land and natural resources, high unemployment, low education levels and skills, sometimes a poor work ethic, and whether people have jobs in subsistence farming or in the better paid urban jobs in the professions and export sector involving oil. Added to this, mention will be made of corruption as a means of increasing income and wealth.
UNCORRECTED
UNCORRECTED
UNCORRECTED
UNCORRECTED
UNCORRECTED
UNCORRECTED
UNCORRECTED
UNCORRECTED
UNCORRECTED
UNCORRECTED
UNCORRECTED
UNCORRECTED
UNCORRECTED
UNCORRECTED 46
UNCORRECTED 46
1980–81 1985–86 1992–93 1996–97 2013–14
UNCORRECTED
1980–81 1985–86 1992–93 1996–97 2013–14
Trends in Nigeria’s estimated rate of absolute poverty
UNCORRECTED Trends in Nigeria’s estimated rate of absolute poverty
FIGURE 4.15
UNCORRECTED
FIGURE 4.15 Trends in Nigeria’s poverty rates
UNCORRECTED
Trends in Nigeria’s poverty rates
Source: UNCORRECTED
Source: Data derived from various sources including World Bank, see http://povertydata.worldbank.org/poverty/country/NGA and UNCORRECTED
Data derived from various sources including World Bank, see http://povertydata.worldbank.org/poverty/country/NGA and UNCORRECTED
https://ask.naij.com/economics/causes-of-poverty-in-nigeria-i23669.html.UNCORRECTED
https://ask.naij.com/economics/causes-of-poverty-in-nigeria-i23669.html.
PAGE However, despite impressive economic progress, 54 per cent of the population of 183 million still lives in
PAGE However, despite impressive economic progress, 54 per cent of the population of 183 million still lives in absolute poverty, attempting to survive on less than $1.90 per day (the recently updated World Bank indicator
PAGE absolute poverty, attempting to survive on less than $1.90 per day (the recently updated World Bank indicator , we mean there is serious physical depravation of some of the things
PAGE , we mean there is serious physical depravation of some of the things
that are essential for life, such as food, shelter, clothing, clean water, education and health. It also means the
PAGE that are essential for life, such as food, shelter, clothing, clean water, education and health. It also means the
Given Nigeria’s enormous economic potential and strong growth in recent times, why does poverty remain
PAGE Given Nigeria’s enormous economic potential and strong growth in recent times, why does poverty remain
PROOFS
PROOFS
PROOFS
PROOFS
PROOFS
PROOFS
However, despite impressive economic progress, 54 per cent of the population of 183 million still lives in PROOFS
However, despite impressive economic progress, 54 per cent of the population of 183 million still lives in
186 Economics Down Under 1
c04EconomicEf�ciencyAndEquityAsContemporaryEconomicIssues 186 4 October 2016 1:18 PM
High unemployment ratesWhen individuals are unemployed, they have low or zero income. Unfortunately, unemployment rates in Nigeria are high, averaging around 24 per cent, with perhaps another 20 per cent of workers being classed as underemployed (i.e. individuals are working very few hours despite having jobs). Together, with over 44 per cent of the labour force in these two categories, the Nigerian economy is operating well inside its pro-duction possibility frontier, limiting the growth in GDP and contributing to absolute poverty and income ine-quality. To lower unemployment and poverty in Nigeria, a 2016 World Bank report estimated that 40 million new jobs would need to be created by 2030. Furthermore, female education and work participation rates are very low, contributing to depressed levels of national production, incomes and living standards.
Failure to diversify the economySince the 1980s, around 90 per cent of Nigeria’s export income (and over 80 per cent of government revenue) comes from oil whereas previously it was from agriculture. Unfortunately, an over-reliance on oil has led to the economy’s failure to generate suf�cient jobs or employment.
Low labour productivityLabour ef�ciency or productivity is usually measured by the rate of rise in GDP per hour worked. Because Nigeria’s annual productivity growth is relatively slow and has been rising by only 1.2 per cent (40 per cent lower than similar countries in the area), this also means that per capita incomes are low and increase very slowly, often failing to keep up with in�ation. Purchasing power is eroded and poverty is worsened. One cause of low productivity is the lack of adequate investment in capital resources, especially in areas like agriculture, communications, power generation, transport. Another cause is inadequate spending on health and education.
Long-term ethnic con�ict and civil unrestCon�ict between militant religious and ethnic groups has contributed to poverty by discouraging foreign and local investment in industry and infrastructure. This has slowed Nigeria’s productive capacity and con-tributed to lower incomes and poverty. In turn, poverty has aggravated civil and ethnic con�ict, creating a vicious cycle.
Corruption and political instabilityThere are reports from the United Nations Of�ce on Drugs and Crime (UNODC) and other sources, of signi�-cant political corruption in Nigeria where, apparently, power is sometimes used for private gain. So despite the rise in government revenue, especially from the extraction of oil and minerals, it seems that some of this (one estimate puts the �gure at perhaps $400 billion since independence) has been distributed among government of�cials and friends, leaving over 50 per cent of the population in poverty without basic education, clean water or adequate health care.
Weblinks The weblinks in these activities are available in this topic’s student resources tab.
• Why some countries are poor and others rich• Nigeria: Work and jobs for the giant of Africa• Can Nigeria’s booming economy lift its poorest people?
CHECK YOUR UNDERSTANDING
1 How is absolute poverty commonly measured in low-income countries like Nigeria?2 How severe is poverty in Nigeria?3 Identify and outline four important causes of poverty in Nigeria
APPLIED ECONOMIC EXERCISES
Apply your understanding of this subtopic by accessing and completing the Applied economic exercise(s).
• School-assessed tasks > Applied economic exercises > Question 4
UNCORRECTED Corruption and political instability
UNCORRECTED Corruption and political instabilityThere are reports from the United Nations Of�ce on Drugs and Crime (UNODC) and other sources, of signi�
UNCORRECTED There are reports from the United Nations Of�ce on Drugs and Crime (UNODC) and other sources, of signi�cant political corruption in Nigeria where, apparently, power is sometimes used for private gain. So despite the
UNCORRECTED cant political corruption in Nigeria where, apparently, power is sometimes used for private gain. So despite the rise in government revenue, especially from the extraction of oil and minerals, it seems that some of this (one
UNCORRECTED rise in government revenue, especially from the extraction of oil and minerals, it seems that some of this (one estimate puts the �gure at perhaps $400 billion since independence) has been distributed among government
UNCORRECTED estimate puts the �gure at perhaps $400 billion since independence) has been distributed among government of�cials and friends, leaving over 50 per cent of the population in poverty without basic education, clean water
UNCORRECTED
of�cials and friends, leaving over 50 per cent of the population in poverty without basic education, clean water or adequate health care.
UNCORRECTED
or adequate health care.
UNCORRECTED
Weblinks
UNCORRECTED
Weblinks The weblinks in these activities are available in this topic’s student resources tab.
UNCORRECTED
The weblinks in these activities are available in this topic’s student resources tab.
Why some countries are poor and others rich
UNCORRECTED
Why some countries are poor and others rich•
UNCORRECTED
• Nigeria: Work and jobs for the giant of Africa
UNCORRECTED
Nigeria: Work and jobs for the giant of Africa•
UNCORRECTED
• Can Nigeria’s booming economy lift its poorest people?
UNCORRECTED
Can Nigeria’s booming economy lift its poorest people?
UNCORRECTED
UNCORRECTED
UNCORRECTED
UNCORRECTED
UNCORRECTED
UNCORRECTED
UNCORRECTED PAGE agriculture, communications, power generation, transport. Another cause is inadequate spending on health
PAGE agriculture, communications, power generation, transport. Another cause is inadequate spending on health
Long-term ethnic con�ict and civil unrest
PAGE Long-term ethnic con�ict and civil unrestCon�ict between militant religious and ethnic groups has contributed to poverty by discouraging foreign
PAGE Con�ict between militant religious and ethnic groups has contributed to poverty by discouraging foreign and local investment in industry and infrastructure. This has slowed Nigeria’s productive capacity and con
PAGE and local investment in industry and infrastructure. This has slowed Nigeria’s productive capacity and contributed to lower incomes and poverty. In turn, poverty has aggravated civil and ethnic con�ict, creating a PAGE tributed to lower incomes and poverty. In turn, poverty has aggravated civil and ethnic con�ict, creating a
PROOFSSince the 1980s, around 90 per cent of Nigeria’s export income (and over 80 per cent of government revenue)
PROOFSSince the 1980s, around 90 per cent of Nigeria’s export income (and over 80 per cent of government revenue) comes from oil whereas previously it was from agriculture. Unfortunately, an over-reliance on oil has led to
PROOFScomes from oil whereas previously it was from agriculture. Unfortunately, an over-reliance on oil has led to
Labour ef�ciency or productivity is usually measured by the rate of rise in GDP per hour worked. Because
PROOFSLabour ef�ciency or productivity is usually measured by the rate of rise in GDP per hour worked. Because Nigeria’s annual productivity growth is relatively slow and has been rising by only 1.2 per cent (40 per cent
PROOFSNigeria’s annual productivity growth is relatively slow and has been rising by only 1.2 per cent (40 per cent lower than similar countries in the area), this also means that per capita incomes are low and increase
PROOFSlower than similar countries in the area), this also means that per capita incomes are low and increase very slowly, often failing to keep up with in�ation. Purchasing power is eroded and poverty is worsened.
PROOFSvery slowly, often failing to keep up with in�ation. Purchasing power is eroded and poverty is worsened. One cause of low productivity is the lack of adequate investment in capital resources, especially in areas like PROOFS
One cause of low productivity is the lack of adequate investment in capital resources, especially in areas like agriculture, communications, power generation, transport. Another cause is inadequate spending on health PROOFS
agriculture, communications, power generation, transport. Another cause is inadequate spending on health
TOPIC 4 Economic ef�ciency and equity as contemporary economic issues 187
c04EconomicEf�ciencyAndEquityAsContemporaryEconomicIssues 187 4 October 2016 1:18 PM
4.5 The effect of poverty on material and non-material living standardsAbsolute poverty severely damages both material and our non-material living standards:
The effect of poverty on material and non-material living standards in low-income countriesMaterial living standards ultimately re�ect an individual’s annual level of consumption and the extent to which needs and wants are satis�ed.
Clearly, in economically poor countries like Nigeria where the absolute poverty line is set at $1.90 (in international dollars or PPP), people lack suf�cient income to purchase life’s necessities. The poorest 10 per cent of households for example, consume a measly 1.8 per cent of the country’s goods and services. • Adequate food and nutrition cannot be purchased and individuals often have a low body mass index. • Because of the cost and the lack of educational facilities, few children attend school. Restricted or no access
to education causes limited employment and income opportunities and depresses productivity. • There is a lack of affordable medical treatment available for serious illnesses. Life expectancy is low, per-
haps around 50 years, and infant death rates are high. • Without much money, housing is basic and overcrowded, with an average of more than four people living in
each room. Sanitation and access to safe drinking water, are non-existent.Non-material living standards relate to the factors affecting the quality of daily life. These might include
happiness, the absence of crime and war, the existence of opportunities and experiences for cultural enrich-ment, the healthy state of the natural environment and the absence of pollution, and a long life expectancy. However, for Nigeria, the typical consequences of poverty include: • social unrest, high crime rates, violence and civil war • the sadness associated with the daily battle to survive • unhappiness because of the premature death of children and other family members due to poor health and
low life expectancy • the absence of hope and opportunities to escape the vicious cycle of poverty • environmental damage associated with the rapid growth of the oil and mining industries.
The effect of poverty on material and non-material living standards in AustraliaIn Australia, for a standard income unit of four people (i.e. one adult, working; one not working; and two dependent children), comparative poverty is de�ned as having an income below $986 per week (in March 2016). Poverty has both material and non-material effects.
Having little money leads to exclusion and limits consumption levels. It signi�cantly reduces the extent to which the material needs and wants of individuals can be met and also undermines non-material wellbeing. For instance: • Some of those in poverty will go without one or two meals a day and have insuf�cient nutritious food. Others
will be unable to pay power and gas bills and will be forced to survive winter without hot water or heating. • Obtaining affordable housing — and paying a bond and rent in advance — is a problem for those in poverty.
As a result, some individuals (including children) live on the streets or are forced to reside on the outskirts where there is no public transport, little to do and few jobs are available.
• When people look shabby, lack personal grooming, or have few skills, it is hard to gain employment. This can begin the cycle of poverty and welfare dependency. In addition, at the macroeconomic level, the exclusion of potential workers slows the economy’s productive capacity and limits future living standards.
• Children from poor families are often reluctant to go to school without a lunch, books, uniform or shoes. They cannot afford to play sport, go on excursions or camps like the others, and frequently experience bullying. The likelihood of completing VCE and especially a tertiary course is greatly reduced in such cir-cumstances. At the macroeconomic level, this lowers Australia’s future labour productivity and erodes our productive capacity, potential GDP and living standards.
• The self-esteem of both parents and children is destroyed and there are feelings of despair and failure resulting in mental illness, possibly substance and alcohol abuse, and violence.
• Poverty results in reduced health outcomes and, according to the ABS, perhaps increased crime rates. • There is isolation and reduced social contact often because of their disreputable appearance and reluctance
to mix with other people or groups. This leads to unhappiness and a lower quality of life. • Poverty and extreme inequality pose a threat to our democracy, freedom and stability as a result of the alien-
ation and exclusion of some people.
UNCORRECTED vironmental damage associated with the rapid growth of the oil and mining industries.
UNCORRECTED vironmental damage associated with the rapid growth of the oil and mining industries.
The effect of poverty on material and non-material living
UNCORRECTED The effect of poverty on material and non-material living
In Australia, for a standard income unit of four people (i.e. one adult, working; one not working; and two
UNCORRECTED In Australia, for a standard income unit of four people (i.e. one adult, working; one not working; and two
comparative poverty
UNCORRECTED comparative poverty is de�ned as having an income below $986 per week (in March
UNCORRECTED is de�ned as having an income below $986 per week (in March
2016). Poverty has both material and non-material effects.
UNCORRECTED
2016). Poverty has both material and non-material effects.
UNCORRECTED
Having little money leads to exclusion and limits consumption levels. It signi�cantly reduces the extent to
UNCORRECTED
Having little money leads to exclusion and limits consumption levels. It signi�cantly reduces the extent to needs and wants of individuals can be met and also undermines
UNCORRECTED
needs and wants of individuals can be met and also undermines
of those in poverty will go without one or two meals a day and have insuf�cient nutritious food. Others
UNCORRECTED
of those in poverty will go without one or two meals a day and have insuf�cient nutritious food. Others will be unable to pay power and gas bills and will be forced to survive winter without hot water or heating.
UNCORRECTED
will be unable to pay power and gas bills and will be forced to survive winter without hot water or heating.fordable housing — and paying a bond and rent in advance — is a problem for those in poverty.
UNCORRECTED
fordable housing — and paying a bond and rent in advance — is a problem for those in poverty. As a result, some individuals (including children) live on the streets or are forced to reside on the outskirts
UNCORRECTED
As a result, some individuals (including children) live on the streets or are forced to reside on the outskirts where there is no public transport, little to do and few jobs are available.
UNCORRECTED
where there is no public transport, little to do and few jobs are available.
UNCORRECTED
people look shabby, lack personal grooming, or have few skills, it is hard to gain employment.
UNCORRECTED
people look shabby, lack personal grooming, or have few skills, it is hard to gain employment. This can begin the cycle of poverty and welfare dependency. In addition, at the macroeconomic level,
UNCORRECTED
This can begin the cycle of poverty and welfare dependency. In addition, at the macroeconomic level, the exclusion of potential workers slows the economy’s productive capacity and limits future living UNCORRECTED
the exclusion of potential workers slows the economy’s productive capacity and limits future living standards.UNCORRECTED
standards.
PAGE ment, the healthy state of the natural environment and the absence of pollution, and a long life expectancy.
PAGE ment, the healthy state of the natural environment and the absence of pollution, and a long life expectancy.
unhappiness because of the premature death of children and other f
PAGE unhappiness because of the premature death of children and other family members due to poor health and
PAGE amily members due to poor health and unhappiness because of the premature death of children and other family members due to poor health and unhappiness because of the premature death of children and other f
PAGE unhappiness because of the premature death of children and other family members due to poor health and unhappiness because of the premature death of children and other f
absence of hope and opportunities to escape the vicious cycle of povertyPAGE absence of hope and opportunities to escape the vicious cycle of poverty
vironmental damage associated with the rapid growth of the oil and mining industries.PAGE
vironmental damage associated with the rapid growth of the oil and mining industries.
PROOFS10 per cent of households for example, consume a measly 1.8 per cent of the country’s goods and services.
PROOFS10 per cent of households for example, consume a measly 1.8 per cent of the country’s goods and services.
of the cost and the lack of educational facilities, few children attend school. Restricted or no access
PROOFSof the cost and the lack of educational facilities, few children attend school. Restricted or no access
is a lack of affordable medical treatment available for serious illnesses. Life expectancy is low, per
PROOFSis a lack of affordable medical treatment available for serious illnesses. Life expectancy is low, per
ithout much money, housing is basic and overcrowded, with an average of more than four people living in
PROOFSithout much money, housing is basic and overcrowded, with an average of more than four people living in
Non-material living standards relate to the factors affecting the quality of daily life. These might include
PROOFSNon-material living standards relate to the factors affecting the quality of daily life. These might include
happiness, the absence of crime and war, the existence of opportunities and experiences for cultural enrichPROOFS
happiness, the absence of crime and war, the existence of opportunities and experiences for cultural enrichment, the healthy state of the natural environment and the absence of pollution, and a long life expectancy. PROOFS
ment, the healthy state of the natural environment and the absence of pollution, and a long life expectancy.
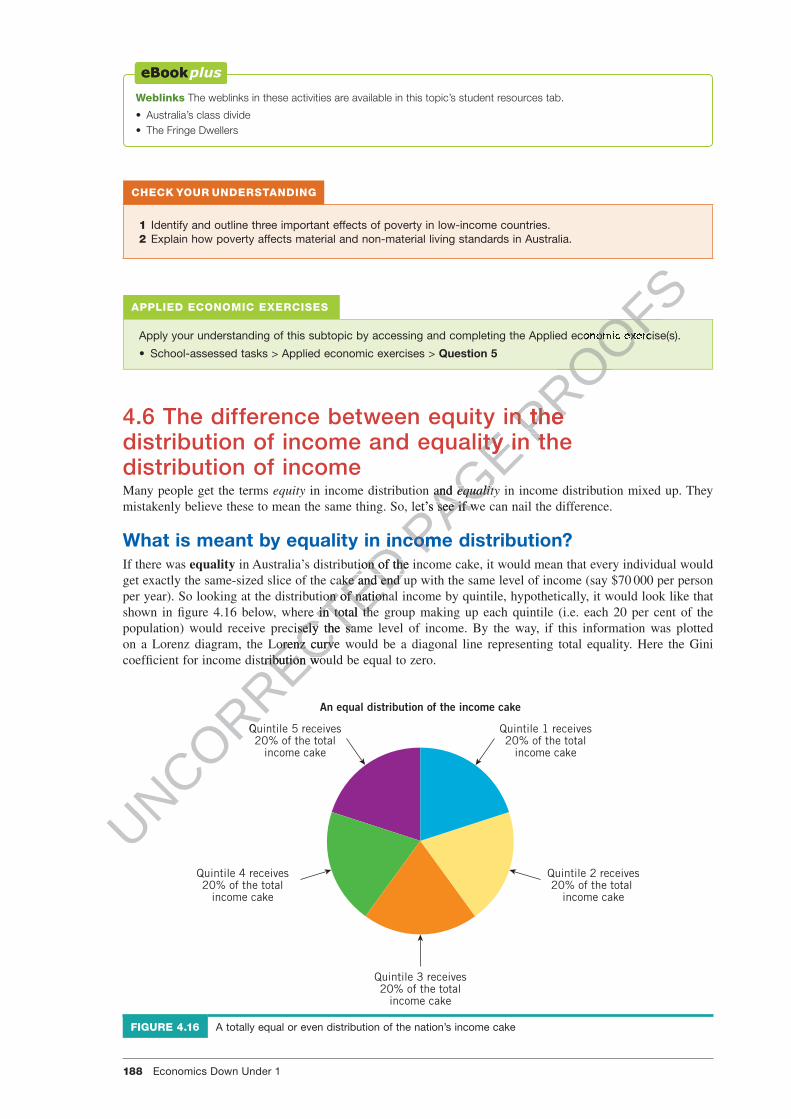
188 Economics Down Under 1
c04EconomicEf�ciencyAndEquityAsContemporaryEconomicIssues 188 4 October 2016 1:18 PM
Weblinks The weblinks in these activities are available in this topic’s student resources tab.
• Australia’s class divide• The Fringe Dwellers
CHECK YOUR UNDERSTANDING
1 Identify and outline three important effects of poverty in low-income countries.2 Explain how poverty affects material and non-material living standards in Australia.
APPLIED ECONOMIC EXERCISES
Apply your understanding of this subtopic by accessing and completing the Applied economic exercise(s).
• School-assessed tasks > Applied economic exercises > Question 5
4.6 The difference between equity in the distribution of income and equality in the distribution of incomeMany people get the terms equity in income distribution and equality in income distribution mixed up. They mistakenly believe these to mean the same thing. So, let’s see if we can nail the difference.
What is meant by equality in income distribution?If there was equality in Australia’s distribution of the income cake, it would mean that every individual would get exactly the same-sized slice of the cake and end up with the same level of income (say $70 000 per person per year). So looking at the distribution of national income by quintile, hypothetically, it would look like that shown in �gure 4.16 below, where in total the group making up each quintile (i.e. each 20 per cent of the population) would receive precisely the same level of income. By the way, if this information was plotted on a Lorenz diagram, the Lorenz curve would be a diagonal line representing total equality. Here the Gini coef�cient for income distribution would be equal to zero.
Quintile 3 receives20% of the total
income cake
Quintile 4 receives20% of the total
income cake
Quintile 5 receives20% of the total
income cake
Quintile 1 receives20% of the total
income cake
An equal distribution of the income cake
Quintile 2 receives20% of the total
income cake
FIGURE 4.16 A totally equal or even distribution of the nation’s income cake
UNCORRECTED What is meant by equality in income distribution?
UNCORRECTED What is meant by equality in income distribution? in Australia’s distribution of the income cake, it would mean that every individual would
UNCORRECTED in Australia’s distribution of the income cake, it would mean that every individual would get exactly the same-sized slice of the cake and end up with the same level of income (say $70
UNCORRECTED get exactly the same-sized slice of the cake and end up with the same level of income (say $70per year). So looking at the distribution of national income by quintile, hypothetically, it would look like that
UNCORRECTED per year). So looking at the distribution of national income by quintile, hypothetically, it would look like that shown in �gure 4.16 below, where in total the group making up each quintile (i.e. each 20 per cent of the
UNCORRECTED shown in �gure 4.16 below, where in total the group making up each quintile (i.e. each 20 per cent of the population) would receive precisely the same level of income. By the way, if this information was plotted
UNCORRECTED population) would receive precisely the same level of income. By the way, if this information was plotted on a Lorenz diagram, the Lorenz curve would be a diagonal line representing total equality. Here the Gini
UNCORRECTED on a Lorenz diagram, the Lorenz curve would be a diagonal line representing total equality. Here the Gini
UNCORRECTED
coef�cient for income distribution would be equal to zero.
UNCORRECTED
coef�cient for income distribution would be equal to zero.
Quintile 5 receives
UNCORRECTED
Quintile 5 receives
PAGE 4.6 The difference between equity in the
PAGE 4.6 The difference between equity in the distribution of income and equality in the
PAGE distribution of income and equality in the
in income distribution and
PAGE in income distribution and equality
PAGE equality
mistakenly believe these to mean the same thing. So, let’s see if we can nail the difference.
PAGE mistakenly believe these to mean the same thing. So, let’s see if we can nail the difference.
What is meant by equality in income distribution?PAGE
What is meant by equality in income distribution?
PROOFS
PROOFS
PROOFS
PROOFSApply your understanding of this subtopic by accessing and completing the Applied economic exercise(s).
PROOFSApply your understanding of this subtopic by accessing and completing the Applied economic exercise(s).
4.6 The difference between equity in the PROOFS
4.6 The difference between equity in the distribution of income and equality in the PROOFS
distribution of income and equality in the
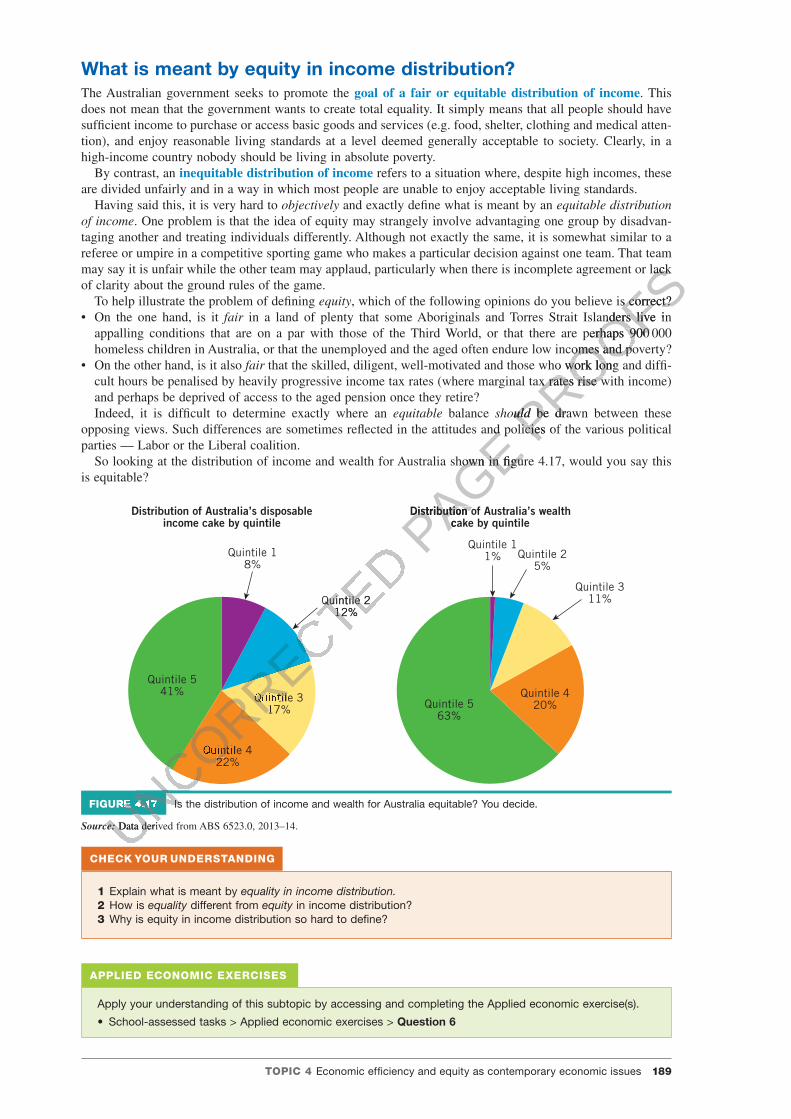
TOPIC 4 Economic ef�ciency and equity as contemporary economic issues 189
c04EconomicEf�ciencyAndEquityAsContemporaryEconomicIssues 189 4 October 2016 1:18 PM
What is meant by equity in income distribution?The Australian government seeks to promote the goal of a fair or equitable distribution of income. This does not mean that the government wants to create total equality. It simply means that all people should have suf�cient income to purchase or access basic goods and services (e.g. food, shelter, clothing and medical atten-tion), and enjoy reasonable living standards at a level deemed generally acceptable to society. Clearly, in a high-income country nobody should be living in absolute poverty.
By contrast, an inequitable distribution of income refers to a situation where, despite high incomes, these are divided unfairly and in a way in which most people are unable to enjoy acceptable living standards.
Having said this, it is very hard to objectively and exactly de�ne what is meant by an equitable distribution of income. One problem is that the idea of equity may strangely involve advantaging one group by disadvan-taging another and treating individuals differently. Although not exactly the same, it is somewhat similar to a referee or umpire in a competitive sporting game who makes a particular decision against one team. That team may say it is unfair while the other team may applaud, particularly when there is incomplete agreement or lack of clarity about the ground rules of the game.
To help illustrate the problem of de�ning equity, which of the following opinions do you believe is correct? • On the one hand, is it fair in a land of plenty that some Aboriginals and Torres Strait Islanders live in
appalling conditions that are on a par with those of the Third World, or that there are perhaps 900 000 homeless children in Australia, or that the unemployed and the aged often endure low incomes and poverty?
• On the other hand, is it also fair that the skilled, diligent, well-motivated and those who work long and dif�-cult hours be penalised by heavily progressive income tax rates (where marginal tax rates rise with income) and perhaps be deprived of access to the aged pension once they retire?Indeed, it is dif�cult to determine exactly where an equitable balance should be drawn between these
opposing views. Such differences are sometimes re�ected in the attitudes and policies of the various political parties — Labor or the Liberal coalition.
So looking at the distribution of income and wealth for Australia shown in �gure 4.17, would you say this is equitable?
Quintile 18%
Quintile 212%
Quintile 317%
Quintile 422%
Quintile 541%
Quintile 11% Quintile 2
5%
Quintile 311%
Distribution of Australia’s disposableincome cake by quintile
Distribution of Australia’s wealthcake by quintile
Quintile 420%Quintile 5
63%
FIGURE 4.17 Is the distribution of income and wealth for Australia equitable? You decide.
Source: Data derived from ABS 6523.0, 2013–14.
CHECK YOUR UNDERSTANDING
1 Explain what is meant by equality in income distribution.2 How is equality different from equity in income distribution?3 Why is equity in income distribution so hard to de�ne?
APPLIED ECONOMIC EXERCISES
Apply your understanding of this subtopic by accessing and completing the Applied economic exercise(s).
• School-assessed tasks > Applied economic exercises > Question 6
UNCORRECTED
UNCORRECTED
UNCORRECTED
UNCORRECTED
UNCORRECTED
UNCORRECTED
UNCORRECTED
UNCORRECTED Quintile 2
UNCORRECTED Quintile 2
12%
UNCORRECTED 12%
Quintile 3
UNCORRECTED
Quintile 317%
UNCORRECTED
17%
Quintile 4
UNCORRECTED
Quintile 422%
UNCORRECTED
22%
FIGURE 4.17
UNCORRECTED
FIGURE 4.17 Is the distribution of income and wealth for Australia equitable? You decide.
UNCORRECTED
Is the distribution of income and wealth for Australia equitable? You decide.
Source: UNCORRECTED
Source: Data derived from ABS 6523.0, 2013–14.UNCORRECTED
Data derived from ABS 6523.0, 2013–14.UNCORRECTED PAGE opposing views. Such differences are sometimes re�ected in the attitudes and policies of the various political
PAGE opposing views. Such differences are sometimes re�ected in the attitudes and policies of the various political
So looking at the distribution of income and wealth for Australia shown in �gure 4.17, would you say this
PAGE So looking at the distribution of income and wealth for Australia shown in �gure 4.17, would you say this
PAGE Distribution of Australia’s wealth
PAGE Distribution of Australia’s wealth
cake by quintilePAGE cake by quintile
PROOFSmay say it is unfair while the other team may applaud, particularly when there is incomplete agreement or lack
PROOFSmay say it is unfair while the other team may applaud, particularly when there is incomplete agreement or lack
, which of the following opinions do you believe is correct?
PROOFS, which of the following opinions do you believe is correct? in a land of plenty that some Aboriginals and Torres Strait Islanders live in
PROOFS in a land of plenty that some Aboriginals and Torres Strait Islanders live in appalling conditions that are on a par with those of the Third World, or that there are perhaps 900
PROOFSappalling conditions that are on a par with those of the Third World, or that there are perhaps 900 000
PROOFS000
Australia, or that the unemployed and the aged often endure low incomes and poverty?
PROOFSAustralia, or that the unemployed and the aged often endure low incomes and poverty?
that the skilled, diligent, well-motivated and those who work long and dif�
PROOFS that the skilled, diligent, well-motivated and those who work long and dif�
cult hours be penalised by heavily progressive income tax rates (where marginal tax rates rise with income)
PROOFScult hours be penalised by heavily progressive income tax rates (where marginal tax rates rise with income)
should PROOFS
should be drawn between these PROOFS
be drawn between these should be drawn between these should PROOFS
should be drawn between these shouldopposing views. Such differences are sometimes re�ected in the attitudes and policies of the various political PROOFS
opposing views. Such differences are sometimes re�ected in the attitudes and policies of the various political
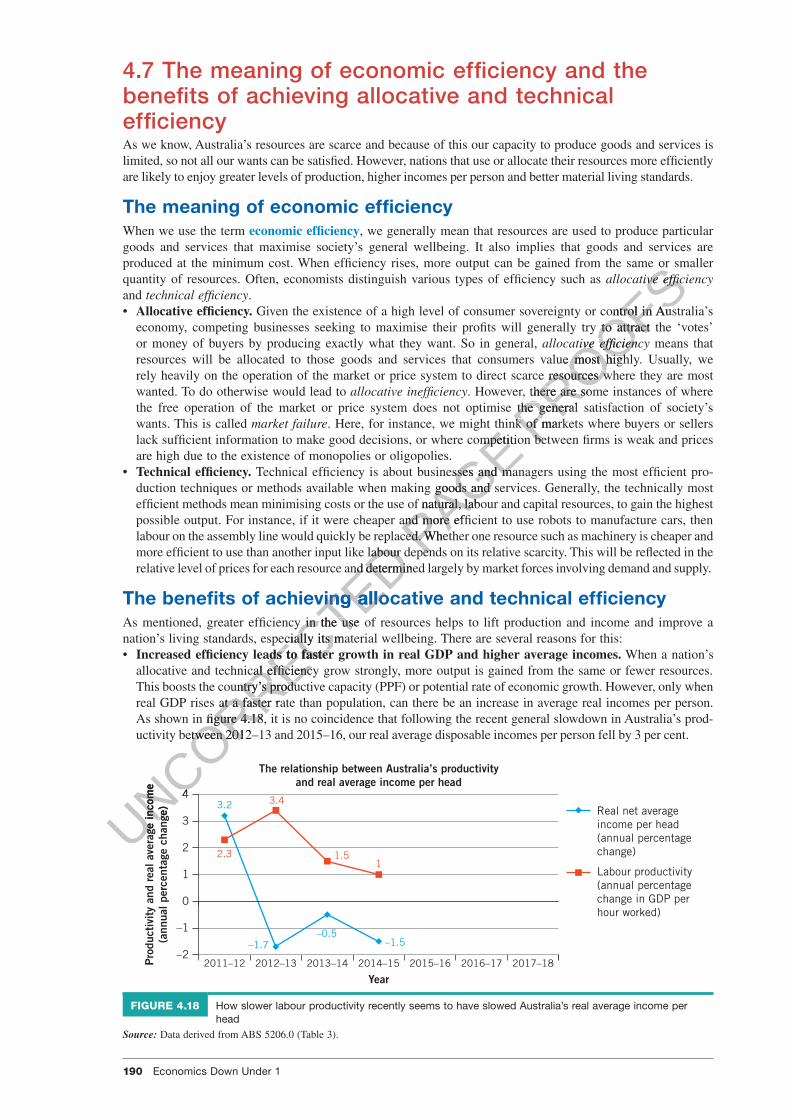
190 Economics Down Under 1
c04EconomicEf�ciencyAndEquityAsContemporaryEconomicIssues 190 4 October 2016 1:18 PM
4.7 The meaning of economic ef�ciency and the bene�ts of achieving allocative and technical ef�ciencyAs we know, Australia’s resources are scarce and because of this our capacity to produce goods and services is limited, so not all our wants can be satis�ed. However, nations that use or allocate their resources more ef�ciently are likely to enjoy greater levels of production, higher incomes per person and better material living standards.
The meaning of economic ef�ciencyWhen we use the term economic ef�ciency, we generally mean that resources are used to produce particular goods and services that maximise society’s general wellbeing. It also implies that goods and services are produced at the minimum cost. When ef�ciency rises, more output can be gained from the same or smaller quantity of resources. Often, economists distinguish various types of ef�ciency such as allocative ef�ciency and technical ef�ciency. • Allocative ef�ciency. Given the existence of a high level of consumer sovereignty or control in Australia’s
economy, competing businesses seeking to maximise their pro�ts will generally try to attract the ‘votes’ or money of buyers by producing exactly what they want. So in general, allocative ef�ciency means that resources will be allocated to those goods and services that consumers value most highly. Usually, we rely heavily on the operation of the market or price system to direct scarce resources where they are most wanted. To do otherwise would lead to allocative inef�ciency. However, there are some instances of where the free operation of the market or price system does not optimise the general satisfaction of society’s wants. This is called market failure. Here, for instance, we might think of markets where buyers or sellers lack suf�cient information to make good decisions, or where competition between �rms is weak and prices are high due to the existence of monopolies or oligopolies.
• Technical ef�ciency. Technical ef�ciency is about businesses and managers using the most ef�cient pro-duction techniques or methods available when making goods and services. Generally, the technically most ef�cient methods mean minimising costs or the use of natural, labour and capital resources, to gain the highest possible output. For instance, if it were cheaper and more ef�cient to use robots to manufacture cars, then labour on the assembly line would quickly be replaced. Whether one resource such as machinery is cheaper and more ef�cient to use than another input like labour depends on its relative scarcity. This will be re�ected in the relative level of prices for each resource and determined largely by market forces involving demand and supply.
The bene�ts of achieving allocative and technical ef�ciencyAs mentioned, greater ef�ciency in the use of resources helps to lift production and income and improve a nation’s living standards, especially its material wellbeing. There are several reasons for this: • Increased ef�ciency leads to faster growth in real GDP and higher average incomes. When a nation’s
allocative and technical ef�ciency grow strongly, more output is gained from the same or fewer resources. This boosts the country’s productive capacity (PPF) or potential rate of economic growth. However, only when real GDP rises at a faster rate than population, can there be an increase in average real incomes per person. As shown in �gure 4.18, it is no coincidence that following the recent general slowdown in Australia’s prod-uctivity between 2012–13 and 2015–16, our real average disposable incomes per person fell by 3 per cent.
3.2
–1.7–0.5
–1.5
2.3
3.4
1.51
–2
–1
0
1
2
3
4
2011–12 2012–13 2013–14 2014–15 2015–16 2016–17 2017–18Pro
duct
ivit
y an
d re
al a
vera
ge in
com
e(a
nnua
l per
cent
age
chan
ge)
The relationship between Australia’s productivityand real average income per head
Real net averageincome per head(annual percentagechange)
Labour productivity(annual percentagechange in GDP perhour worked)
Year
FIGURE 4.18 How slower labour productivity recently seems to have slowed Australia’s real average income per head
Source: Data derived from ABS 5206.0 (Table 3).
UNCORRECTED labour on the assembly line would quickly be replaced. Whether one resource such as machinery is cheaper and
UNCORRECTED labour on the assembly line would quickly be replaced. Whether one resource such as machinery is cheaper and
UNCORRECTED more ef�cient to use than another input like labour depends on its relative scarcity. This will be re�ected in the
UNCORRECTED more ef�cient to use than another input like labour depends on its relative scarcity. This will be re�ected in the relative level of prices for each resource and determined largely by market forces involving demand and supply.
UNCORRECTED relative level of prices for each resource and determined largely by market forces involving demand and supply.
The bene�ts of achieving allocative and technical ef�ciency
UNCORRECTED The bene�ts of achieving allocative and technical ef�ciencyAs mentioned, greater ef�ciency in the use of resources helps to lift production and income and improve a
UNCORRECTED As mentioned, greater ef�ciency in the use of resources helps to lift production and income and improve a nation’s living standards, especially its material wellbeing. There are several reasons for this:
UNCORRECTED nation’s living standards, especially its material wellbeing. There are several reasons for this:
eased ef�ciency leads to faster growth in real GDP and higher average incomes.
UNCORRECTED
eased ef�ciency leads to faster growth in real GDP and higher average incomes.allocative and technical ef�ciency grow strongly, more output is gained from the same or fewer resources.
UNCORRECTED
allocative and technical ef�ciency grow strongly, more output is gained from the same or fewer resources. This boosts the country’s productive capacity (PPF) or potential rate of economic growth. However, only when
UNCORRECTED
This boosts the country’s productive capacity (PPF) or potential rate of economic growth. However, only when
UNCORRECTED
real GDP rises at a faster rate than population, can there be an increase in average real incomes per person.
UNCORRECTED
real GDP rises at a faster rate than population, can there be an increase in average real incomes per person. As shown in �gure 4.18, it is no coincidence that following the recent general slowdown in Australia’s prod
UNCORRECTED
As shown in �gure 4.18, it is no coincidence that following the recent general slowdown in Australia’s productivity between 2012–13 and 2015–16, our real average disposable incomes per person fell by 3 per cent.
UNCORRECTED
uctivity between 2012–13 and 2015–16, our real average disposable incomes per person fell by 3 per cent.
4
UNCORRECTED
4
Pro
duct
ivit
y an
d re
al a
vera
ge in
com
e
UNCORRECTED
Pro
duct
ivit
y an
d re
al a
vera
ge in
com
e(a
nnua
l per
cent
age
chan
ge)
UNCORRECTED
(ann
ual p
erce
ntag
e ch
ange
)
PAGE . Here, for instance, we might think of markets where buyers or sellers
PAGE . Here, for instance, we might think of markets where buyers or sellers lack suf�cient information to make good decisions, or where competition between �rms is weak and prices
PAGE lack suf�cient information to make good decisions, or where competition between �rms is weak and prices
Technical ef�ciency is about businesses and managers using the most ef�cient pro
PAGE Technical ef�ciency is about businesses and managers using the most ef�cient pro
duction techniques or methods available when making goods and services. Generally, the technically most
PAGE duction techniques or methods available when making goods and services. Generally, the technically most ef�cient methods mean minimising costs or the use of natural, labour and capital resources, to gain the highest
PAGE ef�cient methods mean minimising costs or the use of natural, labour and capital resources, to gain the highest possible output. For instance, if it were cheaper and more ef�cient to use robots to manufacture cars, then PAGE possible output. For instance, if it were cheaper and more ef�cient to use robots to manufacture cars, then labour on the assembly line would quickly be replaced. Whether one resource such as machinery is cheaper and PAGE labour on the assembly line would quickly be replaced. Whether one resource such as machinery is cheaper and more ef�cient to use than another input like labour depends on its relative scarcity. This will be re�ected in the PAGE
more ef�cient to use than another input like labour depends on its relative scarcity. This will be re�ected in the
PROOFSproduced at the minimum cost. When ef�ciency rises, more output can be gained from the same or smaller
PROOFSproduced at the minimum cost. When ef�ciency rises, more output can be gained from the same or smaller
allocative ef�ciency
PROOFSallocative ef�ciency
Given the existence of a high level of consumer sovereignty or control in Australia’s
PROOFSGiven the existence of a high level of consumer sovereignty or control in Australia’s economy, competing businesses seeking to maximise their pro�ts will generally try to attract the ‘votes’
PROOFSeconomy, competing businesses seeking to maximise their pro�ts will generally try to attract the ‘votes’
allocative ef�ciency
PROOFSallocative ef�ciency
resources will be allocated to those goods and services that consumers value most highly. Usually, we
PROOFSresources will be allocated to those goods and services that consumers value most highly. Usually, we rely heavily on the operation of the market or price system to direct scarce resources where they are most
PROOFSrely heavily on the operation of the market or price system to direct scarce resources where they are most
. However, there are some instances of where
PROOFS. However, there are some instances of where
the free operation of the market or price system does not optimise the general satisfaction of society’s PROOFS
the free operation of the market or price system does not optimise the general satisfaction of society’s . Here, for instance, we might think of markets where buyers or sellers PROOFS
. Here, for instance, we might think of markets where buyers or sellers lack suf�cient information to make good decisions, or where competition between �rms is weak and prices PROOFS
lack suf�cient information to make good decisions, or where competition between �rms is weak and prices
TOPIC 4 Economic ef�ciency and equity as contemporary economic issues 191
c04EconomicEf�ciencyAndEquityAsContemporaryEconomicIssues 191 4 October 2016 1:18 PM
• Increased ef�ciency leads to lower prices. Improvements in allocative and technical ef�ciency help to reduce production costs (more output from less inputs) for �rms. This leads to lower more competitive prices and a slower in�ation rate. It also helps to improve the purchasing power of family incomes and strengthen material living standards.
• Increased ef�ciency leads to more jobs and employment. Greater technical ef�ciency in particular helps to slow production costs, improve pro�tability and make Australian �rms more competitive here and abroad. This leads to business expansion and, in the long term the creation of new jobs and a reduction in unemployment.
• Increased ef�ciency leads to a stronger trade balance internationally. Improved ef�ciency allows �rms to cut costs and lower the price at which they can pro�tably sell their product. Instead of just selling goods and services in the local market, Australian �rms can grow their sales in export markets, boosting incomes.
• Increased ef�ciency can lead to better non-material living standards. Economies where there is strong economic ef�ciency usually have low levels of unemployment. This boosts non-material living standards by improving the health outcomes for those involved, slowing crime rates, reducing family breakups and �nan-cial stress, and expanding opportunities for cultural enrichment by international travel or attending sporting, live musical or theatrical performances. In addition, greater technical ef�ciency places a country in a better position to deal with environmental problems that can also potentially help to improve the wellbeing of cur-rent and future generations.
Weblinks The weblinks in these activities are available in this topic’s student resources tab.
• Productivity — Investopedia
CHECK YOUR UNDERSTANDING
1 De�ne what is meant by economic ef�ciency?2 Distinguish the terms allocative ef�ciency and technical ef�ciency.3 Identify and explain three important bene�ts of economic ef�ciency for a country.
APPLIED ECONOMIC EXERCISES
Apply your understanding of this subtopic by accessing and completing the Applied economic exercise(s).
• School-assessed tasks > Applied economic exercises > Question 7
4.8 The economic and social costs and bene�ts of achieving equity in the distribution of incomeAs we shall later see, the Australian government uses a wide range of policies designed to promote the goal of an equitable distribution of income (de�ned as all people having access basic goods and services and a reasonable standard of living). In the end, achieving an equitable distribution of income is about the Australian government redistributing or re-slicing our income cake by applying the Robin Hood principle of taking from the rich and giving to the poor. This avoids inequality becoming too extreme and partly narrows the income gap. It means achieving an appropriate balance between too much inequality and too little equality. Striking the right balance also needs to take into account the relationships that exist between the need for greater econ-omic ef�ciency that may sometimes worsen inequality on the one hand, and the achievement of equity on the other.
As we shall see, both equality and inequality in income distribution are situations that can have good and bad effects for individuals, society, governments, the economy and general living standards.
Some negative effects of inequalityWe have already mentioned the dreadful effects of poverty on individuals and on society’s general wellbeing. Indeed, high levels of inequality can cause serious social and economic problems that reduce both material and non-material living standards. • Inequality divides society and reduces social cohesion and non-material welfare. Inequality divides
society into the ‘haves’ and ‘have nots’. In some parts of any city, there are families living comfortably in palatial dwellings located on tree-lined streets well away from the �lth of factories and the noise of freeways and trains. However, in other areas, there are the overcrowded suburbs that include none of the luxuries of
UNCORRECTED
UNCORRECTED
UNCORRECTED
UNCORRECTED
UNCORRECTED
UNCORRECTED Apply your understanding of this subtopic by accessing and completing the Applied economic exercise(s).
UNCORRECTED Apply your understanding of this subtopic by accessing and completing the Applied economic exercise(s).
School-assessed tasks > Applied economic exercises >
UNCORRECTED School-assessed tasks > Applied economic exercises >
4.8 The economic and social costs and bene�ts of
UNCORRECTED
4.8 The economic and social costs and bene�ts of achieving equity in the distribution of income
UNCORRECTED
achieving equity in the distribution of incomeAs we shall later see, the Australian government uses a wide range of policies designed to promote the
UNCORRECTED
As we shall later see, the Australian government uses a wide range of policies designed to promote the of an equitable distribution of income
UNCORRECTED
of an equitable distribution of income reasonable standard of living). In the end, achieving an
UNCORRECTED
reasonable standard of living). In the end, achieving an government redistributing or re-slicing our income cake by applying the
UNCORRECTED
government redistributing or re-slicing our income cake by applying the the rich and giving to the poor. This avoids inequality becoming too extreme and
UNCORRECTED
the rich and giving to the poor. This avoids inequality becoming too extreme and gap. It means achieving an appropriate
UNCORRECTED
gap. It means achieving an appropriate the right balance also needs to take into account the relationships that exist between the need for greater econUNCORRECTED
the right balance also needs to take into account the relationships that exist between the need for greater economic ef�ciency that may sometimes worsen UNCORRECTED
omic ef�ciency that may sometimes worsen
PAGE
PAGE
PAGE
PAGE
PAGE
PAGE ef�ciency.
PAGE ef�ciency.
ee important bene�ts of economic ef�ciency for a country.PAGE ee important bene�ts of economic ef�ciency for a country.
PROOFSeconomic ef�ciency usually have low levels of unemployment. This boosts non-material living standards by
PROOFSeconomic ef�ciency usually have low levels of unemployment. This boosts non-material living standards by improving the health outcomes for those involved, slowing crime rates, reducing family breakups and �nan
PROOFSimproving the health outcomes for those involved, slowing crime rates, reducing family breakups and �nan-
PROOFS-
cial stress, and expanding opportunities for cultural enrichment by international travel or attending sporting,
PROOFScial stress, and expanding opportunities for cultural enrichment by international travel or attending sporting, live musical or theatrical performances. In addition, greater technical ef�ciency places a country in a better
PROOFSlive musical or theatrical performances. In addition, greater technical ef�ciency places a country in a better position to deal with environmental problems that can also potentially help to improve the wellbeing of cur
PROOFSposition to deal with environmental problems that can also potentially help to improve the wellbeing of cur
PROOFS
The weblinks in these activities are available in this topic’s student resources tab.
PROOFS
The weblinks in these activities are available in this topic’s student resources tab.
PROOFS

192 Economics Down Under 1
c04EconomicEf�ciencyAndEquityAsContemporaryEconomicIssues 192 4 October 2016 1:18 PM
af�uence. Here, unemployment, racial ghettos, crime, drugs, despair, poverty and welfare dependence are far more commonplace. The people living in these areas may well resent those who are better off and start to see the system as unfair. This weakens social cohesion and can lead to great discontent, unrest, crime, violence, political protest and even revolution. For many low-income groups there is social and economic exclusion, and opportunities to become rich are limited.
Severe income inequality divides society, reduces social cohesion and may cause social unrest, violence and crime.
Source: The Economist, see http://www.economist.com/news/united-states/21660180-what-good-more-unequal-america-might-look-living-inequality.
• Inequality causes the underproduction of socially bene�cial goods and services. Another drawback of vast inequality is that the economy can tend to overproduce luxury goods and services, and underproduce necessities (e.g. affordable food, health, housing, education, public transport, legal services). Those with low incomes cannot exercise their spending power or indicate the types of things they want produced. They are effectively excluded from decision making so their satisfaction is reduced. In other words, inequality can distort the allocation of resources and thereby signi�cantly lower society’s average material living standards.
• Inequality can undermine productivity, economic growth and prosperity. Mention has already been made that poverty and severe inequality commonly lead to lower levels of educational attainment and higher levels of welfare dependence and economic exclusion. In turn, this represents wasted labour resources and causes the economy’s productivity or ef�ciency rates to be lower than otherwise. As a result, Australia’s productive capacity suffers and our potential GDP and incomes are lower. Additionally, low educational outcomes caused by inequality, lead to higher levels of welfare dependence. In some cases, generations of families become stuck on welfare, producing negative impacts for individuals, society and taxpayers (who must foot the bill).
Some positive effects of inequalitySome economists argue that modest levels of inequality in income and wealth can be bene�cial. They believe that inequality creates incentives to improve ef�ciency in resource allocation and production, pro-mote stronger economic growth, expand employment opportunities, increase general incomes and raise living standards. • Inequality may increase the incentive to work hard. The promise of higher pay can motivate employees
to work extra hours or overtime (and give up some of their leisure or holidays), try harder, and be more productive and ef�cient on the job. This helps strengthen material living standards. However, if all pay rates were equal, it is likely that there would be no such incentive. Productive capacity and the rate of econ-omic growth would probably be lower and goods and services more expensive, thereby depressing living standards.
• Inequality provides increased incentive to gain improved skills and education. More skilled and edu-cated workers usually receive higher pay since they are scarcer, and generally more productive or ef�cient. An advantage of inequality is that it can provide young people with the incentive to stay at school longer and go into tertiary education. In the longer term, this also helps to promote stronger economic growth and better living standards.
• Inequality promotes increased incentives to relocate. Given the desire for self-improvement, income ine-quality can cause people to move from one job to better paid employment. Here, wage differences act as price signals to allocate labour to areas of greatest need or utility. Pay differences also make it possible for �rms to �ll job vacancies even if they are in different towns or states or involve unpleasant work. Again, inequality helps promote better living standards.
• Inequality provides increased incentive for business risk and expansion. Income inequality provides �nancial incentives to reward or compensate business people to take calculated risks with their money, and
UNCORRECTED made that poverty and severe inequality commonly lead to lower levels of educational attainment and higher
UNCORRECTED made that poverty and severe inequality commonly lead to lower levels of educational attainment and higher levels of welfare dependence and economic exclusion. In turn, this represents wasted labour resources and
UNCORRECTED levels of welfare dependence and economic exclusion. In turn, this represents wasted labour resources and causes the economy’s productivity or ef�ciency rates to be lower than otherwise. As a result, Australia’s
UNCORRECTED causes the economy’s productivity or ef�ciency rates to be lower than otherwise. As a result, Australia’s productive capacity suffers and our potential GDP and incomes are lower. Additionally, low educational
UNCORRECTED productive capacity suffers and our potential GDP and incomes are lower. Additionally, low educational outcomes caused by inequality, lead to higher levels of welfare dependence. In some cases, generations of
UNCORRECTED outcomes caused by inequality, lead to higher levels of welfare dependence. In some cases, generations of families become stuck on welfare, producing negative impacts for individuals, society and taxpayers (who
UNCORRECTED families become stuck on welfare, producing negative impacts for individuals, society and taxpayers (who
UNCORRECTED
Some positive effects of inequality
UNCORRECTED
Some positive effects of inequalitySome economists argue that modest levels of
UNCORRECTED
Some economists argue that modest levels of believe that inequality creates
UNCORRECTED
believe that inequality creates mote stronger economic growth, expand employment opportunities, increase general incomes and raise
UNCORRECTED
mote stronger economic growth, expand employment opportunities, increase general incomes and raise living standards.
UNCORRECTED
living standards.Inequality may incr
UNCORRECTED
Inequality may incrto work extra hours or overtime (and give up some of their leisure or holidays), try harder, and be more
UNCORRECTED
to work extra hours or overtime (and give up some of their leisure or holidays), try harder, and be more productive and ef�cient on the job. This helps strengthen material living standards. However, if all pay rates
UNCORRECTED
productive and ef�cient on the job. This helps strengthen material living standards. However, if all pay rates were equal, it is likely that there would be no such incentive. Productive capacity and the rate of econ
UNCORRECTED
were equal, it is likely that there would be no such incentive. Productive capacity and the rate of economic growth would probably be lower and goods and services more expensive, thereby depressing living UNCORRECTED
omic growth would probably be lower and goods and services more expensive, thereby depressing living standards.UNCORRECTED
standards.
PAGE vast inequality is that the economy can tend to overproduce luxury goods and services, and underproduce
PAGE vast inequality is that the economy can tend to overproduce luxury goods and services, and underproduce necessities (e.g. affordable food, health, housing, education, public transport, legal services). Those with
PAGE necessities (e.g. affordable food, health, housing, education, public transport, legal services). Those with low incomes cannot exercise their spending power or indicate the types of things they want produced. They
PAGE low incomes cannot exercise their spending power or indicate the types of things they want produced. They are effectively excluded from decision making so their satisfaction is reduced. In other words, inequality
PAGE are effectively excluded from decision making so their satisfaction is reduced. In other words, inequality can distort the allocation of resources and thereby signi�cantly lower society’s average material living
PAGE can distort the allocation of resources and thereby signi�cantly lower society’s average material living
oductivity, economic growth and prosperity.PAGE oductivity, economic growth and prosperity.
made that poverty and severe inequality commonly lead to lower levels of educational attainment and higher PAGE
made that poverty and severe inequality commonly lead to lower levels of educational attainment and higher
PROOFS
PROOFSSevere income inequality divides society, reduces social cohesion and may cause social unrest, violence and crime.
PROOFSSevere income inequality divides society, reduces social cohesion and may cause social unrest, violence and crime.
The Economist, see http://www.economist.com/news/united-states/21660180-what-good-more-unequal-america-might-look-
PROOFS The Economist, see http://www.economist.com/news/united-states/21660180-what-good-more-unequal-america-might-look-
causes the underproduction of socially bene�cial goods and servicesPROOFS
causes the underproduction of socially bene�cial goods and servicesvast inequality is that the economy can tend to overproduce luxury goods and services, and underproduce PROOFS
vast inequality is that the economy can tend to overproduce luxury goods and services, and underproduce
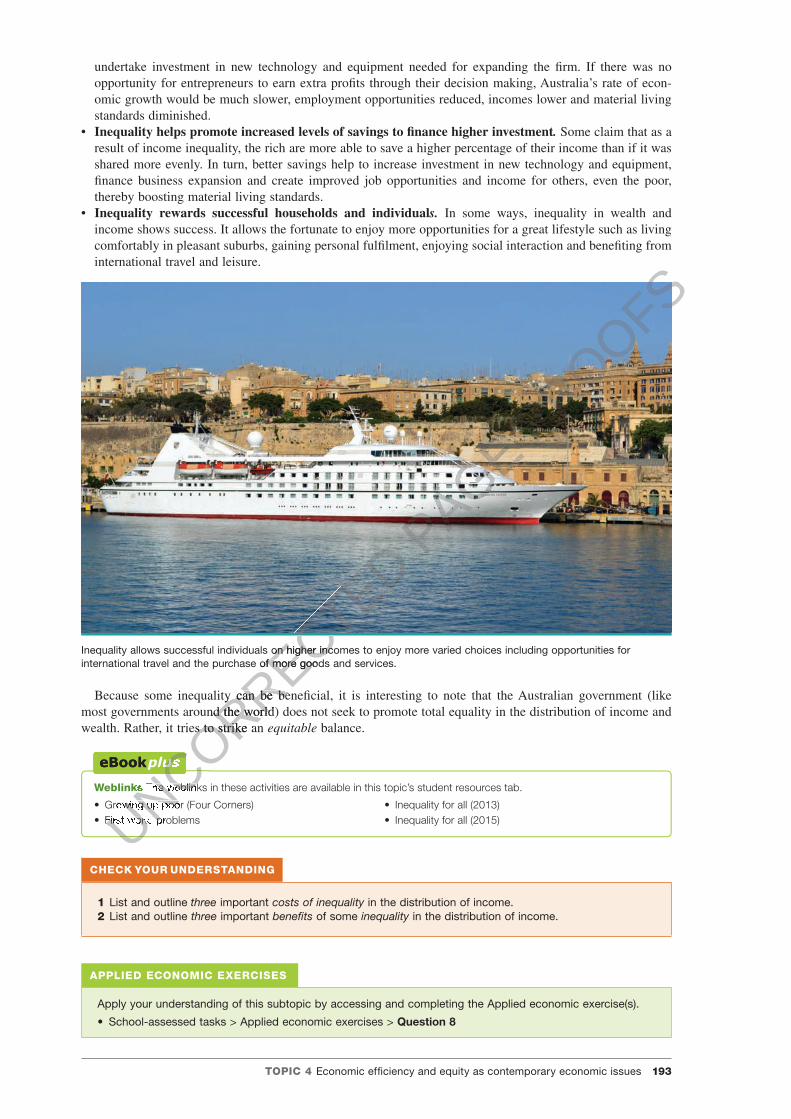
TOPIC 4 Economic ef�ciency and equity as contemporary economic issues 193
c04EconomicEf�ciencyAndEquityAsContemporaryEconomicIssues 193 4 October 2016 1:18 PM
undertake investment in new technology and equipment needed for expanding the �rm. If there was no opportunity for entrepreneurs to earn extra pro�ts through their decision making, Australia’s rate of econ-omic growth would be much slower, employment opportunities reduced, incomes lower and material living standards diminished.
• Inequality helps promote increased levels of savings to �nance higher investment. Some claim that as a result of income inequality, the rich are more able to save a higher percentage of their income than if it was shared more evenly. In turn, better savings help to increase investment in new technology and equipment, �nance business expansion and create improved job opportunities and income for others, even the poor, thereby boosting material living standards.
• Inequality rewards successful households and individuals. In some ways, inequality in wealth and income shows success. It allows the fortunate to enjoy more opportunities for a great lifestyle such as living comfortably in pleasant suburbs, gaining personal ful�lment, enjoying social interaction and bene�ting from international travel and leisure.
Inequality allows successful individuals on higher incomes to enjoy more varied choices including opportunities for international travel and the purchase of more goods and services.
Because some inequality can be bene�cial, it is interesting to note that the Australian government (like most governments around the world) does not seek to promote total equality in the distribution of income and wealth. Rather, it tries to strike an equitable balance.
Weblinks The weblinks in these activities are available in this topic’s student resources tab.
• Growing up poor (Four Corners)• First world problems
• Inequality for all (2013)• Inequality for all (2015)
CHECK YOUR UNDERSTANDING
1 List and outline three important costs of inequality in the distribution of income.2 List and outline three important bene�ts of some inequality in the distribution of income.
APPLIED ECONOMIC EXERCISES
Apply your understanding of this subtopic by accessing and completing the Applied economic exercise(s).
• School-assessed tasks > Applied economic exercises > Question 8
UNCORRECTED
UNCORRECTED
UNCORRECTED
Inequality allows successful individuals on higher incomes to enjoy more varied choices including opportunities for
UNCORRECTED
Inequality allows successful individuals on higher incomes to enjoy more varied choices including opportunities for international travel and the purchase of more goods and services.
UNCORRECTED
international travel and the purchase of more goods and services.
Because some inequality can be bene�cial, it is interesting to note that the Australian government (like
UNCORRECTED
Because some inequality can be bene�cial, it is interesting to note that the Australian government (like most governments around the world) does not seek to promote total equality in the distribution of income and
UNCORRECTED
most governments around the world) does not seek to promote total equality in the distribution of income and wealth. Rather, it tries to strike an
UNCORRECTED
wealth. Rather, it tries to strike an
UNCORRECTED
Weblinks
UNCORRECTED
Weblinks The weblinks in these activities are available in this topic’s student resources tab.
UNCORRECTED
The weblinks in these activities are available in this topic’s student resources tab.
Growing up poor (Four Corners)
UNCORRECTED
Growing up poor (Four Corners)First world problems UNCORRECTED
First world problems UNCORRECTED
UNCORRECTED
UNCORRECTED
UNCORRECTED
UNCORRECTED PAGE P
ROOFS
PROOFS
194 Economics Down Under 1
c04EconomicEf�ciencyAndEquityAsContemporaryEconomicIssues 194 4 October 2016 1:18 PM
4.9 Compatibility and con�ict between the goals of equity in income distribution and ef�ciency in resource allocationIn economics, the relationships between the government goals of promoting ef�ciency and equity are impor-tant issues of debate. Here ef�ciency means allocating resources to their most productive, valued and wanted uses, while equity is about fairness and ensuring that everyone can access basic goods and services and enjoy reasonable living standards.
Economists are divided on whether the government’s promotion of greater equity (i.e. a bit more equality, or a bit less inequality, so that all can access basic goods and services) reduces economic ef�ciency (and vice versa: promoting more ef�ciency reduces equity). Some believe that there is a trade-off where promoting one undermines the other. However, others believe that these two goals can be compatible so that we can achieve both.
A con�icting relationship — that promoting equity can reduce economic ef�ciencyMany economists including Arthur Okun (who wrote Equity and Ef�ciency — the Big Trade-Off, 1975) believe that this trade-off or con�ict between equity and ef�ciency is unavoidable. Typically, the explanation goes something like this: government policies to redistribute income more evenly generally involve the use of measures such as: • progressive taxes (where the marginal rate of tax is higher for upper-income earners than for those on lower
incomes) • the payment of generous cash welfare bene�ts to the neediest individuals • the provision of free or subsidised government services like health and education • the setting of a minimum wage in the labour market at a level higher than the market equilibrium.
These measures that seek to promote equity mean that not all resources will be allocated to their most valued and satisfying end uses, lowering economic ef�ciency, slowing the growth of the income cake and ulti-mately undermining society’s living standards. It is claimed that these measures reduce: • incentives for individuals to work hard and longer hours • saving that is needed to �nance investment and grow productive capacity • the motivation to improve skills, training and worker productivity • self-reliance and encourage a welfare dependency that is an economic cost on those who are most productive.
A compatible relationship — that promoting equity can strengthen economic ef�ciencyHowever, other economists believe that the goals of equity and ef�ciency can be compatible. Perhaps most importantly, take a situation where income inequality is so extreme that individuals are discouraged from par-ticipation in work and where their education, attitudes, skills and health were poor. Through selected govern-ment equity-promoting policies, perhaps involving the provision of free public education and health, along with careful welfare measures, overall the nation’s productivity can be strengthened. For instance, research shows a clear relationship between higher levels of government spending on education and health (measures that will increase equity), rises in labour ef�ciency and faster sustainable rates of economic growth. Indeed, some believe that such outlays may be a more ef�cient use of government resources than generous tax con-cessions given to the rich for their superannuation contributions and in the form of negative gearing on prop-erty speculation. An additional bonus is that increased outlays on health and education have a social bene�t, including a signi�cant reduction in crime rates.
Australia’s approach to equity and ef�ciencyAustralian governments have tended to adopt a compromise involving a balance between the pursuit of equity and ef�ciency. By promoting greater ef�ciency and growing the initial size of our income cake, it is believed that this potentially allows for greater equity in the �nal distribution of income. There are several ways whereby promoting ef�ciency can help equity: • Ef�ciency means there is a faster rise in the nation’s productive capacity, allowing for higher real incomes
per person. • Ef�ciency means that in�ation rates are lower so the purchasing power of incomes is greater. • Ef�ciency means a bigger GDP, in turn increasing average incomes and hence tax revenue so that the
government can more adequately and sustainably provide proper welfare, health and education without having to increase borrowing and debt.
Of course, the real challenge for any government is to get the balance between equity and ef�ciency right.
UNCORRECTED ves for individuals to work hard and longer hours
UNCORRECTED ves for individuals to work hard and longer hoursving that is needed to �nance investment and grow productive capacity
UNCORRECTED ving that is needed to �nance investment and grow productive capacitymotivation to improve skills, training and worker productivity
UNCORRECTED motivation to improve skills, training and worker productivity
are dependency that is an economic cost on those who are most productive.
UNCORRECTED are dependency that is an economic cost on those who are most productive.
UNCORRECTED A compatible relationship — that promoting equity can
UNCORRECTED A compatible relationship — that promoting equity can strengthen economic ef�ciency
UNCORRECTED strengthen economic ef�ciencyHowever, other economists believe that the goals of equity and ef�ciency can be compatible. Perhaps most
UNCORRECTED
However, other economists believe that the goals of equity and ef�ciency can be compatible. Perhaps most importantly, take a situation where income inequality is so extreme that individuals are discouraged from par
UNCORRECTED
importantly, take a situation where income inequality is so extreme that individuals are discouraged from participation in work and where their education, attitudes, skills and health were poor. Through selected govern
UNCORRECTED
ticipation in work and where their education, attitudes, skills and health were poor. Through selected government equity-promoting policies, perhaps involving the provision of free public education and health, along
UNCORRECTED
ment equity-promoting policies, perhaps involving the provision of free public education and health, along with careful welfare measures, overall the nation’s productivity can be strengthened. For instance, research
UNCORRECTED
with careful welfare measures, overall the nation’s productivity can be strengthened. For instance, research shows a clear relationship between higher levels of government spending on education and health (measures
UNCORRECTED
shows a clear relationship between higher levels of government spending on education and health (measures
UNCORRECTED
that will increase equity), rises in labour ef�ciency and faster sustainable rates of economic growth. Indeed,
UNCORRECTED
that will increase equity), rises in labour ef�ciency and faster sustainable rates of economic growth. Indeed, some believe that such outlays may be a more ef�cient use of government resources than generous tax con
UNCORRECTED
some believe that such outlays may be a more ef�cient use of government resources than generous tax concessions given to the rich for their superannuation contributions and in the form of negative gearing on prop
UNCORRECTED
cessions given to the rich for their superannuation contributions and in the form of negative gearing on property speculation. An additional bonus is that increased outlays on health and education have a social bene�t,
UNCORRECTED
erty speculation. An additional bonus is that increased outlays on health and education have a social bene�t, including a signi�cant reduction in crime rates.UNCORRECTED
including a signi�cant reduction in crime rates.
Australia’s approach to equity and ef�ciencyUNCORRECTED
Australia’s approach to equity and ef�ciency
PAGE payment of generous cash welfare bene�ts to the neediest individuals
PAGE payment of generous cash welfare bene�ts to the neediest individualsprovision of free or subsidised government services like health and education
PAGE provision of free or subsidised government services like health and educationsetting of a minimum wage in the labour market at a level higher than the market equilibrium.
PAGE setting of a minimum wage in the labour market at a level higher than the market equilibrium.
mean that not all resources will be allocated to their most
PAGE mean that not all resources will be allocated to their most
valued and satisfying end uses, lowering economic ef�ciency, slowing the growth of the income cake and ulti
PAGE valued and satisfying end uses, lowering economic ef�ciency, slowing the growth of the income cake and ultimately undermining society’s living standards. It is claimed that these measures reduce:PAGE mately undermining society’s living standards. It is claimed that these measures reduce:
ves for individuals to work hard and longer hoursPAGE
ves for individuals to work hard and longer hoursving that is needed to �nance investment and grow productive capacityPAGE
ving that is needed to �nance investment and grow productive capacity
PROOFSA con�icting relationship — that promoting equity can reduce
PROOFSA con�icting relationship — that promoting equity can reduce
Equity and Ef�ciency — the Big Trade-Off
PROOFSEquity and Ef�ciency — the Big Trade-Off, 1975) believe
PROOFS, 1975) believe Equity and Ef�ciency — the Big Trade-Off, 1975) believe Equity and Ef�ciency — the Big Trade-Off
PROOFSEquity and Ef�ciency — the Big Trade-Off, 1975) believe Equity and Ef�ciency — the Big Trade-Off
that this trade-off or con�ict between equity and ef�ciency is unavoidable. Typically, the explanation goes
PROOFSthat this trade-off or con�ict between equity and ef�ciency is unavoidable. Typically, the explanation goes
income more evenly generally involve the use of
PROOFS income more evenly generally involve the use of
ve taxes (where the marginal rate of tax is higher for upper-income earners than for those on lower PROOFS
ve taxes (where the marginal rate of tax is higher for upper-income earners than for those on lower
TOPIC 4 Economic ef�ciency and equity as contemporary economic issues 195
c04EconomicEf�ciencyAndEquityAsContemporaryEconomicIssues 195 4 October 2016 1:18 PM
CHECK YOUR UNDERSTANDING
1 Explain who some economists feel that the promotion of equity and ef�ciency are con�icting aims.2 In what way might the promotion of equity actually increase ef�ciency?3 In what way does the Australian government try to promote a balance between the promotion of ef�ciency
and equity?
APPLIED ECONOMIC EXERCISES
Apply your understanding of this subtopic by accessing and completing the Applied economic exercise(s).
• School-assessed tasks > Applied economic exercises > Question 9
4.10 The role of markets in achieving equity in the distribution of income and ef�ciency in resource allocationAustralia has a market economy. Here, the price or market system usually operates not only to allocate resources ef�ciently, but also to help distribute income between individuals equitably.
How the market operates to allocate resources ef�ciently and distribute incomesAs we saw in topic 2, the market is an incredible device that helps to make many of the economic decisions confronting society. Essentially, the market or price system involves interaction between the buyers and sellers for each good or service, to negotiate or determine relative prices. Over time, these prices change due to new, non-price conditions affecting demand and supply. In turn, changes in relative prices and pro�ts in each market not only tell producers what consumers want and value most highly, they also provide the necessary infor-mation to allow pro�t-seeking owners of resources to answer the three basic questions: • ‘what and how much to produce’ (the type and quantities of particular goods and services) • ‘how to produce’ (production methods to be used) • ‘for whom to produce’ (how the incomes, goods and services should be distributed or shared).
Usually, the market makes fairly good decisions and answers these questions ef�ciently, as we saw in topic 2. For instance, resources will not be wasted producing things that are not wanted or are not highly valued by consumers. In addition, the market will normally distribute the highest incomes to the most pro-ductive or ef�cient members of the labour force. This creates signals to owners of resources to help them use their talents in occupations that are �nancially most rewarding.
However, it is unfortunate that sometimes the market fails to make good decisions that maximise both ef�ciency and equity. This is called market failure and when it occurs, society’s general level of wellbeing is reduced. In such instances, a case can exist for government intervention designed to reduce the extent of market failure.
When the market allocates resources inef�cientlyMarket failure can cause resources to be allocated inef�ciently (where their use is not optimal and society’s satisfaction is reduced). Here we might think of markets where there are monopolies and oligopolies and where competition and hence ef�ciency are weak, leading to lower production and higher prices. In addition, because of the lack of adequate information by buyers and sellers, the economic decisions made in some markets do not lead to an ef�cient allocation of resources. Furthermore, only those with suf�cient income can participate in the market and in�uence the allocation of resources. Hence, it is likely that the necessities of life (e.g. housing, education, health) needed by everyone including the poor will be underproduced (unless of course these are provided by the government).
When the market causes inequality and inequityThe free operation of the market causes some people to receive high wages for their labour (giving them more purchasing power over goods and services), while others receive low wages (or in the absence of govern-ment welfare, gain no income). Essentially, wages or the price of labour in different occupations will be a re�ection of the relative scarcity of each occupation. Here it is likely that well-paid jobs will be those where the quantity of labour supplied is limited relative to its demand. For instance, this may be the result of the requirement of skills, expensive training and experience, unpleasant or dangerous job conditions or long hours
UNCORRECTED not only tell producers what consumers want and value most highly, they also provide the necessary infor
UNCORRECTED not only tell producers what consumers want and value most highly, they also provide the necessary information to allow pro�t-seeking owners of resources to answer the
UNCORRECTED mation to allow pro�t-seeking owners of resources to answer the and how much to produce’ (the type and quantities of particular goods and services)
UNCORRECTED and how much to produce’ (the type and quantities of particular goods and services)
w to produce’ (production methods to be used)
UNCORRECTED w to produce’ (production methods to be used)whom to produce’ (how the incomes, goods and services should be distributed or shared).
UNCORRECTED whom to produce’ (how the incomes, goods and services should be distributed or shared).
Usually, the market makes fairly good decisions and answers these questions ef�ciently, as we saw in
UNCORRECTED Usually, the market makes fairly good decisions and answers these questions ef�ciently, as we saw in
topic 2. For instance, resources will not be wasted producing things that are not wanted or are not highly
UNCORRECTED topic 2. For instance, resources will not be wasted producing things that are not wanted or are not highly valued by consumers. In addition, the market will normally distribute the highest incomes to the most pro
UNCORRECTED
valued by consumers. In addition, the market will normally distribute the highest incomes to the most productive or ef�cient members of the labour force. This creates signals to owners of resources to help them use
UNCORRECTED
ductive or ef�cient members of the labour force. This creates signals to owners of resources to help them use their talents in occupations that are �nancially most rewarding.
UNCORRECTED
their talents in occupations that are �nancially most rewarding.However, it is unfortunate that sometimes the market fails to make good decisions that maximise both ef�ciency
UNCORRECTED
However, it is unfortunate that sometimes the market fails to make good decisions that maximise both ef�ciency and equity. This is called
UNCORRECTED
and equity. This is called market failure
UNCORRECTED
market failureinstances, a case can exist for government intervention designed to reduce the extent of market failure.
UNCORRECTED
instances, a case can exist for government intervention designed to reduce the extent of market failure.
When the market allocates resources inef�ciently
UNCORRECTED
When the market allocates resources inef�cientlyMarket failure
UNCORRECTED
Market failure can cause resources to be allocated
UNCORRECTED
can cause resources to be allocated satisfaction is reduced). Here we might think of markets where there are monopolies and oligopolies and
UNCORRECTED
satisfaction is reduced). Here we might think of markets where there are monopolies and oligopolies and where competition and hence ef�ciency are weak, leading to lower production and higher prices. In addition, UNCORRECTED
where competition and hence ef�ciency are weak, leading to lower production and higher prices. In addition, UNCORRECTED
because of the lack of adequate UNCORRECTED
because of the lack of adequate markets do not lead to an ef�cient allocation of resources. Furthermore, only those with suf�cient income can UNCORRECTED
markets do not lead to an ef�cient allocation of resources. Furthermore, only those with suf�cient income can
PAGE How the market operates to allocate resources ef�ciently and
PAGE How the market operates to allocate resources ef�ciently and
As we saw in topic 2, the market is an incredible device that helps to make many of the economic decisions
PAGE As we saw in topic 2, the market is an incredible device that helps to make many of the economic decisions confronting society. Essentially, the market or price system involves interaction between the buyers and sellers
PAGE confronting society. Essentially, the market or price system involves interaction between the buyers and sellers
relative prices
PAGE relative prices. Over time, these prices change due to new,
PAGE . Over time, these prices change due to new,
affecting demand and supply. In turn, changes in relative prices and PAGE affecting demand and supply. In turn, changes in relative prices and
not only tell producers what consumers want and value most highly, they also provide the necessary inforPAGE
not only tell producers what consumers want and value most highly, they also provide the necessary information to allow pro�t-seeking owners of resources to answer the PAGE
mation to allow pro�t-seeking owners of resources to answer the
PROOFS
PROOFS
PROOFS4.10 The role of markets in achieving equity in the
PROOFS4.10 The role of markets in achieving equity in the distribution of income and ef�ciency in resource
PROOFSdistribution of income and ef�ciency in resource
economy. Here, the price or market system usually operates not only to allocate
PROOFSeconomy. Here, the price or market system usually operates not only to allocate
resources ef�ciently, but also to help distribute income between individuals equitably.
PROOFS
resources ef�ciently, but also to help distribute income between individuals equitably.
How the market operates to allocate resources ef�ciently and PROOFS
How the market operates to allocate resources ef�ciently and
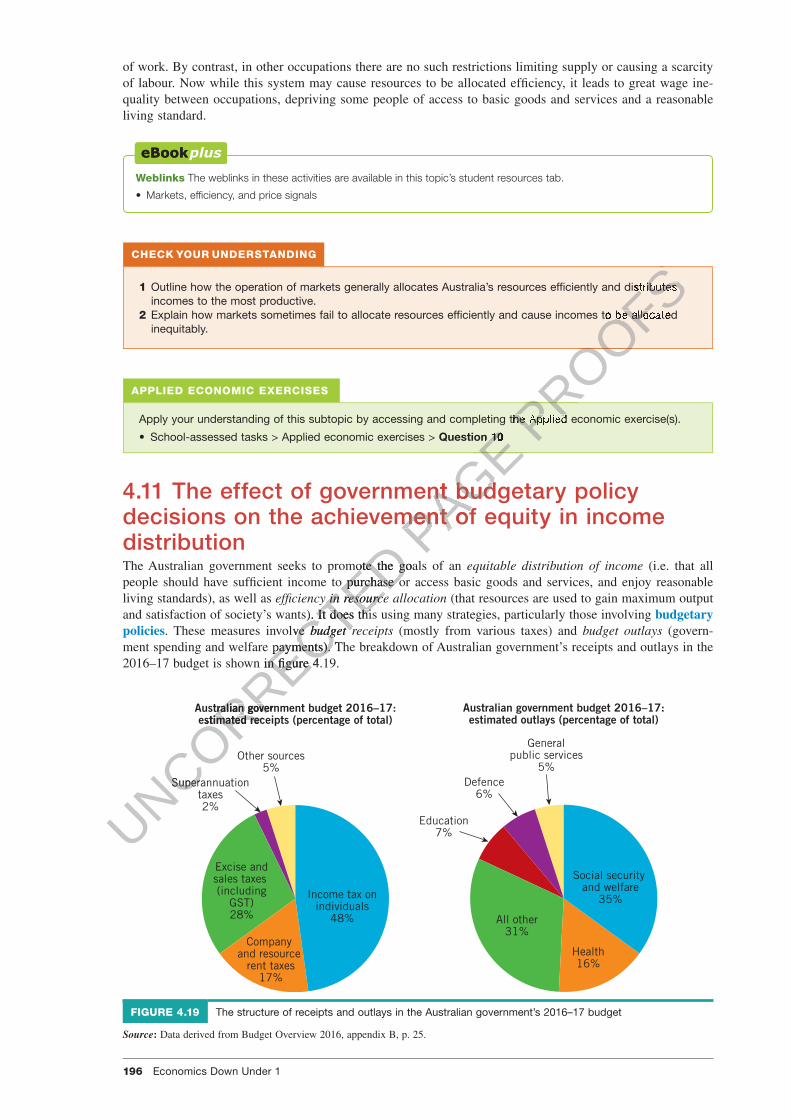
196 Economics Down Under 1
c04EconomicEf�ciencyAndEquityAsContemporaryEconomicIssues 196 4 October 2016 1:18 PM
of work. By contrast, in other occupations there are no such restrictions limiting supply or causing a scarcity of labour. Now while this system may cause resources to be allocated ef�ciency, it leads to great wage ine-quality between occupations, depriving some people of access to basic goods and services and a reasonable living standard.
Weblinks The weblinks in these activities are available in this topic’s student resources tab.
• Markets, ef�ciency, and price signals
CHECK YOUR UNDERSTANDING
1 Outline how the operation of markets generally allocates Australia’s resources ef�ciently and distributes incomes to the most productive.
2 Explain how markets sometimes fail to allocate resources ef�ciently and cause incomes to be allocated inequitably.
APPLIED ECONOMIC EXERCISES
Apply your understanding of this subtopic by accessing and completing the Applied economic exercise(s).
• School-assessed tasks > Applied economic exercises > Question 10
4.11 The effect of government budgetary policy decisions on the achievement of equity in income distributionThe Australian government seeks to promote the goals of an equitable distribution of income (i.e. that all people should have suf�cient income to purchase or access basic goods and services, and enjoy reasonable living standards), as well as ef�ciency in resource allocation (that resources are used to gain maximum output and satisfaction of society’s wants). It does this using many strategies, particularly those involving budgetary policies. These measures involve budget receipts (mostly from various taxes) and budget outlays (govern-ment spending and welfare payments). The breakdown of Australian government’s receipts and outlays in the 2016–17 budget is shown in �gure 4.19.
Income tax onindividuals
48%
Company and resource
rent taxes17%
Excise andsales taxes (including
GST)28%
Superannuationtaxes2%
Other sources5%
Australian government budget 2016–17:estimated receipts (percentage of total)
Social security and welfare
35%
Health16%
All other31%
Education7%
Defence6%
Generalpublic services
5%
Australian government budget 2016–17:estimated outlays (percentage of total)
FIGURE 4.19 The structure of receipts and outlays in the Australian government’s 2016–17 budget
Source: Data derived from Budget Overview 2016, appendix B, p. 25.
UNCORRECTED The Australian government seeks to promote the goals of an
UNCORRECTED The Australian government seeks to promote the goals of an people should have suf�cient income to purchase or access basic goods and services, and enjoy reasonable
UNCORRECTED people should have suf�cient income to purchase or access basic goods and services, and enjoy reasonable
ef�ciency in resource allocation
UNCORRECTED ef�ciency in resource allocation
and satisfaction of society’s wants). It does this using many strategies, particularly those involving
UNCORRECTED and satisfaction of society’s wants). It does this using many strategies, particularly those involving
UNCORRECTED . These measures involve
UNCORRECTED . These measures involve budget receipts
UNCORRECTED budget receipts
ment spending and welfare payments). The breakdown of Australian government’s receipts and outlays in the
UNCORRECTED ment spending and welfare payments). The breakdown of Australian government’s receipts and outlays in the 2016–17 budget is shown in �gure 4.19.
UNCORRECTED
2016–17 budget is shown in �gure 4.19.
UNCORRECTED
Australian government budget 2016–17:
UNCORRECTED
Australian government budget 2016–17:
UNCORRECTED
Superannuation
UNCORRECTED
Superannuation
estimated receipts (percentage of total)
UNCORRECTED
estimated receipts (percentage of total)
PAGE
PAGE
PAGE Question 10
PAGE Question 10
4.11 The effect of government budgetary policy
PAGE 4.11 The effect of government budgetary policy decisions on the achievement of equity in income PAGE decisions on the achievement of equity in income
PROOFS
PROOFS
PROOFS
PROOFSs resources ef�ciently and distributes
PROOFSs resources ef�ciently and distributes
esources ef�ciently and cause incomes to be allocated
PROOFSesources ef�ciently and cause incomes to be allocated
PROOFS
PROOFS
Apply your understanding of this subtopic by accessing and completing the Applied economic exercise(s).PROOFS
Apply your understanding of this subtopic by accessing and completing the Applied economic exercise(s).
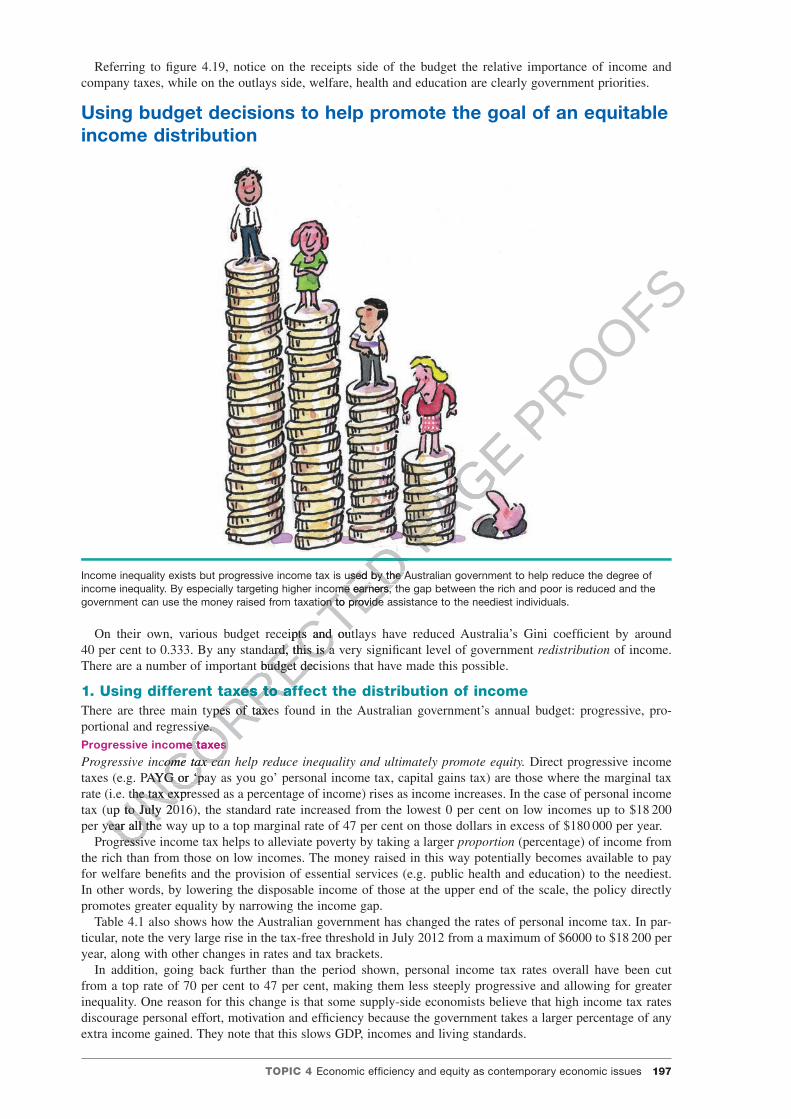
TOPIC 4 Economic ef�ciency and equity as contemporary economic issues 197
c04EconomicEf�ciencyAndEquityAsContemporaryEconomicIssues 197 4 October 2016 1:18 PM
Referring to �gure 4.19, notice on the receipts side of the budget the relative importance of income and company taxes, while on the outlays side, welfare, health and education are clearly government priorities.
Using budget decisions to help promote the goal of an equitable income distribution
Income inequality exists but progressive income tax is used by the Australian government to help reduce the degree of income inequality. By especially targeting higher income earners, the gap between the rich and poor is reduced and the government can use the money raised from taxation to provide assistance to the neediest individuals.
On their own, various budget receipts and outlays have reduced Australia’s Gini coef�cient by around 40 per cent to 0.333. By any standard, this is a very signi�cant level of government redistribution of income. There are a number of important budget decisions that have made this possible.
1. Using different taxes to affect the distribution of incomeThere are three main types of taxes found in the Australian government’s annual budget: progressive, pro-portional and regressive.Progressive income taxes
Progressive income tax can help reduce inequality and ultimately promote equity. Direct progressive income taxes (e.g. PAYG or ‘pay as you go’ personal income tax, capital gains tax) are those where the marginal tax rate (i.e. the tax expressed as a percentage of income) rises as income increases. In the case of personal income tax (up to July 2016), the standard rate increased from the lowest 0 per cent on low incomes up to $18 200 per year all the way up to a top marginal rate of 47 per cent on those dollars in excess of $180 000 per year.
Progressive income tax helps to alleviate poverty by taking a larger proportion (percentage) of income from the rich than from those on low incomes. The money raised in this way potentially becomes available to pay for welfare bene�ts and the provision of essential services (e.g. public health and education) to the neediest. In other words, by lowering the disposable income of those at the upper end of the scale, the policy directly promotes greater equality by narrowing the income gap.
Table 4.1 also shows how the Australian government has changed the rates of personal income tax. In par-ticular, note the very large rise in the tax-free threshold in July 2012 from a maximum of $6000 to $18 200 per year, along with other changes in rates and tax brackets.
In addition, going back further than the period shown, personal income tax rates overall have been cut from a top rate of 70 per cent to 47 per cent, making them less steeply progressive and allowing for greater inequality. One reason for this change is that some supply-side economists believe that high income tax rates discourage personal effort, motivation and ef�ciency because the government takes a larger percentage of any extra income gained. They note that this slows GDP, incomes and living standards.
UNCORRECTED
UNCORRECTED
UNCORRECTED Income inequality exists but progressive income tax is used by the Australian government to help reduce the degree of
UNCORRECTED Income inequality exists but progressive income tax is used by the Australian government to help reduce the degree of income inequality. By especially targeting higher income earners, the gap between the rich and poor is reduced and the
UNCORRECTED income inequality. By especially targeting higher income earners, the gap between the rich and poor is reduced and the government can use the money raised from taxation to provide assistance to the neediest individuals.
UNCORRECTED government can use the money raised from taxation to provide assistance to the neediest individuals.
On their own, various budget receipts and outlays have reduced Australia’s Gini coef�cient by around
UNCORRECTED On their own, various budget receipts and outlays have reduced Australia’s Gini coef�cient by around
40 per cent to 0.333. By any standard, this is a very signi�cant level of government
UNCORRECTED
40 per cent to 0.333. By any standard, this is a very signi�cant level of government There are a number of important budget decisions that have made this possible.
UNCORRECTED
There are a number of important budget decisions that have made this possible.
ing different taxes to affect the distribution of income
UNCORRECTED
ing different taxes to affect the distribution of incomeThere are three main types of taxes found in the Australian government’s annual budget: progressive, pro
UNCORRECTED
There are three main types of taxes found in the Australian government’s annual budget: progressive, proportional and regressive.
UNCORRECTED
portional and regressive.Progressive income taxes
UNCORRECTED
Progressive income taxes
Progressive income tax can help reduce inequality and ultimately promote equity.
UNCORRECTED
Progressive income tax can help reduce inequality and ultimately promote equity. taxes (e.g. PAYG or ‘pay as you go’ personal income tax, capital gains tax) are those where the marginal tax
UNCORRECTED
taxes (e.g. PAYG or ‘pay as you go’ personal income tax, capital gains tax) are those where the marginal tax rate (i.e. the tax expressed as a percentage of income) rises as income increases. In the case of personal income
UNCORRECTED
rate (i.e. the tax expressed as a percentage of income) rises as income increases. In the case of personal income tax (up to July 2016), the standard rate increased from the lowest 0 per cent on low incomes up to $18
UNCORRECTED
tax (up to July 2016), the standard rate increased from the lowest 0 per cent on low incomes up to $18year all the way up to a top marginal rate of 47 per cent on those dollars in excess of $180UNCORRECTED
year all the way up to a top marginal rate of 47 per cent on those dollars in excess of $180Progressive income tax helps to alleviate poverty by taking a larger UNCORRECTED
Progressive income tax helps to alleviate poverty by taking a larger
PAGE
PAGE PROOFS
PROOFS
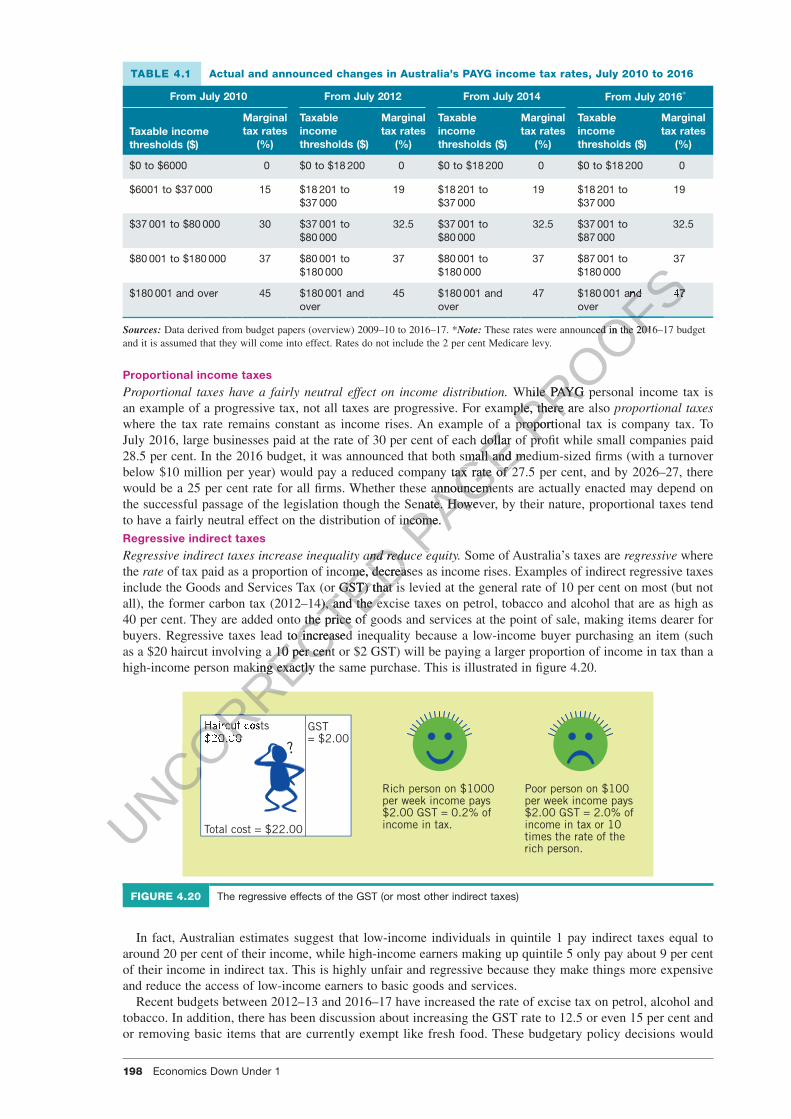
198 Economics Down Under 1
c04EconomicEf�ciencyAndEquityAsContemporaryEconomicIssues 198 4 October 2016 1:18 PM
TABLE 4.1 Actual and announced changes in Australia’s PAYG income tax rates, July 2010 to 2016
From July 2010 From July 2012 From July 2014 From July 2016*
Taxable income thresholds ($)
Marginal tax rates
(%)
Taxable income thresholds ($)
Marginal tax rates
(%)
Taxable income thresholds ($)
Marginal tax rates
(%)
Taxable income thresholds ($)
Marginal tax rates
(%)
$0 to $6000 0 $0 to $18 200 0 $0 to $18 200 0 $0 to $18 200 0
$6001 to $37 000 15 $18 201 to $37 000
19 $18 201 to $37 000
19 $18 201 to $37 000
19
$37 001 to $80 000 30 $37 001 to $80 000
32.5 $37 001 to $80 000
32.5 $37 001 to $87 000
32.5
$80 001 to $180 000 37 $80 001 to $180 000
37 $80 001 to $180 000
37 $87 001 to $180 000
37
$180 001 and over 45 $180 001 and over
45 $180 001 and over
47 $180 001 and over
47
Sources: Data derived from budget papers (overview) 2009–10 to 2016–17. *Note: These rates were announced in the 2016–17 budget and it is assumed that they will come into effect. Rates do not include the 2 per cent Medicare levy.
Proportional income taxes
Proportional taxes have a fairly neutral effect on income distribution. While PAYG personal income tax is an example of a progressive tax, not all taxes are progressive. For example, there are also proportional taxes where the tax rate remains constant as income rises. An example of a proportional tax is company tax. To July 2016, large businesses paid at the rate of 30 per cent of each dollar of pro�t while small companies paid 28.5 per cent. In the 2016 budget, it was announced that both small and medium-sized �rms (with a turnover below $10 million per year) would pay a reduced company tax rate of 27.5 per cent, and by 2026–27, there would be a 25 per cent rate for all �rms. Whether these announcements are actually enacted may depend on the successful passage of the legislation though the Senate. However, by their nature, proportional taxes tend to have a fairly neutral effect on the distribution of income.Regressive indirect taxes
Regressive indirect taxes increase inequality and reduce equity. Some of Australia’s taxes are regressive where the rate of tax paid as a proportion of income, decreases as income rises. Examples of indirect regressive taxes include the Goods and Services Tax (or GST) that is levied at the general rate of 10 per cent on most (but not all), the former carbon tax (2012–14), and the excise taxes on petrol, tobacco and alcohol that are as high as 40 per cent. They are added onto the price of goods and services at the point of sale, making items dearer for buyers. Regressive taxes lead to increased inequality because a low-income buyer purchasing an item (such as a $20 haircut involving a 10 per cent or $2 GST) will be paying a larger proportion of income in tax than a high-income person making exactly the same purchase. This is illustrated in �gure 4.20.
Haircut costs $20.00
Total cost = $22.00
GST= $2.00
Rich person on $1000 per week income pays $2.00 GST = 0.2% of income in tax.
Poor person on $100 per week income pays $2.00 GST = 2.0% of income in tax or 10 times the rate of the rich person.
?
FIGURE 4.20 The regressive effects of the GST (or most other indirect taxes)
In fact, Australian estimates suggest that low-income individuals in quintile 1 pay indirect taxes equal to around 20 per cent of their income, while high-income earners making up quintile 5 only pay about 9 per cent of their income in indirect tax. This is highly unfair and regressive because they make things more expensive and reduce the access of low-income earners to basic goods and services.
Recent budgets between 2012–13 and 2016–17 have increased the rate of excise tax on petrol, alcohol and tobacco. In addition, there has been discussion about increasing the GST rate to 12.5 or even 15 per cent and or removing basic items that are currently exempt like fresh food. These budgetary policy decisions would
UNCORRECTED Regressive indirect taxes increase inequality and reduce equity.
UNCORRECTED Regressive indirect taxes increase inequality and reduce equity.
UNCORRECTED of tax paid as a proportion of income, decreases as income rises. Examples of indirect regressive taxes
UNCORRECTED of tax paid as a proportion of income, decreases as income rises. Examples of indirect regressive taxes
include the Goods and Services Tax (or GST) that is levied at the general rate of 10 per cent on most (but not
UNCORRECTED include the Goods and Services Tax (or GST) that is levied at the general rate of 10 per cent on most (but not all), the former carbon tax (2012–14), and the excise taxes on petrol, tobacco and alcohol that are as high as
UNCORRECTED all), the former carbon tax (2012–14), and the excise taxes on petrol, tobacco and alcohol that are as high as 40 per cent. They are added onto the price of goods and services at the point of sale, making items dearer for
UNCORRECTED 40 per cent. They are added onto the price of goods and services at the point of sale, making items dearer for buyers. Regressive taxes lead to increased inequality because a low-income buyer purchasing an item (such
UNCORRECTED buyers. Regressive taxes lead to increased inequality because a low-income buyer purchasing an item (such as a $20 haircut involving a 10 per cent or $2 GST) will be paying a larger proportion of income in tax than a
UNCORRECTED
as a $20 haircut involving a 10 per cent or $2 GST) will be paying a larger proportion of income in tax than a high-income person making exactly the same purchase. This is illustrated in �gure 4.20.
UNCORRECTED
high-income person making exactly the same purchase. This is illustrated in �gure 4.20.
UNCORRECTED
UNCORRECTED
UNCORRECTED
UNCORRECTED
UNCORRECTED
UNCORRECTED
UNCORRECTED
Haircut costs
UNCORRECTED
Haircut costs $20.00
UNCORRECTED
$20.00
PAGE where the tax rate remains constant as income rises. An example of a proportional tax is company tax. To
PAGE where the tax rate remains constant as income rises. An example of a proportional tax is company tax. To July 2016, large businesses paid at the rate of 30 per cent of each dollar of pro�t while small companies paid
PAGE July 2016, large businesses paid at the rate of 30 per cent of each dollar of pro�t while small companies paid 28.5 per cent. In the 2016 budget, it was announced that both small and medium-sized �rms (with a turnover
PAGE 28.5 per cent. In the 2016 budget, it was announced that both small and medium-sized �rms (with a turnover below $10 million per year) would pay a reduced company tax rate of 27.5 per cent, and by 2026–27, there
PAGE below $10 million per year) would pay a reduced company tax rate of 27.5 per cent, and by 2026–27, there would be a 25 per cent rate for all �rms. Whether these announcements are actually enacted may depend on
PAGE would be a 25 per cent rate for all �rms. Whether these announcements are actually enacted may depend on the successful passage of the legislation though the Senate. However, by their nature, proportional taxes tend
PAGE the successful passage of the legislation though the Senate. However, by their nature, proportional taxes tend to have a fairly neutral effect on the distribution of income.PAGE to have a fairly neutral effect on the distribution of income.
Regressive indirect taxes increase inequality and reduce equity.PAGE
Regressive indirect taxes increase inequality and reduce equity.
PROOFS
PROOFS
PROOFS
PROOFS
PROOFS
PROOFSand
PROOFSand 47
PROOFS47
These rates were announced in the 2016–17 budget
PROOFS These rates were announced in the 2016–17 budget
While PAYG personal income tax is
PROOFSWhile PAYG personal income tax is
an example of a progressive tax, not all taxes are progressive. For example, there are also PROOFS
an example of a progressive tax, not all taxes are progressive. For example, there are also where the tax rate remains constant as income rises. An example of a proportional tax is company tax. To PROOFS
where the tax rate remains constant as income rises. An example of a proportional tax is company tax. To July 2016, large businesses paid at the rate of 30 per cent of each dollar of pro�t while small companies paid PROOFS
July 2016, large businesses paid at the rate of 30 per cent of each dollar of pro�t while small companies paid

TOPIC 4 Economic ef�ciency and equity as contemporary economic issues 199
c04EconomicEf�ciencyAndEquityAsContemporaryEconomicIssues 199 4 October 2016 1:18 PM
tend to reduce equity. One exception to the regressive nature of most indirect excise taxes is the luxury car tax. This is only applied to expensive imported vehicles that are typically purchased by those on higher incomes.A review of various types of tax found in the budget
So far under budgetary policy, we have seen that there are three types of tax — progressive, proportional and regressive taxes. Each affects the distribution of income in different ways. Only progressive taxes narrow the income gap, while regressive taxes widen inequality. Table 4.2 illustrates some of the features of these taxes.
TABLE 4.2 Features of hypothetical progressive, regressive and proportional taxes
Annual taxable income ($)
Amount of tax ($) and average tax rate (%)
applicable for a ‘progressive’ tax
Amount of tax ($) and average tax rate (%)
applicable for a ‘regressive’ tax
Amount of tax ($) and average tax rate (%) applicable for a
‘proportional’ tax
$5000 $0 tax = a rate of 0% $1000 tax = a rate of 20% $1000 tax = a rate of 20%
$10 000 $1000 tax = a rate of 10% $1500 tax = a rate of 15% $2000 tax = a rate of 20%
$15 000 $3000 tax = a rate of 20% $1800 tax = a rate of 12% $3000 tax = a rate of 20%
Impact of tax on income distribution
Has a levelling effect on the distribution of incomese.g. personal income tax is a progressive tax
Causes income distribution to become more unevene.g. the GST is a regressive tax
Has a fairly neutral impact on the distribution of incomee.g. company tax is a proportional tax
2. Using cash welfare payments to promote equityWelfare bene�ts are an important outlay in the Australian government’s budget, accounting for around 35 per cent of all expenses. Income support has the potential to promote equity. It represents cash bene�ts (typically around $250 to $350 per week) that are adjusted upwards or indexed as consumer prices and the cost of living go up. This is designed to help protect their purchasing power. A means test (income test or cut-off) or an assets test (wealth test) is also used by Centrelink to exclude high-income and wealthy indi-viduals from gaining access to welfare and to better target those most in need of help. Welfare works to promote equity by lifting the incomes of the poor so they can purchase basic goods and services and enjoy reasonable living standards.
The federal government provides a wide range of cash welfare assistance (i.e. also called transfer payments). Some of the major forms of income support are summarised in table 4.3 and include the age pension, family tax bene�t, disability pension, parenting payment, Newstart unemployment allowance and youth allowance.
TABLE 4.3 Some types of welfare assistance offered by the Australian government (June 2016)
Name of bene�t Target groupMaximum value per fortnight ($ rounded)
Age pension (single) Aged person (single or couples) who are retired 794.80
Newstart Unemployed over 21 years while looking for work 737.10
Youth allowance Unemployed, undertaking full-time study or training 737.10
Austudy (single with children) Those in full-time study to cover expenses 567.60
Abstudy Indigenous individuals to help cover the cost of education and training
567.60
Family tax bene�t (one child) Lower income couples with one child 262.50
Carer allowance People prevented from working because they are caring for a dependent
123.50
Rent assistance To help cover the cost of housing or rent 456.35
Illness, injury or disability payments Sick, injured or disabled people who temporarily cannot work
873.90
Source: Data derived from Department of Human Services, Centrelink.
3. Providing free or subsidised government services or merit goods to promote equityFederal and state governments use their budgets to provide a range of community services (e.g. public edu-cation, health, some prescription drugs and housing) free of direct charge or at a relatively low, subsidised price. These are regarded as merit goods because if not paid for by the government, they would be underproduced
UNCORRECTED promote equity by lifting the incomes of the poor so they can purchase basic goods and services and enjoy
UNCORRECTED promote equity by lifting the incomes of the poor so they can purchase basic goods and services and enjoy
The federal government provides a wide range of cash welfare assistance (i.e. also called transfer payments).
UNCORRECTED The federal government provides a wide range of cash welfare assistance (i.e. also called transfer payments).
Some of the major forms of income support are summarised in table 4.3 and include the age pension, family
UNCORRECTED Some of the major forms of income support are summarised in table 4.3 and include the age pension, family tax bene�t, disability pension, parenting payment, Newstart unemployment allowance and youth allowance.
UNCORRECTED tax bene�t, disability pension, parenting payment, Newstart unemployment allowance and youth allowance.
UNCORRECTED
UNCORRECTED
UNCORRECTED
UNCORRECTED
UNCORRECTED
UNCORRECTED
UNCORRECTED me types of welfare assistance offered by the
UNCORRECTED me types of welfare assistance offered by the
Austudy (single with children)
UNCORRECTED
Austudy (single with children)
Family tax bene�t (one child)UNCORRECTED
Family tax bene�t (one child)
Carer allowanceUNCORRECTED
Carer allowance
PAGE Welfare bene�ts are an important outlay in the Australian government’s budget, accounting for around
PAGE Welfare bene�ts are an important outlay in the Australian government’s budget, accounting for around 35 per cent of all expenses. Income support has the potential to promote equity. It represents cash bene�ts
PAGE 35 per cent of all expenses. Income support has the potential to promote equity. It represents cash bene�ts (typically around $250 to $350 per week) that are adjusted upwards or indexed as consumer prices and the
PAGE (typically around $250 to $350 per week) that are adjusted upwards or indexed as consumer prices and the cost of living go up. This is designed to help protect their purchasing power. A
PAGE cost of living go up. This is designed to help protect their purchasing power. A
(wealth test) is also used by Centrelink to exclude high-income and wealthy indi
PAGE (wealth test) is also used by Centrelink to exclude high-income and wealthy indi
viduals from gaining access to welfare and to better target those most in need of help. Welfare works to PAGE viduals from gaining access to welfare and to better target those most in need of help. Welfare works to promote equity by lifting the incomes of the poor so they can purchase basic goods and services and enjoy PAGE
promote equity by lifting the incomes of the poor so they can purchase basic goods and services and enjoy
PROOFS
PROOFS
PROOFS
PROOFS a rate of 20%
PROOFS a rate of 20%
a rate of 20%
PROOFS a rate of 20%
a rate of 20%
PROOFS a rate of 20%
Has a fairly neutral impact
PROOFSHas a fairly neutral impact on the distribution of income
PROOFSon the distribution of incomee.g. company tax is a
PROOFSe.g. company tax is a proportional tax
PROOFSproportional tax
200 Economics Down Under 1
c04EconomicEf�ciencyAndEquityAsContemporaryEconomicIssues 200 4 October 2016 1:18 PM
and too expensive for ordinary families. Providing these makes these services more affordable for the poor than would otherwise be the case.
From the point of view of the poor, having access to these government services is as good as having extra income. Indeed, it has been estimated that government services provide a cost saving or bene�t of around $300–$400 a week for those individuals in the lowest two income quintiles (but less than half of this amount for those in quintile 5). However, with the Australian government’s weakened �nancial position involving large budget de�cits (where budget receipts are less than budget outlays), there has been an attempt by the government to recover some of the costs of providing services through a shift towards the ‘user-pays principle’ (i.e. consumers of these services are expected to pay the cost to the government of producing these items). Examples here can be found especially in areas like transport, education and health. This trend is likely to increase inequality.
4. Encouraging superannuation contributions to promote equityAustralia has an ageing population which is living longer, yet there is a declining proportion of the population who are of working age and paying taxes to support these older people. When people no longer work, they usually have lower incomes or none at all. This has helped to create pressure on our welfare system. To ease this problem and starting in 1992, the Australian government introduced the superannuation guarantee charge (SGC). This is a levy which requires employers to make retirement contributions on behalf of their workers. In 1992, the contribution was 3 per cent of the employee’s pay, but by 2015 this had increased to 9.5 per cent with further rises to 12 per cent scheduled for the coming years. By helping ordinary workers to retire with more adequate superannuation, the burden on the nation’s �nances is eased and it is hoped that retirees should be able to enjoy better living standards and live above the poverty line.
The budget also uses very attractive tax concessions to encourage people to put money aside into personal superannuation funds voluntarily (called salary sacri�ce) while they are still working. While this does build retirement savings for those who are better off and can afford to save, it does little to help those on low incomes. Additionally, providing such generous tax concessions that are mostly of use to those on higher incomes seems highly unfair, weakening the government’s budget position and making the provision of merit goods and welfare for the neediest less affordable and sustainable.
Using the budget to help reduce in�ation and unemployment, to help promote equityGenerally, rising prices or in�ation as well as unemployment cause inequality and lead to an inequitable dis-tribution of Australia’s income. Both reduce the purchasing power of individuals. To help avoid in�ationary booms or recessions where there is high unemployment, the Australian government uses the budget as a stabil-iser of spending or AD by adopting either a contractionary or expansionary approach. For this to happen, the budget must be applied in a countercyclical way. • In an in�ationary boom, the budget typically becomes contractionary involving rises in receipts and reduc-
tions in some outlays that slow AD. • In a recession, the budget typically becomes expansionary through lower tax receipts and higher budget
outlays that boost AD.
Using budget decisions to help promote the goal of an ef�cient allocation of resourcesThe Australian government’s budget is also an effective instrument that can help to promote an ef�cient allo-cation of resources. In particular, it can boost both technical and allocative ef�ciency by making changes to key tax rates and budget outlays. Let us take a closer look at a few of these policy measures.
1. Using lower tax rates to increase ef�ciencySome supply-side economists believe that high rates of personal income (PAYG) tax or company tax discourage effort by punishing the most ef�cient and productive. For instance, with progressive income taxes, working longer hours, gaining promotion or undertaking extra training are discouraged because the government will keep an increasing percentage of their income. In addition, faced with high rates of company tax, businesses too are reluctant to take risks or invest in new technology. This makes them less ef�cient and competitive.
Based on these ideas, these economists suggest that tax rates on personal incomes and company pro�ts should be slashed to increase the incentives for businesses and individuals to be more productive or ef�cient (even though this may lead to more income inequality). Over the decades, it is clear that their ideas have been very in�uential in shaping taxation policy within the budget. For example: • the top marginal rate of personal income tax in Australia used to be around 75 per cent up to 1951–52, but
has gradually been reduced to an expected 45 per cent from July 2016. • the top rate of company tax used to be 49 per cent in 1986–87. Now it is 30 per cent for large �rms and, if
implemented, 27.5 per cent for small to medium-sized businesses from july 2016, and 25 per cent has been proposed for all businesses from 2026–27.
UNCORRECTED Generally, rising prices or in�ation as well as unemployment cause inequality and lead to an inequitable dis
UNCORRECTED Generally, rising prices or in�ation as well as unemployment cause inequality and lead to an inequitable distribution of Australia’s income. Both reduce the purchasing power of individuals. To help avoid in�ationary
UNCORRECTED tribution of Australia’s income. Both reduce the purchasing power of individuals. To help avoid in�ationary booms or recessions where there is high unemployment, the Australian government uses the budget as a stabil
UNCORRECTED booms or recessions where there is high unemployment, the Australian government uses the budget as a stabiliser of spending or AD by adopting either a contractionary or expansionary approach. For this to happen, the
UNCORRECTED iser of spending or AD by adopting either a contractionary or expansionary approach. For this to happen, the budget must be applied in a countercyclical way.
UNCORRECTED budget must be applied in a countercyclical way.
boom, the budget typically becomes contractionary involving rises in receipts and reduc
UNCORRECTED boom, the budget typically becomes contractionary involving rises in receipts and reduc
tions in some outlays that slow AD.
UNCORRECTED tions in some outlays that slow AD.
udget typically becomes expansionary through lower tax receipts and higher budget
UNCORRECTED
udget typically becomes expansionary through lower tax receipts and higher budget outlays that boost AD.
UNCORRECTED
outlays that boost AD.
Using budget decisions to help promote the goal of an ef�cient
UNCORRECTED
Using budget decisions to help promote the goal of an ef�cient allocation of resources
UNCORRECTED
allocation of resourcesThe Australian government’s budget is also an effective instrument that can help to promote an ef�cient allo
UNCORRECTED
The Australian government’s budget is also an effective instrument that can help to promote an ef�cient allocation of resources. In particular, it can boost both technical and allocative ef�ciency by making changes to
UNCORRECTED
cation of resources. In particular, it can boost both technical and allocative ef�ciency by making changes to key tax rates and budget outlays. Let us take a closer look at a few of these policy measures.
UNCORRECTED
key tax rates and budget outlays. Let us take a closer look at a few of these policy measures.
1.
UNCORRECTED
1. U
UNCORRECTED
Us
UNCORRECTED
sing lower tax rates to increase ef�ciency
UNCORRECTED
ing lower tax rates to increase ef�ciencySome supply-side economists believe that high rates of personal income (PAYG) tax or company tax discourage UNCORRECTED
Some supply-side economists believe that high rates of personal income (PAYG) tax or company tax discourage UNCORRECTED
effort by punishing the most ef�cient and productive. For instance, with progressive income taxes, working UNCORRECTED
effort by punishing the most ef�cient and productive. For instance, with progressive income taxes, working
PAGE retirement savings for those who are better off and can afford to save, it does little to help those on low incomes.
PAGE retirement savings for those who are better off and can afford to save, it does little to help those on low incomes. Additionally, providing such generous tax concessions that are mostly of use to those on higher incomes seems
PAGE Additionally, providing such generous tax concessions that are mostly of use to those on higher incomes seems highly unfair, weakening the government’s budget position and making the provision of merit goods and welfare
PAGE highly unfair, weakening the government’s budget position and making the provision of merit goods and welfare
ing the budget to help reduce in�ation and unemployment, to help
PAGE ing the budget to help reduce in�ation and unemployment, to help
Generally, rising prices or in�ation as well as unemployment cause inequality and lead to an inequitable disPAGE
Generally, rising prices or in�ation as well as unemployment cause inequality and lead to an inequitable dis
PROOFSwho are of working age and paying taxes to support these older people. When people no longer work, they
PROOFSwho are of working age and paying taxes to support these older people. When people no longer work, they usually have lower incomes or none at all. This has helped to create pressure on our welfare system. To ease
PROOFSusually have lower incomes or none at all. This has helped to create pressure on our welfare system. To ease superannuation guarantee charge
PROOFSsuperannuation guarantee charge). This is a levy which requires employers to make retirement contributions on behalf of their workers.
PROOFS). This is a levy which requires employers to make retirement contributions on behalf of their workers.
In 1992, the contribution was 3 per cent of the employee’s pay, but by 2015 this had increased to 9.5 per cent
PROOFSIn 1992, the contribution was 3 per cent of the employee’s pay, but by 2015 this had increased to 9.5 per cent with further rises to 12 per cent scheduled for the coming years. By helping ordinary workers to retire with
PROOFSwith further rises to 12 per cent scheduled for the coming years. By helping ordinary workers to retire with more adequate superannuation, the burden on the nation’s �nances is eased and it is hoped that retirees should
PROOFSmore adequate superannuation, the burden on the nation’s �nances is eased and it is hoped that retirees should
The budget also uses very attractive tax concessions to encourage people to put money aside into personal
PROOFS
The budget also uses very attractive tax concessions to encourage people to put money aside into personal superannuation funds voluntarily (called salary sacri�ce) while they are still working. While this does build PROOFS
superannuation funds voluntarily (called salary sacri�ce) while they are still working. While this does build retirement savings for those who are better off and can afford to save, it does little to help those on low incomes. PROOFS
retirement savings for those who are better off and can afford to save, it does little to help those on low incomes.
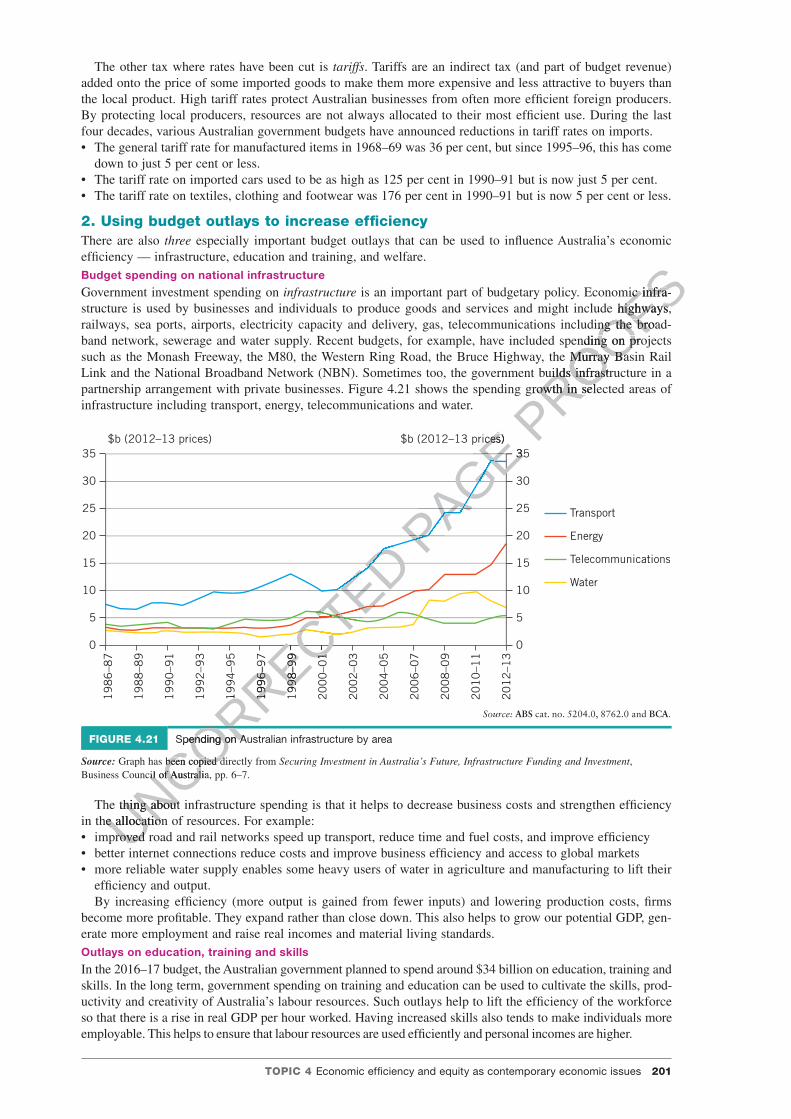
TOPIC 4 Economic ef�ciency and equity as contemporary economic issues 201
c04EconomicEf�ciencyAndEquityAsContemporaryEconomicIssues 201 4 October 2016 1:18 PM
The other tax where rates have been cut is tariffs. Tariffs are an indirect tax (and part of budget revenue) added onto the price of some imported goods to make them more expensive and less attractive to buyers than the local product. High tariff rates protect Australian businesses from often more ef�cient foreign producers. By protecting local producers, resources are not always allocated to their most ef�cient use. During the last four decades, various Australian government budgets have announced reductions in tariff rates on imports. • The general tariff rate for manufactured items in 1968–69 was 36 per cent, but since 1995–96, this has come
down to just 5 per cent or less. • The tariff rate on imported cars used to be as high as 125 per cent in 1990–91 but is now just 5 per cent. • The tariff rate on textiles, clothing and footwear was 176 per cent in 1990–91 but is now 5 per cent or less.
2. Using budget outlays to increase ef�ciencyThere are also three especially important budget outlays that can be used to in�uence Australia’s economic ef�ciency — infrastructure, education and training, and welfare.Budget spending on national infrastructure
Government investment spending on infrastructure is an important part of budgetary policy. Economic infra-structure is used by businesses and individuals to produce goods and services and might include highways, railways, sea ports, airports, electricity capacity and delivery, gas, telecommunications including the broad-band network, sewerage and water supply. Recent budgets, for example, have included spending on projects such as the Monash Freeway, the M80, the Western Ring Road, the Bruce Highway, the Murray Basin Rail Link and the National Broadband Network (NBN). Sometimes too, the government builds infrastructure in a partnership arrangement with private businesses. Figure 4.21 shows the spending growth in selected areas of infrastructure including transport, energy, telecommunications and water.
$b (2012–13 prices) $b (2012–13 prices)35
30
25
20
15
10
5
0
35
30
25
20
15
10
5
0
Source: ABS cat. no. 5204.0, 8762.0 and BCA.
19
86
–87
19
88
–89
19
90
–91
Transport
Energy
Telecommunications
Water
19
92
–93
19
94
–95
19
96
–97
19
98
–99
20
00
–01
20
02
–03
20
04
–05
20
06
–07
20
08
–09
20
10
–11
20
12
–13
FIGURE 4.21 Spending on Australian infrastructure by area
Source: Graph has been copied directly from Securing Investment in Australia’s Future, Infrastructure Funding and Investment, Business Council of Australia, pp. 6–7.
The thing about infrastructure spending is that it helps to decrease business costs and strengthen ef�ciency in the allocation of resources. For example: • improved road and rail networks speed up transport, reduce time and fuel costs, and improve ef�ciency • better internet connections reduce costs and improve business ef�ciency and access to global markets • more reliable water supply enables some heavy users of water in agriculture and manufacturing to lift their
ef�ciency and output.By increasing ef�ciency (more output is gained from fewer inputs) and lowering production costs, �rms
become more pro�table. They expand rather than close down. This also helps to grow our potential GDP, gen-erate more employment and raise real incomes and material living standards.Outlays on education, training and skills
In the 2016–17 budget, the Australian government planned to spend around $34 billion on education, training and skills. In the long term, government spending on training and education can be used to cultivate the skills, prod-uctivity and creativity of Australia’s labour resources. Such outlays help to lift the ef�ciency of the workforce so that there is a rise in real GDP per hour worked. Having increased skills also tends to make individuals more employable. This helps to ensure that labour resources are used ef�ciently and personal incomes are higher.
UNCORRECTED
UNCORRECTED
UNCORRECTED
UNCORRECTED
UNCORRECTED
UNCORRECTED
UNCORRECTED
UNCORRECTED
UNCORRECTED
UNCORRECTED
UNCORRECTED
UNCORRECTED
UNCORRECTED
19
94
–95
UNCORRECTED
19
94
–95
19
96
–97
UNCORRECTED
19
96
–97
19
98
–99
UNCORRECTED
19
98
–99
20
00
–01
UNCORRECTED
20
00
–01
UNCORRECTED
UNCORRECTED
UNCORRECTED
Spending on Australian infrastructure by area
UNCORRECTED
Spending on Australian infrastructure by area
Graph has been copied directly from
UNCORRECTED
Graph has been copied directly from Business Council of Australia, pp. 6–7.
UNCORRECTED
Business Council of Australia, pp. 6–7.
The thing about infrastructure spending is that it helps to decrease business costs and strengthen ef�ciency
UNCORRECTED
The thing about infrastructure spending is that it helps to decrease business costs and strengthen ef�ciency in the allocation of resources. For example:UNCORRECTED
in the allocation of resources. For example:improUNCORRECTED
improved road and rail networks speed up transport, reduce time and fuel costs, and improve ef�ciencyUNCORRECTED
ved road and rail networks speed up transport, reduce time and fuel costs, and improve ef�ciencyinternet connections reduce costs and improve business ef�ciency and access to global marketsUNCORRECTED
internet connections reduce costs and improve business ef�ciency and access to global markets
PAGE
PAGE
PAGE
PAGE
PAGE
PAGE
PAGE $b (2012–13 prices)
PAGE $b (2012–13 prices)35
PAGE 35
PAGE
PAGE
PAGE
PAGE PROOFS is an important part of budgetary policy. Economic infra
PROOFS is an important part of budgetary policy. Economic infra-
PROOFS-structure is used by businesses and individuals to produce goods and services and might include highways,
PROOFSstructure is used by businesses and individuals to produce goods and services and might include highways, railways, sea ports, airports, electricity capacity and delivery, gas, telecommunications including the broad
PROOFSrailways, sea ports, airports, electricity capacity and delivery, gas, telecommunications including the broadband network, sewerage and water supply. Recent budgets, for example, have included spending on projects
PROOFSband network, sewerage and water supply. Recent budgets, for example, have included spending on projects such as the Monash Freeway, the M80, the Western Ring Road, the Bruce Highway, the Murray Basin Rail
PROOFSsuch as the Monash Freeway, the M80, the Western Ring Road, the Bruce Highway, the Murray Basin Rail Link and the National Broadband Network (NBN). Sometimes too, the government builds infrastructure in a
PROOFSLink and the National Broadband Network (NBN). Sometimes too, the government builds infrastructure in a partnership arrangement with private businesses. Figure 4.21 shows the spending growth in selected areas of
PROOFSpartnership arrangement with private businesses. Figure 4.21 shows the spending growth in selected areas of
202 Economics Down Under 1
c04EconomicEf�ciencyAndEquityAsContemporaryEconomicIssues 202 4 October 2016 1:18 PM
Changes to budget outlays on welfare
Welfare or income support in the Australian government’s budget takes around 35 per cent of all outlays. Over the last decade, we have seen many changes to our welfare system with the aim of increasing ef�ciency. The main focus has been to encourage more individuals to be self-reliant and �nancially independent by getting a job and participating in work. This has involved various measures in the budget such as: • tightening welfare access for the unemployed (e.g. requirements involving working for the dole, regularly
applying for jobs and/or undertaking training), aged (e.g. increasing the pension age) and parents (e.g. required to work some hours when children reach school age)
• providing better access for parents to affordable childcare so that they can participate in work and gain employment.Through access to more labour resources, these measures have helped increase ef�ciency and thereby
expand Australia’s productive capacity and real incomes.
Weblinks The weblinks in these activities are available in this topic’s student resources tab.
• Tax the rich: An animated fairy tale• Why tax reform?
• Quick comments & quizzes• Indirect tax
CHECK YOUR UNDERSTANDING
1 What is meant by the Australian government’s goals of an equitable distribution of income and economic ef�ciency?
2 What is budgetary policy?3 Explain how budgetary policy decisions might be used to promote equity in the distribution of income.4 Giving examples, explain the main differences between progressive and regressive taxes.5 Explain how budgetary policies might be used to increase economic ef�ciency.
APPLIED ECONOMIC EXERCISES
Apply your understanding of this subtopic by accessing and completing the Applied economic exercise(s).
• School-assessed tasks > Applied economic exercises > Question 11
SCHOOL ASSESSMENT TASKS
Apply your understanding of this subtopic by accessing and completing the School assessment task(s).
• School-assessed tasks > Terminology revision• School-assessed tasks > A presentation: oral, multimedia or visual • School-assessed tasks > A class debate • School-assessed tasks > An essay
4.12 School-assessed tasksIn order to satisfactorily complete VCE Economics Unit 2, area of study 2, your teacher must assess your ability to demonstrate the general achievement of the set of outcomes speci�ed for the unit, including key knowledge and key skills for Outcome 2. You will be assessed from a selection of school-based assessment tasks. Generally, this assessment should be part of the regular teaching and learning program, and completed mainly in class and within a limited timeframe. A range of these activities has been provided in this section.
Note to teachers: Courses and assessments can change. Please check the latest VCAA assessment guide and various bulletins to ensure that all assessment requirements are met fully.
Multiple-choice test questionsInstructions: Using the multiple-choice answer grid available in this topic’s student resources tab, select the letter (A, B, C, D) that represents the most appropriate answer for each question by marking this with a tick (✓).
Digital documents
Multiple-choice answer grid: Topic 4 Searchlight ID: doc-19270
UNCORRECTED
UNCORRECTED
UNCORRECTED
UNCORRECTED Apply your understanding of this subtopic by accessing and completing the Applied economic exercise(s).
UNCORRECTED Apply your understanding of this subtopic by accessing and completing the Applied economic exercise(s).
School-assessed tasks > Applied economic exercises >
UNCORRECTED School-assessed tasks > Applied economic exercises >
UNCORRECTED
UNCORRECTED
UNCORRECTED
UNCORRECTED TASKS
UNCORRECTED TASKS
Apply your understanding of this subtopic by accessing and completing the School assessment task(s).
UNCORRECTED Apply your understanding of this subtopic by accessing and completing the School assessment task(s).
School-assessed tasks > Terminology revision
UNCORRECTED
School-assessed tasks > Terminology revisionSchool-assessed tasks > A presentation: oral, multimedia or visual
UNCORRECTED
School-assessed tasks > A presentation: oral, multimedia or visual School-assessed tasks > A class debate
UNCORRECTED
School-assessed tasks > A class debate School-assessed tasks > An essay
UNCORRECTED
School-assessed tasks > An essay
4.12 School-assessed tasks
UNCORRECTED
4.12 School-assessed tasksIn order to satisfactorily complete VCE Economics Unit 2, area of study 2, your teacher must assess your
UNCORRECTED
In order to satisfactorily complete VCE Economics Unit 2, area of study 2, your teacher must assess your ability to demonstrate the general achievement of the set of outcomes speci�ed for the unit, including key
UNCORRECTED
ability to demonstrate the general achievement of the set of outcomes speci�ed for the unit, including key knowledge
UNCORRECTED
knowledgetasks. Generally, this assessment should be part of the regular teaching and learning program, and completed UNCORRECTED
tasks. Generally, this assessment should be part of the regular teaching and learning program, and completed mainly in class and within a limited timeframe. A range of these activities has been provided in this section. UNCORRECTED
mainly in class and within a limited timeframe. A range of these activities has been provided in this section.
PAGE
PAGE
PAGE omote equity in the distribution of income.
PAGE omote equity in the distribution of income.progressive
PAGE progressive and
PAGE and
ease economic ef�ciency.
PAGE ease economic ef�ciency.
PAGE
PAGE
Apply your understanding of this subtopic by accessing and completing the Applied economic exercise(s).PAGE
Apply your understanding of this subtopic by accessing and completing the Applied economic exercise(s).
PROOFS
PROOFS
PROOFS
PROOFS
PROOFS
equitable distribution of incomePROOFS
equitable distribution of income
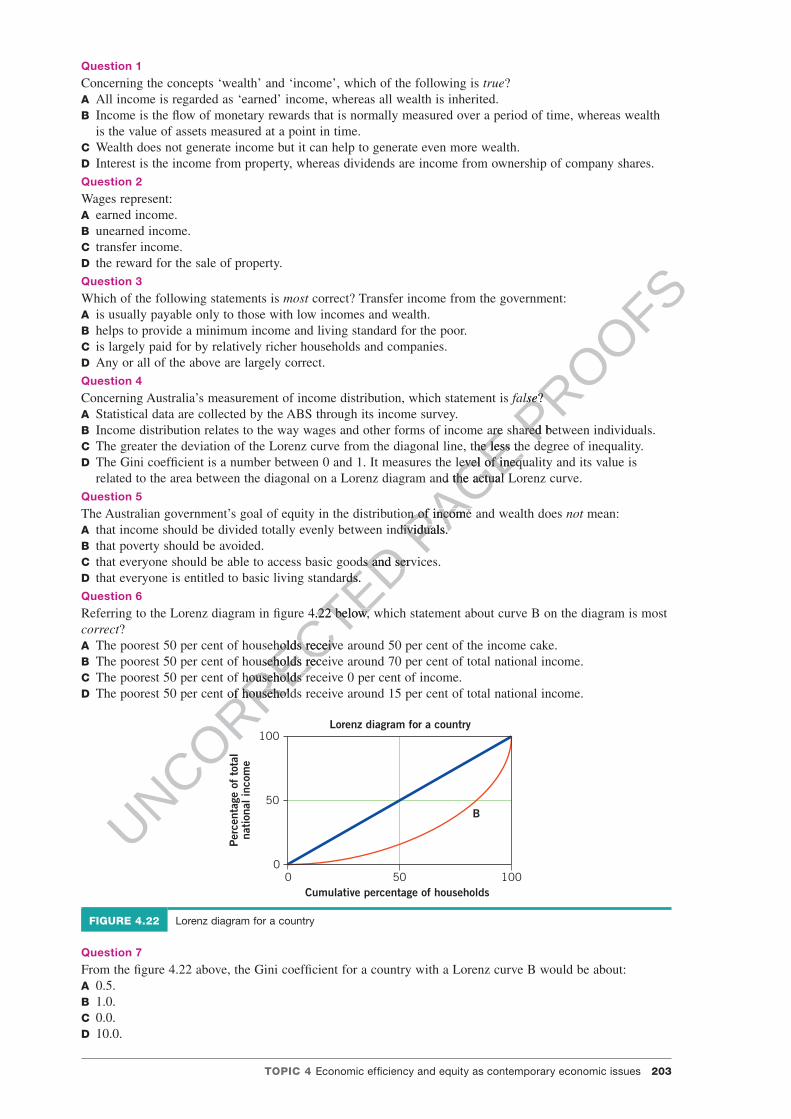
TOPIC 4 Economic ef�ciency and equity as contemporary economic issues 203
c04EconomicEf�ciencyAndEquityAsContemporaryEconomicIssues 203 4 October 2016 1:18 PM
Question 1
Concerning the concepts ‘wealth’ and ‘income’, which of the following is true?A All income is regarded as ‘earned’ income, whereas all wealth is inherited.B Income is the �ow of monetary rewards that is normally measured over a period of time, whereas wealth
is the value of assets measured at a point in time.C Wealth does not generate income but it can help to generate even more wealth.D Interest is the income from property, whereas dividends are income from ownership of company shares.Question 2
Wages represent:A earned income.B unearned income.C transfer income.D the reward for the sale of property.Question 3
Which of the following statements is most correct? Transfer income from the government:A is usually payable only to those with low incomes and wealth.B helps to provide a minimum income and living standard for the poor.C is largely paid for by relatively richer households and companies.D Any or all of the above are largely correct.Question 4
Concerning Australia’s measurement of income distribution, which statement is false?A Statistical data are collected by the ABS through its income survey.B Income distribution relates to the way wages and other forms of income are shared between individuals.C The greater the deviation of the Lorenz curve from the diagonal line, the less the degree of inequality.D The Gini coef�cient is a number between 0 and 1. It measures the level of inequality and its value is
related to the area between the diagonal on a Lorenz diagram and the actual Lorenz curve.Question 5
The Australian government’s goal of equity in the distribution of income and wealth does not mean:A that income should be divided totally evenly between individuals.B that poverty should be avoided.C that everyone should be able to access basic goods and services.D that everyone is entitled to basic living standards.Question 6
Referring to the Lorenz diagram in �gure 4.22 below, which statement about curve B on the diagram is most correct?A The poorest 50 per cent of households receive around 50 per cent of the income cake.B The poorest 50 per cent of households receive around 70 per cent of total national income.C The poorest 50 per cent of households receive 0 per cent of income.D The poorest 50 per cent of households receive around 15 per cent of total national income.
100
5000
100
Per
cent
age
of t
otal
nati
onal
inco
me
Cumulative percentage of households
Lorenz diagram for a country
B50
FIGURE 4.22 Lorenz diagram for a country
Question 7
From the �gure 4.22 above, the Gini coef�cient for a country with a Lorenz curve B would be about:A 0.5.B 1.0.C 0.0.D 10.0.
UNCORRECTED that everyone should be able to access basic goods and services.
UNCORRECTED that everyone should be able to access basic goods and services.that everyone is entitled to basic living standards.
UNCORRECTED that everyone is entitled to basic living standards.
Referring to the Lorenz diagram in �gure 4.22 below, which statement about curve B on the diagram is most
UNCORRECTED Referring to the Lorenz diagram in �gure 4.22 below, which statement about curve B on the diagram is most
The poorest 50 per cent of households receive around 50 per cent of the income cake.
UNCORRECTED The poorest 50 per cent of households receive around 50 per cent of the income cake.The poorest 50 per cent of households receive around 70 per cent of total national income.
UNCORRECTED
The poorest 50 per cent of households receive around 70 per cent of total national income.The poorest 50 per cent of households receive 0 per cent of income.
UNCORRECTED
The poorest 50 per cent of households receive 0 per cent of income.The poorest 50 per cent of households receive around 15 per cent of total national income.
UNCORRECTED
The poorest 50 per cent of households receive around 15 per cent of total national income.
PAGE Income distribution relates to the way wages and other forms of income are shared between individuals.
PAGE Income distribution relates to the way wages and other forms of income are shared between individuals.The greater the deviation of the Lorenz curve from the diagonal line, the less the degree of inequality.
PAGE The greater the deviation of the Lorenz curve from the diagonal line, the less the degree of inequality.The Gini coef�cient is a number between 0 and 1. It measures the level of inequality and its value is
PAGE The Gini coef�cient is a number between 0 and 1. It measures the level of inequality and its value is related to the area between the diagonal on a Lorenz diagram and the actual Lorenz curve.
PAGE related to the area between the diagonal on a Lorenz diagram and the actual Lorenz curve.
The Australian government’s goal of equity in the distribution of income and wealth does
PAGE The Australian government’s goal of equity in the distribution of income and wealth does
that income should be divided totally evenly between individuals.PAGE that income should be divided totally evenly between individuals.
PROOFS
false
PROOFS
false?
PROOFS
?
Income distribution relates to the way wages and other forms of income are shared between individuals.PROOFS
Income distribution relates to the way wages and other forms of income are shared between individuals.The greater the deviation of the Lorenz curve from the diagonal line, the less the degree of inequality.PROOFS
The greater the deviation of the Lorenz curve from the diagonal line, the less the degree of inequality.
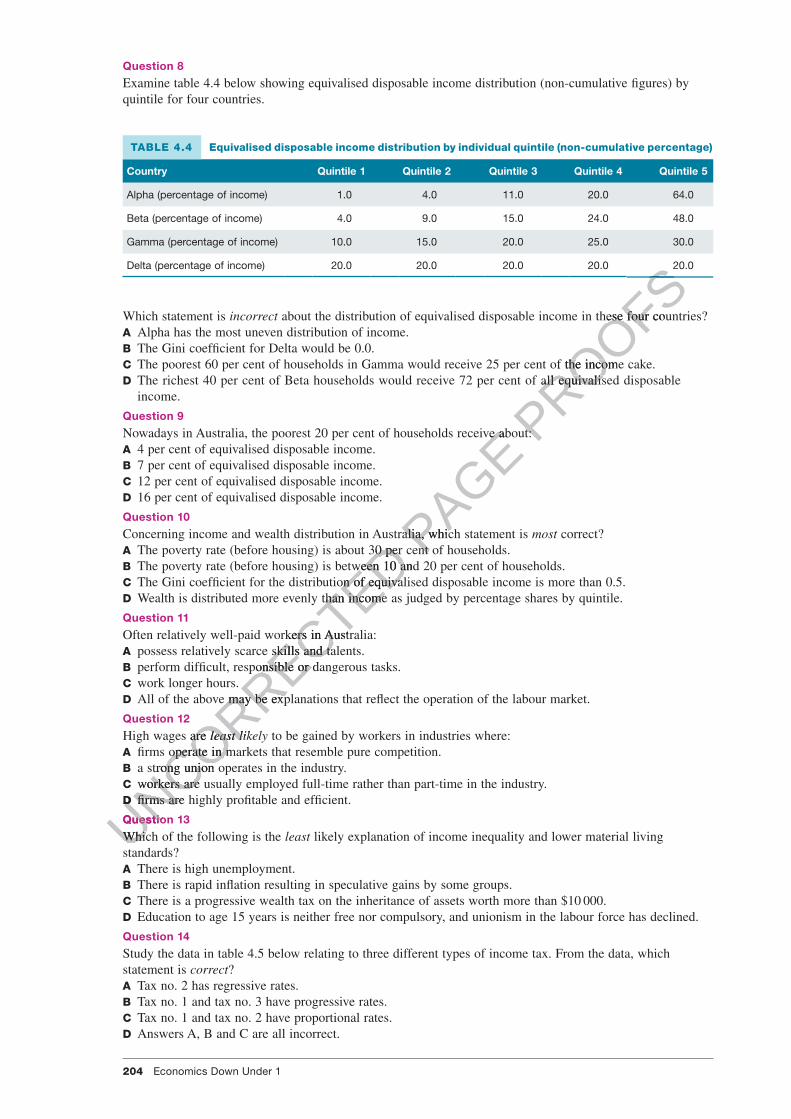
204 Economics Down Under 1
c04EconomicEf�ciencyAndEquityAsContemporaryEconomicIssues 204 4 October 2016 1:18 PM
Question 8
Examine table 4.4 below showing equivalised disposable income distribution (non-cumulative �gures) by quintile for four countries.
TABLE 4.4 Equivalised disposable income distribution by individual quintile (non-cumulative percentage)
Country Quintile 1 Quintile 2 Quintile 3 Quintile 4 Quintile 5
Alpha (percentage of income) 1.0 4.0 11.0 20.0 64.0
Beta (percentage of income) 4.0 9.0 15.0 24.0 48.0
Gamma (percentage of income) 10.0 15.0 20.0 25.0 30.0
Delta (percentage of income) 20.0 20.0 20.0 20.0 20.0
Which statement is incorrect about the distribution of equivalised disposable income in these four countries?A Alpha has the most uneven distribution of income.B The Gini coef�cient for Delta would be 0.0.C The poorest 60 per cent of households in Gamma would receive 25 per cent of the income cake.D The richest 40 per cent of Beta households would receive 72 per cent of all equivalised disposable
income.
Question 9
Nowadays in Australia, the poorest 20 per cent of households receive about:A 4 per cent of equivalised disposable income. B 7 per cent of equivalised disposable income.C 12 per cent of equivalised disposable income.D 16 per cent of equivalised disposable income.
Question 10
Concerning income and wealth distribution in Australia, which statement is most correct?A The poverty rate (before housing) is about 30 per cent of households.B The poverty rate (before housing) is between 10 and 20 per cent of households.C The Gini coef�cient for the distribution of equivalised disposable income is more than 0.5.D Wealth is distributed more evenly than income as judged by percentage shares by quintile.
Question 11
Often relatively well-paid workers in Australia:A possess relatively scarce skills and talents.B perform dif�cult, responsible or dangerous tasks.C work longer hours.D All of the above may be explanations that re�ect the operation of the labour market.
Question 12
High wages are least likely to be gained by workers in industries where:A �rms operate in markets that resemble pure competition.B a strong union operates in the industry.C workers are usually employed full-time rather than part-time in the industry.D �rms are highly pro�table and ef�cient.
Question 13
Which of the following is the least likely explanation of income inequality and lower material living standards?A There is high unemployment.B There is rapid in�ation resulting in speculative gains by some groups.C There is a progressive wealth tax on the inheritance of assets worth more than $10 000.D Education to age 15 years is neither free nor compulsory, and unionism in the labour force has declined.
Question 14
Study the data in table 4.5 below relating to three different types of income tax. From the data, which statement is correct?A Tax no. 2 has regressive rates.B Tax no. 1 and tax no. 3 have progressive rates.C Tax no. 1 and tax no. 2 have proportional rates.D Answers A, B and C are all incorrect.
UNCORRECTED Concerning income and wealth distribution in Australia, which statement is
UNCORRECTED Concerning income and wealth distribution in Australia, which statement is The poverty rate (before housing) is about 30 per cent of households.
UNCORRECTED The poverty rate (before housing) is about 30 per cent of households.The poverty rate (before housing) is between 10 and 20 per cent of households.
UNCORRECTED The poverty rate (before housing) is between 10 and 20 per cent of households.The Gini coef�cient for the distribution of equivalised disposable income is more than 0.5.
UNCORRECTED The Gini coef�cient for the distribution of equivalised disposable income is more than 0.5.Wealth is distributed more evenly than income as judged by percentage shares by quintile.
UNCORRECTED Wealth is distributed more evenly than income as judged by percentage shares by quintile.
Often relatively well-paid workers in Australia:
UNCORRECTED Often relatively well-paid workers in Australia:
possess relatively scarce skills and talents.
UNCORRECTED
possess relatively scarce skills and talents.perform dif�cult, responsible or dangerous tasks.
UNCORRECTED
perform dif�cult, responsible or dangerous tasks.work longer hours.
UNCORRECTED
work longer hours.All of the above may be explanations that re�ect the operation of the labour market.
UNCORRECTED
All of the above may be explanations that re�ect the operation of the labour market.
UNCORRECTED
High wages are
UNCORRECTED
High wages are least likely
UNCORRECTED
least likely�rms operate in markets that resemble pure competition.
UNCORRECTED
�rms operate in markets that resemble pure competition.a strong union operates in the industry.
UNCORRECTED
a strong union operates in the industry.workers are usually employed full-time rather than part-time in the industry.
UNCORRECTED
workers are usually employed full-time rather than part-time in the industry.D
UNCORRECTED
D �rms are highly pro�table and ef�cient.
UNCORRECTED
�rms are highly pro�table and ef�cient.
Question 13UNCORRECTED
Question 13UNCORRECTED
Which of the following is the UNCORRECTED
Which of the following is the standards?UNCORRECTED
standards?
PAGE Nowadays in Australia, the poorest 20 per cent of households receive about:
PAGE Nowadays in Australia, the poorest 20 per cent of households receive about:
Concerning income and wealth distribution in Australia, which statement is PAGE Concerning income and wealth distribution in Australia, which statement is
The poverty rate (before housing) is about 30 per cent of households.PAGE
The poverty rate (before housing) is about 30 per cent of households.
PROOFS
PROOFS
PROOFS about the distribution of equivalised disposable income in these four countries?
PROOFS about the distribution of equivalised disposable income in these four countries?
The poorest 60 per cent of households in Gamma would receive 25 per cent of the income cake.
PROOFSThe poorest 60 per cent of households in Gamma would receive 25 per cent of the income cake.The richest 40 per cent of Beta households would receive 72 per cent of all equivalised disposable
PROOFSThe richest 40 per cent of Beta households would receive 72 per cent of all equivalised disposable
Nowadays in Australia, the poorest 20 per cent of households receive about:PROOFS
Nowadays in Australia, the poorest 20 per cent of households receive about:
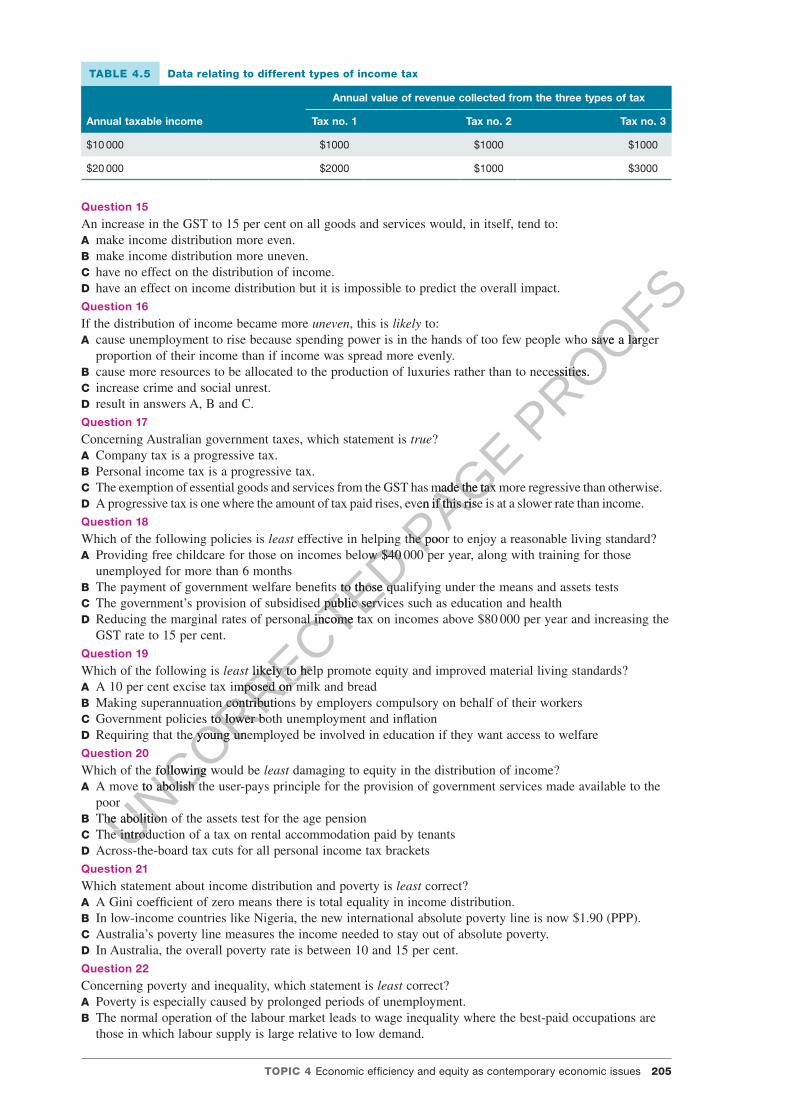
TOPIC 4 Economic ef�ciency and equity as contemporary economic issues 205
c04EconomicEf�ciencyAndEquityAsContemporaryEconomicIssues 205 4 October 2016 1:18 PM
TABLE 4.5 Data relating to different types of income tax
Annual taxable income
Annual value of revenue collected from the three types of tax
Tax no. 1 Tax no. 2 Tax no. 3
$10 000 $1000 $1000 $1000
$20 000 $2000 $1000 $3000
Question 15
An increase in the GST to 15 per cent on all goods and services would, in itself, tend to:A make income distribution more even.B make income distribution more uneven.C have no effect on the distribution of income.D have an effect on income distribution but it is impossible to predict the overall impact.Question 16
If the distribution of income became more uneven, this is likely to:A cause unemployment to rise because spending power is in the hands of too few people who save a larger
proportion of their income than if income was spread more evenly.B cause more resources to be allocated to the production of luxuries rather than to necessities.C increase crime and social unrest.D result in answers A, B and C.Question 17
Concerning Australian government taxes, which statement is true?A Company tax is a progressive tax. B Personal income tax is a progressive tax.C The exemption of essential goods and services from the GST has made the tax more regressive than otherwise.D A progressive tax is one where the amount of tax paid rises, even if this rise is at a slower rate than income.Question 18
Which of the following policies is least effective in helping the poor to enjoy a reasonable living standard?A Providing free childcare for those on incomes below $40 000 per year, along with training for those
unemployed for more than 6 monthsB The payment of government welfare bene�ts to those qualifying under the means and assets testsC The government’s provision of subsidised public services such as education and healthD Reducing the marginal rates of personal income tax on incomes above $80 000 per year and increasing the
GST rate to 15 per cent.Question 19
Which of the following is least likely to help promote equity and improved material living standards?A A 10 per cent excise tax imposed on milk and breadB Making superannuation contributions by employers compulsory on behalf of their workersC Government policies to lower both unemployment and in�ationD Requiring that the young unemployed be involved in education if they want access to welfareQuestion 20
Which of the following would be least damaging to equity in the distribution of income?A A move to abolish the user-pays principle for the provision of government services made available to the
poorB The abolition of the assets test for the age pensionC The introduction of a tax on rental accommodation paid by tenantsD Across-the-board tax cuts for all personal income tax bracketsQuestion 21
Which statement about income distribution and poverty is least correct?A A Gini coef�cient of zero means there is total equality in income distribution.B In low-income countries like Nigeria, the new international absolute poverty line is now $1.90 (PPP).C Australia’s poverty line measures the income needed to stay out of absolute poverty.D In Australia, the overall poverty rate is between 10 and 15 per cent.Question 22
Concerning poverty and inequality, which statement is least correct?A Poverty is especially caused by prolonged periods of unemployment.B The normal operation of the labour market leads to wage inequality where the best-paid occupations are
those in which labour supply is large relative to low demand.
UNCORRECTED effective in helping the poor to enjoy a reasonable living standard?
UNCORRECTED effective in helping the poor to enjoy a reasonable living standard?Providing free childcare for those on incomes below $40
UNCORRECTED Providing free childcare for those on incomes below $40
UNCORRECTED 000
UNCORRECTED 000
The payment of government welfare bene�ts to those qualifying under the means and assets tests
UNCORRECTED The payment of government welfare bene�ts to those qualifying under the means and assets testsThe government’s provision of subsidised public services such as education and health
UNCORRECTED The government’s provision of subsidised public services such as education and healthReducing the marginal rates of personal income tax on incomes above $80
UNCORRECTED Reducing the marginal rates of personal income tax on incomes above $80
likely to help promote equity and improved material living standards?
UNCORRECTED
likely to help promote equity and improved material living standards?A 10 per cent excise tax imposed on milk and bread
UNCORRECTED
A 10 per cent excise tax imposed on milk and breadMaking superannuation contributions by employers compulsory on behalf of their workers
UNCORRECTED
Making superannuation contributions by employers compulsory on behalf of their workers
UNCORRECTED
Government policies to lower both unemployment and in�ation
UNCORRECTED
Government policies to lower both unemployment and in�ationRequiring that the young unemployed be involved in education if they want access to welfare
UNCORRECTED
Requiring that the young unemployed be involved in education if they want access to welfare
Which of the following would be
UNCORRECTED
Which of the following would be A move to abolish the user-pays principle for the provision of government services made available to the
UNCORRECTED
A move to abolish the user-pays principle for the provision of government services made available to the poor
UNCORRECTED
poorThe abolition of the assets test for the age pensionUNCORRECTED
The abolition of the assets test for the age pensionThe introduction of a tax on rental accommodation paid by tenantsUNCORRECTED
The introduction of a tax on rental accommodation paid by tenantsAcross-the-board tax cuts for all personal income tax bracketsUNCORRECTED
Across-the-board tax cuts for all personal income tax brackets
PAGE The exemption of essential goods and services from the GST has made the tax more regressive than otherwise.
PAGE The exemption of essential goods and services from the GST has made the tax more regressive than otherwise.A progressive tax is one where the amount of tax paid rises, even if this rise is at a slower rate than income.
PAGE A progressive tax is one where the amount of tax paid rises, even if this rise is at a slower rate than income.
effective in helping the poor to enjoy a reasonable living standard?PAGE
effective in helping the poor to enjoy a reasonable living standard?000 PAGE
000 per year, along with training for those PAGE
per year, along with training for those
PROOFScause unemployment to rise because spending power is in the hands of too few people who save a larger
PROOFScause unemployment to rise because spending power is in the hands of too few people who save a larger
cause more resources to be allocated to the production of luxuries rather than to necessities.
PROOFScause more resources to be allocated to the production of luxuries rather than to necessities.

206 Economics Down Under 1
c04EconomicEf�ciencyAndEquityAsContemporaryEconomicIssues 206 4 October 2016 1:18 PM
C During periods of in�ation, the wealth and income of property and share speculators often rises faster than those of others in the community.
D Some government policies, like the increased reliance on the user-pays principle, can increase inequality.Question 23
Wages in mining are among the highest in Australia. Which of the following explanations would be unlikely to explain this observation?A Working conditions are often unpleasant and dangerous.B The work is often in remote areas.C The demand for mine workers is large relative to the supply of workers, especially when global economic
growth is strong.D Mine workers are less scarce than factory workers in Australia.Question 24
Which of the following measures of income is most correct?A Private income includes wages and all government welfare.B Gross income includes wages and welfare after the payment of income tax.C Earned income is that derived from the ownership of assets and investments.D Disposable income includes income from all sources minus the payment of income tax.
Question 25
Income inequality and poverty are likely to be highest among:A those on the minimum wage.B the very old.C those on welfare.D those in remote Indigenous communities.
Question 26
Which of the following is probably not the main cause of poverty in Nigeria?A The slow rate of GDP growthB Great inequality in income distributionC Government corruption and the misuse of government revenueD Ethnic con�ict and civil unrest.
Question 27
Concerning equity and inequality in the distribute incomes in Australia, which statement is false?A Equity means ensuring that everyone can enjoy a reasonable living standard at a generally acceptable level.B In one sense, the government’s goal of a fair or equitable income distribution means treating high- and
low-income earners in different ways.C Australia’s wealth (net worth) is distributed more unequally than equivalised disposable income.D An equitable distribution of income is likely to be one where the Gini coef�cient is equal to 1.
Question 28
Which statement about allocative ef�ciency and technical ef�ciency is most accurate?A Allocative ef�ciency is achieved when there is the maximum satisfaction of society’s wants, and resources
are put to their most valued uses.B Technical ef�ciency occurs when there is no waste, and production is maximised.C Allocative ef�ciency is when everyone’s wants are met.D Allocative ef�ciency generally means that the government will make most of the key economic decisions.
Question 29
Which statement about equality, inequality and ef�ciency is least correct?A There can be a con�icting relationship between achieving equity in income distribution and also ef�ciency
in the allocation of resources.B There can sometimes be a partly compatible relationship between equity and ef�ciency when government
policies are used to retrain those who are unemployed so they can gain a job.C By using various policies to promote economic ef�ciency and rapidly grow the size of the nation’s income
‘cake’, normally there is an increase in government tax revenue and its ability to support the needy, making the system more �nancially sustainable
D All of the above are incorrect.
Question 30
Concerning the use of taxes to promote equity and ef�ciency, which statement is least correct?A High tax rates on companies can discourage investment in new technology and limit business expansion
and jobs.B Very generous welfare paid at rates near the level of the minimum wage may cause a rise in the number of
welfare recipients and add to the burden on taxpayers.
UNCORRECTED in the distribute incomes in Australia, which statement is
UNCORRECTED in the distribute incomes in Australia, which statement is Equity means ensuring that everyone can enjoy a reasonable living standard at a generally acceptable level.
UNCORRECTED Equity means ensuring that everyone can enjoy a reasonable living standard at a generally acceptable level.In one sense, the government’s goal of a fair or equitable income distribution means treating high- and
UNCORRECTED In one sense, the government’s goal of a fair or equitable income distribution means treating high- and low-income earners in different ways.
UNCORRECTED low-income earners in different ways.Australia’s wealth (net worth) is distributed more unequally than equivalised disposable income.
UNCORRECTED Australia’s wealth (net worth) is distributed more unequally than equivalised disposable income.An equitable distribution of income is likely to be one where the Gini coef�cient is equal to 1.
UNCORRECTED
An equitable distribution of income is likely to be one where the Gini coef�cient is equal to 1.
Which statement about
UNCORRECTED
Which statement about allocative ef�ciency
UNCORRECTED
allocative ef�ciencyAllocative ef�ciency is achieved when there is the maximum satisfaction of society’s wants, and resources
UNCORRECTED
Allocative ef�ciency is achieved when there is the maximum satisfaction of society’s wants, and resources are put to their most valued uses.
UNCORRECTED
are put to their most valued uses.Technical ef�ciency occurs when there is no waste, and production is maximised.
UNCORRECTED
Technical ef�ciency occurs when there is no waste, and production is maximised.Allocative ef�ciency is when everyone’s wants are met.
UNCORRECTED
Allocative ef�ciency is when everyone’s wants are met.Allocative ef�ciency generally means that the government will make most of the key economic decisions.
UNCORRECTED
Allocative ef�ciency generally means that the government will make most of the key economic decisions.
UNCORRECTED
Question 29
UNCORRECTED
Question 29
Which statement about equality, inequality and ef�ciency is
UNCORRECTED
Which statement about equality, inequality and ef�ciency is A UNCORRECTED
A There can be a con�icting relationship between achieving equity in income distribution and also ef�ciency UNCORRECTED
There can be a con�icting relationship between achieving equity in income distribution and also ef�ciency in the allocation of resources.UNCORRECTED
in the allocation of resources.
PAGE the main cause of poverty in Nigeria?
PAGE the main cause of poverty in Nigeria?
Government corruption and the misuse of government revenue
PAGE Government corruption and the misuse of government revenue
PROOFSDisposable income includes income from all sources minus the payment of income tax.
PROOFSDisposable income includes income from all sources minus the payment of income tax.
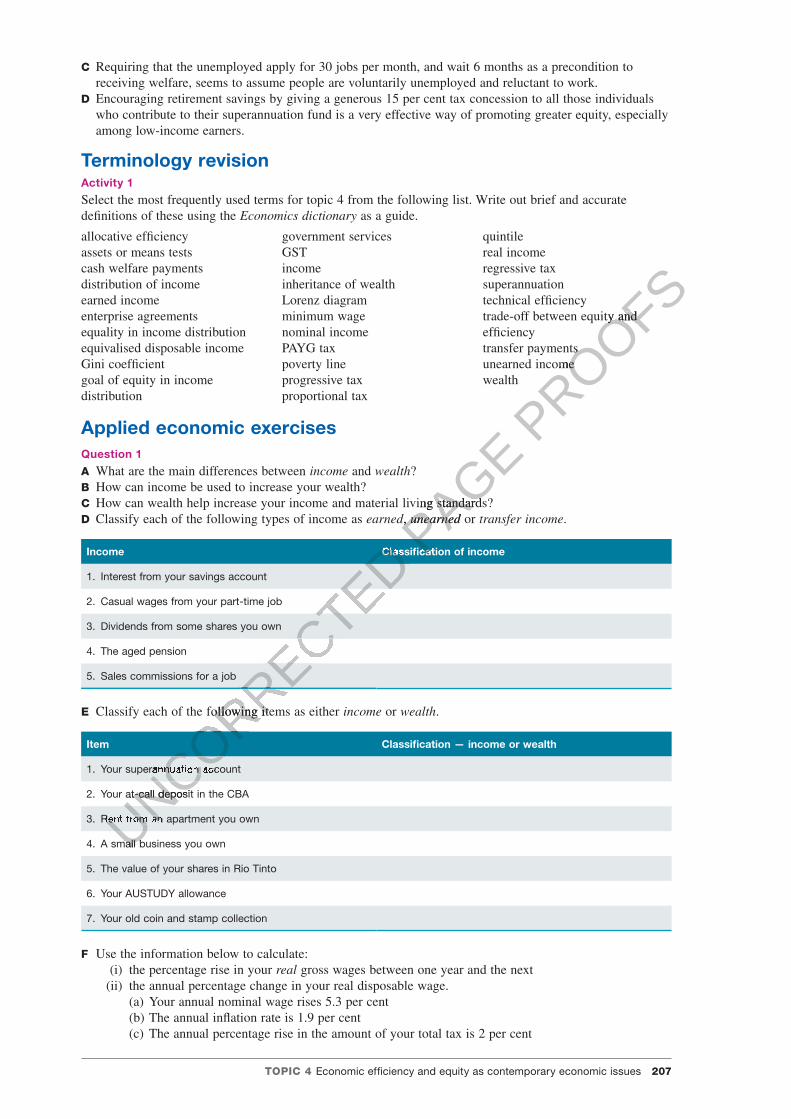
TOPIC 4 Economic ef�ciency and equity as contemporary economic issues 207
c04EconomicEf�ciencyAndEquityAsContemporaryEconomicIssues 207 4 October 2016 1:18 PM
C Requiring that the unemployed apply for 30 jobs per month, and wait 6 months as a precondition to receiving welfare, seems to assume people are voluntarily unemployed and reluctant to work.
D Encouraging retirement savings by giving a generous 15 per cent tax concession to all those individuals who contribute to their superannuation fund is a very effective way of promoting greater equity, especially among low-income earners.
Terminology revisionActivity 1
Select the most frequently used terms for topic 4 from the following list. Write out brief and accurate de�nitions of these using the Economics dictionary as a guide.
allocative ef�ciencyassets or means testscash welfare paymentsdistribution of incomeearned incomeenterprise agreementsequality in income distributionequivalised disposable incomeGini coef�cientgoal of equity in income distribution
government servicesGSTincomeinheritance of wealthLorenz diagramminimum wagenominal incomePAYG taxpoverty lineprogressive taxproportional tax
quintilereal incomeregressive taxsuperannuationtechnical ef�ciencytrade-off between equity and ef�ciencytransfer paymentsunearned incomewealth
Applied economic exercisesQuestion 1
A What are the main differences between income and wealth?B How can income be used to increase your wealth?C How can wealth help increase your income and material living standards?D Classify each of the following types of income as earned, unearned or transfer income.
Income Classi�cation of income
1. Interest from your savings account
2. Casual wages from your part-time job
3. Dividends from some shares you own
4. The aged pension
5. Sales commissions for a job
E Classify each of the following items as either income or wealth.
Item Classi�cation — income or wealth
1. Your superannuation account
2. Your at-call deposit in the CBA
3. Rent from an apartment you own
4. A small business you own
5. The value of your shares in Rio Tinto
6. Your AUSTUDY allowance
7. Your old coin and stamp collection
F Use the information below to calculate: (i) the percentage rise in your real gross wages between one year and the next
(ii) the annual percentage change in your real disposable wage.(a) Your annual nominal wage rises 5.3 per cent(b) The annual in�ation rate is 1.9 per cent(c) The annual percentage rise in the amount of your total tax is 2 per cent
UNCORRECTED
UNCORRECTED
UNCORRECTED
UNCORRECTED Classi�cation of income
UNCORRECTED Classi�cation of income
Classify each of the following items as either
UNCORRECTED
Classify each of the following items as either
UNCORRECTED
UNCORRECTED
UNCORRECTED
UNCORRECTED
UNCORRECTED
UNCORRECTED
our superannuation account
UNCORRECTED
our superannuation account
our at-call deposit in the CBA
UNCORRECTED
our at-call deposit in the CBA
Rent frUNCORRECTED
Rent from an apartment you ownUNCORRECTED
om an apartment you own
A small business you ownUNCORRECTED
A small business you own
PAGE How can wealth help increase your income and material living standards?
PAGE How can wealth help increase your income and material living standards?
earned PAGE earned, PAGE
, unearned PAGE unearned PAGE
Classi�cation of incomePAGE
Classi�cation of income
PROOFStrade-off between equity and
PROOFStrade-off between equity and
transfer payments
PROOFStransfer paymentsunearned income
PROOFSunearned income
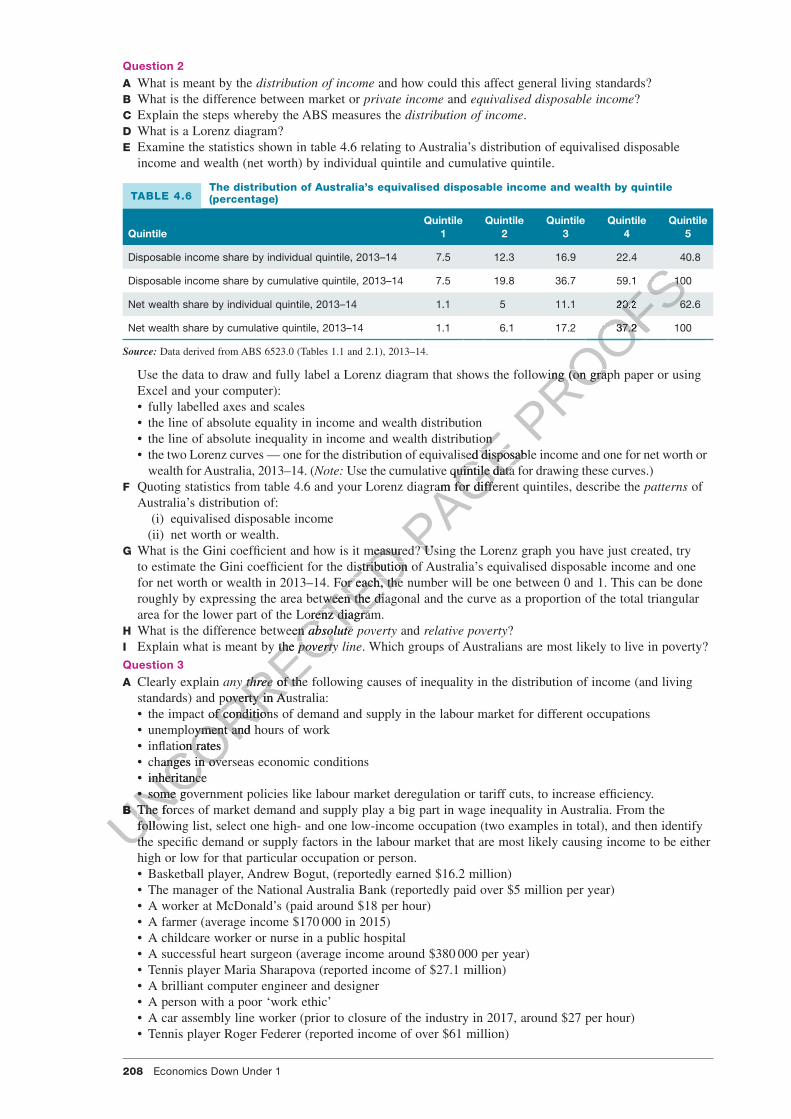
208 Economics Down Under 1
c04EconomicEf�ciencyAndEquityAsContemporaryEconomicIssues 208 4 October 2016 1:18 PM
Question 2
A What is meant by the distribution of income and how could this affect general living standards?B What is the difference between market or private income and equivalised disposable income?C Explain the steps whereby the ABS measures the distribution of income.D What is a Lorenz diagram?E Examine the statistics shown in table 4.6 relating to Australia’s distribution of equivalised disposable
income and wealth (net worth) by individual quintile and cumulative quintile.
TABLE 4.6The distribution of Australia’s equivalised disposable income and wealth by quintile (percentage)
QuintileQuintile
1Quintile
2Quintile
3Quintile
4Quintile
5
Disposable income share by individual quintile, 2013–14 7.5 12.3 16.9 22.4 40.8
Disposable income share by cumulative quintile, 2013–14 7.5 19.8 36.7 59.1 100
Net wealth share by individual quintile, 2013–14 1.1 5 11.1 20.2 62.6
Net wealth share by cumulative quintile, 2013–14 1.1 6.1 17.2 37.2 100
Source: Data derived from ABS 6523.0 (Tables 1.1 and 2.1), 2013–14.
Use the data to draw and fully label a Lorenz diagram that shows the following (on graph paper or using Excel and your computer): • fully labelled axes and scales • the line of absolute equality in income and wealth distribution • the line of absolute inequality in income and wealth distribution • the two Lorenz curves — one for the distribution of equivalised disposable income and one for net worth or wealth for Australia, 2013–14. (Note: Use the cumulative quintile data for drawing these curves.)
F Quoting statistics from table 4.6 and your Lorenz diagram for different quintiles, describe the patterns of Australia’s distribution of:
(i) equivalised disposable income (ii) net worth or wealth.G What is the Gini coef�cient and how is it measured? Using the Lorenz graph you have just created, try
to estimate the Gini coef�cient for the distribution of Australia’s equivalised disposable income and one for net worth or wealth in 2013–14. For each, the number will be one between 0 and 1. This can be done roughly by expressing the area between the diagonal and the curve as a proportion of the total triangular area for the lower part of the Lorenz diagram.
H What is the difference between absolute poverty and relative poverty?I Explain what is meant by the poverty line. Which groups of Australians are most likely to live in poverty?Question 3
A Clearly explain any three of the following causes of inequality in the distribution of income (and living standards) and poverty in Australia: • the impact of conditions of demand and supply in the labour market for different occupations • unemployment and hours of work • in�ation rates • changes in overseas economic conditions • inheritance • some government policies like labour market deregulation or tariff cuts, to increase ef�ciency.
B The forces of market demand and supply play a big part in wage inequality in Australia. From the following list, select one high- and one low-income occupation (two examples in total), and then identify the speci�c demand or supply factors in the labour market that are most likely causing income to be either high or low for that particular occupation or person. • Basketball player, Andrew Bogut, (reportedly earned $16.2 million) • The manager of the National Australia Bank (reportedly paid over $5 million per year) • A worker at McDonald’s (paid around $18 per hour) • A farmer (average income $170 000 in 2015) • A childcare worker or nurse in a public hospital • A successful heart surgeon (average income around $380 000 per year) • Tennis player Maria Sharapova (reported income of $27.1 million) • A brilliant computer engineer and designer • A person with a poor ‘work ethic’ • A car assembly line worker (prior to closure of the industry in 2017, around $27 per hour) • Tennis player Roger Federer (reported income of over $61 million)
UNCORRECTED What is the Gini coef�cient and how is it measured? Using the Lorenz graph you have just created, try
UNCORRECTED What is the Gini coef�cient and how is it measured? Using the Lorenz graph you have just created, try to estimate the Gini coef�cient for the distribution of Australia’s equivalised disposable income and one
UNCORRECTED to estimate the Gini coef�cient for the distribution of Australia’s equivalised disposable income and one for net worth or wealth in 2013–14. For each, the number will be one between 0 and 1. This can be done
UNCORRECTED for net worth or wealth in 2013–14. For each, the number will be one between 0 and 1. This can be done roughly by expressing the area between the diagonal and the curve as a proportion of the total triangular
UNCORRECTED roughly by expressing the area between the diagonal and the curve as a proportion of the total triangular area for the lower part of the Lorenz diagram.
UNCORRECTED area for the lower part of the Lorenz diagram.What is the difference between
UNCORRECTED What is the difference between absolute poverty
UNCORRECTED absolute poverty
Explain what is meant by the
UNCORRECTED Explain what is meant by the poverty line
UNCORRECTED poverty line
any three
UNCORRECTED
any three of the following causes of inequality in the distribution of income (and living
UNCORRECTED
of the following causes of inequality in the distribution of income (and living standards) and poverty in Australia:
UNCORRECTED
standards) and poverty in Australia:impact of conditions of demand and supply in the labour market for different occupations
UNCORRECTED
impact of conditions of demand and supply in the labour market for different occupationsunemplo
UNCORRECTED
unemployment and hours of work
UNCORRECTED
yment and hours of workin�ation
UNCORRECTED
in�ation rates
UNCORRECTED
rateschanges
UNCORRECTED
changes in overseas economic conditions
UNCORRECTED
in overseas economic conditionsinheritance
UNCORRECTED
inheritance•
UNCORRECTED
• some
UNCORRECTED
some government policies like labour market deregulation or tariff cuts, to increase ef�ciency.
UNCORRECTED
government policies like labour market deregulation or tariff cuts, to increase ef�ciency.B
UNCORRECTED
B The forces of market demand and supply play a big part in wage inequality in Australia. From the
UNCORRECTED
The forces of market demand and supply play a big part in wage inequality in Australia. From the following list, select one high- and one low-income occupation (two examples in total), and then identify UNCORRECTED
following list, select one high- and one low-income occupation (two examples in total), and then identify the speci�c demand or supply factors in the labour market that are most likely causing income to be either UNCORRECTED
the speci�c demand or supply factors in the labour market that are most likely causing income to be either
PAGE line of absolute inequality in income and wealth distribution
PAGE line of absolute inequality in income and wealth distributiono Lorenz curves — one for the distribution of equivalised disposable income and one for net worth or
PAGE o Lorenz curves — one for the distribution of equivalised disposable income and one for net worth or Use the cumulative quintile data for drawing these curves.)
PAGE Use the cumulative quintile data for drawing these curves.)
Quoting statistics from table 4.6 and your Lorenz diagram for different quintiles, describe the
PAGE Quoting statistics from table 4.6 and your Lorenz diagram for different quintiles, describe the
What is the Gini coef�cient and how is it measured? Using the Lorenz graph you have just created, try PAGE
What is the Gini coef�cient and how is it measured? Using the Lorenz graph you have just created, try
PROOFS
PROOFS
PROOFS
PROOFS7.5 19.8 36.7 59.1 100
PROOFS7.5 19.8 36.7 59.1 100
11.1 20.2
PROOFS11.1 20.2 62.6
PROOFS62.6
17.2 37.2 100
PROOFS17.2 37.2 100
Use the data to draw and fully label a Lorenz diagram that shows the following (on graph paper or using
PROOFSUse the data to draw and fully label a Lorenz diagram that shows the following (on graph paper or using
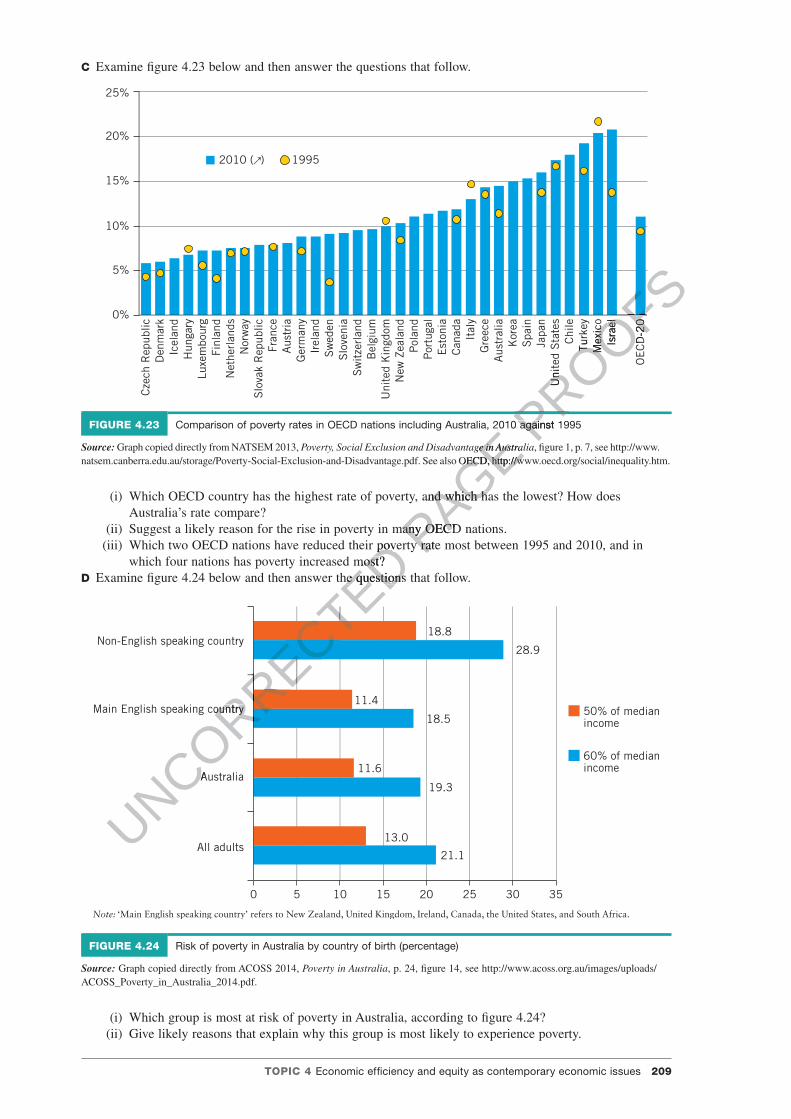
TOPIC 4 Economic ef�ciency and equity as contemporary economic issues 209
c04EconomicEf�ciencyAndEquityAsContemporaryEconomicIssues 209 4 October 2016 1:18 PM
C Examine �gure 4.23 below and then answer the questions that follow.
20%
25%
15%
10%
5%
0%
Cze
ch R
epub
licD
enm
ark
Icel
and
Hun
gary
Luxe
mbo
urg
Finl
and
Net
herl
ands
Nor
way
Slo
vak
Rep
ublic
Fran
ceA
ustr
iaG
erm
any
Irel
and
2010 ( ) 1995
Sw
eden
Slo
veni
aS
wit
zerl
and
Bel
gium
Uni
ted
Kin
gdom
New
Zea
land
Pol
and
Por
tuga
lE
ston
iaC
anad
aIt
aly
Gre
ece
Aus
tral
iaK
orea
Spa
inJa
pan
Uni
ted
Sta
tes
Chi
leTu
rkey
Mex
ico
Isra
el
OE
CD
-20
FIGURE 4.23 Comparison of poverty rates in OECD nations including Australia, 2010 against 1995
Source: Graph copied directly from NATSEM 2013, Poverty, Social Exclusion and Disadvantage in Australia, �gure 1, p. 7, see http://www.natsem.canberra.edu.au/storage/Poverty-Social-Exclusion-and-Disadvantage.pdf. See also OECD, http://www.oecd.org/social/inequality.htm.
(i) Which OECD country has the highest rate of poverty, and which has the lowest? How does Australia’s rate compare?
(ii) Suggest a likely reason for the rise in poverty in many OECD nations.(iii) Which two OECD nations have reduced their poverty rate most between 1995 and 2010, and in
which four nations has poverty increased most?D Examine �gure 4.24 below and then answer the questions that follow.
Non-English speaking country
Main English speaking country
Australia
All adults
50% of medianincome
60% of medianincome
0 5 10 15 20
21.1
13.0
19.3
11.6
18.5
18.8
28.9
11.4
25 30 35
Note: ‘Main English speaking country’ refers to New Zealand, United Kingdom, Ireland, Canada, the United States, and South Africa.
FIGURE 4.24 Risk of poverty in Australia by country of birth (percentage)
Source: Graph copied directly from ACOSS 2014, Poverty in Australia, p. 24, �gure 14, see http://www.acoss.org.au/images/uploads/ACOSS_Poverty_in_Australia_2014.pdf.
(i) Which group is most at risk of poverty in Australia, according to �gure 4.24?(ii) Give likely reasons that explain why this group is most likely to experience poverty.
UNCORRECTED two OECD nations have reduced their poverty rate most between 1995 and 2010, and in
UNCORRECTED two OECD nations have reduced their poverty rate most between 1995 and 2010, and in which four nations has poverty increased most?
UNCORRECTED which four nations has poverty increased most?Examine �gure 4.24 below and then answer the questions that follow.
UNCORRECTED Examine �gure 4.24 below and then answer the questions that follow.
UNCORRECTED
UNCORRECTED
UNCORRECTED
UNCORRECTED
UNCORRECTED
UNCORRECTED
UNCORRECTED
UNCORRECTED
UNCORRECTED
UNCORRECTED
UNCORRECTED
UNCORRECTED
Main English speaking country
UNCORRECTED
Main English speaking country
Australia
UNCORRECTED
Australia
PAGE Comparison of poverty rates in OECD nations including Australia, 2010 against 1995
PAGE Comparison of poverty rates in OECD nations including Australia, 2010 against 1995
Poverty, Social Exclusion and Disadvantage in Australia
PAGE Poverty, Social Exclusion and Disadvantage in Australianatsem.canberra.edu.au/storage/Poverty-Social-Exclusion-and-Disadvantage.pdf. See also OECD, http://www.oecd.org/social/inequality.htm.
PAGE natsem.canberra.edu.au/storage/Poverty-Social-Exclusion-and-Disadvantage.pdf. See also OECD, http://www.oecd.org/social/inequality.htm.
OECD country has the highest rate of poverty, and which has the lowest? How does
PAGE OECD country has the highest rate of poverty, and which has the lowest? How does
a likely reason for the rise in poverty in many OECD nations.PAGE a likely reason for the rise in poverty in many OECD nations.
two OECD nations have reduced their poverty rate most between 1995 and 2010, and in PAGE
two OECD nations have reduced their poverty rate most between 1995 and 2010, and in
PROOFS
PROOFS
Uni
ted
Sta
tes
PROOFS
Uni
ted
Sta
tes
Turk
ey
PROOFS
Turk
eyM
exic
o
PROOFS
Mex
ico
Isra
el
PROOFS
Isra
el
OE
CD
-20
PROOFS
OE
CD
-20
PROOFS
PROOFS
PROOFS
PROOFS
PROOFS
Comparison of poverty rates in OECD nations including Australia, 2010 against 1995PROOFS
Comparison of poverty rates in OECD nations including Australia, 2010 against 1995
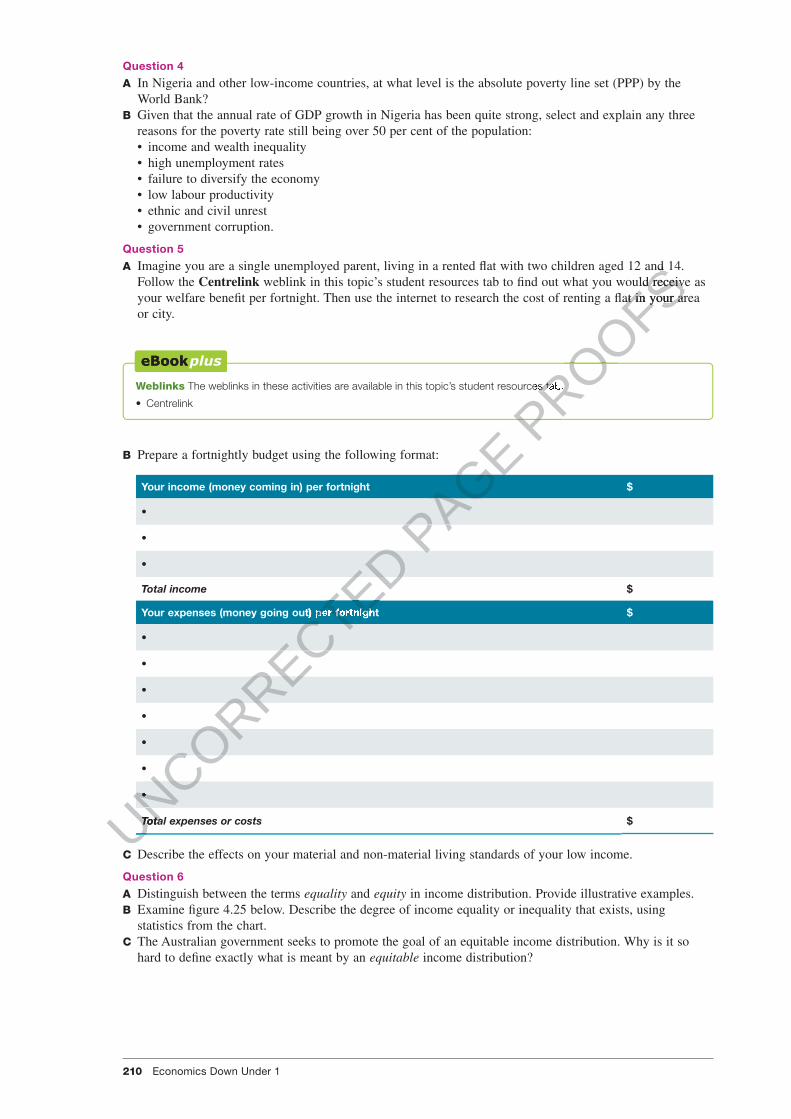
210 Economics Down Under 1
c04EconomicEf�ciencyAndEquityAsContemporaryEconomicIssues 210 4 October 2016 1:18 PM
Question 4
A In Nigeria and other low-income countries, at what level is the absolute poverty line set (PPP) by the World Bank?
B Given that the annual rate of GDP growth in Nigeria has been quite strong, select and explain any three reasons for the poverty rate still being over 50 per cent of the population: • income and wealth inequality • high unemployment rates • failure to diversify the economy • low labour productivity • ethnic and civil unrest • government corruption.
Question 5
A Imagine you are a single unemployed parent, living in a rented �at with two children aged 12 and 14. Follow the Centrelink weblink in this topic’s student resources tab to �nd out what you would receive as your welfare bene�t per fortnight. Then use the internet to research the cost of renting a �at in your area or city.
Weblinks The weblinks in these activities are available in this topic’s student resources tab.
• Centrelink
B Prepare a fortnightly budget using the following format:
Your income (money coming in) per fortnight $
•
•
•
Total income $
Your expenses (money going out) per fortnight $
•
•
•
•
•
•
•
Total expenses or costs $
C Describe the effects on your material and non-material living standards of your low income.
Question 6
A Distinguish between the terms equality and equity in income distribution. Provide illustrative examples.B Examine �gure 4.25 below. Describe the degree of income equality or inequality that exists, using
statistics from the chart.C The Australian government seeks to promote the goal of an equitable income distribution. Why is it so
hard to de�ne exactly what is meant by an equitable income distribution?
UNCORRECTED
UNCORRECTED
UNCORRECTED
UNCORRECTED
UNCORRECTED
UNCORRECTED
UNCORRECTED Your expenses (money going out) per fortnight
UNCORRECTED Your expenses (money going out) per fortnight
•
UNCORRECTED
•
Total expenses or costsUNCORRECTED
Total expenses or costs
PAGE
PAGE
PAGE
PAGE PROOFS
Imagine you are a single unemployed parent, living in a rented �at with two children aged 12 and 14.
PROOFSImagine you are a single unemployed parent, living in a rented �at with two children aged 12 and 14.
weblink in this topic’s student resources tab to �nd out what you would receive as
PROOFS weblink in this topic’s student resources tab to �nd out what you would receive as your welfare bene�t per fortnight. Then use the internet to research the cost of renting a �at in your area
PROOFSyour welfare bene�t per fortnight. Then use the internet to research the cost of renting a �at in your area
PROOFS The weblinks in these activities are available in this topic’s student resources tab.
PROOFS The weblinks in these activities are available in this topic’s student resources tab.
PROOFS
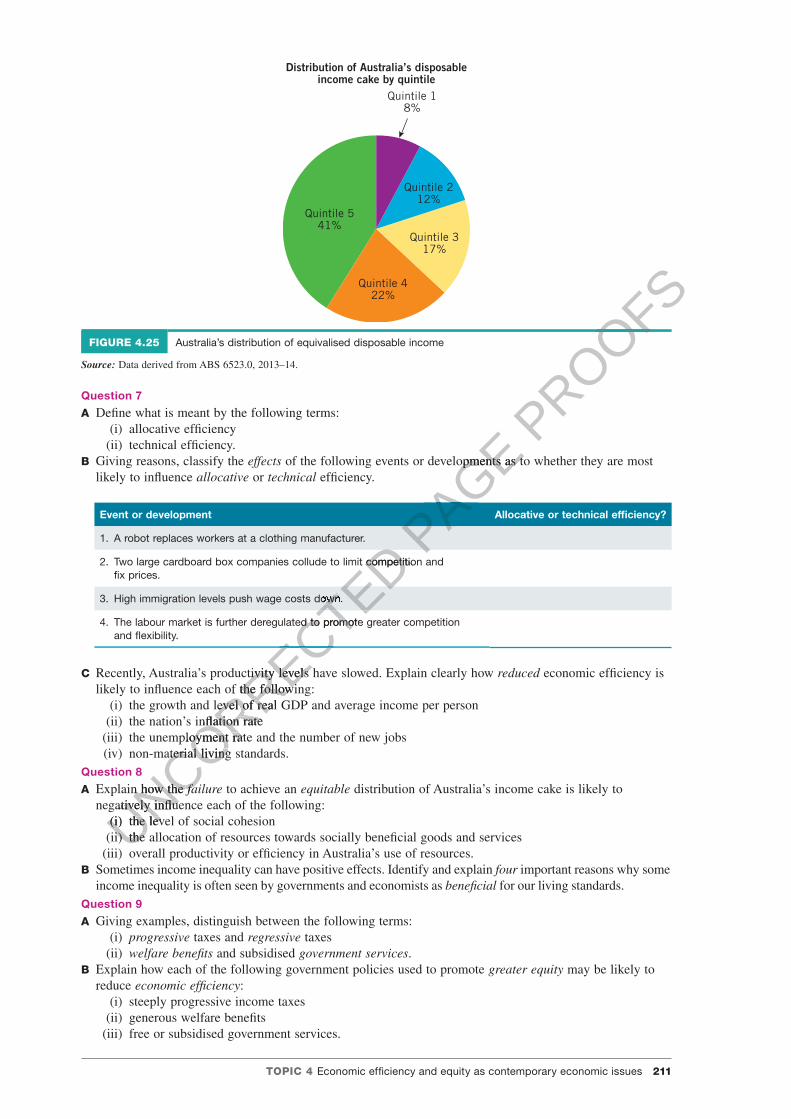
TOPIC 4 Economic ef�ciency and equity as contemporary economic issues 211
c04EconomicEf�ciencyAndEquityAsContemporaryEconomicIssues 211 4 October 2016 1:18 PM
Quintile 18%
Quintile 212%
Quintile 317%
Quintile 422%
Quintile 541%
Distribution of Australia’s disposableincome cake by quintile
FIGURE 4.25 Australia’s distribution of equivalised disposable income
Source: Data derived from ABS 6523.0, 2013–14.
Question 7
A De�ne what is meant by the following terms:(i) allocative ef�ciency
(ii) technical ef�ciency.B Giving reasons, classify the effects of the following events or developments as to whether they are most
likely to in�uence allocative or technical ef�ciency.
Event or development Allocative or technical ef�ciency?
1. A robot replaces workers at a clothing manufacturer.
2. Two large cardboard box companies collude to limit competition and �x prices.
3. High immigration levels push wage costs down.
4. The labour market is further deregulated to promote greater competition and �exibility.
C Recently, Australia’s productivity levels have slowed. Explain clearly how reduced economic ef�ciency is likely to in�uence each of the following:
(i) the growth and level of real GDP and average income per person(ii) the nation’s in�ation rate
(iii) the unemployment rate and the number of new jobs(iv) non-material living standards.
Question 8
A Explain how the failure to achieve an equitable distribution of Australia’s income cake is likely to negatively in�uence each of the following:
(i) the level of social cohesion(ii) the allocation of resources towards socially bene�cial goods and services
(iii) overall productivity or ef�ciency in Australia’s use of resources.B Sometimes income inequality can have positive effects. Identify and explain four important reasons why some
income inequality is often seen by governments and economists as bene�cial for our living standards. Question 9
A Giving examples, distinguish between the following terms:(i) progressive taxes and regressive taxes
(ii) welfare bene�ts and subsidised government services.B Explain how each of the following government policies used to promote greater equity may be likely to
reduce economic ef�ciency: (i) steeply progressive income taxes
(ii) generous welfare bene�ts(iii) free or subsidised government services.
UNCORRECTED
UNCORRECTED
UNCORRECTED wo large cardboard box companies collude to limit competition and
UNCORRECTED wo large cardboard box companies collude to limit competition and
High immigration levels push wage costs down.
UNCORRECTED High immigration levels push wage costs down.
egulated to promote greater competition
UNCORRECTED egulated to promote greater competition
Recently, Australia’s productivity levels have slowed. Explain clearly how
UNCORRECTED
Recently, Australia’s productivity levels have slowed. Explain clearly how likely to in�uence each of the following:
UNCORRECTED
likely to in�uence each of the following: growth and level of real GDP and average income per person
UNCORRECTED
growth and level of real GDP and average income per personnation’s in�ation rate
UNCORRECTED
nation’s in�ation rate
UNCORRECTED
unemployment rate and the number of new jobs
UNCORRECTED
unemployment rate and the number of new jobsnon-material
UNCORRECTED
non-material living standards.
UNCORRECTED
living standards.
Explain how the
UNCORRECTED
Explain how the failure
UNCORRECTED
failurenegatively in�uence each of the following:
UNCORRECTED
negatively in�uence each of the following:(i) UNCORRECTED
(i) the UNCORRECTED
the level of social cohesionUNCORRECTED
level of social cohesion(ii) UNCORRECTED
(ii) the UNCORRECTED
the
PAGE of the following events or developments as to whether they are most
PAGE of the following events or developments as to whether they are most
PAGE
PAGE PROOFS
PROOFS
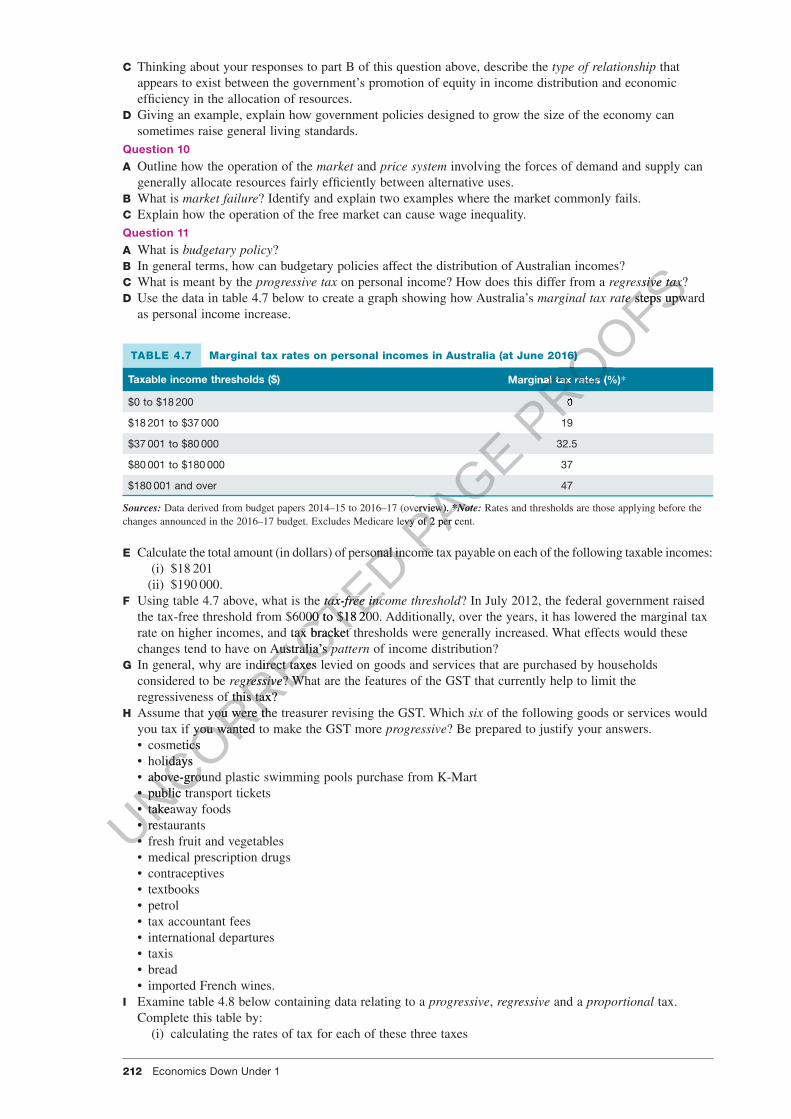
212 Economics Down Under 1
c04EconomicEf�ciencyAndEquityAsContemporaryEconomicIssues 212 4 October 2016 1:18 PM
C Thinking about your responses to part B of this question above, describe the type of relationship that appears to exist between the government’s promotion of equity in income distribution and economic ef�ciency in the allocation of resources.
D Giving an example, explain how government policies designed to grow the size of the economy can sometimes raise general living standards.
Question 10
A Outline how the operation of the market and price system involving the forces of demand and supply can generally allocate resources fairly ef�ciently between alternative uses.
B What is market failure? Identify and explain two examples where the market commonly fails.C Explain how the operation of the free market can cause wage inequality.Question 11
A What is budgetary policy?B In general terms, how can budgetary policies affect the distribution of Australian incomes?C What is meant by the progressive tax on personal income? How does this differ from a regressive tax?D Use the data in table 4.7 below to create a graph showing how Australia’s marginal tax rate steps upward
as personal income increase.
TABLE 4.7 Marginal tax rates on personal incomes in Australia (at June 2016)
Taxable income thresholds ($) Marginal tax rates (%)*
$0 to $18 200 0
$18 201 to $37 000 19
$37 001 to $80 000 32.5
$80 001 to $180 000 37
$180 001 and over 47
Sources: Data derived from budget papers 2014–15 to 2016–17 (overview). *Note: Rates and thresholds are those applying before the changes announced in the 2016–17 budget. Excludes Medicare levy of 2 per cent.
E Calculate the total amount (in dollars) of personal income tax payable on each of the following taxable incomes: (i) $18 201 (ii) $190 000.F Using table 4.7 above, what is the tax-free income threshold? In July 2012, the federal government raised
the tax-free threshold from $6000 to $18 200. Additionally, over the years, it has lowered the marginal tax rate on higher incomes, and tax bracket thresholds were generally increased. What effects would these changes tend to have on Australia’s pattern of income distribution?
G In general, why are indirect taxes levied on goods and services that are purchased by households considered to be regressive? What are the features of the GST that currently help to limit the regressiveness of this tax?
H Assume that you were the treasurer revising the GST. Which six of the following goods or services would you tax if you wanted to make the GST more progressive? Be prepared to justify your answers. • cosmetics • holidays • above-ground plastic swimming pools purchase from K-Mart • public transport tickets • takeaway foods • restaurants • fresh fruit and vegetables • medical prescription drugs • contraceptives • textbooks • petrol • tax accountant fees • international departures • taxis • bread • imported French wines.
I Examine table 4.8 below containing data relating to a progressive, regressive and a proportional tax. Complete this table by:
(i) calculating the rates of tax for each of these three taxes
UNCORRECTED Calculate the total amount (in dollars) of personal income tax payable on each of the following taxable incomes:
UNCORRECTED Calculate the total amount (in dollars) of personal income tax payable on each of the following taxable incomes:
Using table 4.7 above, what is the
UNCORRECTED Using table 4.7 above, what is the tax-free income threshold
UNCORRECTED tax-free income threshold
the tax-free threshold from $6000 to $18
UNCORRECTED the tax-free threshold from $6000 to $18
UNCORRECTED 200.
UNCORRECTED 200.
rate on higher incomes, and tax bracket thresholds were generally increased. What effects would these
UNCORRECTED rate on higher incomes, and tax bracket thresholds were generally increased. What effects would these changes tend to have on Australia’s
UNCORRECTED
changes tend to have on Australia’s
UNCORRECTED
pattern
UNCORRECTED
patternIn general, why are indirect taxes levied on goods and services that are purchased by households
UNCORRECTED
In general, why are indirect taxes levied on goods and services that are purchased by households regressive
UNCORRECTED
regressive? What are the features of the GST that currently help to limit the
UNCORRECTED
? What are the features of the GST that currently help to limit the regressiveness of this tax?
UNCORRECTED
regressiveness of this tax? Assume that you were the treasurer revising the GST. Which
UNCORRECTED
Assume that you were the treasurer revising the GST. Which you tax if you wanted to make the GST more
UNCORRECTED
you tax if you wanted to make the GST more cosmetics
UNCORRECTED
cosmeticsholidays
UNCORRECTED
holidaysabo
UNCORRECTED
above-ground plastic swimming pools purchase from K-Mart
UNCORRECTED
ve-ground plastic swimming pools purchase from K-Mart•
UNCORRECTED
• public
UNCORRECTED
public transport tickets
UNCORRECTED
transport tickets•
UNCORRECTED
• tak
UNCORRECTED
takeaway foods
UNCORRECTED
eaway foods•UNCORRECTED
• restaurantsUNCORRECTED
restaurants•UNCORRECTED
•
PAGE
PAGE
PAGE derived from budget papers 2014–15 to 2016–17 (overview).
PAGE derived from budget papers 2014–15 to 2016–17 (overview). *Note:
PAGE *Note:
changes announced in the 2016–17 budget. Excludes Medicare levy of 2 per cent.PAGE changes announced in the 2016–17 budget. Excludes Medicare levy of 2 per cent.
Calculate the total amount (in dollars) of personal income tax payable on each of the following taxable incomes: PAGE
Calculate the total amount (in dollars) of personal income tax payable on each of the following taxable incomes:
PROOFSregressive
PROOFSregressive tax
PROOFStax?
PROOFS?marginal tax rate
PROOFSmarginal tax rate steps upward
PROOFS steps upward
PROOFS
PROOFSstralia (at June 2016)
PROOFSstralia (at June 2016)
Marginal tax rates (%)
PROOFSMarginal tax rates (%)
0
PROOFS
0

TOPIC 4 Economic ef�ciency and equity as contemporary economic issues 213
c04EconomicEf�ciencyAndEquityAsContemporaryEconomicIssues 213 4 October 2016 1:18 PM
(ii) deciding whether each tax is progressive, proportional or regressive(iii) explaining the effect of each tax on the degree of inequality in income distribution.
TABLE 4.8 Hypothetical data relating to three types of tax
Annual income Tax 1 (amount of tax paid) Tax 2 (amount of tax paid) Tax 3 (amount of tax paid)
$30 000 $5 000 = .........% $2000 = .........% $4000 = .........%
$60 000 $10 000 = .........% $6000 = .........% $3000 = .........%
Type of tax = a ............................ tax a ............................ tax a ............................ tax
Effect on income distribution =
.........................................
...........................................................................................................................
.........................................
.........................................
J Explain how each of the following Australian government budgetary policy decisions would be likely to affect the level of equity in the distribution of income and wealth.
(i) A tightening of the assets or means tests applied to welfare bene�ts (e.g. 1996–2016)(ii) An increase in the superannuation guarantee charge rate paid by employers on behalf of their
employees (e.g. 2015)(iii) The free or subsidised provision of merit goods(iv) A move towards the user-pays principle in the provision of government or public services(v) Requiring that the unemployed wait 6 months before receiving unemployment bene�ts
(vi) Abolishing the indexation of welfare bene�ts(vii) Lowering the top marginal tax rate to 40 per cent
(viii) Increasing the GST to 15 per cent on all goods and services without exception(ix) Scrapping the assets and means test on the aged pension(x) Using an expansionary budget de�cit to stimulate AD and reduce unemployment
(xi) Reintroducing death duties on inherited assets(xii) Scrapping tax concessions for superannuation contributions and negative gearing for those on
incomes above $100 000 per yearK Identify and outline four important ways whereby the Australian government’s budget can be used to
increase ef�ciency in the allocation of Australia’s resources.L For each of the following changes in government budgetary policy, explain the likely effect on ef�ciency
in the allocation of resources.(i) The tax-free income threshold was increased to $25 000 per year and the top marginal rate of tax cut
to 40 per cent on incomes above $200 000 per year.(ii) The Australian government provided $2 billion of money from the budget to build a huge nuclear-
powered desalination plant in South Australia. (iii) The minimum school leaving age was raised from 15 to 17 years and tertiary education was free for
those who gained admission.(iv) Childcare funding was increased in the budget for those on incomes below $80 000 per year up to a
fee limit or cap of $20 000 per year.(v) Company tax rates were reduced to 20 per cent for small �rms and 25 per cent for large �rms.
(vi) There was a 20 per cent decrease in budget funding for the CSIRO for its research and development projects.
A report on an investigation or inquiryInequality in your Economics classAim
Your task is to research the distribution of income and the distribution of wealth in your Economics class, and report your �ndings.Collecting the statistical information
You could proceed using the following steps.A Your teacher should photocopy the survey form shown in table 4.9 and distribute one to each member of
the Economics class for completion. There should be discussion about the nature of income and wealth. Income (e.g. wages from a job, gifts, tips, allowance or pocket money, interest from a savings account, dividends from shares) in the survey should represent an estimate for the last complete �nancial year (e.g. 2017–18). Wealth should be an estimate of the value of your assets (e.g. personal savings, shares, property, share of trust, possessions worth more than $500 per item) on the day of this survey. Forms could then be completed anonymously for homework.
UNCORRECTED Identify and outline four important ways whereby the Australian government’s budget can be used to
UNCORRECTED Identify and outline four important ways whereby the Australian government’s budget can be used to in the allocation of Australia’s resources.
UNCORRECTED in the allocation of Australia’s resources.For each of the following changes in government budgetary policy, explain the likely effect on
UNCORRECTED For each of the following changes in government budgetary policy, explain the likely effect on
tax-free income threshold was increased to $25
UNCORRECTED tax-free income threshold was increased to $25
to 40 per cent on incomes above $200
UNCORRECTED to 40 per cent on incomes above $200
UNCORRECTED 000
UNCORRECTED 000
Australian government provided $2 billion of money from the budget to build a huge nuclear-
UNCORRECTED Australian government provided $2 billion of money from the budget to build a huge nuclear-
UNCORRECTED
powered desalination plant in South Australia.
UNCORRECTED
powered desalination plant in South Australia. minimum school leaving age was raised from 15 to 17 years and tertiary education was free for
UNCORRECTED
minimum school leaving age was raised from 15 to 17 years and tertiary education was free for those who gained admission.
UNCORRECTED
those who gained admission.funding was increased in the budget for those on incomes below $80
UNCORRECTED
funding was increased in the budget for those on incomes below $80fee limit or cap of $20
UNCORRECTED
fee limit or cap of $20
UNCORRECTED
000
UNCORRECTED
000 y tax rates were reduced to 20 per cent for small �rms and 25 per cent for large �rms.
UNCORRECTED
y tax rates were reduced to 20 per cent for small �rms and 25 per cent for large �rms.
UNCORRECTED
was a 20 per cent decrease in budget funding for the CSIRO for its research and development
UNCORRECTED
was a 20 per cent decrease in budget funding for the CSIRO for its research and development projects.
UNCORRECTED
projects.
A report on an investigation or inquiry
UNCORRECTED
A report on an investigation or inquiryequality in your UNCORRECTED
equality in your
PAGE the GST to 15 per cent on all goods and services without exception
PAGE the GST to 15 per cent on all goods and services without exception
an expansionary budget de�cit to stimulate AD and reduce unemployment
PAGE an expansionary budget de�cit to stimulate AD and reduce unemployment
tax concessions for superannuation contributions and negative gearing for those on PAGE tax concessions for superannuation contributions and negative gearing for those on
Identify and outline four important ways whereby the Australian government’s budget can be used to PAGE
Identify and outline four important ways whereby the Australian government’s budget can be used to
PROOFS
PROOFSExplain how each of the following Australian government budgetary policy decisions would be likely to
PROOFSExplain how each of the following Australian government budgetary policy decisions would be likely to
paid by employers on behalf of their
PROOFS paid by employers on behalf of their
move towards the user-pays principle in the provision of government or public services
PROOFSmove towards the user-pays principle in the provision of government or public services
that the unemployed wait 6 months before receiving unemployment bene�tsPROOFS
that the unemployed wait 6 months before receiving unemployment bene�ts
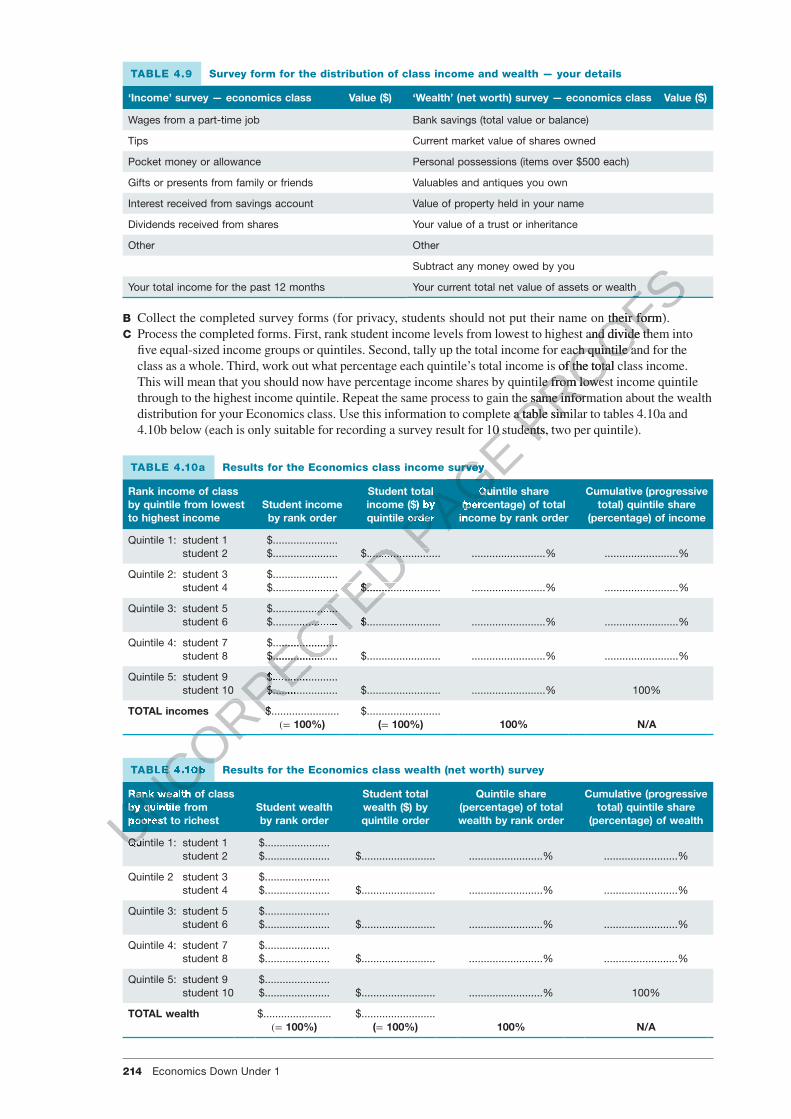
214 Economics Down Under 1
c04EconomicEf�ciencyAndEquityAsContemporaryEconomicIssues 214 4 October 2016 1:18 PM
TABLE 4.9 Survey form for the distribution of class income and wealth — your details
‘Income’ survey — economics class Value ($) ‘Wealth’ (net worth) survey — economics class Value ($)
Wages from a part-time job Bank savings (total value or balance)
Tips Current market value of shares owned
Pocket money or allowance Personal possessions (items over $500 each)
Gifts or presents from family or friends Valuables and antiques you own
Interest received from savings account Value of property held in your name
Dividends received from shares Your value of a trust or inheritance
Other Other
Subtract any money owed by you
Your total income for the past 12 months Your current total net value of assets or wealth
B Collect the completed survey forms (for privacy, students should not put their name on their form). C Process the completed forms. First, rank student income levels from lowest to highest and divide them into
�ve equal-sized income groups or quintiles. Second, tally up the total income for each quintile and for the class as a whole. Third, work out what percentage each quintile’s total income is of the total class income. This will mean that you should now have percentage income shares by quintile from lowest income quintile through to the highest income quintile. Repeat the same process to gain the same information about the wealth distribution for your Economics class. Use this information to complete a table similar to tables 4.10a and 4.10b below (each is only suitable for recording a survey result for 10 students, two per quintile).
TABLE 4.10a Results for the Economics class income survey
Rank income of class by quintile from lowest to highest income
Student income by rank order
Student total income ($) by quintile order
Quintile share (percentage) of total
income by rank order
Cumulative (progressive total) quintile share
(percentage) of income
Quintile 1: student 1 student 2
$......................$...................... $......................... .........................% .........................%
Quintile 2: student 3 student 4
$......................$...................... $......................... .........................% .........................%
Quintile 3: student 5 student 6
$......................$...................... $......................... .........................% .........................%
Quintile 4: student 7 student 8
$......................$...................... $......................... .........................% .........................%
Quintile 5: student 9 student 10
$......................$...................... $......................... .........................% 100%
TOTAL incomes $.......................(= 100%)
$.........................(= 100%) 100% N/A
TABLE 4.10b Results for the Economics class wealth (net worth) survey
Rank wealth of class by quintile from poorest to richest
Student wealth by rank order
Student total wealth ($) by quintile order
Quintile share (percentage) of total wealth by rank order
Cumulative (progressive total) quintile share
(percentage) of wealth
Quintile 1: student 1 student 2
$......................$...................... $......................... .........................% .........................%
Quintile 2 student 3 student 4
$......................$...................... $......................... .........................% .........................%
Quintile 3: student 5 student 6
$......................$...................... $......................... .........................% .........................%
Quintile 4: student 7 student 8
$......................$...................... $......................... .........................% .........................%
Quintile 5: student 9 student 10
$......................$...................... $......................... .........................% 100%
TOTAL wealth $.......................(= 100%)
$.........................(= 100%) 100% N/A
UNCORRECTED
UNCORRECTED
UNCORRECTED
UNCORRECTED $...................... $......................... .........................% .........................%
UNCORRECTED $...................... $......................... .........................% .........................%
$...................... $......................... .........................% .........................%
UNCORRECTED $...................... $......................... .........................% .........................%
$......................
UNCORRECTED $......................$...................... $......................... .........................% .........................%
UNCORRECTED $...................... $......................... .........................% .........................%
$......................
UNCORRECTED $......................$...................... $......................... .........................% .........................%
UNCORRECTED
$...................... $......................... .........................% .........................%
student 10
UNCORRECTED
student 10$......................
UNCORRECTED
$......................$...................... $......................... .........................%
UNCORRECTED
$...................... $......................... .........................%
$.......................
UNCORRECTED
$.......................
UNCORRECTED
UNCORRECTED
UNCORRECTED
UNCORRECTED
UNCORRECTED
BLE 4.10
UNCORRECTED
BLE 4.10b
UNCORRECTED
b
Rank wealth of class
UNCORRECTED
Rank wealth of class by quintile from
UNCORRECTED
by quintile from poorest to richest UNCORRECTED
poorest to richest UNCORRECTED
Quintile 1:UNCORRECTED
Quintile 1:
PAGE 4.10b below (each is only suitable for recording a survey result for 10 students, two per quintile).
PAGE 4.10b below (each is only suitable for recording a survey result for 10 students, two per quintile).
PAGE
PAGE omics class income survey
PAGE omics class income survey
Student total
PAGE Student total income ($) by
PAGE income ($) by quintile order
PAGE quintile order
Quintile share
PAGE Quintile share
(percentage) of total
PAGE (percentage) of total
income by rank order
PAGE income by rank order
$...................... $......................... .........................% .........................%PAGE
$...................... $......................... .........................% .........................%
PROOFS
PROOFS
PROOFS
PROOFSCollect the completed survey forms (for privacy, students should not put their name on their form).
PROOFSCollect the completed survey forms (for privacy, students should not put their name on their form). Process the completed forms. First, rank student income levels from lowest to highest and divide them into
PROOFSProcess the completed forms. First, rank student income levels from lowest to highest and divide them into �ve equal-sized income groups or quintiles. Second, tally up the total income for each quintile and for the
PROOFS�ve equal-sized income groups or quintiles. Second, tally up the total income for each quintile and for the class as a whole. Third, work out what percentage each quintile’s total income is of the total class income.
PROOFSclass as a whole. Third, work out what percentage each quintile’s total income is of the total class income. This will mean that you should now have percentage income shares by quintile from lowest income quintile
PROOFSThis will mean that you should now have percentage income shares by quintile from lowest income quintile through to the highest income quintile. Repeat the same process to gain the same information about the wealth
PROOFS
through to the highest income quintile. Repeat the same process to gain the same information about the wealth distribution for your Economics class. Use this information to complete a table similar to tables 4.10a and PROOFS
distribution for your Economics class. Use this information to complete a table similar to tables 4.10a and 4.10b below (each is only suitable for recording a survey result for 10 students, two per quintile). PROOFS
4.10b below (each is only suitable for recording a survey result for 10 students, two per quintile).

TOPIC 4 Economic ef�ciency and equity as contemporary economic issues 215
c04EconomicEf�ciencyAndEquityAsContemporaryEconomicIssues 215 4 October 2016 1:18 PM
D Use these two tables of survey results and, in particular, the cumulative results (i.e. the last column of each table) to neatly plot a Lorenz diagram or graph showing: • the labelling of the two axes and scales (i.e. 0–100 per cent for each) • a Lorenz curve showing the distribution of class income • a Lorenz curve showing the distribution of class wealth • the diagonal lines of total equality • the lines of total inequality.
E If you are not especially mathematically inclined, you can roughly estimate the area (by counting up the squares on graph paper) between the diagonal line of total equality and the actual Lorenz curve. This allows you to calculate a Gini coef�cient. Your answer will be a number between 0 and 1.
F Write a brief report in which you analyse the causes of income and wealth inequality in your Economics class. Try to identify and explain several factors that cause high or low incomes or that make students rich or poor.
Presentation
Your work could be presented as a wall chart, report or oral presentation in class, illustrated using PowerPoint slides.
A presentation: oral, multimedia or visual
Question 1: Inequality and Indigenous AustraliansAim
Indigenous Australians often endure severe poverty and have some of the lowest living standards in the world. Your task is to investigate the nature and level of inequality in living standards for Indigenous Australians, and present a report of your �ndings. This task will require that you contrast the living conditions and wellbeing of Indigenous people against those of other Australians. In addition, you need to outline what you feel are �ve practical policy suggestions about how the Australian government might improve everyday life for Indigenous Australians.Structure of your investigation
Your report should be broken into two main parts:Part 1: How do the living standards of Indigenous Australians contrast with those of other Australians?In conducting research on this aspect, you might consider some of the following: • unemployment rates, hours worked, types of work and access to jobs • the role of discrimination and commonly held views in the community • primary, secondary and tertiary education rates and attainment • health standards and disease rates • life expectancy • sources of income and income levels • geographic location • access to important services • family structures and attitudes • crime and violence.
Part 2: Outline �ve important government policies for indigenous peopleIn the past decade, the federal government has announced signi�cant changes to aspects of its policy towards Indigenous Australians and acknowledged the limited success of past policies. In this section, you need to discuss �ve important aspects of government policy that you believe might help to improve the daily living standards of Indigenous Australians.Getting started
Start by viewing the commercially available video called The Fringe Dwellers (PG). This is a thought-provoking, Australian-made �lm set in an outback town portraying the daily lives of a group of Indigenous Australians.
Next, go online and complete some careful research, perhaps assisted by a search engine (e.g. Google).The ABS and other agencies also publish relevant information. Follow the weblinks in this topic’s
student resources tab for some relevant publications. Additionally, you may conduct a newspaper search to �nd relevant articles. Your research should also include digital images and photographs to illustrate your report.
UNCORRECTED Part 1: How do the living standards of Indigenous Australians contrast with those of other
UNCORRECTED Part 1: How do the living standards of Indigenous Australians contrast with those of other
In conducting research on this aspect, you might consider some of the following:
UNCORRECTED In conducting research on this aspect, you might consider some of the following:
yment rates, hours worked, types of work and access to jobs
UNCORRECTED yment rates, hours worked, types of work and access to jobs
role of discrimination and commonly held views in the community
UNCORRECTED role of discrimination and commonly held views in the community
, secondary and tertiary education rates and attainment
UNCORRECTED , secondary and tertiary education rates and attainment
of income and income levels
UNCORRECTED
of income and income levels
to important services
UNCORRECTED
to important servicesamily structures and attitudes
UNCORRECTED
amily structures and attitudesand violence.
UNCORRECTED
and violence.Part 2: Outline �ve important government policies for indigenous people
UNCORRECTED
Part 2: Outline �ve important government policies for indigenous peopleIn the past decade, the federal government has announced signi�cant changes to aspects of its policy towards
UNCORRECTED
In the past decade, the federal government has announced signi�cant changes to aspects of its policy towards
UNCORRECTED
Indigenous Australians and acknowledged the limited success of past policies. In this section, you need to
UNCORRECTED
Indigenous Australians and acknowledged the limited success of past policies. In this section, you need to discuss �ve important aspects of government policy that you believe might help to improve the daily living
UNCORRECTED
discuss �ve important aspects of government policy that you believe might help to improve the daily living standards of Indigenous Australians.UNCORRECTED
standards of Indigenous Australians.Getting startedUNCORRECTED
Getting started
Start by viewing the commercially available video called UNCORRECTED
Start by viewing the commercially available video called
PAGE world. Your task is to investigate the nature and level of inequality in living standards for Indigenous
PAGE world. Your task is to investigate the nature and level of inequality in living standards for Indigenous Australians, and present a report of your �ndings. This task will require that you contrast the living
PAGE Australians, and present a report of your �ndings. This task will require that you contrast the living conditions and wellbeing of Indigenous people against those of other Australians. In addition, you need
PAGE conditions and wellbeing of Indigenous people against those of other Australians. In addition, you need to outline what you feel are �ve practical policy suggestions about how the Australian government might
PAGE to outline what you feel are �ve practical policy suggestions about how the Australian government might
Part 1: How do the living standards of Indigenous Australians contrast with those of other PAGE
Part 1: How do the living standards of Indigenous Australians contrast with those of other
PROOFS
Indigenous Australians often endure severe poverty and have some of the lowest living standards in the PROOFS
Indigenous Australians often endure severe poverty and have some of the lowest living standards in the world. Your task is to investigate the nature and level of inequality in living standards for Indigenous PROOFS
world. Your task is to investigate the nature and level of inequality in living standards for Indigenous Australians, and present a report of your �ndings. This task will require that you contrast the living PROOFS
Australians, and present a report of your �ndings. This task will require that you contrast the living
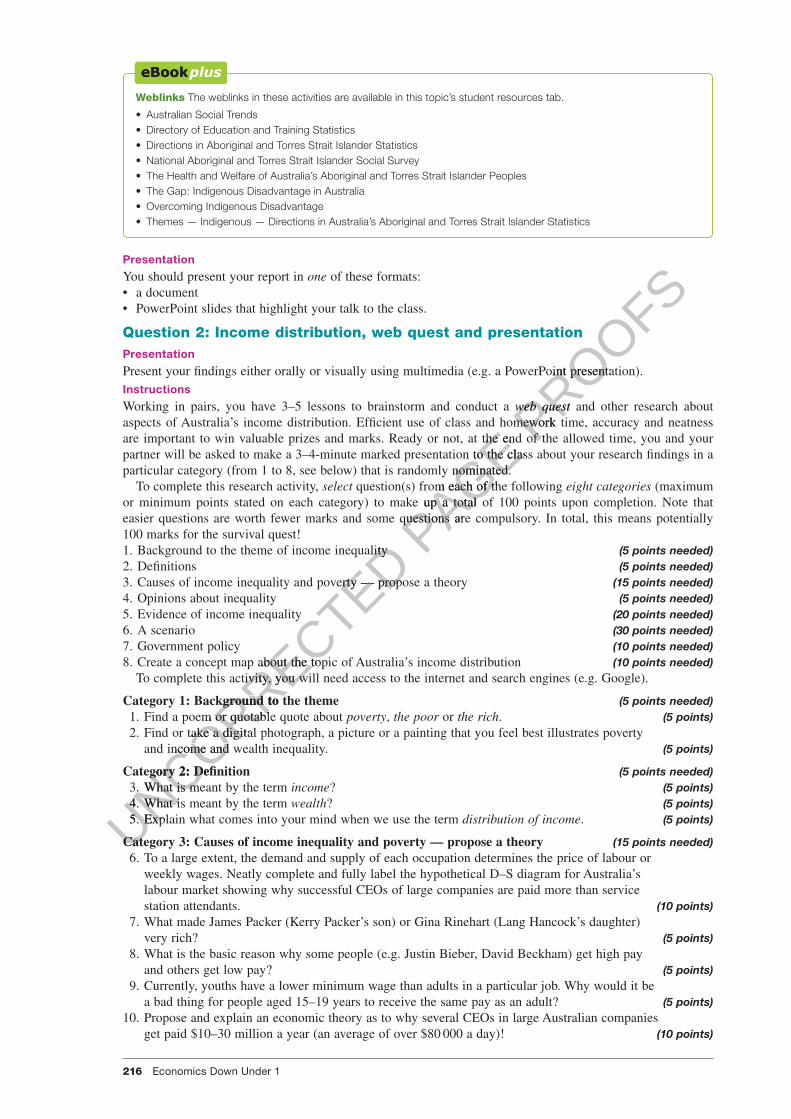
216 Economics Down Under 1
c04EconomicEf�ciencyAndEquityAsContemporaryEconomicIssues 216 4 October 2016 1:18 PM
Weblinks The weblinks in these activities are available in this topic’s student resources tab.
• Australian Social Trends• Directory of Education and Training Statistics• Directions in Aboriginal and Torres Strait Islander Statistics• National Aboriginal and Torres Strait Islander Social Survey• The Health and Welfare of Australia’s Aboriginal and Torres Strait Islander Peoples• The Gap: Indigenous Disadvantage in Australia• Overcoming Indigenous Disadvantage• Themes — Indigenous — Directions in Australia’s Aboriginal and Torres Strait Islander Statistics
Presentation
You should present your report in one of these formats: • a document • PowerPoint slides that highlight your talk to the class.
Question 2: Income distribution, web quest and presentationPresentation
Present your �ndings either orally or visually using multimedia (e.g. a PowerPoint presentation).Instructions
Working in pairs, you have 3–5 lessons to brainstorm and conduct a web quest and other research about aspects of Australia’s income distribution. Ef�cient use of class and homework time, accuracy and neatness are important to win valuable prizes and marks. Ready or not, at the end of the allowed time, you and your partner will be asked to make a 3–4-minute marked presentation to the class about your research �ndings in a particular category (from 1 to 8, see below) that is randomly nominated.
To complete this research activity, select question(s) from each of the following eight categories (maximum or minimum points stated on each category) to make up a total of 100 points upon completion. Note that easier questions are worth fewer marks and some questions are compulsory. In total, this means potentially 100 marks for the survival quest!1. Background to the theme of income inequality (5 points needed)2. De�nitions (5 points needed)3. Causes of income inequality and poverty — propose a theory (15 points needed)4. Opinions about inequality (5 points needed)5. Evidence of income inequality (20 points needed)6. A scenario (30 points needed)7. Government policy (10 points needed)8. Create a concept map about the topic of Australia’s income distribution (10 points needed)
To complete this activity, you will need access to the internet and search engines (e.g. Google).
Category 1: Background to the theme (5 points needed) 1. Find a poem or quotable quote about poverty, the poor or the rich. (5 points) 2. Find or take a digital photograph, a picture or a painting that you feel best illustrates poverty
and income and wealth inequality. (5 points)
Category 2: De�nition (5 points needed) 3. What is meant by the term income? (5 points) 4. What is meant by the term wealth? (5 points) 5. Explain what comes into your mind when we use the term distribution of income. (5 points)
Category 3: Causes of income inequality and poverty — propose a theory (15 points needed) 6. To a large extent, the demand and supply of each occupation determines the price of labour or
weekly wages. Neatly complete and fully label the hypothetical D–S diagram for Australia’s labour market showing why successful CEOs of large companies are paid more than service station attendants. (10 points)
7. What made James Packer (Kerry Packer’s son) or Gina Rinehart (Lang Hancock’s daughter) very rich? (5 points)
8. What is the basic reason why some people (e.g. Justin Bieber, David Beckham) get high pay and others get low pay? (5 points)
9. Currently, youths have a lower minimum wage than adults in a particular job. Why would it be a bad thing for people aged 15–19 years to receive the same pay as an adult? (5 points)
10. Propose and explain an economic theory as to why several CEOs in large Australian companies get paid $10–30 million a year (an average of over $80 000 a day)! (10 points)
UNCORRECTED to the theme of income inequality
UNCORRECTED to the theme of income inequality
of income inequality and poverty — propose a theory
UNCORRECTED of income inequality and poverty — propose a theory
a concept map about the topic of Australia’s income distribution
UNCORRECTED
a concept map about the topic of Australia’s income distributionTo complete this activity, you will need access to the internet and search engines (e.g. Google).
UNCORRECTED
To complete this activity, you will need access to the internet and search engines (e.g. Google).
Category 1: Background to the theme
UNCORRECTED
Category 1: Background to the themea poem or quotable quote about
UNCORRECTED
a poem or quotable quote about
UNCORRECTED
or take a digital photograph, a picture or a painting that you feel best illustrates poverty
UNCORRECTED
or take a digital photograph, a picture or a painting that you feel best illustrates poverty and income and wealth inequality.
UNCORRECTED
and income and wealth inequality.
Category 2: De�nition
UNCORRECTED
Category 2: De�nition3.
UNCORRECTED
3. What
UNCORRECTED
What is meant by the term
UNCORRECTED
is meant by the term 4.
UNCORRECTED
4. What
UNCORRECTED
What is meant by the term
UNCORRECTED
is meant by the term 5.UNCORRECTED
5. Explain UNCORRECTED
Explain
Category 3: Causes of income inequality and poverty — propose a theoryUNCORRECTED
Category 3: Causes of income inequality and poverty — propose a theory
PAGE aspects of Australia’s income distribution. Ef�cient use of class and homework time, accuracy and neatness
PAGE aspects of Australia’s income distribution. Ef�cient use of class and homework time, accuracy and neatness are important to win valuable prizes and marks. Ready or not, at the end of the allowed time, you and your
PAGE are important to win valuable prizes and marks. Ready or not, at the end of the allowed time, you and your partner will be asked to make a 3–4-minute marked presentation to the class about your research �ndings in a
PAGE partner will be asked to make a 3–4-minute marked presentation to the class about your research �ndings in a particular category (from 1 to 8, see below) that is randomly nominated.
PAGE particular category (from 1 to 8, see below) that is randomly nominated.
question(s) from each of the following
PAGE question(s) from each of the following
or minimum points stated on each category) to make up a total of 100 points upon completion.
PAGE or minimum points stated on each category) to make up a total of 100 points upon completion.easier questions are worth fewer marks and some questions are compulsory. In total, this means potentially PAGE easier questions are worth fewer marks and some questions are compulsory. In total, this means potentially
PROOFSPresent your �ndings either orally or visually using multimedia (e.g. a PowerPoint presentation).
PROOFSPresent your �ndings either orally or visually using multimedia (e.g. a PowerPoint presentation).
web questPROOFS
web quest and other research about PROOFS
and other research about web quest and other research about web questPROOFS
web quest and other research about web questaspects of Australia’s income distribution. Ef�cient use of class and homework time, accuracy and neatness PROOFS
aspects of Australia’s income distribution. Ef�cient use of class and homework time, accuracy and neatness are important to win valuable prizes and marks. Ready or not, at the end of the allowed time, you and your PROOFS
are important to win valuable prizes and marks. Ready or not, at the end of the allowed time, you and your
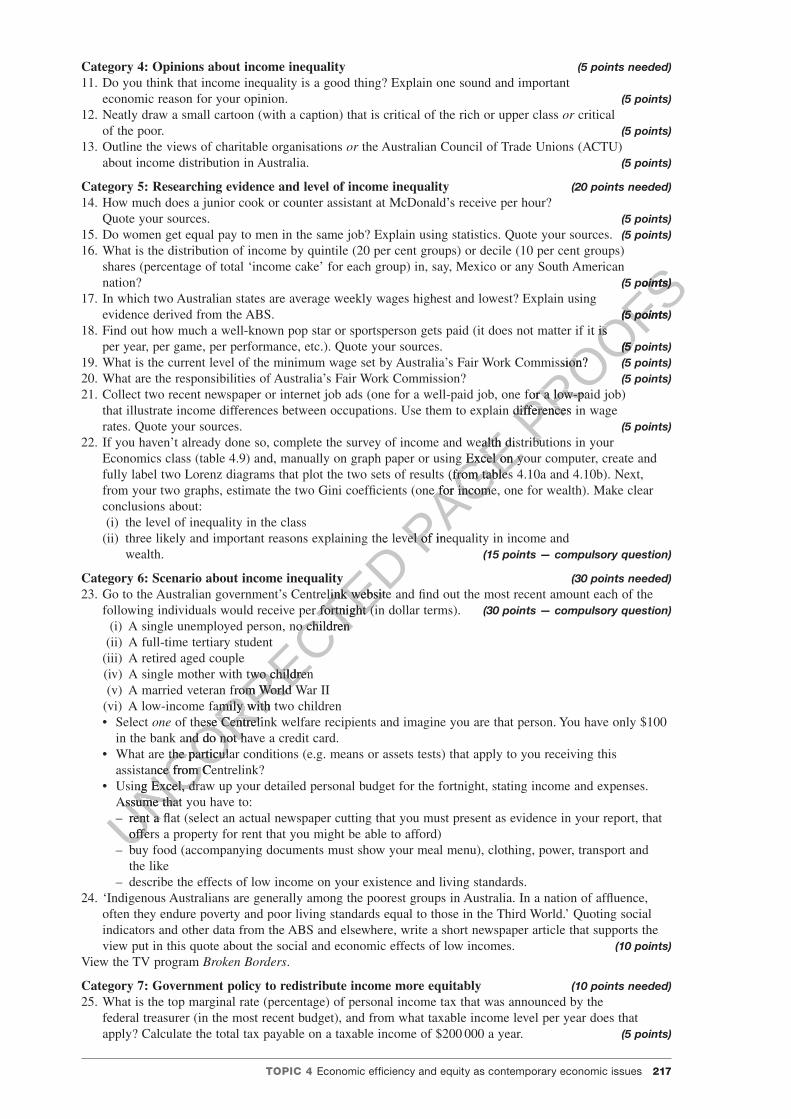
TOPIC 4 Economic ef�ciency and equity as contemporary economic issues 217
c04EconomicEf�ciencyAndEquityAsContemporaryEconomicIssues 217 4 October 2016 1:18 PM
Category 4: Opinions about income inequality (5 points needed)11. Do you think that income inequality is a good thing? Explain one sound and important
economic reason for your opinion. (5 points)12. Neatly draw a small cartoon (with a caption) that is critical of the rich or upper class or critical
of the poor. (5 points)13. Outline the views of charitable organisations or the Australian Council of Trade Unions (ACTU)
about income distribution in Australia. (5 points)
Category 5: Researching evidence and level of income inequality (20 points needed)14. How much does a junior cook or counter assistant at McDonald’s receive per hour?
Quote your sources. (5 points)15. Do women get equal pay to men in the same job? Explain using statistics. Quote your sources. (5 points)16. What is the distribution of income by quintile (20 per cent groups) or decile (10 per cent groups)
shares (percentage of total ‘income cake’ for each group) in, say, Mexico or any South American nation? (5 points)
17. In which two Australian states are average weekly wages highest and lowest? Explain using evidence derived from the ABS. (5 points)
18. Find out how much a well-known pop star or sportsperson gets paid (it does not matter if it is per year, per game, per performance, etc.). Quote your sources. (5 points)
19. What is the current level of the minimum wage set by Australia’s Fair Work Commission? (5 points)20. What are the responsibilities of Australia’s Fair Work Commission? (5 points)21. Collect two recent newspaper or internet job ads (one for a well-paid job, one for a low-paid job)
that illustrate income differences between occupations. Use them to explain differences in wage rates. Quote your sources. (5 points)
22. If you haven’t already done so, complete the survey of income and wealth distributions in your Economics class (table 4.9) and, manually on graph paper or using Excel on your computer, create and fully label two Lorenz diagrams that plot the two sets of results (from tables 4.10a and 4.10b). Next, from your two graphs, estimate the two Gini coef�cients (one for income, one for wealth). Make clear conclusions about:(i) the level of inequality in the class
(ii) three likely and important reasons explaining the level of inequality in income and wealth. (15 points — compulsory question)
Category 6: Scenario about income inequality (30 points needed)23. Go to the Australian government’s Centrelink website and �nd out the most recent amount each of the
following individuals would receive per fortnight (in dollar terms). (30 points — compulsory question) (i) A single unemployed person, no children(ii) A full-time tertiary student
(iii) A retired aged couple(iv) A single mother with two children (v) A married veteran from World War II(vi) A low-income family with two children • Select one of these Centrelink welfare recipients and imagine you are that person. You have only $100
in the bank and do not have a credit card. • What are the particular conditions (e.g. means or assets tests) that apply to you receiving this
assistance from Centrelink? • Using Excel, draw up your detailed personal budget for the fortnight, stating income and expenses.
Assume that you have to:– rent a �at (select an actual newspaper cutting that you must present as evidence in your report, that
offers a property for rent that you might be able to afford)– buy food (accompanying documents must show your meal menu), clothing, power, transport and
the like– describe the effects of low income on your existence and living standards.
24. ‘Indigenous Australians are generally among the poorest groups in Australia. In a nation of af�uence, often they endure poverty and poor living standards equal to those in the Third World.’ Quoting social indicators and other data from the ABS and elsewhere, write a short newspaper article that supports the view put in this quote about the social and economic effects of low incomes. (10 points)
View the TV program Broken Borders.
Category 7: Government policy to redistribute income more equitably (10 points needed)25. What is the top marginal rate (percentage) of personal income tax that was announced by the
federal treasurer (in the most recent budget), and from what taxable income level per year does that apply? Calculate the total tax payable on a taxable income of $200 000 a year. (5 points)
UNCORRECTED likely and important reasons explaining the level of inequality in income and
UNCORRECTED likely and important reasons explaining the level of inequality in income and
Category 6: Scenario about income inequality
UNCORRECTED Category 6: Scenario about income inequality
to the Australian government’s Centrelink website and �nd out the most recent amount each of the
UNCORRECTED to the Australian government’s Centrelink website and �nd out the most recent amount each of the
following individuals would receive per fortnight (in dollar terms).
UNCORRECTED following individuals would receive per fortnight (in dollar terms).
single unemployed person, no children
UNCORRECTED single unemployed person, no children
single mother with two children
UNCORRECTED
single mother with two childrenmarried veteran from World War II
UNCORRECTED
married veteran from World War IIlow-income family with two children
UNCORRECTED
low-income family with two children of these Centrelink welfare recipients and imagine you are that person. You have only $100
UNCORRECTED
of these Centrelink welfare recipients and imagine you are that person. You have only $100 in the bank and do not have a credit card.
UNCORRECTED
in the bank and do not have a credit card.are the particular conditions (e.g. means or assets tests) that apply to you receiving this
UNCORRECTED
are the particular conditions (e.g. means or assets tests) that apply to you receiving this assistance from Centrelink?
UNCORRECTED
assistance from Centrelink?Using
UNCORRECTED
Using Excel, draw up your detailed personal budget for the fortnight, stating income and expenses.
UNCORRECTED
Excel, draw up your detailed personal budget for the fortnight, stating income and expenses. Assume that you have to:
UNCORRECTED
Assume that you have to:– UNCORRECTED
– rent UNCORRECTED
rent a �at (select an actual newspaper cutting that you must present as evidence in your report, that UNCORRECTED
a �at (select an actual newspaper cutting that you must present as evidence in your report, that offers a property for rent that you might be able to afford)UNCORRECTED
offers a property for rent that you might be able to afford)bUNCORRECTED
buy food (accompanying documents must show your meal menu), clothing, power, transport and UNCORRECTED
uy food (accompanying documents must show your meal menu), clothing, power, transport and
PAGE you haven’t already done so, complete the survey of income and wealth distributions in your
PAGE you haven’t already done so, complete the survey of income and wealth distributions in your Economics class (table 4.9) and, manually on graph paper or using Excel on your computer, create and
PAGE Economics class (table 4.9) and, manually on graph paper or using Excel on your computer, create and fully label two Lorenz diagrams that plot the two sets of results (from tables 4.10a and 4.10b). Next,
PAGE fully label two Lorenz diagrams that plot the two sets of results (from tables 4.10a and 4.10b). Next, from your two graphs, estimate the two Gini coef�cients (one for income, one for wealth). Make clear
PAGE from your two graphs, estimate the two Gini coef�cients (one for income, one for wealth). Make clear
likely and important reasons explaining the level of inequality in income and PAGE
likely and important reasons explaining the level of inequality in income and
PROOFS(5 points)
PROOFS(5 points)
(5 points)
PROOFS(5 points)out how much a well-known pop star or sportsperson gets paid (it does not matter if it is
PROOFSout how much a well-known pop star or sportsperson gets paid (it does not matter if it is
(5 points)
PROOFS(5 points)
is the current level of the minimum wage set by Australia’s Fair Work Commission?
PROOFSis the current level of the minimum wage set by Australia’s Fair Work Commission? (5 points)
PROOFS(5 points)
two recent newspaper or internet job ads (one for a well-paid job, one for a low-paid job)
PROOFStwo recent newspaper or internet job ads (one for a well-paid job, one for a low-paid job)
that illustrate income differences between occupations. Use them to explain differences in wage PROOFS
that illustrate income differences between occupations. Use them to explain differences in wage
you haven’t already done so, complete the survey of income and wealth distributions in your PROOFS
you haven’t already done so, complete the survey of income and wealth distributions in your
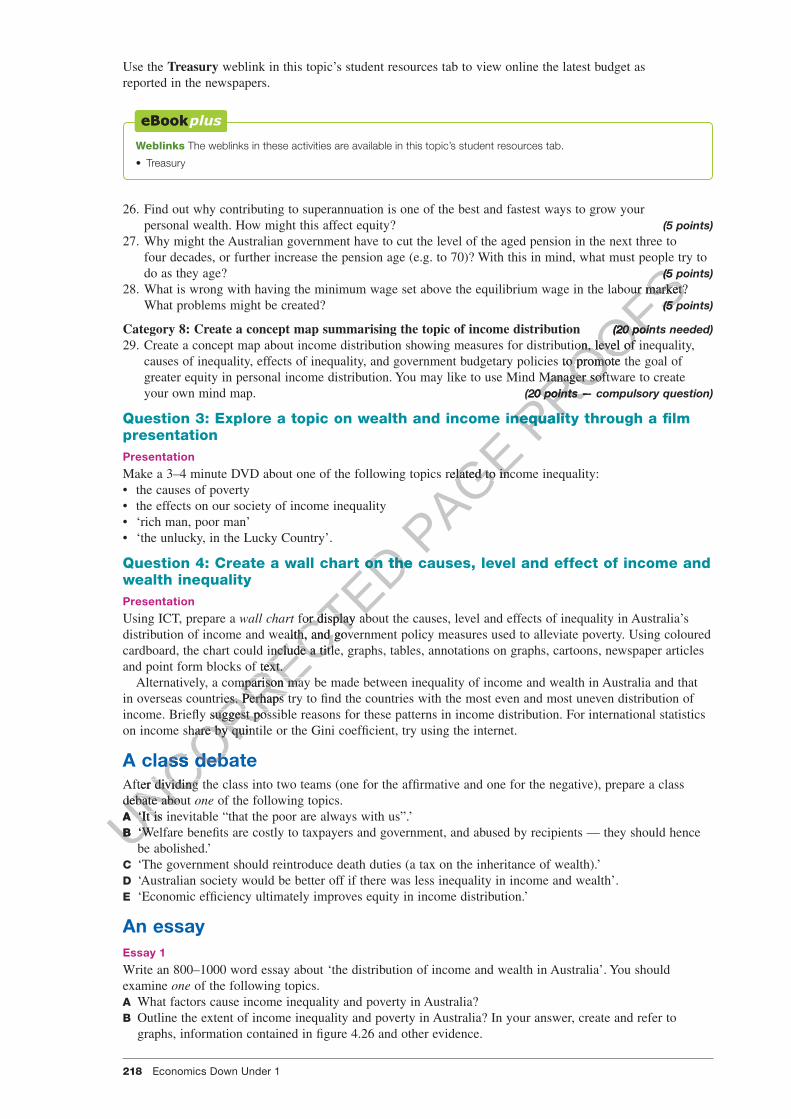
218 Economics Down Under 1
c04EconomicEf�ciencyAndEquityAsContemporaryEconomicIssues 218 4 October 2016 1:18 PM
Use the Treasury weblink in this topic’s student resources tab to view online the latest budget as reported in the newspapers.
Weblinks The weblinks in these activities are available in this topic’s student resources tab.
• Treasury
26. Find out why contributing to superannuation is one of the best and fastest ways to grow your personal wealth. How might this affect equity? (5 points)
27. Why might the Australian government have to cut the level of the aged pension in the next three to four decades, or further increase the pension age (e.g. to 70)? With this in mind, what must people try to do as they age? (5 points)
28. What is wrong with having the minimum wage set above the equilibrium wage in the labour market? What problems might be created? (5 points)
Category 8: Create a concept map summarising the topic of income distribution (20 points needed)29. Create a concept map about income distribution showing measures for distribution, level of inequality,
causes of inequality, effects of inequality, and government budgetary policies to promote the goal of greater equity in personal income distribution. You may like to use Mind Manager software to create your own mind map. (20 points — compulsory question)
Question 3: Explore a topic on wealth and income inequality through a �lm presentationPresentation
Make a 3–4 minute DVD about one of the following topics related to income inequality: • the causes of poverty • the effects on our society of income inequality • ‘rich man, poor man’ • ‘the unlucky, in the Lucky Country’.
Question 4: Create a wall chart on the causes, level and effect of income and wealth inequalityPresentation
Using ICT, prepare a wall chart for display about the causes, level and effects of inequality in Australia’s distribution of income and wealth, and government policy measures used to alleviate poverty. Using coloured cardboard, the chart could include a title, graphs, tables, annotations on graphs, cartoons, newspaper articles and point form blocks of text.
Alternatively, a comparison may be made between inequality of income and wealth in Australia and that in overseas countries. Perhaps try to �nd the countries with the most even and most uneven distribution of income. Brie�y suggest possible reasons for these patterns in income distribution. For international statistics on income share by quintile or the Gini coef�cient, try using the internet.
A class debateAfter dividing the class into two teams (one for the af�rmative and one for the negative), prepare a class debate about one of the following topics.A ‘It is inevitable “that the poor are always with us”.’B ‘Welfare bene�ts are costly to taxpayers and government, and abused by recipients — they should hence
be abolished.’C ‘The government should reintroduce death duties (a tax on the inheritance of wealth).’D ‘Australian society would be better off if there was less inequality in income and wealth’.E ‘Economic ef�ciency ultimately improves equity in income distribution.’
An essayEssay 1
Write an 800–1000 word essay about ‘the distribution of income and wealth in Australia’. You should examine one of the following topics.A What factors cause income inequality and poverty in Australia?B Outline the extent of income inequality and poverty in Australia? In your answer, create and refer to
graphs, information contained in �gure 4.26 and other evidence.
UNCORRECTED eate a wall chart on the causes, level and effect of income and
UNCORRECTED eate a wall chart on the causes, level and effect of income and
for display about the causes, level and effects of inequality in Australia’s
UNCORRECTED for display about the causes, level and effects of inequality in Australia’s
distribution of income and wealth, and government policy measures used to alleviate poverty. Using coloured
UNCORRECTED distribution of income and wealth, and government policy measures used to alleviate poverty. Using coloured cardboard, the chart could include a title, graphs, tables, annotations on graphs, cartoons,
UNCORRECTED
cardboard, the chart could include a title, graphs, tables, annotations on graphs, cartoons,and point form blocks of text.
UNCORRECTED
and point form blocks of text.Alternatively, a comparison may be made between inequality of income and wealth in Australia and that
UNCORRECTED
Alternatively, a comparison may be made between inequality of income and wealth in Australia and that
UNCORRECTED
in overseas countries. Perhaps try to �nd the countries with the most even and most uneven distribution of
UNCORRECTED
in overseas countries. Perhaps try to �nd the countries with the most even and most uneven distribution of income. Brie�y suggest possible reasons for these patterns in income distribution. For international statistics
UNCORRECTED
income. Brie�y suggest possible reasons for these patterns in income distribution. For international statistics on income share by quintile or the Gini coef�cient, try using the internet.
UNCORRECTED
on income share by quintile or the Gini coef�cient, try using the internet.
A class debate
UNCORRECTED
A class debateAfter dividing the class into two teams (one for the af�rmative and one for the negative), prepare a class
UNCORRECTED
After dividing the class into two teams (one for the af�rmative and one for the negative), prepare a class debate about
UNCORRECTED
debate about A UNCORRECTED
A ‘It is inevitable “that the poor are always with us”.’UNCORRECTED
‘It is inevitable “that the poor are always with us”.’B UNCORRECTED
B ‘Welfare bene�ts are costly to taxpayers and government, and abused by recipients — they should hence UNCORRECTED
‘Welfare bene�ts are costly to taxpayers and government, and abused by recipients — they should hence
PAGE Make a 3–4 minute DVD about one of the following topics related to income inequality:
PAGE Make a 3–4 minute DVD about one of the following topics related to income inequality:
PROOFS(5 points)
PROOFS(5 points)
is wrong with having the minimum wage set above the equilibrium wage in the labour market?
PROOFSis wrong with having the minimum wage set above the equilibrium wage in the labour market? (5 points)
PROOFS(5 points)
(20 points needed)
PROOFS(20 points needed)
a concept map about income distribution showing measures for distribution, level of inequality,
PROOFSa concept map about income distribution showing measures for distribution, level of inequality,
causes of inequality, effects of inequality, and government budgetary policies to promote the goal of
PROOFScauses of inequality, effects of inequality, and government budgetary policies to promote the goal of greater equity in personal income distribution. You may like to use Mind Manager software to create
PROOFSgreater equity in personal income distribution. You may like to use Mind Manager software to create
(20 points — compulsor
PROOFS(20 points — compulsor
plore a topic on wealth and income inequality through a �lm PROOFS
plore a topic on wealth and income inequality through a �lm
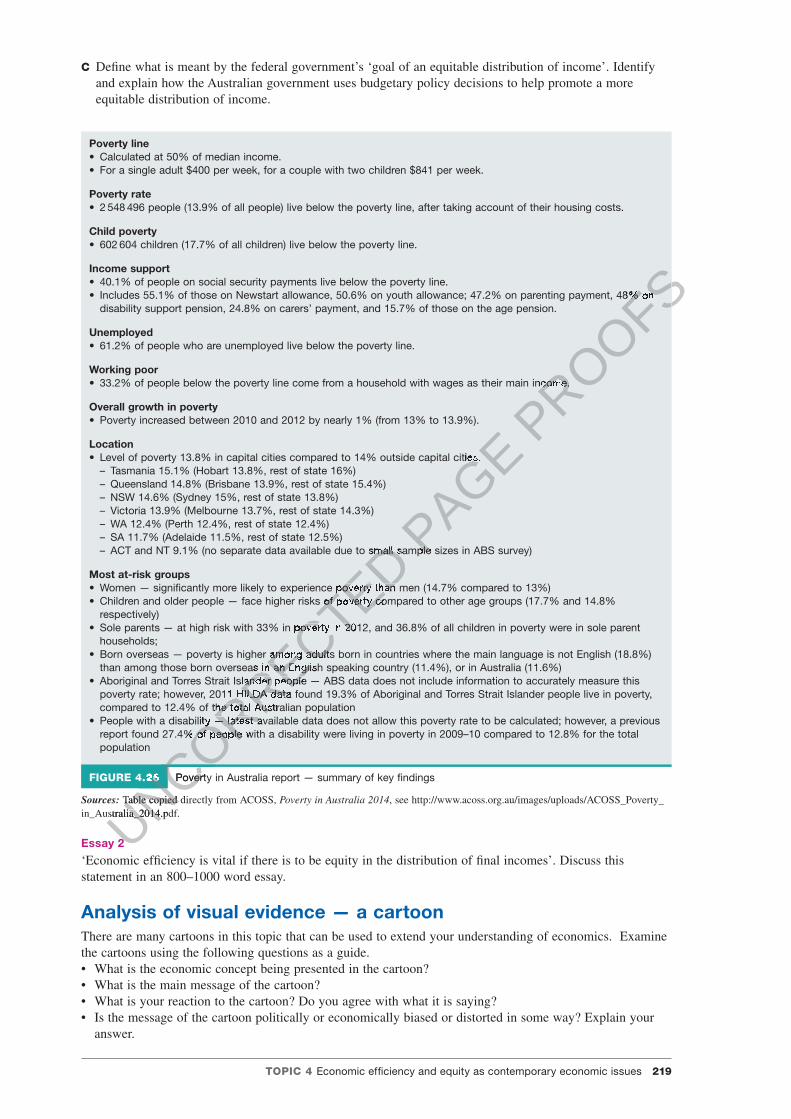
TOPIC 4 Economic ef�ciency and equity as contemporary economic issues 219
c04EconomicEf�ciencyAndEquityAsContemporaryEconomicIssues 219 4 October 2016 1:18 PM
C De�ne what is meant by the federal government’s ‘goal of an equitable distribution of income’. Identify and explain how the Australian government uses budgetary policy decisions to help promote a more equitable distribution of income.
Poverty line• Calculated at 50% of median income. • For a single adult $400 per week, for a couple with two children $841 per week.
Poverty rate• 2 548 496 people (13.9% of all people) live below the poverty line, after taking account of their housing costs.
Child poverty• 602 604 children (17.7% of all children) live below the poverty line.
Income support• 40.1% of people on social security payments live below the poverty line. • Includes 55.1% of those on Newstart allowance, 50.6% on youth allowance; 47.2% on parenting payment, 48% on
disability support pension, 24.8% on carers’ payment, and 15.7% of those on the age pension.
Unemployed• 61.2% of people who are unemployed live below the poverty line.
Working poor• 33.2% of people below the poverty line come from a household with wages as their main income.
Overall growth in poverty• Poverty increased between 2010 and 2012 by nearly 1% (from 13% to 13.9%).
Location• Level of poverty 13.8% in capital cities compared to 14% outside capital cities.
– Tasmania 15.1% (Hobart 13.8%, rest of state 16%)– Queensland 14.8% (Brisbane 13.9%, rest of state 15.4%)– NSW 14.6% (Sydney 15%, rest of state 13.8%)– Victoria 13.9% (Melbourne 13.7%, rest of state 14.3%)– WA 12.4% (Perth 12.4%, rest of state 12.4%)– SA 11.7% (Adelaide 11.5%, rest of state 12.5%)– ACT and NT 9.1% (no separate data available due to small sample sizes in ABS survey)
Most at-risk groups• Women — signi�cantly more likely to experience poverty than men (14.7% compared to 13%)• Children and older people — face higher risks of poverty compared to other age groups (17.7% and 14.8%
respectively)• Sole parents — at high risk with 33% in poverty in 2012, and 36.8% of all children in poverty were in sole parent
households;• Born overseas — poverty is higher among adults born in countries where the main language is not English (18.8%)
than among those born overseas in an English speaking country (11.4%), or in Australia (11.6%)• Aboriginal and Torres Strait Islander people — ABS data does not include information to accurately measure this
poverty rate; however, 2011 HILDA data found 19.3% of Aboriginal and Torres Strait Islander people live in poverty, compared to 12.4% of the total Australian population
• People with a disability — latest available data does not allow this poverty rate to be calculated; however, a previous report found 27.4% of people with a disability were living in poverty in 2009–10 compared to 12.8% for the total population
FIGURE 4.26 Poverty in Australia report — summary of key �ndings
Sources: Table copied directly from ACOSS, Poverty in Australia 2014, see http://www.acoss.org.au/images/uploads/ACOSS_Poverty_in_Australia_2014.pdf.
Essay 2
‘Economic ef�ciency is vital if there is to be equity in the distribution of �nal incomes’. Discuss this statement in an 800–1000 word essay.
Analysis of visual evidence — a cartoonThere are many cartoons in this topic that can be used to extend your understanding of economics. Examine the cartoons using the following questions as a guide. • What is the economic concept being presented in the cartoon? • What is the main message of the cartoon? • What is your reaction to the cartoon? Do you agree with what it is saying? • Is the message of the cartoon politically or economically biased or distorted in some way? Explain your
answer.
UNCORRECTED ACT and NT 9.1% (no separate data available due to small sample sizes in ABS survey)
UNCORRECTED ACT and NT 9.1% (no separate data available due to small sample sizes in ABS survey)
Women — signi�cantly more likely to experience poverty than men (14.7% compared to 13%)
UNCORRECTED Women — signi�cantly more likely to experience poverty than men (14.7% compared to 13%)Children and older people — face higher risks of poverty compared to other age groups (17.7% and 14.8%
UNCORRECTED Children and older people — face higher risks of poverty compared to other age groups (17.7% and 14.8%
— at high risk with 33% in poverty in 2012, and 36.8% of all children in poverty were in sole parent
UNCORRECTED — at high risk with 33% in poverty in 2012, and 36.8% of all children in poverty were in sole parent
Born overseas — poverty is higher among adults born in countries where the main language is not English (18.8%)
UNCORRECTED
Born overseas — poverty is higher among adults born in countries where the main language is not English (18.8%) than among those born overseas in an English speaking country (11.4%), or in Australia (11.6%)
UNCORRECTED
than among those born overseas in an English speaking country (11.4%), or in Australia (11.6%)Aboriginal and Torres Strait Islander people
UNCORRECTED
Aboriginal and Torres Strait Islander peoplepoverty rate; however, 2011 HILDA data found 19.3% of Aboriginal and Torres Strait Islander people live in poverty,
UNCORRECTED
poverty rate; however, 2011 HILDA data found 19.3% of Aboriginal and Torres Strait Islander people live in poverty, compared to 12.4% of the total Australian population
UNCORRECTED
compared to 12.4% of the total Australian population
UNCORRECTED
UNCORRECTED
UNCORRECTED
UNCORRECTED
UNCORRECTED
UNCORRECTED
UNCORRECTED
People with a disability — latest available data does not allow this poverty rate to be calculated; however, a previous
UNCORRECTED
People with a disability — latest available data does not allow this poverty rate to be calculated; however, a previous report found 27.4% of people with a disability were living in poverty in 2009–10 compared to 12.8% for the total
UNCORRECTED
report found 27.4% of people with a disability were living in poverty in 2009–10 compared to 12.8% for the total
FIGURE 4.26
UNCORRECTED
FIGURE 4.26 Poverty in Australia report — summary of key �ndings
UNCORRECTED
Poverty in Australia report — summary of key �ndings
Table copied directly from
UNCORRECTED
Table copied directly fromin_Australia_2014.pdf.UNCORRECTED
in_Australia_2014.pdf.
Essay 2 UNCORRECTED
Essay 2
PAGE Level of poverty 13.8% in capital cities compared to 14% outside capital cities.
PAGE Level of poverty 13.8% in capital cities compared to 14% outside capital cities.
ACT and NT 9.1% (no separate data available due to small sample sizes in ABS survey)PAGE
ACT and NT 9.1% (no separate data available due to small sample sizes in ABS survey)
PROOFS
PROOFSIncludes 55.1% of those on Newstart allowance, 50.6% on youth allowance; 47.2% on parenting payment, 48% on
PROOFSIncludes 55.1% of those on Newstart allowance, 50.6% on youth allowance; 47.2% on parenting payment, 48% on
33.2% of people below the poverty line come from a household with wages as their main income.
PROOFS33.2% of people below the poverty line come from a household with wages as their main income.
220 Economics Down Under 1
c04EconomicEf�ciencyAndEquityAsContemporaryEconomicIssues 220 4 October 2016 1:18 PM
4.13 ReviewSummaryThe nature of income and wealth
• Income affects material living standards. It represents �ow of money or rewards over a time period, usually to those households selling natural, labour and capital resources.
• When labour is sold, this is called earned income as opposed to unearned income in the form of rent and interest, or transfer income from government welfare payments to the neediest individuals.
• Wealth is different — it is the value of assets (e.g. savings, shares, property, superannuation, collectables) which often generate income for their owners (e.g. interest, dividends).
Measures of income inequality and poverty
• Income distribution refers to the way the income ‘cake’ is shared or divided between individuals, genders, groups or regions. This pattern of distribution affects living standards and may be fairly even or uneven.
• The ABS measures income distribution using a sample survey of Australian households to construct a range of measures. Three important measures of income distribution are: – market or private income (i.e. income from personal sources such as wages, interest, dividends, pro�ts and rent, prior to government redistribution measures)
– equivalised disposable income (i.e. income from all private sources after allowing for government welfare payments, the payment of income tax and adjustments made to re�ect differences in household size and composition)
– �nal income (income from all private sources after allowing for the effects of government redistribution measures including welfare, income tax, provision of government services and payment of indirect taxes).
• From its survey data, the ABS calculates quintile shares of income (i.e. for �ve groups each representing 20 per cent of households). From this, a Lorenz diagram and curve can be drawn and a Gini coef�cient calculated where 1.0 is total inequality and 0.0 is total equality in distribution.
• There is moderate income inequality in Australia relative to some countries. The Gini coef�cient is 0.333. The lowest quintile receives just 7.5 per cent of the equivalised disposable income cake, while quintile 5 receives a massive 40.8 per cent of the total income cake.
• The ABS also calculates income differences by gender, state, occupation, educational attainment and age. • Wealth surveys (net worth) are also conducted by the ABS in a similar way to the income survey and
reveal an especially high degree of inequality. • Absolute poverty is the absence of the necessities of life due to very low incomes, whereas relative poverty
means that living standards are austere. usually less than 50 per cent of average weekly earnings. • In Australia, 11.8 per cent of the population live in relative poverty. Overall, this �gure has gradually
increased over recent years. Those most likely to experience poverty include the unemployed, welfare recipients, the disabled and individuals from non-English speaking countries.
Causes of income inequality and poverty in Australia and Nigeria
• A range of factors causes inequality in Australia’s distribution of income and wealth: – foremost, wage differences in Australia re�ect the relative scarcity or economic value of each occupation. Wage differences hence re�ect the operation of the forces of demand for labour (e.g. affected by tastes, technology, economic conditions) and supply of labour (e.g. affected by education, skill, experience) in the labour market. Here, higher wages re�ect greater scarcity and mean that supply is less than demand for labour, while lower pay means that supply is greater than demand.
– incomes are also in�uenced by unemployment, hours worked, in�ation, overseas economic conditions, union effectiveness, luck, inheritance, age, education, discrimination, work ethic and the unintended effects of some government policies (e.g. tariff cuts, the user-pays principle, deregulation of the labour market).
• in low-income countries like Nigeria, poverty re�ects extreme inequality in income and wealth, high levels of unemployment and underemployment, the failure to diversify the economy to create more jobs, low worker productivity, long-term ethnic and civil unrest, and political corruption.
Effects of poverty on material and non-material living standards
• Clearly, poverty reduces both material and non-material living standards of individuals, whether they live in Australia, Nigeria or some other country.
• In Australia for example, relative poverty means that household consumption per head is very low because many goods and services (e.g. food, clothing, housing, electricity) are unaffordable, children often do not attend school, there are poor health outcomes, some people live on the streets, and there is often low self-esteem, isolation and higher crime rates.
• In Nigeria, absolute poverty leads to suffering, insuf�cient food and other basics of life, social unrest, low life expectancy, crime, lack of opportunity and sadness.
UNCORRECTED ABS also calculates income differences by gender, state, occupation, educational attainment and age.
UNCORRECTED ABS also calculates income differences by gender, state, occupation, educational attainment and age.ealth surveys (net worth) are also conducted by the ABS in a similar way to the income survey and
UNCORRECTED ealth surveys (net worth) are also conducted by the ABS in a similar way to the income survey and reveal an especially high degree of inequality.
UNCORRECTED reveal an especially high degree of inequality.
is the absence of the necessities of life due to very low incomes, whereas
UNCORRECTED is the absence of the necessities of life due to very low incomes, whereas
means that living standards are austere. usually less than 50 per cent of average weekly earnings.
UNCORRECTED means that living standards are austere. usually less than 50 per cent of average weekly earnings.
Australia, 11.8 per cent of the population live in relative poverty. Overall, this �gure has gradually
UNCORRECTED Australia, 11.8 per cent of the population live in relative poverty. Overall, this �gure has gradually
increased over recent years. Those most likely to experience poverty include the unemployed, welfare
UNCORRECTED increased over recent years. Those most likely to experience poverty include the unemployed, welfare recipients, the disabled and individuals from non-English speaking countries.
UNCORRECTED
recipients, the disabled and individuals from non-English speaking countries.Causes of income inequality and poverty in Australia and Nigeria
UNCORRECTED
Causes of income inequality and poverty in Australia and Nigeria
range of factors causes inequality in Australia’s distribution of income and wealth:
UNCORRECTED
range of factors causes inequality in Australia’s distribution of income and wealth:wage differences in Australia re�ect the relative scarcity or economic value of each
UNCORRECTED
wage differences in Australia re�ect the relative scarcity or economic value of each occupation. Wage differences hence re�ect the operation of the forces of demand for labour
UNCORRECTED
occupation. Wage differences hence re�ect the operation of the forces of demand for labour (e.g. affected by tastes, technology, economic conditions) and supply of labour (e.g. affected by
UNCORRECTED
(e.g. affected by tastes, technology, economic conditions) and supply of labour (e.g. affected by education, skill, experience) in the labour market. Here, higher wages re�ect greater scarcity and mean
UNCORRECTED
education, skill, experience) in the labour market. Here, higher wages re�ect greater scarcity and mean that supply is less than demand for labour, while lower pay means that supply is greater than demand.
UNCORRECTED
that supply is less than demand for labour, while lower pay means that supply is greater than demand.–
UNCORRECTED
– incomes
UNCORRECTED
incomes union effectiveness, luck, inheritance, age, education, discrimination, work ethic and the unintended
UNCORRECTED
union effectiveness, luck, inheritance, age, education, discrimination, work ethic and the unintended effects of some government policies (e.g. tariff cuts, the user-pays principle, deregulation of the labour UNCORRECTED
effects of some government policies (e.g. tariff cuts, the user-pays principle, deregulation of the labour
PAGE of income (i.e. for �ve groups each representing
PAGE of income (i.e. for �ve groups each representing and curve can be drawn and a
PAGE and curve can be drawn and a
calculated where 1.0 is total inequality and 0.0 is total equality in distribution.
PAGE calculated where 1.0 is total inequality and 0.0 is total equality in distribution.
in Australia relative to some countries. The Gini coef�cient is 0.333.
PAGE in Australia relative to some countries. The Gini coef�cient is 0.333.
The lowest quintile receives just 7.5 per cent of the equivalised disposable income cake, while quintile
PAGE The lowest quintile receives just 7.5 per cent of the equivalised disposable income cake, while quintile 5 receives a massive 40.8 per cent of the total income cake.PAGE 5 receives a massive 40.8 per cent of the total income cake.
ABS also calculates income differences by gender, state, occupation, educational attainment and age.PAGE
ABS also calculates income differences by gender, state, occupation, educational attainment and age.
PROOFSgroups or regions. This pattern of distribution affects living standards and may be fairly even or uneven.
PROOFSgroups or regions. This pattern of distribution affects living standards and may be fairly even or uneven.
ABS measures income distribution using a sample survey of Australian households to construct a
PROOFSABS measures income distribution using a sample survey of Australian households to construct a
(i.e. income from personal sources such as wages, interest, dividends, pro�ts
PROOFS (i.e. income from personal sources such as wages, interest, dividends, pro�ts
(i.e. income from all private sources after allowing for government
PROOFS (i.e. income from all private sources after allowing for government
welfare payments, the payment of income tax and adjustments made to re�ect differences in household
PROOFSwelfare payments, the payment of income tax and adjustments made to re�ect differences in household
(income from all private sources after allowing for the effects of government redistribution
PROOFS
(income from all private sources after allowing for the effects of government redistribution measures including welfare, income tax, provision of government services and payment of indirect PROOFS
measures including welfare, income tax, provision of government services and payment of indirect
TOPIC 4 Economic ef�ciency and equity as contemporary economic issues 221
c04EconomicEf�ciencyAndEquityAsContemporaryEconomicIssues 221 4 October 2016 1:18 PM
The difference between equity and equality
• Equality in income distribution means that everyone has the same level of income — the income cake is divided totally equally between all individuals. By contrast, inequality means that people have different incomes and the cake is shared unevenly.
• Equity or fairness is very hard to de�ne since it depends partly on one’s values and point of view. For Australia, an equitable income distribution is often taken to mean that everyone should have access to basic goods and services and be able to enjoy reasonable living standards at a level deemed generally acceptable to society. Achieving this may mean treating some people unequally.
The meaning of economic ef�ciency and the bene�ts of achieving allocative and technical ef�ciency
• Resources are scarce and must be used ef�ciently to maximise material living standards and satisfy society’s wants.
• Economic ef�ciency means that resources are used in ways that maximise the general satisfaction of society’s wants and that the maximum output is gained from minimum inputs or resources. Often we refer to two types of ef�ciency: – Allocative ef�ciency means that scarce resources are used where they are most wanted or valued by consumers. Normally we rely on the operation of the market or price system to determine how resources should be used.
– Technical ef�ciency means that when a business makes a decision about how to produce a good or service, it will select the cheapest or lowest-cost method whether it involves using much labour or mostly machinery.
• Economic ef�ciency brings many bene�ts, for example: – faster rates of economic and income growth – lower in�ation rates and more purchasing power of incomes – the creation of more jobs and lower unemployment – a stronger trade balance with increased levels of net exports – better non-material living standards.
The economic and social costs and bene�ts of achieving equity in income distribution
• Too much inequality can be detrimental. For example, it can: – reduce social cohesion and non-material living standards – distort the allocation of resources and lead to the underproduction of socially bene�cial or merit goods
and services, like health and education, unless there is government interference – undermine productivity, economic growth and prosperity because poverty and inequality lead to poorer
educational and health outcomes, and a reduction in the quality and volume of Australia’s labour resources. • Too little inequality can also be bad. For instance modest inequality can help:
– increase the incentive to work hard – increase the incentive to gain improved skills, education and job position – increase the incentive to relocate to another geographic area – increase incentives for businesses to take risks and expand their operations – increase the levels of savings needed to �nance higher levels of investment – reward households and individuals who are successful.
Compatibility and con�ict between the goals of equity in income distribution and ef�ciency in resource allocation
• In economics, many believe that the promotion of equity (perhaps using government policies like progressive taxes, generous welfare and free services, setting a minimum wage) involves a trade-off or con�icting relationship with economic ef�ciency, mostly by reducing incentives to work hard, be �nancially independent, save to �nance investment, and gain improved education and skills.
• However, some believe that it might be a partially compatible relationship; for example, government policies that involve free education and health can increase the ef�ciency of the labour force so the potential GDP is bigger and there is more output or GDP per hour worked.
• In Australia, there appears to be a compromise position adopted whereby promoting ef�ciency grows the size of the production cake, allows for higher incomes, keeps prices down and purchasing power up, and provides government tax revenue that allows for a more sustainable and generous welfare system and the better provision of merit goods. However, to guarantee equity, it is still essential that the government has in place effective progressive taxes, well-targeted welfare and well-resourced collective or merits goods like affordable health and education.
The role of markets in the achievement of an ef�cient allocation of resources and equitable distribution of income
• The free or unregulated operation of the market or price system usually ensures that resources are allocated ef�ciently to areas where they are most wanted or are of greatest value. The forces of demand and supply operate in each market to determine relative prices and relative pro�ts, guiding the economic decisions of pro�t-seeking owners of resources.
UNCORRECTED and services, like health and education, unless there is government interference
UNCORRECTED and services, like health and education, unless there is government interferencevity, economic growth and prosperity because poverty and inequality lead to poorer
UNCORRECTED vity, economic growth and prosperity because poverty and inequality lead to poorer educational and health outcomes, and a reduction in the quality and volume of Australia’s labour resources.
UNCORRECTED educational and health outcomes, and a reduction in the quality and volume of Australia’s labour resources.
can also be bad. For instance modest inequality can help:
UNCORRECTED can also be bad. For instance modest inequality can help:
the incentive to gain improved skills, education and job position
UNCORRECTED the incentive to gain improved skills, education and job positionthe incentive to relocate to another geographic area
UNCORRECTED the incentive to relocate to another geographic areaincentives for businesses to take risks and expand their operations
UNCORRECTED
incentives for businesses to take risks and expand their operations
UNCORRECTED
the levels of savings needed to �nance higher levels of investment
UNCORRECTED
the levels of savings needed to �nance higher levels of investmentward households and individuals who are successful.
UNCORRECTED
ward households and individuals who are successful.
Compatibility and con�ict between the goals of equity in income distribution and ef�ciency in
UNCORRECTED
Compatibility and con�ict between the goals of equity in income distribution and ef�ciency in
economics, many believe that the promotion of
UNCORRECTED
economics, many believe that the promotion of progressive taxes, generous welfare and free services, setting a minimum wage) involves a
UNCORRECTED
progressive taxes, generous welfare and free services, setting a minimum wage) involves a con�icting relationship
UNCORRECTED
con�icting relationship�nancially independent, save to �nance investment, and gain improved education and skills.
UNCORRECTED
�nancially independent, save to �nance investment, and gain improved education and skills.wever, some believe that it might be a partially compatible relationship; for example, government
UNCORRECTED
wever, some believe that it might be a partially compatible relationship; for example, government
UNCORRECTED
policies that involve free education and health can increase the ef�ciency of the labour force so the UNCORRECTED
policies that involve free education and health can increase the ef�ciency of the labour force so the potential GDP is bigger and there is more output or GDP per hour worked.UNCORRECTED
potential GDP is bigger and there is more output or GDP per hour worked.Australia, there appears to be a compromise position adopted whereby promoting ef�ciency grows the UNCORRECTED
Australia, there appears to be a compromise position adopted whereby promoting ef�ciency grows the
PAGE The economic and social costs and bene�ts of achieving equity in income distribution
PAGE The economic and social costs and bene�ts of achieving equity in income distribution
living standards
PAGE living standards
underproductionPAGE underproduction
and services, like health and education, unless there is government interferencePAGE
and services, like health and education, unless there is government interferencevity, economic growth and prosperity because poverty and inequality lead to poorer PAGE
vity, economic growth and prosperity because poverty and inequality lead to poorer
PROOFSsociety’s wants and that the maximum output is gained from minimum inputs or resources. Often we refer
PROOFSsociety’s wants and that the maximum output is gained from minimum inputs or resources. Often we refer
means that scarce resources are used where they are most wanted or valued by
PROOFS means that scarce resources are used where they are most wanted or valued by consumers. Normally we rely on the operation of the market or price system to determine how resources
PROOFSconsumers. Normally we rely on the operation of the market or price system to determine how resources
means that when a business makes a decision about how to produce a good or service, it
PROOFS means that when a business makes a decision about how to produce a good or service, it
will select the cheapest or lowest-cost method whether it involves using much labour or mostly machinery.
PROOFSwill select the cheapest or lowest-cost method whether it involves using much labour or mostly machinery.
222 Economics Down Under 1
c04EconomicEf�ciencyAndEquityAsContemporaryEconomicIssues 222 4 October 2016 1:18 PM
• However, sometimes when competition in markets is weak (e.g. monopolies) or there is incomplete knowledge by buyers or sellers, decisions are not always optimal and society’s wellbeing may be reduced. Market failure can be the reason why governments sometime intervene in allocating resources so as to improve ef�ciency and living standards.
• Markets also help to allocate of distribute the highest incomes to those whose skills and talents are most wanted and scarce. However, this results in wage inequality between occupations and individuals.
• When inequality is too great, governments use policies to redistribute incomes more fairly so that everyone can enjoy reasonable living standards and poverty is avoided.
The effect of government budgetary policy decisions on the achievement of equity in income distribution
• The Australian government’s goal is to promote an equitable distribution of income and wealth so that everyone has access to basic goods and services (e.g. food and housing), and can enjoy reasonable living standards at a level deemed generally acceptable to society, avoiding absolute poverty.
• The government redistributes incomes more equitably using budgetary policy decisions involving changes in the level and composition of budget tax receipts and outlays.
• Direct progressive taxes like PAYG income tax are used in the budget to narrow the income gap a little between high- and low-income earners and promote equity. Here, the marginal tax rate rises with taxable income (e.g. personal marginal tax rate range from 0 on incomes up to $18 000 up to 47 per cent marginal rate on incomes above $180 000 for June 2016). They take money from the wealthy which can then potentially be used to pay for welfare and free or subsidised public services.
• Indirect taxes on goods and services (e.g. the GST, excise taxes on petrol, alcohol and tobacco, the former carbon tax) are also part of the budget. These are mostly regressive and increase inequality, but they are less so if necessities are exempted or the taxes are only levied on luxury items purchased mainly by higher income earners.
• Proportional taxes like company tax also raise budget revenue and involve a �at tax rate on every dollar of business pro�t. These have a fairly neutral effect on the distribution of income.
• Cash welfare bene�ts of perhaps $250–350 per week are paid only to the neediest (e.g. the aged, unemployed, families). This is done by applying both assets and means tests. These bene�ts are also indexed to protect their purchasing power as the cost of living rises. Income support allows low-income individuals to purchase basic goods and services and thus helps to promote equity. In addition, there have been changes to the welfare system over the years. This has involved tightening access with the hope of better targeting the most needy, encouraging increased participation in work and reducing reliance on government income support.
• The budget is also used to fund and provide free or subsidised government services (e.g. merit goods and services like public health, education, housing, transport) to the needy at an affordable price, improving their accessibility. A concern is the increased move towards the user-pays principle. This is likely to make the policy less effective in promoting an equitable distribution of income.
• Budgetary policy has encouraged superannuation or retirement savings. Some years ago, the budget announced the superannuation guarantee charge. This is a compulsory levy on employers who must currently contribute an amount equal to an additional 9.5 per cent of employees’ wages into a superannuation fund on behalf of each employee. There are also generous tax concessions for those individuals who salary sacri�ce and contribute to their superannuation balances. While some of these measures tend to favour higher income earners, they should allow people to retire with more wealth and income, reduce their reliance on the pension and enjoy improved access to goods and services.
• The government has tried to lower unemployment (e.g. following the GFC in 2012–17) and keep in�ation in check (e.g. during 2007–08 and 2010–11) using appropriate countercyclical budgetary policies that typically involve either expansionary or contractionary changes in budget receipts and outlays. By keeping unemployment and in�ation rates lower, the purchasing power of family incomes and general living standards are better protected. Equity is improved.
Key termsAbsolute poverty occurs when people’s basic survival needs for adequate food, shelter, clothing and health
are not generally met.Allocative ef�ciency means that resources will be used ef�ciently to produce those goods and services that
consumers value most highly.An assets test (wealth test) is used by the government to exclude the rich from gaining access to welfare and
to better target those in most need of help.Budgetary policy relates to government receipts mostly from various types of tax, and outlays on services
and welfare. It is often used to stabilise the level of economic activity. It can be used as an aggregate demand and as an aggregate supply policy.
Cash welfare assistance is given by the government to the neediest individuals to allow them to purchase basic goods and services.
UNCORRECTED to the welfare system over the years. This has involved tightening access with the hope of
UNCORRECTED to the welfare system over the years. This has involved tightening access with the hope of better targeting the most needy, encouraging increased
UNCORRECTED better targeting the most needy, encouraging increased
provide free
UNCORRECTED provide free or
UNCORRECTED or
services like public health, education, housing, transport) to the needy at an affordable price, improving
UNCORRECTED services like public health, education, housing, transport) to the needy at an affordable price, improving their accessibility. A concern is the increased move towards the
UNCORRECTED their accessibility. A concern is the increased move towards the the policy less effective in promoting an equitable distribution of income.
UNCORRECTED the policy less effective in promoting an equitable distribution of income.
policy has encouraged
UNCORRECTED policy has encouraged superannuation
UNCORRECTED superannuation
superannuation guarantee charge
UNCORRECTED
superannuation guarantee chargemust currently contribute an amount equal to an additional 9.5 per cent of employees’ wages into a
UNCORRECTED
must currently contribute an amount equal to an additional 9.5 per cent of employees’ wages into a superannuation fund on behalf of each employee. There are also generous
UNCORRECTED
superannuation fund on behalf of each employee. There are also generous individuals who salary sacri�ce and contribute to their superannuation balances. While some of these
UNCORRECTED
individuals who salary sacri�ce and contribute to their superannuation balances. While some of these measures tend to favour higher income earners, they should allow people to retire with more wealth and
UNCORRECTED
measures tend to favour higher income earners, they should allow people to retire with more wealth and income, reduce their reliance on the pension and enjoy improved access to goods and services.
UNCORRECTED
income, reduce their reliance on the pension and enjoy improved access to goods and services.
UNCORRECTED
government has tried to
UNCORRECTED
government has tried to in check
UNCORRECTED
in check (e.g. during 2007–08 and 2010–11) using appropriate
UNCORRECTED
(e.g. during 2007–08 and 2010–11) using appropriate typically involve either expansionary or contractionary changes in budget receipts and outlays. By keeping
UNCORRECTED
typically involve either expansionary or contractionary changes in budget receipts and outlays. By keeping unemployment and in�ation rates lower, the purchasing power of family incomes and general living
UNCORRECTED
unemployment and in�ation rates lower, the purchasing power of family incomes and general living standards are better protected. Equity is improved.UNCORRECTED
standards are better protected. Equity is improved.
Key termsUNCORRECTED
Key terms
PAGE like company tax also raise budget revenue and involve a �at tax rate on every dollar of
PAGE like company tax also raise budget revenue and involve a �at tax rate on every dollar of business pro�t. These have a fairly neutral effect on the distribution of income.
PAGE business pro�t. These have a fairly neutral effect on the distribution of income. of perhaps $250–350 per week are paid only to the neediest (e.g. the aged,
PAGE of perhaps $250–350 per week are paid only to the neediest (e.g. the aged,
assets
PAGE assets and
PAGE and means
PAGE means
to protect their purchasing power as the cost of living rises. Income support allows low-income
PAGE to protect their purchasing power as the cost of living rises. Income support allows low-income
individuals to purchase basic goods and services and thus helps to promote equity. In addition, there have
PAGE individuals to purchase basic goods and services and thus helps to promote equity. In addition, there have
to the welfare system over the years. This has involved tightening access with the hope of PAGE to the welfare system over the years. This has involved tightening access with the hope of
better targeting the most needy, encouraging increased PAGE
better targeting the most needy, encouraging increased participationPAGE
participation
PROOFS decisions involving changes
PROOFS decisions involving changes
like PAYG income tax are used in the budget to narrow the income gap a little
PROOFS like PAYG income tax are used in the budget to narrow the income gap a little between high- and low-income earners and promote equity. Here, the marginal tax rate rises with taxable
PROOFSbetween high- and low-income earners and promote equity. Here, the marginal tax rate rises with taxable up to 47 per cent marginal
PROOFSup to 47 per cent marginal
for June 2016). They take money from the wealthy which can then
PROOFSfor June 2016). They take money from the wealthy which can then
on goods and services (e.g. the GST, excise taxes on petrol, alcohol and tobacco, the
PROOFS on goods and services (e.g. the GST, excise taxes on petrol, alcohol and tobacco, the
former carbon tax) are also part of the budget. These are mostly regressive and increase inequality,
PROOFSformer carbon tax) are also part of the budget. These are mostly regressive and increase inequality, but they are less so if necessities are exempted or the taxes are only levied on luxury items purchased
PROOFS
but they are less so if necessities are exempted or the taxes are only levied on luxury items purchased
like company tax also raise budget revenue and involve a �at tax rate on every dollar of PROOFS
like company tax also raise budget revenue and involve a �at tax rate on every dollar of
TOPIC 4 Economic ef�ciency and equity as contemporary economic issues 223
c04EconomicEf�ciencyAndEquityAsContemporaryEconomicIssues 223 4 October 2016 1:18 PM
Disposable weekly income is market income, plus any government welfare income, that is available for spending each week by individuals after the payment of personal income tax.
Earned income comes from households selling their labour (i.e. supplying intellectual talents and/or physical power to businesses).
Economic ef�ciency means that resources are used to produce particular types of goods and services that maximise the general satisfaction of society’s needs and wants, and wellbeing.
Economic infrastructure is used by businesses and individuals to produce goods and services and might include highways, railways, sea ports, airports, electricity capacity and delivery, gas, telecommunications including the broadband network, sewerage and water supply.
Equality in Australia’s distribution of the income cake would mean that every individual would get exactly the same-sized slice of the cake and end up with the same level of income.
Equivalised disposable income refers to the level of spendable income available for individuals, after special equivalence adjustments have been made to re�ect the effects of different-sized households. Disposable income includes market income plus any government welfare income minus personal income tax.
Final income refers to the level of market or private income after allowing for the effects of government income redistribution policies including welfare, free or subsidised public services, the payment of direct personal income tax and the payment of indirect taxes.
A fringe bene�t is a special non-monetary reward given by an employer to selected employees in lieu of income (e.g. a free house, company car).
The Gini coef�cient is a measure of the degree of inequality in the distribution of a nation’s income or wealth. On the Lorenz diagram, it represents the area between the diagonal line of total equality and the actual nation’s Lorenz curve. The bigger the area, the closer the Gini coef�cient is to its maximum value of 1; the smaller the area, the lower the degree of inequality and the closer the Gini coef�cient is to 0.
The goal of a fair and equitable distribution of income and wealth is a government objective and means that everyone should be able to have access to basic goods and services and enjoy reasonable living standards. This often means partly narrowing the gap or differences between the rich and poor.
Goal of an equitable income distribution is achieved when everyone has access to basic goods and services, and can enjoy a reasonable standard of living at a level deemed generally acceptable by most in society.
Income distribution refers to the way the nation’s ‘income cake’ is divided or shared between individuals and income units making up the population.
Income units are of different sizes and types, and represent a group of people or an individual that is dependent on a given income to survive.
Indirect taxes are those added onto the price of goods and services at the point of sale. These are regressive and add to inequality because their value represents a higher percentage of a low-income earner’s income than for a high-income earner purchasing a particular item.
Inequitable distribution of income refers to a situation where a nation’s income cake is divided unfairly and where many people are unable to enjoy access to basic goods and services and reasonable living standards.
A Lorenz curve is part of the Lorenz diagram. The line or curve shows how total income or wealth is shared between cumulative quintiles. The greater the deviation of the Lorenz curve from the diagonal line of total equality, the greater the degree of inequality.
A Lorenz diagram is a graph used to show how evenly income or wealth is distributed between individuals.Market failure occurs when the operation of demand and supply and the price system do not cause
resources to be used in ways that maximise the general wellbeing of society.Market or private income is personal income from private sources including wages, salaries, pro�ts, rent,
interest and dividends, prior to any government efforts to redistribute income more evenly.A means test (income test) is used by the government to exclude high-income earners from gaining access to
welfare and to better target those individuals that most need �nancial help.Merit goods are socially bene�cial goods and services like health and education that all people require for
reasonable living standards so they are usually provided free of charge or subsidised by the government.Net worth is positive when there is an excess of assets or wealth owned by households over their liabilities.Nominal income is simply the number of dollars of income received by an individual measured over a
period of time, and does not take into account its purchasing power.The pattern of income distribution is regarded as fairly even if people receive similar-sized slices of
Australia’s income cake, but uneven if the majority of the population receives only a relatively small share of the total income cake.
Poverty has many meanings, including material deprivation and inability to afford basic goods and services needed for survival (absolute poverty) or for a reasonable living standard (relative poverty).
The poverty line is set at the amount of money required by different-sized income units each week to sustain an austere or basic living standard, and purchase essential food, shelter and clothing.
UNCORRECTED refers to the way the nation’s ‘income cake’ is divided or shared between individuals
UNCORRECTED refers to the way the nation’s ‘income cake’ is divided or shared between individuals
are of different sizes and types, and represent a group of people or an individual that is
UNCORRECTED are of different sizes and types, and represent a group of people or an individual that is
are those added onto the price of goods and services at the point of sale. These are regressive
UNCORRECTED are those added onto the price of goods and services at the point of sale. These are regressive
and add to inequality because their value represents a higher percentage of a low-income earner’s income
UNCORRECTED and add to inequality because their value represents a higher percentage of a low-income earner’s income than for a high-income earner purchasing a particular item.
UNCORRECTED than for a high-income earner purchasing a particular item.
Inequitable distribution of income
UNCORRECTED
Inequitable distribution of income refers to a situation where a nation’s income cake is divided unfairly and
UNCORRECTED
refers to a situation where a nation’s income cake is divided unfairly and where many people are unable to enjoy access to basic goods and services and reasonable living standards.
UNCORRECTED
where many people are unable to enjoy access to basic goods and services and reasonable living standards.is part of the Lorenz diagram. The line or curve shows how total income or wealth is shared
UNCORRECTED
is part of the Lorenz diagram. The line or curve shows how total income or wealth is shared between cumulative quintiles. The greater the deviation of the Lorenz curve from the diagonal line of total
UNCORRECTED
between cumulative quintiles. The greater the deviation of the Lorenz curve from the diagonal line of total equality, the greater the degree of inequality.
UNCORRECTED
equality, the greater the degree of inequality.Lorenz diagram
UNCORRECTED
Lorenz diagram is a graph used to show how evenly income or wealth is distributed between individuals.
UNCORRECTED
is a graph used to show how evenly income or wealth is distributed between individuals.occurs when the operation of demand and supply and the price system do not cause
UNCORRECTED
occurs when the operation of demand and supply and the price system do not cause resources to be used in ways that maximise the general wellbeing of society.
UNCORRECTED
resources to be used in ways that maximise the general wellbeing of society.Market or private income
UNCORRECTED
Market or private income interest and dividends, prior to any government efforts to redistribute income more evenly.
UNCORRECTED
interest and dividends, prior to any government efforts to redistribute income more evenly.means test UNCORRECTED
means test (income test) is used by the government to exclude high-income earners from gaining access to UNCORRECTED
(income test) is used by the government to exclude high-income earners from gaining access to UNCORRECTED
welfare and to better target those individuals that most need �nancial help.UNCORRECTED
welfare and to better target those individuals that most need �nancial help.Merit goods UNCORRECTED
Merit goods
PAGE actual nation’s Lorenz curve. The bigger the area, the closer the Gini coef�cient is to its maximum value
PAGE actual nation’s Lorenz curve. The bigger the area, the closer the Gini coef�cient is to its maximum value of 1; the smaller the area, the lower the degree of inequality and the closer the Gini coef�cient is to 0.
PAGE of 1; the smaller the area, the lower the degree of inequality and the closer the Gini coef�cient is to 0.is a government objective and means
PAGE is a government objective and means
that everyone should be able to have access to basic goods and services and enjoy reasonable living
PAGE that everyone should be able to have access to basic goods and services and enjoy reasonable living standards. This often means partly narrowing the gap or differences between the rich and poor.
PAGE standards. This often means partly narrowing the gap or differences between the rich and poor.
is achieved when everyone has access to basic goods and services, and
PAGE is achieved when everyone has access to basic goods and services, and
can enjoy a reasonable standard of living at a level deemed generally acceptable by most in society.PAGE can enjoy a reasonable standard of living at a level deemed generally acceptable by most in society.
refers to the way the nation’s ‘income cake’ is divided or shared between individuals PAGE
refers to the way the nation’s ‘income cake’ is divided or shared between individuals
PROOFSrefers to the level of market or private income after allowing for the effects of government
PROOFSrefers to the level of market or private income after allowing for the effects of government income redistribution policies including welfare, free or subsidised public services, the payment of direct
PROOFSincome redistribution policies including welfare, free or subsidised public services, the payment of direct
is a special non-monetary reward given by an employer to selected employees in lieu of
PROOFSis a special non-monetary reward given by an employer to selected employees in lieu of
is a measure of the degree of inequality in the distribution of a nation’s income or
PROOFSis a measure of the degree of inequality in the distribution of a nation’s income or
wealth. On the Lorenz diagram, it represents the area between the diagonal line of total equality and the PROOFS
wealth. On the Lorenz diagram, it represents the area between the diagonal line of total equality and the actual nation’s Lorenz curve. The bigger the area, the closer the Gini coef�cient is to its maximum value PROOFS
actual nation’s Lorenz curve. The bigger the area, the closer the Gini coef�cient is to its maximum value of 1; the smaller the area, the lower the degree of inequality and the closer the Gini coef�cient is to 0.PROOFS
of 1; the smaller the area, the lower the degree of inequality and the closer the Gini coef�cient is to 0.
224 Economics Down Under 1
c04EconomicEf�ciencyAndEquityAsContemporaryEconomicIssues 224 4 October 2016 1:18 PM
Progressive personal income tax is one where the percentage of income paid in tax rises with the level of income.
Purchasing power parity (PPP) is used to make adjustments to the purchasing power of money in different countries so as to allow comparisons of incomes.
Quintiles represent the �ve equal-sized groups making up all income earners in Australia. Each quintile therefore represents 20 per cent or 1/5 of all income earners. Comparing income or wealth shares of the income cake by quintiles exposes the degree of inequality.
Real income is equal to a person’s nominal level of income measured in so many dollars after taking into account the in�ation rate. This is a guide to its purchasing power.
Regressive taxes are those where the rate of tax as a proportion of income decreases as incomes rise (e.g. the GST). Unless they are used carefully, targeting items purchased by the rich, they increase the gap between high- and low-income earners, reducing equality.
Relative poverty exists when people have low incomes compared with what is needed to maintain what are regarded as reasonable living standards.
Superannuation guarantee charge (SGC) requires employers to make superannuation or retirement contributions on behalf of their workers, currently equal to an extra 9.5 per cent of pay (to be progressively increased to 12 per cent by 2025).
Technical ef�ciency is about businesses and managers using the most ef�cient techniques or methods of production available when making goods and services.
Transfer income is derived from government cash welfare payments made to the neediest individuals with little or no income or wealth.
Unearned income includes rent and interest, and is received for allowing others to use your property and savings.
Wealth consists of assets or things of value owned by private individuals (e.g. houses, shares, bonds, savings) or governments (e.g. public infrastructure including power, transport, health and education).
UNCORRECTED PAGE consists of assets or things of value owned by private individuals (e.g. houses, shares, bonds,
PAGE consists of assets or things of value owned by private individuals (e.g. houses, shares, bonds, savings) or governments (e.g. public infrastructure including power, transport, health and education).
PAGE savings) or governments (e.g. public infrastructure including power, transport, health and education).PROOFS
exists when people have low incomes compared with what is needed to maintain what are
PROOFSexists when people have low incomes compared with what is needed to maintain what are
(SGC) requires employers to make superannuation or retirement
PROOFS(SGC) requires employers to make superannuation or retirement contributions on behalf of their workers, currently equal to an extra 9.5 per cent of pay (to be progressively
PROOFScontributions on behalf of their workers, currently equal to an extra 9.5 per cent of pay (to be progressively
is about businesses and managers using the most ef�cient techniques or methods of
PROOFSis about businesses and managers using the most ef�cient techniques or methods of
is derived from government cash welfare payments made to the neediest individuals with
PROOFSis derived from government cash welfare payments made to the neediest individuals with
includes rent and interest, and is received for allowing others to use your property and
PROOFS
includes rent and interest, and is received for allowing others to use your property and
consists of assets or things of value owned by private individuals (e.g. houses, shares, bonds, PROOFS
consists of assets or things of value owned by private individuals (e.g. houses, shares, bonds,