topic 5: ecology and evolution - wikispaces5... · topic 5: ecology and evolution ... material not...
TRANSCRIPT

Topic 5: Ecology and evolution


Topic 5: Ecology and evolution
5.1 Communities and ecosystems
Assessment Statement IBO Notes Student Notes
5.1.1 Define species, habitat, population, community, ecosystem and ecology.
Species: a group of organisms that can interbreed and produce fertile offspring. Habitat: the environment in which a species normally lives or the location of a living organism. Population: a group of organisms of the same species who live in the same area at the same time. Community: a group of populations living and interacting with each other in an area. Ecosystem: a community and its abiotic environment. Ecology: the study of relationships between living organisms and between organisms and their environment.
5.1.2 Distinguish between autotroph and heterotroph. Autotroph: an organism that synthesizes its organic molecules from simple inorganic substances. Heterotroph: an organism that obtains organic molecules from other organisms.
5.1.3 Distinguish between consumers, detritivores and saprotrophs.
Consumer: an organism that ingests other organic matter that is living or recently killed. Detritivore: an organism that ingests non‐living organic matter. Saprotroph: an organism that lives on or in non‐living organic matter, secreting digestive enzymes into it and absorbing the products of digestion.
5.1.4 Describe what is meant by a food chain, giving three examples, each with at least three linkages (four organisms).
Only real examples should be used from natural ecosystems. indicates that A is being “eaten” by B (that is, the arrow indicates the direction of energy flow). Each food chain should include a producer and consumers, but not decomposers. Named organisms at either species or genus level should be used. Common species names can be used instead of binomial names. General names such as “tree” or “fish” should not be used.
5.1.5 Describe what is meant by a food web.

5.1.6 Define trophic level.
5.1.7 Deduce the trophic level of organisms in a food chain and a food web.
Students should be able to place an organism at the level of producer, primary consumer, secondary consumer, and so on, as the terms herbivore and carnivore are not always applicable.
5.1.8 Construct a food web containing up to 10 organisms, using appropriate information.
5.1.9 State that light is the initial energy source for almost all communities.
No reference to communities where food chains start with chemical energy is required.
5.1.10 Explain the energy flow in a food chain. Energy losses between trophic levels include material not consumed or material not assimilated, and heat loss through cell respiration.
5.1.11 State that energy transformations are never 100% efficient.
Reference to the second law of thermodynamics is not expected.
5.1.12 Explain reasons for the shape of pyramids of energy. A pyramid of energy shows the flow of energy from one trophic level to the next in a community. The units of pyramids of energy are, therefore, energy per unit area per unit time, for example, kJ m–2 yr–1.
5.1.13 Explain that energy enters and leaves ecosystems, but nutrients must be recycled.
5.1.14 State that saprotrophic bacteria and fungi (decomposers) recycle nutrients.

1. Explain the significance of the principle of competitive exclusion.
...............................................................................................................................................
...............................................................................................................................................
...............................................................................................................................................
...............................................................................................................................................
...............................................................................................................................................
...............................................................................................................................................
...............................................................................................................................................
...............................................................................................................................................(Total 3 marks)
2. Explain how parasitism differs from mutualism with reference to named organisms.
...............................................................................................................................................
...............................................................................................................................................
...............................................................................................................................................
...............................................................................................................................................
...............................................................................................................................................
...............................................................................................................................................
...............................................................................................................................................
...............................................................................................................................................
...............................................................................................................................................
...............................................................................................................................................
...............................................................................................................................................
...............................................................................................................................................
...............................................................................................................................................
...............................................................................................................................................(Total 6 marks)
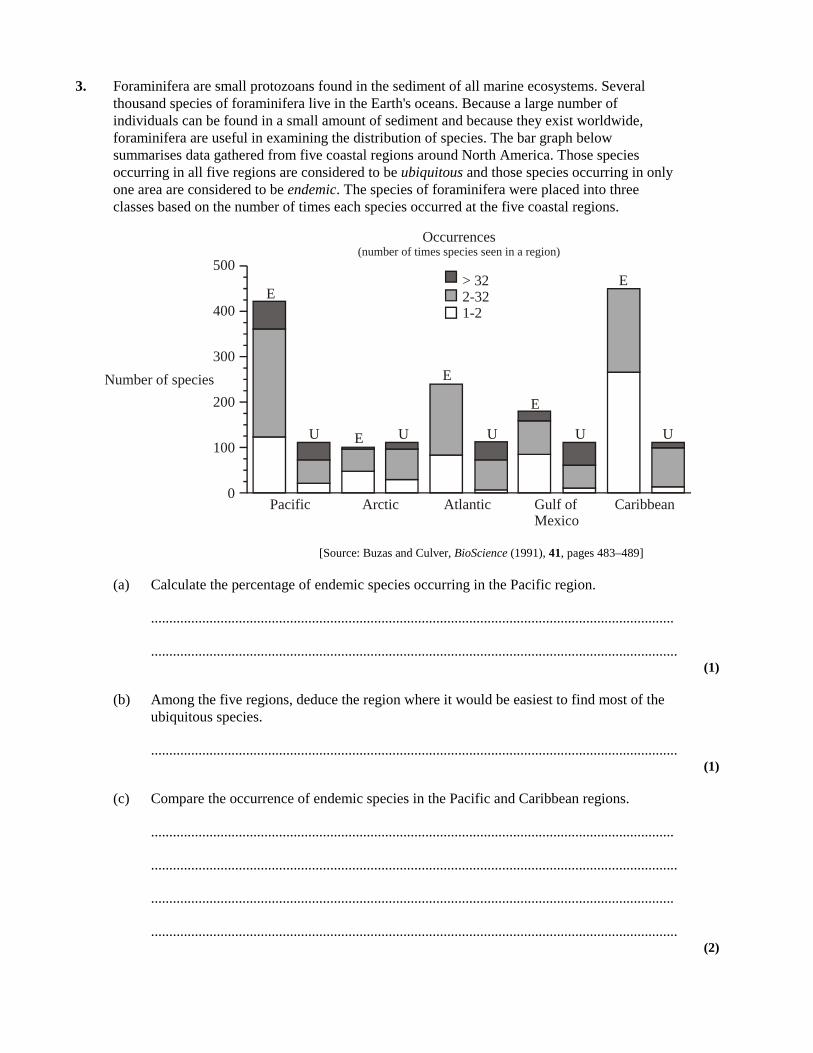
3. Foraminifera are small protozoans found in the sediment of all marine ecosystems. Severalthousand species of foraminifera live in the Earth's oceans. Because a large number ofindividuals can be found in a small amount of sediment and because they exist worldwide,foraminifera are useful in examining the distribution of species. The bar graph belowsummarises data gathered from five coastal regions around North America. Those speciesoccurring in all five regions are considered to be ubiquitous and those species occurring in onlyone area are considered to be endemic. The species of foraminifera were placed into threeclasses based on the number of times each species occurred at the five coastal regions.
500
400
300
200
100
0
Occurrences(number of times species seen in a region)
Pacific Arctic Atlantic Gulf ofMexico
Caribbean
U U U U U
E
E
E
E
E
Number of species
> 322-321-2
[Source: Buzas and Culver, BioScience (1991), 41, pages 483–489]
(a) Calculate the percentage of endemic species occurring in the Pacific region.
...............................................................................................................................................
................................................................................................................................................(1)
(b) Among the five regions, deduce the region where it would be easiest to find most of theubiquitous species.
................................................................................................................................................(1)
(c) Compare the occurrence of endemic species in the Pacific and Caribbean regions.
...............................................................................................................................................
................................................................................................................................................
...............................................................................................................................................
................................................................................................................................................(2)

(d) Suggest, giving a reason, which of the Pacific, Atlantic or Caribbean regions will have agreater extinction rate.
...............................................................................................................................................
................................................................................................................................................
...............................................................................................................................................
................................................................................................................................................(2)
(e) Identify which region has the lowest species diversity.
................................................................................................................................................(1)
(Total 7 marks)
4. On a field trip a group of students was asked to estimate the size of the population of a small,nocturnal ground dwelling mammal, the long-nosed bandicoot (Perameles nasuta). Thebandicoot feeds on invertebrates and plant material found by digging pits 5 cm deep in theground with its front legs.
[Source: J Smith & P Smith, Fauna of the Blue Mountains, Kangaroo Press, Sydney, 1990]
(a) (i) State the name of an appropriate technique to estimate the population sizeof P. nasuta.
..................................................................................................................................... 1)

(ii) Describe this method of estimating the population size of P. nasuta.
.....................................................................................................................................
.....................................................................................................................................
.....................................................................................................................................
.....................................................................................................................................
.....................................................................................................................................
.....................................................................................................................................
.....................................................................................................................................(3)
(b) Deduce, with reasons, the trophic level of P. nasuta in food chains.
...............................................................................................................................................
...............................................................................................................................................
...............................................................................................................................................
...............................................................................................................................................(2)
(Total 6 marks)
5. Ecologists sometimes measure the gross production and net production of a species in anecosystem.
(a) Define the term gross production.
...............................................................................................................................................
...............................................................................................................................................(1)
(b) Explain why the gross production of a species in an ecosystem is always higher than thenet production.
...............................................................................................................................................
...............................................................................................................................................
...............................................................................................................................................
...............................................................................................................................................(2)

(c) Outline the changes in the gross production of an ecosystem during ecological succession.
...............................................................................................................................................
...............................................................................................................................................
...............................................................................................................................................
...............................................................................................................................................(2)
(Total 5 marks)
6. Explain how energy and nutrients enter, move through, and exit a food chain in an ecosystem.(Total 8 marks)
7. The Kluane boreal forest ecosystem project was a large scale ten year experimentalmanipulation of food and predators on arctic ground squirrel population (Spermophilusparryiiplesius).
Three areas were set up:
• a food addition area• a predator exclusion area• a food addition area enclosed within a predator exclusion area.
The areas were monitored from 1986 to 1996. In spring 1996 all fences were dismantled andfood addition was stopped.
As a further experiment, spring and summer mark-recapture population estimates of thesquirrels were conducted from spring 1996 to spring 1998. The results for these two years areshown below. The areas are labelled according to the conditions imposed during the previousten years.
30
25
20
15
10
5
0Spring1996
Spring1997
Spring1998
Summer1996
Summer1997
Squi
rrel
s hec
tare
–1
ControlPredator exclusionFood additionFood addition pluspredator exclusion
[Source: Karels et al., Nature, (2000), 408, Pages 460–463)]

(a) State the squirrel population in the food addition plus predator exclusion area in spring1996.
...............................................................................................................................................(1)
(b) Describe the effect of ending food addition on the squirrel population.
...............................................................................................................................................
...............................................................................................................................................
...............................................................................................................................................
...............................................................................................................................................
...............................................................................................................................................(2)
(c) Scientists believed that the number of ground squirrels in the boreal forests was limitedby an interaction between food and predators that acted primarily through changes inreproduction. Using the data, discuss this hypothesis.
...............................................................................................................................................
...............................................................................................................................................
...............................................................................................................................................
...............................................................................................................................................
...............................................................................................................................................
...............................................................................................................................................
...............................................................................................................................................(3)
(Total 6 marks)
8. (a) Define the term net production.
...............................................................................................................................................
...............................................................................................................................................
...............................................................................................................................................(1)
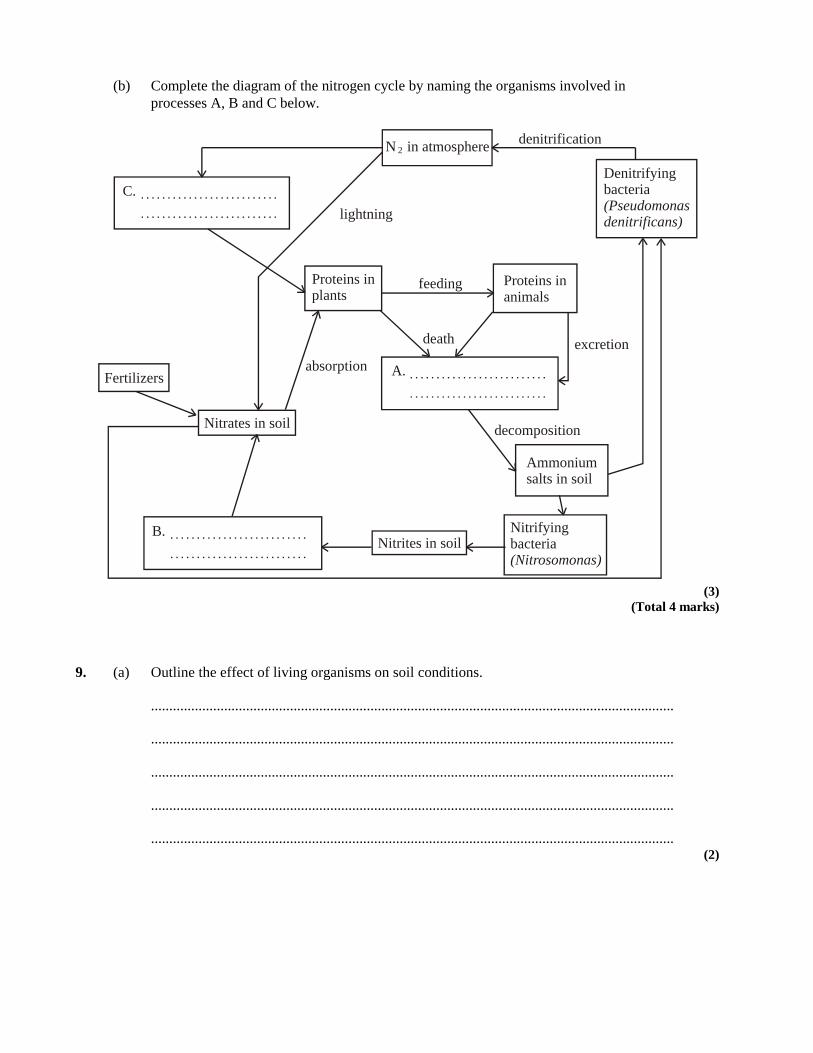
(b) Complete the diagram of the nitrogen cycle by naming the organisms involved inprocesses A, B and C below.
C.
A.
B.
N in atmosphere denitrification
lightning
feedingProteins inplants
Proteins inanimals
death
Fertilizers
Nitrates in soil
absorptionexcretion
decomposition
Nitrites in soil
Ammoniumsalts in soil
Denitrifyingbacteria(Pseudomonasdenitrificans)
Nitrifyingbacteria(Nitrosomonas)
2
(3)(Total 4 marks)
9. (a) Outline the effect of living organisms on soil conditions.
...............................................................................................................................................
...............................................................................................................................................
...............................................................................................................................................
...............................................................................................................................................
...............................................................................................................................................(2)

(b) Discuss the economic reasons for the conservation of tropical rainforest biodiversity.
...............................................................................................................................................
...............................................................................................................................................
...............................................................................................................................................
...............................................................................................................................................
...............................................................................................................................................
...............................................................................................................................................
...............................................................................................................................................
...............................................................................................................................................(3)
(Total 5 marks)
10. (a) Simpson’s index is given by the following equation:
( )( )∑ −−
=1
1nn
NND
where:
D = the diversity index, N = the total number of all species found and n = the number ofindividuals of a particular species.
(i) State what would happen to this index if the numbers of one species increased butthe total number of species stays the same.
.....................................................................................................................................(1)
(ii) State what a high value of D suggests about an ecosystem.
.....................................................................................................................................(1)

(b) Explain the use of biotic indices in monitoring environmental changes.
...............................................................................................................................................
...............................................................................................................................................
...............................................................................................................................................
...............................................................................................................................................
...............................................................................................................................................
...............................................................................................................................................(3)
(Total 5 marks)
11. In the south-west of the USA, dams were built across rivers in the early 1900s to stop naturalflooding. As a result, a non-native tree Tamarix ramosissima (salt cedar) gradually replaced thenative Populus deltoides (cottonwood) as the dominant woody species. Flooding is beingre-established to reverse the invasion of Tamarix.

Studies were done to investigate the relative competitive abilities at the seedling stage usingdifferent densities of the two species. Seedlings were grown in pots at different densities andmixtures of the two species. A three dimensional model was developed to show the effect of thedensities of each species on Populus mass (graph A) and height (graph B). Densities representthe number of seedlings per 20-cm-diameter pot.
[Source: A Sher, D Marshall and S Gilbert, (2000) Conservation Biology, 14, pages 1722–1754]
(a) Considering the pots where Populus is growing without Tamarix, describe the change inmass and height of Populus with increased density of Populus seedlings.
...............................................................................................................................................
...............................................................................................................................................
...............................................................................................................................................
...............................................................................................................................................
...............................................................................................................................................
...............................................................................................................................................
...............................................................................................................................................(3)
(b) Describe how Tamarix density affects Populus height.
...............................................................................................................................................
...............................................................................................................................................(1)
(c) Suggest two factors that could have allowed Tamarix to dominate in non-floodconditions.
...............................................................................................................................................
...............................................................................................................................................
...............................................................................................................................................
...............................................................................................................................................
...............................................................................................................................................(2)
(Total 6 marks)
12. (a) Distinguish between parasitism and mutualism.
...............................................................................................................................................
...............................................................................................................................................
...............................................................................................................................................
...............................................................................................................................................(2)

(b) Outline the management of nature reserves.
...............................................................................................................................................
...............................................................................................................................................
...............................................................................................................................................
...............................................................................................................................................
...............................................................................................................................................(2)
(Total 4 marks)
13. In communities, groups of populations live together and interact with each other. Outline theimportance of plants to populations of other organisms in a community.
(Total 6 marks)
14. Ecosystems require an input of energy, water and nutrients to maintain themselves. Nutrientsmay be reused through recycling within ecosystems.
Nutrient cycling within an ecosystem has been studied in many biomes. One factor studied isthe mean residence time (MRT), which is the amount of time needed for one cycle ofdecomposition (from absorption by organism to release after death). The table below gives themean residence time for certain nutrients in four different biomes. In addition, the plantproductivity is also shown. (Plant productivity gives an indication of the quantity of biomasspotentially available to consumers.)
Mean residence time / years
Biome Carbon Nitrogen Phosphorus Potassium Calcium Magnesium Plantproductivity/g Cm–2 yr–1
Sub-arctic forest 353.0 230.0 324.0 94.0 149.0 455.0 360Temperate forest 4.0 5.5 5.8 1.3 3.0 3.4 540
Chaparral 3.8 4.2 3.6 1.4 5.0 2.8 270Tropicalrainforest
0.4 2.0 1.6 0.7 1.5 1.1 900
[Source: W H Schlesinger (1991), in M Bush, Ecology of a Changing Planet (1997), Prentice Hall, page 67]
(a) (i) State which nutrient shows the shortest mean residence time in a temperate forest.
.....................................................................................................................................(1)
(ii) Identify the biome in which potassium has the longest mean residence time.
.....................................................................................................................................(1)

(b) Compare the mean residence time for nutrients in the temperate forest and chaparral.
...............................................................................................................................................
...............................................................................................................................................
...............................................................................................................................................
...............................................................................................................................................
...............................................................................................................................................(2)
(c) Evaluate the relationship between the mean residence time and plant productivity for thedifferent biomes.
...............................................................................................................................................
...............................................................................................................................................
...............................................................................................................................................
...............................................................................................................................................
...............................................................................................................................................(2)
(d) Suggest one reason for the difference in mean residence time of nutrients in the tropicalrainforest and the sub-arctic forest.
...............................................................................................................................................
...............................................................................................................................................(1)
(e) Define the term ecosystem.
...............................................................................................................................................
...............................................................................................................................................(1)

In addition to nutrients, other atmospheric elements may also enter the ecosystem. Radioactivecesium-137 was released into the atmosphere by atomic bomb tests in 1961. The cesium-137was deposited in the soil and on to plants. The graph shows the amount of radioactivity found inthe tissues of lichens (an alga and a fungus growing together), caribou (a member of the deerfamily) and the Inuit (people of Alaska and Northern Canada) in the Anaktuvuk Pass of Alaska.
Inuit
Caribou
Lichens
June1961
June1962
June1963
June1964
June1965
June1966
Dec Dec Dec Dec Dec
Increasing radioactivity/ nCi g –1
[Source: W G Henson, “Cesium-137 in Alaska Lichens, Caribou and Inuit.” Health Physics, (1967), 13,pages 383–389, Pergamon Press; reproduced with permission from the Health Physics Society]
(f) Describe the level of cesium-137 in the Inuit from 1962 through to 1965.
...............................................................................................................................................
...............................................................................................................................................
...............................................................................................................................................
...............................................................................................................................................(2)
(g) The three organisms form a food chain. Deduce the trophic level of
(i) lichens. ...............................................................................................................
(ii) the Inuit. ...............................................................................................................(2)
(h) Suggest a reason for the difference in the amount of cesium-137 found in lichens, caribouand the Inuit.
...............................................................................................................................................
...............................................................................................................................................(1)
(Total 13 marks)

15. The total solar energy received by a grassland is 5 × l05 kJ m–2 y–1. The net production of thegrassland is 5 × 10² kJ m–2 y–1 and its gross production is 6 × l02 kJ m–2 y–1. The total energypassed on to primary consumers is 60 kJ m–2 y–1. Only 10 % of this energy is passed on to thesecondary consumers.
(a) Calculate the energy lost by plant respiration.
...............................................................................................................................................
...............................................................................................................................................
...............................................................................................................................................
...............................................................................................................................................(2)
(b) Construct a pyramid of energy for this grassland.
(3)(Total 5 marks)
16. (a) State how gross production differs from net production in an ecosystem.
...............................................................................................................................................
...............................................................................................................................................(1)
(b) State the units that would be used if constructing a pyramid of energy.
...............................................................................................................................................(1)

(c) Explain how parasitism differs from mutualism, giving an example of each.
...............................................................................................................................................
...............................................................................................................................................
...............................................................................................................................................
...............................................................................................................................................
...............................................................................................................................................
...............................................................................................................................................
...............................................................................................................................................
...............................................................................................................................................
...............................................................................................................................................(4)
(Total 6 marks)
17. What term refers to a community and its abiotic environment?
A. Biosphere
B. Ecosystem
C. Habitat
D. Niche(1)
18. Which organisms externally digest dead organic matter and then absorb the nutrients?
A. Autotrophs
B. Detritivores
C. Heterotrophs
D. Saprotrophs(1)
19. Outline ways in which leaves take part in the carbon cycle in ecosystems, apart fromphotosynthesis.
(Total 4 marks)

20. Outline the use of the Simpson diversity index.
...............................................................................................................................................
...............................................................................................................................................
...............................................................................................................................................
...............................................................................................................................................
...............................................................................................................................................
...............................................................................................................................................
...............................................................................................................................................(Total 3 marks)
21. The relationship between the numbers of rodent species and rainfall was studied in dry areas ofChile and in the south-west of the United States. The results of the study are shown in thescattergraph below.
Key:ChileUSA
8
6
4
2
0
Number of species
10 50 100 500Rainfall / mm
[Source: UNEP, (1995), Global Biodiversity Assessment, Press Syndicate of the University of Cambridge, page 154]

(a) Calculate the difference between the number of species found at 80 mm of rainfall and at100 mm of rainfall in
(i) Chile.
.....................................................................................................................................
.....................................................................................................................................(1)
(ii) the USA.
.....................................................................................................................................
.....................................................................................................................................(1)
(b) Compare the relationship between the number of rodent species and rainfall in Chile withthat of the USA.
...............................................................................................................................................
...............................................................................................................................................
...............................................................................................................................................
...............................................................................................................................................(2)
(c) Suggest two reasons for the relationship between the number of rodent species andrainfall in each country.
...............................................................................................................................................
...............................................................................................................................................
...............................................................................................................................................
...............................................................................................................................................(2)
(Total 6 marks)
22. (a) Outline changes caused in marine ecosystems by over-fishing.
...............................................................................................................................................
...............................................................................................................................................
...............................................................................................................................................
...............................................................................................................................................(2)

(b) Explain the low numbers of organisms in higher trophic levels of a food chain.
...............................................................................................................................................
...............................................................................................................................................
...............................................................................................................................................
...............................................................................................................................................(2)
(Total 4 marks)
23. (a) Describe the use of ex situ conservation measures.
...............................................................................................................................................
...............................................................................................................................................
...............................................................................................................................................
...............................................................................................................................................
...............................................................................................................................................
...............................................................................................................................................
...............................................................................................................................................(3)
(b) (i) Define the term niche.
.....................................................................................................................................
.....................................................................................................................................(1)

(ii) Explain the niche concept using a named organism.
.....................................................................................................................................
.....................................................................................................................................
.....................................................................................................................................
.....................................................................................................................................
.....................................................................................................................................
.....................................................................................................................................
.....................................................................................................................................
.....................................................................................................................................
.....................................................................................................................................
.....................................................................................................................................(4)
(Total 8 marks)
24. What are the two components of an ecosystem?
A. community and abiotic environment
B. species and habitat
C. habitat and abiotic environment
D. species and community(1)

25. The reticulated python (Python reticulatus), a species of snake, consumes rats as part of its diet.The graph shows changes in the proportion of rats in the diet of male and female reticulatedpythons from southern Sumatra as the length of the snake increases.
1.0
0.8
0.6
0.4
0.2
0.0
MalesFemales
100 200 300 400 500 600 700
Length of snake / cm
Proportion of dietcomposed of rats
[Source: R Shine, et al., (1998) Functional Ecology, 12, pages 248–258]
(a) Identify the relationship between the proportion of diet composed of rats and the length offemale pythons.
...............................................................................................................................................
...............................................................................................................................................(1)
(b) Compare the feeding preferences of female and male pythons of lengths between
(i) 100 and 300 cm.
.....................................................................................................................................
.....................................................................................................................................(1)
(ii) 300 and 400 cm.
.....................................................................................................................................
.....................................................................................................................................(1)

(c) Suggest two reasons for the differences in feeding preferences of the pythons as lengthincreases.
...............................................................................................................................................
...............................................................................................................................................
...............................................................................................................................................
...............................................................................................................................................(2)
The snakes were bought at local markets and skinning factories in Sumatra. Therefore, theorigin of the individual snakes was not known. Estimations about prey size and species weremade from fur and skeletal remains in the gut of the snakes.
(d) Suggest two factors that could influence the reliability of the results of this investigation.
...............................................................................................................................................
...............................................................................................................................................
...............................................................................................................................................
...............................................................................................................................................(2)
(Total 7 marks)
26. Discuss, giving named examples, the difficulties of placing organisms in higher trophic levels.
...............................................................................................................................................
...............................................................................................................................................
...............................................................................................................................................
...............................................................................................................................................
...............................................................................................................................................
...............................................................................................................................................
...............................................................................................................................................
...............................................................................................................................................
...............................................................................................................................................
...............................................................................................................................................(Total 4 marks)

27. The water flea (Daphnia sp.) normally produces eggs asexually. Under certain conditions,Daphnia will switch to sexual reproduction, producing "resting" eggs that can survive dormantfor many years.
The graph below shows how the day length and biomass of algae (a food source for Daphnia)varies over the course of the year in the habitat of Daphnia.
Month
18
16
14
12
10
8
Day length/ h
biomass of algae day length
Biomassof algae /arbitrary
units
J F M A M J J A S O N D
[Source: V Alekseev and W Lampert, Nature, (2001), 414, pages 899–901]
(a) Identify the month during which the quantity of food is at a maximum.
............................................................................................................................................... (1)
(b) Compare the changes in biomass of algae with the changes in day length from January toJune.
...............................................................................................................................................
...............................................................................................................................................
...............................................................................................................................................
...............................................................................................................................................
...............................................................................................................................................
...............................................................................................................................................
...............................................................................................................................................(3)

An investigation was conducted to determine how conditions experienced by one generation ofDaphnia can affect resting egg production by the next generation. The investigation examinedthe influence of three variables on resting egg production: day length, quantity of food(photosynthetic algae), and conditions experienced by the previous generation.
The table below shows the percentage of resting eggs produced under the various conditions.
Conditions experienced by1st generation mother
Conditions experienced by2nd generation mothers
Percentage of resting eggsproduced by 2nd
generation
Food Levels Day Length Food Levels Day Length
High Short Day High Short Day 0.0
High Long Day 0.0
Low Short Day 52.3
Low Long Day 38.0
High Long Day High Short Day 0.0
High Long Day 0.0
Low Short Day 13.0
Low Long Day 11.0
Low Short Day High Short Day 0.0
High Long Day 0.0
Low Short Day 7.5
Low Long Day 15.8
Low Long Day High Short Day 0.0
High Long Day 0.0
Low Short Day 0.0
Low Long Day 30.7
(c) Discuss the conditions in the 2nd generation which favour resting egg production.
...............................................................................................................................................
...............................................................................................................................................
...............................................................................................................................................
...............................................................................................................................................
...............................................................................................................................................
...............................................................................................................................................
...............................................................................................................................................(3)

(d) Using the graph, deduce, giving a reason, whether resting egg production is likely inApril.
...............................................................................................................................................
...............................................................................................................................................(1)
(e) Determine the change between the 1st generation and the 2nd generation which is mostlikely to trigger resting egg production.
...............................................................................................................................................
...............................................................................................................................................(1)
(f) Suggest the advantages of having asexual and sexual reproduction in Daphnia.
...............................................................................................................................................
...............................................................................................................................................
...............................................................................................................................................
...............................................................................................................................................
...............................................................................................................................................
...............................................................................................................................................
...............................................................................................................................................(3)
(Total 12 marks)
28. Ecologists sometimes investigate one population and at other times do research into a wholecommunity. Define the terms population and community.
(Total 4 marks)

29. In Norway the body masses of young moose (calves) fluctuate from year-to-year in the fall(autumn). Because of the regularity of the pattern, the fluctuation was thought to be related tofood availability. Moose (Alce alce) eat bilberry (Vaccinium myrtillus), as do the bank vole(Clethrionomys glareolus). It was known that the bank vole populations peaked the year afterhigh bilberry production.
These population changes were studied in a Northern area and a Southern area of Norway. Thevariation in mean fall (autumn) body mass of moose calves and the bank vole density are shownfor the two areas in the graphs below.
70
60
50
40
70
60
50
40
30
20
10
0
30
20
10
0
Moose calfbody mass / kg
Moose calfbody mass / kg
Bank vole density/ arbitrary units
Bank vole density/ arbitrary units
1971
1971
1979
1979
1987
1987
1995
1995
1972
1972
1980
1980
1988
1988
1996
1996
Year
Year
Moose
Moose
Vole
Vole
Northern area
Southern area
[Source: V Selâs et al., OIKOS, (2001), 92, pages 271–278. Reprinted from OIKOS]
(a) (i) State the lowest body mass of moose calves in the Northern area.
.....................................................................................................................................(1)
(ii) Determine the year in which bank vole density was highest in the Northern area.
.....................................................................................................................................(1)

(b) Compare the variations in the moose calf body mass in both areas.
...............................................................................................................................................
...............................................................................................................................................
...............................................................................................................................................
...............................................................................................................................................
...............................................................................................................................................(2)
(c) Evaluate the hypothesis that both populations vary according to the availability of thecommon food source, the bilberry.
...............................................................................................................................................
...............................................................................................................................................
...............................................................................................................................................
...............................................................................................................................................
...............................................................................................................................................(2)
(Total 6 marks)
30. (a) State two factors that affect the distribution of animal species.
...............................................................................................................................................
...............................................................................................................................................(1)
(b) Explain the principal of competitive exclusion.
...............................................................................................................................................
...............................................................................................................................................
...............................................................................................................................................
...............................................................................................................................................
...............................................................................................................................................
...............................................................................................................................................
...............................................................................................................................................(3)

(c) Outline the process of ecological succession.
...............................................................................................................................................
...............................................................................................................................................
...............................................................................................................................................
...............................................................................................................................................(2)
(Total 6 marks)
31. Sea water temperature has an effect on the spawning (release of eggs) of echinoderms living inAntarctic waters. Echinoderm larvae feed on phytoplankton. In this investigation, the spawningof echinoderms and its effect on phytoplankton was studied.

In the figure below, the top line indicates the number of larvae caught (per 5000 litres of seawater). The shaded bars below show when spawning occurred in echinoderms.
= 0 % to 25 %= 25 % to 75 %= 75 % to 100%
The concentration of chlorophyll gives an indication of the concentration of phytoplankton.Note: that the seasons in the Antarctic are reversed from those in the northern hemisphere.
Dec Dec DecMar MarJun JunSep Sep
800
100
10
1
0.1
0.01
210–1–2
Sea
tem
pera
ture
/°C
Number ofechinoderm larvae
% Spawning ofechinoderm
Sea temperature / °C
Log Chlorophyllconcentration
/ mg m–3
10
1993 1994
phytoplankton
[Source: adapted from Stairwell-Smith and Peck, Biological Bulletin, (1998), 194, pages 44–52]
(a) State the trophic level of echinoderm larvae.
...............................................................................................................................................(1)
(b) Identify the period during which the spawning of echinoderm lies between 25 % and75%.
...............................................................................................................................................(1)

(c) Explain the relationship between the seasons and the concentration of phytoplankton.
...............................................................................................................................................
...............................................................................................................................................
...............................................................................................................................................
...............................................................................................................................................
...............................................................................................................................................(2)
(d) (i) Outline the effect of sea water temperature on echinoderm larvae numbers.
.....................................................................................................................................
.....................................................................................................................................
.....................................................................................................................................
.....................................................................................................................................
.....................................................................................................................................(2)
(ii) Using the data in the figure, predict the effect of global warming on echinodermlarvae numbers.
.....................................................................................................................................
.....................................................................................................................................
.....................................................................................................................................
.....................................................................................................................................(2)
(Total 8 marks)
32. Sea turtles have existed on Earth for millions of years, but are now threatened by humanactivities, both at sea and on the sandy beaches where they lay their eggs. All species of seaturtle reproduce in a similar way. During the breeding season, when females have mated at seathey emerge from the ocean at night and drag themselves up a beach. They dig a pit into whichthey lay fertilized eggs. After covering the eggs with sand the females return to the ocean. Thewarmth of the sun on the sand incubates the eggs allowing the development of young turtles,called hatchlings. These emerge after about 50 days and move down the beach at night to theocean.
Ecologists have been keeping records of the nesting activity of sea turtles along the easterncoastline of Florida since the 1950s. The bar chart below shows the mean number of nests perkilometre of beach between 1989 and 1998 for the three species of sea turtle that are commonlyfound.

30
28
26
Latitude / degreesnorth of the equator
Loggerheads( )Caretta caretta
Green Turtles( )Chelonia mydas
Leatherbacks( )Dermochelys coriacea
0 0 01000 50 5
Nests km–1
Canaveral
Melbourne Beach
Hutchinson IslandJupiter Island
Juno Beach
Boca Raton
[Source: M Salmon, Biologist, (2003), 50, pages 163–168]
(a) State which species of turtle nests in the greatest numbers on Jupiter Island.
...............................................................................................................................................(1)
(b) Compare the distribution of nesting in the three species of turtle along the easterncoastline of Florida.
...............................................................................................................................................
...............................................................................................................................................
...............................................................................................................................................
...............................................................................................................................................
...............................................................................................................................................(2)

(c) The parts of the coastline where there was most nesting were those where there was leasthuman activity and therefore least artificial light. Suggest an experiment that could bedone to test whether artificial light discourages nesting.
...............................................................................................................................................
...............................................................................................................................................
...............................................................................................................................................
...............................................................................................................................................
...............................................................................................................................................
...............................................................................................................................................(2)
A study was undertaken at the southernmost nesting site, at Boca Raton. Here a beach liesadjacent to a series of apartment buildings that are unoccupied during the nesting season. Thesebuildings therefore shade the beach from artificial light further inland. The location of nest sitesalong the beach has been accurately recorded, in relation to the position of the apartmentbuildings. The chart below shows the locations of the nests and apartment buildings and theheight of the buildings as seen from the beach.
100 metres
604020
0
Height / m
3000 South Whitehall South Stratford ArmsArvita
WhitehallPlacide
Atlantic Ocean
Villa DelMar
Location of nests ( )and
apartment buildings ( )
[Source: M Salmon, Biologist, (2003), 50, pages 163–168]

(d) Explain how the distribution of turtle nests provides evidence for female turtles choosingsites that are dark at night.
...............................................................................................................................................
...............................................................................................................................................
...............................................................................................................................................
...............................................................................................................................................
...............................................................................................................................................
...............................................................................................................................................
...............................................................................................................................................
...............................................................................................................................................
...............................................................................................................................................
...............................................................................................................................................(4)
On beaches where there is no human activity, hatchlings move directly towards the ocean afteremergence at night. The hatchlings can orientate themselves using one or more external stimuli.An experiment was done at Boca Raton to test the ability of hatchlings to locate the ocean atdifferent levels of artificial light. Four sites were chosen and numbered 1–4, ranging from thedarkest site (1), to the site most exposed to artificial lighting (4). At each site a four-metrediameter circle was marked. Hatchlings were released at the centre of each circle and the trailsmade in the sand by their movements were recorded. The diagrams below show these trails. Thearrow head on the outside of the circle shows the mean direction of the tracks.
(1)
(3)
(2)
(4)
Ocean

(e) Compare the movement of the hatchlings at the different intensities of artificial light.
...............................................................................................................................................
...............................................................................................................................................
...............................................................................................................................................
...............................................................................................................................................
...............................................................................................................................................(2)
(f) Deduce one external stimulus, and the source of this stimulus, that allows hatchlings toorientate themselves at sites unaffected by human activity.
...............................................................................................................................................
...............................................................................................................................................(1)
(g) Using the data in this question,
(i) explain two reasons for artificial light reducing the chances of survival of seaturtles.
.....................................................................................................................................
.....................................................................................................................................
.....................................................................................................................................
.....................................................................................................................................
.....................................................................................................................................(2)
(ii) suggest one conservation measure, aimed at increasing the chances of survival ofsea turtles.
.....................................................................................................................................
.....................................................................................................................................(1)
(Total 15 marks)
33. A study was conducted to investigate the growth factors affecting plants in urban areascompared to rural areas. Fast-growing clones of Eastern cottonwood trees (Populus deltoids)were grown in both urban and rural sites. The results of three successive growing seasons (X, Y,and Z) are shown below.
100
80
60
40
20
0
20
40
100
80
60
40
20
0
20
40
100
80
60
40
20
0
20
40
Rootbiomass / g
Shootbiomass / g
Season X Season Y Season Z
LI HV NY LI HV NY LI HV NY
Key: LI and HV are rural sites and NY is an urban site
[Source: Gregg et al., Nature (2003), 424, pages 183–187]
(a) Identify the site which most favours the growth of cottonwood trees.
...............................................................................................................................................(1)
(b) Calculate the ratio of shoot biomass to root biomass in site LI during season X.
...............................................................................................................................................
...............................................................................................................................................(1)
(c) Analyse the data for growth patterns over the three years of the study.
...............................................................................................................................................
...............................................................................................................................................
...............................................................................................................................................
...............................................................................................................................................
...............................................................................................................................................
...............................................................................................................................................(3)
A further study showed that differences in light, temperature, water, CO2 concentration, and thesoil could not account for the differences in growth of the cottonwoods in the urban and ruralareas.

(d) Suggest a reason which could account for the growth differences.
...............................................................................................................................................(1)
(Total 6 marks)
34. Explain how an organism's abiotic environment can be affected by ecological succession.
...............................................................................................................................................
...............................................................................................................................................
...............................................................................................................................................
...............................................................................................................................................
...............................................................................................................................................
...............................................................................................................................................
...............................................................................................................................................
...............................................................................................................................................
...............................................................................................................................................
...............................................................................................................................................
...............................................................................................................................................
...............................................................................................................................................
...............................................................................................................................................
...............................................................................................................................................(Total 6 marks)

35. The energy flow diagram below for a temperate ecosystem has been divided into two parts. Onepart shows autotrophic use of energy and the other shows the heterotrophic use of energy. Allvalues are kJm –2 yr–1.
grossproduction
43 510feeding14 690
photosynthesis
heat23 930
heat 14 140
net productionX
storage4 900
storage540
autotrophicrespiration
heterotrophicrespiration
Autotrophs Heterotrophs
(a) Calculate the net production of the autotrophs.
...............................................................................................................................................
...............................................................................................................................................(1)
(b) (i) Compare the percentage of heat lost through respiration by the autotrophs with theheterotrophs.
.....................................................................................................................................
.....................................................................................................................................(1)
(ii) Most of the heterotrophs are animals. Suggest one reason for the difference in heatlosses between the autotrophs and animal heterotrophs.
.....................................................................................................................................
.....................................................................................................................................(1)
The heterotrophic community can be divided into food webs based upon decomposers and foodwebs based upon herbivores. It has been shown that of the energy consumed by theheterotrophs, 99 % is consumed by the decomposer food webs.
(c) State the importance of decomposers in an ecosystem.
...............................................................................................................................................
...............................................................................................................................................(1)

(d) Deduce the long-term effects of sustained pollution which kills decomposers onautotrophic productivity.
...............................................................................................................................................
...............................................................................................................................................
...............................................................................................................................................
...............................................................................................................................................(2)
(Total 6 marks)

5.2 The greenhouse effect
Assessment Statement IBO Notes Student Notes
5.2.1 Draw and label a diagram of the carbon cycle to show the processes involved.
The details of the carbon cycle should include the interaction of living organisms and the biosphere through the processes of photosynthesis, cell respiration, fossilization and combustion. Recall of specific quantitative data is not required. TOK: What difference might it make to scientific work if nature were to be regarded as a machine, for example, as a clockwork mechanism, or as an organism, that is, the Gaia hypothesis? How useful are these metaphors?
5.2.2 Analyse the changes in concentration of atmospheric carbon dioxide using historical records.
Data from the Mauna Loa, Hawaii, or Cape Grim, Tasmania, monitoring stations may be used.
5.2.3 Explain the relationship between rises in concentrations of atmospheric carbon dioxide, methane and oxides of nitrogen and the enhanced greenhouse effect.
Students should be aware that the greenhouse effect is a natural phenomenon. Reference should be made to transmission of incoming shorter‐wave radiation and re‐radiated longer‐wave radiation. Knowledge that other gases, including methane and oxides of nitrogen, are greenhouse gases is expected.
5.2.4 Outline the precautionary principle. The precautionary principle holds that, if the effects of a human‐induced change would be very large, perhaps catastrophic, those responsible for the change must prove that it will not do harm before proceeding. This is the reverse of the normal situation, where those who are concerned about the change would have to prove that it will do harm in order to prevent such changes going ahead. TOK: Parallels could be drawn here between success in deterring crime by increasing the severity of the punishment or by increasing the chance of detection. If the possible consequences of rapid global warming are devastating enough, preventive measures are justified even if it is far from certain that rapid global warming will result from current human activities.

5.2.5 Evaluate the precautionary principle as a justification
for strong action in response to the threats posed by the enhanced greenhouse effect.
Aim 8: Consider whether the economic harm of measures taken now to limit global warming could be balanced against the potentially much greater harm for future generations of taking no action now. There are also ethical questions about whether the health and wealth of future human generations should be jeopardized, and whether it is right to knowingly damage the habitat of, and possibly drive to extinction, species other than humans. The environmental angle here is that the issue of global warming is, by definition, a genuinely global one in terms of causes, consequences and remedies. Only through international cooperation will a solution be found. There is an inequality between those in the world who are contributing most to the problem and those who will be most harmed.
5.2.6 Outline the consequences of a global temperature rise on arctic ecosystems.
Effects include increased rates of decomposition of detritus previously trapped in permafrost, expansion of the range of habitats available to temperate species, loss of ice habitat, changes in distribution of prey species affecting higher trophic levels, and increased success of pest species, including pathogens.

5.3 Populations
Assessment Statement IBO Notes Student Notes
5.3.1 Outline how population size is affected by natality, immigration, mortality and emigration.
Aim 7: Simulation exercises can be performed.
5.3.2 Draw and label a graph showing a sigmoid (S‐shaped) population growth curve.
5.3.3 Explain the reasons for the exponential growth phase, the plateau phase and the transitional phase between these two phases.
5.3.4 List three factors that set limits to population increase.

5.4 Evolution
Assessment Statement IBO Notes Student Notes
5.4.1 Define evolution. Evolution is the cumulative change in the heritable characteristics of a population. If we accept not only that species can evolve, but also that new species arise by evolution from pre‐existing ones, then the whole of life can be seen as unified by its common origins. Variation within our species is the result of different selection pressures operating in different parts of the world, yet this variation is not so vast to justify a construct such as race having a biological or scientific basis.
5.4.2 Outline the evidence for evolution provided by the fossil record, selective breeding of domesticated animals and homologous structures.
5.4.3 State that populations tend to produce more offspring than the environment can support.
5.4.4 Explain that the consequence of the potential overproduction of offspring is a struggle for survival.
5.4.5 State that the members of a species show variation.
5.4.6 Explain how sexual reproduction promotes variation in a species.
5.4.7 Explain how natural selection leads to evolution. Greater survival and reproductive success of individuals with favourable heritable variations can lead to change in the characteristics of a population. Aim 7: Computer simulations can be performed.
5.4.8 Explain two examples of evolution in response to environmental change; one must be antibiotic resistance in bacteria.
Other examples could include: the changes in size and shape of the beaks of Galapagos finches; pesticide resistance, industrial melanism or heavy‐metal tolerance in plants.

5.5 Classification
Assessment Statement IBO Notes Student Notes
5.5.1 Outline the binomial system of nomenclature. TOK: The adoption of a system of binomial nomenclature is largely due to Swedish botanist and physician Carolus Linnaeus (1707–1778). Linnaeus also defined four groups of humans, and the divisions were based on both physical and social traits. By 21st‐century standards, his descriptions can be regarded as racist. How does the social context of scientific work affect the methods and findings of research? Is it necessary to consider the social context when evaluating ethical aspects of knowledge claims?
5.5.2 List seven levels in the hierarchy of taxa—kingdom, phylum, class, order, family, genus and species—using an example from two different kingdoms for each level.
5.5.3 Distinguish between the following phyla of plants, using simple external recognition features: bryophyta, filicinophyta, coniferophyta and angiospermophyta.
5.5.4 Distinguish between the following phyla of animals, using simple external recognition features: porifera, cnidaria, platyhelminthes, annelida, mollusca and arthropoda.
5.5.5 Apply and design a key for a group of up to eight organisms.
A dichotomous key should be used.