topic 7 tables, charts and graphs
TRANSCRIPT

Tables, Tables, Charts and Charts and GraphsGraphs

TYPES OF GRAPHIC AIDSTYPES OF GRAPHIC AIDS
•Tables•Bar Graphs•Pictographs•Line Graphs•Pie Charts
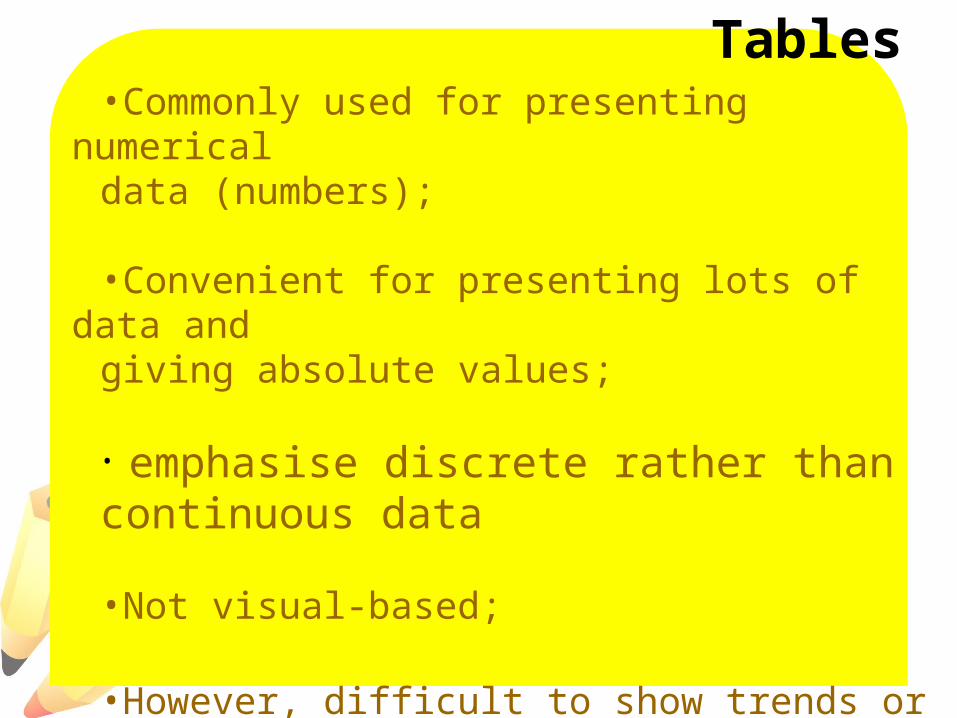
Tables•Commonly used for presenting numerical data (numbers);
•Convenient for presenting lots of data and giving absolute values;
• emphasise discrete rather than continuous data
•Not visual-based;
•However, difficult to show trends or direction;

Department
1998 1999 2000 2002
R & D 33,000 39,000 42,000 41,000
Accounting 28,000 29,000 29,000 29,000
Sales 22,100 28,000 27,500 27,000

Bar Graphs•Uses bars to compare:
•items at one time•items over period of time•changes in one item over time•portion/part of a single item
•Cannot represent exact quantities or provide comparisons of quantities;•Useful when reader wants to understand overall trends and comparisons;

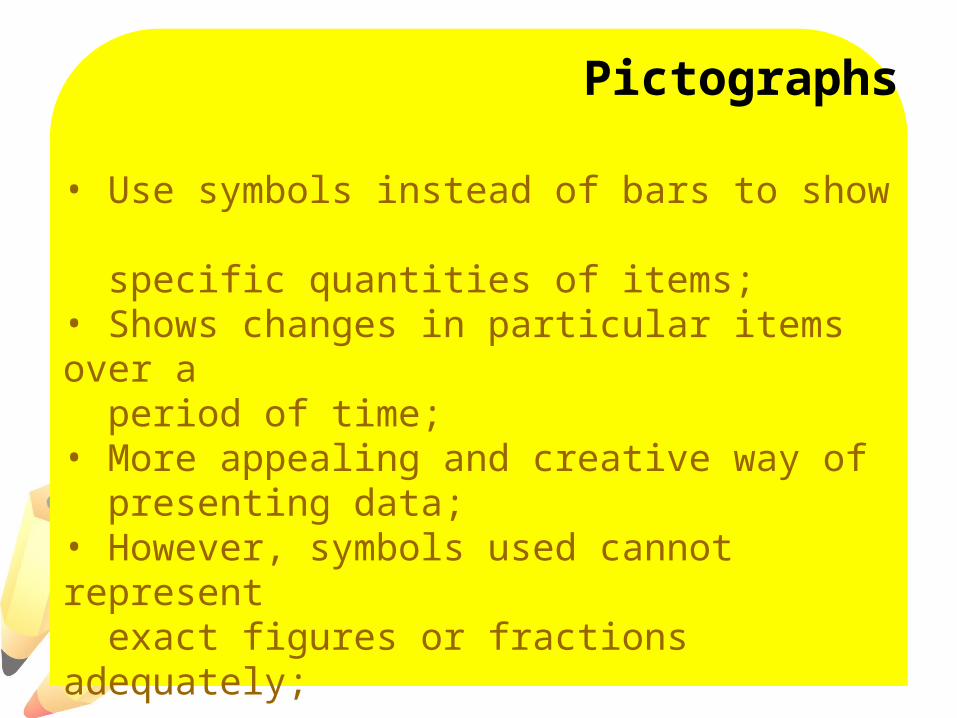
Pictographs
• Use symbols instead of bars to show specific quantities of items;• Shows changes in particular items over a period of time;• More appealing and creative way of presenting data;• However, symbols used cannot represent exact figures or fractions adequately;


Line Graphs
•Uses lines between the horizontal and vertical axes to show changes in relationship between elements represented by the two axes;•Plot changes in quantity or position to illustrate trends;•However, using more than 2 lines can be confusing, different colours have to be used and a key used to identify them;


Pie Charts
•Used to show distribution trends;•Good at providing quick visual impression of a particular item;•Use of colours and shading to highlight different segments;•Sometimes difficult to represent exact quantities;


TABLES - Interpreting Data
CAR SALES IN MALAYSIA (2000 and 2002)
Company 2000 2002 % change
Proton 1,351,875 1,443,652 6.8
Ford 714,097 758,207 6.2
Chrysler 274.333 300,893 9.7
Honda 264,705 279,765 5.7
Toyota 128,546 140,983 9.7
BMW 91,730 85,205 -7.1
Nissan 77,888 74,232 -4.7
Mazda 93,138 64,155 -31.1

Gantt Chart
•a graphical representation of the duration of tasks against the progression of time;•a useful tool for planning and scheduling projects;•helpful when monitoring a project's progress;

Planning and Scheduling
•A Gantt chart allows you to assess how long a project should take; •lays out the order in which tasks need to be carried out;•helps manage the dependencies between tasks;

Monitoring A Project
•allows you to see immediately what should have been achieved at a point in time; •allows you to see how remedial action may bring the project back on course;


Words used to interpret charts and graphs
plummet soar droprocket plunge fluctuate
level out peak slump

Verbs and adverbs
Verbs Adverbsincrease slightly
decrease moderately
decline steadilyfall gradually
drop rapidly
rise dramatically
sharply