topic: analysis of effect of establishing a dr program on...
TRANSCRIPT

Effect of ADR Issuance on the Liquidity of the Underlying Stock
Ainsley Quiohilag
The Leonard N. Stern School of Business Glucksman Institute for Research in Securities Markets
Faculty Advisor: Joel Hasbrouck April 1, 2003
Table of Contents
I. INTRODUCTION .............................................................................................................. 3 II. PREVIOUS WORK AND OTHER RELATED LITERATURE....................................... 4 III. DESCRIPTION OF DATA ................................................................................................ 5 IV. METHODOLOGY ............................................................................................................. 7 V. RESULTS ......................................................................................................................... 10 VI. SUMMARY...................................................................................................................... 15 Appendices ………………………………………………………………………………………17 References .………………………………………………………………………………………36
2
I. INTRODUCTION
Depositary Receipts or DRs have played a significant role in the globalization of capital
markets. First created by JPMorgan in 1927 to accommodate U.S. investment in U.K. equities,
Depositary Receipts today are used by approximately 2,200 non-U.S. issuers from more than 80
countries to enable their shares to be traded in foreign equity markets. Of the 2,200 DRs,
approximately 600 of them are American Depositary Receipts or ADRs which are listed on U.S.
exchanges.
While ADRs are negotiable instrument that represents an ownership interest in securities
of a non-U.S. company, they are quoted and traded in U.S. dollars, and are settled according to
procedures governing the U.S. market. This enables investors to invest in non-U.S. securities
without concern for often complex and expensive cross-border transactions, and offer
substantially the same economic benefits enjoyed by the domestic shareholders of the non-U.S.
issuer. On the other hand, ADRs are also believed to offer substantial benefits to non-U.S.
companies as issuers, from broadening the investor base to increasing visibility in the U.S.
markets.
This paper attempts to determine if establishing a Depositary Receipt program has any
real measurable effect on the liquidity of the underlying stock. In this case, liquidity is being
measured as a significant increase in trading volume turnover of the stock (both the underlying
stock and the ADR) for the first six months following the establishment of a DR program, as
compared to the six months immediately preceding it.
We considered stock trading data of companies from six countries, covering both
developed and emerging economies. This also allowed us to see if there were any significant
country patterns which can be identified from the data.
3

II. PREVIOUS WORK AND OTHER RELATED LITERATURE
The increased market liquidity brought about by broadened and more diversified investor
exposure has always been touted as one of the greatest advantages of establishing an ADR
program. Therefore, it comes as no surprise that ADR-related improvement in market liquidity is
often one of the most discussed topics among practitioners. There is also a considerable amount
of academic research regarding this topic. A review of the information and data in these articles
and academic papers is provided below.
Practitioners
Most practitioners agree that one of the primary benefits of establishing an ADR program
is the increased liquidity that comes from an increased and diversified investor base. David
Russell, Asian regional sales director of depositary receipts at Citibank, says that “the success of
an ADR is in the trading – whether or not people are interested in buying or selling it. Investors
wish to buy liquid tocks, analysts cover liquid stocks, and issuers can raise capital through a
well-traded stock listing.”1
The attraction that an ADR holds for U.S. investors is believed to be different, depending
on the stage of development and level of restrictions present in the domestic market where the
ADR’s underlying shares are trading. For instance, to invest in Taiwan or Korea, there are
certain processes that an investor has to go through before they can invest directly. For these
markets, ADRs provide a very efficient way for foreign investors to buy exposures into those
huge markets without going through the approval process, and for issuers from such countries to
tap these same investors. On the other hand, for free markets such as Singapore, foreign investors
buy ADRs mainly for the ease and simplicity of trading in the U.S. Furthermore, these investors
are more comfortable with the disclosure and transparency required under U.S. Securities and 1 Rob Davies, “Sky’s the Limit for Asian ADRs”, Finance Asia (March 2002)
4
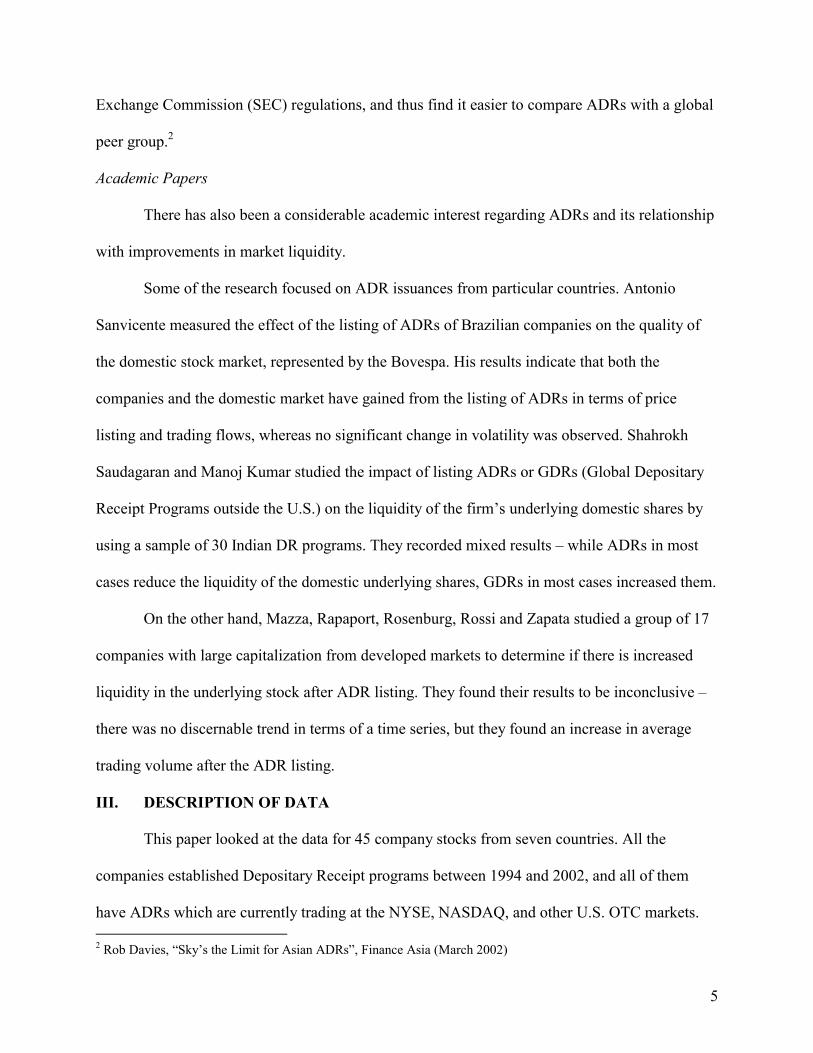
Exchange Commission (SEC) regulations, and thus find it easier to compare ADRs with a global
peer group.2
Academic Papers
There has also been a considerable academic interest regarding ADRs and its relationship
with improvements in market liquidity.
Some of the research focused on ADR issuances from particular countries. Antonio
Sanvicente measured the effect of the listing of ADRs of Brazilian companies on the quality of
the domestic stock market, represented by the Bovespa. His results indicate that both the
companies and the domestic market have gained from the listing of ADRs in terms of price
listing and trading flows, whereas no significant change in volatility was observed. Shahrokh
Saudagaran and Manoj Kumar studied the impact of listing ADRs or GDRs (Global Depositary
Receipt Programs outside the U.S.) on the liquidity of the firm’s underlying domestic shares by
using a sample of 30 Indian DR programs. They recorded mixed results – while ADRs in most
cases reduce the liquidity of the domestic underlying shares, GDRs in most cases increased them.
On the other hand, Mazza, Rapaport, Rosenburg, Rossi and Zapata studied a group of 17
companies with large capitalization from developed markets to determine if there is increased
liquidity in the underlying stock after ADR listing. They found their results to be inconclusive –
there was no discernable trend in terms of a time series, but they found an increase in average
trading volume after the ADR listing.
III. DESCRIPTION OF DATA
This paper looked at the data for 45 company stocks from seven countries. All the
companies established Depositary Receipt programs between 1994 and 2002, and all of them
have ADRs which are currently trading at the NYSE, NASDAQ, and other U.S. OTC markets. 2 Rob Davies, “Sky’s the Limit for Asian ADRs”, Finance Asia (March 2002)
5

For each company, the following data were gathered:
��Trading volume of the underlying stock six months before establishing the ADR program
��Trading volume of the underlying stock six months after establishing the ADR program
��Trading volume of the ADR for the first six months after issuance
��Overall trading volume of the domestic stock market where the underlying stock is trading,
covering a period starting six months before the ADR issuance and ending six months after
��Total number of outstanding shares
The trading volume of the underlying shares and the ADRs (converted into underlying
shares using the conversion ratio) are added together to get the total trading volume for the stock
for the six-month period following the ADR issuance. The trading volume data is then divided
by the number of outstanding shares to get the trading volume turnover for the entire 12-month
period.
The companies included in the data set are summarized in the table below.
Table 1
Country Category Company ADR Issuance Date3 Brazil Emerging Markets Banco Bradesco November 2001 Banco Itau February 2002 CEMIG September 2001 Brasil Telecom November 2001 Net Servicos December 2001 Tele Nordeste June 2002 Votorantim Celulose May 2002 Saneamento May 2002 Tele Celular June 2002 Vale de Rio March 2002 Korea Emerging Markets KT Corporation May 1999 SK Telecom July 1996 Korea Electric October 1994 Mirae Corporation November 1999 Hanaro Telecom March 2000
3 Source: Citibank ADR Services Universal Issuance Guide, http://wwss.citissb.com/adr/www/
6
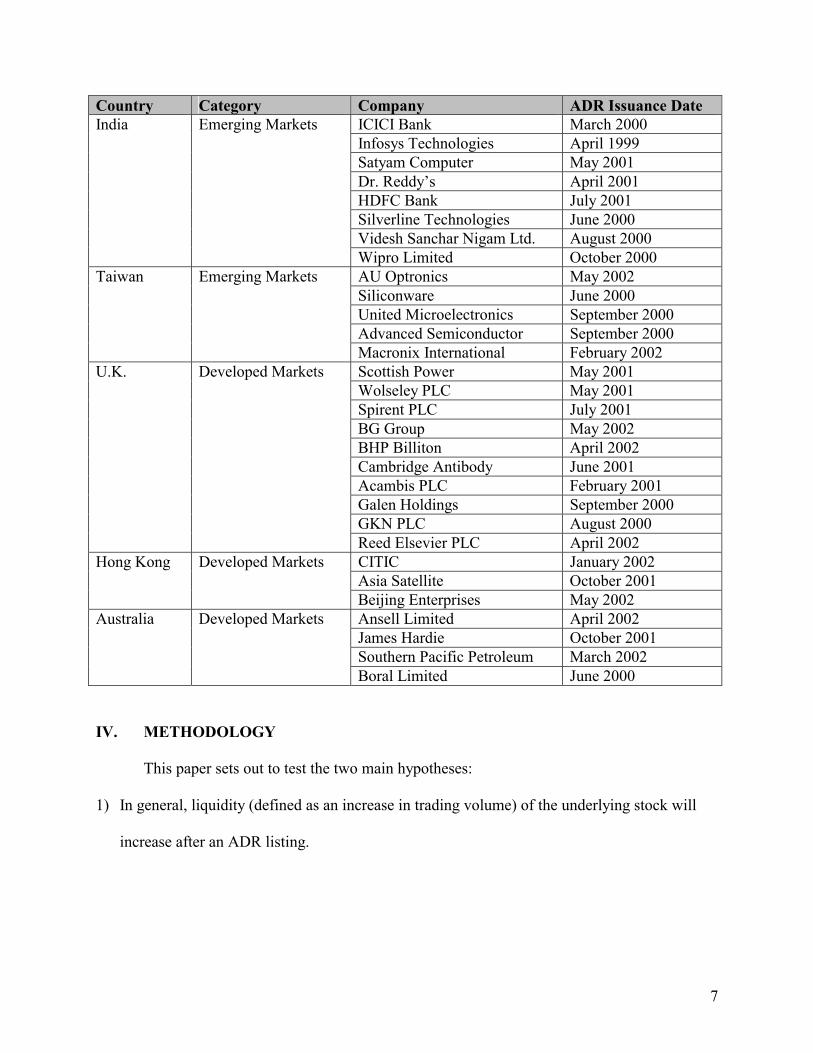
3Country Category Company ADR Issuance Date India Emerging Markets ICICI Bank March 2000 Infosys Technologies April 1999 Satyam Computer May 2001 Dr. Reddy’s April 2001 HDFC Bank July 2001 Silverline Technologies June 2000 Videsh Sanchar Nigam Ltd. August 2000 Wipro Limited October 2000 Taiwan Emerging Markets AU Optronics May 2002 Siliconware June 2000 United Microelectronics September 2000 Advanced Semiconductor September 2000 Macronix International February 2002 U.K. Developed Markets Scottish Power May 2001 Wolseley PLC May 2001 Spirent PLC July 2001 BG Group May 2002 BHP Billiton April 2002 Cambridge Antibody June 2001 Acambis PLC February 2001 Galen Holdings September 2000 GKN PLC August 2000 Reed Elsevier PLC April 2002 Hong Kong Developed Markets CITIC January 2002 Asia Satellite October 2001 Beijing Enterprises May 2002 Australia Developed Markets Ansell Limited April 2002 James Hardie October 2001 Southern Pacific Petroleum March 2002 Boral Limited June 2000
IV. METHODOLOGY This paper sets out to test the two main hypotheses:
1) In general, liquidity (defined as an increase in trading volume) of the underlying stock will
increase after an ADR listing.
7
2) ADR listing will result in more significant liquidity benefits for stocks which trade
domestically in emerging markets, relative to stocks which trade domestically in more
developed markets.
To test this hypothesis, two separate regressions were performed.
Step 1
The monthly trading turnover data for each of the stocks was regressed against two
variables. The first variable is the total monthly trading volume of the domestic stock exchange
where the underlying share is traded. This is done to remove general market effects on the
turnover data of the stock. The second variable consists of a dummy variable indicating whether
an ADR has been established or not. The coefficient of this dummy variable can be taken as an
indication of the effect an ADR listing has on the liquidity of the underlying stock.
The resulting regression equation is as follows:
i,tDi,t εADRdummycVolb aturnover ���� **
for stock i in month t, where
VolD = total monthly volume of the domestic stock exchange for month t
ADRdummy = the dummy variable indicating the presence of an ADR
Step 2
The monthly trading turnover data of stocks from the same country were also combined
to come up with a single regression equation for each of the seven countries. To be consistent
with the second hypothesis, the regression results should show an ADR listing as having a
significantly positive effect on countries which are classified as emerging markets, and relatively
insignificant effect on countries classified as developed.
8
The combined turnover data for each country was regressed against three variables:
1) A dummy variable indicating the company. Each company indicator was set up as a separate
dummy variable. This allows us to isolate the individual effects of each company on the
turnover data in the regression equation through the coefficient of the variable representing
the company indicator.
2) The total trading volume of the domestic stock market where the underlying stock is trading.
The stock market trading volume data corresponding to each company stock is also set up as
separate variables. This allows us to isolate the general market effects on the trading turnover
of each individual stock in the data set.
3) A dummy variable to indicate the presence of an ADR. The ADR indicator is set up as a
single dummy variable for all companies in the data set. Again, the coefficient of this dummy
variable can be taken as a reflection of the effect establishing an ADR program has on the
trading turnover of the underlying stocks. Because the ADR indicator is set up as a single
dummy variable, a single coefficient for the ADR indicator variable can be obtained for each
of the countries.
The resulting regression equation is as follows:
tiDnnDnnti ADRdummycVolbVolbCompanyaCompanyaturnover ,1111, **...**...* ��������� for a typical stock from country i at time t, where
Company1…n = company indicators for all the firms in the country data set
VolD1…n = monthly domestic stock exchange volume for the corresponding month for company n
ADRdummy = the dummy variable indicating the presence of an ADR
9

V. RESULTS Step 1
The individual company regressions seem to support the hypothesis that stocks whose
domestic stock markets are classified as emerging markets benefit significantly from an ADR
listing. Of the 28 company stocks whose domestic markets were classified as emerging markets,
23 of them showed that establishing an ADR program had a positive effect on their trading
turnover. Of these results, 18 were statistically significant at conventional levels, with T-statistic
of 2 or more. On the other hand, of the 5 company stocks which displayed a negative effect
resulting from the ADR program, only 1 was statistically significant.
The results from the data on stocks from developing countries also seem to support the
hypothesis. Of the 17 company stocks whose domestic markets were classified as developed
markets, 8 of them showed that establishing an ADR program had a slight positive effect on their
trading turnover. Of these, only 2 were statistically significant. On the other hand, of the other 9
stocks which showed a negative effect resulting from the ADR listing, only 3 were statistically
significant. These results seem to support the hypothesis that establishing an ADR listing will
have little or no effect on stocks whose domestic markets were already developed.
Results of the individual company regressions are summarized in the table below:
Table 2
Emerging Markets Developed Markets
# of stocks in data set 28 17
Positive effect 23 8
Statistically significant 18 2
Negative effect 5 9
Statistically significant 1 3
10
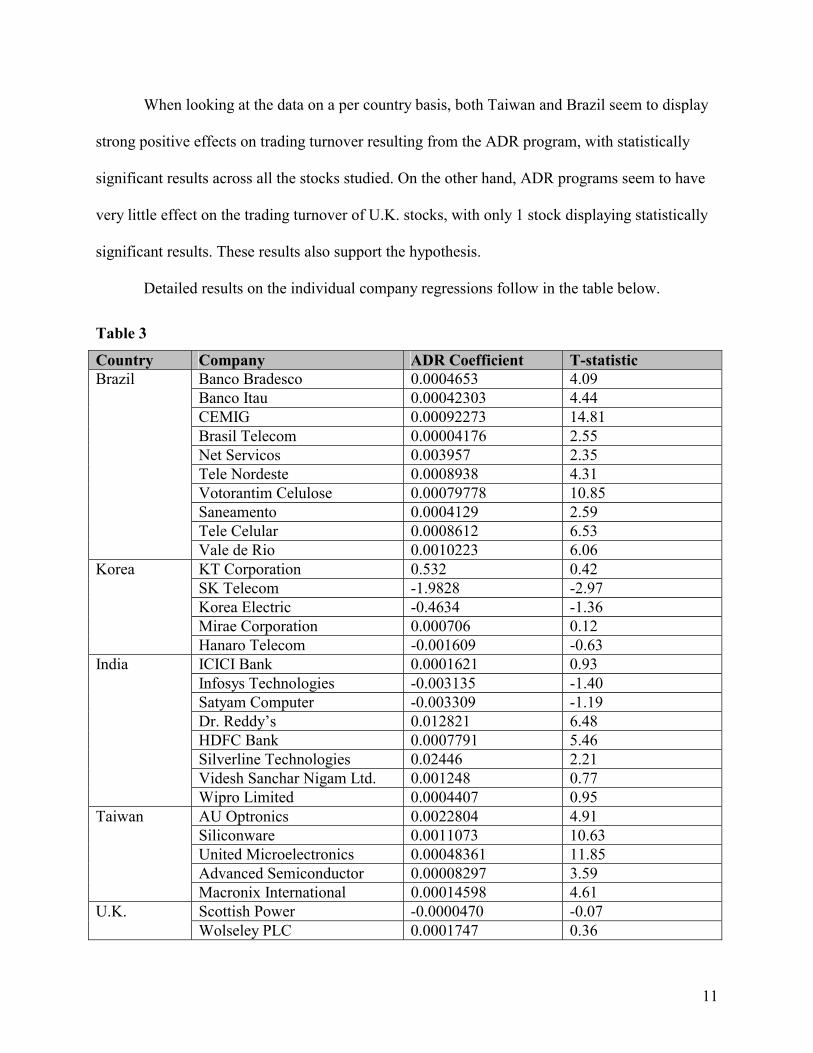
When looking at the data on a per country basis, both Taiwan and Brazil seem to display
strong positive effects on trading turnover resulting from the ADR program, with statistically
significant results across all the stocks studied. On the other hand, ADR programs seem to have
very little effect on the trading turnover of U.K. stocks, with only 1 stock displaying statistically
significant results. These results also support the hypothesis.
Detailed results on the individual company regressions follow in the table below.
Table 3
Country Company ADR Coefficient T-statistic Brazil Banco Bradesco 0.0004653 4.09 Banco Itau 0.00042303 4.44 CEMIG 0.00092273 14.81 Brasil Telecom 0.00004176 2.55 Net Servicos 0.003957 2.35 Tele Nordeste 0.0008938 4.31 Votorantim Celulose 0.00079778 10.85 Saneamento 0.0004129 2.59 Tele Celular 0.0008612 6.53 Vale de Rio 0.0010223 6.06 Korea KT Corporation 0.532 0.42 SK Telecom -1.9828 -2.97 Korea Electric -0.4634 -1.36 Mirae Corporation 0.000706 0.12 Hanaro Telecom -0.001609 -0.63 India ICICI Bank 0.0001621 0.93 Infosys Technologies -0.003135 -1.40 Satyam Computer -0.003309 -1.19 Dr. Reddy’s 0.012821 6.48 HDFC Bank 0.0007791 5.46 Silverline Technologies 0.02446 2.21 Videsh Sanchar Nigam Ltd. 0.001248 0.77 Wipro Limited 0.0004407 0.95 Taiwan AU Optronics 0.0022804 4.91 Siliconware 0.0011073 10.63 United Microelectronics 0.00048361 11.85 Advanced Semiconductor 0.00008297 3.59 Macronix International 0.00014598 4.61 U.K. Scottish Power -0.0000470 -0.07 Wolseley PLC 0.0001747 0.36
11
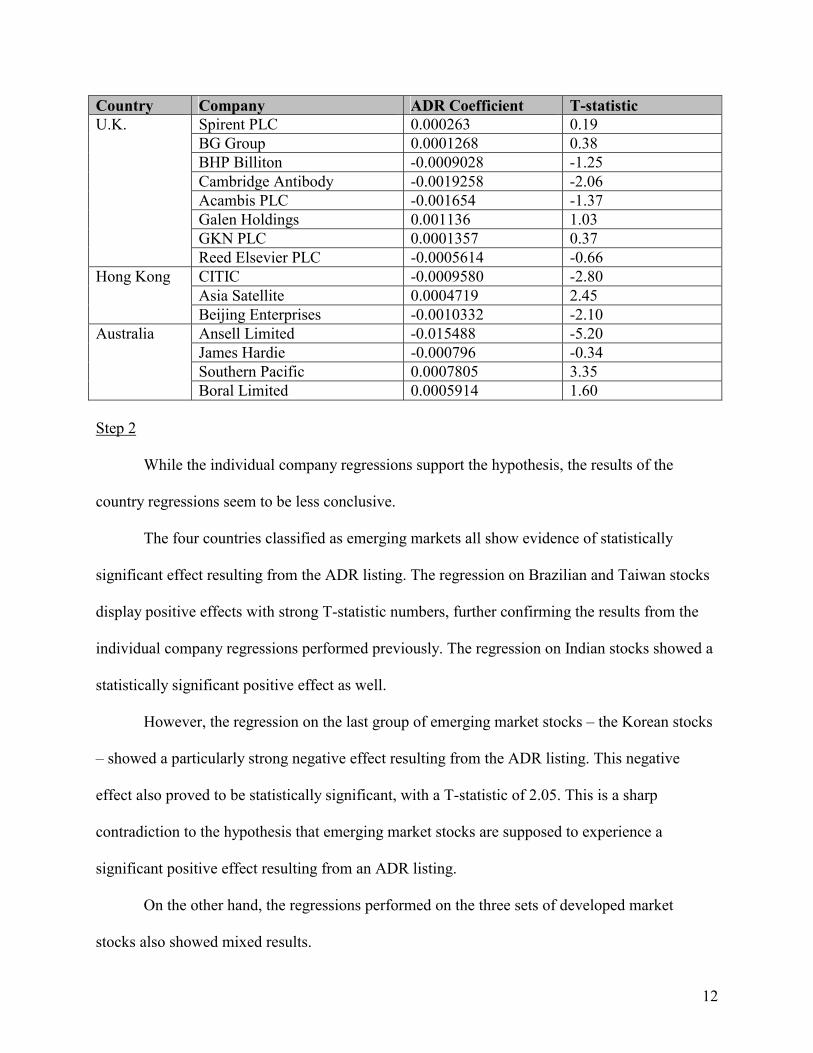
Country Company ADR Coefficient T-statistic U.K. Spirent PLC 0.000263 0.19 BG Group 0.0001268 0.38 BHP Billiton -0.0009028 -1.25 Cambridge Antibody -0.0019258 -2.06 Acambis PLC -0.001654 -1.37 Galen Holdings 0.001136 1.03 GKN PLC 0.0001357 0.37 Reed Elsevier PLC -0.0005614 -0.66 Hong Kong CITIC -0.0009580 -2.80 Asia Satellite 0.0004719 2.45 Beijing Enterprises -0.0010332 -2.10 Australia Ansell Limited -0.015488 -5.20 James Hardie -0.000796 -0.34 Southern Pacific 0.0007805 3.35 Boral Limited 0.0005914 1.60 Step 2
While the individual company regressions support the hypothesis, the results of the
country regressions seem to be less conclusive.
The four countries classified as emerging markets all show evidence of statistically
significant effect resulting from the ADR listing. The regression on Brazilian and Taiwan stocks
display positive effects with strong T-statistic numbers, further confirming the results from the
individual company regressions performed previously. The regression on Indian stocks showed a
statistically significant positive effect as well.
However, the regression on the last group of emerging market stocks – the Korean stocks
– showed a particularly strong negative effect resulting from the ADR listing. This negative
effect also proved to be statistically significant, with a T-statistic of 2.05. This is a sharp
contradiction to the hypothesis that emerging market stocks are supposed to experience a
significant positive effect resulting from an ADR listing.
On the other hand, the regressions performed on the three sets of developed market
stocks also showed mixed results.
12
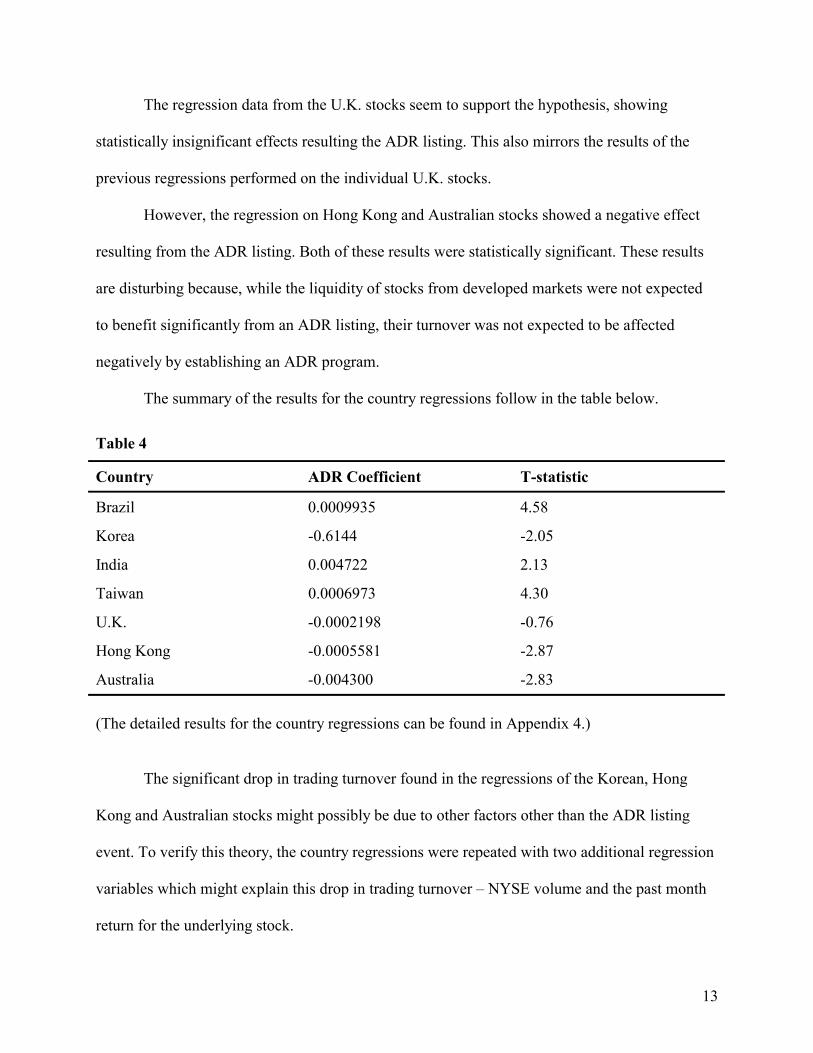
The regression data from the U.K. stocks seem to support the hypothesis, showing
statistically insignificant effects resulting the ADR listing. This also mirrors the results of the
previous regressions performed on the individual U.K. stocks.
However, the regression on Hong Kong and Australian stocks showed a negative effect
resulting from the ADR listing. Both of these results were statistically significant. These results
are disturbing because, while the liquidity of stocks from developed markets were not expected
to benefit significantly from an ADR listing, their turnover was not expected to be affected
negatively by establishing an ADR program.
The summary of the results for the country regressions follow in the table below.
Table 4
Country ADR Coefficient T-statistic
Brazil 0.0009935 4.58
Korea -0.6144 -2.05
India 0.004722 2.13
Taiwan 0.0006973 4.30
U.K. -0.0002198 -0.76
Hong Kong -0.0005581 -2.87
Australia -0.004300 -2.83 (The detailed results for the country regressions can be found in Appendix 4.)
The significant drop in trading turnover found in the regressions of the Korean, Hong
Kong and Australian stocks might possibly be due to other factors other than the ADR listing
event. To verify this theory, the country regressions were repeated with two additional regression
variables which might explain this drop in trading turnover – NYSE volume and the past month
return for the underlying stock.
13
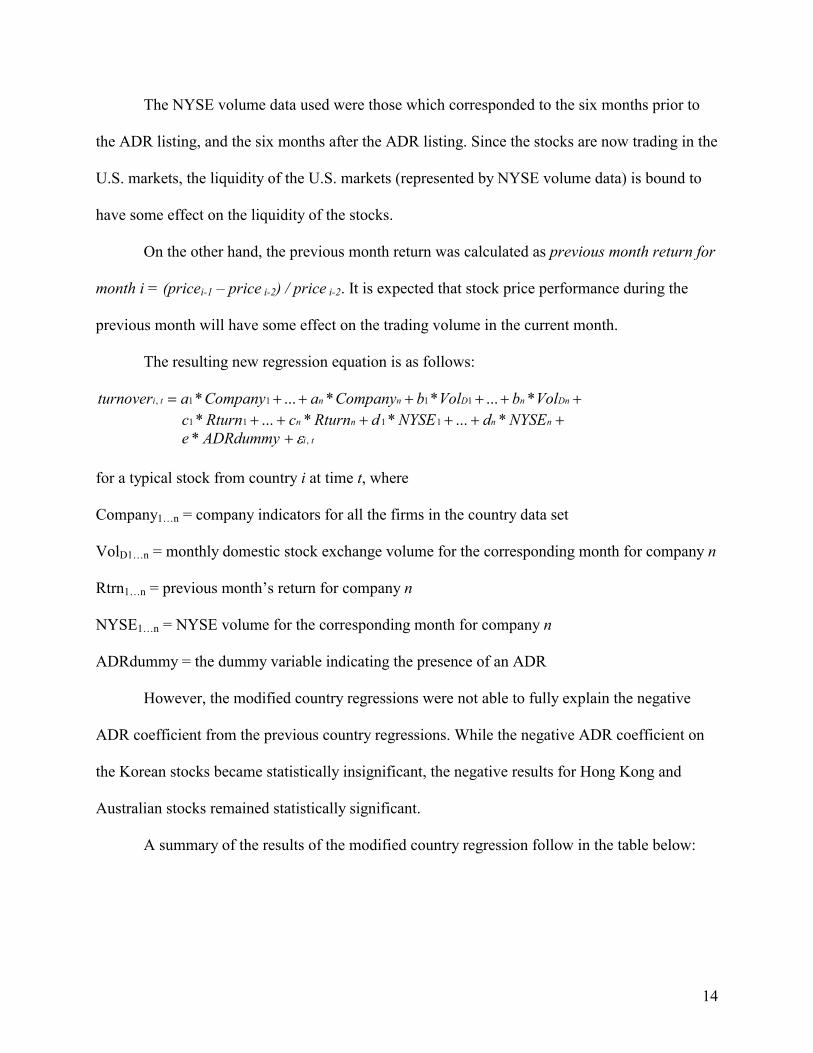
The NYSE volume data used were those which corresponded to the six months prior to
the ADR listing, and the six months after the ADR listing. Since the stocks are now trading in the
U.S. markets, the liquidity of the U.S. markets (represented by NYSE volume data) is bound to
have some effect on the liquidity of the stocks.
On the other hand, the previous month return was calculated as previous month return for
month i = (pricei-1 – price i-2) / price i-2. It is expected that stock price performance during the
previous month will have some effect on the trading volume in the current month.
The resulting new regression equation is as follows:
������� DnnDnnti VolbVolbCompanyaCompanyaturnover *...**...* 1111, c ������ nnnn NYSEdNYSEdRturncRturn *...**...* 1111
tiADRdummye ,* ��
for a typical stock from country i at time t, where
Company1…n = company indicators for all the firms in the country data set
VolD1…n = monthly domestic stock exchange volume for the corresponding month for company n
Rtrn1…n = previous month’s return for company n
NYSE1…n = NYSE volume for the corresponding month for company n
ADRdummy = the dummy variable indicating the presence of an ADR
However, the modified country regressions were not able to fully explain the negative
ADR coefficient from the previous country regressions. While the negative ADR coefficient on
the Korean stocks became statistically insignificant, the negative results for Hong Kong and
Australian stocks remained statistically significant.
A summary of the results of the modified country regression follow in the table below:
14
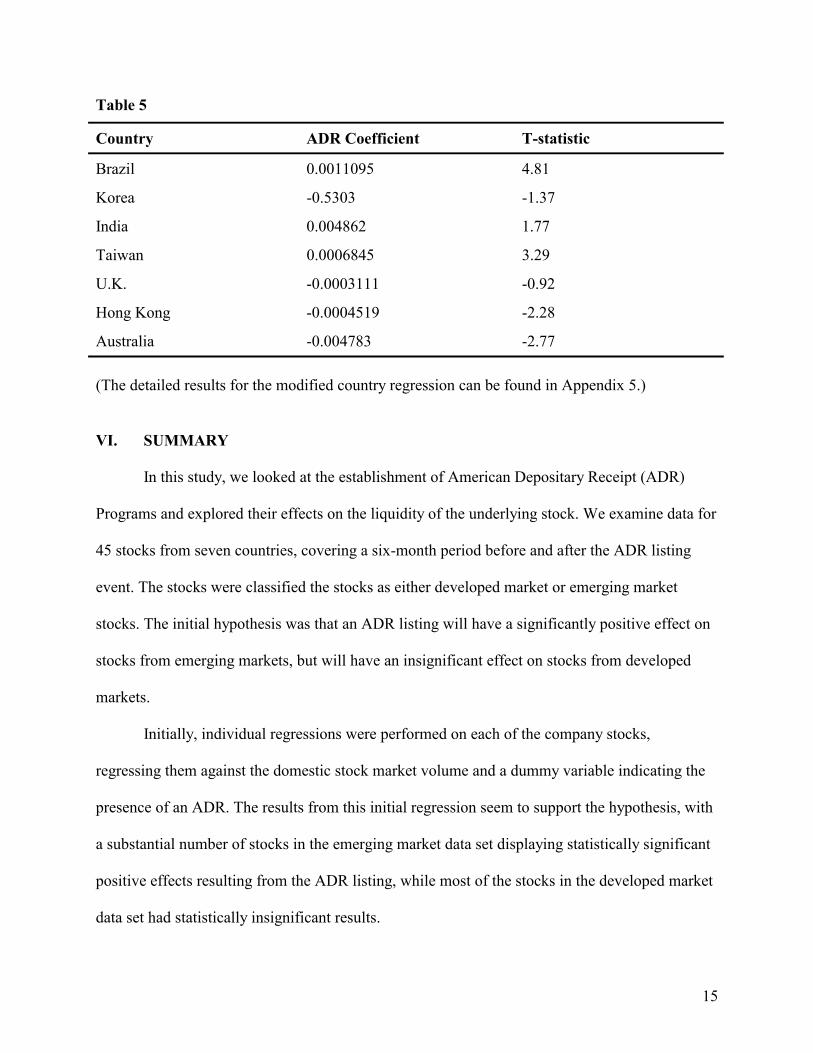
Table 5
Country ADR Coefficient T-statistic
Brazil 0.0011095 4.81
Korea -0.5303 -1.37
India 0.004862 1.77
Taiwan 0.0006845 3.29
U.K. -0.0003111 -0.92
Hong Kong -0.0004519 -2.28
Australia -0.004783 -2.77 (The detailed results for the modified country regression can be found in Appendix 5.) VI. SUMMARY
In this study, we looked at the establishment of American Depositary Receipt (ADR)
Programs and explored their effects on the liquidity of the underlying stock. We examine data for
45 stocks from seven countries, covering a six-month period before and after the ADR listing
event. The stocks were classified the stocks as either developed market or emerging market
stocks. The initial hypothesis was that an ADR listing will have a significantly positive effect on
stocks from emerging markets, but will have an insignificant effect on stocks from developed
markets.
Initially, individual regressions were performed on each of the company stocks,
regressing them against the domestic stock market volume and a dummy variable indicating the
presence of an ADR. The results from this initial regression seem to support the hypothesis, with
a substantial number of stocks in the emerging market data set displaying statistically significant
positive effects resulting from the ADR listing, while most of the stocks in the developed market
data set had statistically insignificant results.
15
Another set of regressions were performed to confirm the first set of results, and to
determine if there were any discernable country trends. Stocks from the same country were
combined to come up with a single regression equation for each of the seven countries. However,
the results from this second set of regressions were inconclusive.
While three of the four emerging market country regressions continued to show
statistically significant positive effects resulting from the ADR listing, the last country regression
displayed a statistically significant negative effect. This same significantly negative effect was
also exhibited by two of the three developed market country regressions. While the liquidity of
developed market stocks was not expected to benefit significantly from an ADR listing, there is
no reason to believe that an ADR program will have a significant negative effect on liquidity
either.
Further regressions were performed to include additional regression variables, such as
NYSE volume and past month returns, in an attempt to explain this negative effect. However,
these additional variables were not able to sufficiently explain this negative effect, particularly
for the developed market data set.
In conclusion, it would seem that there is some evidence to suggest that emerging market
stocks experience significant positive effects on liquidity resulting from an ADR listing.
However, the effect of ADRs on developed market stocks is not as clear.
16
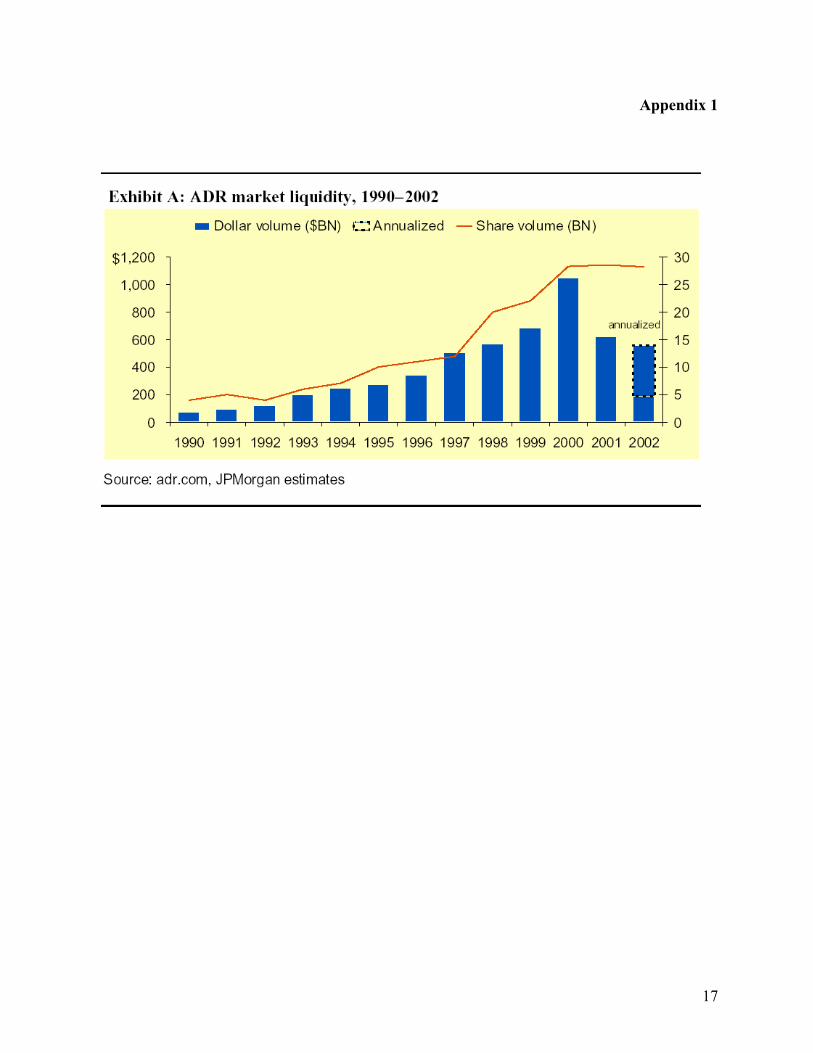
Appendix 1
17

Appendix 2
Top 10 ADRs by Trading Volume, First Half 2002
(in millions)
Issuer Country Exchange Ticker Volume
LM Ericsson Telephone Sweden NASDAQ ERICY 2,051
Nokia Corp. Finland NYSE NOK 1,574
Elan Corp plc Ireland NYSE ELN 630
Taiwan Semiconductor Mfg. Co. Taiwan NYSE TSM 630
Vodafone Group plc U.K. NYSE VOD 470
United Microelectronics Corp. Taiwan NYSE UMC 419
Durban Roodeport Deep Ltd. So. Africa NASDAQ DROOY 385
ASML Holding Netherlands NASDAQ ASML 340
Gold Fields Ltd. So. Africa NYSE GFI 308
Marconi plc U.K. NASDAQ MONI 305 Source: Citibank report, June 2002
18

Appendix 3
Top 10 Capital Raisings Using ADRs
(US$ millions, First Half 2002)
Issuer Country Exchange Date Value
Companhia Vale de Rio Doce Brazil NYSE 3/27/02 1,087
AU Optronics Corp. Taiwan NYSE 5/29/02 659
Realtek Semiconductor Corp. Taiwan PORTAL 1/24/02 271
KorAm Bank Korea PORTAL 4/30/02 199
Wimm-Bill-Dann Foods Russia NYSE 2/28/02 165
Powerchip Semiconductor Taiwan PORTAL 5/8/02 149
Promos Technologies Taiwan PORTAL 5/17/02 146
Ambit Microsystems Taiwan PORTAL 1/8/02 70
IONA Technologies Ireland NASDAQ 3/5/02 69
SABESP Brazil NYSE 5/10/02 67
Source: Citibank report, June 2002
19
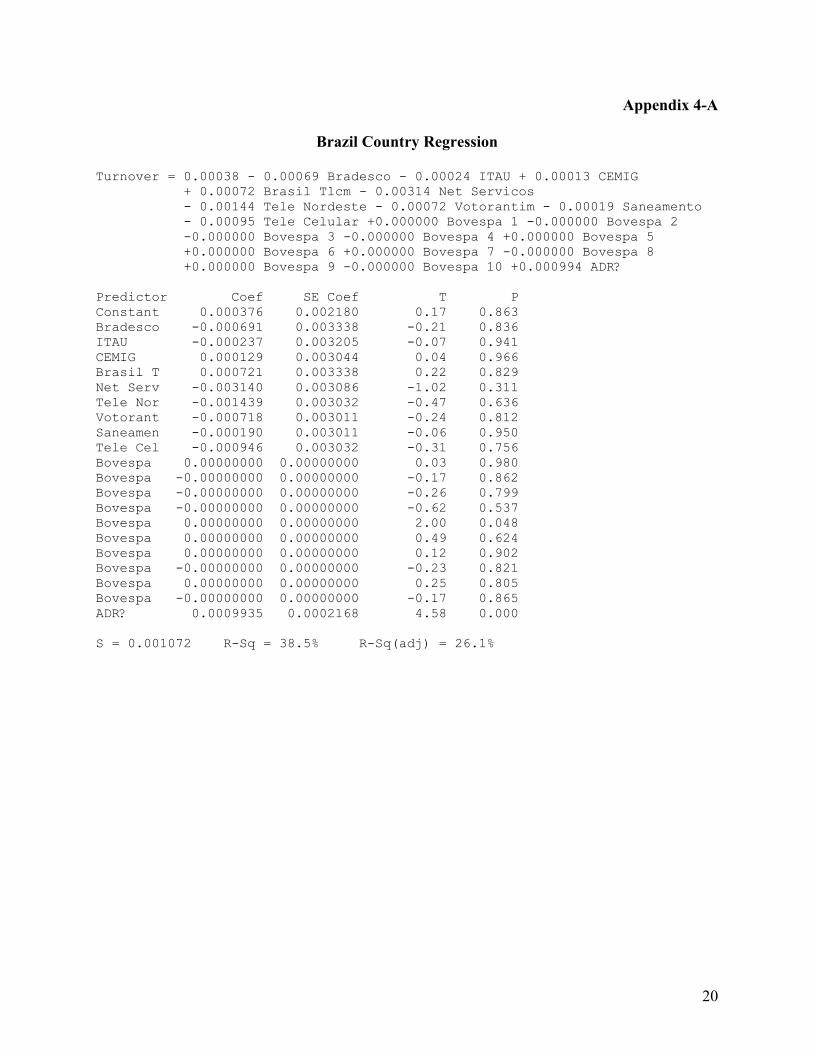
Appendix 4-A
Brazil Country Regression
Turnover = 0.00038 - 0.00069 Bradesco - 0.00024 ITAU + 0.00013 CEMIG + 0.00072 Brasil Tlcm - 0.00314 Net Servicos - 0.00144 Tele Nordeste - 0.00072 Votorantim - 0.00019 Saneamento - 0.00095 Tele Celular +0.000000 Bovespa 1 -0.000000 Bovespa 2 -0.000000 Bovespa 3 -0.000000 Bovespa 4 +0.000000 Bovespa 5 +0.000000 Bovespa 6 +0.000000 Bovespa 7 -0.000000 Bovespa 8 +0.000000 Bovespa 9 -0.000000 Bovespa 10 +0.000994 ADR? Predictor Coef SE Coef T P Constant 0.000376 0.002180 0.17 0.863 Bradesco -0.000691 0.003338 -0.21 0.836 ITAU -0.000237 0.003205 -0.07 0.941 CEMIG 0.000129 0.003044 0.04 0.966 Brasil T 0.000721 0.003338 0.22 0.829 Net Serv -0.003140 0.003086 -1.02 0.311 Tele Nor -0.001439 0.003032 -0.47 0.636 Votorant -0.000718 0.003011 -0.24 0.812 Saneamen -0.000190 0.003011 -0.06 0.950 Tele Cel -0.000946 0.003032 -0.31 0.756 Bovespa 0.00000000 0.00000000 0.03 0.980 Bovespa -0.00000000 0.00000000 -0.17 0.862 Bovespa -0.00000000 0.00000000 -0.26 0.799 Bovespa -0.00000000 0.00000000 -0.62 0.537 Bovespa 0.00000000 0.00000000 2.00 0.048 Bovespa 0.00000000 0.00000000 0.49 0.624 Bovespa 0.00000000 0.00000000 0.12 0.902 Bovespa -0.00000000 0.00000000 -0.23 0.821 Bovespa 0.00000000 0.00000000 0.25 0.805 Bovespa -0.00000000 0.00000000 -0.17 0.865 ADR? 0.0009935 0.0002168 4.58 0.000 S = 0.001072 R-Sq = 38.5% R-Sq(adj) = 26.1%
20

Appendix 4-B
Korea Country Regression
Turnover = 0.17 - 0.91 KT + 1.08 SK Tlcm + 0.43 Korea Elec + 0.78 Mirae +0.000768 Korea Vol1 +0.000003 Korea Vol3 +0.000001 Korea Vol4 -0.000106 Korea Vol5 +0.000025 Korea Vol6 - 0.614 ADR? Predictor Coef SE Coef T P Constant 0.167 1.288 0.13 0.897 KT -0.908 1.760 -0.52 0.608 SK Tlcm 1.076 1.660 0.65 0.520 Korea El 0.428 1.776 0.24 0.810 Mirae 0.777 2.174 0.36 0.722 Korea Vo 0.0007676 0.0002024 3.79 0.000 Korea Vo 0.00000326 0.00000149 2.19 0.033 Korea Vo 0.00000063 0.00000151 0.42 0.680 Korea Vo -0.0001061 0.0003010 -0.35 0.726 Korea Vo 0.0000246 0.0002029 0.12 0.904 ADR? -0.6144 0.3002 -2.05 0.046 S = 1.091 R-Sq = 72.9% R-Sq(adj) = 67.3%
21
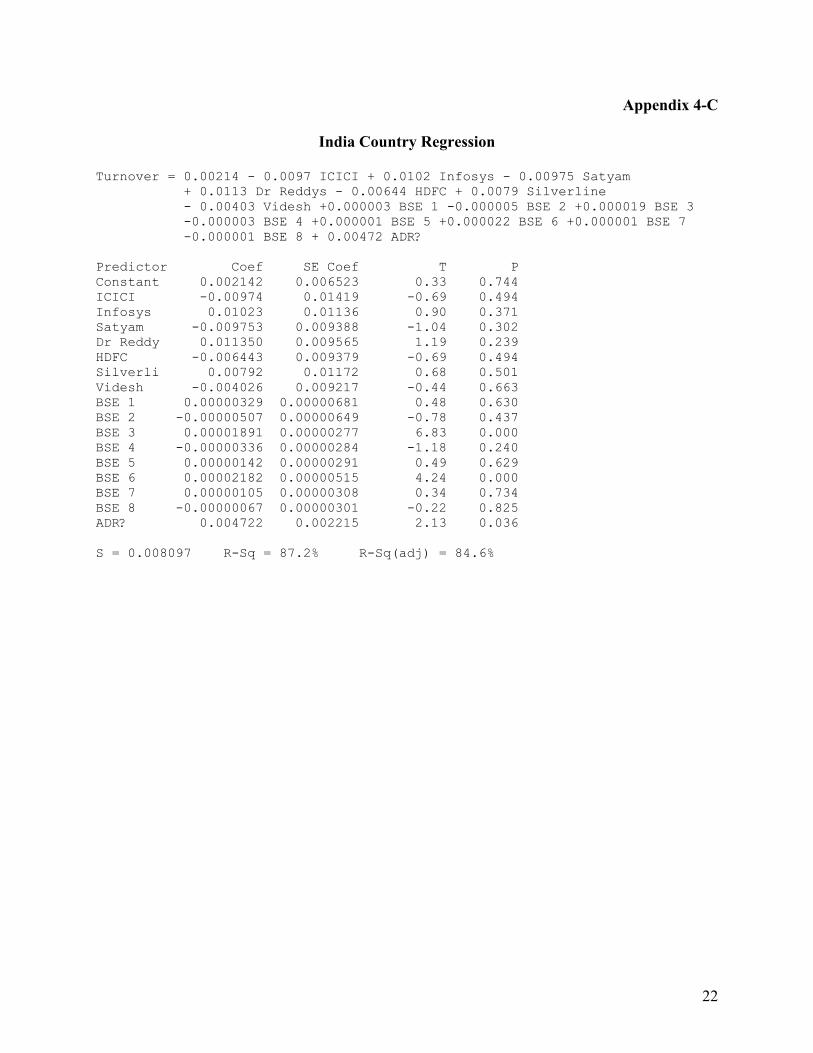
Appendix 4-C
India Country Regression
Turnover = 0.00214 - 0.0097 ICICI + 0.0102 Infosys - 0.00975 Satyam + 0.0113 Dr Reddys - 0.00644 HDFC + 0.0079 Silverline - 0.00403 Videsh +0.000003 BSE 1 -0.000005 BSE 2 +0.000019 BSE 3 -0.000003 BSE 4 +0.000001 BSE 5 +0.000022 BSE 6 +0.000001 BSE 7 -0.000001 BSE 8 + 0.00472 ADR? Predictor Coef SE Coef T P Constant 0.002142 0.006523 0.33 0.744 ICICI -0.00974 0.01419 -0.69 0.494 Infosys 0.01023 0.01136 0.90 0.371 Satyam -0.009753 0.009388 -1.04 0.302 Dr Reddy 0.011350 0.009565 1.19 0.239 HDFC -0.006443 0.009379 -0.69 0.494 Silverli 0.00792 0.01172 0.68 0.501 Videsh -0.004026 0.009217 -0.44 0.663 BSE 1 0.00000329 0.00000681 0.48 0.630 BSE 2 -0.00000507 0.00000649 -0.78 0.437 BSE 3 0.00001891 0.00000277 6.83 0.000 BSE 4 -0.00000336 0.00000284 -1.18 0.240 BSE 5 0.00000142 0.00000291 0.49 0.629 BSE 6 0.00002182 0.00000515 4.24 0.000 BSE 7 0.00000105 0.00000308 0.34 0.734 BSE 8 -0.00000067 0.00000301 -0.22 0.825 ADR? 0.004722 0.002215 2.13 0.036 S = 0.008097 R-Sq = 87.2% R-Sq(adj) = 84.6%
22

Appendix 4-D
Taiwan Country Regression
Turnover = -0.000154 + 0.00243 AUO +0.000795 Siliconwr +0.000016 Unitd Mcroelectrc -0.000129 Advnc Semicon -0.000000 TSE 1 -0.000000 TSE 2 +0.000000 TSE 3 -0.000000 TSE 4 -0.000000 TSE 5 +0.000697 ADR? Predictor Coef SE Coef T P Constant -0.0001538 0.0005096 -0.30 0.764 AUO 0.0024321 0.0007797 3.12 0.003 Siliconw 0.0007945 0.0008548 0.93 0.357 Unitd Mc 0.0000162 0.0008368 0.02 0.985 Advnc Se -0.0001294 0.0008368 -0.15 0.878 TSE 1 -0.00000002 0.00000001 -2.65 0.011 TSE 2 -0.00000001 0.00000001 -0.65 0.521 TSE 3 0.00000000 0.00000001 0.06 0.950 TSE 4 -0.00000000 0.00000001 -0.02 0.985 TSE 5 -0.00000000 0.00000001 -0.20 0.845 ADR? 0.0006973 0.0001620 4.30 0.000 S = 0.0005809 R-Sq = 57.6% R-Sq(adj) = 48.9%
23

Appendix 4-E
U.K. Country Regression
Turnover = 0.00310 - 0.00542 Scottish Pwr? - 0.00483 Wolseley? - 0.00380 Spirent? - 0.00376 BG Grp? - 0.00037 BHP Bll? - 0.00159 Cambrige Ant? + 0.00254 Acambis? + 0.00157 Galen? - 0.00118 GKN? +0.000000 LSE Vol1 +0.000000 LSE Vol2 +0.000000 LSE Vol3 +0.000000 LSE Vol4 +0.000000 LSE Vol5 +0.000000 LSE Vol6 -0.000000 LSE Vol7 -0.000000 LSE Vol8 +0.000000 LSE Vol9 +0.000000 LSE Vol10 -0.000220 ADR? Predictor Coef SE Coef T P Constant 0.003096 0.002705 1.14 0.255 Scottish -0.005424 0.003623 -1.50 0.138 Wolseley -0.004831 0.003623 -1.33 0.185 Spirent? -0.003796 0.004025 -0.94 0.348 BG Grp? -0.003762 0.003689 -1.02 0.310 BHP Bll? -0.000373 0.003802 -0.10 0.922 Cambrige -0.001587 0.003653 -0.43 0.665 Acambis? 0.002542 0.004061 0.63 0.533 Galen? 0.001571 0.003651 0.43 0.668 GKN? -0.001176 0.003448 -0.34 0.734 LSE Vol1 0.00000013 0.00000005 2.66 0.009 LSE Vol2 0.00000012 0.00000005 2.46 0.016 LSE Vol3 0.00000019 0.00000006 3.08 0.003 LSE Vol4 0.00000009 0.00000004 2.03 0.045 LSE Vol5 0.00000007 0.00000005 1.41 0.161 LSE Vol6 0.00000008 0.00000005 1.62 0.109 LSE Vol7 -0.00000002 0.00000007 -0.32 0.746 LSE Vol8 -0.00000006 0.00000006 -0.98 0.330 LSE Vol9 0.00000005 0.00000005 0.94 0.349 LSE Vol1 0.00000007 0.00000005 1.43 0.156 ADR? -0.0002198 0.0002901 -0.76 0.451 S = 0.001409 R-Sq = 68.1% R-Sq(adj) = 61.6%
24
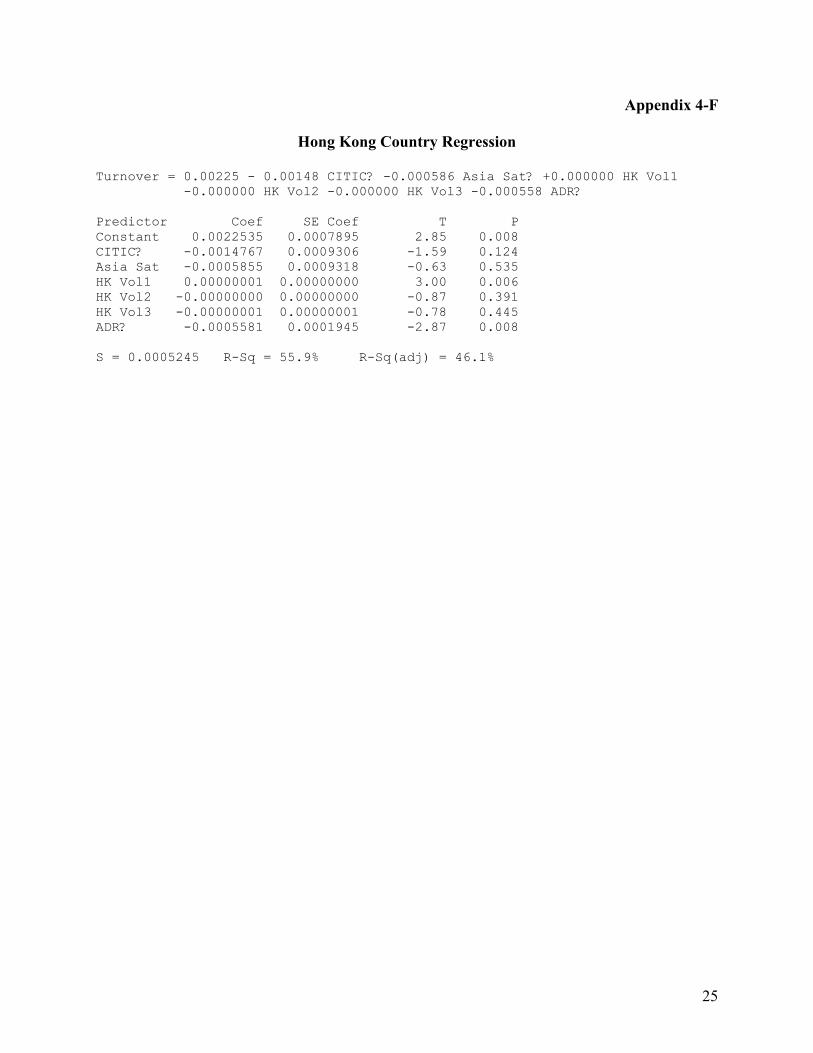
Appendix 4-F
Hong Kong Country Regression
Turnover = 0.00225 - 0.00148 CITIC? -0.000586 Asia Sat? +0.000000 HK Vol1 -0.000000 HK Vol2 -0.000000 HK Vol3 -0.000558 ADR? Predictor Coef SE Coef T P Constant 0.0022535 0.0007895 2.85 0.008 CITIC? -0.0014767 0.0009306 -1.59 0.124 Asia Sat -0.0005855 0.0009318 -0.63 0.535 HK Vol1 0.00000001 0.00000000 3.00 0.006 HK Vol2 -0.00000000 0.00000000 -0.87 0.391 HK Vol3 -0.00000001 0.00000001 -0.78 0.445 ADR? -0.0005581 0.0001945 -2.87 0.008 S = 0.0005245 R-Sq = 55.9% R-Sq(adj) = 46.1%
25

Appendix 4-G
Australia Country Regression
Turnover = 0.00678 + 0.0009 Ansell + 0.0045 James Hardie - 0.0099 Sthrn Pac +0.000000 AUS1 +0.000000 AUS2 +0.000000 AUS3 -0.000000 AUS4 - 0.00430 ADR? Predictor Coef SE Coef T P Constant 0.006780 0.004205 1.61 0.115 Ansell 0.00095 0.01371 0.07 0.945 James Ha 0.00453 0.01246 0.36 0.718 Sthrn Pa -0.00993 0.01288 -0.77 0.445 AUS1 0.00000038 0.00000102 0.37 0.710 AUS2 0.00000021 0.00000094 0.22 0.829 AUS3 0.00000047 0.00000096 0.49 0.627 AUS4 -0.00000016 0.00000028 -0.58 0.564 ADR? -0.004300 0.001518 -2.83 0.007 S = 0.004830 R-Sq = 59.0% R-Sq(adj) = 50.6%
26

Appendix 5-A
Brazil Modified Country Regression
Turnover = 0.00049 - 0.00093 Bradesco + 0.00024 ITAU + 0.00068 CEMIG + 0.00049 Brasil Tlcm + 0.00864 Net Servicos - 0.00115 Tele Nordeste - 0.00049 Votorantim + 0.00182 Saneamento - 0.00060 Tele Celular +0.000000 Bovespa 1 -0.000000 Bovespa 2 -0.000000 Bovespa 3 -0.000000 Bovespa 4 +0.000000 Bovespa 5 +0.000000 Bovespa 6 +0.000000 Bovespa 7 -0.000000 Bovespa 8 +0.000000 Bovespa 9 -0.000000 Bovespa 10 - 0.00204 Retn1 - 0.00073 Retn2 + 0.00012 Retn3 - 0.00131 Retn4 + 0.00880 Retn5 + 0.00009 Retn6 + 0.00010 Retn7 - 0.00192 Retn8 + 0.00064 Retn9 + 0.00242 Retn10 -0.000000 NYSE1 -0.000000 NYSE2 -0.000000 NYSE3 +0.000000 NYSE4 -0.000000 NYSE5 -0.000000 NYSE6 -0.000000 NYSE7 -0.000000 NYSE8 -0.000000 NYSE9 +0.000000 NYSE10 + 0.00111 ADR? Predictor Coef SE Coef T P Constant 0.000488 0.002653 0.18 0.855 Bradesco -0.000931 0.004553 -0.20 0.839 ITAU 0.000240 0.003805 0.06 0.950 CEMIG 0.000683 0.004757 0.14 0.886 Brasil T 0.000488 0.004597 0.11 0.916 Net Serv 0.008638 0.004819 1.79 0.077 Tele Nor -0.001155 0.003491 -0.33 0.742 Votorant -0.000490 0.003588 -0.14 0.892 Saneamen 0.001817 0.004109 0.44 0.660 Tele Cel -0.000597 0.003483 -0.17 0.864 Bovespa 0.00000000 0.00000000 0.07 0.942 Bovespa -0.00000000 0.00000000 -0.20 0.842 Bovespa -0.00000000 0.00000000 -0.39 0.696 Bovespa -0.00000000 0.00000000 -0.62 0.536 Bovespa 0.00000000 0.00000000 2.30 0.024 Bovespa 0.00000000 0.00000000 0.43 0.665 Bovespa 0.00000000 0.00000000 0.13 0.898 Bovespa -0.00000000 0.00000000 -0.24 0.814 Bovespa 0.00000000 0.00000000 0.29 0.776 Bovespa -0.00000000 0.00000000 -0.46 0.649 Retn1 -0.002037 0.004631 -0.44 0.661 Retn2 -0.000729 0.003416 -0.21 0.832 Retn3 0.000124 0.003625 0.03 0.973 Retn4 -0.001312 0.002780 -0.47 0.638 Retn5 0.008796 0.001790 4.91 0.000 Retn6 0.000092 0.002315 0.04 0.969 Retn7 0.000100 0.004860 0.02 0.984 Retn8 -0.001924 0.003592 -0.54 0.594 Retn9 0.000638 0.002887 0.22 0.826 Retn10 0.002422 0.004504 0.54 0.592 NYSE1 -0.00000000 0.00000000 -0.00 0.998 NYSE2 -0.00000000 0.00000000 -0.25 0.805 NYSE3 -0.00000000 0.00000000 -0.14 0.890 NYSE4 0.00000000 0.00000000 0.02 0.987 NYSE5 -0.00000000 0.00000000 -3.38 0.001 NYSE6 -0.00000000 0.00000000 -0.23 0.817 NYSE7 -0.00000000 0.00000000 -0.21 0.835 NYSE8 -0.00000000 0.00000000 -0.89 0.375
27
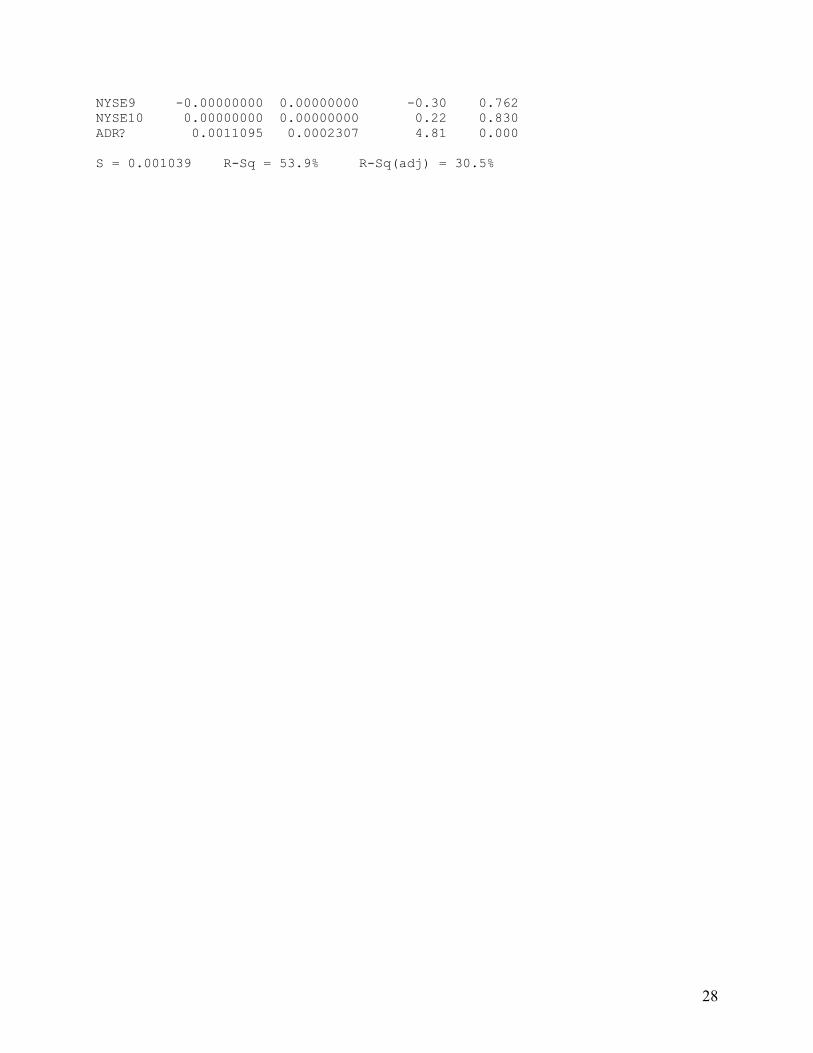
NYSE9 -0.00000000 0.00000000 -0.30 0.762 NYSE10 0.00000000 0.00000000 0.22 0.830 ADR? 0.0011095 0.0002307 4.81 0.000 S = 0.001039 R-Sq = 53.9% R-Sq(adj) = 30.5%
28
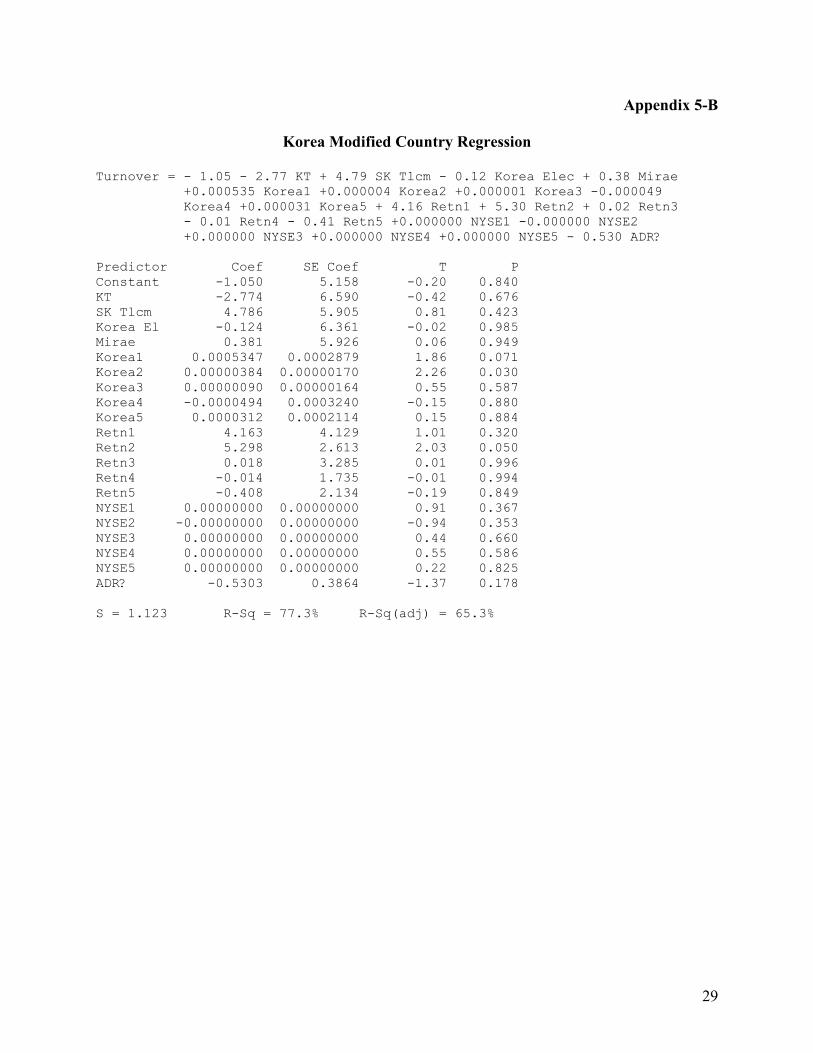
Appendix 5-B
Korea Modified Country Regression
Turnover = - 1.05 - 2.77 KT + 4.79 SK Tlcm - 0.12 Korea Elec + 0.38 Mirae +0.000535 Korea1 +0.000004 Korea2 +0.000001 Korea3 -0.000049 Korea4 +0.000031 Korea5 + 4.16 Retn1 + 5.30 Retn2 + 0.02 Retn3
- 0.01 Retn4 - 0.41 Retn5 +0.000000 NYSE1 -0.000000 NYSE2 +0.000000 NYSE3 +0.000000 NYSE4 +0.000000 NYSE5 - 0.530 ADR? Predictor Coef SE Coef T P Constant -1.050 5.158 -0.20 0.840 KT -2.774 6.590 -0.42 0.676 SK Tlcm 4.786 5.905 0.81 0.423 Korea El -0.124 6.361 -0.02 0.985 Mirae 0.381 5.926 0.06 0.949 Korea1 0.0005347 0.0002879 1.86 0.071 Korea2 0.00000384 0.00000170 2.26 0.030 Korea3 0.00000090 0.00000164 0.55 0.587 Korea4 -0.0000494 0.0003240 -0.15 0.880 Korea5 0.0000312 0.0002114 0.15 0.884 Retn1 4.163 4.129 1.01 0.320 Retn2 5.298 2.613 2.03 0.050 Retn3 0.018 3.285 0.01 0.996 Retn4 -0.014 1.735 -0.01 0.994 Retn5 -0.408 2.134 -0.19 0.849 NYSE1 0.00000000 0.00000000 0.91 0.367 NYSE2 -0.00000000 0.00000000 -0.94 0.353 NYSE3 0.00000000 0.00000000 0.44 0.660 NYSE4 0.00000000 0.00000000 0.55 0.586 NYSE5 0.00000000 0.00000000 0.22 0.825 ADR? -0.5303 0.3864 -1.37 0.178 S = 1.123 R-Sq = 77.3% R-Sq(adj) = 65.3%
29

Appendix 5-C
India Modified Country Regression
Turnover = 0.0090 + 0.0039 ICICI - 0.0177 Infosys - 0.0144 Satyam + 0.0075 Dr Reddys - 0.0001 HDFC + 0.0158 Silverline - 0.0018 Videsh +0.000003 BSE 1 -0.000007 BSE 2 +0.000020 BSE 3 -0.000004 BSE 4 +0.000002 BSE 5 +0.000032 BSE 6 +0.000001 BSE 7 -0.000000 BSE 8 + 0.00374 Retn1 - 0.0011 Retn2 - 0.0193 Retn3 - 0.0019 Retn4 - 0.0238 Retn5 - 0.0355 Retn6 + 0.0035 Retn7 + 0.00122 Retn8 -0.000000 NYSE1 +0.000000 NYSE2 -0.000000 NYSE3 -0.000000 NYSE4 -0.000000 NYSE5 -0.000000 NYSE6 -0.000000 NYSE7 -0.000000 NYSE8 + 0.00486 ADR? Predictor Coef SE Coef T P Constant 0.00901 0.01964 0.46 0.648 ICICI 0.00387 0.04067 0.10 0.925 Infosys -0.01768 0.03212 -0.55 0.584 Satyam -0.01443 0.02991 -0.48 0.631 Dr Reddy 0.00751 0.03047 0.25 0.806 HDFC -0.00009 0.03617 -0.00 0.998 Silverli 0.01578 0.02942 0.54 0.593 Videsh -0.00184 0.02866 -0.06 0.949 BSE 1 0.00000312 0.00000684 0.46 0.650 BSE 2 -0.00000663 0.00000766 -0.86 0.391 BSE 3 0.00002033 0.00000325 6.26 0.000 BSE 4 -0.00000352 0.00000320 -1.10 0.275 BSE 5 0.00000205 0.00000337 0.61 0.546 BSE 6 0.00003179 0.00000588 5.40 0.000 BSE 7 0.00000110 0.00000382 0.29 0.775 BSE 8 -0.00000035 0.00000372 -0.09 0.925 Retn1 0.003744 0.006439 0.58 0.563 Retn2 -0.00109 0.01360 -0.08 0.936 Retn3 -0.01931 0.01357 -1.42 0.160 Retn4 -0.00195 0.02546 -0.08 0.939 Retn5 -0.02381 0.05115 -0.47 0.643 Retn6 -0.03551 0.01024 -3.47 0.001 Retn7 0.00347 0.01708 0.20 0.840 Retn8 0.001224 0.009146 0.13 0.894 NYSE1 -0.00000000 0.00000000 -0.57 0.574 NYSE2 0.00000000 0.00000000 0.87 0.390 NYSE3 -0.00000000 0.00000000 -0.33 0.740 NYSE4 -0.00000000 0.00000000 -0.14 0.886 NYSE5 -0.00000000 0.00000000 -0.44 0.660 NYSE6 -0.00000000 0.00000000 -1.51 0.135 NYSE7 -0.00000000 0.00000000 -0.42 0.673 NYSE8 -0.00000000 0.00000000 -0.33 0.742 ADR? 0.004862 0.002748 1.77 0.082 S = 0.007939 R-Sq = 90.2% R-Sq(adj) = 85.2%
30

Appendix 5-D
Taiwan Modified Country Regression
Turnover = 0.00097 - 0.00178 AUO - 0.00076 Siliconwr - 0.00072 Unitd Mcroelectrc + 0.00030 Advnc Semicon -0.000000 TSE 1 -0.000000 TSE 2 +0.000000 TSE 3 +0.000000 TSE 4 -0.000000 TSE 5 -0.000765 Retn1 -0.000240 Retn2 + 0.00044 Retn3 -0.000638 Retn4 + 0.00093 Retn5 +0.000000 NYSE1 +0.000000 NYSE2 -0.000000 NYSE3 -0.000000 NYSE4 -0.000000 NYSE5 +0.000685 ADR? Predictor Coef SE Coef T P Constant 0.000973 0.001292 0.75 0.456 AUO -0.001777 0.001929 -0.92 0.363 Siliconw -0.000756 0.002074 -0.36 0.717 Unitd Mc -0.000717 0.001734 -0.41 0.682 Advnc Se 0.000297 0.001796 0.17 0.870 TSE 1 -0.00000001 0.00000001 -1.75 0.089 TSE 2 -0.00000001 0.00000001 -0.51 0.612 TSE 3 0.00000000 0.00000001 0.31 0.761 TSE 4 0.00000001 0.00000002 0.73 0.471 TSE 5 -0.00000001 0.00000001 -0.51 0.610 Retn1 -0.0007650 0.0008346 -0.92 0.365 Retn2 -0.0002398 0.0008175 -0.29 0.771 Retn3 0.000443 0.001447 0.31 0.761 Retn4 -0.0006378 0.0009234 -0.69 0.494 Retn5 0.000925 0.001934 0.48 0.635 NYSE1 0.00000000 0.00000000 1.92 0.063 NYSE2 0.00000000 0.00000000 0.21 0.833 NYSE3 -0.00000000 0.00000000 -0.41 0.687 NYSE4 -0.00000000 0.00000000 -1.23 0.225 NYSE5 -0.00000000 0.00000000 -0.65 0.521 ADR? 0.0006845 0.0002078 3.29 0.002 S = 0.0005501 R-Sq = 69.7% R-Sq(adj) = 54.2%
31

Appendix 5-E
U.K. Modified Country Regression
Turnover = 0.00189 - 0.00240 Scottish Pwr? - 0.00370 Wolseley? + 0.00110 Spirent? - 0.00238 BG Grp? + 0.00330 BHP Bll? - 0.00115 Cambrige Ant? + 0.00314 Acambis? - 0.00170 Galen? - 0.00072 GKN? +0.000000 LSE Vol1 +0.000000 LSE Vol2 +0.000000 LSE Vol3 +0.000000 LSE Vol4 +0.000000 LSE Vol5 +0.000000 LSE Vol6 -0.000000 LSE Vol7 -0.000000 LSE Vol8 +0.000000 LSE Vol9 +0.000000 LSE Vol10 + 0.00025 Retn1 - 0.00082 Retn2 - 0.00140 Retn3 - 0.0007 Retn4 - 0.00414 Retn5 - 0.00021 Retn6 + 0.00020 Retn7 - 0.00789 Retn8 - 0.00054 Retn9 + 0.00413 Retn10 -0.000000 NYSE1 +0.000000 NYSE2 -0.000000 NYSE3 -0.000000 NYSE4 -0.000000 NYSE5 +0.000000 NYSE6 +0.000000 NYSE7 +0.000000 NYSE8 +0.000000 NYSE9 +0.000000 NYSE10 -0.000311 ADR? Predictor Coef SE Coef T P Constant 0.001895 0.003326 0.57 0.571 Scottish -0.002404 0.004823 -0.50 0.620 Wolseley -0.003705 0.004863 -0.76 0.448 Spirent? 0.001099 0.005717 0.19 0.848 BG Grp? -0.002383 0.004813 -0.50 0.622 BHP Bll? 0.003299 0.005114 0.65 0.521 Cambrige -0.001154 0.005430 -0.21 0.832 Acambis? 0.003141 0.005452 0.58 0.566 Galen? -0.001697 0.004698 -0.36 0.719 GKN? -0.000722 0.005096 -0.14 0.888 LSE Vol1 0.00000016 0.00000006 2.58 0.012 LSE Vol2 0.00000013 0.00000006 2.14 0.036 LSE Vol3 0.00000023 0.00000008 2.94 0.004 LSE Vol4 0.00000010 0.00000007 1.44 0.153 LSE Vol5 0.00000010 0.00000008 1.21 0.230 LSE Vol6 0.00000008 0.00000007 1.17 0.245 LSE Vol7 -0.00000004 0.00000010 -0.44 0.662 LSE Vol8 -0.00000014 0.00000010 -1.45 0.152 LSE Vol9 0.00000004 0.00000006 0.68 0.499 LSE Vol1 0.00000003 0.00000008 0.45 0.657 Retn1 0.000251 0.005277 0.05 0.962 Retn2 -0.000821 0.004194 -0.20 0.845 Retn3 -0.001399 0.001834 -0.76 0.448 Retn4 -0.00066 0.01438 -0.05 0.964 Retn5 -0.004143 0.006709 -0.62 0.539 Retn6 -0.000206 0.002682 -0.08 0.939 Retn7 0.000199 0.004389 0.05 0.964 Retn8 -0.007886 0.004418 -1.79 0.078 Retn9 -0.000543 0.003425 -0.16 0.874 Retn10 0.004133 0.008573 0.48 0.631 NYSE1 -0.00000000 0.00000000 -0.79 0.432 NYSE2 0.00000000 0.00000000 0.03 0.980 NYSE3 -0.00000000 0.00000000 -1.04 0.300 NYSE4 -0.00000000 0.00000000 -0.14 0.887 NYSE5 -0.00000000 0.00000000 -1.07 0.288 NYSE6 0.00000000 0.00000000 0.18 0.854 NYSE7 0.00000000 0.00000000 0.40 0.691 NYSE8 0.00000000 0.00000000 1.65 0.104
32
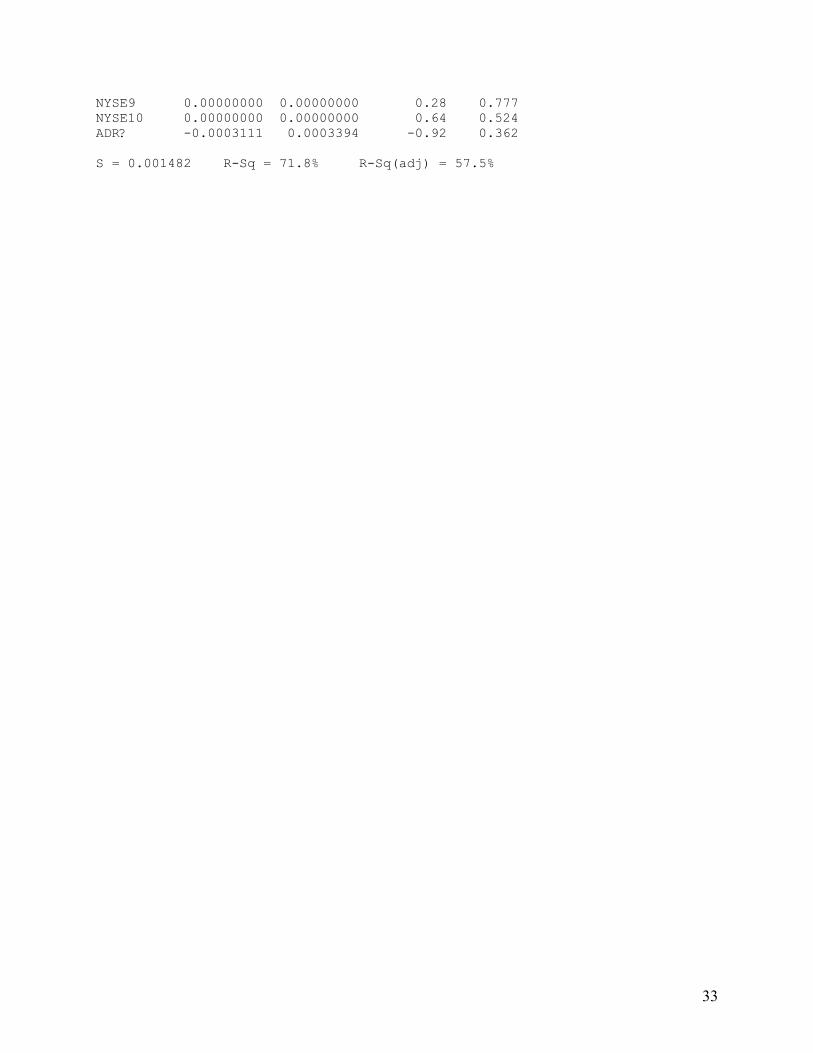
NYSE9 0.00000000 0.00000000 0.28 0.777 NYSE10 0.00000000 0.00000000 0.64 0.524 ADR? -0.0003111 0.0003394 -0.92 0.362 S = 0.001482 R-Sq = 71.8% R-Sq(adj) = 57.5%
33
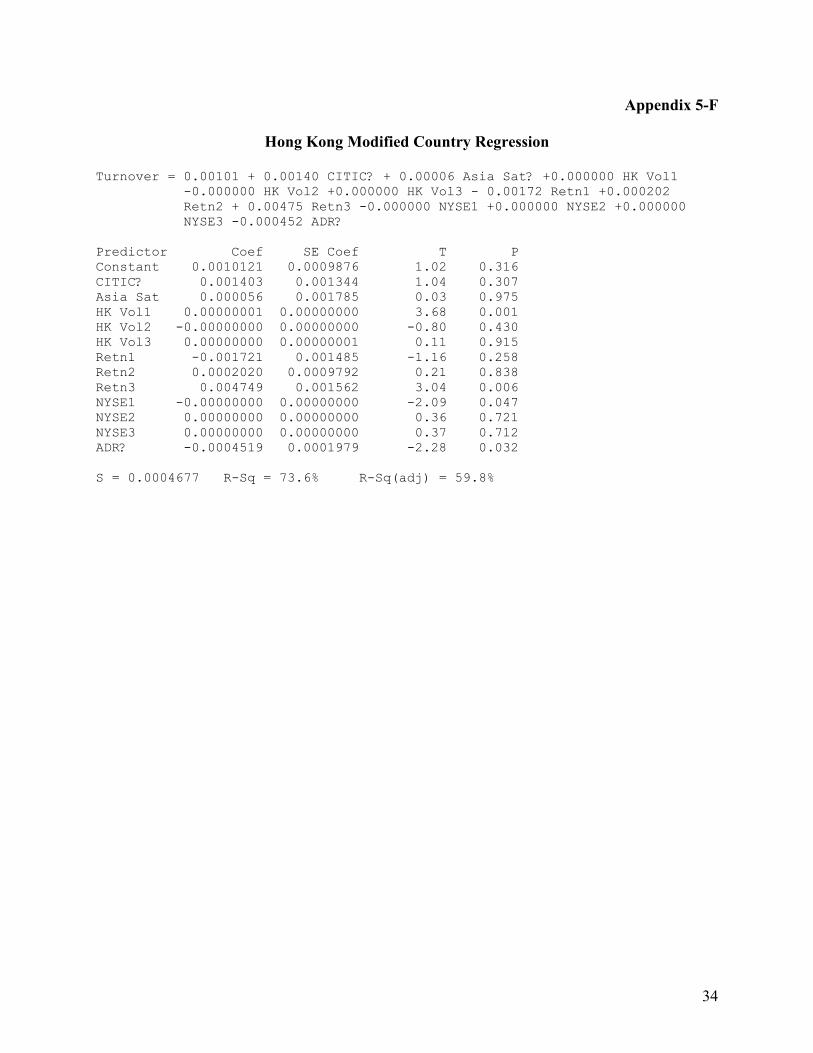
Appendix 5-F
Hong Kong Modified Country Regression
Turnover = 0.00101 + 0.00140 CITIC? + 0.00006 Asia Sat? +0.000000 HK Vol1 -0.000000 HK Vol2 +0.000000 HK Vol3 - 0.00172 Retn1 +0.000202 Retn2 + 0.00475 Retn3 -0.000000 NYSE1 +0.000000 NYSE2 +0.000000 NYSE3 -0.000452 ADR?
Predictor Coef SE Coef T P Constant 0.0010121 0.0009876 1.02 0.316 CITIC? 0.001403 0.001344 1.04 0.307 Asia Sat 0.000056 0.001785 0.03 0.975 HK Vol1 0.00000001 0.00000000 3.68 0.001 HK Vol2 -0.00000000 0.00000000 -0.80 0.430 HK Vol3 0.00000000 0.00000001 0.11 0.915 Retn1 -0.001721 0.001485 -1.16 0.258 Retn2 0.0002020 0.0009792 0.21 0.838 Retn3 0.004749 0.001562 3.04 0.006 NYSE1 -0.00000000 0.00000000 -2.09 0.047 NYSE2 0.00000000 0.00000000 0.36 0.721 NYSE3 0.00000000 0.00000000 0.37 0.712 ADR? -0.0004519 0.0001979 -2.28 0.032 S = 0.0004677 R-Sq = 73.6% R-Sq(adj) = 59.8%
34
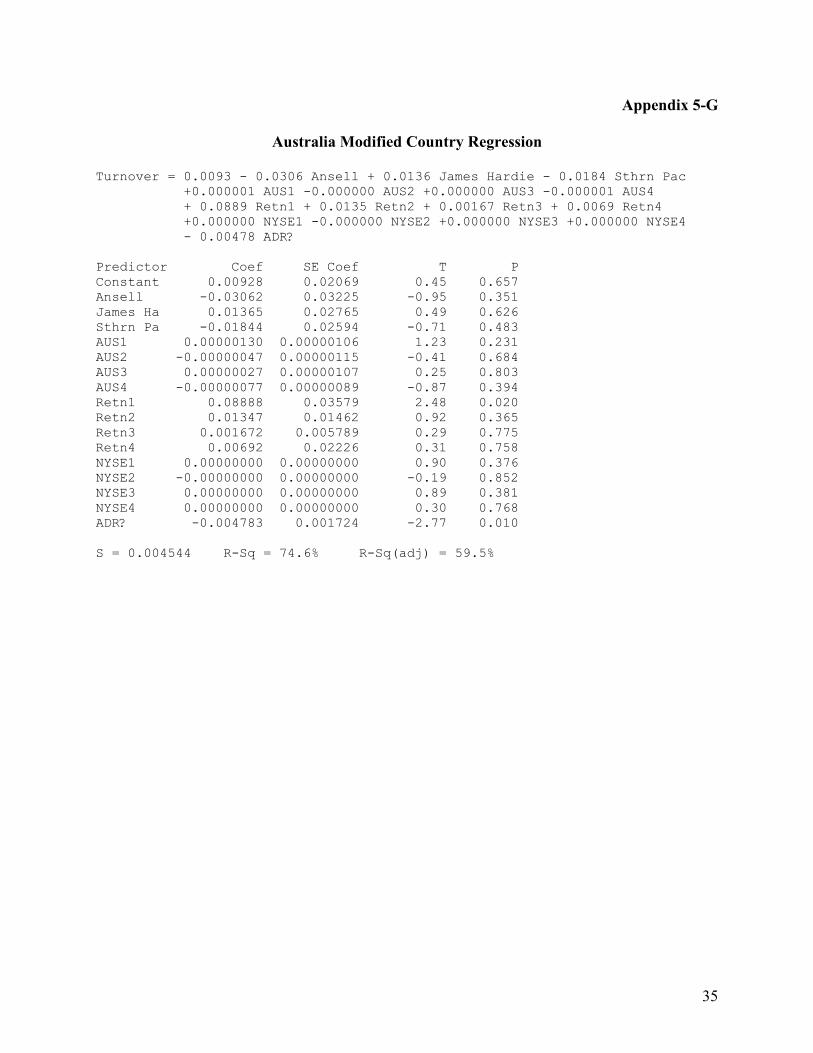
Appendix 5-G
Australia Modified Country Regression
Turnover = 0.0093 - 0.0306 Ansell + 0.0136 James Hardie - 0.0184 Sthrn Pac +0.000001 AUS1 -0.000000 AUS2 +0.000000 AUS3 -0.000001 AUS4 + 0.0889 Retn1 + 0.0135 Retn2 + 0.00167 Retn3 + 0.0069 Retn4 +0.000000 NYSE1 -0.000000 NYSE2 +0.000000 NYSE3 +0.000000 NYSE4 - 0.00478 ADR? Predictor Coef SE Coef T P Constant 0.00928 0.02069 0.45 0.657 Ansell -0.03062 0.03225 -0.95 0.351 James Ha 0.01365 0.02765 0.49 0.626 Sthrn Pa -0.01844 0.02594 -0.71 0.483 AUS1 0.00000130 0.00000106 1.23 0.231 AUS2 -0.00000047 0.00000115 -0.41 0.684 AUS3 0.00000027 0.00000107 0.25 0.803 AUS4 -0.00000077 0.00000089 -0.87 0.394 Retn1 0.08888 0.03579 2.48 0.020 Retn2 0.01347 0.01462 0.92 0.365 Retn3 0.001672 0.005789 0.29 0.775 Retn4 0.00692 0.02226 0.31 0.758 NYSE1 0.00000000 0.00000000 0.90 0.376 NYSE2 -0.00000000 0.00000000 -0.19 0.852 NYSE3 0.00000000 0.00000000 0.89 0.381 NYSE4 0.00000000 0.00000000 0.30 0.768 ADR? -0.004783 0.001724 -2.77 0.010 S = 0.004544 R-Sq = 74.6% R-Sq(adj) = 59.5%
35

References
“The ADR Reference Guide”, JPMorgan, 2002-03.
Davies, Rob. “Sky’s the Limit for Asian ADRs.” Finance Asia, March 2002.
Sanvicente, Antonio Zoratto. “The Market for ADRs and the Quality of the Brazilian Stock
Market,” 2001.
Kumar, Manoj and Saudagaran, Shahrokh M. “The Impact of International Listings on Liquidity:
Evidence from the Indian Stock Market,” 2001.
Mazza, Rebecca, Rapaport, Alexander, Rosenburg, Marcelo, Rossi, Massimiliano and Zapata,
Jose. “The Effect of ADR Listing on Underlying Equity Behavior,” 2001
Universal Issuance Guide, Citibank ADR Services. http://wwss.citissb.com/adr/www/
“ADR Market 2002: A Look at Trading Liquidity.” JPMorgan, May 2002.
“Citibank Analysis Finds ADRs Significantly Outperform Their Home Markets.” Citigroup
Research, June 17, 2002.
36