topic title: city of sydney bridges – an overview and ...€¦ · city of sydney bridges – an...
TRANSCRIPT

8th Australian Small Bridges Conference
1
City of Sydney Bridges – an Overview and Current Asset Management Practices
Nasser Hossain, Senior Engineer, Roads and Structural Assets
Param Seenithamby, Principal Engineer, Roads and Structural Assets City of Sydney Council, Australia
ABSTRACT
City of Sydney has 40 bridges comprising road bridges and pedestrian bridges. This paper will provide an overview on some of these bridges and their current asset management practices. Roads and structural asset (RSA) team manages all roads and structural assets (e.g. roads, footpaths, kerb and gutter, bridges, underpasses, retaining walls, cliffs or natural rock faces, stairs/steps/ramps, seawalls and other foreshore structures, and fences) in City’s LGA. This paper will first provide an overview on these bridge assets including some constraints. These constraints include difficult access, shared responsibility with other councils and interface arrangement with other asset managers. This paper will then present some works undertaken in recent years to manage these bridges that include condition assessment, further bridge investigation/ assessment works including bridge load rating. Based on these works RSA team has programmed a number of bridge remediation/ upgrade work, some of them will commence shortly. This RSA team has also prepared a draft asset management (AM) plan for City’s structures that include these bridges. This paper will include some limited information from that draft AM plan that is related to these bridges. As the latter information is based on the draft AM plan so they are indicative only and likely to be refined further before adopting into the Council’s financial planning and asset management strategy.
INTRODUCTION
The City of Sydney (the City) is responsible for the management and maintenance of City-owned and leased bridges in the City’s Local Government Area (LGA). At this time, the City owns 40 (forty) bridges (refer to Figure 1 and Table 1) worth around $89 million. These bridges comprise road bridges and pedestrian bridges. Material includes concrete, steel and timber. Although majority of these bridges are located along the roads, some are located in various parks around the City and some are shared with the neighbouring councils. In future, more bridges are likely to be added into this list from City’s new development works or by acquiring bridges through new lease agreements or because of ownership changes.
BRIDGE ASSET OWNERSHIP
Bridge asset ownership within the City is sometimes complex. City is not the asset owner of all the bridges that are located within City’s LGA. Many are owned by other organisations that include Roads and Maritime Services RMS, Sydney Harbour Foreshore Authority SHFA (currently Property NSW), RailCorp.
For some of these bridges the City acts as a road manager only. Bridge structures beneath these roads are owned by other organisations. Harris Street Bridge at Pyrmont is one example of such a bridge. There is an Interface Agreement titled “Managing Risks to Safety Due to Rail – Road Crossings”, which refers to the following Clause:

8th Australian Small Bridges Conference
2
“Part 3, Division 6, Subdivision 2 of the Rail Safety National Law obliges the Rail Infrastructure Managers and the Road Managers to identify, assess and manage, so far as is reasonably practicable, risks to safety that may arise from Railway Operations carried out on Rail Infrastructure, wholly or partly because of the existence of any Rail or Road Crossing that is part of the Road Infrastructure of a Public Road.”
Figure 1: Indicative Map of City of Sydney Bridges (Note: Newly added Bridges are not marked in this Map)
Table 1: Bridge Asset Summary
Asset Class Bridge Asset Numbers
Bridges:
Pedestrian Bridges (19):
Timber 4
Non-Timber 15
Road Bridges (21):
Local 17
Regional 4
TOTAL 40

8th Australian Small Bridges Conference
3
In relation to the above Clause, the responsibilities are as follows to ensure the safety of that Harris Street road bridge at that Rail interface:
• Bridge structure and any crash barrier at the edge of the bridge preventing entry into the Rail Corridor is the responsibility of the owner of the bridge structure (RailCorp).
• Rail Infrastructure Manager (Transdev Sydney Light Rail) is responsible for the light rail corridor.
• In relation to providing safety to pedestrians over the footpath of Harris Street Pyrmont Bridge, Road Manager (Sydney City Council) is responsible.
The above three organizations are collectively managing the risk at that road/rail interface.
There are many such interfaces within City’s LGA and the responsibilities varies as they depend on the asset ownership. Interface agreements define roles and responsibilities of various asset owners, road/rail managers at such interfaces along the rail corridor. Some examples of bridges over the light rail within the City are:
• Miller Street Bridge, Pyrmont (City is the bridge asset owner as well as the road manager)
• Point Street Bridge, Pyrmont (City is the bridge asset owner as well as the road manager)
• Harris Street Bridge, Pyrmont (RailCorp is the bridge asset owner, City is the road manager)
City needs to liaise with Transdev Sydney Light Rail and take their approval before undertaking any inspection or repair work on these bridges. Because of the very limited rail shutdown period each year, there is a very restricted opportunity to carry out inspection or repair work on these bridges. Presence of live electricity under the bridges introduces another difficulty to carry out these works.
There are bridges at the boundary between the City and the neighbouring councils (e.g. Woollahra, Inner West). These are owned jointly by the City and the corresponding neighbouring council. Currently there are seven such bridges that include both road and pedestrian bridges. Owner councils work together to repair such bridges and share repair costs between them. The following are some examples of such shared bridges:
• Burton Street Viaduct (shared with the Woollahra Council)
• Booth Street Bridge (shared with the Inner West Council)
• Rushcutters Bay Park Bridges (2 pedestrian bridges; shared with the Woollahra Council)
• Wigram Road Bridge (shared with the Inner West Council)
City shares bridges with other organisations also. Pier Street Bridge (also known as William Henry Street Bridge) is one example of such bridges. This is a long bridge and one span goes over the light rail.
There are some bridges that are leased to the City. The following are some examples of such leased bridges located over the Hickson Road. These are leased to the City by formerly Maritime Authority of NSW (now RMS).
• Bridge-2/3 Pottinger St, Dawes Point

8th Australian Small Bridges Conference
4
• Bridge 6/7 Pottinger St Near Pier-5, Dawes Point
• Bridge 8/9 Pottinger St, Millers Point
New development works within the City sometimes handover bridges and culverts to the City. At relatively recent time two bridges and one culvert in the Harold park area are handed over to the city. These include one concrete road bridge, one 6m long culvert (supporting full width of a road) and one steel pedestrian bridge over the Johnstons Creek.
Figure1 shows a map with bridges within City’s LGA that are owned (in full or partly) by the City and that are leased to the City. It does not show newly added bridges from new development works.
PHYSICAL PARAMETERS, BRIDGE ASSET CAPACITY AND PERFORMANCE
Bridges of Table 1 are covered in this paper. Road bridges are designed and constructed to facilitate access and movement of a range of vehicles including buses, trucks, cars and bicycles as well as pedestrians. Pedestrian bridges facilitate access and movement of pedestrians and bicycles.
Road management between Roads and Maritime Services and councils in NSW provides for three categories of road: State, Regional and Local. RMS document “NSW Road Management Arrangements” available in their website provides detail information on these three types of roads. Local and Regional Roads are the responsibility of Councils to fund, determine priorities and carry out works.
Local Road Bridges are located on Local Roads and the Regional Road Bridges are located on Regional Roads. These bridges are generally designed and constructed to meet relevant design standards that were applicable at the time of their construction. In general, there are currently no major deficiencies observed in service performance related to these bridge assets.
Capacity and performance of these assets are under constant review. These assets are generally in good condition and are functionally performing well, except a cantilever footway that was attached later to the Burton Street concrete viaduct. The viaduct was constructed in the early 1900s as a tram bridge. The cantilever footway comprises concrete deck panels supported by steel frames and was installed in the late 1930s. Other than its age, the footway was also having restricted access as many adjacent property fences ended on the viaduct wall. This made it difficult for routine inspection and regular maintenance works. The footway was closed in 2016 to facilitate repair of steel members. The footway is currently in the process of a major rehabilitation work.
CONDITION AUDIT, FURTHER INVESTIGATION AND BRIDGE REMEDIATION PLAN
Bridge and other structures (e.g. retaining walls, cliffs or natural rock faces, stairs/steps/ ramps, and seawalls and other foreshore structures) asset condition is formally assessed every four to five (4-5) years as part of a comprehensive asset data collection and condition assessment exercise. Historically the condition assessment has been based on a visual inspection. This was last completed in mid-2013 as part of an asset survey carried out by consultants SMEC (for stairs/steps/ ramps) and GHD (for bridges, retaining walls, cliffs or natural rock faces, seawalls and other foreshore structures). The next condition

8th Australian Small Bridges Conference
5
assessment exercise for all these structures is expected to be carried out in 2018-19 financial year.
Since the 2013 audit, the City gradually undertook further higher level inspection works and structural assessment works for some bridges (e.g. Booth street bridge, Burton street viaduct, Cutler footway, Point street bridge, Miller street bridge, Euston road bridge, Burrows road bridge, Bourke street bridge, western approach of Pier street bridge, Wyndham street bridge) that are identified having any risk associated with durability and safety requirements or are located on roads with heavier traffic loads. Further to that City undertook a project to check compliance of bridge barriers of some bridges. These works lead to some bridge remediation and upgrade works that the City is currently undertaking or planning to undertake in coming years. The following are some examples of these works:
• Booth Street Bridge, Annandale:
➢ Stage-1 Work: This will include arch spall repair, soil stabilisation to prevent loss of fill material, concrete crack repair, joint repair, repair of gap between arch and the channel wall, stabilisation of spandrel wall.
➢ Stage-2 Work: Widening of road carriageway above the bridge arches, upgrading bridge barriers.
• Burton Street Viaduct, Darlinghurst: Bridge deck repair, steel footway repair, repair of spalled concrete.
• Domain Link Bridge, Sydney: Corrosion remediation work and repainting.
• Timber Truss Bridge at Bicentennial Park, Glebe: Replacing defective timber elements.
• Wigram Road Bridge, Forest Lodge: Bridge barrier upgrade.
• Miller Street Bridge, Pyrmont: Recommended repair works include treatment and cleaning of corrosion on the exposed steel and sealing of cracks in concrete to avoid further damage. Barrier upgrade work will also be reviewed.
• Point Street Bridge, Pyrmont: This Bridge is currently being investigated by a bridge consultant. Identified defects and recommended repair works will be assessed by the City for future remediation works.
• Rushcutters Bay Park pedestrian bridge: Concrete spall repair
• Heritage Balustrades of Various Bridges: Corrosion repair and repainting.

8th Australian Small Bridges Conference
6
BRIDGE ASSET CONDITION
GHD’s 2013 visual inspection work measured bridge condition using a 1 – 5 grading system as detailed in Table 2.
Figure 2 shows the diagram of the condition deterioration model that is used in works related to this paper. The adopted model is consistent with industry asset management and financial standards and guidelines.
Figure 2: Asset Condition Deterioration Model
The condition profiles of these bridges are shown in the following Figure 3. Note that these figures represent overall condition of these bridge assets. Each bridge normally comprises various components: deck slab, deck support beams, piers, abutment headstock, abutment pile, railings, fences, wearing course, etc. So even though the following figures show the overall asset conditions, some component may be of higher (worse) condition than the overall condition rating for that asset. In that situation that component is given a priority for repair work by a maintennace or renewal measure even though the overall condition does not require any repair action.

8th Australian Small Bridges Conference
7
Table 2: Condition Rating [Ref. GHD Pty Ltd (2013) – Visual Inspection for Bridges, Seawalls, Retaining and Cliff Walls, Jetties, Boardwalks and Pontoons]
Condition Index
Condition Defect Description
Concrete Steel Timber
1 Element or component which shows no defects; condition Excellent
The element shows no deterioration. No cracks
Paintwork on steel in excellent condition.
Timber in sound condition, no decay or splinters.
2 Element or component which shows minor defects; condition good
The element shows no deterioration. There may be discolouration, efflorescence, and/or superficial cracking. Hairline Crack < 0.15mm
Isolated steel surface corrosion and minor pitting. Paint work on steel components with < 5% spot rusting.
Timber in sound condition, minor decay or splinters. Minor surface rust on connection bolts and brackets. Less than 10% defects.
3 Element or component which shows moderate defects; condition fair
Minor cracks and spalls may be present but there is no evidence of corrosion of the reinforcement. Crack width between 0.15 mm - 0.3mm
Extensive surface corrosion, minor pitting. Paint work on steel components has spot rusting 5 to 10% of coated area. Section loss of 1-5%.
Timber in moderate condition, reasonable amount of decay or splinters. Moderate surface rust on connection bolts and brackets. Cross sectional loss 10 to 15%.
4 Element or component which shows substantial defects; condition poor
Some delamination or spalls or cracks or corrosion of the reinforcement are prevalent. Corrosion of reinforcement may be present but section loss is minor. Crack width > 0.3 mm and < 2.0 mm
Active Surface corrosion and deep pitting. Section loss to 5-10%.
Timber in poor condition, extensive amount of decay or splinters. Extreme surface rust on connection bolts. Cross sectional loss to 15 to 30%.
5 Element or component which is potentially unsafe for traffic and requires reconstruction; condition very poor.
Delamination or spalls or cracks or corrosion of the reinforcement are prevalent. Corrosion of reinforcement is present and section loss is major. There is sufficient concern to warrant an analysis to ascertain the impact on the strength and/or serviceability of either the element or the bridge. Cracks > than 2mm
Severe corrosion loss and extreme pitting. Metal section loss > 10%.
Timber in unsafe condition, severe amount of decay or splinters. Loose or completely missing fixings. Cross sectional loss > 30%.

8th Australian Small Bridges Conference
8
(a) Condition based on numbers
(b) Condition based on deck areas
Figure 3: Overall Condition of Bridge Assets

8th Australian Small Bridges Conference
9
ASSET VALUATIONS
The unit rates and useful lives of bridges used to develop projected asset renewal expenditures are shown in Table 3. Replacement costs for various bridge categories are shown in Table 4. Asset useful lives and unit rates are currently being reviewed in preparation for next asset revaluation.
Table 3: Bridge Asset Unit Rates and Useful Lives
Asset Sub-Group Unit Rate ($/m2)
Useful Life
(years)
Road Bridge: Concrete/Steel/Composite 9,200 100
Pedestrian Bridge 15,120 100
Timber Bridges 7,385 100
Table 4: Bridge Asset Replacement Cost
Bridge Asset Class Dimension Replacement Cost
($)
Pedestrian: Timber 4 (Length=86.6m,
305.5m2) 2,255,601
Pedestrian: Non-Timber 15 (Length=388.1m,
2,199.8m2) 26,305,206
Local 17 (Length=395.2m,
4,974.8m2) 45,767,999
Regional 4 (Length=59.3m,
1,550.9m2) 14,268,280
TOTAL 40 (Length=929.1m,
9,030.9m2) 88,597,086
Bridge Asset valuation summary is available in Table 5. Assets are valued at “brownfield” replacement unit rates. Valuation is based on straight line depreciation. Valuation principles are as illustrated in the following Figure 4:
Residual
Value
Depreciable
Amount
Useful Life
Current
Replacement
Cost
End of
reporting
period 1
Annual
Depreciation
Expense
End of
reporting
period 2
Accumulated
Depreciation Depreciated
Replacement
Cost
Figure 4: Valuation Principles

8th Australian Small Bridges Conference
10
Table 5: Bridge Assets Valuation Summary
Asset Class
Dimension Asset Average
Condition
Useful Life
Current Replacement Cost (CRC)
Depreciable Amount
($)
Accumulated Depreciation
($)
Depreciated Replacement Cost (DRC)
($)
Annual Depre-ciation
($)
(years)
($)
All Bridges (40 No)
40 nos (L=929m;
Deck Area= 9,031m2)
2.62 100 88,597,086 88,597,086 43,058,184 45,538,902 885,971
Table 6: Various Ratios of Asset Consumption and Expenditure
Asset Class
Depreciable Amount
($)
Annual Depreciat
ion
($)
#Budgeted Renewal cost per
year
($)
Annual Capital Upgrade
Expenditure
($)
&Rate of Annual Asset Consumption
(%)
@Rate of Budgeted Annual Asset
Renewal
(%)
^Rate of Annual Asset Upgrade/New
(%)
All Bridges (40 Nos)
88,597,086 885,971 979,000 - 1 1.11 -
&Rate of Annual Asset Consumption = Depreciation/Depreciable Amount *100 @Rate of Annual Asset Renewal = Capital Renewal Expenditure/Depreciable Amount ^Rate of Annual Asset Upgrade/New = Capital Upgrade Expenditure/Depreciable Amount #Budgeted renewal cost per year is based on a 10 year forward estimates starting from 16-17 and taking the average

8th Australian Small Bridges Conference
11
The overall value of Council’s bridge assets is as follows:-
Current Replacement Cost $88,597,086 Depreciable Amount $88,597,086 Depreciated Replacement Cost $45,538,902 Annual Depreciation Expense $885,971
A more detailed summary is as follows in Table 5.
Various ratios of asset consumption and expenditure have been prepared to help guide and gauge asset management performance and trends over time. A more detailed summary is as follows in Table 6.
If the renewals (sustainable assets case) funding of Figure 5 is used then a Minimum average condition of less than 2.6 is maintained for 10 years. If renewal funding levels are not maintained as per projections then average asset condition will gradually worsen and in the longer term desired service levels will not be met.
Note: Renewals (Sustainable Asset Case) shown are to maintain a min avg condition of less than 2.6
and an abs min condition of 4.0
Figure 5: Renewal Expenditure to Maintain the Overall Bridge
Condition Rating less than 2.6. Projected Operating and Maintenance Expenditure are also shown in this Figure.

8th Australian Small Bridges Conference
12
Figure 6: How Overall Bridge Condition Rating will vary for 10 Years if Renewal Expenditures of Figure 5 are Utilised
RENEWAL PLAN
Renewal is required to restore the asset to its original service potential. Work over and above restoring an asset to original service potential is upgrade/expansion.
Bridges budgeted renewal expenditure is around $0.979M per year based on a 10 year forward estimates starting from 17-18 financial year plan. Actual renewal expenditures may vary from these budgeted figures due to various constraints.
Renewal work is carried out in accordance with the relevant industry standards and specifications including Australian Standards and RMS and Austroads standards and specifications.
Projected future renewal expenditure requirements for “asset sustainability” and to maintain current service levels are forecast to increase over time as assets deteriorate with age. The renewal expenditure forecast is summarised in Figure 5.
Current renewal expenditure projections have had to increase slightly to meet future asset renewal requirements (refer to Figure 5 and Table 7). If the renewals (sustainable assets case) funding of Figure 5 is used then a Minimum average condition of less than 2.6 is maintained for 10 years.
If renewal funding levels are not increased as per projections then average asset condition will gradually worsen and in the longer term desired service levels will not be met.
These risks will be included for consideration in the Infrastructure Risk Management Plan.
One item is worthwhile to mention here that the $ amounts shown in Figure 5 may not be able to be utilised exactly as per the year by year basis as shown in Figure 5.

8th Australian Small Bridges Conference
13
Because it may not be practical to rehabilitate or replace a bridge piece by piece as it ages. But it is likely that some bridges will need to be rehabilitated or replaced as a whole at certain points in time in the future. So an aggregate of some $ amounts shown in Figure 5 is likely to be required at those points in time of replacing the bridges. And renewal term used in this Section may be more appropriately to refer to both renewal and replacement of bridges.
FINANCIAL SUMMARY
This section contains some financial requirements resulting from the information presented in the draft AM Plan. The financial projections will be improved as further information becomes available on desired levels of service and current and projected future asset performance.
Financial Statement and Projection
Projected Operating and Capital Expenditure
The financial projections are shown in Table 7 and Figure 5 for projected operating (operations and maintenance) and capital expenditure (renewal).
Asset Renewal Funding Ratio
The ratio of the net present value of asset renewal funding accommodated over a 10 year period in a long term financial plan relative to the net present value of projected capital renewal expenditures identified in an asset management (AM) plan for the same period [AIFMG Financial Sustainability Indicator No 8].
Asset Renewal Funding Ratio 85%
The Asset Renewal Funding Ratio is the most important indicator and reveals that over the next 10 years, the organisation is forecasting that it will have 85% of the funds required for the optimal renewal and replacement of its assets (based on the assumption that Council will allocate on average $0.979M per year toward bridge asset renewals, in line with recent/ current budgeted annual funding/ expenditure levels).
8th Australian Small Bridges Conference
14
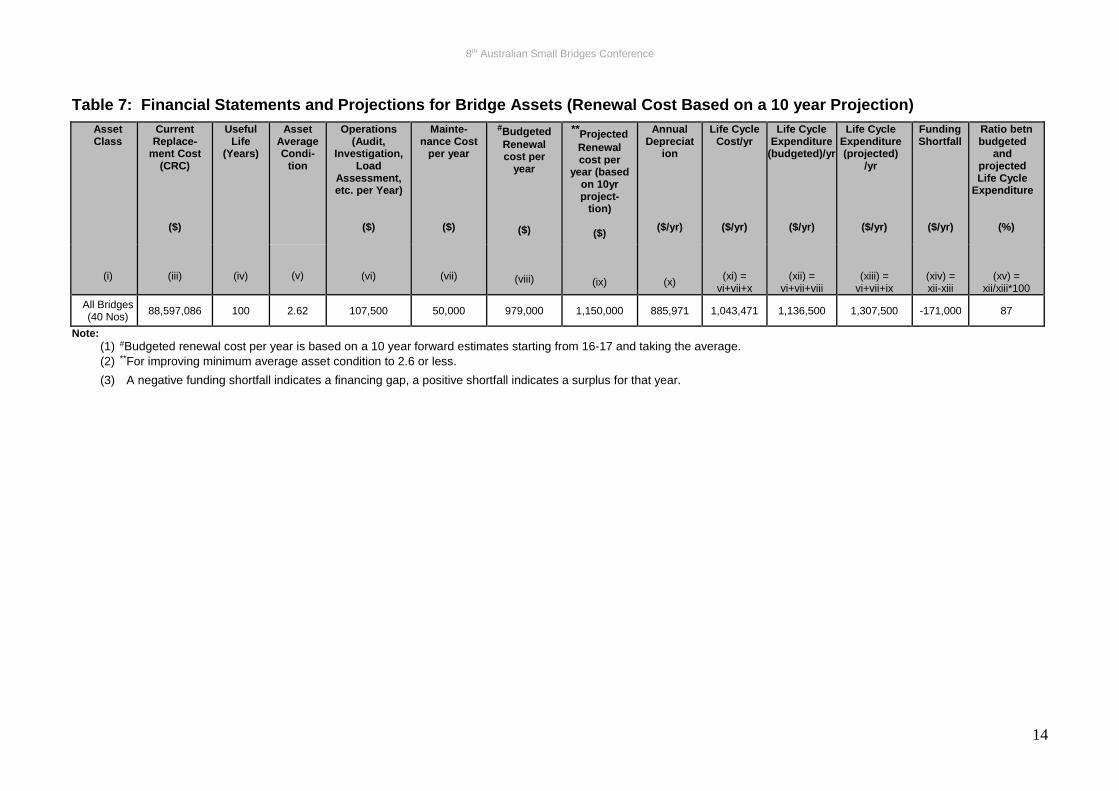
Table 7: Financial Statements and Projections for Bridge Assets (Renewal Cost Based on a 10 year Projection)
Asset Class
(i)
Current Replace-
ment Cost (CRC)
($)
(iii)
Useful Life
(Years)
(iv)
Asset Average Condi-
tion
Operations (Audit,
Investigation, Load
Assessment, etc. per Year)
($)
(vi)
Mainte-nance Cost
per year
($)
(vii)
#Budgeted
Renewal cost per
year
($)
(viii)
**Projected
Renewal cost per
year (based on 10yr project-
tion)
($)
(ix)
Annual Depreciat
ion
($/yr)
(x)
Life Cycle Cost/yr
($/yr)
(xi) = vi+vii+x
Life Cycle Expenditure
(budgeted)/yr
($/yr)
(xii) = vi+vii+viii
Life Cycle Expenditure (projected)
/yr
($/yr)
(xiii) = vi+vii+ix
Funding Shortfall
($/yr)
(xiv) = xii-xiii
Ratio betn budgeted
and projected Life Cycle
Expenditure
(%)
(xv) = xii/xiii*100
(v)
All Bridges (40 Nos)
88,597,086 100 2.62 107,500 50,000 979,000 1,150,000 885,971 1,043,471 1,136,500 1,307,500 -171,000 87
Note:
(1) #Budgeted renewal cost per year is based on a 10 year forward estimates starting from 16-17 and taking the average.
(2) **For improving minimum average asset condition to 2.6 or less.
(3) A negative funding shortfall indicates a financing gap, a positive shortfall indicates a surplus for that year.

8th Australian Small Bridges Conference
15
Life Cycle Cost and Life Cycle Expenditure
Life cycle costs (or whole of life costs) are the average costs that are required to sustain the service levels over the asset life cycle. Life cycle costs include operations and maintenance expenditure and asset consumption (depreciation expense). The life cycle cost for the services covered in this paper is $1,043,471 per year (average operations and maintenance expenditure plus depreciation expense projected over 10 years). Refer to Table 7.
Life cycle costs can be compared to life cycle expenditure to give an initial indicator of affordability of projected service levels when considered with age profiles. Life cycle expenditure includes operations, maintenance and capital renewal expenditure. Life cycle expenditure will vary depending on the timing of asset renewals. The life cycle budgeted expenditure over the 10 year planning period is $1,136,500 per year (average operations and maintenance plus capital renewal budgeted expenditure in a long term financial plan over 10 years). Refer to Table 7.
A shortfall between life cycle cost and life cycle expenditure is the life cycle gap. The life cycle gap for services covered by this paper is ($1,043,471 - $1,136,500) = - $93,029 per year. This is around 9% surplus.
Life cycle expenditure is 109% of life cycle costs (Refer to Table 7: $1,136,500/ $1,043,471*100).
The life cycle costs and life cycle expenditure comparison highlights any difference between present outlays and the average cost of providing the service over the long term. If the life cycle expenditure is less than that life cycle cost, it is most likely that outlays will need to be increased or cuts in services made in the longer term.
Knowing the extent and timing of any required increase in outlays and the service consequences if funding is not available will assist organisations in providing services to their communities in a financially sustainable manner. This is the purpose of the AM Plans and long term financial plan.
The projected operations, maintenance and capital renewal expenditure required over the first 10 years of the planning period is $1,307,500 on average per year. Estimated (budget) operations, maintenance and capital renewal funding is $1,136,500 on average per year. Refer to Table 7. This indicates that Council expects to have approximately 87% of projected expenditures required to provide the services shown in the draft AM Plan over the next 10 years.
Figure 5 shows the projected expenditures for the 10 year long term financial plan.

8th Australian Small Bridges Conference
16
Funding Strategy
After reviewing service levels, as appropriate to ensure ongoing financial sustainability, City will consider incorporating projected expenditures identified earlier (with further refinement) in the organisation’s 10 year long term financial plan.
Projected expenditure identified (with further refinement) is to be funded from Council’s operating and capital budgets.
Additional to City’s current sources of revenue, opportunities for future funding may include:
• additional rate income (e.g. via an infrastructure renewal based rate increase)
• allocation of a portion of new additional rate income from new properties from future land development
• increased contributions towards maintenance and renewal works from third parties
• additional fees and charges for specific facilities and services
• government grants
• developer contributions (monetary i.e. S94 or “in-kind”) for maintenance and renewal
Valuation Forecasts
Current replacement cost (CRC) is the cost the entity would incur to acquire the asset on the reporting date. Figure 7 shows the projected replacement cost (CRC) of City’s bridge assets over the planning period.
Depreciation expense values are forecast in line with asset values as shown in the same Figure 7.
Depreciated replacement cost (DRC) is the current replacement cost (CRC) of an asset less, where applicable, accumulated depreciation calculated on the basis of such cost to reflect the already consumed or expired future economic benefits of the asset. The depreciated replacement cost (DRC) will vary over the forecast period depending on the rates of addition of new assets, disposal of old assets and consumption and renewal of existing assets. Forecast of the asset depreciated replacement cost (DRC) is also shown in Figure 7.

8th Australian Small Bridges Conference
17
Fig 7: Projected Depreciated Replacement Cost, Depreciation and Asset Values of Bridge Assets
CONCLUSION
The paper has presented an overview on City of Sydney’s bridge assets, along with an overview on its condition summary, bridge remediation plan as well as limited information from the draft asset management (AM) plan that include asset valuation, financial statements and projections. As the AM plan is yet to be finalised therefore various unit rates, valuation, results and comment in this paper are indicative only. These are likely to be refined further before adopting into the Council’s financial planning and asset management strategy. This strategy will assist in justifying requirements for increased funding to maintain the bridge assets in a functional and safe standards. Also to produce a meaningful long term financial plan.
REFERENCES
IPWEA, 2006, ‘International Infrastructure Management Manual’, Institute of Public Works Engineering Australia, Sydney, www.ipwea.org.au/IIMM
IPWEA, 2008, ‘NAMS.PLUS Asset Management’, Institute of Public Works Engineering Australia, Sydney, www.ipwea.org.au/namsplus.
IPWEA, 2009, ‘Australian Infrastructure Financial Management Guidelines’, Institute of Public Works Engineering Australia, Sydney, www.ipwea.org.au/AIFMG.
IPWEA, 2011, ‘International Infrastructure Management Manual’, Institute of Public Works Engineering Australia, Sydney, www.ipwea.org.au/IIMM
Organisation, ‘Sustainable Sydney 2030 Community Strategic Plan’
Organisation,‘Council Resourcing Strategy 2013’

8th Australian Small Bridges Conference
18
AUTHOR BIOGRAPHY Nasser Hossain, PhD has 16 years Australian experience as a Bridge and Structural Engineer since completing his PhD in 2001. He pursued his PhD research on Structural Engineering (1997-2000) in The University of Newcastle (Australia) with a University of Newcastle Research Scholarship (UNRS) and additional funding from the Australian Research Council (ARC). Prior to working with the City of Sydney council, Nasser worked on major civil infrastructure projects including bridges and roads, railways, major civil works, cut and cover structures and buildings structures while working with lead Australian consultancies. During that period Nasser was involved with the analysis and design, design review, investigation and inspection of major structures that include major bridges. He has also worked with the RTA (currently RMS) and dealt with major bridges. Nasser has published several technical papers in journals and international conference proceedings and presented papers in various conferences held in Australia, New Zealand and USA. Currently Nasser is working with the City of Sydney’s Roads and Structural Asset (RSA) team to manage City’s roads and structural assets.