topics in patient safety® contents summary of fourth national
TRANSCRIPT

TOPICS IN PATIENTSAFETY®
VOL. 12, ISSUE 2March/April 2012
ContentsPages 1 and 4: Summary of fourth national patient safety survey
Page 2:Avoiding a single point of failure: Fault tolerance and patient safety
Page 3:Getting “SERIOUS” about medication reconciliation
VA National Center forPatient SafetyP.O. Box 486Ann Arbor, MI 48106-0486
Phone: .................(734) 930-5890Fax: ......................(734) 930-5877E-mail: [email protected]
Web Sites:Internet .....www.patientsafety.gov
Robin R. Hemphill, M.D., M.P.H.Deputy Chief Patient Safety Officer Director, VA National Center for Patient Safety
Editor Joe Murphy, M.S., APRPublic Affairs Officer
Graphic Design and Copy EditingDeborah Royal Visual Information Specialist
TIPS is published bimonthly by the VA National Center for Patient Safety. As the official patient safety newsletter of the Department of Veterans Affairs, it is meant to be a source of patient safety information for all VA employees. Opinions of contributors are not necessarily those of the VA. Suggestions and articles are always welcome.
Thanks to all contributors and those NCPS program managers and analysts who offered their time and effort to review and comment on these TIPS articles prior to publication.
Summary of fourth national patient safety survey By Joe Murphy, APR, NCPS public affairs officer
NCPS conducts a VHA-wide patient safety culture survey every three to five years to assess patient safety culture. Four national surveys have been conducted since 2000, the latest occurring in 2011, with more than 48,000 participants (Table 1). An important result from each survey is that NCPS can provide facilities with an individual-ized data analysis, permitting them to drill down into various occupation groups (Table 2). This allows for the identification of occupation groups that contribute most significantly to the perception of patient safety at their facility. Facility results for each occupation group can also be compared to the network and national results for that group. A new analysis tool developed by NCPS identifies facilities with high and low perceptions of the patient safety culture. Culture change can be recognized when staff members understand and perform what is required to create a safe patient experience at their facili-ties, which is measured in the survey using 14 specific dimensions (Table 3), such as “Teamwork Within Hospital Units” and “Frequency of Event Reporting.”
Comparing the surveys Aartee Ignaczak, the NCPS program analyst who managed the 2011 survey, said few major changes were seen at the national level, further noting that the most important comparisons are made at the facility and network levels. “The average responses at the national level didn’t go significantly up or down across the board,” she said, “and that is a positive sign.” One of the 14 dimensions of the survey, “non-punitive response to error,” has shown a slight decline across all four surveys. “We want the trends of the averages to be increasing. So I think it is a challenge, then, to determine underlying causes and ways to improve this perception of patient safety,” Ignaczak said. “If there is the pervasive culture at a facility or work unit where people believe they are going to be punished for reporting an error, or making an error, then it is much less likely an error will be reported and the system improved.” Patient safety managers, however, are con-tinually looking for ways to advance programs at their facilities.
She has provided numerous patient safety managers detailed information on specific facility results. “They have consistently asked, ‘How can we better address whatever problems we find?’ ” Ignaczak noted. Some of the issues can be resolved through implementing NCPS programs, such as Medical Team Training and Clinical Crew Resource Man-agement, which foster improved teamwork and communication. “But we also like to get ideas from the field as to what they are doing to address issues at their facilities,” she said. “When drilling down to the different occupational groups in the survey, I tell people that while you want to look at those groups that have lower than the VHA average, you also want to take a look at are higher than the VHA average.” Individuals in the latter group may be con-ducting business in such a way that can serve as a model to others. “What are they doing better? Can the lessons learned be disseminated to the rest of the facility? Are there best practices that can ben-efit all, rather than just a single group?” Ignaczak continued.
Benchmarks Five dimensions of the VHA-wide survey are comparable to the Agency for Healthcare Re-search and Quality (AHRQ) patient safety surveys for public and private hospitals. Results from past AHRQ comparisons have shown an overall favorable comparison between VHA and the AHRQ benchmarks, such as VHA scoring 80 percent to 70 percent in organizational learning in 2009. “The frequency of event reporting at other organizations is somewhat higher in the latest survey,” she said, “but not significantly so.” Ignaczak noted that such comparisons with outside organizations are important, as they pro-vide a needed prospective on VHA’s patient safety efforts (Table 4). “We will always be looking for new ideas that will allow us to improve future national results,” she said, “and the key to doing this is to continue to partner with patient safety managers at the facility level.”
Continued on page 4

Page 2
Avoiding a single point of failure: Fault tolerance and patient safetyBy Joe Murphy, APR, NCPS public affairs officer
NCPS programs focus on the reduc-tion and prevention of inadvertent harm to patients as a result of their care, using a number of tenets adapted from fault-tolerance design principles.Background We take a systems approach to prob-lem solving, focused on prevention, not punishment. In most cases, a chain of events that has gone unnoticed leads to a recurring safety problem. It is seldom related to the actions of just one individual. A successful approach to improving patient care must therefore include looking for ways to break that link in the chain of events that can cause a recurring problem – which can lead one to consider building care systems that are fault-tolerant. Such systems can reduce or eliminate the possibility that harm can come to a pa-tient, because these systems are designed to succeed even if individual components fail. The fault-tolerance principle has been used for years by the aviation industry and other high-reliability industries.Basic characteristics The basic characteristics of fault tolerance in industry require:
• No single point of failure • Fault isolation to the failing compo-
nent; i.e., how easy is it to discover or detect?
• Fault containment to prevent propaga-tion of the failure; i.e., how easy is it to recover?
• Availability of “reversion modes”; i.e., redundancy1
Healthcare Failure Mode Effect Analysis (HFMEA) is based on a five-step process used by interdisciplinary teams to proactively evaluate a health care process, in an effort to create a fault-tolerant care system.2 Specifically designed for health care professionals, the process offers analytical tools that enable users to identify vulner-abilities and deal with them effectively. To illustrate how the HFMEA process relates to development of a fault-tolerant care system, consider two of the steps used. This step focuses directly on “fault isolation to the failing component”:
• Graphically describe the process be-ing studied. Team members develop and verify a flow process diagram. Each step in the process under study is identified and numbered. If a process is complex, a specific area is identified to keep the effort manage-able. Appropriate sub-processes are also identified and flow process diagrams developed.
Another step in the HFMEA process focuses on “fault containment to prevent propagation of the failure”:
• Conduct a hazard analysis. Focusing on the sub-processes, team members list all potential failure modes to de-termine their severity and probability. Cognitive aids developed by NCPS to support teams at this step include a Scoring Matrix and a Decision Tree.
The Scoring Matrix is used to deter-mine the probability of an event’s reoccur-rence and severity; the Decision Tree to determine if corrective actions should be taken. An HFMEA team’s final step is to de-termine what best course of action to take. In an effort to avoid “a single point of failure,” outcome measures are identified to analyze and test redesigned processes. Critical components Providing a fault-tolerant design for every component in a system is normally not an option. When thinking of examples in other industries, the following criteria are used to determine which components – each playing a specific part of a chain of events – should be fault-tolerant:
• How critical is the component? • How likely is the component to fail? • How expensive is it to make the com-
ponent fault-tolerant?3
Consider these criteria in relation to the Medical Team Training program,2
which emphasizes communication and teamwork through checklist-driven brief-ings and debriefings. For instance, a preoperative briefing plays a specific role in the chain of events leading to an operation:
• Used (in part) to correctly identify the patient; a critical component
• Failure can occur if the identification relies on a single point in the system; communication is vital, i.e., “speaking up” if an error is noticed
• The “expense” of system failure would be felt by the patient – as a potential adverse event – and by its result on efficiency and effectiveness in the operating room
Backup components Fault-tolerant designs can also mitigate or limit of the effects of errors after they have been made, by includ-ing “backup components” that “kick in,” should one component fail.3
In one final example, compare this to one aspect of The Daily Plan®, an NCPS initiative that enhances patient safety by involving patients in their care.2 A single document is provided to them that outlines what can be expected on a specific day of hospitalization. In this case, imagine a nurse using the document as the basis for a discus-sion with a patient concerning upcoming events that day. The patient notices a test is missing, one that a physician had told the patient was scheduled occur. The error was thus not only mitigated, but avoided, by including the patient as a “backup component.” In fact, during the 2009 “Phase 2” of The Daily Plan® pilot program, evalua-tions were completed by 198 hospitalized patients and 85 nurses:
• 47.5 percent of the patients reported that either they or their family mem-ber found and asked about a discrep-ancy in their planned care
Conclusion Integrating fault-tolerance principles into NCPS initiatives and programs has been successful – and can be a signifi-cant tool in reducing inadvertent harm to patients as a result of their care.
Notes1. Answers.com. Retrieved January 10,
2012 from http://www.answers.com/topic/fault-tolerant-system
2. Learn more about NCPS programs: http://www.patietsafety.gov
3. Wikipedia. Retrieved January 10, 2012 from http://en.wikipedia.org/wiki/Fault-tolerant_design

Page 3
Getting “SERIOUS” about medication reconciliationAn interdisciplinary medication reconciliation clinic wins Cheers AwardBy Joe Murphy, APR, NCPS public affairs officer
The departments of pharmacy and cardiology at the Louis Stokes Cleveland VA Medical Center have been designated as a 2011 Cheers Award winner by the Institute for Safe Medication Practices. Staff members have continued to implement an innovative medication reconciliation model, known as “SERI-OUS,” which was created in 2008 by NCPS Patient Safety Physician Danielle Hoover, M.D., M.P.H. “When I heard the clinic had won the award I was floored. I didn’t even know it had been nominated! I did a Facebook status post that night, compar-ing it to winning a ‘health care Grammy,’ ” she said. Dr. Hoover developed the model when she served on the facility staff as a VA National Quality Scholar and NCPS Patient Safety Fellow. It incorporates all the Elements of Performance of a then-proposed 2009 Joint Commission National Patient Safety Goal, which focused on creating an accurate medi-cation list. The SERIOUS model im-proves the medication recon-ciliation process by breaking it down into small steps that can be performed by differ-ent members of a health care team. Dr. Hoover partnered with a team working to prevent heart failure readmis-sions at the Cleveland VA Medical Center. The model was piloted at the team’s post-discharge clinic, staffed by pharmacists and nurse practitioners. “I am really proud that my colleagues chose to con-tinue using the model over the years and have integrated it into how medication reconcil-iation is done at their facility,” she said.
A multidisciplinary model, SERI-OUS shifts the focus of medication rec-onciliation from the accuracy of a list to the needs of a patient, addressing quality as well as safety. “Just because the medication list is accurate, doesn’t mean that it is good,” said Dr. Hoover. “Patients could accurate-ly tell you that they do not take a daily aspirin – and there could be no aspirin on the medication list in the chart; therefore, you would have met the National Patient Safety Goal of accurately reconciling medications.”
“But what if the patient is a dia-betic and should be on a daily aspirin for stroke prevention?” she continued, “that is a ‘quality’ issue, not a safety issue. The SERIOUS model takes the National Patient Safety Goal for overall safe care a step further to improve patient-specific care.” One key further step, taken by phar-macists, was to review patient dosing reg-imens with cardiology staff to “optimize” them to guideline-recommended dosages, when appropriate. By doing this, a suc-cessful partnership has been developed between cardiology and pharmacy – and
has shown a decrease in 30-day readmission rates. “Facility leadership was impressed with the savings from decreased readmissions and patients were excited to finally understand what they were taking and why!” noted Dr. Hoover. “We had patients who would bring rolling suitcases full of pill bottles with them. They were so appreciative of the time we took to educate them about their medications.” “Modern health care is moving to implement standards that can be applied consistently to each patient, while at the same time mov-ing to more a patient-specif-ic, individualized medicine. Although the model fits these principles, my goal was simply to change the process of medication reconciliation from something you do to comply with a mandate, back to something you do because it is right for the patient,” she concluded. VA employees can find more information about this clinic and the VA National Medication Reconciliation Initiative at VA site.
Page 4
Summary of fourth national patient safety survey Continued from page 1
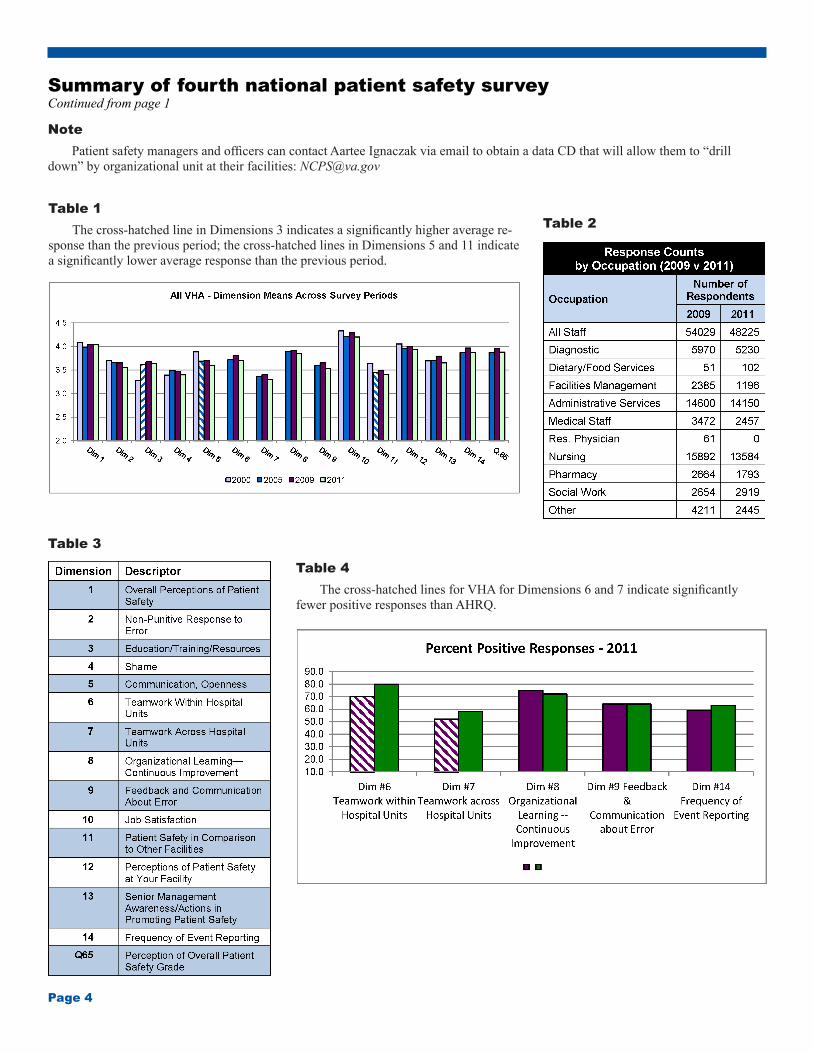
Note Patient safety managers and officers can contact Aartee Ignaczak via email to obtain a data CD that will allow them to “drill down” by organizational unit at their facilities: [email protected]
Table 1 The cross-hatched line in Dimensions 3 indicates a significantly higher average re-sponse than the previous period; the cross-hatched lines in Dimensions 5 and 11 indicate a significantly lower average response than the previous period.
Table 2
Table 3
Table 4 The cross-hatched lines for VHA for Dimensions 6 and 7 indicate significantly fewer positive responses than AHRQ.