topographic history ofthe maui nui complex, hawai'i, … · topographic history ofthe maui nui...
TRANSCRIPT

Topographic History of the Maui Nui Complex, Hawai'i,and Its Implications for Biogeography1
Jonathan Paul Price2,4 and Deborah Elliott-Fisk3
Abstract: The Maui Nui complex of the Hawaiian Islands consists of the islandsof Maui, Moloka'i, Lana'i, and Kaho'olawe, which were connected as a singlelandmass in the past. Aspects of volcanic landform construction, island subsidence, and erosion were modeled to reconstruct the physical history of thiscomplex. This model estimates the timing, duration, and topographic attributesof different island configurations by accounting for volcano growth and subsidence, changes in sea level, and geomorphological processes. The model indicates that Maui Nui was a single landmass that reached its maximum areal extentaround 1.2 Ma, when it was larger than the current island of Hawai'i. As subsidence ensued, the island divided during high sea stands of interglacial periodsstarting around 0.6 Ma; however during lower sea stands of glacial periods,islands reunited. The net effect is that the Maui Nui complex was a single largelandmass for more than 75% of its history and included a high proportion oflowland area compared with the contemporary landscape. Because the HawaiianArchipelago is an isolated system where most of the biota is a result of in situevolution, landscape history is an important detertninant of biogeographic patterns. Maui Nui's historical landscape contrasts sharply with the current landscape but is equally relevant to biogeographical analyses.
THE HAWAIIAN ISLANDS present an idealsetting in which to weigh the relative influences of ecological phenomena (concernedwith local conditions and species interactions)and historical phenomena (concerned withdispersal and speciation) on the compositionof species assemblages. Environmental gradients such as elevation and moisture are veryreadily studied in the Hawaiian Islands, ascompared with many regions. The Islandsalso span a remarkable time line of geo-
I This work was supported by NSF Doctoral Dissertation Improvement Grant no. 9900933 and a grant fromthe ]astro-Shields Foundation at University of California,Davis. Manuscript accepted 1 May 2003.
2 Department of Botany, MRC-166, National Museum of Natural History, Smithsonian Institution, P.O.Box 37012, Washington, D.C. 20013-7012.
3 Department of Wildlife, Fisheries, and Conservation Biology, University of California, Davis, 1 ShieldsAvenue, Davis, California 95616.
4 Corresponding author.
Pacific Science (2004), vol. 58, no. 1:27-45© 2004 by University of Hawai'i PressAll rights reserved
27
logic histories that can be reconstructed moreeasily and accurately than in most regions.Having been extremely isolated in the Pacificsince its inception, the Hawaiian biota hasevolved in situ from a limited number of colonists, achieving very high levels of endemism (Carlquist 1980). Hawai'i's biota istherefore best examined in terms of how current conditions and island history relate tothe dispersal, evolution, and extinction oforganisms.
The Hawaiian Islands are volcanic in origin, going through a life cycle with welldefined stages (Macdonald and Abbott 1970,Moore and Clague 1992). Upon formation onthe seafloor, a volcano grows until it formsa gently sloped volcanic shield above the seasurface. During shield building and for sometime after completion, weight of the volcanicmass on Earth's crust causes it to subside.Despite some postshield volcanism, subsequent erosion and subsidence further reducethe volcano to sea level until it ultimately becomes an atoll or seamount. Volcanoes of theHawaiian Archipelago increase in age to thenorthwest, exhibiting a linear progression of

Ni'ihau - 5.2
28 PACIFIC SCIENCE· January 2004
GKaUa'i-4.7
Lai'anae~3'0
, Ko'olau - 2.6Oahu :A. / £:estMoloka'i _2.0
East Moloka'i - \.8:.to. :A.
Penguin Bank _2.2 /). 2Yest Maui - \.5
_ ,. ~ :A.:A. East Maui - \.2Lana I - 1.5 (Haleakalli)
~Kaho'olawe - 1.2
Hawai'j Hualalai - 0.4
0 50 100 150 200 KilometersI MaunaLoa
(near end of0 25 50 75 100 125 Miles shield-building)
FIGURE 1. Volcanoes of the major Hawaiian Islands. Ages given in myr are from Clague (1996) and reflect the estimated end of the shield-building stage.
these stages (Figure 1). Although this agegradient is the primary historical variable, theislands of Maui, Moloka'i, Lana'i, and Kaho'olawe share a distinct history in havingonce formed a single island, "Maui Nui."
Stearns and Macdonald (1942) first suggested that four islands of the Maui Nuicomplex were conjoined before subsidence.Age and duration of this formation remainedvague, however. Later understanding of sealevel history and bathymetry surrounding theIslands revealed that they were connected recently during the low sea stands of glacialperiods into a landmass referred to as "MauiNui," Hawaiian for "Big Maui" (Macdonaldand Abbott 1970, Nullet et al. 1998). Detailedbathymetry and marine geological exploration made possible by submersible vehiclesilluminated the magnitude of subsidence:areas surrounding the Islands have subsidedas much as 2000 m as evidenced by formershoreline features existing at extreme depths
(Moore 1987). The only estimate of the nature and timing of changes in Maui Nui'sconfiguration due to subsidence is that byCarson and Clague (1995). They postulatedthe following sequence: (1) Penguin BankVolcano was connected to the island of O'ahuvia a land bridge; (2) newer volcanoes in theMaui Nui complex coalesced with older ones,ultimately forming a single landmass largerthan the current island of Hawai'i; (3) assubsidence ensued, submerging saddles between its volcanoes, this landmass graduallydivided into separate islands as Moloka'ilLana'i separated from Maui/Kaho'olawe lessthan 300,000 to 400,000 years ago (ka); and(4) finally, the complex consisted of four discrete islands by less than 100 to 200 ka.However, concurrent with these events, sealevel changes reunited the fragments periodically, as pointed out by Asquith (1995). Thus,multiple processes have resulted in a complexhistory.

Topographic History of the Maui Nui Complex . Price and Elliott-Fisk 29
Our current understanding of volcanism,subsidence, and sea-level change, along withadvances in submarine surveying and available Geographic Information System (GIS)technology, makes possible a detailed reconstruction of how the spatial and topographiccharacteristics of the Maui Nui complex havechanged over time. Also, because climate inthe Hawaiian Islands is largely a functionof topographic attributes of an island (e.g.,height of mountain masses, aspect with respect to weather systems), details of pasttopographic attributes should help resolveclimate history, thus further enhancing understanding of evolutionary history. Thecomplex history presented here provides aframework on which to base detailed biogeographical hypotheses.
MATERIALS AND METHODS
The first step in modeling past landscapesof the Maui Nui complex is accurate compilation of geographic data. Topographicand bathymetric (seafloor topography) datawere obtained from several sources. Highprecision sonar data were supplied by JamesGardner (U.S. Geological Survey, MenloPark, California) and David Clague (Monterey Bay Aquarium Research Institute, MossLanding, California). A less detailed but morespatially extensive composite data set camefrom the University of Hawai'i, School ofOcean and Earth Science and Technology.This was used for areas where detailed sonardata were unavailable or had sparse coverage,as well as for all areas above sea level. Thearea between Moloka'i and Lana'i was notaccurately represented by any data set, and sospot depths from a National Oceanic and Atmospheric Administration nautical chart wereused; the lower precision of these data is acceptable given the shallow depth of the area(<100 m), which makes them sufficiently accurate. In scattered locations, elevations wereinterpolated from nearby data in small areaswhere no accurate data were available. Alldata to be used were compiled into a digitalelevation model (DEM) using the GIS software ArcInfo (Environmental Systems Research Institute 1999). This consisted of a
grid of values representing the elevation ateach point, the resolution (lateral spacing ofpoints) of which was 300 m.
Key features were identified from this baseDEM in conjunction with published sourcesand consultation with geologists (DavidClague, David Sherrod). These features, including former shorelines and volcanic features, defined five components of a compositemodel, each detailing a given physical characteristic or process. The major componentsof the model are as follows: (1) assessmentof age and spatial distribution of volcanicshields; (2) reconstruction of East Maui's(Haleakala Volcano) topography before andafter extensive postshield volcanism; (3) estimation of the extent and timing of majorerosion and landslides; (4) determination ofthe timing and spatial variability of tectonicsubsidence; and (5) consideration of glacioeustatic sea-level change. The overall modeladjusts the base DEM by accounting for theprocesses in each component to create newDEMs approximating the topography of theMaui Nui complex through time. Each component is detailed here.
Shield-Building Volcanism
Volcanoes in the Hawaiian Islands form inresponse to hot-spot magmatism deep belowthe lithosphere. As a volcano is moved awayfrom the hot spot by motion of the Pacifictectonic plate, it ceases volcanic activity and anew vent forms (Wilson 1963). Thus a chainof volcanoes forms along the direction ofplate motion, with younger volcanoes nearthe position of the hot spot. As volcanoesemerge above the sea surface, they form agently sloping volcanic shield composed oftholeiitic basalt. The period from when a newvolcano breaks the sea surface to the end ofshield building is estimated to last betweenabout 0.5 million yr (myr) (Moore andClague 1992) and 1.0 myr (Guillou et al. 2000).Available radiometric ages of tholeiitic lavascome from different points within this stage,including some that may have been emplacedlong after the majority of a shield edifice hadbeen constructed. We have chosen to useClague's (1996) age estimates, derived from
30
an empirical model based on the most reliable radiometric dates, because they representapproximations of when the bulk of eachshield's mass had accumulated. We thereforerefer to shield building as a structural, ratherthan a mineralogical, phase. Because volcanoes experience a sequence of tectonic, volcanic, and geomorphic processes after shieldformation, this age is a reference point for theinitiation of that sequence.
The seven volcanoes of the Maui Nuicomplex completed shield building between2.2 million yr ago (Ma) for Penguin BankVolcano and 1.2 Ma for Haleakala andKaho'olawe Volcanoes. Because each volcanic shield overlies large parts of previouslyformed volcanoes, it is impossible to reconstruct the shapes of volcanic surfaces thathave been covered. A detailed and quantitative model can only encompass the time afterHaleakala and Kaho'olawe Volcanoes (theyoungest in the complex) completed shieldbuilding (1.2 Ma), with the prior history being general and descriptive. The 1.2-myr ageis probably well substantiated for Haleakala,because reliably dated subaerial shield orearly postshield lavas (Honomaml Volcanics[Stearns and Macdonald 1942]) are as old as1.1 myr (Chen et a1. 1991). For Kaho'olawepostshield lavas are as old as 1.15 myr (Fodoret a1. 1992).
Late-Stage Volcanism
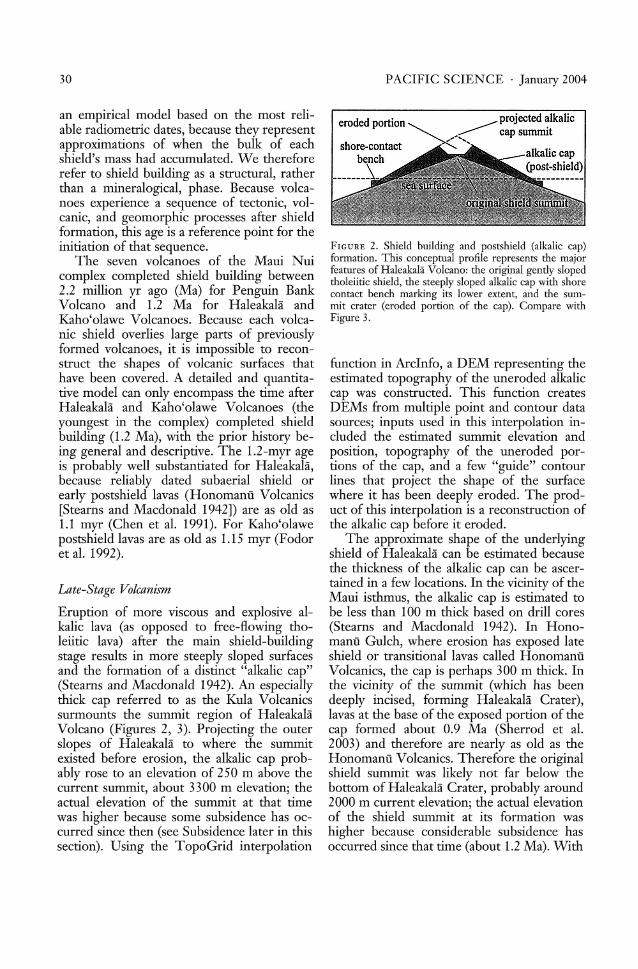
Eruption of more viscous and explosive alkalic lava (as opposed to free-flowing tholeiitic lava) after the main shield-buildingstage results in more steeply sloped surfacesand the formation of a distinct "alkalic cap"(Stearns and Macdonald 1942). An especiallythick cap referred to as the Kula Volcanicssurmounts the summit region of HaleakalaVolcano (Figures 2, 3). Projecting the outerslopes of Haleakala to where the summitexisted before erosion, the alkalic cap probably rose to an elevation of 250 m above thecurrent summit, about 3300 m elevation; theactual elevation of the summit at that timewas higher because some subsidence has occurred since then (see Subsidence later in thissection). Using the TopoGrid interpolation
PACIFIC SCIENCE· January 2004
eroded portion projected ~1kalic~~ cap summit
shore-contact ' -- Ik I'b h a a Iccap
_______e~~ (post-shield)
FIGURE 2. Shield building and postshield (alkalic cap)formation. This concepmal profile represents the majorfeamres of Haleakala Volcano: the original gently slopedtholeiitic shield, the steeply sloped alkalic cap with shorecontact bench marking its lower extent, and the summit crater (eroded portion of the cap). Compare withFigure 3.
function in ArcInfo, a DEM representing theestimated topography of the uneroded alkaliccap was constructed. This function createsDEMs from multiple point and contour datasources; inputs used in this interpolation included the estimated summit elevation andposition, topography of the uneroded portions of the cap, and a few "guide" contourlines that project the shape of the surfacewhere it has been deeply eroded. The product of this interpolation is a reconstruction ofthe alkalic cap before it eroded.
The approximate shape of the underlyingshield of Haleakala can be estimated becausethe thickness of the alkalic cap can be ascertained in a few locations. In the vicinity of theMaui isthmus, the alkalic cap is estimated tobe less than 100 m thick based on drill cores(Stearns and Macdonald 1942). In Honomanu Gulch, where erosion has exposed lateshield or transitional lavas called HonomanuVolcanics, the cap is perhaps 300 m thick. Inthe vicinity of the summit (which has beendeeply incised, forming Haleakala Crater),lavas at the base of the exposed portion of thecap formed about 0.9 Ma (Sherrod et a1.2003) and therefore are nearly as old as theHonomanu Volcanics. Therefore the originalshield summit was likely not far below thebottom of Haleakala Crater, probably around2000 m current elevation; the actual elevationof the shield summit at its formation washigher because considerable subsidence hasoccurred since that time (about 1.2 Ma). With

Topographic History of the Maui Nui Complex . Price and Elliott-Fisk 31
it contacts the shore, a bench marks the loweredge of the alkalic cap. Below the base of thisbench, slopes are more modest and probablyrepresent the shape of the original tholeiiticshield because the alkalic cap is probably thinthis far from the summit. Again, using theTopoGrid interpolater, a DEM representingthe original shape of the shield was created.Confining the interpolation to the estimatedarea of the alkalic cap, inputs included theestimated position and elevation of the shieldsummit and "guide" contour lines representing projected slopes, based on slopes belowthe base of the cap.
The bulk of Haleakala's alkalic cap hadformed by about 0.4 Ma, after which volcanicactivity slowed dramatically (Sherrod et a1.2002). For the sake of simplicity, a lineargrowth function for the alkalic cap was used.This entailed creating intermediate DEMswhose elevation values were calculated as alinear transition from the original shield 1.2Ma to the fully formed alkalic cap 0.4 Ma.Thus, the rate of vertical growth at the summit is estimated to have been 1300 m in 0.8myr, or 1.6 mm/yr, and slower toward theedges of the cap, where volcanic depositionwas less. Adjusted DEMs were calculated atintervals of 0.01 myr (10,000 yr) during thatperiod. Again, this growth in the summitregion was countered by subsidence, whichentails further adjustment of the DEM (discussed later).
o 5 10 15 20 25 Kilometers 0 10 15 Miles- - - --==-- Erosion and Landslides
FIGURE 3. Map of changing topography of Haleakalasummit. Contour interval 200 m. A, Current topography;B, reconstructed alkalic cap (0.4 Ma); C, estimated original tholeiitic shield (1.2 Ma). These models representelevation relative to present and do not account fortectonic subsidence. Changes in bathymetry/topographyoutside the extent of the alkalic cap are not considered.
the alkalic cap summit at 3300 m and theoriginal shield summit at 2000 m elevation,the thickness of the alkalic cap around thesummit was about 1300 m. Therefore the alkalic cap is thickest near the summit andgradually thinner with greater distance fromthe summit. Because lava cools quickly when
Over long time periods, erosion is an important factor in changing the topography of anisland. Erosion is difficult to model becausethere is no accurate way to determine thetiming and magnitude of all events. Mostvolcanoes in the Maui Nui complex havenot undergone erosion substantial enough togreatly alter their original volcanic slopes.Two exceptions to this are East Moloka'i,which experienced a major landslide and subsequent accelerated erosion, and Haleakala,which, though otherwise intact, experiencedrapid and deep erosion of its summit area.
East Moloka'i's topography was altereddramatically by a massive landslide that re-

32
moved much of the north slope of thevolcano (Moore et al. 1989). This likely occurred around the time of the completion ofshield building, because canyons that formedabove the sea surface after the slope failureextend to considerable depth, having subsidedover a long period of time. The creation of anunstable, oversteepened slope probably accelerated erosion, substantially lowering thesummit elevation. Although it is possible toestimate the shield's shape before the landslide and subsequent erosion, these eventsoccurred early in the postshield history ofEast Moloka'i and therefore before the startof the detailed model.
An easily reconstructed scenario exists forHaleakala Crater, which is an erosional feature. Because lavas were deposited on theouter slopes as recently as 0.15 Ma, thereprobably was no prominent summit erosionalfeature at that time, because lavas originatingat the summit would have flowed into thecrater rather than on the outer slopes. Lavasthat flowed out of the summit depression areas old as 0.12 myr (Sherrod et al. 2002).Therefore, there was a very brief period during which the summit likely eroded: beforethat period, lavas flowed outside the slopes,and after that, lavas flowed into the floor ofthe depression and down to the coast. Therefore it appears that the crater was formed asa series of catastrophic landslides that continued to incise the summit once an unstableslope was formed. The resulting erosion reduced the summit by 250 m and created adepression 600 m deep. Because the episodicnature of the landslides cannot be dated precisely, modeling this reduction is most simplyrepresented by a linear function. IntermediateDEMs were calculated as a linear transitionfrom the fully formed alkalic cap 0.15 Ma tothe elevation values of the base DEM 0.12Ma at intervals of 0.01 myr.
Subsidence
Throughout the growth of a volcano and forsome time after completion of its shield,weight on the thin oceanic crust causes thevolcano to subside. During shield building,rapid growth outpaces subsidence and there
PACIFIC SCIENCE· January 2004
is a net increase in height and area. However, when shield building ceases, net subsidence submerges many areas formerly abovesea level. There are also some circumstanceswhen uplift may occur. When giant landslidesremove large portions of a volcano's mass(around the end of shield building), isostaticrebound may occur, resulting in uplift of perhaps up to 100 m (Smith and Wessel 2000).Muhs and Szabo (1994) demonstrated thatO'ahu (long past shield building) has recentlyuplifted at a very low rate due to compensational lithospheric flexure in response to regional subsidence in the vicinity of Hawai'i.Both of these modes of uplift are modest incomparison with the rate and magnitude ofsubsidence, and probably have occurred littlein the Maui Nui complex during the periodcovered in detail by this model.
A number of subsidence rate estimates arebased on examination of recent changes intide gauge measurements. A 38-yr recordfrom a tide gauge in Hilo, on the currentlysubsiding island of Hawai'i, indicated a netsubsidence rate (after accounting for sea-levelchange) of 2.4 mm/yr. In Kahului, Maui, thetide gauge indicates very little subsidence (0.3mm/yr); thus the Haleakala Volcano (whoseage is 1.2 myr) essentially has completed itssubsidence stage (Moore 1987).
Tide gauges indicate the rate of subsidencefor only one site over a very brief period oftime, however. A longer-term estimate hasbeen determined by examining the ages of aseries of submerged coral reefs. Campbell(1984) proposed that, on a subsiding surface,coral reefs could only grow during periodswhen sea level was dropping, because that isthe only time that the relative position of theshore remains constant; he derived a rate ofsubsidence of 2.0 mm/yr based on a uraniumseries age of a reef northwest of Hawai'i.Moore and Fornari (1984) used estimates ofthe timing of low sea stands (Chappell 1983)to assign ages to different coral reefs and thenused these ages and the depths of the reefs toderive a subsidence rate of 1.8 to 3.0 mm/yrwest of the island of Hawai'i. Moore andCampbell (1987) used similar methods to derive subsidence rates of 2.5 mm/yr northwestof Hawai'i and 3.0 mm/yr west of Lana'i. The

Topographic History of the Maui Nui Complex . Price and Elliott-Fisk 33
drawback to this method is that the ages ofsubmerged reefs are assumed from sea-levelestimates. Because Lana'i completed shieldbuilding around 1.5 Ma, the assigned ages ofthe nearby reefs at 0.65-0.35 myr are probably too young. Uranium-series radiometricdates of several reefs northwest of Hawai'iyield a subsidence rate of about 2.6 mm/yr(Ludwig et al. 1991). Electron spin resonancedating of reefs between Maui and Hawai'iyield a subsidence rate of 3-4 mm/yr southof Maui (Jones 1995); however, the age estimates for these reefs are too young, considering their depths and the time Haleakalacompleted shield building. Thus, the onlyreliable subsidence rates based on coral reefsare those near Hawai'i, which are comparablewith the tide gauge estimate of 2.4 mm/yr.
A rough but long-term estimate of the rate
of subsidence can be determined from closeexamination of a feature referred to as thebreak-in-slope. Lava extruded underwater iscooled quickly, forming a steep slope, butthat extruded subaerially (above the sea surface) cools more slowly, remaining fluidlonger and forming more gentle slopes; thusthere is a sharp transition between submarineand subaerial lavas, manifested as a breakin-slope, that demarcates the maximum extent of the shoreline before shield buildingwaned and subsidence submerged the feature(Moore 1987). There are several breaks-inslope associated with volcanoes of differentages. The most notable of these are the Hand K terraces associated with Haleakala(East Maui) and East Moloka'i Volcanoes,respectively (Figure 4) (Moore 1987). Theseterraces, representing the maximum extents
~-..( ',Moloka'i landslideI •
/Ii breaks·in-slope
,...., prominent coral reefs
20 0~
20 40 60 80 100 Kilometers 20I j
o 20 40 60 MilesI
FIGURE 4. Submerged geologic features. Contour interval is 500 m. Heavy lines show approximate location of breaksin-slope associated with different volcanoes. Gray areas below sea level represent deeply submerged reefs. The dashedline outlines the massive landslide north of Moloka'i. Line A-A' represents the transect of the profile in Figure 5. Thenaming convention for different breaks-in-slope (terraces) is as follows: M, Mahukona/Kohala; H, Haleakala (EastMaui); K, East Moloka'i; L, Lana'i; W, West Moloka'i.

34 PACIFIC SCIENCE· January 2004
M terrace
_(Mahukona-
Kohala)
H terrace
4000
3000
2000,.-..
'"l.QJ....QJ 1000e'-'
-=....Q.
0QJ"t:l-..C0
+:: -1000c::~
L terraceQJ
~ ~ (Uina'i)K terrace (E. Maui)-2000
(E. Moloka'i) N. side of ridge
-3000 -t----------,----r---.---------,r-----r---,
oA
25 50 75 100
Distance (km)
125 150
A'
FIGURE 5. Profile offeatures from Figure 4 projected into vertical plane along transect line A-A'. Vertical exaggerationis 15 times. Major breaks-in-slope indicated by heavy line labeled according to naming convention from Figure 4.
of the shorelines of their associated volcanoes, formed at the end of shield building ofeach volcano.
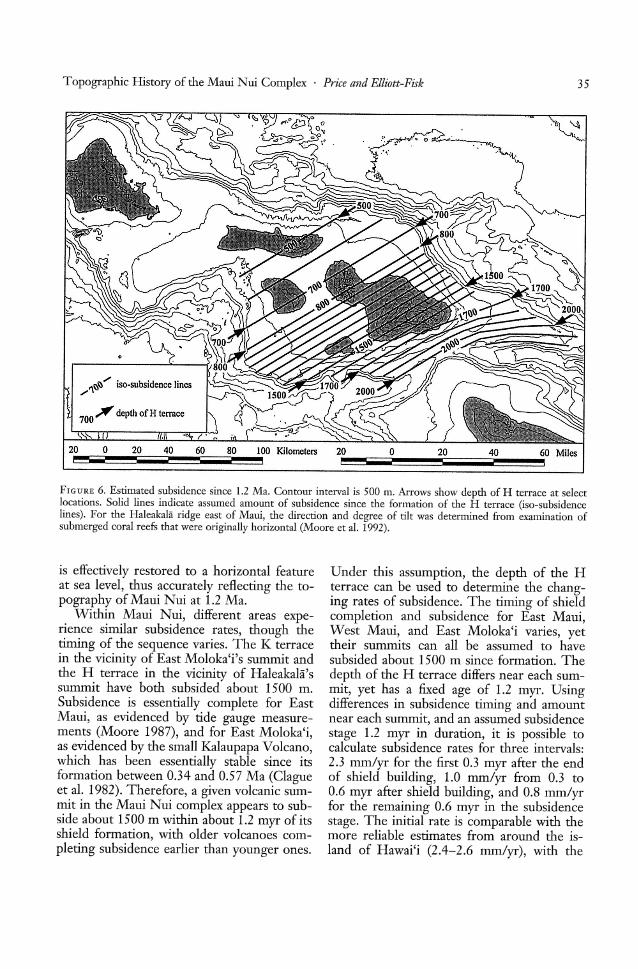
An important aspect of subsidence is that itvaries spatially. The H terrace is about 500 mdeep near Moloka'i but is over 2000 m deepeast of Maui, meaning that this originallyhorizontal feature has tilted as it subsided(Figure 5). This tilt is a function of fastersubsidence rates occurring closer to the current zone of volcanic loading and slower ratesin areas farther from the hot spot (Moore1987). The direction of tilt is approximatelysoutheast toward the island of Hawai'i, parallel to the trend of volcanic propagation, except for the Haleakala Ridge east of Maui,which tilts in a more southerly direction(which is again toward Hawai'i) (Moore et al.1992). Depth of the H terrace at a given
location indicates how much subsidence hasoccurred since its formation 1.2 Ma. Usingthese depths, a map was created to show theamount of subsidence that has occurred indifferent areas since that time by constructing lines of equal subsidence perpendicularto the tilt direction (Figure 6). It is likely thatthe middle of the ridge subsided more thanthe edges (where the depth of the H terracerecords the amount of subsidence); however,this difference is probably relatively minorand cannot be determined accurately. Theassumed iso-subsidence lines were interpolated into a grid of gradually varying valuesrepresenting how much subsidence has occurred at a given grid location since 1.2 Ma("subsidence amount grid"). By simply adding this grid of values to the adjusted DEMrepresenting the original shield, the H terrace
Topographic History of the Maui Nui Complex . Price and Elliott-Fisk 35
700-'depth ofH terrace
,,/\r::.r::.'" iso-subsidence lines
20 0p--s;;;
20 40 60 80 100 Kilomctcrs 20I i
40 60 Milesi
FIGURE 6. Estimated subsidence since 1.2 Ma. Contour interval is 500 m. Arrows show depth of H terrace at selectlocations. Solid lines indicate assumed amount of subsidence since the formation of the H terrace (iso-subsidencelines). For the Haleakala ridge east of Maui, the direction and degree of tilt was determined from examination ofsubmerged coral reefs that were originally horizontal (Moore et ai. 1992).
is effectively restored to a horizontal featureat sea level, thus accurately reflecting the topography of Maui Nui at 1.2 Ma.
Within Maui Nui, different areas experience similar subsidence rates, though thetiming of the sequence varies. The K terracein the vicinity of East Moloka'i's summit andthe H terrace in the vicinity of Haleakala'ssummit have both subsided about 1500 m.Subsidence is essentially complete for EastMaui, as evidenced by tide gauge measurements (Moore 1987), and for East Moloka'i,as evidenced by the small Kalaupapa Volcano,which has been essentially stable since itsformation between 0034 and 0.57 Ma (Clagueet al. 1982). Therefore, a given volcanic summit in the Maui Nui complex appears to subside about 1500 m within about 1.2 myr of itsshield formation, with older volcanoes completing subsidence earlier than younger ones.
Under this assumption, the depth of the Hterrace can be used to determine the changing rates of subsidence. The timing of shieldcompletion and subsidence for East Maui,West Maui, and East Moloka'i varies, yettheir summits can all be assumed to havesubsided about 1500 m since formation. Thedepth of the H terrace differs near each summit, yet has a fixed age of 1.2 myr. Usingdifferences in subsidence timing and amountnear each summit, and an assumed subsidencestage 1.2 myr in duration, it is possible tocalculate subsidence rates for three intervals:2.3 mm/yr for the first 0.3 myr after the endof shield building, 1.0 mm/yr from OJ to0.6 myr after shield building, and 0.8 mm/yrfor the remaining 0.6 myr in the subsidencestage. The initial rate is comparable with themore reliable estimates from around the island of Hawai'i (2.4-2.6 mm/yr), with the

36
g 200..'l:l
~ 150='",g~ 100'c.;8t 50...c=e O..,::.--,.---..----r---..,..-----.< 0 0.3 0.6 0.9 1.2 1.5
Time remaining in subsidence stage (m.y.)
FIGURE 7. Subsidence rates/stages. The sequence hereaccounts for the changing rate of subsidence. Assumingthat the Maui Nui complex has completed subsidence,the known amount of subsidence in the last 1.2 myr isessentially a measure of where a given point was in thesubsidence sequence at that time. This was then used todetermine the changing rate of the subsidence between1.2 Ma and the present.
subsequent rates indicating that subsidenceslows over time. These rates were compiledinto the sequence shown in Figure 7. Thissequence serves as a way to determine howthe elevation at a location changes from thatestimated for 1.2 Ma to that at present.
The amount of subsidence estimated tohave occurred at a given location since 1.2 Ma(calculated for each location as the "subsidence amount grid") essentially marks wherein the subsidence sequence the location wasat that time. Assuming that each location experiences the same transition of rates withdifferent timing, the sequence in Figure 7 indicates how a location transitioned from itsposition in the sequence at 1.2 Ma to its current position with subsidence complete. Forexample, areas that subsided 500 m since1.2 Ma were assumed simply to subside at arate of 0.83 mm/yr until reaching their current elevation with subsidence complete. Onthe other hand, locations that subsided 1500m since 1.2 Ma were estimated to go throughthe sequence of rates in Figure 7, having justreached their current elevation after completing the subsidence sequence.
To account for subsidence, the adjustedDEM representing the appropriate amountof alkalic cap formation and erosion is de-
PACIFIC SCIENCE· January 2004
termined for each point in time. A secondadjustment for subsidence was made foreach location based on (1) the point in timebeing considered, (2) that location's positionin the subsidence sequence at 1.2 Ma, and(3) the sequence of rates from Figure 7.Between 1.2 Ma and the present, at intervals of 0.01 myr (10,000 yr) the appropriateadjusted DEM was adjusted further for theappropriate amount of subsidence; in total,120 topographic models were calculated.These models incrementally transition fromthe presubsidence and prealkalic cap modelfor 1.2 Ma to the current topographic settingof completed subsidence and a fully formedand eroded alkalic cap.
Sea-Level Change
The extent of continental glaciation causesglobal sea level to fluctuate over time. Thecurrent interglacial sea stand is relativelyhigh, but sea level was considerably lowerthan at present during the last glacial maximum around 20-21 ka (Fairbanks 1989). Sealevel change influenced the landscape of MauiNui by changing its land area and by influencing when islands were connected or isolated. Actual sea level in the past is difficultto ascertain in a tectonically dynamic regionsuch as Hawai'i. An approximation of sealevel can be derived from oxygen isotope ratios in Foraminifera from seafloor sedimentcores, which are largely a function of globalice volume and sea-surface temperature. Theisotope record in Figure 8 is from OceanDrilling Project (ODP) site 849 (Mix et al.1995) and indicates the timing of major glacial and interglacial extremes. To avoid a falseappearance of precision, the area of the MauiNui complex was estimated for typical interglacial sea stands at current sea level andfor typical glacial maximum sea stands at120 m below present (an approximationwithin the range of estimates available) toshow the minimum and maximum possibleland area during a given period. Actual landarea fluctuated between these two extremesaccording to the timing of glacial events. Toestimate when islands were connected or isolated, the elevations of the saddles between

Topographic History of the Maui Nui Complex' Price and Elliott-Fisk 37
3
3.2
3.4
3.6
,-... 3.8<:>
~ 40
oc
'<l 4.2
4.4
4.6
4.8
5
5.2
0 0.2 0.4 0.6 0.8 1.0
Age (Ma)
1.2 1.4
FIGURE 8. Timing of glacial cycles since 1.4 Ma. Oxygen isotope record for benthic Foraminifera in Ocean DrillingProject (ODP) core 849 from the eastern equatorial Pacific (Mix et al. 1995). Peaks represent periods with high sealevels comparable with present levels; low points indicate glacial periods when sea level was around 120 m lower. Giventhe many uncertainties of sea-level estimation, this serves as a way to determine the approximate timing of major sealevel changes over the given period.
volcanoes, which lowered as subsidence ensued, were examined in the context of likelysea levels associated with the timing of eventsin Figure 8.
RESULTS
Maui Nui Complex before 1.2 Ma
Because Haleakala Volcano overlies much ofthe original shield surfaces of older volcanoesin the Maui Nui complex, the topographichistory of the complex before Haleakala'sformation is speculative. Penguin Bank, theoldest volcano in the Maui Nui complex,was connected to O'ahu when it originallyformed (Carson and Clague 1995). Takinginto account the depth of the break-in-slopeassociated with Penguin Bank (1100 m), indicating the amount of subsidence since itsformation, and the depth of the saddle between Penguin Bank and O'ahu's Ko'olau
Volcano (600 m), the saddle was probablyabout 500 m above sea level at its maximumaround 2.2 Ma. In addition, West Moloka'i'sbreak-in-slope (W terrace) extends west toO'ahu, indicating that when it formed around2.0 Ma it was also connected. There was abroad plain connecting O'ahu and WestMoloka'i, though the elevation of the saddleconnecting them was perhaps only 200 m atits maximum. The resulting island (whichmight appropriately be called "O'ahu Nui")had an area probably in excess of 7000 km2
•
Given the maximum elevations of the saddlesand probable rates of subsidence when thesefeatures formed (at least 2.0 mm/yr), thePenguin Bank-O'ahu saddle probably submerged around 2.0 Ma, and the West Moloka'i-O'ahu saddle perhaps 1.9 Ma. Thus, theO'ahu-Maui Nui connection probably lastedonly 0.3 myr or so.
By the time East Moloka'i completed itsshield building at 1.8 Ma, Maui Nui was a

38 PACIFIC SCIENCE· January 2004
E
distinct island consisting of three fully formedvolcanoes (Penguin Bank, West Moloka'i,and East Moloka'i), with West Maui andU.na'i Volcanoes probably in their earlyshield-building stages. Even after the massive landslide on East Moloka'i's north flank,this island was probably larger than 5000 km2
,
with East Moloka'i rising to a summit ofabout 3000 m. Gradually, Lana'i, West Maui,East Maui (Haleakala), and Kaho'olawe Volcanoes formed as the older volcanoes in thecomplex subsided. By the time HaleakalaVolcano finished shield building around 1.2Ma, Maui Nui was at its maximum size.
Area ofthe Maui Nui Complex
The changing area of the Maui Nui complexsince its maximum extent is summarized inFigure 9. Both a higher estimate assuming aglacial-period low sea stand and a lower estimate assuming an interglacial-period high seastand are shown. Penguin Bank is overlain bya thick coral cap about 500 km2 in extent,which formed gradually over a shield whoseoriginal topography is unknown; therefore,Maui Nui's area before the formation of thecoral may be overestimated by as much as 500km2• Maui Nui's area at its maximum extent(around 14,000 km2) exceeded that of thecurrent "Big Island" of Hawai'i (10,458 km2).
FIGURE 9. Summary of Maui Nui history. For each 0.2myr interval, the approximate range of variation in thearea and configuration of islands around that time issummarized. Black shading represents land area duringhigh sea stands of interglacial periods, gray shading represents area during low sea stands of glacial periods. A,Around 1.2 Ma: single landmass; 14,000-14,600 km2 ;
Haleakala about 3500 m. B, Around 1.0 Ma: single landmass; 9800-11,400 km2; Haleakala about 3500 m. C,Around 0.8 Ma: single landmass; 7100-9000 km2
; Haleakala about 3500 m. D, Around 0.6 Ma: single landmassduring low sea stands, two landmasses during high seastands; 5500-7700 km 2; Haleakala about 3500 m. E,Around 0.4 Ma: single landmass during low sea stands,three landmasses during high sea stands; 4200-6800 km2 ;
Haleakala about 3500 m. P, Around 0.2 Ma: single landmass during low sea stands, four landmasses during highsea stands; 3400-6100 km2; Haleakala about 3400 m. G,Last glacial cycle: two landmasses during low sea stands,four landmasses during high sea stands; 3100-5900 km2 ;
Haleakala about 3000 m.
F
G
50 100
50 100 Miles__-=====:::::JI
a
a
Topographic History of the Maui Nui Complex . Price and Elliott-Fisk 39
As the Maui Nui complex subsided over thepast 1.2 myr, its area diminished greatly, despite some fluctuation with sea-level changes.It is likely that the current four islands compose the smallest area (3037 km2) that theMaui Nui complex has occupied in the last 2myr. Even during the last glacial maximum(as recently as 20-21 ka), Maui Nui's area(5900 km2
) was nearly twice what it is currently.
Timing ofSeparation
Islands are isolated when the saddle betweentwo volcanoes is submerged by subsidenceand/or rising sea level. By accounting forthese processes, the topographic models produce rough estimates of when Maui Nui isolation events occurred. Since 1.2 Ma, the firstconnection to be submerged was that between West Moloka'i and Penguin Bank,probably over 1 Ma, but this reconnected repeatedly during low sea stands, particularly asthe coral platform approached its current extent. East Moloka'i and West Maui developeda permanent embayment between them perhaps around 0.7 Ma, but both remained connected via Lana'i as recently as the last glacialmaximum. The saddle between East Moloka'iand Lana'i first submerged around 0.6 Ma butreemerged during glacial periods since thattime. Similarly, the saddle between Lana'iand West Maui submerged around 0.4 Maand has reemerged during glacial periods.The isthmus between East and West Mauihas probably remained emergent since Haleakala's formation: no sea stand has beenhigh enough in recent history to submerge it,and it has been experiencing subsidence thathas probably slowed only recently. Thereforeits elevation relative to sea level is probablynow as low as it has ever been. The saddlebetween East Maui and Kaho'olawe probablyfirst submerged around 0.2 Ma. Although itmay have reconnected during the penultimateglacial maximum around 150 ka, it has subsided enough so that during the last glacialmaximum Kaho'olawe was not connected tothe other Maui Nui islands.
Viewing the topographic models in thecontext of probable sea levels, it appears that
over the last 1.2 myr all four of the Maui Nuiislands have been connected into a singlelandmass more than 75% of the time. TheMaui Nui complex comprised substantiallyseparate islands between five and seven times(during interglacial periods), though thesewere all fairly recent, occurring in the last0.6 myr, and were minimal in duration, lasting only 0.05 myr (50 kyr) at most. The current configuration of four separate islands istherefore an unusual state in the context ofthe last 1.2 myr. These results differ somewhat from those of Carson and Clague (1995)discussed earlier because their analysis wasspeculative and did not entail a quantitativespatial model like the one presented here.The most substantial differences are that theages of initial isolation given here are somewhat older than those of Carson and Clagueand that recent connections involving sealevel are considered in detail in this model.
Topography
The topography of Maui Nui at its maximumextent (around 1.2 Ma) differed greatly fromthat of Hawai'i (Figure 10). Maui Nui hadmuch more lowland below 1000 m than Hawai'i (77% compared with 49%), suggestingthat Maui Nui's climate at that time differedfrom Hawai'i's. Even after subsidence wasessentially complete, during low sea standsof recent glacial periods, 90% of Maui Nui'sarea was below 1000 m, as compared with85% at present. Therefore the Maui Nuicomplex has been composed of extensivecontiguous lowlands with less extensive andmore isolated uplands.
The detail of the model in the vicinityof Haleakala's summit allows a fairly accurate reconstruction of its elevation over time.Considering the amount of subsidence estimated to have occurred in the summit region(1500 m) and the current elevation of theoriginal volcanic shield summit (about 2000m), Haleakala's height at the completion ofshield building was probably in the vicinityof 3500 m. This is considerably less thanthe estimate of 5000 m (Moore and Clague1992), which did not account for the timingof alkalic cap formation or the spatial varia-

40 PACIFIC SCIENCE· January 2004
Maui Nui - 1.2 Ma
Maui Nui - Last Glacial Maximum (20-21 ka)
~~~,( ;;;-" ',/" "f"'-/ ~,,-~,-~~ I ;\-,. r'-~"
~ '1' '~ ~ "\ '-,) " r?iJ: ~'-J-~\. ~)
/ o~__~'----~]
Maui Nui - Present
o 25 50 75 100 125 150 Kilometersi
oi
25 50 75 100 Miles
FIGURE 10. Topography of Maui Nui and Hawai'i. Contour interval 500 m. Maui Nui's topography shown at maximum extent, at the last glacial maximum, and at present. Current topography of Hawai'i shown for comparison.
tion in subsidence. As subsidence occurred,the alkalic cap was added to the summit;because these rates were roughly comparable, the summit elevation probably did notchange greatly while the alkalic cap was beingformed. Considering fluctuations of sea leveland the episodic nature of the alkalic capformation, the summit elevation probablyvaried between 3300 and 3700 m from 1.2 to0.4 Ma. After that, the summit lowered to itscurrent height only in the last 0.15 myr as iteroded.
DISCUSSION
Climate
With more lowland area, Maui Nui at itsmaximum extent probably had more land areain warmer temperature regimes than the current island of Hawai'i, which has large areas
of cooler montane, subalpine, and alpine climates. For the current interglacial climate,the dominant feature of Hawaiian climates isnortheasterly trade winds that deposit highamounts of rainfall on windward mountainslopes, leaving leeward slopes relatively dry(Giambelluca and Schroeder 1998). Becausethe saddles between Maui Nui volcanoeswere lower than those currently on Hawai'i,trade wind-driven orographic rainfall mayhave formed a somewhat discontinuous rainforest belt on Maui Nui's windward slopes,gradually becoming more patchy as the saddles subsided to their current positions nearsea level. It is also likely that Maui Nui waslarge enough to generate localized land-seaorographic rainfall as occurs today on theisland of Hawai'i; on the west and southeast slopes of Mauna Loa, where trade windsare blocked, heating of the land surfacedraws moisture-laden air up the slopes of
Topographic History of the Maui Nui Complex . Price and Elliott-Fisk 41
the mountain, generating convectional rainfall that is sufficient to create a rain-forestclimate in those otherwise leeward regions(Giambelluca and Schroeder 1998). Maui Nuiprobably also had such leeward rain-forestregions on the south and west slopes of theisland.
It is unclear how Maui Nui's topographyat its maximum extent would have influenced climate during glacial periods. Gavenda(1992) summarized evidence for Hawaiianpaleoclimates and concluded that glacial periods were generally cooler and wetter thanat present. Recent palynological work byHotchkiss (1998) and Hotchkiss and Juvik(1999) indicated that during glacial periods,trade wind inversion (the top of the cloudlayer and thus the upper limit of rain forest)lowered considerably, in association withwidespread cooling of 3-5°C. In addition, ageneral weakening of trade winds and/or decrease in moisture capacity of the associatedair mass resulted in generally drier conditionsthan present for areas that are currently intrade wind rain-forest regions, suggesting reduced rain-forest area. Influence of thesechanges on convectional rainfall is uncertain.Maui Nui's greater area at its maximum extent, coupled with weaker trade winds, mayhave allowed more uneven heating and thusgreater convectional rainfall; however, decreased temperature and lower moisture content in air masses may have diminished thistype of precipitation.
During recent glacial periods, the MauiNui complex had topography similar to thatat present but included an extensive lowlandbetween major volcanoes that is not presenttoday. The resulting difference may have hadlittle influence on trade wind-generated precipitation, though this was likely diminished,as discussed earlier. There may have beensome convectional precipitation due to diminished trade winds and greater land areaavailable for heating, although again it is unclear how glacial climates influenced this typeof precipitation. However, with glacial-periodclimates generally drier, and with discontinuous mountain masses for orographic uplift,the lowland area connecting the volcanoes ofthe Maui Nui complex probably had a rela-
tively dry climate at that time. Therefore, atleast for the past 0.5 myr or so, the rain-forestregions of the Maui Nui complex have likelybeen discontinuous and more arid climateregions may have been more contiguous andextensive, particularly during low sea standsof glacial periods when islands were connected.
Estimates of Haleakala's summit elevationcan be used to address speculation about thepotential for glacier formation on Haleakala.Porter (1979) estimated that an ice cap onMauna Kea (with a summit elevation of 4206m) extended down to 3200 m and calculatedan equilibrium line altitude (ELA) at an elevation over 3700 m; above that elevationthere was net accumulation and below it therewas net ablation, with the presence of icebelow the ELA a function of glacier flow.Moore et al. (1993) speculated that Haleakala was high enough before about OJ Mato have supported glacial ice and suggestedthat the crater formed by glacial outburstfloods; they assumed a maximum elevation of5000 m, however, and suggested that thecrater formed early in the postshield history(before subsidence). Because Haleakala's elevation appears not to have substantially (ifever) exceeded 3700 m, there would havebeen little net ice accumulation under conditions similar to those of the last glacial period.Because it had subsided to well below thatelevation by the time the crater is now believed to have formed, it is unlikely that outwash from multiple glaciations formed theHaleakala Crater.
Biogeography
The most obvious biological consequence ofMaui Nui's history is that the dispersal ofspecies into and within the complex wasgreatly facilitated. With direct connections toO'ahu early in its history, species (evenflightless or poorly dispersed species) dispersed easily from older to younger volcanoes. Subsequent connections between MauiNui islands further facilitated dispersal untilvery recently. Flightless birds appear to havemade use of connections in at least two cases.First, the flightless waterfowl, or Moa nalos

42
(Anatidae), in the genus Thambetochen mayhave dispersed from O'ahu to Maui Nui viathe Penguin Bank land bridge and thenthroughout Maui Nui via subsequent connections (Sorenson et al. 1999). Hawaiianflightless ibises (Apteribis spp.) are restrictedto Maui Nui; because ibises show little tendency to become flightless (only one otherinstance is known), it is likely that they developed flightlessness on Maui Nui, resultingin a vicariant distribution as the landmassbecame separate islands (Olson and James1991).
Maui Nui's considerable size and probable range of environments also presented asubstantial target for the overwater dispersalof species, not only for species dispersingfrom older islands but also from outside theHawaiian Islands. Lowrey (1995) estimatedthat 11 species of Tetramolopium (Asteraceae)evolved from a common ancestor that colonized Maui Nui around 0.6 to 0.7 Ma. Theancestors are believed to be from cool climates of the New Guinea highlands, so MauiNui would have been the most likely point ofcolonization because it had the most extensivehigh-elevation habitats in the Hawaiian Islands at that time.
In the past, Maui Nui was closer to otherislands than it is at present, which likely madeit more of a target and a source of dispersalthan is apparent. When the oldest volcanoes of Hawai'i Island completed their shieldbuilding around 0.5-0.6 Ma, the shorelineassociated with the M terrace would havebeen less than 15 km from Maui Nui'sshoreline. This distance is comparable withthat currently between Maui Nui islands andis considerably less than the current distancebetween Maui and Hawai'i (nearly 50 km).Similarly, the distance between Maui Nui andO'ahu was much closer during low sea stands,even as recently as the last glacial period.With Penguin Bank exposed, Maui Nui wasabout 14 km from O'ahu, much less than thecurrent distance between O'ahu and Moloka'i(40 km).
Maui Nui's history probably played animportant role in speciation. Because largerislands have been shown to experience morespeciation than small ones (Heaney 1986,
PACIFIC SCIENCE· January 2004
Losos and Schluter 1999), Maui Nui's areathrough evolutionary time may be more relevant to the evolution of diversity than thecurrent size of its constituent islands. Further,the process of islands splitting up may produce vicariant speciation through the formation of a barrier (Mayr 1963), in this case awater channel or inhospitable lowland. Withthe isolation process repeated with iterationsof sea-level fluctuation and associated climatechange, numerous isolation scenarios mayhave been possible; however, iterative speciation involving glacial cycles is probably uncommon (Joseph et al. 1995). In addition tothe two examples of flightless birds previouslymentioned, vicariant speciation has been suggested within several lineages, as summarizedby Funk and Wagner (1995): true bugs inthe genus Sarona (Miridae) (Asquith 1995),plants in the genus Schiedea (Caryophyllaceae)(Wagner et al. 1995), and spiders in the genusTetrag;natha (Tetragnathidae) (Gillespie andCroom 1995). Liebherr (1997) proposed amore complex vicariance scenario in a phylogeny of several genera of beetles (Carabidae, tribe Platynini): several subclades includespecies from each of three volcanoes (EastMoloka'i, East and West Maui), suggestingthat initial divergence within Maui Nui wasfollowed by parallel vicariance in the resultingsublineages.
Considering past island configurations andclimates, the species composition of islands ofthe Maui Nui complex should differ fromthose of the other Hawaiian Islands in severalways. First, because of facilitated dispersal andenhanced speciation, Maui Nui islands shouldcontain more species than would be predictedby their age and area alone. Second, becauseMaui Nui islands are part of a single "evolutionary isolate," they should share many species that are endemic to Maui Nui as a wholeyet contain relatively few species that areendemic to only a single Maui Nui island.Finally, these patterns should be most pronounced in lowland and dry climates, becausethese have been spatially and temporallycontinuous over the lifetime of the Maui Nuicomplex. A detailed biogeographical analysisof the native angiosperm flora confirms manyof these points (Price 2002). A high degree of

Topographic History of the Maui Nui Complex . Price and Elliott-Fisk 43
floristic similarity, low-level single-island endemism, and high species richness (particularly in dry habitats) characterize the floras ofthe islands of the Maui Nui complex.
ACKNOWLEDGMENTS
Arthur Shapiro, David Sherrod, and PeterVitousek all gave constructive reviews. DavidClague provided considerable bathymetrydata and critical assistance in identifying submerged features. Jim Gardner provided additional bathymetry and advice.
Literature Cited
Asquith, A. 1995. Evolution of Sarona(Heteroptera, Miridae): Speciation on geographic and ecological islands. Pages 90120 in W. L. Wagner and V. A. Funk, eds.Hawaiian biogeography: Evolution on ahot spot archipelago. Smithsonian Institution Press, Washington.
Campbell, J. F. 1984. Rapid subsidence ofKohala Volcano and its effect on coral reefgrowth. Geo-Mar. Lett. 4:31-36.
Carlquist, S. 1980. Hawaii, a natural history:Geology, climate, native flora and faunaabove the shoreline. 2nd ed. Pacific Tropical Botanic Garden, Lawa'i, Kaua'i.
Carson, H. L., and D. A. Clague. 1995. Geology and biogeography. Pages 14-29 inW. L. Wagner and V. A. Funk, eds. Hawaiian biogeography: Evolution on a hotspot archipelago. Smithsonian InstitutionPress, Washington.
Chappell,]. 1983. A revised sea-level recordfor the last 300,000 years from Papua,New Guinea. Search (Syd.) 14:99-101.
Chen, C. Y., F. A. Frey, M. O. Garcia, G. B.Dalrymple, and S. R. Hart. 1991. Thetholeiite to alkalic basalt transition at Haleakala Volcano, Maui, Hawai'i. Contrib.Mineral. Petrol. 106:183-200.
Clague, D. A. 1996. The growth and subsidence of the Hawaiian-Emperor volcanicchain. Pages 35-50 in A. Keast and S. E.Miller, eds. The origin and evolution ofPacific island biotas, New Guinea to eastern Polynesia: Patterns and processes. SPBAcademic Publishing bv., Amsterdam.
Clague, D. A., Chen Dao-gong, R. Murnane,M. H. Beeson, M. A. Lanphere, G. B.Dalrymple, W. Friesen, and R. T. Holcomb. 1982. Age and petrology of theKalaupapa Basalt, Moloka'i, Hawai'i. Pac.Sci. 36:411-420.
Environmental Systems Research Institute.1999. ArcInfo and ARCGrid extensionversion 8.0.1. ESRI, Redlands, California.
Fairbanks, R. G. 1989. A 17,000-year glacioeustatic sea level record: Influence of glacial melting rates on the Younger Dryasevent and deep-ocean circulation. Nature(Lond.) 342:637-642.
Fodor, R. v., F. A. Frey, G. R. Bauer, andD. A. Clague. 1992. Ages, rare-earth element enrichment, and petrogenesis of tholeiitic and alkalic basalts from Kaho'olaweIsland, Hawai'i. Contrib. Mineral. Petrol.110:442-462.
Funk, V. A., and W. L. Wagner. 1995. Biogeographic patterns in the Hawaiian Islands. Pages 379-419 in W. L. Wagnerand V. A. Funk, eds. Hawaiian biogeography: Evolution on a hot spot archipelago.Smithsonian Institution Press, Washington.
Gavenda, R. T. 1992. Hawaiian Quaternarypaleoenvironments: A review of geological,pedological, and botanical evidence. Pac.Sci. 46:295-307.
Giambelluca, T. W., and T. A. Schroeder.1998. Climate. Pages 49-59 in S. P. Juvikand]. O. Juvik, eds. Atlas of Hawai'i. 3rded. University of Hawai'i Press, Honolulu.
Gillespie, R. G., and H. B. Croom. 1995.Comparison of speciation mechanismsin web-building and non-web-buildinggroups within a lineage of spiders. Pages121-146 in W. L. Wagner and V. A.Funk, eds. Hawaiian biogeography: Evolution on a hot spot archipelago. Smithsonian Institution Press, Washington.
Guillou, H.,]. Sinton, C. Laj, C. Kissel, andN. Szeremeta. 2000. New K-Ar ages ofshield lavas from Waianae Volcano, Oahu,Hawaiian Archipelago. J. Volcano!. Geothermo Res. 96:229-242.
Heaney, L. R. 1986. Biogeography of mammals in Southeast Asia: Estimates of ratesof colonization, extinction and speciation.BioI.]. Linn. Soc. 28:127-166.

44
Hotchkiss, S. C. 1998. Quaternary vegetationand climate of Hawai'i. Ph.D. russ., University of Minnesota, St. Paul.
Hotchkiss, S. c., and]. O. Juvik. 1999. Alate-Quaternary pollen record from Ka'auCrater, O'ahu, Hawai'i. Quat. Res. (Tokyo) 52:115-128.
Jones, A. T. 1995. Geochronology ofdrowned Hawaiian coral reefs. Sediment.Geol. 99:233-242.
Joseph, L., C. Moritz, and A. Hugall. 1995.Molecular support for vicariance as a sourceof diversity in rainforest. Proc. R Soc.Lond. Ser. B. BioI. Sci. 260:177-182.
Liebherr,]. K. 1997. Dispersal and vicariancein Hawaiian platynine carabid beetles(Coleoptera). Pac. Sci. 51:424-439.
Losos, ]. B., and D. Schluter. 1999. Analysisof an evolutionary species-area curve. Nature (Lond.) 408:847-850.
Lowrey, T. K. 1995. Phylogeny, adaptiveradiation, and biogeography of HawaiianTetramolopium (Asteraceae, Asterae). Pages195-220 in W. L. Wagner and V. AFunk, eds. Hawaiian biogeography: Evolution on a hot spot archipelago. Smithsonian Institution Press, Washington.
Ludwig, K. R, B. ]. Szabo,]. G. Moore, andK. R Simmons. 1991. Crustal subsidencerate off Hawai'i determined from 234U/238U ages of drowned coral reefs. Geology (Boulder) 19:171-174.
Macdonald, G. A, and A. T. Abbott. 1970.Volcanoes in the sea: The geology of Hawaii. University of Hawai'i Press, Honolulu.
Mayr, E. 1963. Animal species and evolution. Harvard University Press, Cambridge, Massachusetts.
Mix, A c., N. G. Pisias, W. Rugh,]. Wilson,A Morey, and T. K. Hagelberg. 1995.Benthic foraminifer stable isotope recordfrom site 849 (0-5 Ma): Local and globalclimate changes. Pages 371-412 in N. G.Pisias, L. A Mayer, T. R Janecek, A.Palmer-Julson, and T. H. van Andel, eds.Proceedings of the Ocean Drilling Program, scientific results. Vol. 138. OceanDrilling Program, College Station, Texas.
Moore,]. G. 1987. Subsidence of the Hawaiian Ridge. Pages 85-100 in R W. Decker,
PACIFIC SCIENCE· January 2004
T. L. Wright, and P. H. Stauffer, eds.Volcanism in Hawai'i. U.S. Geol. Surv.Prof. Pap. 1350.
Moore, ]. G., and]. F. Campbell. 1987. Ageof tilted reefs, Hawai'i. ]. Geophys. Res.92 :2641-2646.
Moore, ]. G., and D. A Clague. 1992. Volcano growth and the evolution of the island of Hawai'i. GeoI. Soc. Am. Bull.104:1471-1484.
Moore, ]. G., and D. ]. Fornari. 1984.Drowned reefs as indicators of the rate ofsubsidence of the island of Hawai'i. ].Geol. 92:752-759.
Moore,]. G., D. A Clague, R T. Holcomb,P. W. Lipman, W. R Normark, and M. E.Torresan. 1989. Prodigious submarinelandslides on the Hawaiian ridge. ]. Geophys. Res. 94:17,465-17,484.
Moore, ]. G., D. A Clague, K. R Ludwig,and R K. Mark. 1992. Subsidence andvolcanism of the Haleakala Ridge, Hawai'i.]. Volcanol. Geotherm. Res. 42:273-284.
Moore, ]. G., S. C. Porter, and R Mark.1993. Glaciation of Haleakala Volcano,Hawai'i. Geol. Soc. Am. Abstracts withPrograms 25:123-124.
Muhs, D. R, and B. ]. Szabo. 1994. Newuranium-series ages of the WaimanaloLimestone, Oahu, Hawaii: Implications forsea level during the last interglacial period.Mar. GeoI. 118:315-326.
Nullet, D., C. H. Fletcher III, S. Hotchkiss,and ]. O. Juvik. 1998. Paleoclimate andgeography. Pages 64-66 in]. O. Juvik andS. P. Juvik, eds. Atlas of Hawai'i. 3rd ed.University of Hawai'i Press, Honolulu.
Olson, S. L., and H. F. James. 1991. Descriptions of thirty-two new species ofbirds from the Hawaiian Islands: Part I.Non-Passeriformes. Ornithol. Monogr.45:1-88.
Porter, S. C. 1979. Hawaiian glacial ages.Quat. Res. (Tokyo) 12:161-186.
Price,]. P. In press. Floristic Biogeography ofthe Hawaiian Islands: influences of area,environment and paleogeography. Journalof Biogeography.
Sherrod, D. R, Y. Nishimitsu, and T.Tagami. 2002. New K-Ar ages and thegeologic evidence against rejuvenated-

Topographic History of the Maui Nui Complex' Price and Elliott-Fisk 45
stage volcanism at Haleakala, East Maui,a postshield-stage volcano of the Hawaiian island chain. Geol. Soc. Am. Bull.115:683-694.
Smith, J. R, and P. Wessel. 2000. Isostaticconsequences of giant landslides on theHawaiian ridge. Pure Appl. Geophys.157:1097-1114.
Sorenson, M. D., A. Cooper, E. E. Paxinos,T. W. Quinn, H. F. James, S. L. Olson,and R C. Fleischer. 1999. Relationships ofthe extinct moa-nalos, flightless Hawaiianwaterfowl, based on ancient DNA. Proc.R Soc. Lond. Ser. B. BioI. Sci. 266:21872193.
Stearns, H. T., and G. A. Macdonald. 1942.Geology and groundwater resources of theisland of Maui, Hawaii. Advertiser Publishing Co., Ltd., Honolulu, Hawai'i.
Wagner, W. L., S. G. Weller, and A. K. Sakai. 1995. Phylogeny and biogeography inSchiedea and Alsinidendron (Caryophyllaceae). Pages 221-258 in W. L. Wagnerand V. A. Funk, eds. Hawaiian biogeography: Evolution on a hot spot archipelago.Smithsonian Institution Press, Washington.
Wilson, J. T. 1963. A possible origin of theHawaiian Islands. Can. J. Phys. 41:135138.