topology & topological data analysistopology & topological data analysis 2 abstract topology...
TRANSCRIPT

Topology & Topological Data Analysis

TOPOLOGY & TOPOLOGICAL DATA ANALYSIS 2
Abstract
Topology is the branch of pure mathematics that studies the notion of shape. Topology takes on two main tasks, namely the measurement of shape and the representation of shape. Both tasks are meaningful in the context of large, complex, and high dimensional data sets. They permit one to measure shape related properties within the data, such as the presence of loops, and they provide methods for creating compressed representations of data sets that retain features, and which reflect the relationships among points in the data set. The representation is in the form of a topological network or combinatorial graph, which is a very simple and intuitive object to work with using graph layout algorithms.
This whitepaper will explore the main properties of topological analysis and explain how shapes are measured and represented. It also shows how TDA provides a framework for machine learning and why it provides a way to understand the overall organization of the data directly.
Why Topological Data Analysis?
Topology within mathematics can be characterized as that part of the subject that studies notions of shape. It consists of at least two separate threads, one in which one attempts to “measure” shape, and in the other in which one attempts to find compressed combinatorial representations of shape and analyze the degree to which these representations are faithful to the shape. The first proceeds primarily via algebraic invariants, such as homology and homotopy groups, to measure and count the instances of particular patterns within the shape in a suitably systematic way. The second is the subject of a great deal of manifold topology, and is exemplified by the work on the “Hauptvermutung” concerning the existence of a common subdivision of any two triangulations of manifolds.
Both these threads have been extended to the world of point clouds of data. The measurement aspect is extended via the theory of persistent homology and its variants. The second one is extended by various simplicial complex constructors, such as Vietoris-Rips complexes, witness complexes, and the complexes constructed by the Ayasdi platform. In ordinary topology, the role of the combinatorial representations is to lend additional concreteness to the study of the shape, as well as to provide a succinct representation of it. They serve the same purpose in the study of high dimensional and complex data sets, in that they provide a compressed representation of the data that retains information about the geometric relationships between data points. The representations are also easy to work with, so they provide extremely useful and simple ways to interrogate the data, and to understand the driving variables characterizing various subgroups. At a high level, one can say that they allow for easy identification of coherent groups within the data. The search for coherent groups, performed naively, is a clearly intractable problem since it requires searching through the collection of all subsets in the data set.
Ultimately, both sets of ideas will be useful in permitting investigators to study their data. The representations are at the forefront, because they are what a user deals with directly. As we move further into automation, the measuring of the shape of a data set and of the complex outputs of the Ayasdi platform will be critical, since we will want, for example, to test Ayasdi constructions for the presence of geometric features such as flares and loops, so as to provide the user the best possible “quick analysis,” automatically building complexes for the user without requiring by hand selection of parameter values, metrics, and lenses.
CONTENT
1. Introduction to Topology
2. Three Properties of Topological Analysis
3. Visualizing Topological Networks
4. TDA & Machine Learning
5. Measuring Shape

TOPOLOGY & TOPOLOGICAL DATA ANALYSIS 3
Three Properties of Topological Analysis
Topology is in fact the study of shape from a particular point of view. For example, it does not distinguish between a perfectly round circle and a circle that has been “squashed” into an ellipse. There are actually three important properties enjoyed by topological analysis, and they are important in many settings.
COORDINATE INVARIANCE
This property says that topology does not study properties of shapes that depend on the set of coordinates chosen. For example, the ellipses below are all considered to be topologically the same, even though they may be positioned differently in the plane.
The value of this property in data analysis is that we often modify data by the use of various transformations on the entries in a data matrix, which amount to a change of coordinates. Very simple transformations involve only translations and scaling, such as occurs in the transformation from Celsius temperatures to Fahrenheit or Kelvin. More complex transformations, such as three-dimensional rotations, are often useful to clarify underlying properties of a data set. The idea is to study properties that do not change under such coordinate changes. Another example of this property occurs in the study of microarray studies of gene expression, where different technologies may be applied to the same phenomena, such as particular forms of cancer, but produce outputs with entirely different coordinate systems, coming from different choices of genes or families of genes as coordinates.
DEFORMATION INVARIANCE
This property says that topological properties are unchanged when we stretch or deform a geometric shape. To give an example of this, consider the problem of distinguishing between letters. The human visual system is capable of robustly recognizing the differences that distinguish between a letter “A” and a letter “B” independently of what font the letters are drawn in, the angle from which they are viewed, and even of possible curvature of the surface
on which the letters are drawn.
The different choices of fonts or aspect can be thought of as deformations of the underlying shape of the letters. This kind of robustness is also quite useful when complicated transformations, such as log-log transformations, are applied to a data set. For instance, the shape below is the result of applying a log-log transformation to a perfectly round circle. We can think of this as deforming the circle, and topological methods say that the round circle and the transformed version are the same.
TOPOLOGY & TOPOLOGICAL DATA ANALYSIS 4
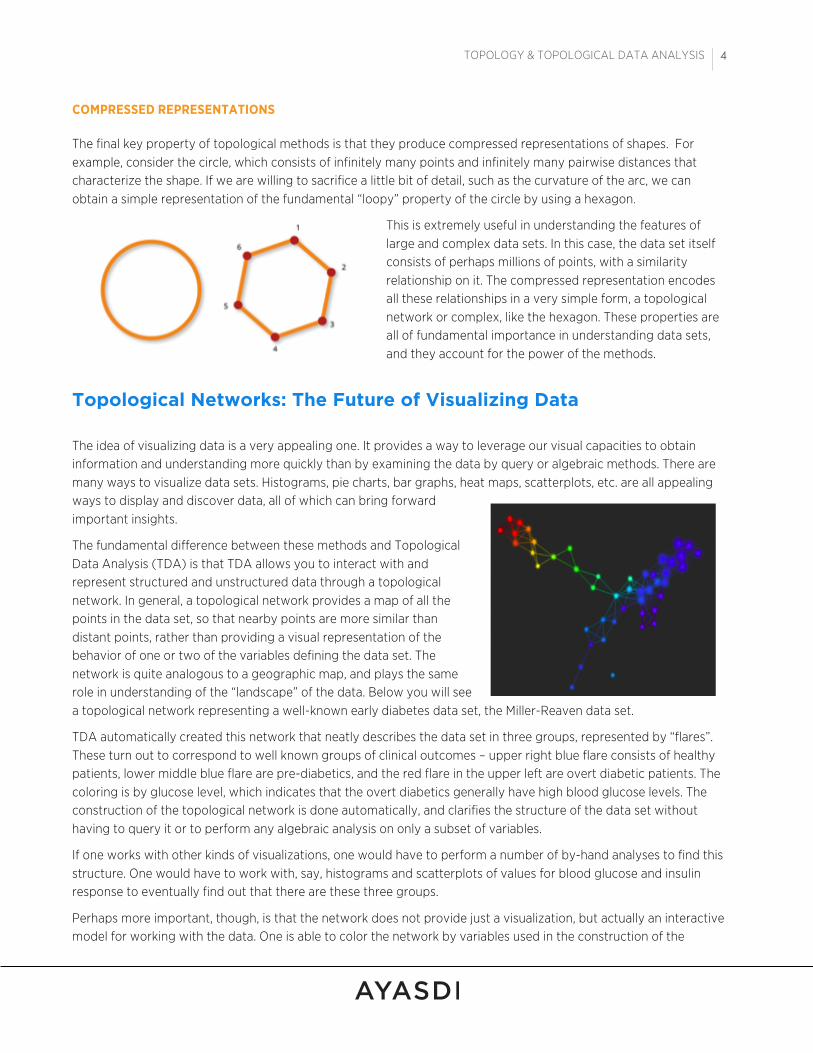
COMPRESSED REPRESENTATIONS
The final key property of topological methods is that they produce compressed representations of shapes. For example, consider the circle, which consists of infinitely many points and infinitely many pairwise distances that characterize the shape. If we are willing to sacrifice a little bit of detail, such as the curvature of the arc, we can obtain a simple representation of the fundamental “loopy” property of the circle by using a hexagon.
This is extremely useful in understanding the features of large and complex data sets. In this case, the data set itself consists of perhaps millions of points, with a similarity relationship on it. The compressed representation encodes all these relationships in a very simple form, a topological network or complex, like the hexagon. These properties are all of fundamental importance in understanding data sets, and they account for the power of the methods.
Topological Networks: The Future of Visualizing Data
The idea of visualizing data is a very appealing one. It provides a way to leverage our visual capacities to obtain information and understanding more quickly than by examining the data by query or algebraic methods. There are many ways to visualize data sets. Histograms, pie charts, bar graphs, heat maps, scatterplots, etc. are all appealing ways to display and discover data, all of which can bring forward important insights.
The fundamental difference between these methods and Topological Data Analysis (TDA) is that TDA allows you to interact with and represent structured and unstructured data through a topological network. In general, a topological network provides a map of all the points in the data set, so that nearby points are more similar than distant points, rather than providing a visual representation of the behavior of one or two of the variables defining the data set. The network is quite analogous to a geographic map, and plays the same role in understanding of the “landscape” of the data. Below you will see a topological network representing a well-known early diabetes data set, the Miller-Reaven data set.
TDA automatically created this network that neatly describes the data set in three groups, represented by “flares”. These turn out to correspond to well known groups of clinical outcomes – upper right blue flare consists of healthy patients, lower middle blue flare are pre-diabetics, and the red flare in the upper left are overt diabetic patients. The coloring is by glucose level, which indicates that the overt diabetics generally have high blood glucose levels. The construction of the topological network is done automatically, and clarifies the structure of the data set without having to query it or to perform any algebraic analysis on only a subset of variables.
If one works with other kinds of visualizations, one would have to perform a number of by-hand analyses to find this structure. One would have to work with, say, histograms and scatterplots of values for blood glucose and insulin response to eventually find out that there are these three groups.
Perhaps more important, though, is that the network does not provide just a visualization, but actually an interactive model for working with the data. One is able to color the network by variables used in the construction of the

TOPOLOGY & TOPOLOGICAL DATA ANALYSIS 5
network, or by metadata. For example, if one had a data set of diabetes patients, one could color the nodes by patients with type I diabetes. In addition, one can select any part of the network (and therefore part of the data set) to perform further study and analyze the fine grain structure within the data. Having interrogated the data in this manner, one can obtain understanding about what characterizes different subgroups, and then find statistically significant features that distinguish each group from the rest of the data set.
What this means is that the topological network is very easy to interrogate, allowing one to discover the true meaning of the data by analyzing a compressed representation of the data set retaining all of the subtle features. In this representation, each node corresponds to multiple data points, and so the number of nodes is often much smaller than the number of data points. Each node contains data points that have a degree of similarity to each other. So the network gives much more than a static visualization. Instead, it provides a workbench for searching and analyzing data without having to perform algebraic manipulations or database queries. It gives one a way to understand the overall organization of the data directly.
A Framework for Machine Learning
Machine learning is a collection of techniques for understanding data, including methods for visualization, prediction, classification and other tasks relevant for making sense of data.
The visualization techniques come under the heading of scatterplot methods, where one produces projections of the data points on two or sometimes three dimensions, and then plots the projections on these coordinates in the usual way. The projection techniques include principal component analysis, multidimensional scaling, and projection pursuit.
Topological Data Analysis (TDA), on the other hand, represents data using topological networks. A topological network represents data by grouping similar data points into nodes, and connecting those nodes by an edge if the corresponding collections have a data point in common. Because each node represents multiple data points, the network gives a compressed version of extremely high dimensional data.
Many network representations do not afford this compression, and so produce a complex network that can be difficult to interpret. Interestingly, the topological network can be constructed off of the results of machine learning techniques, and can therefore produce a representation of the scatterplot that is easier to understand and interact with and which often provides more resolution of the data. Topological networks allow individuals to easily interrogate machine-learning outputs in a way that highlights high value segments of the data.
Next you will see a scatterplot at the top, in the middle a network representation in which each node corresponds to a data point, and further down a topological network in which each node is a collection of data points.

TOPOLOGY & TOPOLOGICAL DATA ANALYSIS 6

TOPOLOGY & TOPOLOGICAL DATA ANALYSIS 7
Cluster analysis is another class of techniques within machine learning. In cluster analysis, the goal is to divide a data set up into disjoint groups that have some distinct defining properties, or conceptual coherence. When data sets naturally break into such distinct groups, as in the case to the right, this family of techniques works quite well at finding such decompositions.
In other situations, though, such as the data set to the right, they will not. However, using TDA, one is able to form groups of data points but retain information that will allow us to connect the groups to indicate which ones contain points that are close to the points in another cluster.
So, a topological network representation of the data set above might look as follows.
Note that it accurately captures the “loopy” characteristic of the data set, a property that could not even be expressed within clustering theory. This loopy behavior in this case represents periodic behavior in the data set, which is an important characteristic to know about. This is what is meant by the statement “shape has meaning.”
Topological Data Analysis can be used as a framework in conjunction with machine learning to understand the “shape” of complex data sets, and which can also be used to study data where the elements themselves encode geometry, such as in images and organic compounds.

TOPOLOGY & TOPOLOGICAL DATA ANALYSIS 8
Measuring Shape
Unlike many numerical properties we deal with, shape is a somewhat nebulous concept. We find that we can recognize similarities between shapes, but we are often unclear about how we recognize it. Further, we are even less clear about how we might instruct a machine to recognize and classify shapes. One of the main tasks of topology is to develop methods for recognizing shapes, which it does through a set of tools called homology, or Betti numbers, named after the Italian mathematician Enrico Betti. There is one Betti number for each non-negative number. The zero-th Betti number is a count of the number of connected components.
The first Betti number counts the number of independent loops in a space suitably defined. So, the first Betti number of the letter “A” is one, and the first Betti number of the letter “B” is two.
The higher Betti numbers count occurrences of “higher dimensional cycles,” which again have to be suitably defined. Here are some examples.
The kind of counts we have described above sound great intuitively, but it is difficult to make mathematical sense of it, and be able to instruct a computer to evaluate them. It turns out that this is possible, although it took a great deal of effort from a number of mathematicians in the early to mid 20th century. For every space (think of a subset of 2, 3, 4, or n-dimensional space), there is a Betti number for every k greater than or equal to zero, and it measures the presence of higher dimensional cycles in that space. The problem that has only come up in the last 15 years is how to infer shape when all we have is a finite sample from the shape.
TOPOLOGY & TOPOLOGICAL DATA ANALYSIS 9
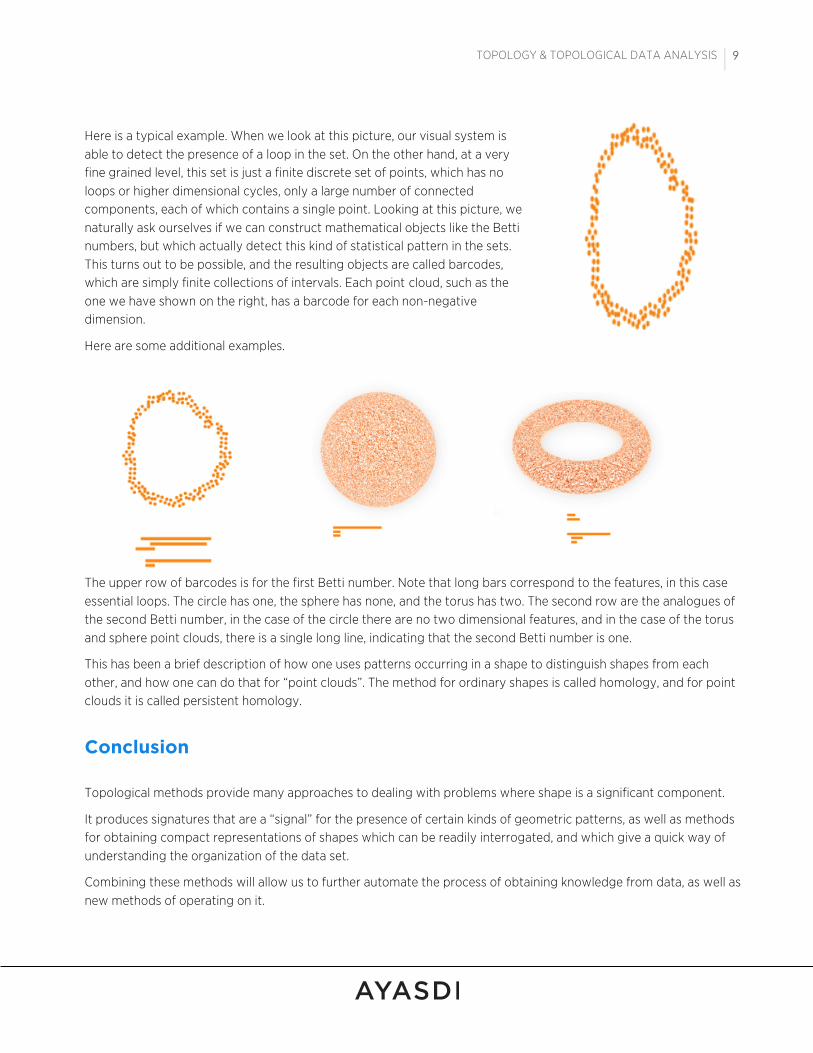
Here is a typical example. When we look at this picture, our visual system is able to detect the presence of a loop in the set. On the other hand, at a very fine grained level, this set is just a finite discrete set of points, which has no loops or higher dimensional cycles, only a large number of connected components, each of which contains a single point. Looking at this picture, we naturally ask ourselves if we can construct mathematical objects like the Betti numbers, but which actually detect this kind of statistical pattern in the sets. This turns out to be possible, and the resulting objects are called barcodes, which are simply finite collections of intervals. Each point cloud, such as the one we have shown on the right, has a barcode for each non-negative dimension.
Here are some additional examples.
The upper row of barcodes is for the first Betti number. Note that long bars correspond to the features, in this case essential loops. The circle has one, the sphere has none, and the torus has two. The second row are the analogues of the second Betti number, in the case of the circle there are no two dimensional features, and in the case of the torus and sphere point clouds, there is a single long line, indicating that the second Betti number is one.
This has been a brief description of how one uses patterns occurring in a shape to distinguish shapes from each other, and how one can do that for “point clouds”. The method for ordinary shapes is called homology, and for point clouds it is called persistent homology.
Conclusion
Topological methods provide many approaches to dealing with problems where shape is a significant component.
It produces signatures that are a “signal” for the presence of certain kinds of geometric patterns, as well as methods for obtaining compact representations of shapes which can be readily interrogated, and which give a quick way of understanding the organization of the data set.
Combining these methods will allow us to further automate the process of obtaining knowledge from data, as well as new methods of operating on it.

Ayasdi is on a mission to make the world’s complex data useful by automating and accelerating insight discovery. Our breakthrough approach, Topological Data Analysis (TDA), simplifies the extraction of intelligence from even the most complex data sets confronting organizations today. Developed by Stanford computational mathematicians over the last decade, our approach combines advanced learning algorithms, abundant compute power and topological summaries to revolutionize the process for converting data into business impact. Funded by Khosla Ventures, Institutional Venture Partners, GE Ventures, Citi Ventures, and FLOODGATE, Ayasdi’s customers include General Electric, Citigroup, Anadarko, Boehringer Ingelheim, the University of California San Francisco (UCSF), Mercy, and Mount Sinai Hospital.
ABOUT AYASDI
© Copyright 2014 Ayasdi, Inc. Ayasdi, the Ayasdi logo design, and Ayasdi Core are registered trademarks, and Ayasdi Cure and Ayasdi Care are trademarks of Ayasdi, Inc. All rights reserved. All other trademarks are the property of their respective owners.