toreador research & trading -...
TRANSCRIPT

Copyright © 2015 Toreador Research and Trading For More Information Visit: www.EconomicMargin.com
Individual Security Analysis For Macro Market Insights
Presented By:
Rafael Resendes
Toreador Research and Trading
Toreador Research & Trading
Global Investment Research Insights
Copyright © 2015 Toreador Research and Trading For More Information Visit: www.EconomicMargin.com
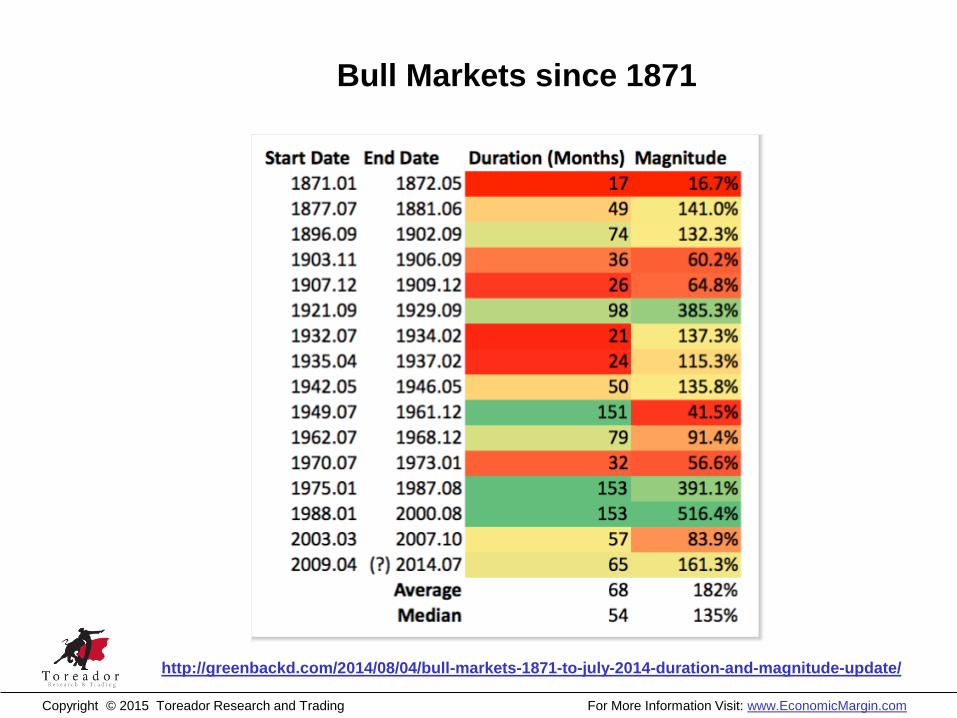
Bull Markets since 1871
http://greenbackd.com/2014/08/04/bull-markets-1871-to-july-2014-duration-and-magnitude-update/
Copyright © 2015 Toreador Research and Trading For More Information Visit: www.EconomicMargin.com
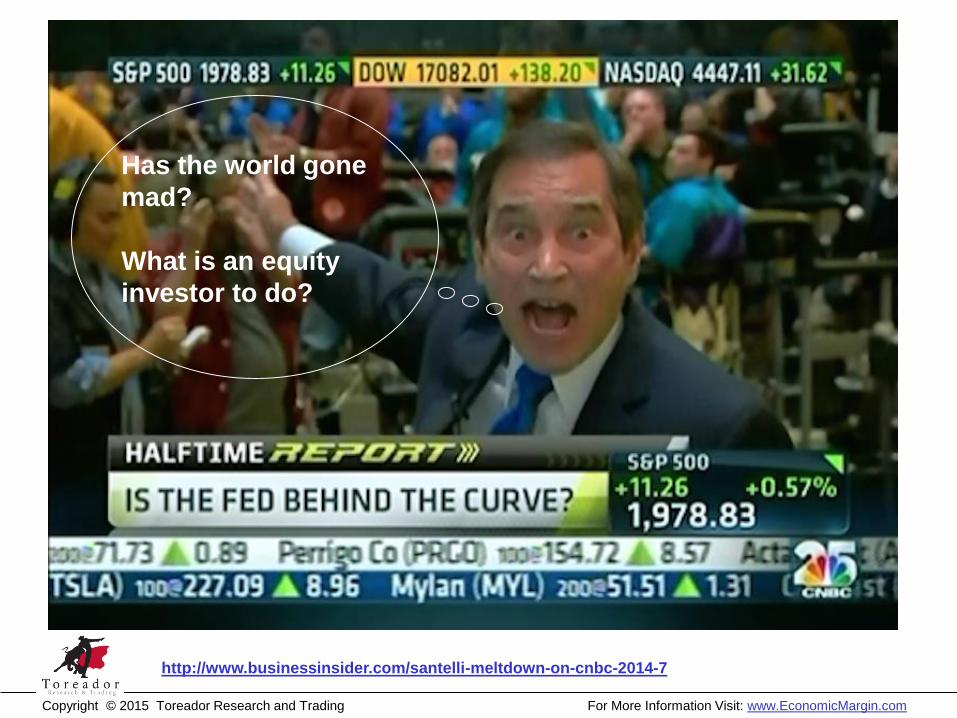
http://www.businessinsider.com/santelli-meltdown-on-cnbc-2014-7
Has the world gone
mad?
What is an equity
investor to do?

Copyright © 2015 Toreador Research and Trading For More Information Visit: www.EconomicMargin.com
Understanding Intrinsic Value

Copyright © 2015 Toreador Research and Trading For More Information Visit: www.EconomicMargin.com
Getting to Performance Management
Company A Company B
Working Capital 100 0
Gross Plant 0 100
Total Assets 100 100
Cost of Capital 10% 10%
EBITDA 20 20
Cash Yield(EBITDA / Assets)
20% 20%
Are these firms really similar?
Simplistic accounting based analysis shows that these firms have similar
risk and return characteristics. However the asset compositions of each
firm indicates they have very different underlying economics.
Copyright © 2015 Toreador Research and Trading For More Information Visit: www.EconomicMargin.com
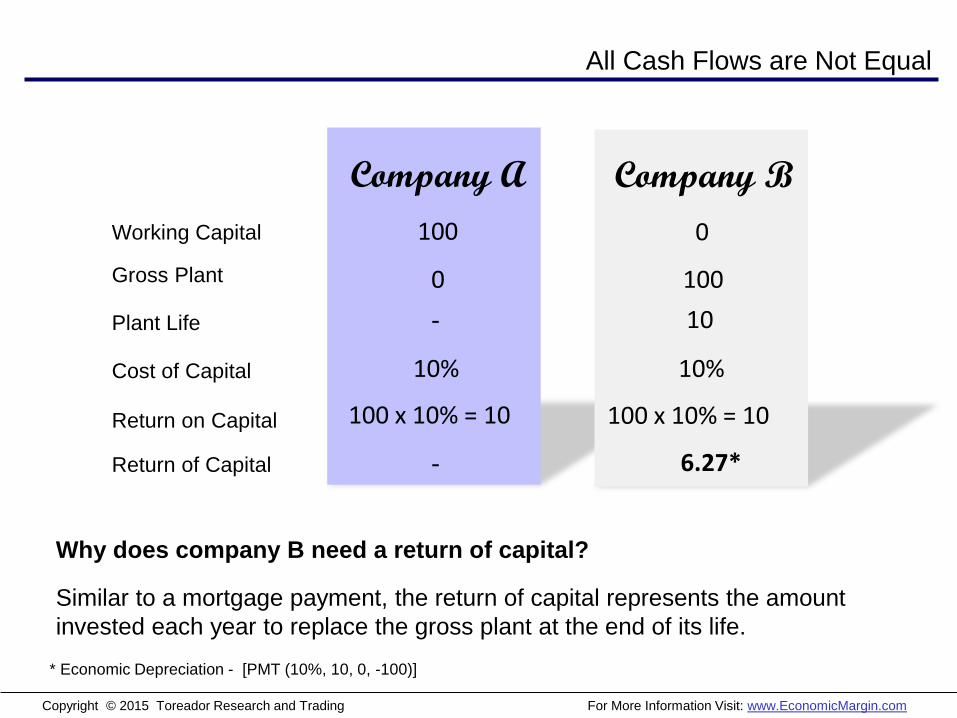
All Cash Flows are Not Equal
Company A Company B
Working Capital 100 0
Gross Plant 0 100
Plant Life - 10
Cost of Capital 10% 10%
Return on Capital 100 x 10% = 10
Return of Capital - 6.27*
* Economic Depreciation - [PMT (10%, 10, 0, -100)]
Why does company B need a return of capital?
Similar to a mortgage payment, the return of capital represents the amount
invested each year to replace the gross plant at the end of its life.
100 x 10% = 10
Copyright © 2015 Toreador Research and Trading For More Information Visit: www.EconomicMargin.com
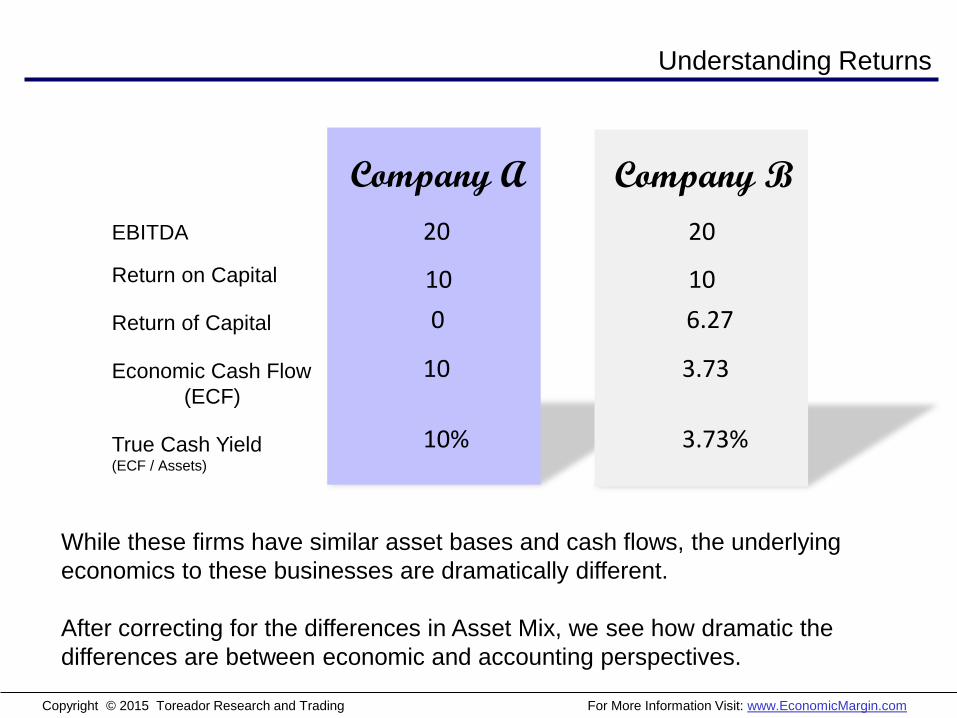
Understanding Returns
Company A Company B
EBITDA 20 20
Return on Capital 10 10
Return of Capital 0 6.27
Economic Cash Flow
(ECF)
10 3.73
True Cash Yield(ECF / Assets)
While these firms have similar asset bases and cash flows, the underlying
economics to these businesses are dramatically different.
After correcting for the differences in Asset Mix, we see how dramatic the
differences are between economic and accounting perspectives.
10% 3.73%
Copyright © 2015 Toreador Research and Trading For More Information Visit: www.EconomicMargin.com
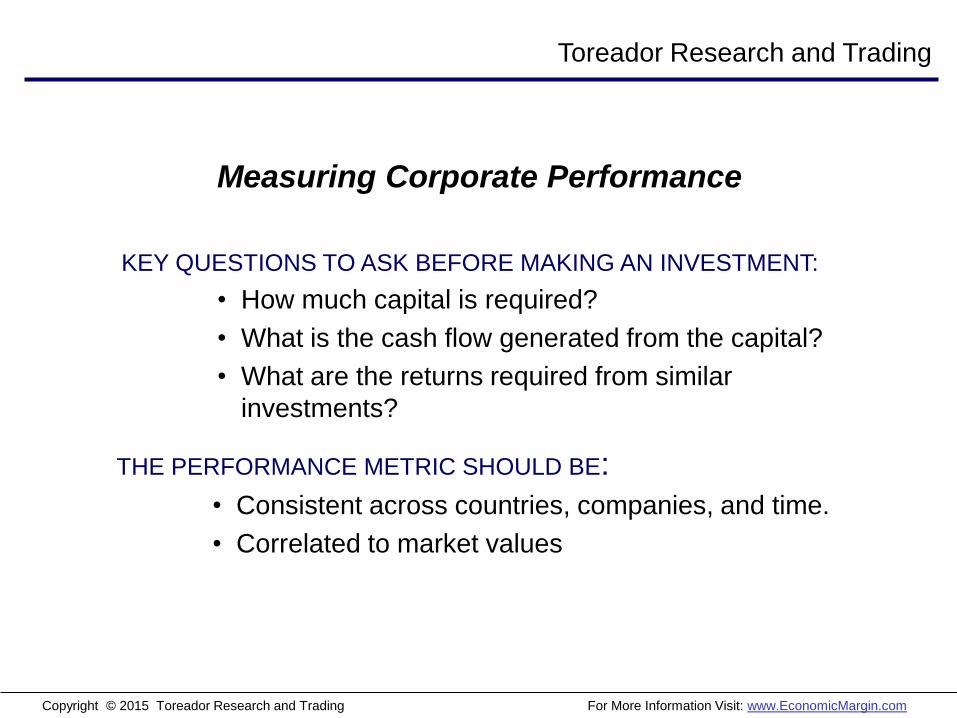
KEY QUESTIONS TO ASK BEFORE MAKING AN INVESTMENT:
• How much capital is required?
• What is the cash flow generated from the capital?
• What are the returns required from similar
investments?
THE PERFORMANCE METRIC SHOULD BE:
• Consistent across countries, companies, and time.
• Correlated to market values
Measuring Corporate Performance
Toreador Research and Trading

Copyright © 2015 Toreador Research and Trading For More Information Visit: www.EconomicMargin.com
EARNINGS ARE A POOR PROXY FOR ECONOMIC PROFITABILTY
• Cash Flow
• Cost of Capital
• Inflation
ACCOUNTING RATIOS MIX/CONFUSE MANY DIFFERENT RATIOS
• Asset Life
• Asset Mix
• Asset Age
• Capital Structure
• Growth
ACCOUNTING RULES DISTORT MANY ASPECTS OF ECONOMIC REALITY
• Leases
• Research and Development
• Revaluations/Goodwill Written Off
• Accelerated Depreciation
Toreador Research and Trading

Copyright © 2015 Toreador Research and Trading For More Information Visit: www.EconomicMargin.com
Toreador Valuation Framework

Copyright © 2015 Toreador Research and Trading For More Information Visit: www.EconomicMargin.com
• Properly understanding how well a company is performing
• Asset characteristics
• Risk
• Incorporating time tested concepts such as competition and risk
• Ability to value thousands of companies to create market insights
• An actual ability to explain how markets tend to work
A Useful Micro/Macro Valuation Approach Requires:
The Toreador Valuation Approach…
Toreador Research and Trading

Copyright © 2015 Toreador Research and Trading For More Information Visit: www.EconomicMargin.com
Economic Margin Framework
Operations Based Cash Flow:
+ Net Income
+ Depreciation & amortization
+ After Tax Interest Expense
+ Rental Expense Net Int. Adj.
+ R & D Expense
± Non-Recurring Items
Inflation Adjusted Invested Capital:
+ Total Assets
+ Accumulated Depreciation
+ Gross Plant Inflation Adjustment
+ Capitalized Operating Rentals
+ Capitalized R & D
- Non Debt Current Liabilities
- Revaluations
Capital Charge:
Return on and Return of Capital
that captures company specific
economic circumstances.
Economic Margin Calculation Details
(Country Specific COC)

Copyright © 2015 Toreador Research and Trading For More Information Visit: www.EconomicMargin.com
Economic Margin Framework
Given 5% WACC, What Must Project Yield To Break Even?
Investment:
PV
Life = 10 years
N
PMT = ?Salvage:
$5,000FV
$10,000
Annual Economic Charge = $898
FV (Salvage Value)
N (Life) 0% 50% 100%
7 $1,728 $1,114 $500
10 $1,298 $898 $500
13 $1,065 $728 $500
* Calculated using the Payment function [PMT (5%, 10, 0, -10,000)]
EM =Cash Flow – Capital Charge
Invested Capital
Copyright © 2015 Toreador Research and Trading For More Information Visit: www.EconomicMargin.com
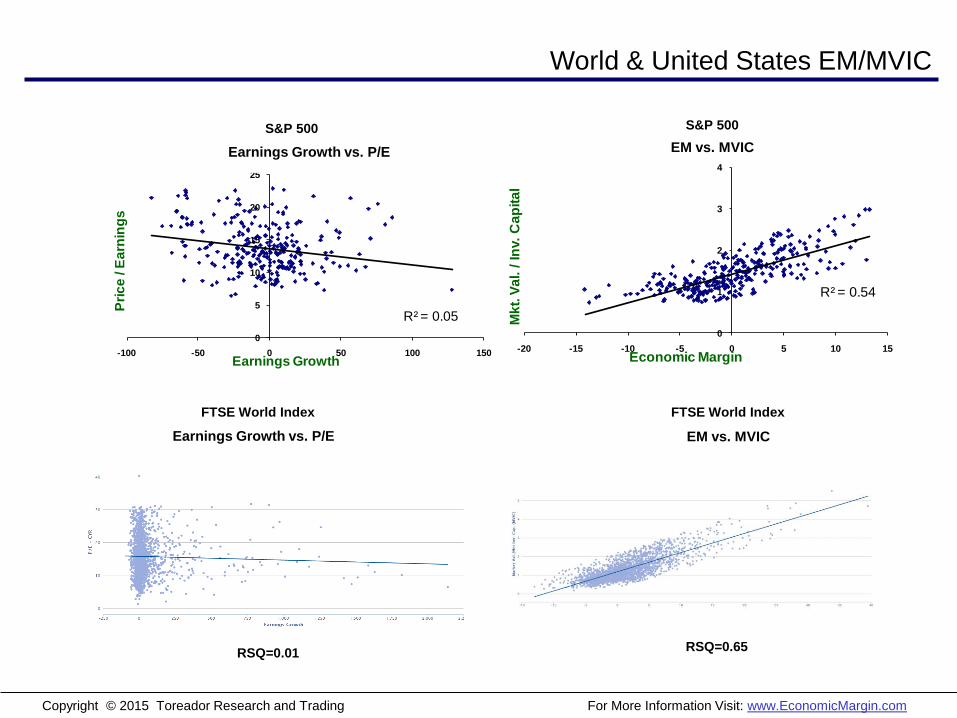
World & United States EM/MVIC
R² = 0.05
0
5
10
15
20
25
-100 -50 0 50 100 150
Pri
ce
/ E
arn
ing
s
Earnings Growth
Earnings Growth vs. P/E (United States 2009)Earnings Growth vs. P/E
R² = 0.54
0
1
2
3
4
-20 -15 -10 -5 0 5 10 15
Mk
t. V
al. /
In
v.
Ca
pit
al
Economic Margin
EM vs. MVIC (United States 2009)EM vs. MVIC
S&P 500 S&P 500
Earnings Growth vs. P/E EM vs. MVIC
FTSE World Index FTSE World Index
RSQ=0.01RSQ=0.65

Copyright © 2015 Toreador Research and Trading For More Information Visit: www.EconomicMargin.com
Linking Performance to Value
Copyright © 2015 Toreador Research and Trading For More Information Visit: www.EconomicMargin.com
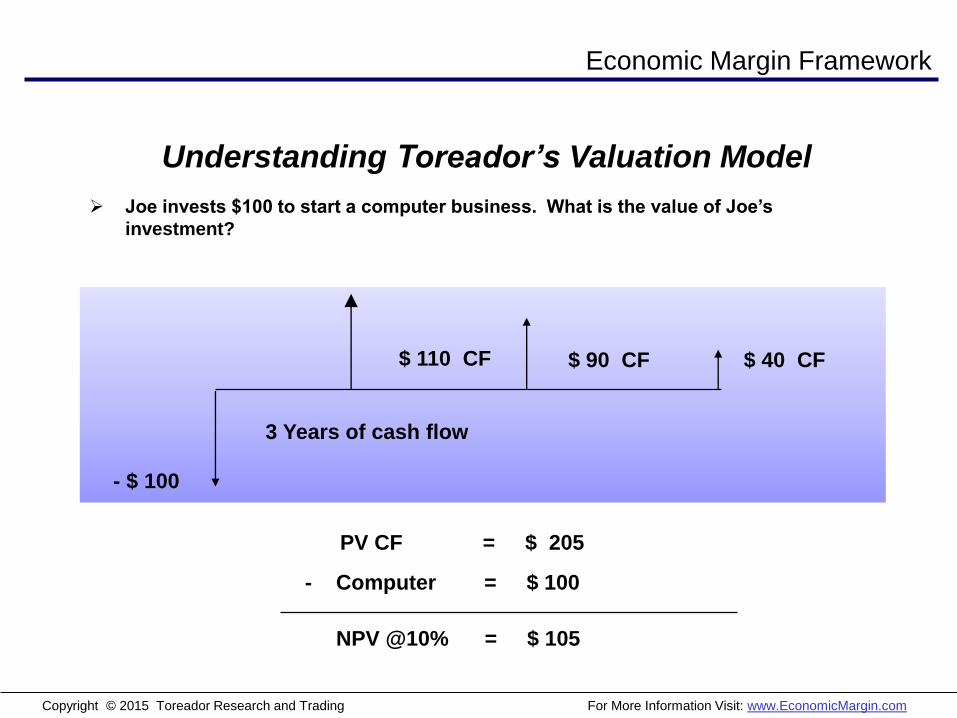
Economic Margin Framework
Joe invests $100 to start a computer business. What is the value of Joe’s
investment?
$ 90 CF
- $ 100
3 Years of cash flow
$ 110 CF $ 40 CF
PV CF = $ 205
NPV @10% = $ 105
- Computer = $ 100
Understanding Toreador’s Valuation Model

Copyright © 2015 Toreador Research and Trading For More Information Visit: www.EconomicMargin.com
A New Approach: Linking Performance to Value
Yr 1 Yr 2 Yr 3
+ Cash Flow 110 90 40
- Capital Charge 40 40 40
= Economic Profit 70 50 0
x PV Factor .91 .83 .75
= Economic Value 64 + 41 + 0 = 105
____ ____ ____
If EM=0, it Creates No Value Regardless of its EPS or Cash Flow!
Economic Margin = 70% 50% 0%
Economic Margin Framework

Copyright © 2015 Toreador Research and Trading For More Information Visit: www.EconomicMargin.com
Effects of Competition and Decay
Capturing Franchise Value: Economic Margin Decay

Copyright © 2015 Toreador Research and Trading For More Information Visit: www.EconomicMargin.com
Capturing Franchise Value: Economic Margin Decay
Historical Decay Analysis – Russell 1000® Index
Copyright © 2015 Toreador Research and Trading For More Information Visit: www.EconomicMargin.com
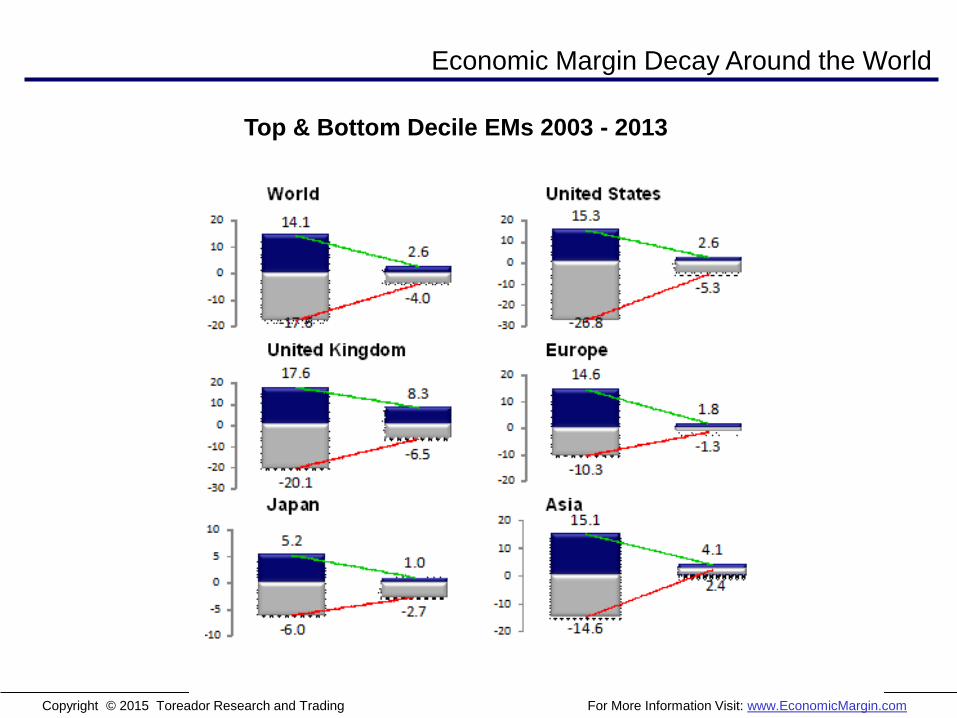
Economic Margin Decay Around the World
Top & Bottom Decile EMs 2003 - 2013

Copyright © 2015 Toreador Research and Trading For More Information Visit: www.EconomicMargin.com
Valuation – Cost of Capital
Copyright © 2015 Toreador Research and Trading For More Information Visit: www.EconomicMargin.com
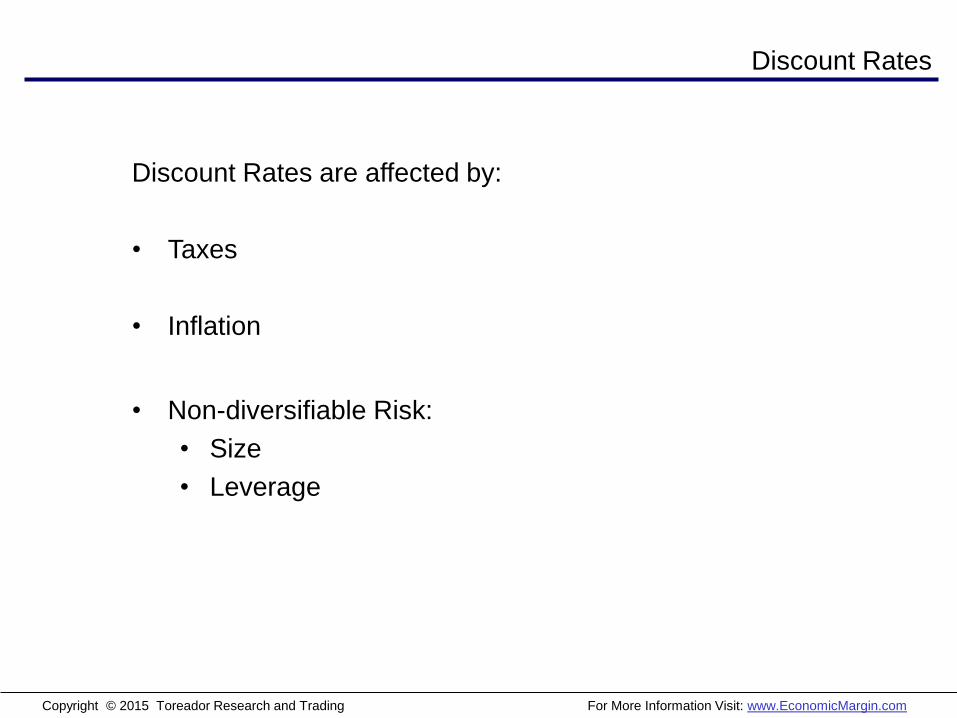
Discount Rates
Discount Rates are affected by:
• Taxes
• Inflation
• Non-diversifiable Risk:
• Size
• Leverage
Copyright © 2015 Toreador Research and Trading For More Information Visit: www.EconomicMargin.com
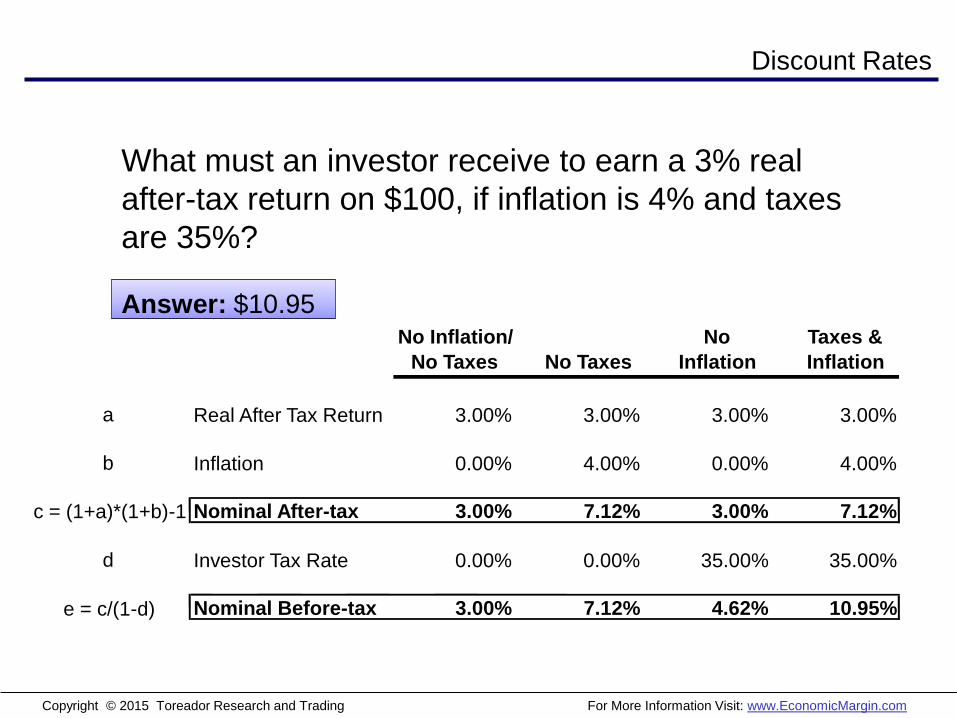
No Inflation/
No Taxes No Taxes
No
Inflation
Taxes &
Inflation
a Real After Tax Return 3.00% 3.00% 3.00% 3.00%
b Inflation 0.00% 4.00% 0.00% 4.00%
c = (1+a)*(1+b)-1 Nominal After-tax 3.00% 7.12% 3.00% 7.12%
d Investor Tax Rate 0.00% 0.00% 35.00% 35.00%
e = c/(1-d) Nominal Before-tax 3.00% 7.12% 4.62% 10.95%
What must an investor receive to earn a 3% real
after-tax return on $100, if inflation is 4% and taxes
are 35%?
Answer: $10.95
Discount Rates
Copyright © 2015 Toreador Research and Trading For More Information Visit: www.EconomicMargin.com
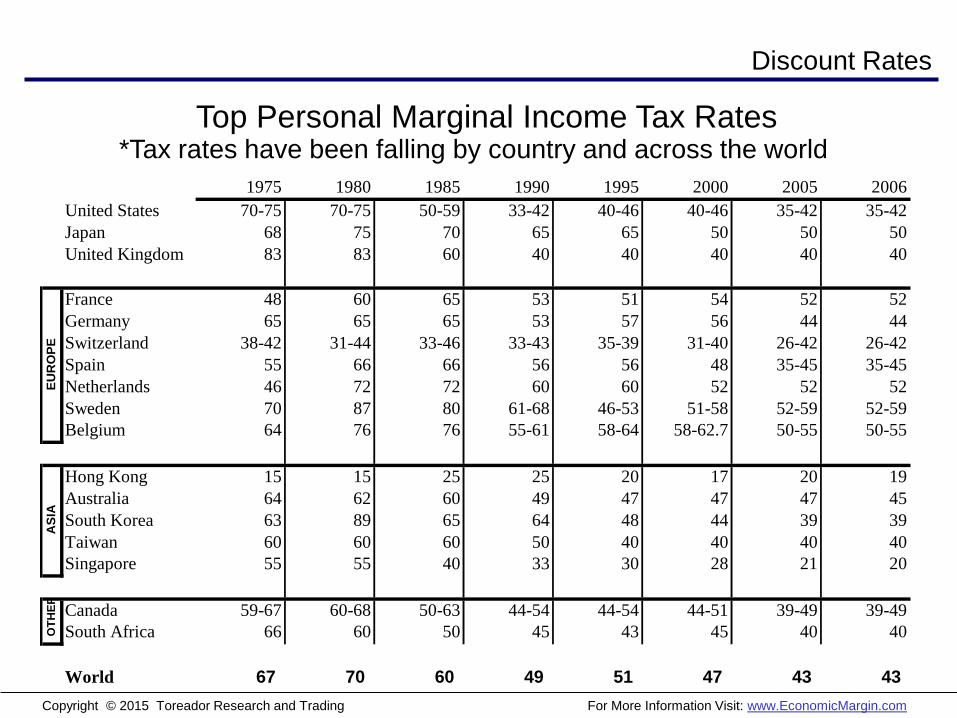
Discount Rates
*Tax rates have been falling by country and across the world
1975 1980 1985 1990 1995 2000 2005 2006
United States 70-75 70-75 50-59 33-42 40-46 40-46 35-42 35-42
Japan 68 75 70 65 65 50 50 50
United Kingdom 83 83 60 40 40 40 40 40
France 48 60 65 53 51 54 52 52
Germany 65 65 65 53 57 56 44 44
Switzerland 38-42 31-44 33-46 33-43 35-39 31-40 26-42 26-42
Spain 55 66 66 56 56 48 35-45 35-45
Netherlands 46 72 72 60 60 52 52 52
Sweden 70 87 80 61-68 46-53 51-58 52-59 52-59
Belgium 64 76 76 55-61 58-64 58-62.7 50-55 50-55
Hong Kong 15 15 25 25 20 17 20 19
Australia 64 62 60 49 47 47 47 45
South Korea 63 89 65 64 48 44 39 39
Taiwan 60 60 60 50 40 40 40 40
Singapore 55 55 40 33 30 28 21 20
Canada 59-67 60-68 50-63 44-54 44-54 44-51 39-49 39-49
South Africa 66 60 50 45 43 45 40 40
World 67 70 60 49 51 47 43 43
EU
RO
PE
AS
IAO
TH
ER
Top Personal Marginal Income Tax Rates

Copyright © 2015 Toreador Research and Trading For More Information Visit: www.EconomicMargin.com
Discount Rates
WORLD US
1980-89 1990-99 2000-08 1980-89 2000-08
Real After-Tax Equity Rate 3.0% 3.0% 3.0% 3.0% 3.0%
Inflation 5.0% 2.3% 1.7% 4.9% 2.4%
Nominal After-Tax Equity Rate 8.2% 5.3% 4.8% 8.0% 5.5%
Tax-Rate 60% 51% 43% 55% 39%
Nominal Before-Tax Equity Rate 20.3% 10.9% 8.4% 17.8% 8.9%
Lower inflation and investor tax rates have dropped required
equity rates by approximately half from 1980 levels.
Going forward, where will the current government fiscal policies
take us?

Copyright © 2015 Toreador Research and Trading For More Information Visit: www.EconomicMargin.com
Discount Rates
Median Market Derived Discount Rates By Country

Copyright © 2015 Toreador Research and Trading For More Information Visit: www.EconomicMargin.com
Discount Rates
Discount Rates: Size & Leverage Effect
Copyright © 2015 Toreador Research and Trading For More Information Visit: www.EconomicMargin.com
Does Intrinsic Value Make Sense?

Copyright © 2015 Toreador Research and Trading For More Information Visit: www.EconomicMargin.com
Source: AFGView client databases 1991-2014
Valuation Metric Quintile Analysis – Russell 1000® Index

Copyright © 2015 Toreador Research and Trading For More Information Visit: www.EconomicMargin.com
-15%
-10%
-5%
0%
5%
10%
15%
F A
A vs. F Percent to Target – Current Spreads: Global and US Analysis
AFG International Backtest Database: Percent to Target - Current [Global Quintile By Sector] from 12/31/91 to 12/31/14
Universe Size: 5,200 to 14,100 Companies - Global Analysis | All Sectors | All Cap | ADRs Excluded
COUNTRY ANALYSIS
‘
SECTOR ANALYSIS SIZE/STYLE
‘
SECTOR ANALYSIS SIZE/STYLE INDEX/ADR
AFG International Backtest Database: Percent to Target - Current [Global Quintile By Sector] from 12/31/91 to
12/31/14 Universe Size: 2,200 to 5,400 Companies - United States | All Sectors | All Cap | ADRs Included
Global Analysis United States Analysis

Copyright © 2015 Toreador Research and Trading For More Information Visit: www.EconomicMargin.com
After Such A Long Run, We have Reached
The Stare Down

Copyright © 2015 Toreador Research and Trading For More Information Visit: www.EconomicMargin.com
Valuation Trends
• Plot standardized valuation levels vs warning bands
• Categories: US, International, Size (Large, Mid, Small), Leverage,
Style (Value, Growth), & Sectors
• Period: 12/31/1991 to 1/31/2015
• US Traded Stocks
Valuation and Market Cycles

Copyright © 2015 Toreador Research and Trading For More Information Visit: www.EconomicMargin.com
US Equities: ALL
Upside %: December 1991- Jan 2015

Copyright © 2015 Toreador Research and Trading For More Information Visit: www.EconomicMargin.com
INTL Equities: All
Upside %: December 1991- Jan 2015

Copyright © 2015 Toreador Research and Trading For More Information Visit: www.EconomicMargin.com
US Equities: Mid
Upside %: December 1991- Jan 2015
Copyright © 2015 Toreador Research and Trading For More Information Visit: www.EconomicMargin.com
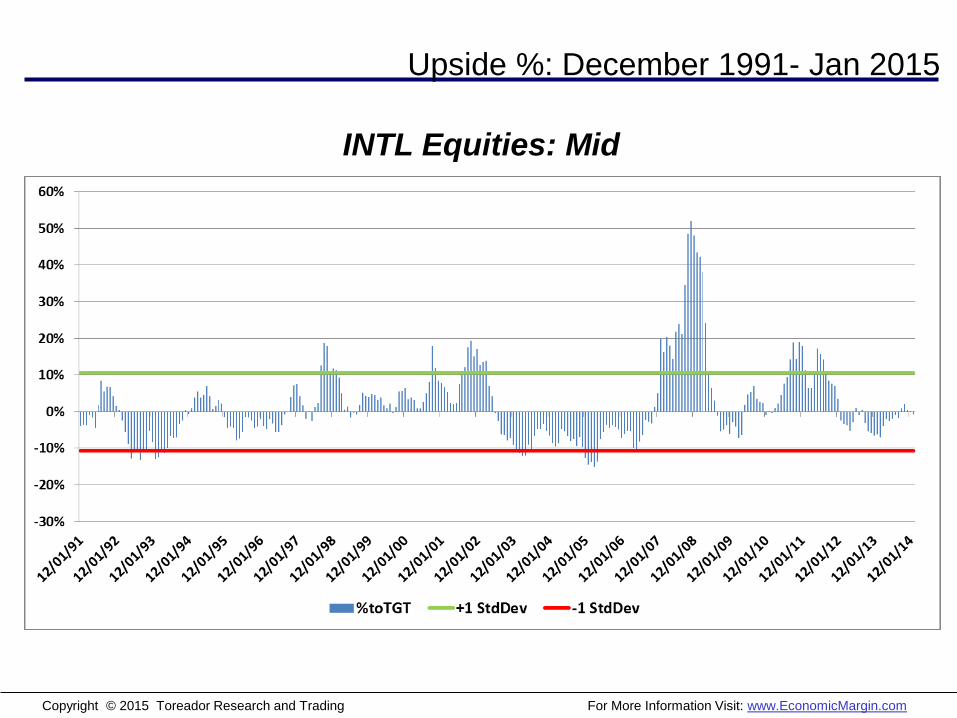
INTL Equities: Mid
Upside %: December 1991- Jan 2015
Copyright © 2015 Toreador Research and Trading For More Information Visit: www.EconomicMargin.com
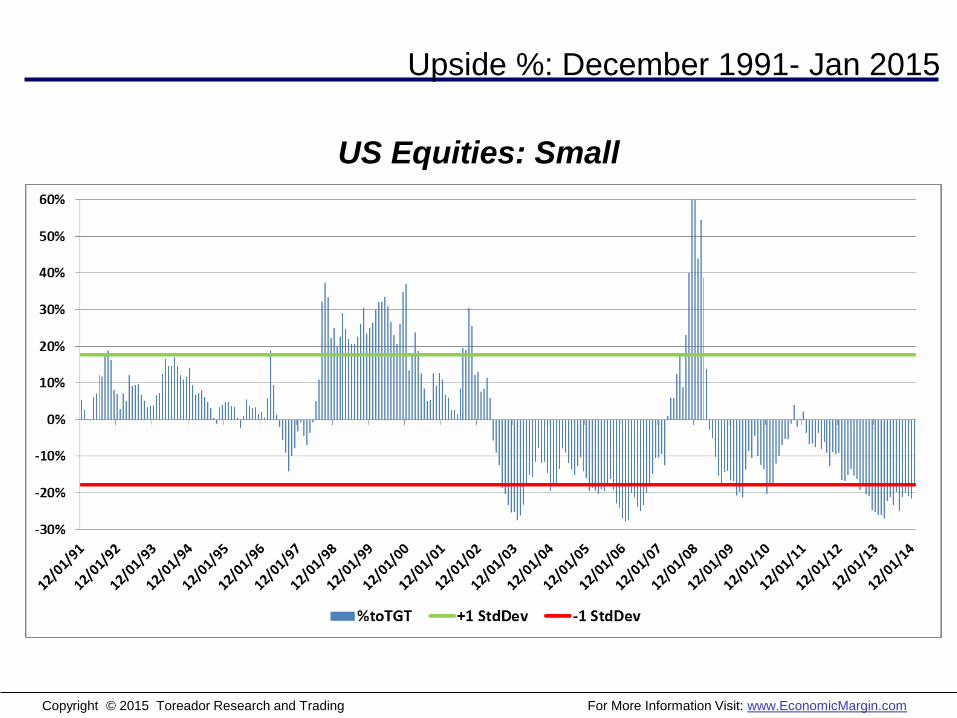
US Equities: Small
Upside %: December 1991- Jan 2015

Copyright © 2015 Toreador Research and Trading For More Information Visit: www.EconomicMargin.com
INTL Equities: Small
Upside %: December 1991- Jan 2015
Copyright © 2015 Toreador Research and Trading For More Information Visit: www.EconomicMargin.com
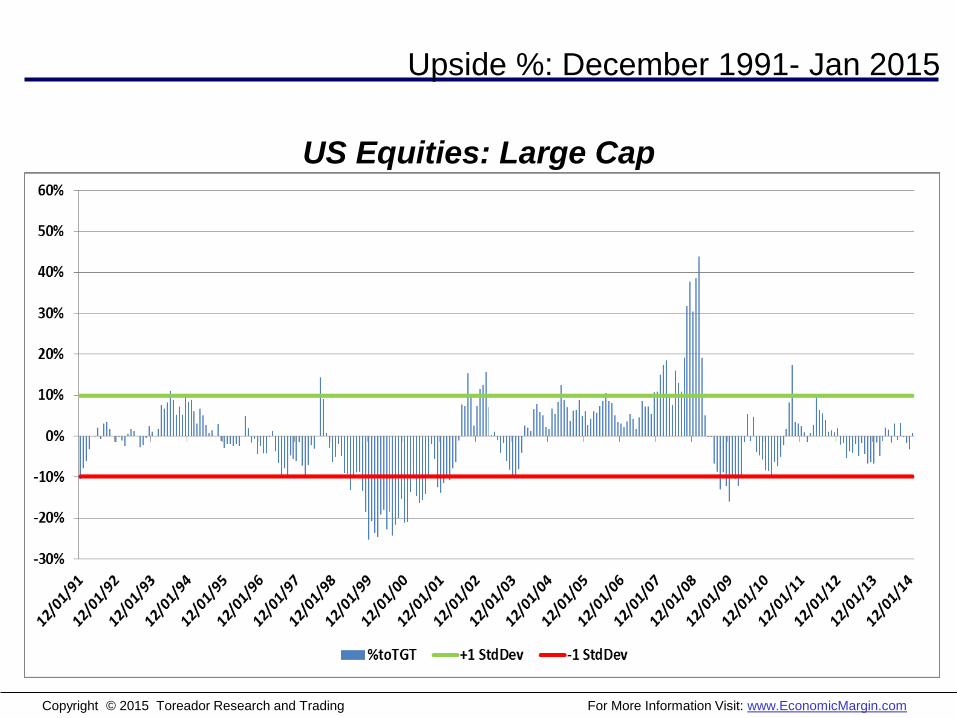
US Equities: Large Cap
Upside %: December 1991- Jan 2015

Copyright © 2015 Toreador Research and Trading For More Information Visit: www.EconomicMargin.com
INTL Equities : Large
Upside %: December 1991- Jan 2015

Copyright © 2015 Toreador Research and Trading For More Information Visit: www.EconomicMargin.com
US vs. Intl Upside Characteristics
• As measured by Percent to Target, US and Intl
Large Cap equities appear similarly valued for
upside potential
• International Equities have slightly higher
upside than US equities, though this has
varied over the past 6 months with US equities
at times appearing to have slightly higher
upside
• International QE Programs provide a support
catalyst for Intl equities that no longer exists
for US stocks, increasing Intl attractiveness

Copyright © 2015 Toreador Research and Trading For More Information Visit: www.EconomicMargin.com
US vs. Intl
• US and Intl Cost of Capital have converged over the last 20 years
• International QE maybe be the catalyst that brings the rates together again in the
near future.
• From an equity risk premium perspective, international equities offer much more
attractive risk/return opportunities
Implied Future Returns

Copyright © 2015 Toreador Research and Trading For More Information Visit: www.EconomicMargin.com
US vs. Intl Implied Future Returns
• Though upside as measured by Percent to Target is similar for US and
Intl Large Cap stocks, implied future returns are more favorable for
Intl stocks
• As of Jan 30, 2015 the market derived rate of return to Intl equities was
approximately 100bps higher than for US equities
• If we increase the cost of capital for US stocks by 100 bps, they
become approximately 15% over-valued, making Intl equities quite a
bit more attractive on a relative basis.
• As measured from an Equity Risk Premium perspective, International
Equities become even more appealing

Copyright © 2015 Toreador Research and Trading For More Information Visit: www.EconomicMargin.com
Discount Rates
5.25
6.586.17
9.73
7.157.53
6.15
0
2
4
6
8
10
12
US Canada UK Germany Japan Europe ex. UK&GER Asia ex. JPN
GLOBAL EQUITY RISK PREMIUMS

Copyright © 2015 Toreador Research and Trading For More Information Visit: www.EconomicMargin.com
Conclusions
• Don’t be a hero – Large Cap stocks domestically and
internationally are likely the best equity class at the
moment
• International QE programs are likely to provide an
ongoing trend to reduce cost of capital globally back
towards US levels, making international equities
particularly attractive
• Strategically, any weakness internationally should be
exploited to ensure portfolios are at least market
neutral internationally
• Specific stock picks should consider both valuation
and momentum – those interested, attend our portfolio
workshop – March 31st at the St Regis
Copyright © 2015 Toreador Research and Trading For More Information Visit: www.EconomicMargin.com
Disclaimers
The Applied Finance Group, Ltd. certifies that the views expressed in this report accurately reflect the firm's models. The information in this
report is based on material we believe to be accurate and reliable, however, the accuracy and completeness of the material and conclusions
derived from said material are not guaranteed. The information is not intended to be used as the primary basis of investment decisions, and
The Applied Finance Group, Ltd. makes no recommendation as to the suitability of such investments for any person. Any opinions and
projections expressed herein reflect our judgment at this date and are subject to change without notice. Due to individual investor
requirements, this information should not be construed as advice meant to meet the investment needs of any investor. This information is
not an offer to buy or sell, or a solicitation of an offer to buy or sell any securities.
The Applied Finance Group, Ltd, its owners, employees and/or customers may have positions in the securities whose information is
available on this report. No part of this report may be reproduced, copied, redistributed or posted without prior consent of The Applied
Finance Group, Ltd.
Russell Investment Group is the source and owner of the Russell Index data contained or reflected in this material and all trademarks and
copyrights related thereto. Recipient of this Russell Index data is prohibited from making any further redistribution of the Russell Index data
included in this material. Russell Investment Group is not responsible for the formatting or configuration of this material or for any
inaccuracy in AFG’s presentation thereof..
All the information contained in this report is the property of The Applied Finance Group, Ltd. © 2012.
Contact Us
Illinois
The Applied Finance Group, Ltd.
105 W. Adams, Suite 2105
Chicago, IL 60603
(312) 362-9903
California
The Applied Finance Group, Ltd.
7493 N. Ingram Ave., Suite 104
Fresno, CA 93711
(559) 436-4270
Toreador Research and Trading