torque and joint angle collective for...
TRANSCRIPT

1-1-co
Torque and joint angle collective for driveshafts Acquire joint angle measurement data and compile a torque and joint angle collective Master of Science Thesis in Product Development Fredrik Doberauer Daniel Högberg Department of Product and Production Development Division of Product Development CHALMERS UNIVERSITY OF TECHNOLOGY Gothenburg, Sweden, 2012
Abstract When setting requirements on driveshaft joints, the joints articulated angle is of great importance. The occurrence and magnitude of the articulated angles affects the life-length, weight and cost of the driveshaft joints are therefore important to measure and analyze. Due to the high rotational speed of an operating driveshaft, measuring the vertical articulation angle is difficult. The master thesis presents a method for measuring the vertical articulation angle of front-wheel driveshafts in a car as well as a script to compile a torque and joint angle collective and manage acquired measurement data that can be used as a base when setting requirements on driveshafts. Several concept models of the measurement equipment has been developed and evaluated with respect to the usability and the measurement accuracy. The solution measures the angle of the linkage arms and relates that angle to the vertical articulation angle of the driveshafts with an accuracy of approximately 0.5°. The script is programmed in MATLAB and imports structured measurement data in order to compile the data according to a set of classification methods. To perform necessary calculations other measurement signals are required, such as the horizontal articulation angle. The horizontal articulation angle is calibrated against the cars steering angle. Results are directly applicable on Volvo cars based on the current platform (EUCD) but can with a slight design change be applied on other cars and platforms. Keywords: driveshaft, joint, angle, articulation, car, measure, rainflow, duty value, load collective, torque, level crossings
Table of Contents
1. Introduction ................................................................................................................. 1 1.1. Purpose ................................................................................................................................... 1 1.2. Delimitations ........................................................................................................................ 1
2. Background .................................................................................................................. 3 2.1. Volvo Cars Corporation ..................................................................................................... 3 2.2. Driveshafts and Measurements ...................................................................................... 3
3. Literature Study .............................................................................................................. 5 3.1. Driveshafts and Joints ........................................................................................................ 5
3.1.1. Universal Joints ........................................................................................................................... 5 3.1.2. Constant Velocity Joints ........................................................................................................... 7 3.1.3. Fixed Joint Designs .................................................................................................................... 8 3.1.4. Plunging Joint Designs ............................................................................................................. 8
3.2. Data Classification Methods............................................................................................. 9 3.2.1. Torque and Joint Angle Collective ....................................................................................... 9 3.2.2. Duty Value ..................................................................................................................................... 9 3.2.3. Level Crossings ........................................................................................................................... 9 3.2.4. Rainflow ...................................................................................................................................... 10
4. Methodology ................................................................................................................. 11
5. Results: Acquiring Measurement Data ................................................................ 13 5.1. Measurement Equipment Requirements ..................................................................13 5.2. Concept Generation ..........................................................................................................13
5.2.1. Clarifying the Problem .......................................................................................................... 13 5.2.2. External Search ........................................................................................................................ 14 5.2.3. Internal Search ......................................................................................................................... 14 5.2.4. Concept Combination ............................................................................................................ 15
5.3. Concepts ................................................................................................................................15 5.3.1. Photo-Electric Sensor ............................................................................................................ 16 5.3.2. Compact Sensor ....................................................................................................................... 17 5.3.3. Angle Sensor .............................................................................................................................. 17 5.3.4. Snap-on ....................................................................................................................................... 18 5.3.5. Roller ............................................................................................................................................ 18
5.4. Concept Screening .............................................................................................................18 5.5. Concept Scoring ..................................................................................................................21 5.6. Detailed Design ..................................................................................................................23
5.6.1. Gearbox fixture ........................................................................................................................ 24 5.6.2. Engine fixture ........................................................................................................................... 24
5.7. Calibration ...........................................................................................................................26 5.7.1. Calibration of angle sensors ............................................................................................... 26 5.7.2. Calibration diagrams ............................................................................................................. 28 5.7.3. Test of calibration ................................................................................................................... 29 5.7.4. Sources of error ....................................................................................................................... 30
5.8. Measurements ....................................................................................................................31
6. Results: Managing Acquired Measurement Data ............................................. 32 6.1. Articulated Angle ...............................................................................................................32 6.2. Interface ................................................................................................................................33
6.2.1. Functions and Workflow ...................................................................................................... 34 6.2.2. Torque and Joint Angle Collective .................................................................................... 36 6.2.3. Example of Plots ...................................................................................................................... 36
7. Discussion ...................................................................................................................... 38 7.1. General discussion ............................................................................................................38
7.1.1. Development Phase ................................................................................................................ 38 7.1.2. Fixtures ....................................................................................................................................... 40
7.2. Methodology ........................................................................................................................41 7.3. Measurement equipment ...............................................................................................43 7.4. Script ......................................................................................................................................43
6.4.1. Script workflow ....................................................................................................................... 43 7.4.2. Torque and Joint Angle Collective matrix ..................................................................... 44 7.4.3. Duty Value .................................................................................................................................. 44 7.4.4. Level Crossings ........................................................................................................................ 45 7.4.5. Rainflow ...................................................................................................................................... 45
7.5. Reflections on Previous Relevant Knowledge ........................................................45 7.6. Sustainable Development ...............................................................................................46 7.7. Further Development ......................................................................................................46
7.7.1. Measurement Equipment .................................................................................................... 46 7.7.2. Script ............................................................................................................................................ 46
8. Conclusions ................................................................................................................... 47 8.1. Measurement Equipment ........................................................................................................ 47 8.2. Script ................................................................................................................................................ 47
References .......................................................................................................................... 48
APPENDIX 1: Drawings of the fixtures for the measurement system .............. 1
APPENDIX 2: Calibration Diagrams .............................................................................. 4
APPENDIX 3: Gantt Chart ................................................................................................. 6
1
1. Introduction The report describes in detail the development of a measurement equipment to acquire data on joint angle as well as a method to compile a torque and joint angle collective.
1.1. Purpose The purpose of the master thesis is to investigate how to acquire measurement data of the vertical articulation angles on the front-wheel driveshafts of a Volvo car by using physical measurement equipment. Furthermore, the purpose is also to develop a method to compile and present acquired measurement data as a torque and joint angle collective among with a set of other classification methods. The method to manage acquired measurement data can be used as a basis to set the requirements of the front-wheel driveshafts in order to raise the life-length as well as lower the cost and weight of the front-wheel driveshafts. The classifications shall be based on the angles of the joints, the torque for the driveshaft and the number of revolutions at a given composite angle and/or torque range. The master thesis is to result in a measurement method that physically acquires accurate measurement data in all situations that may occur during the Volvo Cars Corporation test programs. It shall be easy to use and possible to adapt and implement on other Volvo car models. Furthermore, the method to manage acquired measurement data should be user friendly and present the data in a structured way.
1.2. Delimitations The project is limited to acquire measurement data and present a torque and joint angle collective based on the following parameters: Vertical articulation angle of the front inner joints. Steering angle of the front outer joints. Torque in the front driveshafts. The number of revolutions of the front driveshafts. Data for other important parameters such as vehicle speed and time are also acquired since it is needed to compile and calculate the torque and joint angle collective. Further on, a few simplifications and assumptions are made: Only physical measurement methods will be investigated (no simulation
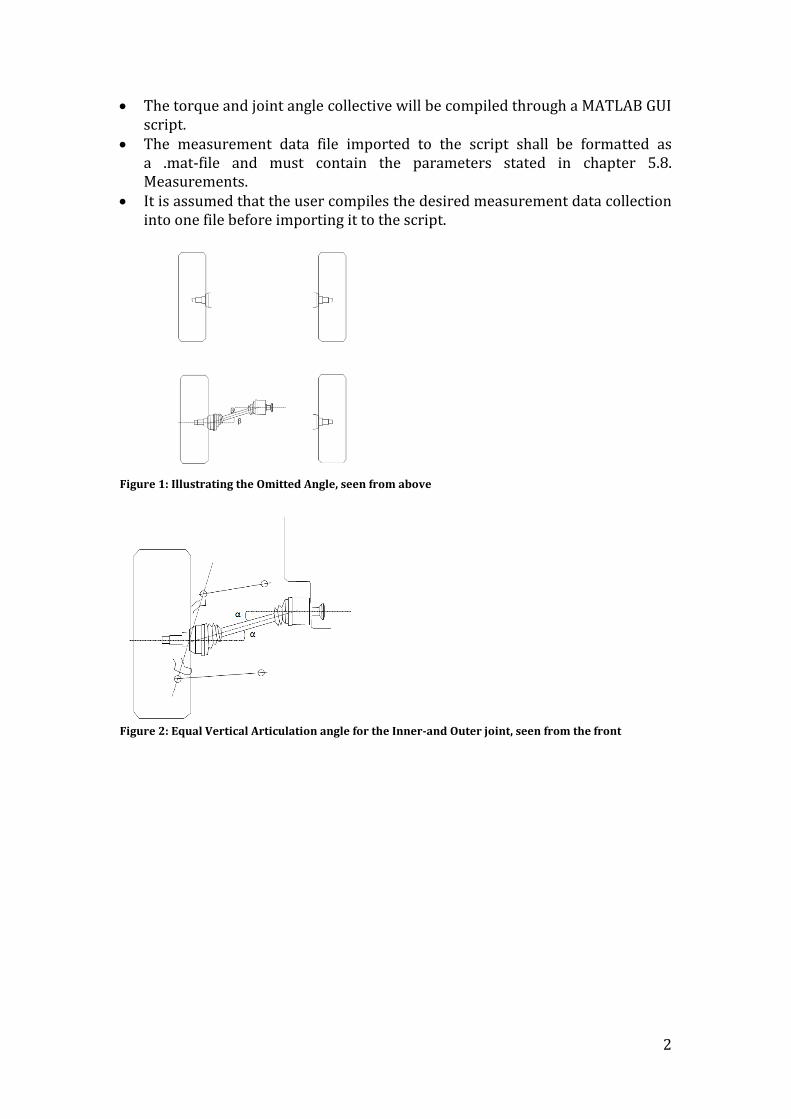
methods will be evaluated). No sub frame movements are measured. The problem is simplified by assuming that the horizontal angle change of the
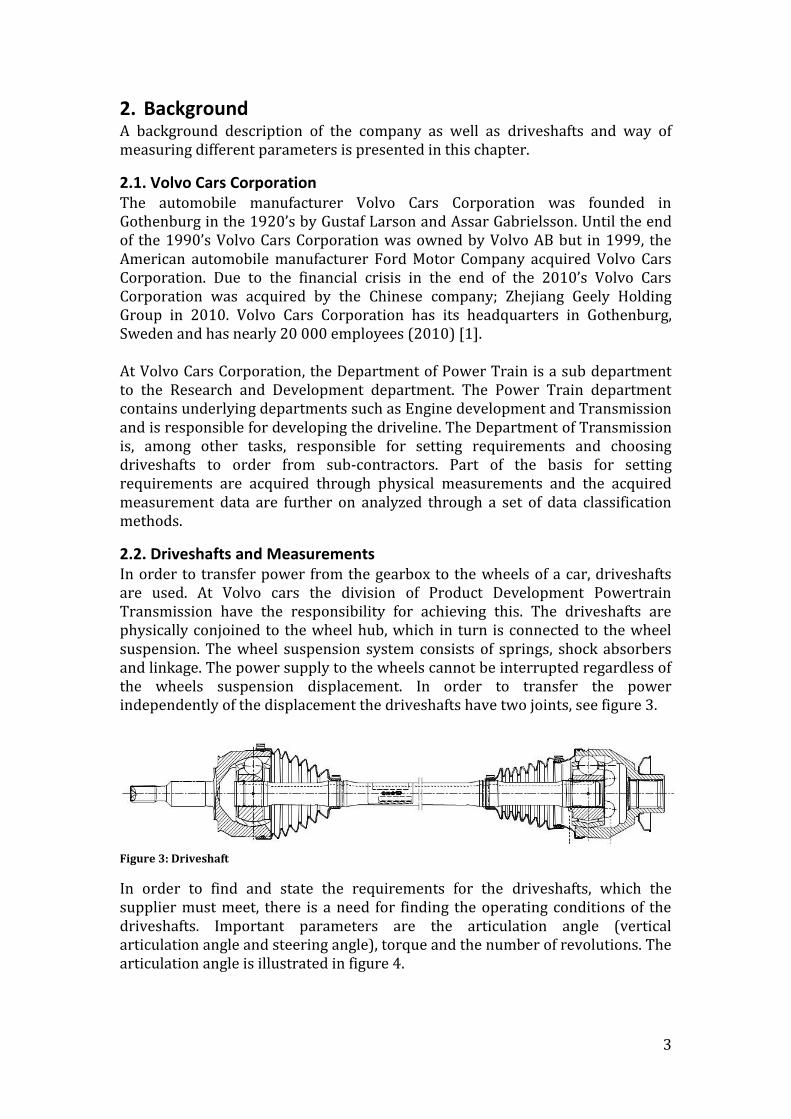
inner joints is zero, see figure 1. It is assumed that the vertical articulation angle of the outer and inner joint is
equal, see figure 2.
2
The torque and joint angle collective will be compiled through a MATLAB GUI script.
The measurement data file imported to the script shall be formatted as a .mat-file and must contain the parameters stated in chapter 5.8. Measurements.
It is assumed that the user compiles the desired measurement data collection into one file before importing it to the script.
Figure 1: Illustrating the Omitted Angle, seen from above
Figure 2: Equal Vertical Articulation angle for the Inner-and Outer joint, seen from the front
3
2. Background A background description of the company as well as driveshafts and way of measuring different parameters is presented in this chapter.
2.1. Volvo Cars Corporation The automobile manufacturer Volvo Cars Corporation was founded in Gothenburg in the 1920’s by Gustaf Larson and Assar Gabrielsson. Until the end of the 1990’s Volvo Cars Corporation was owned by Volvo AB but in 1999, the American automobile manufacturer Ford Motor Company acquired Volvo Cars Corporation. Due to the financial crisis in the end of the 2010’s Volvo Cars Corporation was acquired by the Chinese company; Zhejiang Geely Holding Group in 2010. Volvo Cars Corporation has its headquarters in Gothenburg, Sweden and has nearly 20 000 employees (2010) [1]. At Volvo Cars Corporation, the Department of Power Train is a sub department to the Research and Development department. The Power Train department contains underlying departments such as Engine development and Transmission and is responsible for developing the driveline. The Department of Transmission is, among other tasks, responsible for setting requirements and choosing driveshafts to order from sub-contractors. Part of the basis for setting requirements are acquired through physical measurements and the acquired measurement data are further on analyzed through a set of data classification methods.
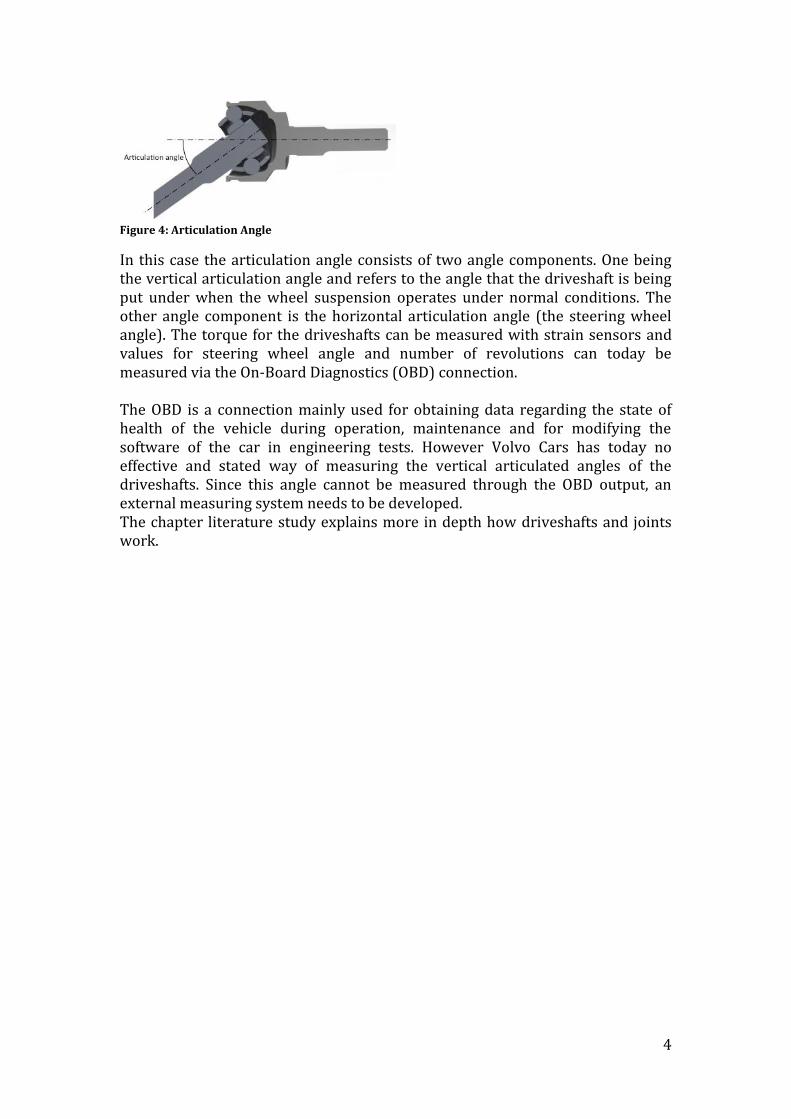
2.2. Driveshafts and Measurements In order to transfer power from the gearbox to the wheels of a car, driveshafts are used. At Volvo cars the division of Product Development Powertrain Transmission have the responsibility for achieving this. The driveshafts are physically conjoined to the wheel hub, which in turn is connected to the wheel suspension. The wheel suspension system consists of springs, shock absorbers and linkage. The power supply to the wheels cannot be interrupted regardless of the wheels suspension displacement. In order to transfer the power independently of the displacement the driveshafts have two joints, see figure 3.
Figure 3: Driveshaft
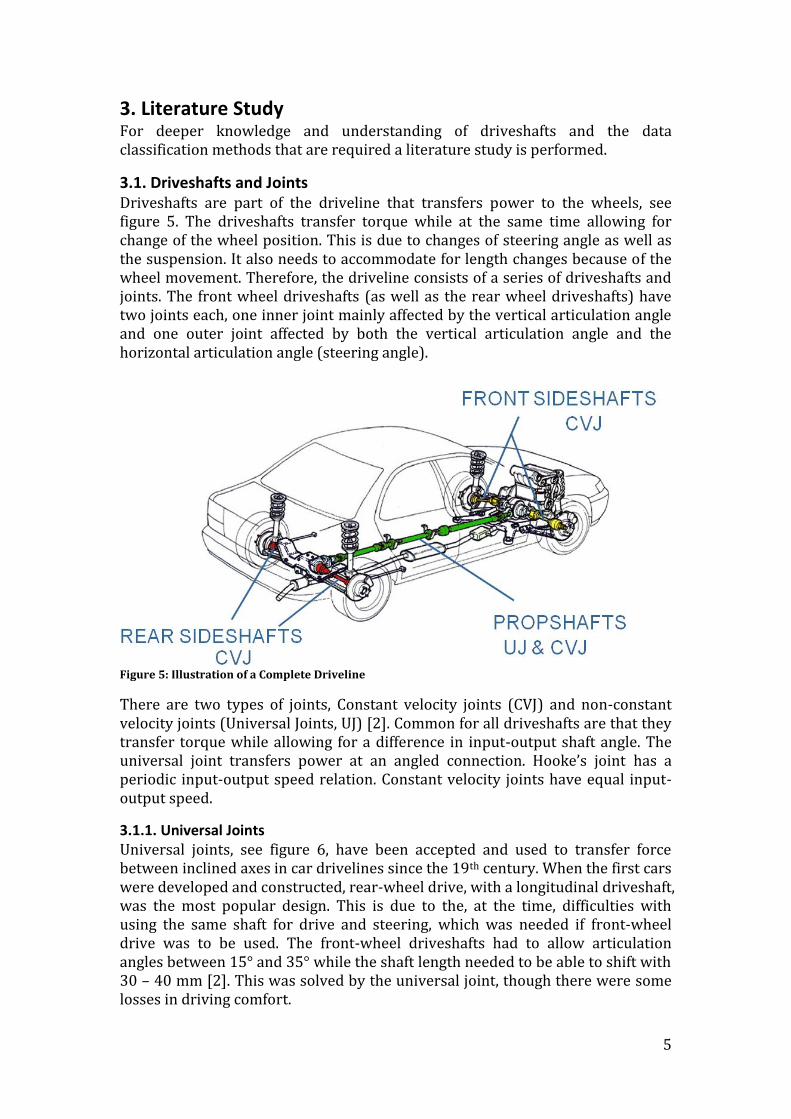
In order to find and state the requirements for the driveshafts, which the supplier must meet, there is a need for finding the operating conditions of the driveshafts. Important parameters are the articulation angle (vertical articulation angle and steering angle), torque and the number of revolutions. The articulation angle is illustrated in figure 4.
4
Figure 4: Articulation Angle
In this case the articulation angle consists of two angle components. One being the vertical articulation angle and refers to the angle that the driveshaft is being put under when the wheel suspension operates under normal conditions. The other angle component is the horizontal articulation angle (the steering wheel angle). The torque for the driveshafts can be measured with strain sensors and values for steering wheel angle and number of revolutions can today be measured via the On-Board Diagnostics (OBD) connection. The OBD is a connection mainly used for obtaining data regarding the state of health of the vehicle during operation, maintenance and for modifying the software of the car in engineering tests. However Volvo Cars has today no effective and stated way of measuring the vertical articulated angles of the driveshafts. Since this angle cannot be measured through the OBD output, an external measuring system needs to be developed. The chapter literature study explains more in depth how driveshafts and joints work.
5
3. Literature Study For deeper knowledge and understanding of driveshafts and the data classification methods that are required a literature study is performed.
3.1. Driveshafts and Joints Driveshafts are part of the driveline that transfers power to the wheels, see figure 5. The driveshafts transfer torque while at the same time allowing for change of the wheel position. This is due to changes of steering angle as well as the suspension. It also needs to accommodate for length changes because of the wheel movement. Therefore, the driveline consists of a series of driveshafts and joints. The front wheel driveshafts (as well as the rear wheel driveshafts) have two joints each, one inner joint mainly affected by the vertical articulation angle and one outer joint affected by both the vertical articulation angle and the horizontal articulation angle (steering angle).
Figure 5: Illustration of a Complete Driveline
There are two types of joints, Constant velocity joints (CVJ) and non-constant velocity joints (Universal Joints, UJ) [2]. Common for all driveshafts are that they transfer torque while allowing for a difference in input-output shaft angle. The universal joint transfers power at an angled connection. Hooke’s joint has a periodic input-output speed relation. Constant velocity joints have equal input-output speed.
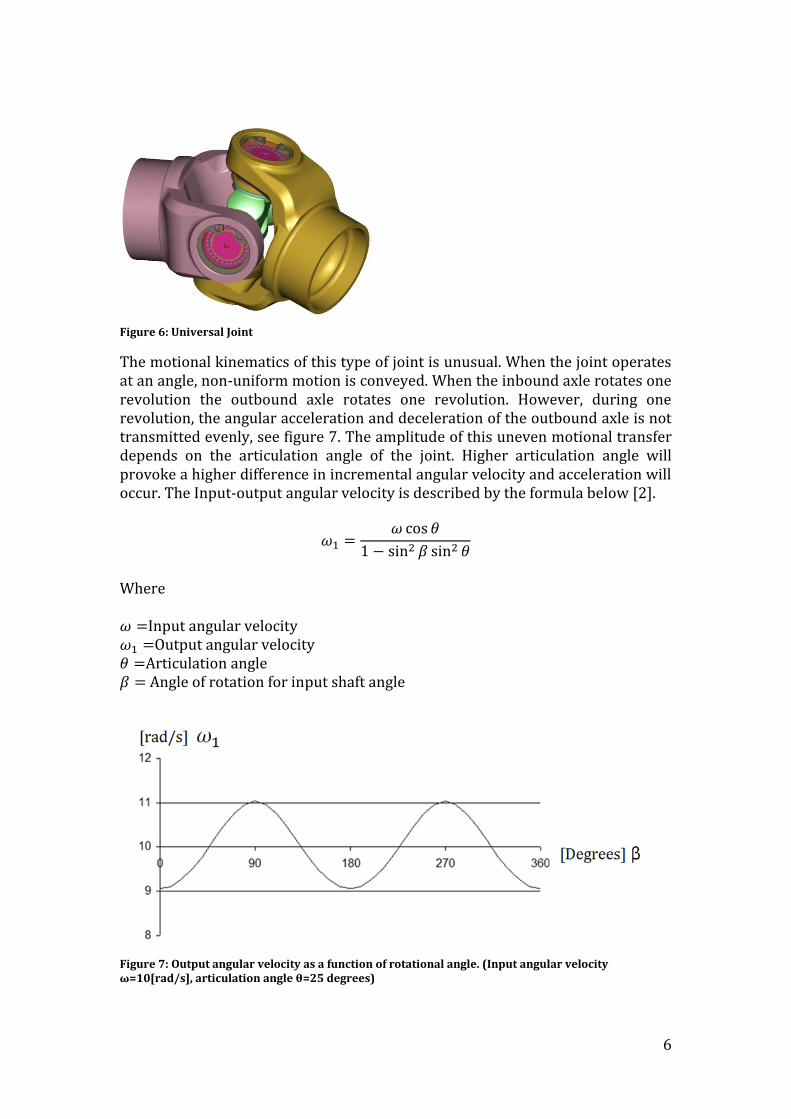
3.1.1. Universal Joints Universal joints, see figure 6, have been accepted and used to transfer force between inclined axes in car drivelines since the 19th century. When the first cars were developed and constructed, rear-wheel drive, with a longitudinal driveshaft, was the most popular design. This is due to the, at the time, difficulties with using the same shaft for drive and steering, which was needed if front-wheel drive was to be used. The front-wheel driveshafts had to allow articulation angles between 15° and 35° while the shaft length needed to be able to shift with 30 – 40 mm [2]. This was solved by the universal joint, though there were some losses in driving comfort.
6
Figure 6: Universal Joint
The motional kinematics of this type of joint is unusual. When the joint operates at an angle, non-uniform motion is conveyed. When the inbound axle rotates one revolution the outbound axle rotates one revolution. However, during one revolution, the angular acceleration and deceleration of the outbound axle is not transmitted evenly, see figure 7. The amplitude of this uneven motional transfer depends on the articulation angle of the joint. Higher articulation angle will provoke a higher difference in incremental angular velocity and acceleration will occur. The Input-output angular velocity is described by the formula below [2].
Where Input angular velocity Output angular velocity Articulation angle Angle of rotation for input shaft angle
Figure 7: Output angular velocity as a function of rotational angle. (Input angular velocity ω=10[rad/s], articulation angle θ=25 degrees)
7
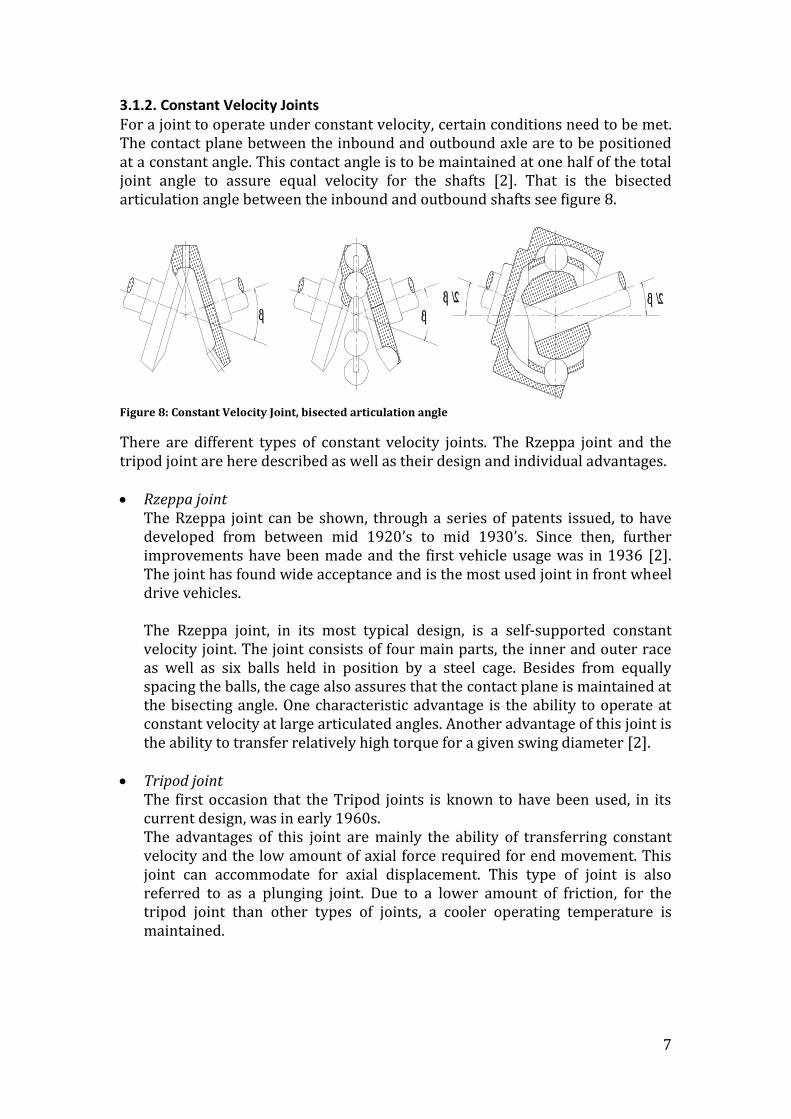
3.1.2. Constant Velocity Joints For a joint to operate under constant velocity, certain conditions need to be met. The contact plane between the inbound and outbound axle are to be positioned at a constant angle. This contact angle is to be maintained at one half of the total joint angle to assure equal velocity for the shafts [2]. That is the bisected articulation angle between the inbound and outbound shafts see figure 8.
Figure 8: Constant Velocity Joint, bisected articulation angle
There are different types of constant velocity joints. The Rzeppa joint and the tripod joint are here described as well as their design and individual advantages. Rzeppa joint
The Rzeppa joint can be shown, through a series of patents issued, to have developed from between mid 1920’s to mid 1930’s. Since then, further improvements have been made and the first vehicle usage was in 1936 [2]. The joint has found wide acceptance and is the most used joint in front wheel drive vehicles. The Rzeppa joint, in its most typical design, is a self-supported constant velocity joint. The joint consists of four main parts, the inner and outer race as well as six balls held in position by a steel cage. Besides from equally spacing the balls, the cage also assures that the contact plane is maintained at the bisecting angle. One characteristic advantage is the ability to operate at constant velocity at large articulated angles. Another advantage of this joint is the ability to transfer relatively high torque for a given swing diameter [2].
Tripod joint
The first occasion that the Tripod joints is known to have been used, in its current design, was in early 1960s. The advantages of this joint are mainly the ability of transferring constant velocity and the low amount of axial force required for end movement. This joint can accommodate for axial displacement. This type of joint is also referred to as a plunging joint. Due to a lower amount of friction, for the tripod joint than other types of joints, a cooler operating temperature is maintained.
8
The Tripod joint has one major disadvantage hindering it from being used in applications with relatively high rotational speeds and large angles. This is due to the fact that the center of the spider plane moves around the center of the joint in a circular motion for articulated angles larger than zero. For each revolution of the joint this center completes three rotational laps [2]. This orbiting motion produces an inertia effect that increases in magnitude with the size of the outer housing.
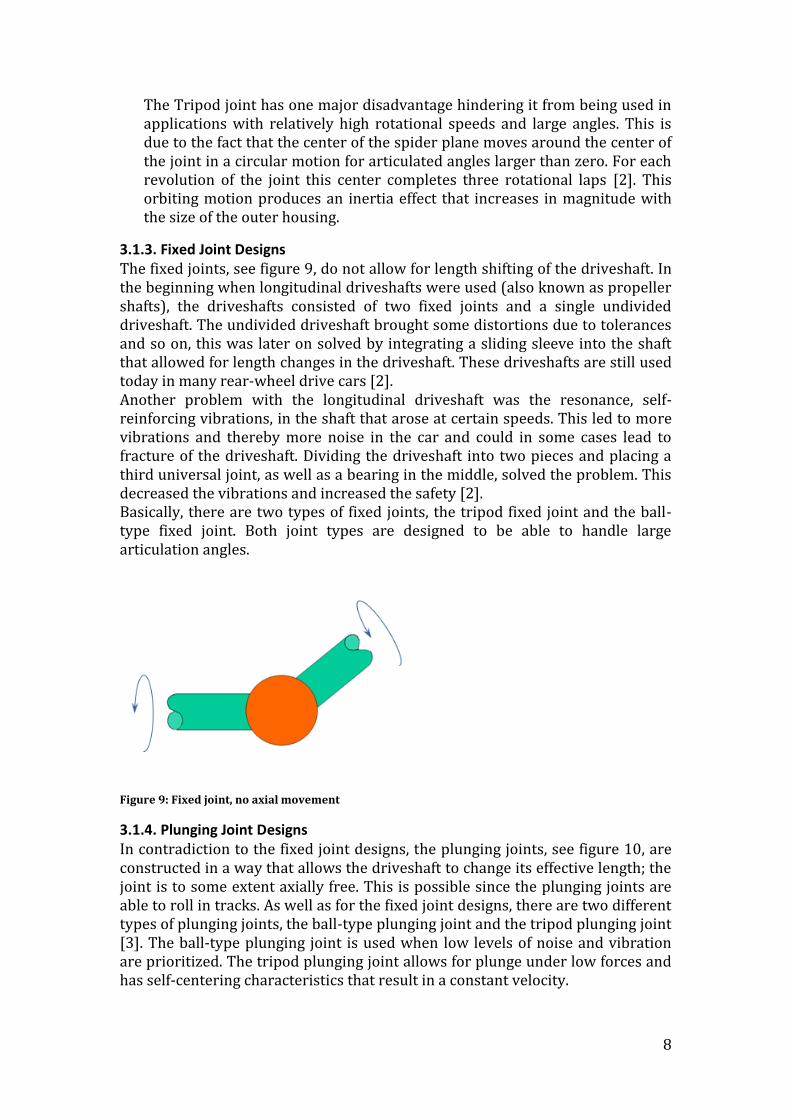
3.1.3. Fixed Joint Designs The fixed joints, see figure 9, do not allow for length shifting of the driveshaft. In the beginning when longitudinal driveshafts were used (also known as propeller shafts), the driveshafts consisted of two fixed joints and a single undivided driveshaft. The undivided driveshaft brought some distortions due to tolerances and so on, this was later on solved by integrating a sliding sleeve into the shaft that allowed for length changes in the driveshaft. These driveshafts are still used today in many rear-wheel drive cars [2]. Another problem with the longitudinal driveshaft was the resonance, self-reinforcing vibrations, in the shaft that arose at certain speeds. This led to more vibrations and thereby more noise in the car and could in some cases lead to fracture of the driveshaft. Dividing the driveshaft into two pieces and placing a third universal joint, as well as a bearing in the middle, solved the problem. This decreased the vibrations and increased the safety [2]. Basically, there are two types of fixed joints, the tripod fixed joint and the ball-type fixed joint. Both joint types are designed to be able to handle large articulation angles.
Figure 9: Fixed joint, no axial movement
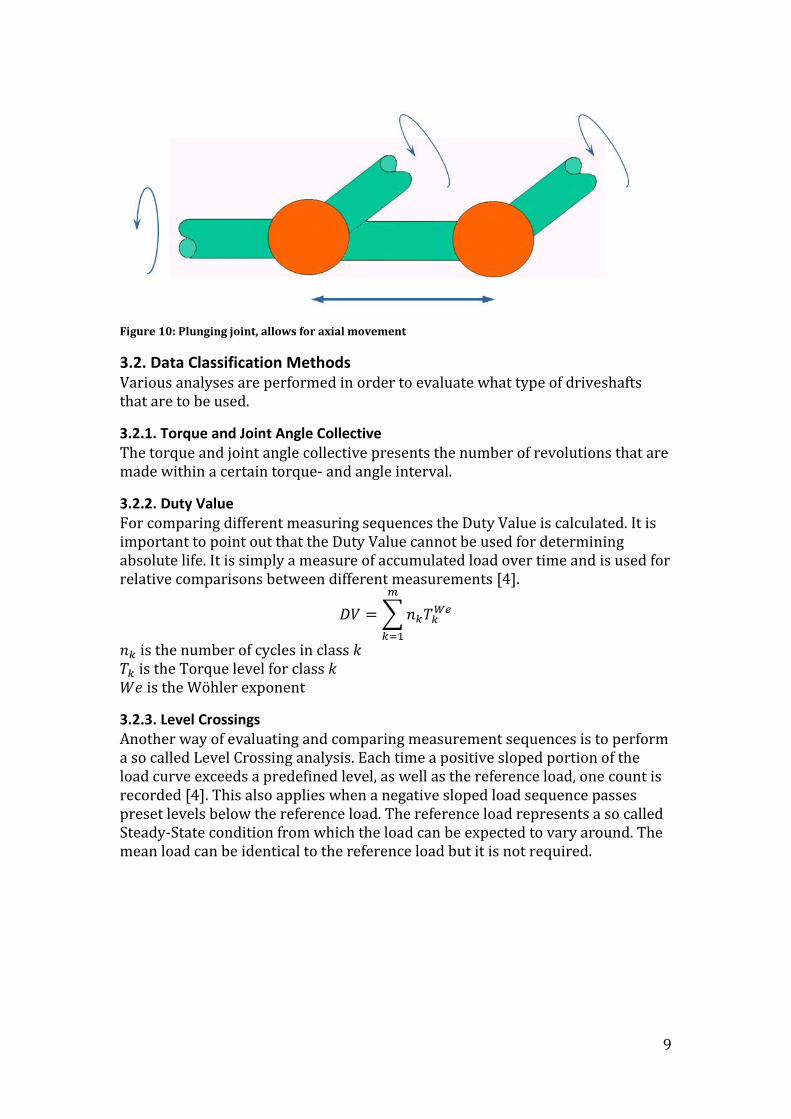
3.1.4. Plunging Joint Designs In contradiction to the fixed joint designs, the plunging joints, see figure 10, are constructed in a way that allows the driveshaft to change its effective length; the joint is to some extent axially free. This is possible since the plunging joints are able to roll in tracks. As well as for the fixed joint designs, there are two different types of plunging joints, the ball-type plunging joint and the tripod plunging joint [3]. The ball-type plunging joint is used when low levels of noise and vibration are prioritized. The tripod plunging joint allows for plunge under low forces and has self-centering characteristics that result in a constant velocity.
9
Figure 10: Plunging joint, allows for axial movement
3.2. Data Classification Methods Various analyses are performed in order to evaluate what type of driveshafts that are to be used.
3.2.1. Torque and Joint Angle Collective The torque and joint angle collective presents the number of revolutions that are made within a certain torque- and angle interval.
3.2.2. Duty Value For comparing different measuring sequences the Duty Value is calculated. It is important to point out that the Duty Value cannot be used for determining absolute life. It is simply a measure of accumulated load over time and is used for relative comparisons between different measurements [4].
is the number of cycles in class is the Torque level for class is the Wöhler exponent
3.2.3. Level Crossings Another way of evaluating and comparing measurement sequences is to perform a so called Level Crossing analysis. Each time a positive sloped portion of the load curve exceeds a predefined level, as well as the reference load, one count is recorded [4]. This also applies when a negative sloped load sequence passes preset levels below the reference load. The reference load represents a so called Steady-State condition from which the load can be expected to vary around. The mean load can be identical to the reference load but it is not required.

10
3.2.4. Rainflow Rainflow is a cycle counting algorithm that is used to summarize irregular load histories over time. Cycles, of various sizes, are counted and represented with both a mean value interval and amplitude interval [5]. The intervals for mean and amplitude are specified individually according to preference. For a simple loading sequence such as where the mean value and amplitude value remain constant over time there is no need to perform a rainflow analysis.

11
4. Methodology The methodology can be described in the following way: 1. Literature study: Perform a literature study in order to gain more
knowledge about the theory behind driveshafts and data classification methods. Analyze how a driveshaft works, what different types of driveshafts there are as well as finding out about the differences between the types of driveshafts and for what kind of situations they are used. The following literature will be analyzed:
Constant-Velocity Driveshafts for Passenger Cars by Bernd Pierburg and Peter Amborn
Universal Joint and Driveshaft Design Manual by Charles E. Cooney Jr et al.
Various internal documents In addition to the literature study, several interviews are carried out with Thomas Ottosson (test engineer, Volvo Cars Corporation) regarding driveshaft and joints as well as Jan Andersson (computing engineer, Volvo Cars Corporation), regarding data classification methods.
2. Develop measurement equipment: With expertise and recommendations from Stephan Denzel (test engineer, Volvo Cars Corporation) investigate the possibilities to attach measurement equipment in a Volvo car in order to obtain accurate measurement data on the vertical articulation angles. In addition to studies of a physical car a CAD-model containing the gearbox, engine, driveshafts etc. is used to provide accurate information regarding dimensions and space available. Develop and manufacture measurement equipment. The development process and the evaluation tools used follow the process and tools presented by Ulrich and Eppinger in their book Product Design and Development [6]. This development process is chosen since it is used in the education at Chalmers University of Technology and since it contains relevant steps for this kind of projects such as external and internal searches and evaluation matrices. Concepts of the measurement equipment will be generated through a set of brainstorming sessions in order to bring creativity to the concepts. The possibility to combine generated concepts will be investigated by using a Combination table and the final solution will be chosen through using a Concept screening matrix and a Concept scoring matrix since this is a good procedure in order to narrow down the number of concepts and eventually choose a solution. The concepts will be modeled in CATIA V5 since this is the CAD-program used at Volvo Cars Corporation and the chosen concept will be manufactured in the workshop at Volvo Cars. When the measurement equipment is fully developed and manufactured, it will be attached to a car.
3. Calibrate measurement equipment: Calibrate the developed measurement equipment as well as the steering angle and the torque sensors in order to be able to provide accurate data. In order to calibrate the measurement equipment the spring struts must be removed in order to cover the driveshafts full angle. An alternative would be to compress the springs, however, this would not cover the full angle. Investigate sources of error such as vibrations and sub frame movements due to acceleration and deceleration.

12
4. Test measurement equipment and acquire measurement data: Perform test measurements of the vertical and horizontal articulation angle, torque and the number of revolutions along with other important parameters on a Volvo car to verify the functionality of the measurement equipment. The testing will be performed both in Gothenburg city and its surroundings as well as at Volvos test track in Hällered. These tests involve different types of driving such as high speed testing, long durational driving, driving with trailer and hill climbing and covers the tests that driveshafts needs to fulfill at Volvo Cars Corporation according to Thomas Ottosson. The test data will be collected and stored on a laptop through the program DIAdem which is commonly used in these kinds of tests at Volvo Cars Corporation. An alternative would be to use a similar program called Inca, also commonly used at Volvo Cars Corporation.
5. State conditions for development of MATLAB-script: Investigate the test measurements stored in DIAdem to state conditions for the development of a script to structure and present the data classifications. The data in DIAdem will be converted to an appropriate format (.mat) suitable for MATLAB through the in-house developed program MDF Converter.
6. Develop MATLAB-script: Develop a script in MATLAB that structures the torque and joint angle collective and presents measurement data by using the classification methods stated in the literature study. A MATLAB-script is chosen since MATLAB is commonly used at Volvo Cars Corporation and the GUI-function assures the usability. The script will import converted data from MDF Converter. Meanwhile programming, the script will be tested in order to assure its functionality.
Throughout the project, continuous documentation is carried out in order to ease the final report writing and to make sure that all relevant information is accessible.
13
5. Results: Acquiring Measurement Data The chapter describes the development of the measurement equipment used to acquire measurement data.
5.1. Measurement Equipment Requirements From several interviews with Volvo personnel as well as studies of CAD-models and physical cars a set of requirements is identified. These requirements describe important aspects of the measurement equipment. Number of attachment points. A low number is preferred in order to ease the
mounting process. Similar solution left and right. Easy to attach. Small spaces, high required level of placement precision etc.
puts higher demands on design precision and makes the attachment more complex and time-consuming.
Stability during operation Measurement accuracy Mathematical compensation due to distance from the center of the joint as
well as the linearity in the measurement. Easy to manufacture. Number of parts, complexity etc. Impact on existing construction. Risk of damage on other parts on the vehicle. Environmental sensitivity. Sensitivity to dirt, water, temperature etc.
5.2. Concept Generation In order to reach a good measurement method a series of concepts are developed and evaluated amongst each other.
5.2.1. Clarifying the Problem It is difficult to measure the articulated angle during operation because of the limited space available as well as the high-speed of the rotating driveshaft. Complicating the problem further is the movement of the wheel suspension that affects the driveshaft. The problem is to measure the vertical component, of the articulated driveshaft angle, correctly. When considering different solutions for the problem certain aspects need to be fulfilled. The concept of the solution should be able to be applied to different types of cars. However the attachment and physical connections could differ. Given the physical location of the measurement equipment, within the wheelhouse, it will be subjected to various substances. These substances could be dirt, gravel, snow, and water. Preferably the solution should also be easy to attach and affect the surrounding components as little as possible. A smaller number of attachments are in both cases preferred. It is of importance that the measurement equipment easily can be implemented on other Volvo vehicles with different design of the driveline and sub-frame. Given the fact that the measurement equipment is used during normal operations of a car it will be subjected to various acceleration forces. Acceleration, deceleration, cornering and rough surfaces, that influence the wheel suspension, will affect the measurement equipment. Therefore keeping the mass low is important since it will minimize the resulting forces.

14
Simplicity of the fixtures from a manufacturing standpoint is also important.
5.2.2. External Search An external search for information is made in order to investigate if there are any similar or existing solutions to the problem. The external search is based on the following information sources: Information from a supplier of driveshafts regarding measurements on
articulation angles A patent search on existing and similar solutions [7, 8] A published literature search regarding how to measure angles in joints [9,
10, 11, 12, 13] A search among manufacturers and suppliers of measuring devices The information gathered from the external search treats different areas such as the automobile industry, the biomedical industry and also measurement sensors in general. Different techniques for measuring joint angles are presented and there are some solutions that are most likely suitable for measuring the articulation angle in a car. Common solutions mentioned in the external study are measuring with angle sensors, photoelectric distance sensors or accelerometers.
5.2.3. Internal Search In addition to the external search for solutions, an internal search is carried out in order to expand the number of ideas and bring creativity to the concept generation. By investigating personal knowledge a lot of different concepts can be generated, highly feasible as well as less feasible solutions. To end up with a good solution, having a large number of concepts is important in order to identify most of the possible ways to solve the problem. Also internal documents at Volvo are studied regarding earlier investigations of the same problem. Through a set of brainstorming sessions, where no criticism is allowed, a number of concepts are generated. The concepts generated can solve the problem in different ways, mainly through: Angle sensors connected mechanically to the gearbox/engine and to the sub-
frame or directly to the driveshaft Photoelectric sensors fixed on the wheel house measuring through laser on
the driveshaft Accelerometers fixed on the gearbox/engine and the sub-frame

15
5.2.4. Concept Combination By dividing the problem into sub-problems, an investigation of the possibilities of concept combinations is carried out. The sub-problems are identified as the following four: Attachment for sensor Measurement technique Point of measurement Interface to measurement point By identifying how the different concepts solve each of these sub-problems and organize them in a combination table, the different solutions are combined into new concepts based on the previously generated concepts. The combination table used is shown in table 1. Table 1 Combination table
Attachment for sensor
Measurement type
Point of measurement
Interface to measurement point
Gearbox Potentiometer Driveshaft Pins
Sub-frame LVDT Control arm Rolls
Engine Accelerometer Spring plate Snap-on Clip
Wheel-house Photoelectric Bearing
Spring plate Bolt and nut
Clamp
Laser
Glue
5.3. Concepts The concepts generated are presented below along with a description and picture for illustration.
16
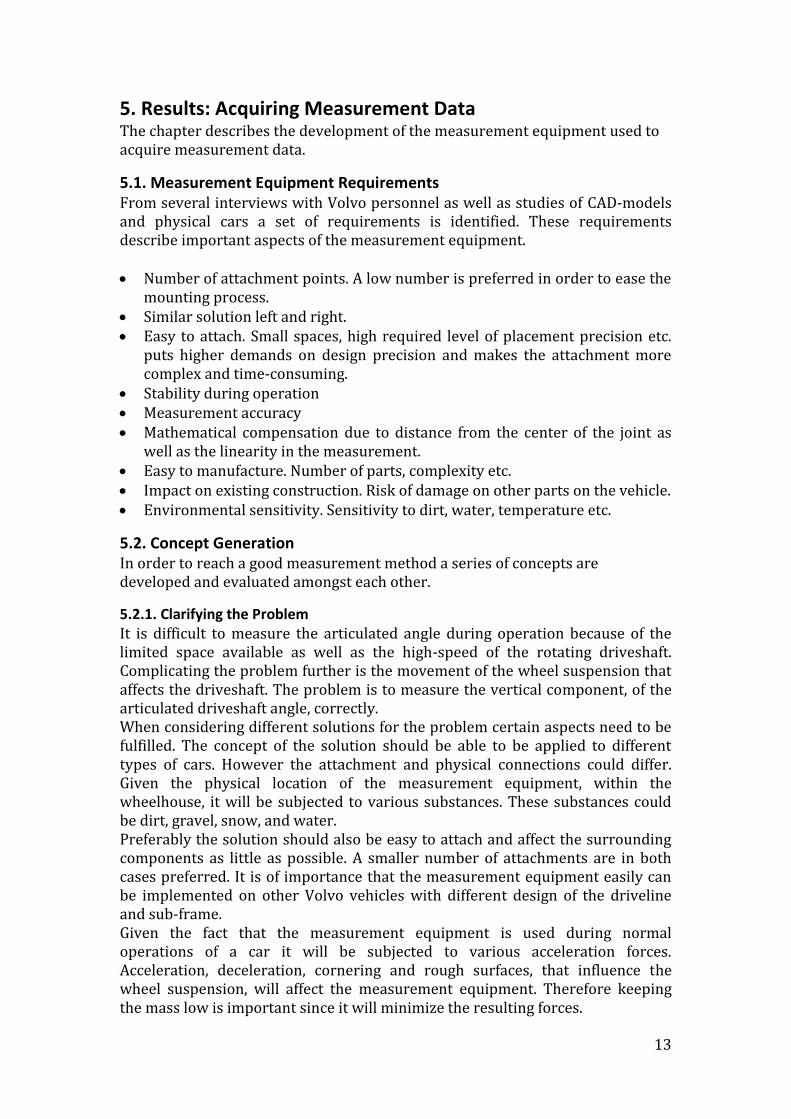
5.3.1. Photo-Electric Sensor The “Photo-Electric Sensor”-concept consists of a photoelectric sensor that is attached to the top of the wheelhouse, see figure 11. The laser continuously measures the distance to the driveshaft. There is a need for a smooth and even surface finish for achieving accurate measurements. Any slight longitudinal variations will affect the results unfavorably due to the circular shape of the axle. A drawback with the “Photo-Electric Sensor”- concept is the change of measurement point when the driveshaft moves forward and backward, see figure 12.
Figure 11: Concept Photo Electric Sensor
Figure 12: Measurement inaccuracy
17
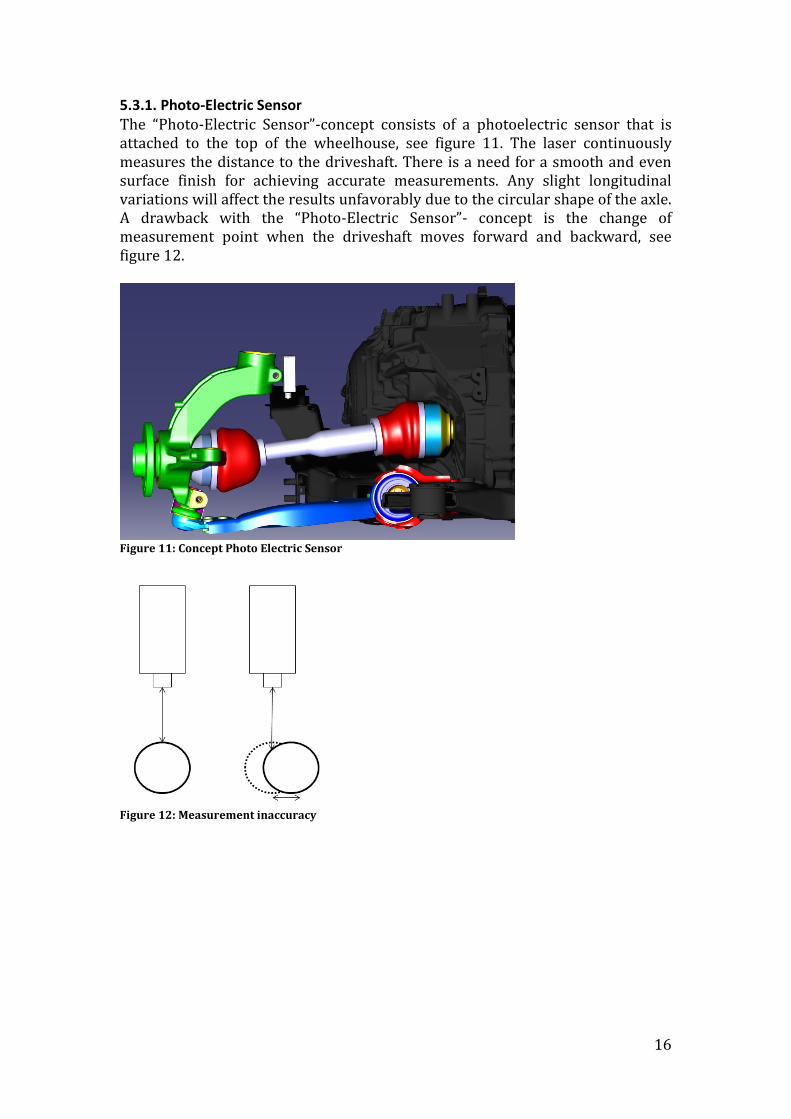
5.3.2. Compact Sensor The sensor is attached to the forward mount of the control arm, see figure 13. The center of the sensor is connected to the center of the joint for the control arm. Furthermore the shell of the sensor is connected to the sub frame in order to measure the difference in angular movement. This installment does not require large and complex measuring arms and fixtures, making it more compact. However the space available is limited, further emphasizing the importance to keep the attachment small, making sure that the total solution can be fitted in the closed space. Compared to concept 1, which incorporates an optical laser, this solution is more insensitive to dust that could interfere and affect concept 1.
Figure 13: Compact Sensor
5.3.3. Angle Sensor The concept consists of an angle sensor with an arm, linkage with bearings on both ends, and an attachment-plate on the control arm. See figure 14 for a more detailed illustration. The way of measuring the vertical articulation angle is similar to an existing solution used by a supplier of driveshaft and is also similar to the Snap-on and Roller concepts since it uses the same technology. The concept is less sensitive to dust and temperature then the other concepts.
Figure 14: Angular Sensor
18
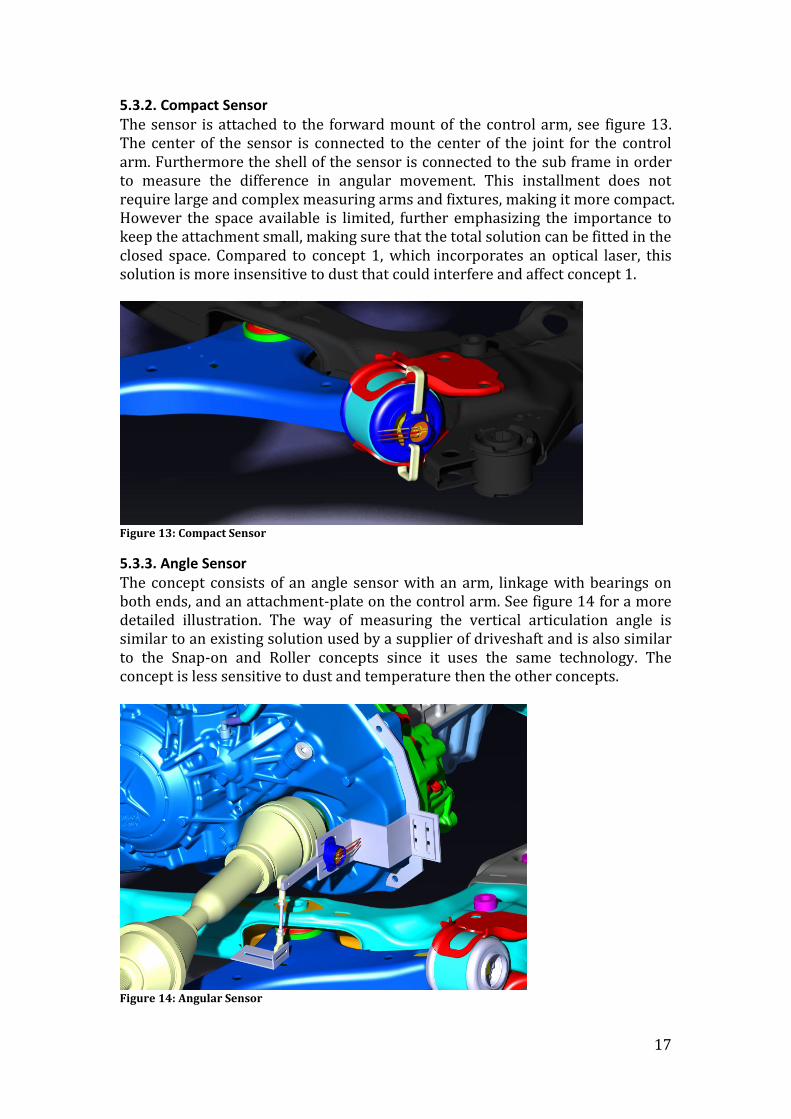
5.3.4. Snap-on The “Snap-on”-concept is based on the “Angle sensor” concept but measures directly on the driveshaft through a clip with an inner surface covered with low friction material, see figure 15. Measuring directly on the driveshaft while at the same time having the same rotational center, for both the sensor and the driveshaft, gives a linear relation. This is not the case for the previously described concepts.
Figure 15: Snap-On
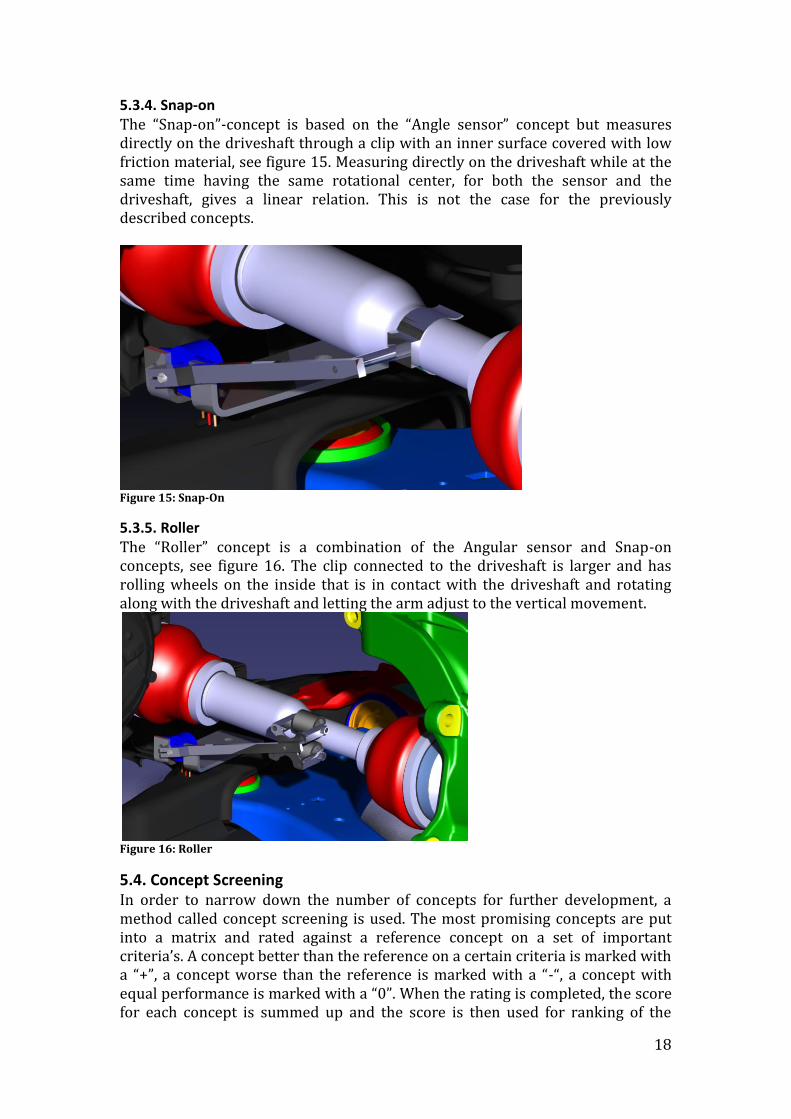
5.3.5. Roller The “Roller” concept is a combination of the Angular sensor and Snap-on concepts, see figure 16. The clip connected to the driveshaft is larger and has rolling wheels on the inside that is in contact with the driveshaft and rotating along with the driveshaft and letting the arm adjust to the vertical movement.
Figure 16: Roller
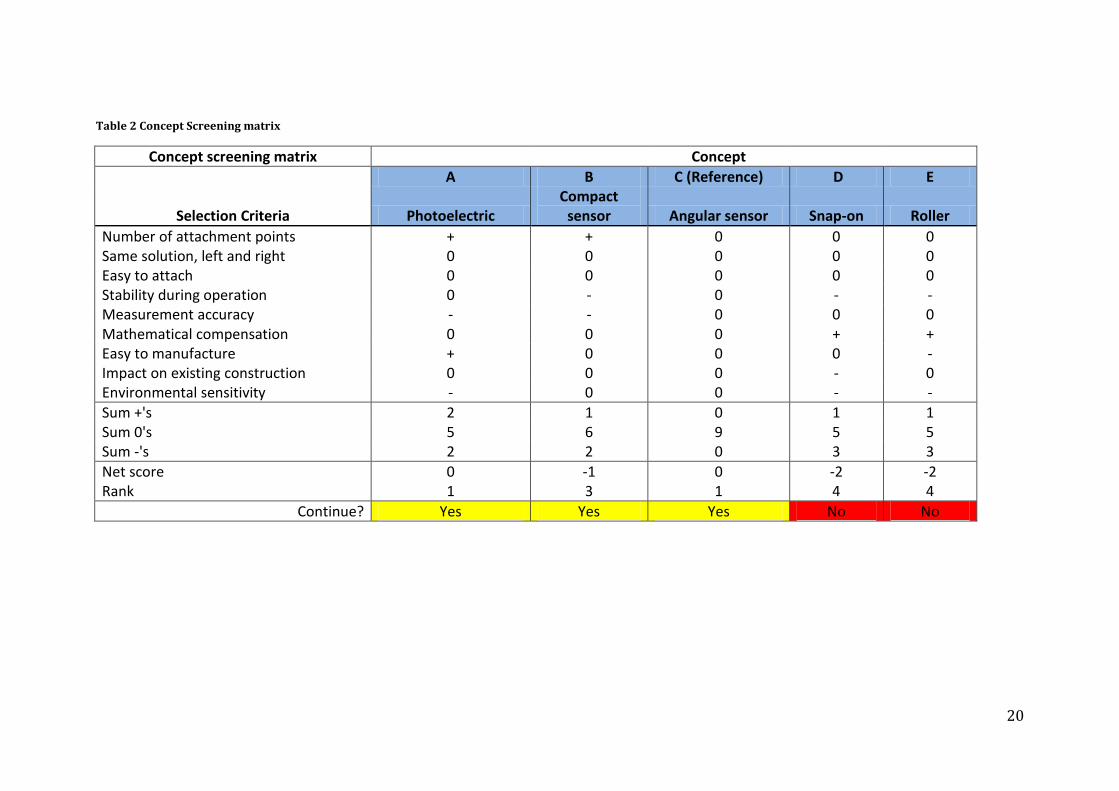
5.4. Concept Screening In order to narrow down the number of concepts for further development, a method called concept screening is used. The most promising concepts are put into a matrix and rated against a reference concept on a set of important criteria’s. A concept better than the reference on a certain criteria is marked with a “+”, a concept worse than the reference is marked with a “-“, a concept with equal performance is marked with a “0”. When the rating is completed, the score for each concept is summed up and the score is then used for ranking of the

19
concepts. The concepts are rated based on the requirements stated in chapter 5.1. Se Appendix 2 for the concept screening matrix. After the concept screening two concepts are decided not to pursue further development. These concepts are the “Snap-on” and the “Roller”. These concepts main disadvantages are that they are measuring in direct contact with the driveshaft and therefore cannot guarantee enough stability during operation due to movements from the driveshaft as well as their sensitivity of being knocked of their measuring position by dirt and other pollutions. The Concept Screening matrix is shown in table 2. Three concepts are taken into further investigation and development: Photo-electric sensor Compact sensor Angle sensor
20
Table 2 Concept Screening matrix
Concept screening matrix Concept
A B C (Reference) D E
Selection Criteria Photoelectric Compact
sensor Angular sensor Snap-on Roller
Number of attachment points + + 0 0 0 Same solution, left and right 0 0 0 0 0 Easy to attach 0 0 0 0 0 Stability during operation 0 - 0 - - Measurement accuracy - - 0 0 0 Mathematical compensation 0 0 0 + + Easy to manufacture + 0 0 0 - Impact on existing construction 0 0 0 - 0 Environmental sensitivity - 0 0 - -
Sum +'s 2 1 0 1 1 Sum 0's 5 6 9 5 5 Sum -'s 2 2 0 3 3
Net score 0 -1 0 -2 -2 Rank 1 3 1 4 4
Continue? Yes Yes Yes No No

21
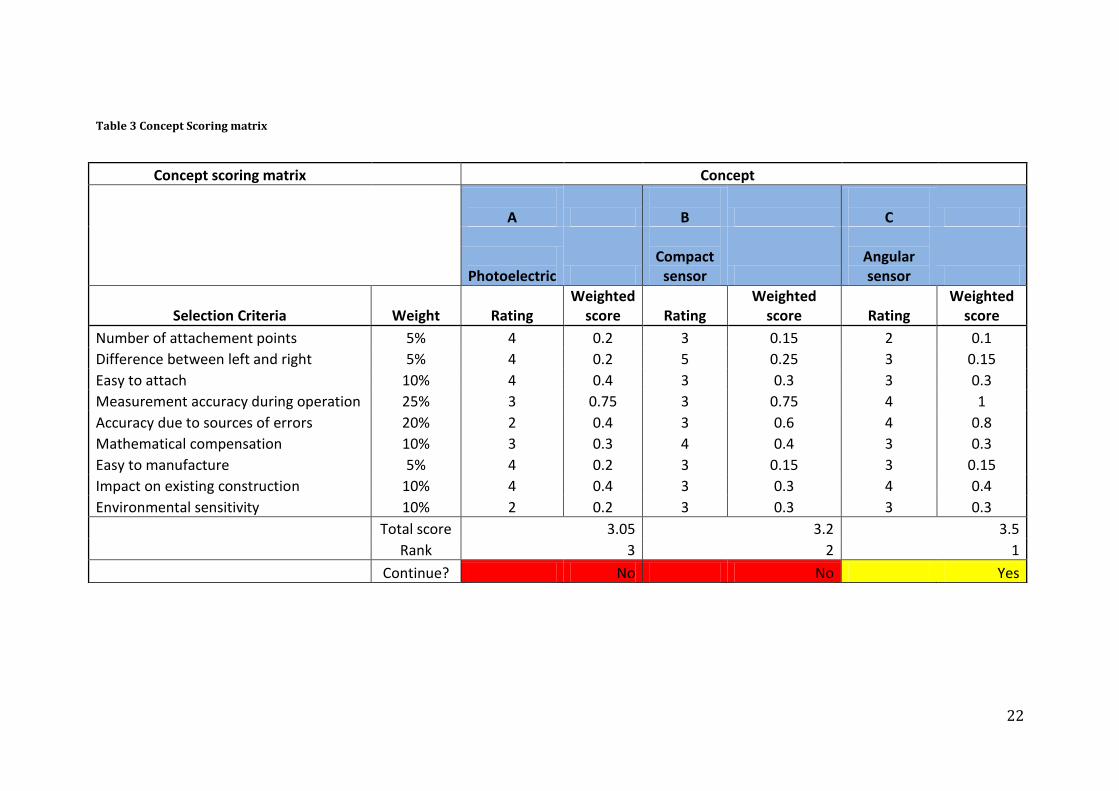
5.5. Concept Scoring After further development of the concepts succeeding from the concept screening, a concept scoring is carried out. A Concept Scoring matrix, quite similar to the Concept Screening matrix, is presented in table 3. The Concept screening matrix is used in order to choose a final concept and brings more detail to the selection process than the concept screening. The Concept scoring matrix weights the different criteria’s in percent’s based on the importance of the particular criteria. The concepts are then rated on each criterion with a number from 1 to 5 compared to a reference criterion (highlighted cells) where 3 corresponds to the same rate as the reference, 1-2 are worse and 4-5 are better. The total score of a concept is then calculated by multiplying the weight and the rate of each criterion and then calculate the sum of all criteria’s. Through comparing the results a concept is chosen. The Concept Scoring matrix is shown in table 3. Based on the Concept Scoring matrix the “Angular sensor” is chosen as the solution. The Angular sensor can easily be mounted on the gearbox and engine, which eliminates sources of error that can occur during operation. Although the Photoelectric sensor can be mounted in a similar way it suffers from measuring directly on the driveshaft since the driveshaft will make small movements in the driving direction, which continuously changes the point of measurement. The “Compact sensor” suffers from the possibilities of attachment.
22
Table 3 Concept Scoring matrix
Concept scoring matrix Concept
A
B
C
Photoelectric
Compact
sensor
Angular sensor
Selection Criteria Weight Rating Weighted
score Rating Weighted
score Rating Weighted
score
Number of attachement points 5% 4 0.2 3 0.15 2 0.1
Difference between left and right 5% 4 0.2 5 0.25 3 0.15
Easy to attach 10% 4 0.4 3 0.3 3 0.3
Measurement accuracy during operation 25% 3 0.75 3 0.75 4 1
Accuracy due to sources of errors 20% 2 0.4 3 0.6 4 0.8
Mathematical compensation 10% 3 0.3 4 0.4 3 0.3
Easy to manufacture 5% 4 0.2 3 0.15 3 0.15
Impact on existing construction 10% 4 0.4 3 0.3 4 0.4
Environmental sensitivity 10% 2 0.2 3 0.3 3 0.3
Total score 3.05 3.2 3.5
Rank 3 2 1
Continue? No No Yes
23
5.6. Detailed Design When the measurement technique is decided, the detailed design of the mounting fixture is to be developed. There are some important positioning aspects that need to be considered: The left fixture (from a driver-point-of-view) should be mounted on the
gearbox in order to reduce the sources of errors due to movement of the driveline.
The right fixture (from a driver-point-of-view) should be mounted on the engine for the same reasons as the left fixture.
The fixture should allow for positioning the sensor in order to fit the construction into the spaces available. This should also allow for positioning the sensor close to the center of the joint. Since the concept “Angular sensor” does not involve measuring directly on the driveshaft, this does not affect the result of the measurements, although it simplifies for further solutions based on measuring directly on the driveshaft.
Drawings of the developed fixtures can be found in Appendix 1.

24
5.6.1. Gearbox fixture The gearbox fixture, see figure 17, consists of two consoles constructed from 3 mm thick steel plate; one mounted on the gearbox with two M10 bolts and one mounted on the gearbox-console with four M6 bolts and holds the sensor. The two consoles allow for adjustments of the sensor in X, Y and Z-directions through traces. In the X-direction, it is important that the sensor is mounted with good precision in order to avoid a collision with the driveshaft and other surrounding parts. In the Y and Z direction, the sensor can be adjusted in order to be as close as possible to the center of the joint. Figure 18 shows the complete solution for measurements on the left driveshaft.
Figure 17: Gearbox Fixture
Figure 18: Complete solution left side
5.6.2. Engine fixture The engine fixture, see figure 19, is in functionality similar to the gearbox fixture, though designed different since it is mounted on the engine instead of the gearbox. It consists of two consoles, constructed from 3 mm thick steel plate and adjustable in X, Y and Z-directions. Figure 20 shows the complete solution for measurements on the right driveshaft.

25
Figure 19: Engine Fixture
26
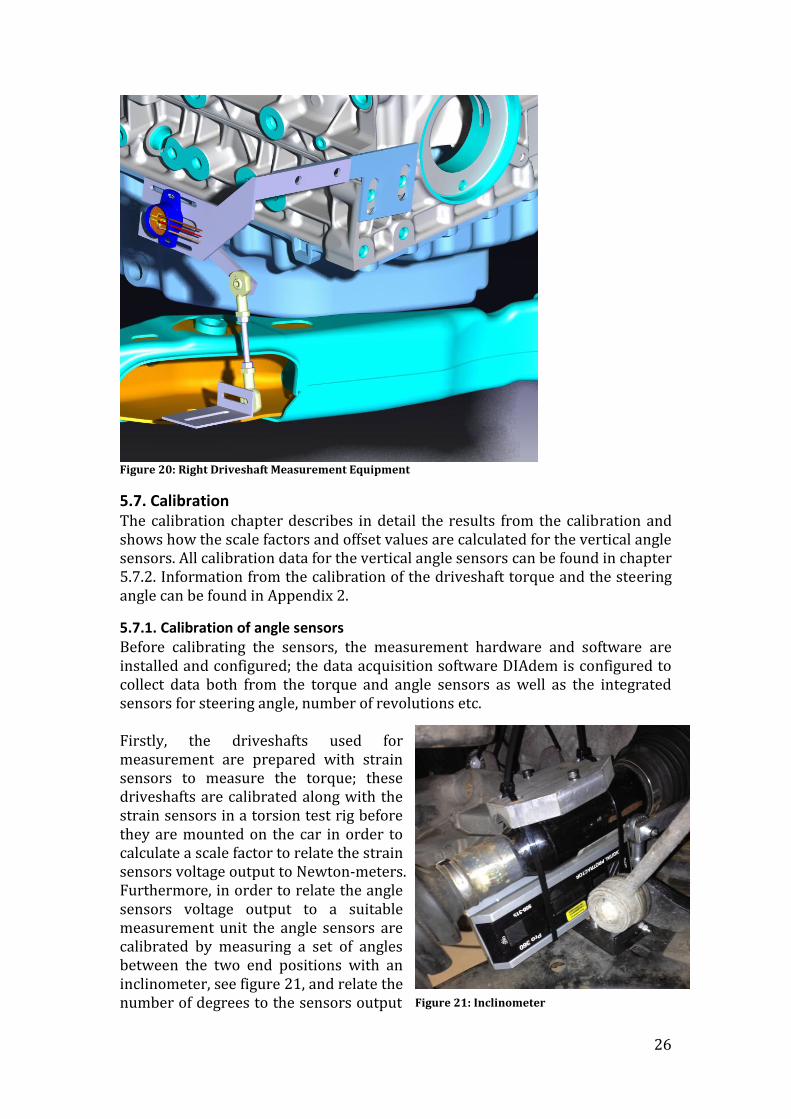
Figure 20: Right Driveshaft Measurement Equipment
5.7. Calibration The calibration chapter describes in detail the results from the calibration and shows how the scale factors and offset values are calculated for the vertical angle sensors. All calibration data for the vertical angle sensors can be found in chapter 5.7.2. Information from the calibration of the driveshaft torque and the steering angle can be found in Appendix 2.
5.7.1. Calibration of angle sensors Before calibrating the sensors, the measurement hardware and software are installed and configured; the data acquisition software DIAdem is configured to collect data both from the torque and angle sensors as well as the integrated sensors for steering angle, number of revolutions etc. Firstly, the driveshafts used for measurement are prepared with strain sensors to measure the torque; these driveshafts are calibrated along with the strain sensors in a torsion test rig before they are mounted on the car in order to calculate a scale factor to relate the strain sensors voltage output to Newton-meters. Furthermore, in order to relate the angle sensors voltage output to a suitable measurement unit the angle sensors are calibrated by measuring a set of angles between the two end positions with an inclinometer, see figure 21, and relate the number of degrees to the sensors output Figure 21: Inclinometer

27
voltage signal. This process is carried out after removing the front tires, break calipers as well as replacing the spring struts with a pipe construction, see figure 22, without spring and damper in order to make sure the driveshaft and control arm will follow the correct route. Replacing the spring strut is necessary since otherwise the spring and damper will prevent reaching the required angles. The angles are then varied using a lifting jack and stored in a calibration table. This result in a scale factor converting voltage into degrees which are put into DIAdem along with an offset value to make sure that the angles presented are the correct angle with respect to a coordinate system where zero degrees correspond to a driveshaft perpendicular to the wheel/engine-package. The offset values are identified by measuring both the angle as well as the voltage signal when the car is unloaded and standing on all four wheels. This is performed two times and an average value is calculated. After calibrating the angle sensors, the spring struts and the wheels are mounted and the steering angle is calibrated, see figure 23. Since the integrated sensor only measures the angle of the steering wheel, that signal must be related to the actual wheel angle. This is performed using a wheel alignment lift equipped with rotating plates showing the wheel angle for the front wheels. The angle of the steering wheel is then related to the angle of the wheels.
Figure 22: Pipe construction
Figure 23: Calibration of steering angle
28
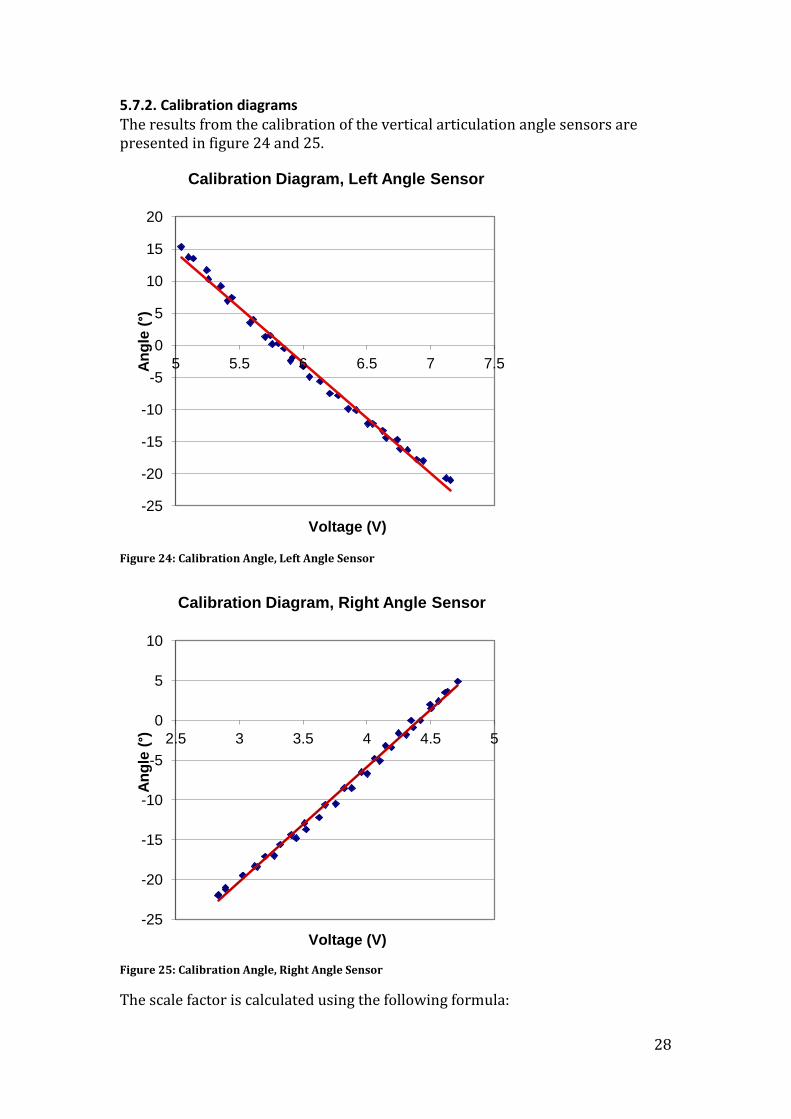
5.7.2. Calibration diagrams The results from the calibration of the vertical articulation angle sensors are presented in figure 24 and 25.
Figure 24: Calibration Angle, Left Angle Sensor
Figure 25: Calibration Angle, Right Angle Sensor
The scale factor is calculated using the following formula:
-25
-20
-15
-10
-5
0
5
10
15
20
5 5.5 6 6.5 7 7.5 An
gle
(°)
Voltage (V)
Calibration Diagram, Left Angle Sensor
-25
-20
-15
-10
-5
0
5
10
2.5 3 3.5 4 4.5 5
An
gle
(°)
Voltage (V)
Calibration Diagram, Right Angle Sensor
29
Where Using the calibration data in chapter 5.6.2, for each side respectively, this result in the following scale factors: Where Furthermore, the offset values are calculated using the following formula: Where Using adjustment data, for each side respectively, from a series of measurements, the following offset values are calculated: Where
5.7.3. Test of calibration To verify that the vertical angle sensors are correctly calibrated a set of verification tests are carried out. The measured angles are compared to angles

30
physically measured with an inclinometer repeatedly after driving for a couple of minutes. The car is placed on a ramp and then physically shaken in order to make sure that the sensor system and control arm take a neutral position. The test data for left and right vertical angle sensor are presented in table 4. Table 4 Test Data
Left Right
Real angle (°) Calculated angle (°) Real angle (°) Calculated angle (°)
-9,4 -9,13 -9,1 -9,18
-9,4 -9,2 -8,8 -9
-9,4 -9,45 -8,7 -9
-9,4 -9,28 -8,6 -9
-9,2 -9,26 -8,8 -9,1
-22,1 -22,1 -22,1 -22,5
-21,9 -22 -22,2 -22,6
-21,8 -21,6 -22,1 -22,1
Maximum error 0,27 Maximum error 0,4
Mean error 0,125 Mean error 0,26
5.7.4. Sources of error Having all sensors calibrated, possible sources of errors are investigated by physically trying to physically affect the angle sensors and the consoles while checking the measured values. Applied force on the console/sensor in the vertical direction results in an
error. A force downwards gives an error of about 2-3° while a force upwards gives an error of about 1°.
Applied force on the SKF linkage arm in the horizontal direction results in an error of about 1° in both directions.
The linearization of the calibration curve results in small errors.
31
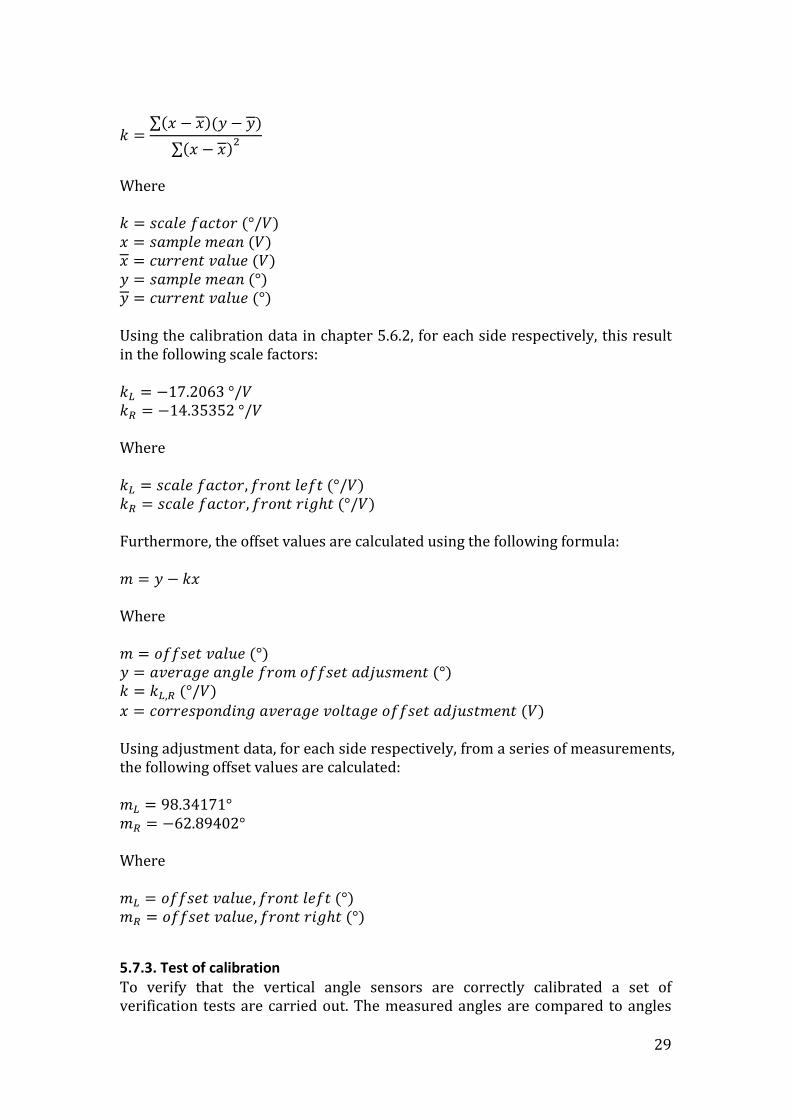
5.8. Measurements After verification of the measurement equipment, measurements on Volvo’s test routes are carried out. These tests involve different types of driving such as high speed testing, long durational driving, driving with trailer and hill climbing, according to Thomas Ottosson at Volvo Cars. Standard test procedures like these are performed in order to make sure that all different operational conditions are tested. The measurement equipment is tested and measurement data are acquired from the following test routes: Gothenburg city-route (20 Hz): Simulation of city driving. The Gothenburg
city-route is driven and measured once. Gravel-route (20 Hz): Simulation of driving on gravel roads. The Gravel-route
is driven and measured once. Country road-route (20 Hz): Simulation of driving on country roads. The
Country road-route is driven and measured once. Mountain-route (20 Hz): Simulation of driving in mountains and hills. The
Mountain-route is driven and measured once. VPT2 (100 Hz): High-speed driving, driving with trailer on hills, country
roads and city at Volvo’s test track in Hällered. The VPT2 is driven and measured three times, each time with different drivers in order to acquire measurement data based on different driving behavior.
The Hertz value refers to the frequency of the measurements; during high-speed tests (VPT2) a higher frequency is needed due to the higher speed. In addition to the articulation angle, steering angle, driveshaft torque and the number of driveshaft revolutions the following parameters are measured and stored:
AWD Propeller shaft torque Acceleration pedal position Ambient temperature Brake pedal position Gear Vehicle speed Wheel speed front left Wheel speed front right Longitudinal acceleration Lateral acceleration Crank shaft torque
These parameters are necessary in order to calculate, understand and interpret the results of the main parameters. Test data are collected and stored on a laptop through the program DIAdem.
32
6. Results: Managing Acquired Measurement Data In order to manage and present the acquired measurement data a MATLAB-script is developed. The script allows the user to choose a measurement data source, enter certain controlling parameters, compile the torque and joint angle collective and analyze measurements through the classification methods presented in the literature study as well as export the results to an .xls-file for further investigations. The script is programmed to handle the following operations: Choose measurement data-source Present a quick preview of a chosen data-file Allow the user to enter parameters Perform the calculations needed for the classification methods Plot the classifications; Articulated Angle, Rainflow, Duty Value, Level
crossings, Revolutions per torque class and a torque and joint angle collective. Plot the articulated angle and the velocity profile Export the results to an Excel-spreadsheet
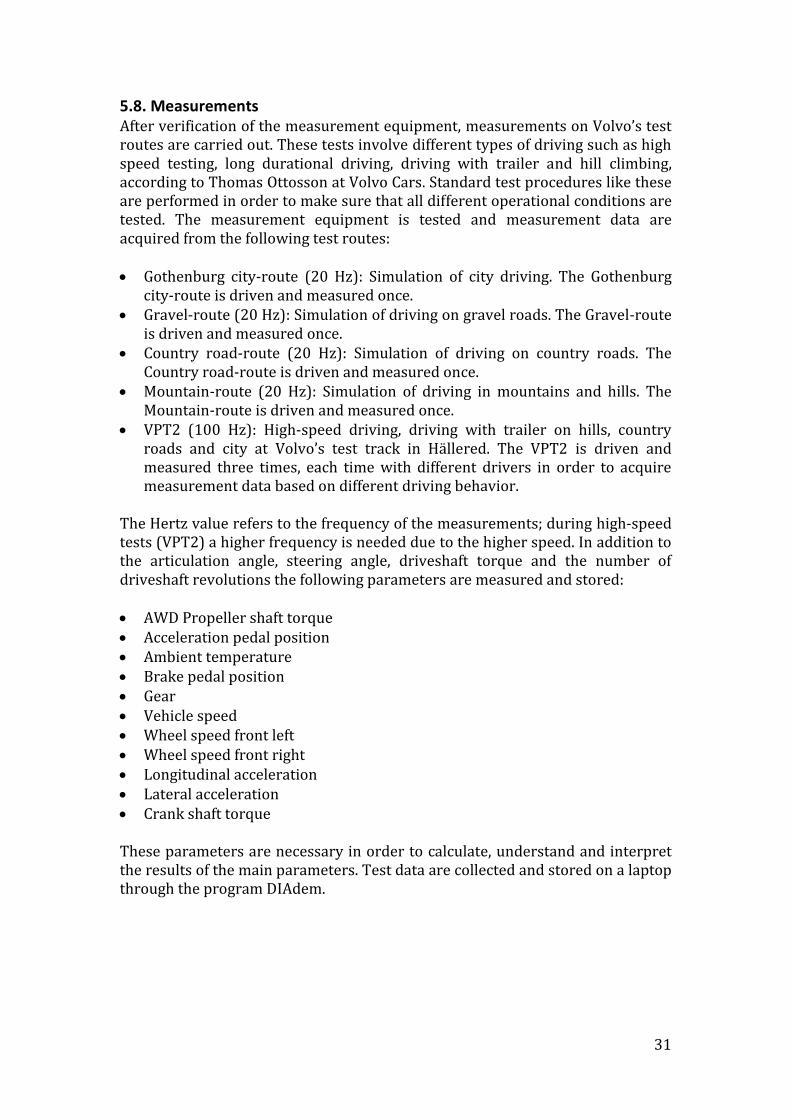
6.1. Articulated Angle Given the two angle components consisting of the steering angle and the vertical movement of the driveshaft, here referred to as and , the articulation angle is calculated.
Figure 26: Illustration of the Articulated Angle
Given (1)
Equation (1) yields
(2)
By assuming length 1 in the y direction for vector , see figure 26.
is then
represented by . The vector consists of the steering angle and is
therefore represented by . The vector is represented by
. This yields which is then represented by .
Equation (2) will then be as follows
This will generate the articulated angle given the two vectors expressed by the two angle components. The articulated angle for the joint will be combined in a torque and joint angle collective along with measured torque and number of revolutions.
33
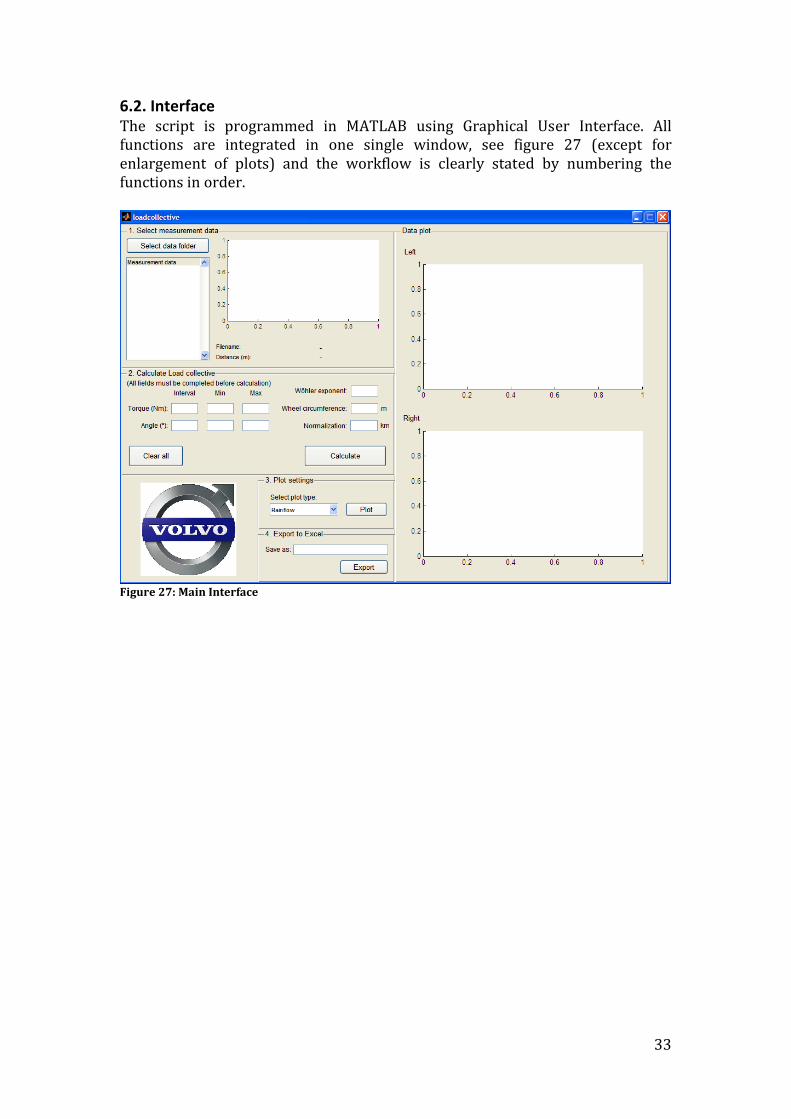
6.2. Interface The script is programmed in MATLAB using Graphical User Interface. All functions are integrated in one single window, see figure 27 (except for enlargement of plots) and the workflow is clearly stated by numbering the functions in order.
Figure 27: Main Interface
34
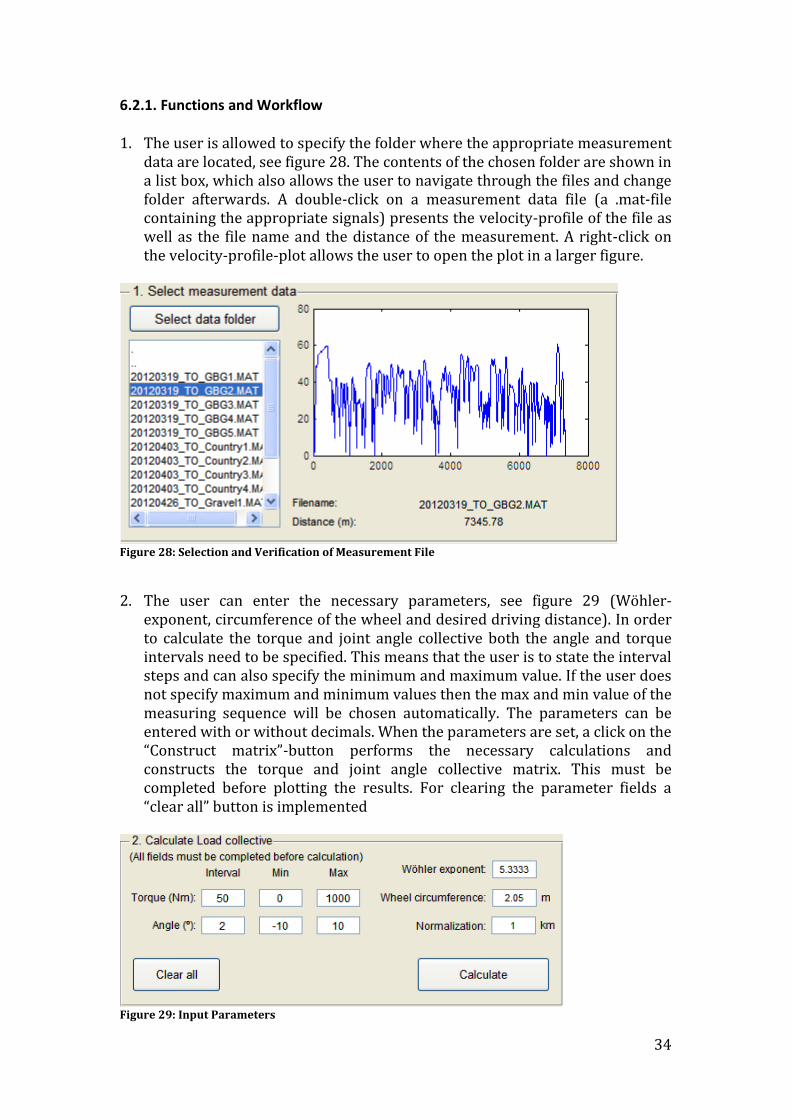
6.2.1. Functions and Workflow 1. The user is allowed to specify the folder where the appropriate measurement
data are located, see figure 28. The contents of the chosen folder are shown in a list box, which also allows the user to navigate through the files and change folder afterwards. A double-click on a measurement data file (a .mat-file containing the appropriate signals) presents the velocity-profile of the file as well as the file name and the distance of the measurement. A right-click on the velocity-profile-plot allows the user to open the plot in a larger figure.
Figure 28: Selection and Verification of Measurement File
2. The user can enter the necessary parameters, see figure 29 (Wöhler-
exponent, circumference of the wheel and desired driving distance). In order to calculate the torque and joint angle collective both the angle and torque intervals need to be specified. This means that the user is to state the interval steps and can also specify the minimum and maximum value. If the user does not specify maximum and minimum values then the max and min value of the measuring sequence will be chosen automatically. The parameters can be entered with or without decimals. When the parameters are set, a click on the “Construct matrix”-button performs the necessary calculations and constructs the torque and joint angle collective matrix. This must be completed before plotting the results. For clearing the parameter fields a “clear all” button is implemented
Figure 29: Input Parameters

35
3. The user is allowed to choose what type of plot that should be displayed, see figure 30. The user can choose between; Rainflow, Revolutions-Torque, Duty Value, Level Crossings and torque and joint angle collective. Based on the constructed torque and joint angle collective, when the “Plot”-button is clicked, the chosen plots are displayed, one plot for each front-driveshaft. The Duty Value is also shown. A right-click on a plot allows the user to display the plot in a larger figure.
Figure 30: Plot Selection
4. The export panel allows the user to export the torque and joint angle
collective into an Excel-spreadsheet, see figure 31. The user can choose filename by entering the desired filename in the text-edit-box. When the “Export”-button is clicked the user can choose a folder where the .xls-file is stored.
Figure 31: Export Box

36
6.2.2. Torque and Joint Angle Collective The main result of the script is a torque and joint angle collective matrix. An example of a torque and joint angle collective matrix is presented in figure 32.
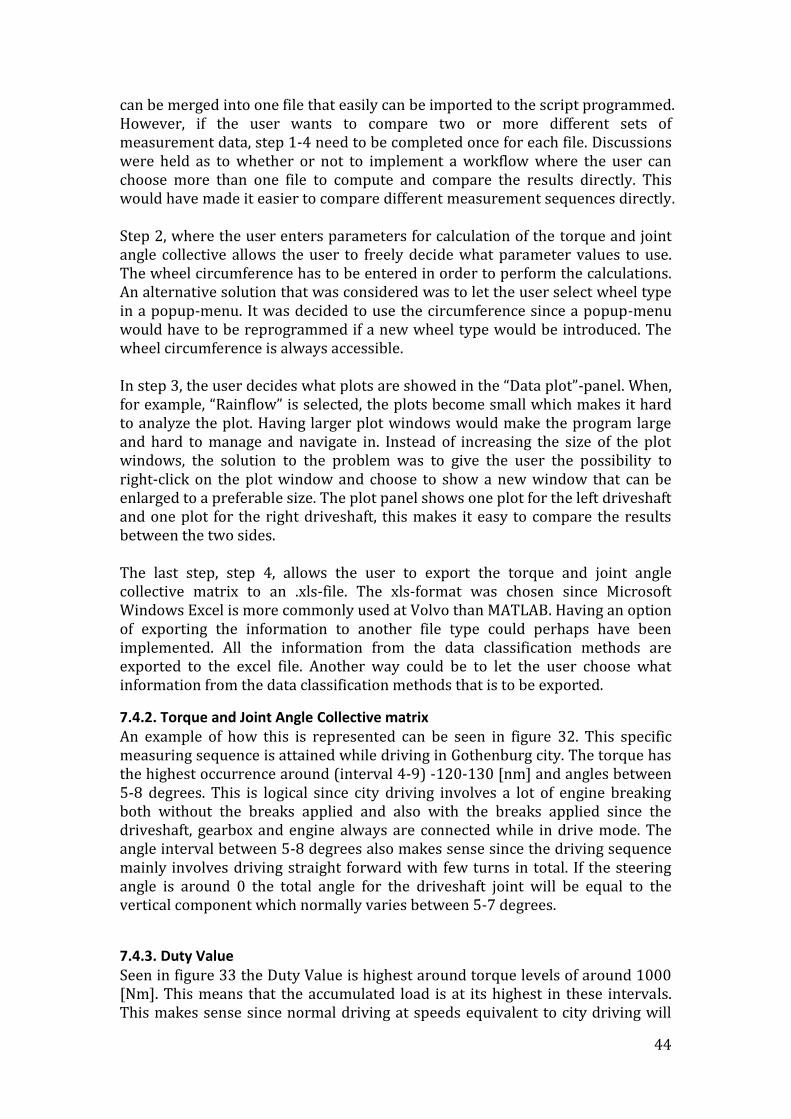
6.2.3. Example of Plots The following examples are based on a measuring sequence recorded during city driving in central Gothenburg. Figure 32 shows a plot of the torque and joint angle collective and illustrates the number of revolutions that are made for a given torque- and angle interval. There are a high concentration of revolutions around (interval 4-9) -120-130 [nm] and angles between (interval 3-4)5-8 degrees
Figure 32: Torque and Joint Angle Collective
The Duty Value is calculated for each torque class and presented as a bar chart, se figure 33. Large Duty Values is found for torque levels around 1000 [Nm].

37
Figure 33: Duty Value per Torque Class
The number of level crossings are calculated and presented as a bar chart shown in figure 34. As can be seen in the plot, levels around 0 [Nm] are crossed the most.
Figure 34: Level Crossings
Figure 35 shows the number of cycles for a specific mean interval as well as an amplitude interval. This type of analysis is called Rainflow. A large number of cycles can be seen for torque levels with a mean value of around 0 [Nm] and amplitude of 0-20 [Nm].
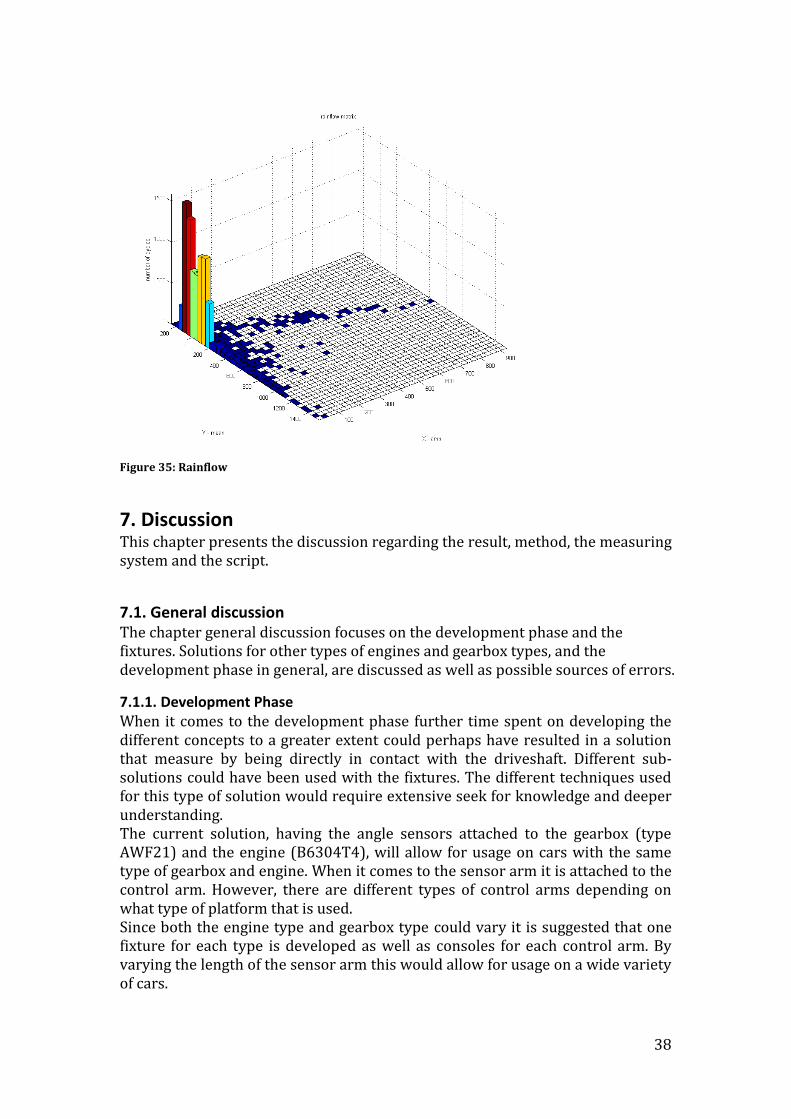
38
Figure 35: Rainflow
7. Discussion This chapter presents the discussion regarding the result, method, the measuring system and the script.
7.1. General discussion The chapter general discussion focuses on the development phase and the fixtures. Solutions for other types of engines and gearbox types, and the development phase in general, are discussed as well as possible sources of errors.
7.1.1. Development Phase When it comes to the development phase further time spent on developing the different concepts to a greater extent could perhaps have resulted in a solution that measure by being directly in contact with the driveshaft. Different sub-solutions could have been used with the fixtures. The different techniques used for this type of solution would require extensive seek for knowledge and deeper understanding. The current solution, having the angle sensors attached to the gearbox (type AWF21) and the engine (B6304T4), will allow for usage on cars with the same type of gearbox and engine. When it comes to the sensor arm it is attached to the control arm. However, there are different types of control arms depending on what type of platform that is used. Since both the engine type and gearbox type could vary it is suggested that one fixture for each type is developed as well as consoles for each control arm. By varying the length of the sensor arm this would allow for usage on a wide variety of cars.
39
The solution of having the sensors attached to the gearbox and engine comes with an advantage. In order to obtain a higher driving pleasure and level of comfort the engine and gearbox are placed on several rubber mountings. These rubber mountings are used to damp out vibrations and independent movements of the engine due to moment of inertia. The position of the driveshafts is directly affected by the movement of the engine and gearbox. Having fixtures mounted on the engine and gearbox package will make the movement of the sensor arm more similar to the movement of the driveshaft. If the fixtures for the sensors would have been placed on for example the sub frame or somewhere in the wheelhouse it would mean that the movement of the engine and gearbox package, due to acceleration and deceleration, would not have been included. In order to mimic the movement of the driveshaft more exactly, a solution that measures directly on the driveshaft would be preferable. This will allow the movement of the sensor arm to follow the driveshaft more exactly. One factor that makes the matter more complex is that the driveshaft rotates at a high speed. For attaching this type of solution the fixtures and sensors already developed can be used. When it comes to the physical point of contact against the driveshaft some sort of low friction technique could be used. Examples of this are different types of ball bearings of steel or plastic.
40
Regarding the calibration, the control arm does not have the same center of rotation as the inner knot of the driveshaft. This will suggest that the relation between the movement of the sensor arm and the driveshaft is not linear. After having calibrated the sensors a very near linear relation was found as can be seen in chapter 5.7.2. However a shorter distance between the rotational centers would make the relation even more linear.
7.1.2. Fixtures Since both the fixtures are extended from their attachment points a certain relative movement is found. This movement is amplified during acceleration, deceleration and turning. The flexing and relative movement of the arms will make it sensitive to vibration. When the engine is running these vibrations affect the measured data as noise. The driveshaft is also affected by these vibrations affecting the angle to some extent. The fixtures are developed with the current EUCD- platform in mind. The new SPA-platform and P1-platform use other types of control arms. Therefore, in order to use the developed method for the other platforms, new mountings on the control arm needs to be developed. A solution for a general measuring system can be found however. All Volvo cars equipped with xenon headlights are fitted with sensors (BL3KA) that measure the movement of the control arm relative to the wheelhouse on both the front right wheel and rear right wheel. These sensors have the same type of functionality as the sensors used in the suggested measuring method. However they do not take movement of the engine into account, this movement also affects the angle of the driveshaft.
41
7.2. Methodology The discussion of methodology is mainly based on the authors own opinions and thoughts and evaluates the methodology of the thesis mainly regarding the development procedures, the implementation and calibration of the measurement equipment and the script as well as the verification of the measurement equipment and the script. However, the chapter starts with a short discussion regarding the choice of literature studies. The literature studied was mainly focused on understanding how driveshafts work in general as well as different types of joints and why they are designed and used in the way they are. Further studies were also made on the different analysis methods that were used to process the data. This knowledge is important in order to understand the purpose of the script and why it is important for Volvo to measure these kinds of parameters. However a more general study, earlier in the project, of the systems in the close surroundings would have rendered an even better result. The work mainly consisted of three separate parts. First the development phase of the measurement system, then tests and verification of the system. After that, acquiring measurement data and last programming of the script in MATLAB. When it comes to the Ulrich and Eppinger development process, used for the development of the measurement equipment, it is simplified. Since the measurement equipment is not a commercial product and will only be used internally by Volvo. The development phase could have been the sole focus of this project. However, in order to verify the measurement system and acquiring data for classification to construct the scrip the focus was evenly distributed on all three parts of the project. The first set of product requirements was set through interviews with Volvo personnel. This provided important information about measurements in general such as how large errors can be accepted and what the sources of errors could be. Further on, several studies of CAD-models as well as a physical car were made. These hands-on studies provided good understanding of the complex construction of the driveline and the sub-frame. This also provided good understanding about the limited space available and the harsh environment that the measurement equipment needs to withstand. After setting the preliminary product requirement, researches for existing and/or similar solutions were made. Investigations in databases for scientific articles and patents were also used. These two approaches gave a good idea of possible ways to solve the problem. The scientific articles provided interesting information regarding measurements on joints although these were mainly for bio-medical measurements and the performance in high-speed was uncertain. The searches in patent databases generated more interesting ideas from the perspective of implementing the solution on a car. However, the solutions in the patent search were not of the nature that they could be implemented directly for measurements of driveshafts.
42
With inspiration from the external search as well as an internal search of Volvo documents from previous investigations of the same problem a set of brainstorming sessions were held. Many interesting solutions were generated although many of the solutions would have been very time consuming to develop in comparison to others and were therefore left behind. If further time would have been spent on evaluating these concepts to a more detailed level this would perhaps have rendered a different solution. The results of the Concept screening matrix were fairly even. This led to some uncertainty about what concept to go through with. However, after several discussions a decision to go for the results of the Concept screening matrix was taken due to the uncertainties of measuring physically directly on the driveshaft. Further on, the concepts were put into a Concept scoring matrix and ranked against each other. The results of the scoring were also fairly even but it was decided to pursue with the highest ranked concept due to uncertainties of attachment of the compact sensor and the measurement accuracy of the photoelectric sensor. The detailed design of the angle sensor was finished after testing and changing the design in a CAD-assembly. Furthermore, the calibration and the testing of the measurement equipment were done with the equipment mounted on a car. This gave restricted possibilities to verify the results. The testing only contained values from three different driveshaft positions, one with the car loaded, one unloaded and one lifted. From this, conclusions were made that the measurement equipment worked as intended. Another way of evaluating the measuring method would have been to test the equipment on a test rig. When it comes to the calibration of the steering angle it was done by manually by measuring the angle on a wheel alignment lift. The lift was also equipped with sensors that measured the angle photoelectric at a higher accuracy. The intention was to use these photoelectric sensors to calibrate the steering angle, although, the sensors only allowed angles up to 15° which was not enough to cover the whole angle span.
43
7.3. Measurement equipment When it comes to the aspect regarding sources of error it can be seen when turning the wheels to the maximum position for each direction the driveshaft moves slightly forward and backwards. This movement implies that the center of rotation for the suspension is located offset from the center of the outer driveshaft knot. This will give a small source of error and can be compensated for since it linearly follows the movement of the wheels. There is some flexibility of the consoles that affects the measuring. When manipulating the angle sensor arm, and exerting a force in the direction of travel, this results in an error of 1 degree due to flexibility in the mechanical structure of the measuring system. If the console placed at the left front wheel is manipulated in a similar manner it will result in an error of about 2-3 degrees. The console at the right front wheel is not as sensitive for these types of external forces. Forces that are required for reaching these errors are considered not to be attained during normal driving conditions. It is also important to state that the angular movement of the inner joint is simplified and is said to only have movement in the horizontal angle. That is the only angle that affects the inner joint is the angle that arises when the driveshaft moves up and down.
7.4. Script The workflow of the script is discussed as well as the results of the calculations that are performed by the script. The script was developed together with Volvo personnel who helped setting up a layout for the script. Continuous communication was held with Volvo personnel throughout the programming phase. This was very helpful in order to understand Volvo’s needs and to make a script that suited them. Furthermore, meanwhile programming, testing the script helped to find bugs and incorrect functions and find better solutions to solve individual problems.
6.4.1. Script workflow The results of the script correspond to the stated purpose to a great extent. It is designed to be simple and intuitive which is represented by the clear workflow with four steps to follow. Also using MATLAB’s GUI increased the usability of the script since it presents the whole script graphically which gives the user greater possibilities to navigate in the program and quickly perform changes. The preview containing velocity profile, filename and driving distance in step 1 helps the user to assure that the correct file is selected, furthermore, the preview is fast and the calculations behind the information are completed and plotted almost immediately after a selection change in the list box. A benefit with the list box is that if the user selects wrong data folder, the list box allows for navigation through folders directly without selecting a new folder by pushing the “Select data folder”. A limitation in step 1 is that the user is only allowed to select one file, however, by using the internal Volvo program MDF Converter several files
44
can be merged into one file that easily can be imported to the script programmed. However, if the user wants to compare two or more different sets of measurement data, step 1-4 need to be completed once for each file. Discussions were held as to whether or not to implement a workflow where the user can choose more than one file to compute and compare the results directly. This would have made it easier to compare different measurement sequences directly. Step 2, where the user enters parameters for calculation of the torque and joint angle collective allows the user to freely decide what parameter values to use. The wheel circumference has to be entered in order to perform the calculations. An alternative solution that was considered was to let the user select wheel type in a popup-menu. It was decided to use the circumference since a popup-menu would have to be reprogrammed if a new wheel type would be introduced. The wheel circumference is always accessible. In step 3, the user decides what plots are showed in the “Data plot”-panel. When, for example, “Rainflow” is selected, the plots become small which makes it hard to analyze the plot. Having larger plot windows would make the program large and hard to manage and navigate in. Instead of increasing the size of the plot windows, the solution to the problem was to give the user the possibility to right-click on the plot window and choose to show a new window that can be enlarged to a preferable size. The plot panel shows one plot for the left driveshaft and one plot for the right driveshaft, this makes it easy to compare the results between the two sides. The last step, step 4, allows the user to export the torque and joint angle collective matrix to an .xls-file. The xls-format was chosen since Microsoft Windows Excel is more commonly used at Volvo than MATLAB. Having an option of exporting the information to another file type could perhaps have been implemented. All the information from the data classification methods are exported to the excel file. Another way could be to let the user choose what information from the data classification methods that is to be exported.
7.4.2. Torque and Joint Angle Collective matrix An example of how this is represented can be seen in figure 32. This specific measuring sequence is attained while driving in Gothenburg city. The torque has the highest occurrence around (interval 4-9) -120-130 [nm] and angles between 5-8 degrees. This is logical since city driving involves a lot of engine breaking both without the breaks applied and also with the breaks applied since the driveshaft, gearbox and engine always are connected while in drive mode. The angle interval between 5-8 degrees also makes sense since the driving sequence mainly involves driving straight forward with few turns in total. If the steering angle is around 0 the total angle for the driveshaft joint will be equal to the vertical component which normally varies between 5-7 degrees.
7.4.3. Duty Value Seen in figure 33 the Duty Value is highest around torque levels of around 1000 [Nm]. This means that the accumulated load is at its highest in these intervals. This makes sense since normal driving at speeds equivalent to city driving will

45
suggest a high accumulated load of around 1000 [Nm]. Heavy acceleration will correspond to loads in excess of 1200 [Nm] and since this type of acceleration occurs relatively seldom low Duty Values can be seen in this area. The same reasoning applies for Duty Values lower then about700 [Nm]. This would suggest a low amount of engine breaking in order to lower the speed or simply coming to a standstill position.
7.4.4. Level Crossings Figure 34 shows that Level Crossings from -50 to -100 occur frequently. Since city driving involves a relative high amount of frequent accelerations and breaking this makes sense. When breaking with a car equipped with an automatic gearbox, while continuously having it in drive, the engine will also help breaking (lowering) the speed. Therefore the driveshafts will experience torque while breaking as represented by the large number of level crossings below 0 [Nm]
7.4.5. Rainflow The rainflow analysis represented in figure 35 shows that the number of cycles are highest around mean values for torque of around 0 [Nm]. The amplitude for this has the highest occurrence just up to 25 [Nm]. A very low amount of cycles can be seen at mean values of over 0 [Nm] and amplitudes over 75 [Nm]. This is to be expected since the sampling frequency is relatively high and torque levels mainly are sustained over a relatively long period of sampling history.
7.5. Reflections on Previous Relevant Knowledge Throughout the project relevant methods and approaches learnt during the education are implemented. For concept evaluation and screening various product development methods are used such as for example the concept scoring and screening methods. Previously gained knowledge in MATLAB has been of great help when programming the script although a lot of new knowledge had to be acquired. Previous courses in machine element and mechanics helped to speed up the learning of how the driveshaft works as well as understanding the systems closely joined to the driveshaft such as the gearbox, suspension and steering. Also the calculations that are performed in MATLAB involve a certain amount of general math knowledge on a higher level.

46
7.6. Sustainable Development A key aspect of any study on this level should include focus on sustainable development. Given the method of analysis and result, this gives a possibility of choosing the driveshafts more correctly. Both a smaller shaft and joint can be used. This means that material and weight can be saved in addition to a lower cost for the driveshaft. Lowering the weight of the driveshaft gives a lower total weigh of the car and will mean lower fuel consumption. However, the saved weight for the driveshaft will be relatively small but if a similar approach is applied to all components this will of course greatly reduce the total weight of the car.
7.7. Further Development Suggestions on further development are made in case of expanding the work at a later state.
7.7.1. Measurement Equipment There are a few ideas and suggestions that are interesting for further development of the measurement equipment. Firstly, the measurement equipment developed allows for positioning of the sensor at the center of the joint, which means that if the sensor arm could be connected physically directly to the driveshaft, the measurements would be fully linear and thereby more correct than the measurements measured by the existing equipment. Some of the concepts generated in the concept generation phase measure directly on the driveshaft. Although these concepts are only at an early development stage important aspects such as the high rotational speed and the longitudinal movement of the driveshaft would have to be carefully investigated. Furthermore, movements of the sub-frame might be interesting to measure in order to investigate to what extent these movements affect the angle of the driveshafts. As for the existing solution, these movements are taken into account since the consoles are attached to the gearbox/engine but if an investigation of the sub-frame movements would show a low contribution to the resulting angles, a future measurement solution might be easier to implement. Volvo cars with the extra equipment FOUR-C and/or Xenon lights are equipped with a type of angle sensors which are attached to the linkage arm and the wheelhouse. These sensors are connected to the CAN-net, which would mean that no extra measurement equipment would have to be installed; only a calibration of the sensors would be necessary.
7.7.2. Script The script is designed to calculate torque and joint angle collective based on front-wheel driveshafts. Load collectives are used for other driveline components as well, therefore, a suggestion for further development would be to increase the functionality of the script and adapt it to handle other components. Other components could be rear-wheel driveshafts, propeller shafts, gearboxes and so on. The basic functionality behind calculation of other load collectives exists in the script but the required signals, formulas and the layout need to be adjusted.
47
8. Conclusions Conclusions of the work are for relevant parts are presented in this chapter.
8.1. Measurement Equipment
The developed measurement equipment measures the vertical articulation angle on the front wheel driveshafts with an approximate error of 0.5°.
The developed measurement equipment has shown to withstand Volvo Cars Corporations test program and manages to acquire measurement data without breaking.
The developed measurement equipment is possible to use on different Volvo models through slight design changes.
Sources of errors due to sub-frame movement are taken into account through the gearbox/engine mounting.
Verification of the measurement equipment’s accuracy has only been proven while the car is not operating. There are still problems with verifying the accuracy of the measurement equipment on an operating car.
8.2. Script
The script compiles and presents acquired measurement data as a torque and joint angle collective among with a set of other classification methods based on joint angle, torque and number of revolutions.
The outputs of the script can be exported to an .xls-file and used to analyze acquired measurement data in order to raise the life-length of driveshafts as well as lower the cost and weight of driveshafts.
The one-window-Graphical User Interface, the four steps, the progress windows etc. makes the script user friendly and simple to follow.

48
References [1] Volvo Corporate Report. (2010) http://www.volvocars.com/intl/top/about/corporate/volvo-sustainability/Documents/Volvo_Corporate_report_ENG_2010_locked.pdf (2012-05-16) [2] Cooney Jr C et al. (1979) Universal Joint and Driveshaft Design Manual [3] Pierburg B, Amborn P. (1998) Constant-Velocity Driveshafts for Passenger Cars [4] Nikitas Sidiropoulos (2003) Volvo Internal Document; Calculation methodology for service life analysis of transmission components [5] ASTME1049-85 (2005) Standard Practices for Cycle Counting in Fatigue Analysis [6] Ulrich K, Eppinger S. (2007) Product Design and Development [7] Mayagoitia. R, Nene. A, Veltink. P. (2002) Accelerometer and rate gyroscope measurement of kinematics: an inexpensive alternative to optical motion analysis systems. Journal of Biomechanics. nr 35, page 537-542 [8] O'Donovan K, Kamnik R, O'Keeffe D, Lyons G. (2007) An inertial and magnetic sensor based technique for joint angle measurement. Journal of Biomechanics, nr 40, page 2604-2611 [9] Catharina R et al. (2006) Measuring the angle between a first and a second element under dynamic conditions. SE2219521 [10] Steinert H-R. (2000) Sensor arrangement on a wheel suspension for a vehicle. US6126177 [11] Kurzeja P et al. (2002) Method and apparatus for measuring driveline angles. US6490540 [12] Rapp J et al. (2004) Device for measuring universal joint operating angles in a drive train system. US20040093960 [13] Klank M, Gartner A (2011) Wheel suspension for a vehicle. US20110153
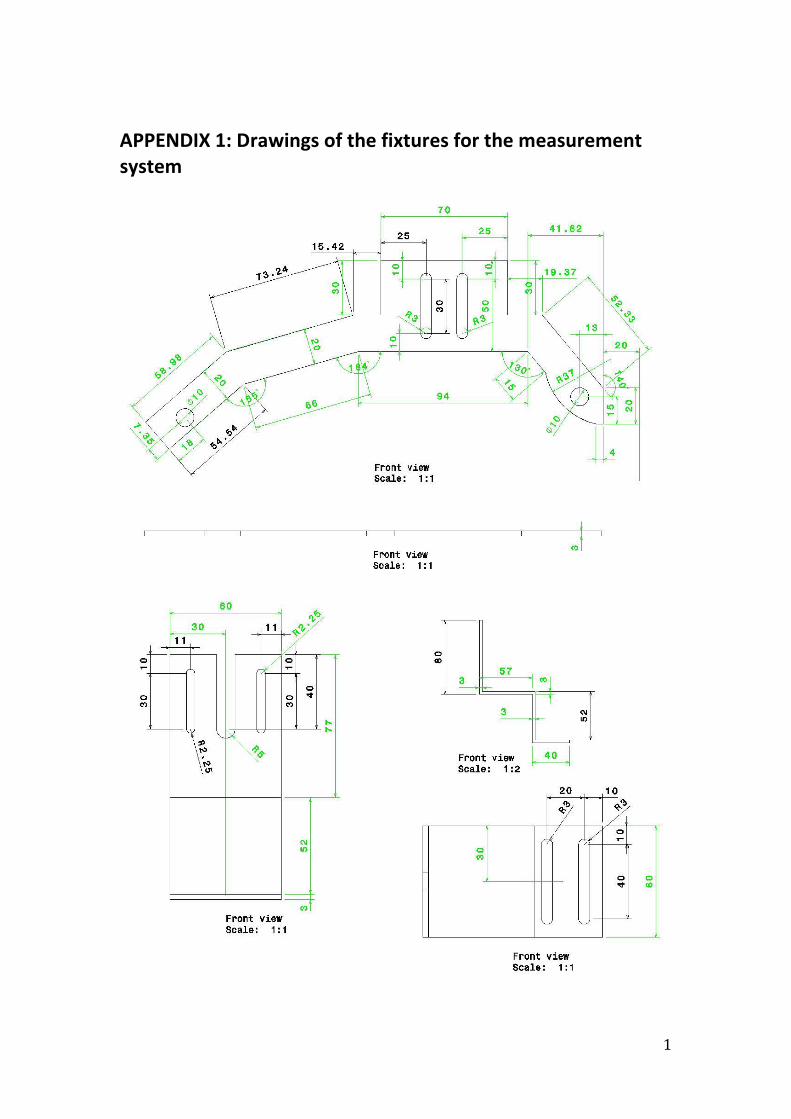
1
APPENDIX 1: Drawings of the fixtures for the measurement system
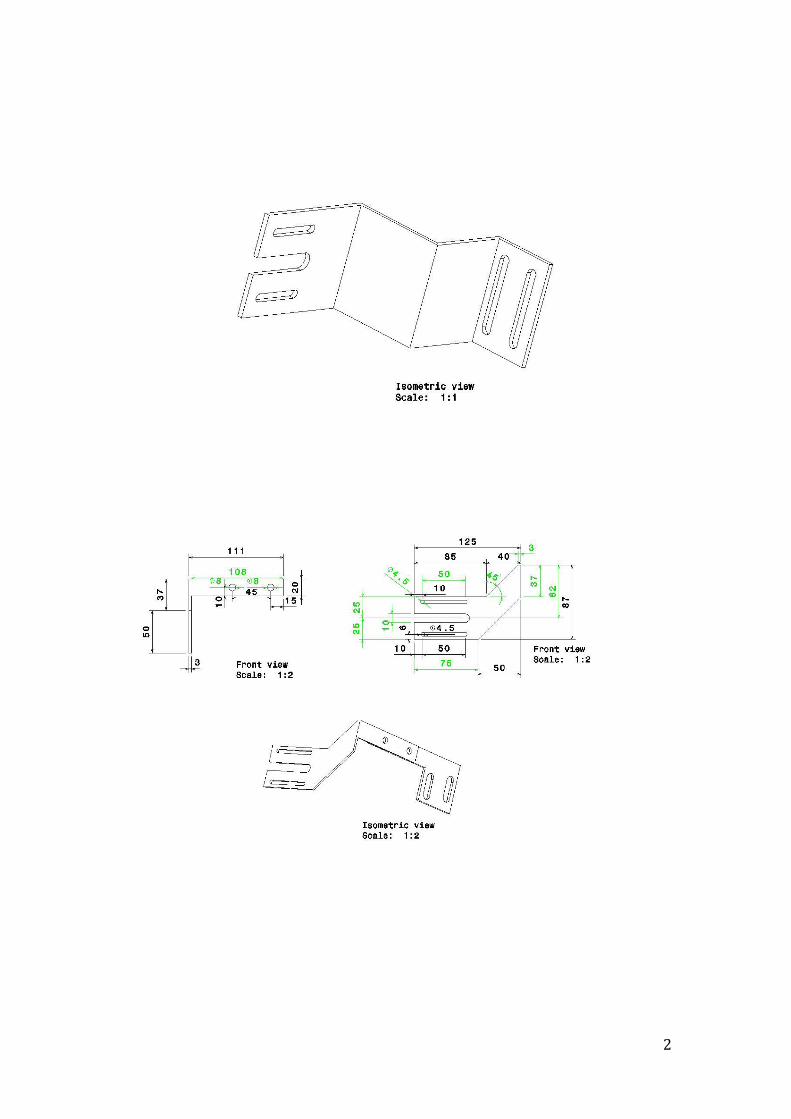
2
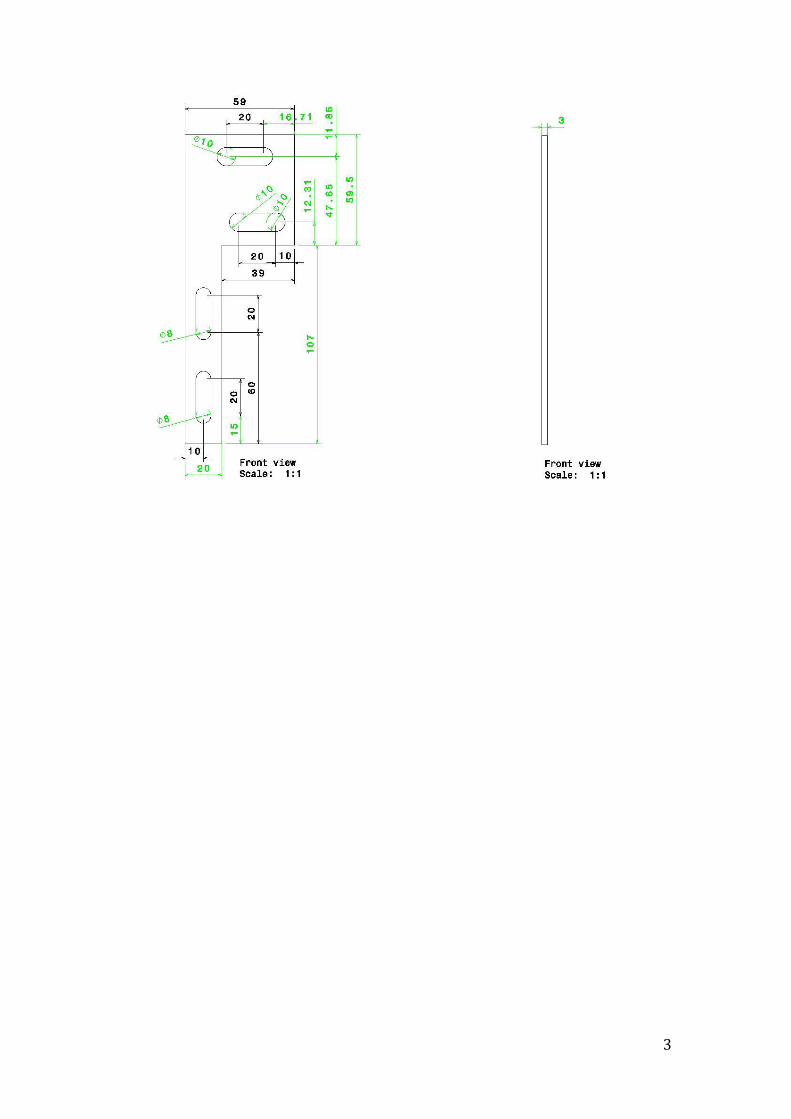
3

4
APPENDIX 2: Calibration Diagrams
0
5
10
15
20
25
30
35
40
-600 -400 -200 0 200 400 600
To
rqu
e (
Nm
)
Volt (V)
Calibration Diagram Steering Angle
-3000
-2000
-1000
0
1000
2000
3000
-10 -5 0 5 10
To
rqu
e (
Nm
)
Volt (V)
Calibration Diagram Right Driveshaft

5
-3000
-2000
-1000
0
1000
2000
3000
-10 -5 0 5 10
To
rqu
e (
Nm
)
Volt (V)
Calibration Diagram Left Driveshaft
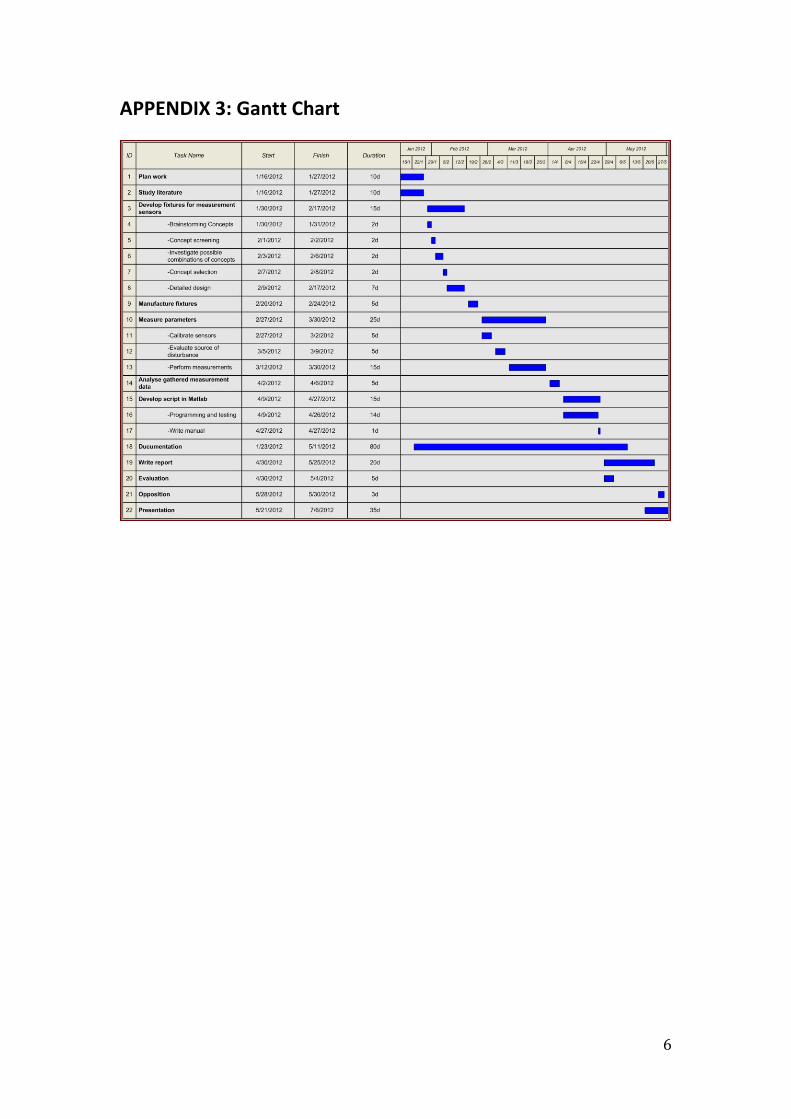
6
APPENDIX 3: Gantt Chart