total n-nitrosamine precursor adsorption with carbon
TRANSCRIPT
University of Arkansas, FayettevilleScholarWorks@UARK
Theses and Dissertations
5-2017
Total N-nitrosamine Precursor Adsorption withCarbon Nanotubes: Elucidating ControllingPhysiochemical Properties and Developing a Size-Resolved Precursor SurrogateErin NeedhamUniversity of Arkansas, Fayetteville
Follow this and additional works at: http://scholarworks.uark.edu/etd
Part of the Civil Engineering Commons, Environmental Engineering Commons, and theNanoscience and Nanotechnology Commons
This Dissertation is brought to you for free and open access by ScholarWorks@UARK. It has been accepted for inclusion in Theses and Dissertations byan authorized administrator of ScholarWorks@UARK. For more information, please contact [email protected], [email protected].
Recommended CitationNeedham, Erin, "Total N-nitrosamine Precursor Adsorption with Carbon Nanotubes: Elucidating Controlling PhysiochemicalProperties and Developing a Size-Resolved Precursor Surrogate" (2017). Theses and Dissertations. 1993.http://scholarworks.uark.edu/etd/1993
Total N-nitrosamine Precursor Adsorption with Carbon Nanotubes: Elucidating Controlling Physiochemical Properties and Developing a Size-Resolved Precursor Surrogate
A dissertation submitted in partial fulfillment of the requirements for the degree of
Doctorate of Philosophy in Civil Engineering
by
Erin Michelle Needham University of Arkansas
Bachelor of Science in Civil Engineering, 2013
May 2017 University of Arkansas
This dissertation is approved for recommendation to the Graduate Council.
_____________________________ Dr. Julian Fairey Dissertation Director _____________________________ _____________________________ Dr. Wen Zhang Dr. David Miller Committee Member Committee Member _____________________________ Dr. Justin Chimka Committee Member
Abstract
As drinking water sources become increasingly impaired with nutrients and wastewater
treatment plant (WWTP) effluent, formation of disinfection byproducts (DBPs) – such as
trihalomethanes (THMs), dihaloacetonitriles (DHANs), and N-nitrosamines – during water
treatment may also increase. N-nitrosamines may comprise the bulk of the chronic toxicity in
treated drinking waters despite forming at low ng/L levels. This research seeks to elucidate
physicochemical properties of carbon nanotubes (CNTs) for removal of DBP precursors, with an
emphasis on total N-nitrosamines (TONO).
Batch experiments with CNTs were completed to assess adsorption of THM, DHAN, and
TONO precursors; physiochemical properties of CNTs were quantified through gas adsorption
isotherms and x-ray photoelectron spectroscopy. Numerical modeling was used to elucidate
characteristics of CNTs controlling DBP precursor adsorption. Multivariate models developed
with unmodified CNTs revealed that surface carboxyl groups and, for TONO precursors,
cumulative pore volume (CPV), controlled DBP precursor adsorption. Models developed with
modified CNTs revealed that specific surface area controlled adsorption of THM and DHAN
precursors while CPV and surface oxygen content were significant for adsorption of TONO
precursors.
While surrogates of THM and DHAN precursors leverage metrics from UV absorbance
and fluorescence spectroscopy, a TONO precursor surrogate has proved elusive. This is
important as measurements of TONO formation potential (TONOFP) require large sample
volumes and long processing times, which impairs development of treatment processes. TONO
precursor surrogates were developed using samples that had undergone oxidative or sorption
treatments. Precursors were analyzed with asymmetric flow field-flow fractionation (AF4) with
inline fluorescence detection (FLD) and whole water fluorescence excitation-emission matrices
(EEMs). TONO precursor surrogates were discovered, capable of predicting changes in
TONOFP in WWTP samples that have undergone oxidation (R2 = 0.996) and sorption (R2 =
0.576). Importantly, both surrogates only require just 2 mL of sample volume to measure and
take only 1 hour. Application of the sorption precursor surrogate revealed that DBP precursor
adsorption was feasible with freeform CNT microstructures with various dimensions and surface
chemistries, establishing a framework for development of this novel CNT application for
drinking water treatment.
Acknowledgements
I would like to thank my husband along with my family and friends for their encouragement and
unwavering support. I would also like to acknowledge my dissertation director and committee
members for their guidance. Financial support from the National Science Foundation (CBET
#1254350 to Julian Fairey) and the University of Arkansas Graduate School Doctoral Academy
Fellowship is gratefully acknowledged.
Table of Contents
Chapter 1: Introduction .............................................................................................................1
1. Problem Statement .................................................................................................................2
2. Objectives and Approach .......................................................................................................5
2.1. Objective 1 ......................................................................................................................5
2.2. Objective 2 ......................................................................................................................5
2.3. Objective 3 ......................................................................................................................6
3. Document Organization .........................................................................................................6
4. References ..............................................................................................................................8
Chapter 2: Trihalomethane, Dihaloacetonitrile, and Total N-nitrosamine Precursor Adsorption
by Carbon Nanotubes: The Importance of Surface Oxides and Pore Volume ............................10
Abstract ........................................................................................................................................11
1. Introduction ............................................................................................................................12
2. Materials and Methods ...........................................................................................................15
2.1. Site Description and Sample Collection .........................................................................15
2.2. Experimental Procedures ................................................................................................16
2.2.1. Bottle-Point Isotherms ............................................................................................16
2.2.2. DBPFP ....................................................................................................................17
2.2.3. CNT Characterization .............................................................................................18
2.2.4. Data Modeling ........................................................................................................19
3. Results and Discussion ..........................................................................................................20
3.1. DBP Precursor Adsorption by CNTs ..............................................................................20
3.2. CNT Characterization .....................................................................................................22
3.3. Impacts of Physiochemical CNT Properties on DBP Precursor Adsorption ..................23
3.4. Fluorescence Metrics as DBP Precursor Surrogates ......................................................26
3.5. Implications ....................................................................................................................27
4. Conclusions ............................................................................................................................28
5. Associated Content ................................................................................................................30
6. Figures and Tables .................................................................................................................31
7. References ..............................................................................................................................37
Appendix 1: Supplementary Information for “Trihalomethane, Dihaloacetonitrile, and Total N-
nitrosamine Precursor Adsorption by Carbon Nanotubes: The Importance of Surface Oxides and
Pore Volume”...............................................................................................................................45
Chapter 3: Revealing a Size-Resolved Fluorescence-Based Metric to Track Oxidative
Treatment of Total N-nitrosamine Precursors in Wastewater-Derived Waters ...........................76
Abstract ........................................................................................................................................77
1. Introduction ............................................................................................................................78
2. Materials and Methods ...........................................................................................................79
2.1. Sample Description and Water Quality Measurements ..................................................79
2.2. Experimental Procedures ................................................................................................80
2.2.1. DBPFP ...................................................................................................................80
2.2.2. AF4-FLD Fractograms ..........................................................................................81
2.3. AF4-FLD Processing ......................................................................................................82
2.4. Model Development .......................................................................................................82
3. Results and Discussion ..........................................................................................................83
3.1. AF4-FLD ........................................................................................................................83
3.2. Model Development .......................................................................................................84
3.3. Implications ....................................................................................................................86
4. Associated Content ................................................................................................................87
5. Figures and Tables .................................................................................................................88
6. References ..............................................................................................................................91
Appendix 2: Supplementary Information for “Revealing a Size-Resolved Fluorescence-Based
Metric to Track Oxidative Treatment of Total N-nitrosamine Precursors in Wastewater-Derived
Waters” ........................................................................................................................................94
Chapter 4: Trihalomethane, Dihaloacetonitrile, and Total N-nitrosamine Precursor Adsorption
by Modified Carbon Nanotubes (CNTs) and Freeform CNT Microstructures ............................115
Abstract ........................................................................................................................................116
1. Introduction ............................................................................................................................117
2. Materials and Methods ...........................................................................................................120
2.1. Site Description and Sample Collection .........................................................................120
2.2. Batch Adsorbent Selection .............................................................................................120
2.3. Characterizations of Pattered CNT Forests ....................................................................121
2.4. Experimental Procedures ................................................................................................122
2.4.1. Bottle-point Isotherms ...........................................................................................122
2.4.2. DBPFP ...................................................................................................................122
2.4.3. Continuous Flow Experiments with CNT Mats ....................................................123
2.4.4. AF4-FLD ...............................................................................................................123
2.4.5. Fluorescence EEMs ...............................................................................................124
2.5. Data Modeling ................................................................................................................124
3. Results and Discussion ..........................................................................................................125
3.1. Batch Adsorption Models ...............................................................................................125
3.2. TONO Precursor Surrogate Development ......................................................................128
3.3. Continuous Flow CNT Mat Testing ...............................................................................129
4. Conclusions ............................................................................................................................131
5. Associated Content ................................................................................................................133
6. Figures and Tables .................................................................................................................134
7. References ..............................................................................................................................141
Appendix 3: Supplementary Information for “Trihalomethane, Dihaloacetonitrile, and Total N-
nitrosamine Precursor Adsorption by Modified Carbon Nanotubes (CNTs) and Freeform CNT
Microstructures” ..........................................................................................................................144
Chapter 5: Conclusion ...............................................................................................................155
1. Summary ................................................................................................................................156
2. Significance and Future Work ...............................................................................................157
List of Published Papers
Chapter 2
Needham, E. M., Sidney, S. M., Chimka, J. R., and Fairey, J. L., 2016. Trihalomethane,
dihaloacetonitrile, and total N-nitrosamine precursor adsorption by carbon nanotubes: the
importance of surface oxides and pore volume. Environmental Science: Water Research
and Technology, 2 (6), 1004-1013.
Chapter 3
Needham, E. M., A. M. Fernandez de Luis, J. R. Chimka, and J. L. Fairey, 2017. Revealing a
size-resolved fluorescence-based metric to track oxidative treatment of total N-
nitrosamine precursors in wastewater-derived waters. Environmental Science &
Technology Letters, In Revision.
Chapter 4
Needham, E. M., J. R. Chimka, and J. L. Fairey, 2017. Trihalomethane, dihaloacetonitrile, and
total N-nitrosamine precursor adsorption by modified carbon nanotubes (CNTs) and
freeform CNT microstructures. Environmental Science: Water Research and Technology,
In Progress.

1
Chapter 1
Introduction
2
1. Problem Statement
The formation of disinfection byproducts (DBPs) in drinking water systems has been
studied since the 1970s but remains an ongoing regulatory compliance issue throughout the
United States. For example, in 2014, the Beaver Water District (Lowell, AR) switched primary
disinfectants primarily for DBP control – the capital cost of this project cost was $5.2 million
and the operating cost is $1.0 million annually (HagenBurger, 2017). Halogenated DBPs such as
trihalomethanes (THMs) and dihaloacetonitriles (DHANs) form through reactions between
natural organic matter (NOM) present in the source water and disinfectants, such as free chlorine
or chloramines. THMs are regulated under the Stage 2 Disinfectants/Disinfection Byproduct
(D/DBP) Rule because of widespread occurrence in chlorinated or chloraminated drinking water
and potential carcinogenicity. While DHANs are not regulated, their formation is also
widespread and these DBPs are more toxic than some regulated DBPs (Muellner et al., 2007). As
a result, the control of many non-regulated DBPs is an active area of research, in particular for
compounds with high toxicity and widespread occurrence.
DBP formation upon disinfection can be fomented by source water impairment. For
instance, drinking water sources enriched with nutrients (nitrogen and phosphorus) can undergo
eutrophication (Schindler, 1974), which leads to the formation of algal organic matter (AOM);
similarly, wastewater treatment plant (WWTP) effluents contain effluent organic matter (EfOM)
(Sirivedhin and Gray, 2005). AOM and EfOM contain labile chemical moieties which, upon
chloramination, can result in the formation of THMs, DHANs, and N-Nitrosamines (Krasner et
al., 2013), the latter being a non-regulated group of DBPs that form at low ng⋅L-1 levels but may
nevertheless comprise the bulk of the chronic toxicity exerted by treated drinking waters (Hrudey
and Charrois, 2012). Although N-Nitrosodimethylamine (NDMA) is the most commonly
3
occurring N-nitrosamine in drinking water systems (Russell et al., 2012), Dai and Mitch (2013)
showed that NDMA comprised just 5% of total N-Nitrosamines (TONO). As source waters
become less pristine (i.e., continued enrichment with AOM and EfOM), development of
processes for enhanced DBP precursor removal could help drinking water treatment plants
(DWTPs) continue to meet regulatory requirements and decrease the toxicity of their finished
water.
Carbon nanotubes (CNTs) have not been used in conventional DWTPs but have the
potential to be used for adsorption of DBP precursors. CNTs have a structure similar to a rolled
graphene sheet and possess high specific surface area. Because of the lack of bulk carbon in
CNTs, their surface properties such as size, shape, texture, defects, and functionalities can be
manipulated for desired applications. Others have observed that CNTs show an affinity for
various NOM fractions in water (Wang et al., 2009; Yang and Xing, 2009), but these
investigations were intended to minimize NOM uptake by CNTs in favor of adsorption of other
target compounds. No existing work to date has explored the ability of CNTs to simultaneously
remove THM, DHAN, and TONO precursors from natural waters.
Though CNT toxicity (Liu et al., 2013; Das et al., 2014) is a concern in drinking water
treatment, particularly with respect to fate and transport of toxic substances related to CNTs
(Yang and Xing, 2009), several attached growth technologies now exist to grow CNTs on
various substrates or to incorporate CNTs into membrane filtration systems (De Volder et al.,
2014). These options could be valuable in addressing issues with CNT toxicity. In particular,
freeform CNT microstructures can be grown on silicon substrates in various shapes and sizes.
Provided the physical and chemical properties of CNTs can be tuned to make CNTs a promising
4
sorbent for DBP precursors, these application methods can be developed to further the goal of
enhanced DBP precursor removal in DWTPs.
TONO formation in drinking water systems is of particular interest as formation of these
compounds is expected to increase in the coming years as source waters become less pristine and
more utilities switch to chloramines to comply with the Stage 2 D/DBP rule to achieve adequate
control of regulated DBPs. Additionally, drinking water TONO research was initiated relatively
recently (i.e., the first publication on the subject appeared in 2010 by Mitch and colleagues), so
strategies to curb TONO formation and measure TONO itself are in the developmental stage.
Spectroscopic DBP precursor surrogates provide estimates of precursor concentrations
and are often developed in conjunction with DBP formation potential (DBPFP) tests. Such
surrogates can be used to assess the effectiveness of treatment processes targeting removal of
DBP precursors and can reduce (or even eliminate) the need for time-consuming DBPFP
measurements. Metrics from fluorescence excitation-emission matrices (EEMs) have been
shown to be strong precursor surrogates for total THMs (TTHMs) (Pifer and Fairey, 2014) and
dihaloacetonitriles (DHANs) (Do et al., 2015). One goal of this study is to expand on past
analysis techniques such as parallel factor analysis (PARAFAC) for fluorescence EEMs
(Stedmon and Bro, 2008) and use asymmetric flow-field flow fractionation (AF4) with inline
fluorescence detection (AF4-FLD) to develop a precursor surrogate for TONO. The use of AF4
allows for size-based separation of natural organic matter (NOM) prior to fluorescence
measurement and is potentially useful for a higher resolution characterization of protein-like (i.e.,
organic nitrogen containing) DBP precursors that may be obscured in traditional fluorescence
EEMs. Notably, the AF4-FLD measurement utilizes small sample volumes (i.e., 0.5 mL), which
allows for flexibility in the design of lab-scale treatment processes.
5
This dissertation focuses on (1) methodological improvements to the TONO
quantification procedure and data analysis techniques (2) development of a novel
characterization technique for TONO precursors, (3) assessment of TONO precursor removal by
CNTs in competitive adsorption systems with concomitant THM- and DHAN precursor removal,
and (4) elucidation of physicochemical CNTs properties that control DBP precursor adsorption.
2. Objectives and Approach
2.1. Objective 1
The first objective of this research is to assess multiple types of CNTs for DBP precursor
adsorption and identify the controlling physicochemical CNT properties. Nine types of CNTs
were selected with a wide range of physicochemical characteristics and used in batch
experiments to assess adsorption of TTHM, DHAN, and TONO precursors. In separate
experiments, each CNT type was characterized physically by gas adsorption isotherms and
chemically by x-ray photoelectron spectroscopy (XPS). Thus, the performance of the nine CNT
types relative to each other and relative to other common adsorbents (such as activated carbon)
can be established. The controlling physicochemical CNT properties identified will be used to
guide rational selection of CNT types to maximize DBP precursor adsorption in continuous flow
packed-bed column experiments.
2.2. Objective 2
The second objective of this research is to develop a TONO precursor surrogate using
fluorescence EEMs and AF4-FLD. The focus of TONO method development will be on
improved QA/QC practices that account for NDMA recovery in the standard curve and reaction
chamber degradation over the course of a sample set. The goal of the AF4-FLD method
development is to establish a procedure to separate and size (i.e., determine the approximate
6
molecular weight) protein-like organics in waters containing EfOM and AOM. Metrics from
fluorescence EEMs and AF4-FLD will be assessed as a TONO precursor surrogate in waters
treated by oxidation (i.e., chlorine, ozone, and UV disinfection) and sorption (i.e., CNTs and
activated carbon).
2.3. Objective 3
The third objective of this research is to assess CNTs selected based on desirable
physicochemical properties identified in Objective 1 for enhanced removal of TONO precursors.
Assessments occurred in batch reactors and CNTs were characterized by gas adsorption
isotherms and XPS. Hypotheses regarding physicochemical CNT properties and DBP precursor
adsorption will be developed further to formulate a rational framework for optimizing CNTs.
Additionally, to address fate and toxicity concerns regarding CNTs, freeform CNT
microstructures grown on a silicon substrate were assessed in continuous flow studies in terms of
sorption of THM, DHAN, and TONO precursors.
3. Document Organization
Chapter 2 addresses Objective 1 and details the batch application of nine types of CNTs
for DBP precursor removal. These results demonstrated that CNTs have natural affinity for
TTHM, DHAN, and TONO precursors. Unexpectedly, CNTs had the highest affinity for TONO
precursors, which were thought to be the least hydrophobic, a result that is encouraging for
targeted removal for these compounds. Chapter 2 also includes results from the physical and
chemical CNT analyses and numerical models aimed at identifying control CNT properties for
DBP precursor adsorption.
Chapter 3 addresses Objective 2. An AF4-FLD method was developed that can
distinguish between water types enriched with EfOM in terms of NOM size and chemistry.
7
Metrics from this novel AF4-FLD method were used in conjunction with corresponding
TONOFP data and to develop a TONO precursor surrogate. The resultant surrogate can be
leveraged to develop and optimize treatment processes to curb N-nitrosamines in drinking water
systems. Additionally, several improvements were made to TONO measurement QA/QC
practices including the application of the solid phase extraction process to the standard curve (i.e.,
the same process as applied to the samples) and progress in accounting for degradation of the
TONO reaction chamber.
Chapter 4 addresses Objective 3, which leveraged the controlling physical and
chemical CNT characteristics identified in Chapter 2 to select several types of CNTs for
enhanced TTHM, DHAN, and TONO precursor removal. Batch experiments with CNTs were
analyzed and numerical models were developed to assess the impact of sorbent physical and
chemical properties on the sorption of DBP precursors, with an emphasis on TONO. A separate
TONO precursor surrogate was developed using the data from batch sorption tests in
combination with the novel AF4-FLD method developed in Chapter 3 and applied to assess the
performance of CNT microstructures grown on mats (De Volder et al., 2014) in a continuous
flow setting.
8
4. References
Dai, N. and Mitch, W. A., 2013. Relative importance of N-nitrosodimethylamine compared to
total N-nitrosamines in drinking waters. Environmental Science & Technology 47 (8), 3648-3656.
Das, R., Hamid, S. B. A., Ali, M. E., Ismail, A. F., Annuar, M. S. M. and Ramakrishna, S., 2014. Multifunctional carbon nanotubes in water treatment: The present, past and future. Desalination 354, 160-179.
De Volder, M., Park, S., Tawfick, S. and Hart, A. J., 2014. Strain-engineered manufacturing of freeform carbon nanotube microstructures. Nature Communications 5.
Do, T. D., Chimka, J. R. and Fairey, J. L., 2015. Improved (and singular) disinfectant protocol for indirectly assessing organic precursor concentrations of trihalomethanes and dihaloacetonitriles. Environmental Science & Technology 49 (16), 9858-9865.
HagenBurger, B. (2017). Personal Communication with J. L. Fairey on Cost of chlorine dioxide feed system at the Beaver Water District.
Hrudey, S. E. and Charrois, J. W. A., Eds. (2012). Disinfection by-products and human health. IWA Publishing and Australian Water Association, London.
Krasner, S. W., Mitch, W. A., McCurry, D. L., Hanigan, D. and Westerhoff, P., 2013. Formation, precursors, control, and occurrence of nitrosamines in drinking water: A review. Water Research 47 (13), 4433-4450.
Liu, Y., Zhao, Y., Sun, B. and Chen, C., 2013. Understanding the toxicity of carbon nanotubes. Accounts of Chemical Research 46 (3), 702-713.
Muellner, M. G., Wagner, E. D., McCalla, K., Richardson, S. D., Woo, Y. T. and Plewa, M. J., 2007. Haloacetonitriles vs. regulated haloacetic acids: are nitrogen-containing DBPs more toxic? Environmental Science & Technology 41 (2), 645-651.
Pifer, A. D. and Fairey, J. L., 2014. Suitability of organic matter surrogates to predict trihalomethane formation in drinking water sources. Environmental Engineering Science 31 (3), 117-126.
9
Russell, C. G., Blute, N. K., Via, S., Wu, X. and Chowdhury, Z., 2012. National assessment of nitrosamine occurrence and trends. Journal American Water Works Association 104 (3), E205-E217.
Schindler, D. W., 1974. Eutrophication and recovery in experimental lake - Implications for lake management. Science 184 (4139), 897-899.
Sirivedhin, T. and Gray, K. A., 2005. 2. Comparison of the disinfection by-product formation potentials between a wastewater effluent and surface waters. Water Research 39 (6), 1025-1036.
Stedmon, C. A. and Bro, R., 2008. Characterizing dissolved organic matter fluorescence with parallel factor analysis: a tutorial. Limnology and Oceanography-Methods 6, 572-579.
Wang, X., Tao, S. and Xing, B., 2009. Sorption and competition of aromatic compounds and humic acid on multiwalled carbon nanotubes. Environmental Science & Technology 43 (16), 6214-6219.
Yang, K. and Xing, B., 2009. Adsorption of fulvic acid by carbon nanotubes from water. Environmental Pollution 157 (4), 1095-1100.
10
Chapter 2
Trihalomethane, Dihaloacetonitrile, and Total N-nitrosamine Precursor Adsorption by
Carbon Nanotubes: The Importance of Surface Oxides and Pore Volume
11
Abstract
As drinking water sources become increasingly impaired, enhanced removal of natural
organic matter (NOM) may be required to curb formation of disinfection byproducts (DBPs)
upon chlor(am)ination. While carbon nanotubes (CNTs) can adsorb NOM, their properties for
DBP precursor adsorption have not been elucidated. Nine types of CNTs were assessed for
trihalomethane (THM), dihaloacetonitrile (DHAN), and total N-nitrosamine (TONO) precursor
adsorption. Batch isotherm experiments were completed with lake water and, to simulate an
impaired condition, effluent from a wastewater treatment plant (WWTP). Adsorption varied with
CNT type and dose, with TONO precursors having the highest percent removals from WWTP
effluent (up to 97%). Physicochemical properties of CNTs were characterized by gas adsorption
isotherms and x-ray photoelectron spectroscopy and numerical models were developed to
identify CNT properties driving DBP precursor adsorption. The models fits were strong (R2 >
0.92) and indicated removal of the three precursor types increased with percent carboxyl groups
(p < 0.01) and, for TONO precursors only, cumulative pore volume (CPV, p = 0.001). A
multicollinearity analysis suggested surface oxides – particularly carboxyl groups – on the CNTs
increased CPV, presumably by increasing electrostatic repulsive forces, which enhanced
microporosity sufficiently to overshadow any repulsion of DBP precursors from negatively
charged surface oxides. A size exclusion analysis revealed all CNT pores were accessible to
TONO precursors, while THM and DHAN precursors had limited access to the smaller
micropores. These findings provide a framework to modify CNTs to optimize adsorption of DBP
precursors and demonstrate the potential of CNTs for TONO precursor removal.
12
1. Introduction
The tunable physicochemical properties of carbon nanotubes (CNTs) (Tawfick et al.,
2012; De Volder et al., 2014) have the potential to be exploited in drinking water treatment
plants (DWTPs) to adsorb organic precursors of disinfection byproducts (DBPs). While CNT
toxicity (Liu et al., 2013; Das et al., 2014) is a concern in water treatment, the technology is now
available to grow CNTs on various substrates as well as to incorporate CNTs into membrane
filtration systems (De Volder et al., 2014). This may alleviate problems associated with fate and
transport of toxic substances related to CNTs (Yang and Xing, 2009) in drinking waters.
However, before CNT-based attached growth or membrane applications can be developed
specifically to enhance DBP precursor removal, fundamental investigations are needed to
quantify the affinity of CNTs for important groups of DBP precursors and elucidate the
physiochemical properties primarily responsible for their adsorption.
It is well known that natural organic matter (NOM) in source water reacts with
disinfectants (i.e., free chlorine or chloramines) to form DBPs at low µg⋅L-1 levels, such as
trihalomethanes (THMs) (Rook, 1976) and dihaloacetonitriles (DHANs) (Krasner et al., 2006).
In waters enriched with algal organic matter or impacted by wastewater treatment plant (WWTP)
effluents, N-nitrosamines can also form, albeit at low ng⋅L-1 levels (Krasner et al., 2013). N-
nitrosamines are a non-halogenated group of DBPs under consideration for regulation in drinking
waters due to their high toxicity (Hrudey and Charrois, 2012). While the majority of N-
nitrosamine research to date has focused on N-nitrosodimethylamine (NDMA) due to its
prevalence in drinking water systems (Russell et al., 2012), recent studies have demonstrated
NDMA may only comprise ~5% of total N-nitrosamines (TONO) in chloramine systems (Dai
and Mitch, 2013). As such, relatively little is known about the removal of TONO precursors by
13
engineered sorbents, although a recent study demonstrated that they have some affinity for
activated carbon (Dai et al., 2012). Further, the authors are aware of no studies that have assessed
the concomitant removal of THM, DHAN, and TONO precursors in sorption processes. With
respect to CNTs, other researchers have demonstrated their affinity for various NOM fractions in
water (Wang et al., 2009; Yang and Xing, 2009), although these investigations were geared
towards minimizing NOM uptake by CNTs to maximize adsorption of other target compounds.
Regardless, development of novel sorbents with enhanced affinities for organic DBP precursors
could potentially be leveraged to curb DBP formation in finished drinking waters, regardless of
the disinfection scheme used.
As DBP measurements are time- and labor-intensive, reliable DBP precursor surrogate
measures can be valuable screening tools to assess treatment. Previous studies by this research
group have demonstrated metrics from fluorescence excitation-emission matrices (EEMs)
collected before and after treatment but prior to chlor(am)ination were strong total THM
(TTHM) precursor surrogates (Pifer and Fairey, 2014). In these studies, the EEMs were
decomposed by parallel factor analysis (PARAFAC) to identify principal fluorophore groups
(Stedmon and Bro, 2008). The corresponding maximum intensity values, FMAX, of humic- and
fulvic-like fluorophores correlated strongly with TTHM precursor concentrations. A more recent
study found strong correlations between fluorescence intensity values from peak-picking (i.e.,
excitation-emission pairs, IEx/Em) and removal of TTHM and DHAN precursors (Do et al., 2015).
There is, however, a strong basis for why fluorescence may be useful as a TONO precursor
surrogate. For example, in contrast to EPA Method 521 N-nitrosamines, algal-derived organic
matter is a strong precursor to uncharacterized N-nitrosamines measured by the TONO assay
(Krasner et al., 2013). Additionally, Liao and colleagues found strong correlations between the
14
removal of NA9FP – the sum of the FP of the six N-nitrosamines regulated under the UCMR2
along with N-nitrosomorpholine, N-nitrosopiperidine, and N-nitrosodiphenylamine – and the
regions of a fluorescence EEM associated with aromatic proteins (R = 0.88) and soluble
microbial products (R = 0.90) (Liao et al., 2014). Aromatic proteins are nitrogen-containing and
N-nitrosamine precursors can be present as functional groups, while soluble microbial products
have been identified as an NDMA precursor (Krasner et al., 2013). In essence, secondary,
tertiary, and quaternary amines may not fluoresce themselves but may be associated with
compounds that do so. Coupled with the labor-intensive nature of TONOFP tests, a fluorescence-
based TONO precursor surrogate would advance development of control measures for these
DBPs.
Given that the structure of CNTs is equivalent to that of a rolled graphene sheet, their
physicochemical properties dictate their functionality. CNTs can be produced in single-walled
(SW) and multi-walled (MW) varieties, both of which have high specific surface area and range
in hydrophobicity (Wang et al., 2009; Yang and Xing, 2009), size (Balasubramanian and
Burghard, 2005), shape (De Volder et al., 2014), texture (Birch et al., 2013), defects (Shih and Li,
2008), and functionalities (Cho et al., 2008), all of which can be manipulated for their intended
application. The ability to fine-tune CNT properties is an attractive option for use as a sorbent in
drinking water treatment, but it is not yet known what properties are desirable for DBP precursor
removal. Adsorption by CNTs is based on accessible surface area, which includes aggregated
pores and large external surface area, in contrast to activated carbon, which preferentially
adsorbs lower molecular weight compounds due to size exclusion from micropores. CNTs have
been shown to have high adsorption capacities for organic contaminants (Ren et al., 2011) and to
15
outperform other microporous adsorbents in competitive adsorption systems (Upadhyayula et al.,
2009).
The objective of this study is to assess physicochemical CNT properties for enhanced
TTHM-, DHAN-, and TONO-precursor adsorption. Nine commercially available CNTs were
selected with a variety of characteristics and used in batch isotherm tests with two diverse water
sources – a well-characterized lake water (Sen et al., 2007) that serves as a drinking water source
and an effluent from a conventional WWTP. The TTHM-, DHAN-, and TONO-precursor
concentrations in the raw and CNT-treated waters were indirectly measured using a recently
verified DBP formation potential (DBPFP) test (Do et al., 2015), modified from Standard
Methods 5710-B and D (Eaton, 2005). Each CNT type was characterized physically by gas
adsorption isotherms to determine their specific surface area and pore volume distributions, and
chemically by x-ray photoelectron spectroscopy (XPS) to determine the relative composition of
surface functional groups. These physicochemical properties were used as primary variables in
models to assess the adsorption of TTHM-, DHAN-, and TONO-precursors. Modeling results
revealed strong correlations between CNT properties and removal of all three DBP precursor
types. The findings of this study provide guidance for selective modification of CNTs for
enhanced DBP precursor adsorption.
2. Materials and Methods
2.1. Site Description and Sample Collection
Waters used for the isotherm experiments originated from Beaver Lake, the drinking
water source for Northwest Arkansas, and the West Side Wastewater Treatment Plant (WS-EFF)
in Fayetteville, AR. Beaver Lake water (BL-RAW) was collected at the intake structure of the
Beaver Water District DWTP (Lowell, AR) on July 7, 2014. Details on the land use and nutrient
16
inputs in the Beaver Lake watershed can be found elsewhere (Sen et al., 2007). WS-EFF samples
were collected June 6, 2014 from the WWTP effluent. The plant utilizes biological nutrient
removal, depth filtration, and ultraviolet disinfection with effluent aeration prior to discharge.
Raw water characteristics are detailed in Table S1. Both waters were stored in 50-L low-density
polyethylene carboys at 4 °C in the dark prior to use in the isotherm experiments.
2.2. Experimental Procedures
2.2.1. Bottle-Point Isotherms
Bottle-point isotherms were conducted with nine types of commercially available CNTs,
selected to cover a range of wall type (SW and MW), diameter, and length (Table S2). CNTs
were added to the sample waters at doses of 0-, 25- and 50 mg⋅L-1, in triplicate, in 1.25 L
headspace-free amber glass bottles and were tumbled end-over-end for 3 days. Lu et al. (2007)
showed that 4 hours was sufficient to reach equilibrium in a bottle-point isotherm study with
MWCNTs and NOM-spiked waters. An equilibrium time of 3 days (i.e., 18 times longer) was
chosen in this study and assumed to be a sufficient equilibration period for all precursors given
the diversity of DBP precursors in the sample waters, including those for TONO for which little
characterization information exists. The pH drift during the 3 days of tumbling was less than 0.1
pH unit from the initial values reported in Table S1. CNT doses were chosen to achieve less than
100% removal based on preliminary TTHMFP and DHANFP removal tests, the results of which
are detailed in Table S3. It is important to note that the goal of this study does not include
determination of the required CNT doses at a DWTP; rather, this study is intended identify CNT
properties for enhanced DBP precursor adsorption and future studies will focus on development
of an optimized CNT type and application mode. Following tumbling, BL-RAW samples were
filtered through pre-rinsed 0.45-µm polyethersulfone (PES) membranes (Karanfil et al., 2003).
17
The WS-EFF samples were passed through pre-rinsed 0.7-µm glass fiber filters prior to 0.45-µm
PES filtration, as direct filtration with the PES membranes was impractically slow. In both cases,
filtration removed all CNTs from the water samples, which was confirmed by the lower chlorine
residuals (or higher demand) of the blank relative to the CNT-treated waters (Table S4). Methods
used for measuring dissolved organic carbon (DOC) and fluorescence EEMs, and performing
PARAFAC analysis are in the Supplementary Information (SI) in Appendix 1.
2.2.2. DBPFP
The procedure developed by Do et al. (2015) was used to assess the DBPFP of untreated
waters (i.e., samples not exposed to CNTs) and CNT-treated waters and is detailed in the SI.
EPA Method 551.1 with modifications (Pifer and Fairey, 2012) was used to extract TTHMs and
DHANs into n-pentane. A gas chromatograph equipped with an electron capture detector (GC-
ECD, Shimadzu 2010) was used to quantify TTHMFP (the sum of trichloromethane,
dichlorobromomethane, dibromochloromethane, and tribromomethane formation potential) and
DHANFP (the sum of dichloroacetonitrile, bromochloroacetonitrile, and dibromoacetonitrile
formation potential). Details regarding the GC standard curve are provided in the SI. Blanks and
check standards complied with EPA Method 551.1.
Assessment of total N-nitrosamine formation potential (TONOFP) began with a modified
SPE procedure from EPA Method 521, adapted from Kulshrestha et al. (2010). SPE columns
were conditioned with methanol and Milli-Q water, and then 500 mL sample aliquots were
pulled through the columns at a flow rate of 5 mL⋅min-1. Following 10 minutes of column
aspiration, N-nitrosamines were eluted from the SPE columns using 12 mL of methanol. All
remaining water was removed from the column extracts using a sodium sulfate drying column
rinsed with an additional 3 mL of methanol; leached sodium sulfate was subsequently removed
18
with a 0.2 μm nominal pore size polytetrafluoroethylene syringe filter. Samples were
concentrated to 1 mL in a 37 °C water bath using an evaporator with ultra high purity nitrogen
gas and stored at -20 °C. To eliminate potential interferences, S-nitrosothiols and nitrite, if
present, were quenched immediately before TONO measurement from sample extracts with 20
g⋅L-1 mercuric chloride in Milli-Q water and 50 g⋅L-1 sulfanilamide in 1 N HCl, respectively.
Notably, ion chromatography results (Table S1) indicated no nitrite in raw waters (method
detection limit, MDL = 0.008 mg⋅L-1). An Eco Physics CLD 88sp chemiluminescence NO
detector was used to quantify N-nitrosamines in purified samples, as detailed in Mitch and Dai.
(2012) TONO concentrations were determined using a five-point NDMA standard curve, which
was rerun after every four samples to account for sample mass recoveries. To prevent sample
carryover, blank spike samples were run between each sample. As untreated BL-RAW samples
had average TONO concentrations of 33 ng⋅L-1 as NDMA, just above the MDL of this procedure,
TONO was not measured for these CNT-treated samples.
2.2.3. CNT Characterization
CNT physical characteristics were measured rather than relying on manufacturer
specifications (Table S2). The pore volume distribution and Brunauer-Emmett-Teller (BET)
surface area of the CNTs were measured using a Quantachrome Nova 2200e Surface Area and
Pore Size Analyzer using N2 and CO2 gas adsorption at 77 K and 273 K, respectively.
Adsorption isotherms (Figure S1) were collected at partial pressures of 0.005-0.99 using step
sizes of 0.011-0.095. Pore volume distributions (Figure S2) were calculated from the isotherms
using a hybrid density functional theory model that assumed slit pore geometry for micropores
and slit or cylindrical pore geometry for mesopores (Zhu et al., 2011). The BET surface area
(SBET) was calculated using the N2 adsorption isotherm in the linear relative pressure range from
19
0.05-0.30. However, it should be noted that SBET is calculated without regard for the information
given about micropores by the CO2 adsorption isotherm. As such, SBET is more suitable for
comparing the amount of specific surface area individual CNT types have relative to each other,
rather than their absolute specific surface area (Zhu et al., 2011).
XPS measurements were performed on pristine CNTs using a PHI 5000 VersaProbe
spectrometer with an AlKα source, and a vacuum of 10-8 Torr was maintained during analysis.
Methods for the XPS data analysis are detailed in the SI and carbon spectra deconvolutions are
shown in Figure S3.
2.2.4. Data Modeling
To assess the impact of physicochemical CNT characteristics on DBP precursor
adsorption, a multivariate analysis was performed for the three groups of DBPs. DBPFP was
expressed as a ratio, as the median of each triplicate sample to the median of each untreated
sample – either BL-RAW or WS-EFF, as appropriate. The median was utilized, rather than the
mean, due to its relative insensitivity to outliers. The potential undue influence on the mean
caused by outliers in the data is exacerbated by small sample sizes (e.g., n=3) for a given CNT
type and dose. The following independent variables are associated with each group of DBPs:
DOC ratio, UV254 ratio, CNT dose, carbon-carbon bonds, alcohol groups, carbonyl groups,
carboxyl groups, SBET, and cumulative pore volume (CPV). A binary variable (called Water
Type) distinguishing between water types was also included in models of TTHM and DHAN
Ratio. A binary variable was deemed more appropriate than including water quality
characteristics as individual independent variables because these characteristics do not vary
among the samples of a given water type. This variable was only used for TTHM and DHAN
Ratio because TONO Ratio does not include samples of BL-RAW that were below the MDL.
20
DOC and UV254 ratio were calculated using procedures analogous to DBP ratio and were
incorporated into the numerical models to assess their usefulness as DBP precursor surrogates, as
opposed to the other independent variables related to CNT properties. An additional binary
variable distinguishing single- and multi-walled CNTs is explored in the SI. Analysis of variance
was used to study associations between DBP ratios and independent variables, or explanatory
factors; equivalent linear regression was used to test hypotheses about factor levels while
controlling for other factors. Models were estimated using STATA/IC 11.2 statistical software
(StataCorp, 2009) which leverages principles of applied regression analysis as detailed by Draper
and Smith (1998).
3. Results and Discussion
3.1. DBP Precursor Adsorption by CNTs
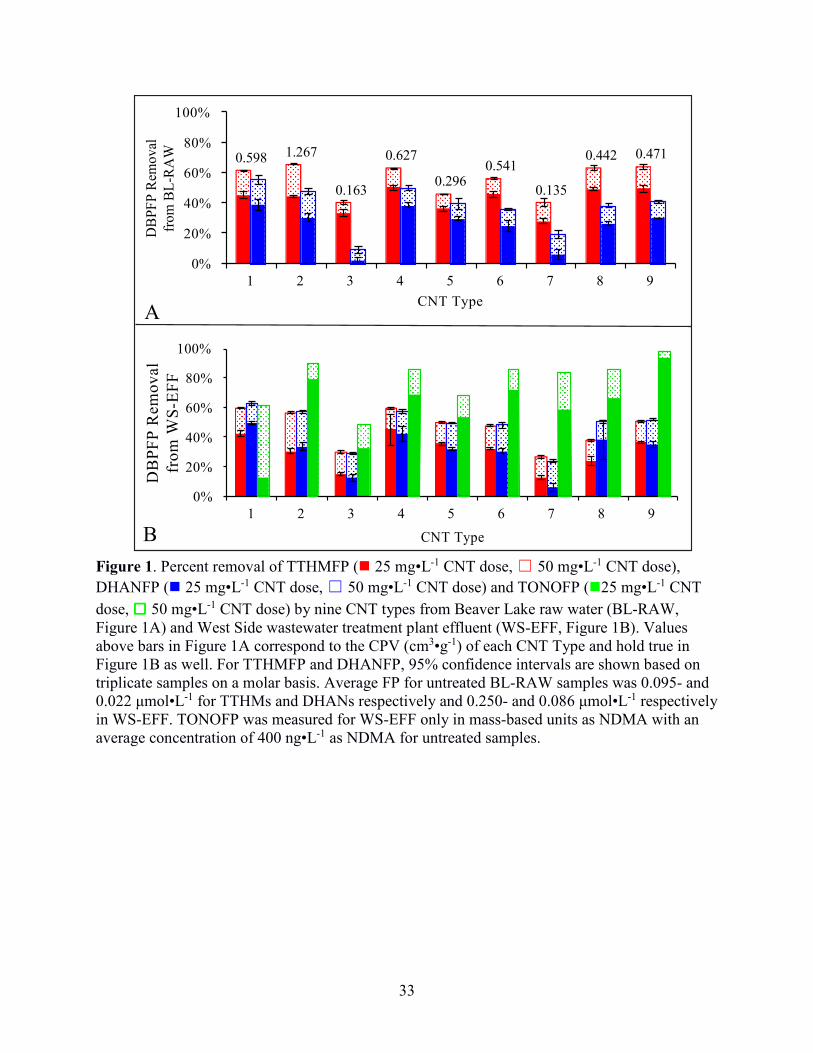
Figure 1 shows percent removals of TTHMFP and DHANFP from BL-RAW (Figure 1A)
and of TTHMFP, DHANFP, and TONOFP from WS-EFF (Figure 1B) attributed to each of the
nine CNT types. Removal of TONOFP is only provided for WS-EFF because the concentration
was below the MDL in BL-RAW. DBPFP removal is assumed to be due to adsorption of DBP
precursors by the CNTs. As expected, increasing the CNT dose from 25- to 50 mg⋅L-1 resulted in
an increase in percent removal for each DBP precursor for all nine CNT types. For TTHM
precursor removal, the CNT types assessed performed similarly or better on a percent basis than
the activated carbons used by Najm and colleagues (1991) and Iriarte-Velasco et al. (2008).
Additionally, Iriarte-Velasco and colleagues reported removal of DOC (a commonly used as a
TTHM precursor surrogate) as 27.6 and 2.2 mg DOC g-1 GAC for two types of GAC tested. In
comparison, the removal of DOC from BL-RAW ranged from 8.5-24.2 mg DOC g-1 CNT, while
the removal from WS-EFF was 11.4-57.1 mg DOC g-1 CNT, depending on the CNT type.
21
DHAN can be formed through two pathways utilizing different reactants, which include: (1) the
decarboxylation pathway, in which chloramine (and/or free chlorine) reacts with amine-
containing moieties of NOM and (2) the aldehyde pathway, where an aldehyde incorporates
chloramine-nitrogen (Shah and Mitch, 2012). For BL-RAW samples, the percent removals of
DHAN precursors were less than that of TTHM precursors for all nine CNT types; in contrast,
for WS-EFF samples, removal of DHAN precursors by CNT Types 1, 2, and 8 surpassed
removal of TTHM precursors. Though other precursors in natural waters may contribute to
DHANFP in an unknown degree, this relative difference in precursor removal between BL-RAW
and WS-EFF suggests the possibility either the amine- or aldehyde-based precursors are more
prevalent in WS-EFF and have a greater affinity for CNTs than the less abundant precursors.
Average percent removal of TONO precursors reached a maximum of 93% (Type 9) at a
CNT dose of 25 mg⋅L-1 and 97% at the higher CNT dose. Because of a lack of similar studies
involving CNTs and TONO precursors, direct comparisons to the literature are not possible.
However, using linear interpolation, we compared these results to Hanigan et al. (2012) who
quantified NDMA precursor adsorption in batch studies with activated carbon and found that 6
of the 9 CNT types achieved approximately the same or higher percent removals of TONO
precursors on a mass sorbent basis. It is important to note that NDMA may only comprise ~5%
of TONO formed following chloramination of wastewater effluent organic matter (Dai and
Mitch, 2013) and little is known about the physicochemical properties of TONO precursors
relative to NDMA precursors. Additionally, the average percent removal of TONO precursors at
the 50 mg⋅L-1 CNT dose was 31% greater than either TTHM or DHAN precursor removal.
Hydrophilic base fractions of organic matter are considered the most likely N-nitrosamine
precursors in DWTPs (Wang et al., 2013) and WWTP effluent (Pehlivanoglu-Mantas and Sedlak,
22
2008). Taken together, this may indicate that CNTs can sorb both hydrophobic and hydrophilic
NOM fractions from natural waters although additional testing is required to support such an
assertion. Regardless, the results in Figure 1B illustrate that many CNT types have high affinities
for TONO precursors, the underlying reasons for which are discussed further in Section 3.3.
3.2. CNT Characterization
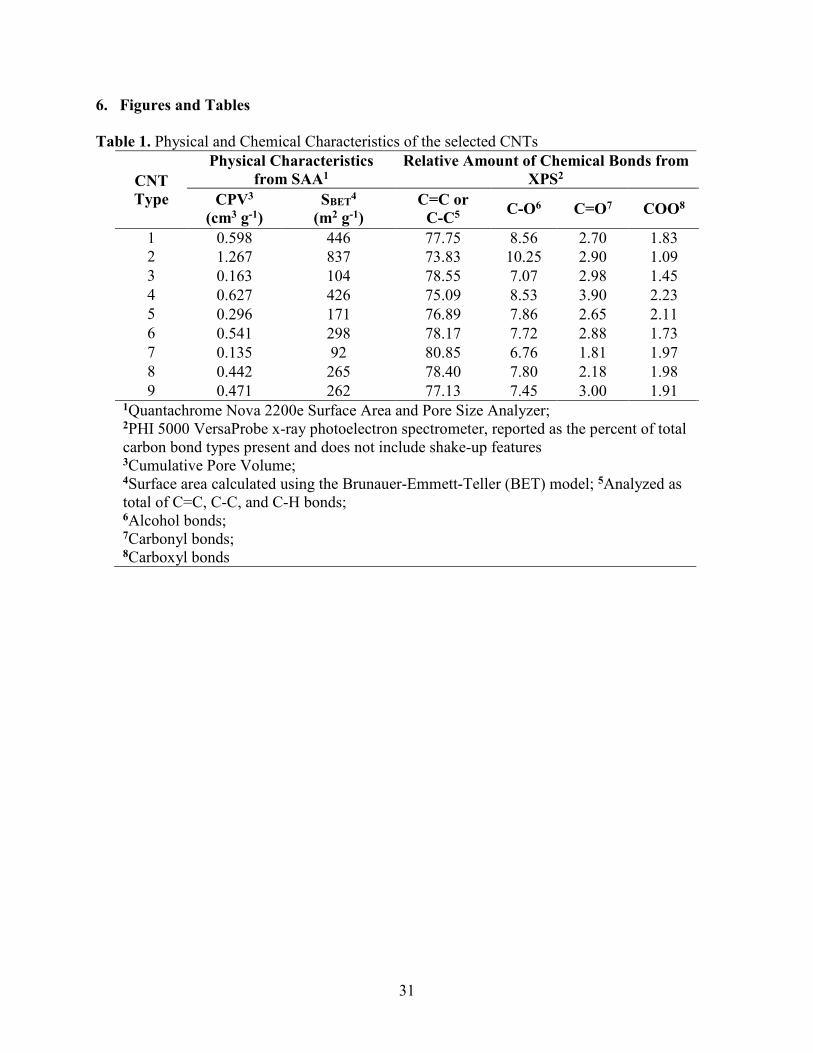
The physical and chemical characteristics of each CNT type are summarized in Table 1.
The shape of the gas adsorption isotherms (Figure S1) indicated the nitrogen adsorption
isotherms were IUPAC Type II and the carbon dioxide adsorption isotherms were Type I (Sing
et al., 1985; Zhang et al., 2010; Adeniran and Mokaya, 2015). CPV varied almost one order of
magnitude, from 0.135 cm3⋅g-1 (Type 7) to 1.267 cm3⋅g-1 (Type 2). The CPV measurements of all
CNT types fell within the range of values reported in the literature (0.104-2.46 cm3⋅g-1), which
vary based on CNT dimensions and the number of walls and are associated with both pristine
and modified CNTs (Zhang et al., 2010; Adeniran and Mokaya, 2015; Apul and Karanfil, 2015).
Pore volume distributions were bimodal (Figure S2), with microporosity assumed to be
associated with the interstitial space within CNT bundles and mesoporosity associated with the
space within individual tubes (Yang et al., 2005). SBET measurements (Table 1) were within 55%
of supplier specifications (Table S2) in all cases with the exception of Type 2, which was 106%
greater. In fact, SBET for Type 2 (837 m2⋅g-1) was higher than the range reported in the literature
for SWCNTs (22-662 m2⋅g-1) (Zhang et al., 2010; Birch et al., 2013). However, SBET can vary
based on CNT dimensions and the methods of synthesis and purification, and thus, values
outside the ranges reported in the literature are not unexpected. For all MWCNT types, SBET fell
within the range reported in the literature (58-653 m2⋅g-1) (Cho et al., 2008; Zhang et al., 2010;
Birch et al., 2013; Apul and Karanfil, 2015). Elemental composition data from deconvolution of
23
carbon spectra from XPS measurements (Figure S3) indicated that surface oxides (i.e., the sum
of C-O, C=O, and COO functional groups) comprised 11% (Type 7) to 14% (Type 2) of the
CNTs (Table 1), which falls into the range (6-32%) reported by others (Ago et al., 1999;
Komarova et al., 2015). In Section 3.3, we explore relationships between CNT properties and
DBP precursor adsorption.
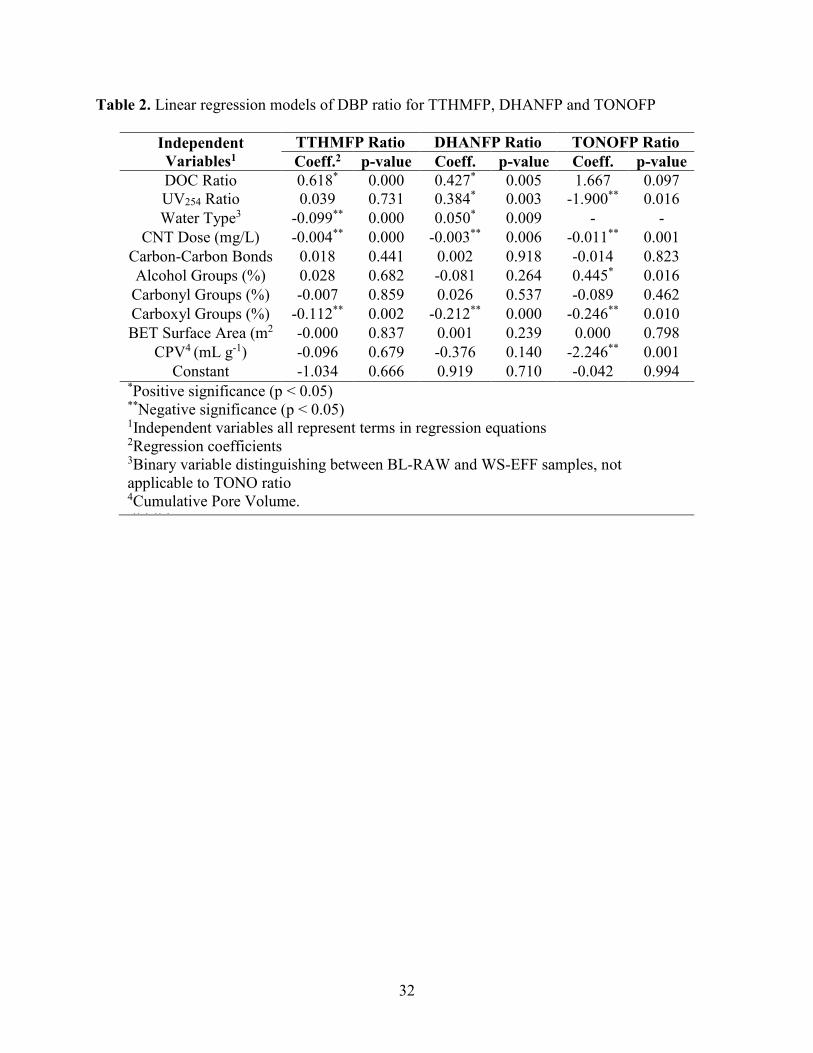
3.3. Impacts of Physicochemical CNT Properties on DBP Precursor Adsorption
Multivariate analysis for each DBP type yielded regression coefficients and p-values
(Table 2) for TTHM (n = 36), DHAN (n = 36) and TONO (n = 18). Coefficients with p < 0.05
are assumed to be nonzero and indicate a significant effect on DBP ratio (i.e., influent-
normalized effluent concentration), controlling for other variables in the model. Significance of
an independent variable in the negative direction indicates that an increase in the magnitude of
that variable resulted in a decrease in DBP ratio, otherwise stated as an increase in the removal of
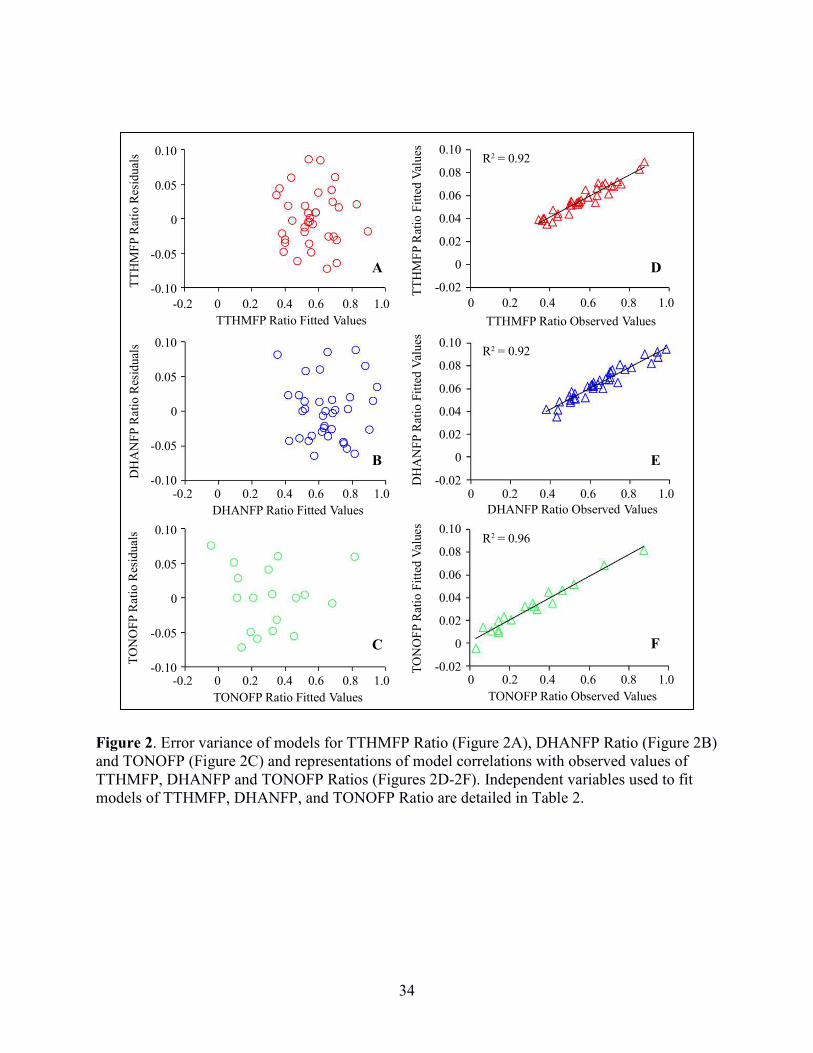
that DBP precursor by the nine CNT types. A scatterplot of residuals versus fitted values
suggested constant error variance (Figures 2A, B, and C). R-squared values indicated strong
correlations between fitted values and observed values of DBP ratio for TTHM (R2 = 0.92,
Figure 2D), DHAN (R2 = 0.92, Figure 2E) and TONO (R2 = 0.96, Figure 2F). In essence, the
model has no discernible bias to the magnitude of DBP ratio and at least 92% of the variation is
explained by the measured CNT properties.
The regression coefficients and p-values in Table 2 indicate several notable
trends. Opposing signs of significance for the Water Type binary variable for TTHM Ratio and
DHAN Ratio indicate that in comparing DBP precursor removal from the two waters, there was
greater removal of (1) TTHM precursors from BL-RAW and (2) DHAN precursors from WS-
EFF samples when controlling for all other variables in the model. Also, across all three DBP
24
groups, an increase in either CNT dose or the amount of carboxyl groups resulted in greater
removal of precursors. That CNT dose shows this trend only confirms the effect of these
particular dosages illustrated in Figure 1. However, the relationship between DBP ratio and the
percent of carboxyl groups is intriguing due to the significance of that variable across all DBP
groups and suggests that CNT surface chemistry is important for DBP precursor adsorption. For
TONO Ratio only, a positive correlation with the percent of alcohol functional groups indicates a
decrease in the amount of those surface oxides increased adsorption of TONO precursors.
Additionally, for TONO Ratio alone, there was a significant relationship with CPV, indicating
that an increase in CPV resulted in enhanced TONO precursor removal. Notably, true
relationships between DBP precursor removal and CNT surface chemistry would be obscured by
large errors in XPS carbon spectra deconvolution or any other independent variable. The risk of
accidentally or randomly observing a relationship that is untrue is kept low by the choice of
significance level (alpha = 0.05). Therefore, we have confidence in the importance of significant
chemical characteristics in the models.
Surface oxides are generally considered to inhibit sorption of NOM (i.e., DBP
precursors) to activated carbon due to repulsion caused by their negative surface charge (Karanfil
et al., 2007). However, the results of the multivariate model (Table 2) indicate that an increase in
carboxyl groups increases adsorption of all three groups of DBP precursors. Zhang et al. (2015)
postulated a link between chemical and physical CNT characteristics that may be relevant here:
repulsive forces created by negatively charged oxygen-containing functional groups enlarge
spaces between individual CNTs in bundles thereby increasing CPV and SBET. Additionally,
functional groups generally form at defect sites in the CNT walls which are also locations that
allow access inner microporosity or mesoporosity (depending on the inner diameter of the CNT)
25
(Yang et al., 2005). It has also been shown that the presence of surface oxides increases the
hydrophilicity of CNT surfaces, which could enhance the adsorption of hydrophilic DBP
precursors, such as those that react with chloramines to form N-nitrosamines (Zhang et al.,
2015). Additionally, amine-based groups serving as N-nitrosamine precursors are positively
charged at circumneutral pH. Thus, these groups would experience electrostatic attractions to the
negatively charged carboxylic acid functionalities on the CNTs, which may explain the high
removal of TONO precursors relative to TTHM and DHAN precursors. Hydrogen bonding may
also be an important adsorption mechanism, which would be consistent with our results, as
increases in oxygen groups will increase adsorption when hydrogen bonding is important (Pan
and Xing, 2008). However, application of CNTs in the water produces hydrophobic interactions
that could obscure the contribution of hydrogen bonding as an adsorption mechanism. The
multicollinearity of the physical and chemical properties indicates that both CPV and oxygen-
containing functional groups are important to CNT performance for DBP precursor removal.
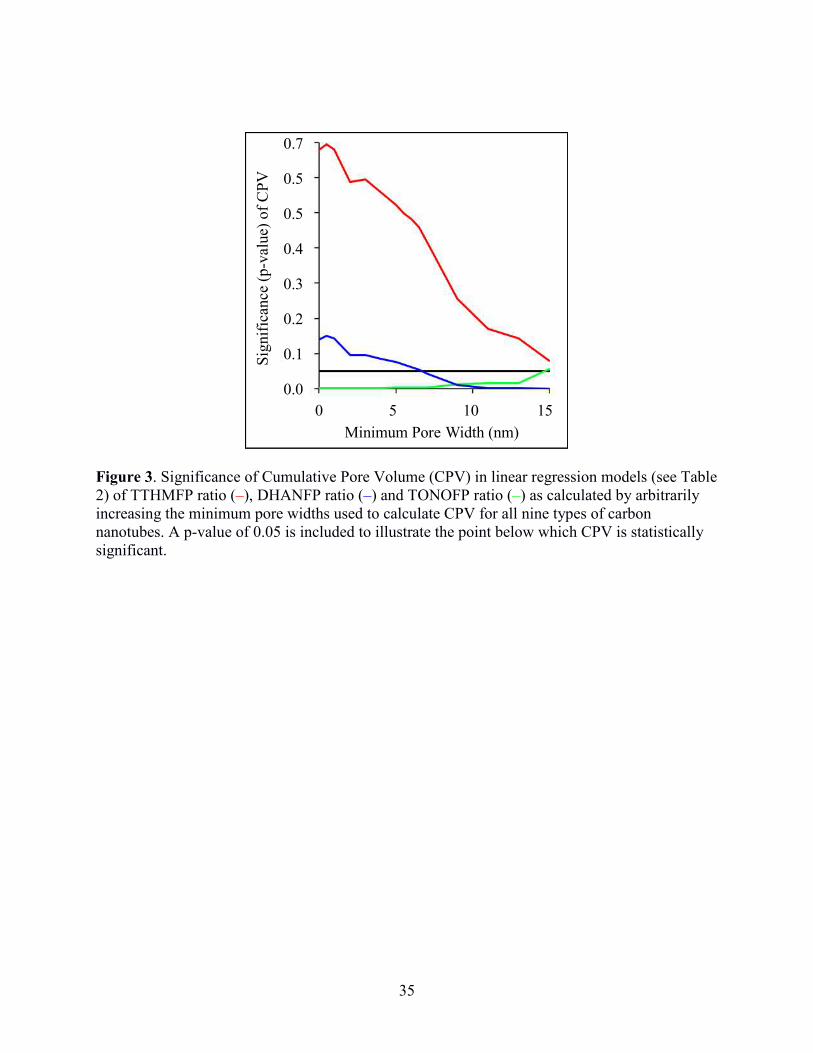
To explore the concept of DBP precursor size exclusion from the CNT pore networks,
linear regression models were refit for all DBP types by arbitrarily increasing minimum pore
widths used for the computation of pore volume while all other variables remained unchanged
(Figure 3). For TTHM, CPV p-values were large (p > 0.5) at low pore widths (< 5 nm) and only
came close to significance (p = 0.079) above 15 nm. For DHAN, CPV p-values decreased from
~0.15 and became significant (p = 0.05) near a minimum pore width of 7 nm and remained
significant throughout. For TONOFP, pore volume had a negative effect (i.e. more precursor
adsorption occurred as pore volume increased) and pore width had relatively little impact on the
importance of pore volume. On balance, the results in Figure 3 indicate that size exclusion
effects by the CNT pores could impact adsorption of TTHM and DHAN precursors, but not
26
TONO precursors. The trends in Figure 3 could indicate that TONO precursors are generally
smaller in size (or more accessible to the smaller CNT pores) than TTHM and DHAN precursors.
At smaller pore widths, TONO precursors may not have much competition for adsorption sites;
as pore width increases toward pores in excess of 15 nm, larger and more abundant TTHM and
DHAN precursors could utilize a greater portion of the adsorption capacity. Others have shown
that larger molecules at relatively high concentrations (such as TTHM precursors) can block
CNT pores and limit further adsorption, while small molecules at trace concentrations (such as
TONO precursors) experience little competition for adsorption sites (Hanigan et al., 2015).
3.4. Fluorescence Metrics as DBP Precursor Surrogates
Fluorescence EEMs were measured on untreated and CNT-treated (but not
chloraminated) waters to evaluate its usefulness as a precursor surrogate and perhaps limit time-
consuming DBPFP analyses in upcoming studies. Fluorescence intensities at all wavelength pairs
measured were regressed against the DBP data to identify pairs for which strong correlations
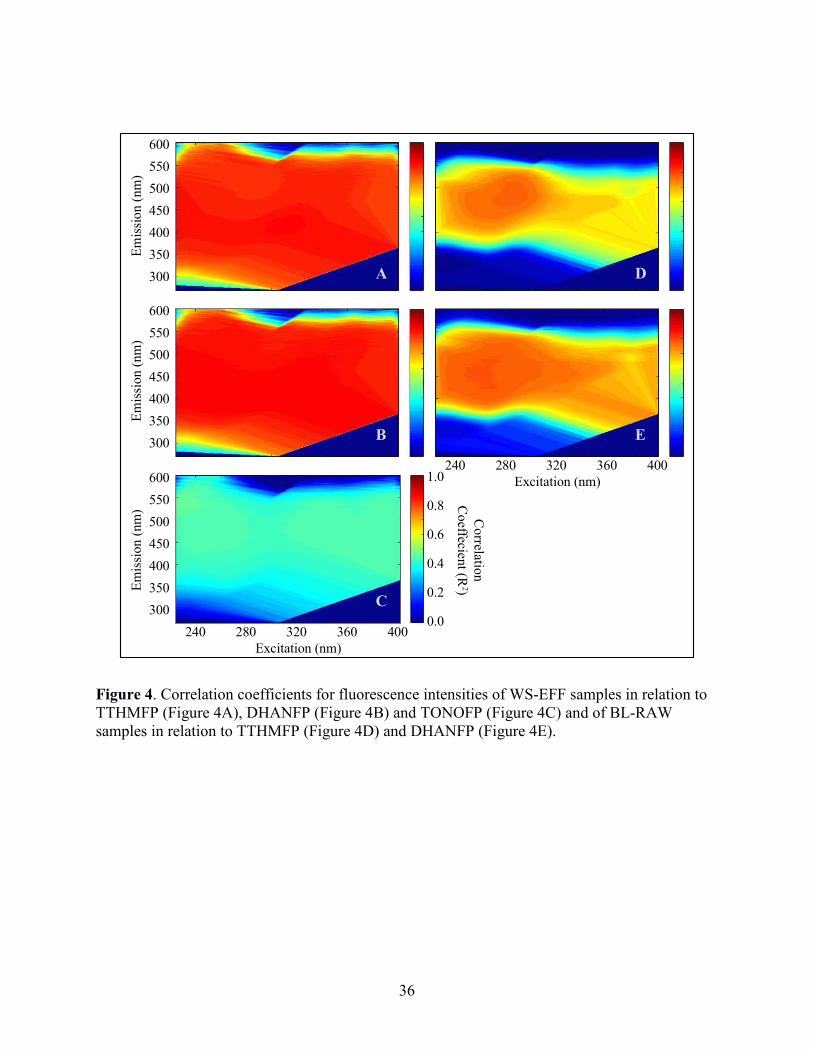
exist. Figure 4 shows the correlation coefficients presented on axes equivalent to the EEMs for
TTHMFP (Panel A, RMAX2 = 0.86), DHANFP (Panel B, RMAX
2 = 0.88), and TONOFP (Panel C,
RMAX2 = 0.50) in WS-EFF, and TTHMFP (Panel D, RMAX
2 = 0.78) and DHANFP (Panel E,
RMAX2 = 0.80) in BL-RAW. These correlations represent relationships between DBP precursors
remaining after treatment with CNTs and DBP concentrations formed following FP tests,
performed using a recently developed method (Do et al., 2015). As expected, correlations are
strong for TTHMFP and DHANFP in both waters. However, the moderate correlation
coefficients for TONOFP indicate that fluorescence is unlikely to be a suitable precursor
surrogate for total N-nitrosamine precursor concentrations when applied in this manner.
Interestingly, samples from WS-EFF (Figures 4A, 4B, and 4C) show a large region of
27
wavelength pairs that give high correlation coefficients. In contrast, high RMAX2 values for BL-
RAW (Figures 4D and 4E) are more localized and are centered near I275/480. The insensitivity in
R2 values shown in Figures 4A, 4B, and 4C was unexpected in light of several studies attributing
the various regions of EEMs to distinct fluorophore groups (i.e., humic-, fulvic-, tryptophan-,
and tyrosine-like), each with its unique chemistry (Hudson et al., 2007). The results presented in
Figure 4 suggest strong relationships among virtually all wavelength pairs, and thus imply
interdependence (i.e. an increase in a particular fluorophore group could impact other regions of
the EEM). Fluorescence EEMs were also analyzed by PARAFAC analysis. A detailed discussion
of the removal of the PARAFAC components by the CNTs and correlations between PARAFAC
components (Table S5) is provided in the SI. This analysis advances our assertion of fluorophore
interdependence, which prevents valid conclusions regarding the affinity of CNTs for discrete
humic-, fulvic- and protein-like fluorophores. The interdependence observed in both EEM
correlations and PARAFAC components may be indicative of interferences on the protein-like
fluorophores and preclude the use of fluorescence EEMs alone as a surrogate for TONO
precursors. However, the nature of these precursors suggests that fluorescence may be utilized
following elimination of interfering humics (Wang et al., 2015), in applications such as
asymmetric flow field-flow fractionation where proteins can be physically separated from
humics prior to fluorescence measurements.
3.5. Implications
Based on the importance of surface oxides and CPV for DBP precursor removal, future
studies are needed to enhance these CNT characteristics and test their impact in sorption systems.
Oxidative treatment with a mixture of nitric and sulfuric acid has been shown to result in
formation of oxygen-containing groups on SWCNTs (Balasubramanian and Burghard, 2005;
28
Komarova et al., 2015) and MWCNTs (Ago et al., 1999). Additionally, KOH treatment can
increase surface area and pore volume, specifically in mesopores (Niu et al., 2007). Based on the
size exclusion results (Figure 3), this may be particularly important to improve sorption of
DHAN and TTHM precursors. Furthermore, future studies of CNT modification should be
paired with a reliable system for CNT integration into DWTP treatment processes. A large range
of possibilities now exists regarding design of freeform CNT microstructures grown on
substrates that could be adapted into current treatment processes. These microstructures can be
grown to exacting specifications of size, shape, and porosity, and conformal coating can be
applied to manipulate chemical properties (De Volder et al., 2014). Additionally, incorporation
of CNTs into hollow fiber membranes has been shown to increase membrane flux, fouling
resistance, thermal stability, porosity, and electrochemically regenerative capability with
minimal CNT leaching (Huang et al., 2014; Wei et al., 2014; Jafari et al., 2015).
4. Conclusions
With no modification, CNTs have natural affinity for THM-, DHAN, and TONO
precursors. The breadth of applications discovered for CNTs due to their unique set of
physiochemical properties speak to their potential for further commercial availability. Though
CNTs are a novel sorbent with higher costs than standard sorbents, higher performance levels –
particularly with regard to TONO precursor adsorption – give CNTs an advantage that warrants
future study. As production costs decrease and the body of research regarding their applications
increases, CNTs gain potential for feasibility of application in conventional water treatment
systems. Manipulation of physicochemical properties to enhance DBP precursor adsorption in
concert with reliable methods of integration into water treatment processes could provide
DWTPs with a new technique for meeting the increasingly rigorous water quality standards for

29
DBP control.
30
5. Associated Content
Notes
The authors declare no competing financial interests.
Acknowledgements
Financial support from the National Science Foundation (CBET #1254350 to JLF) and the
University of Arkansas Doctoral Academy Fellowship (to EMN) is gratefully acknowledged.
The authors thank Thien Do and Huong Pham (PhD students, University of Arkansas) and two
anonymous reviewers for their constructive comments on previous versions of this manuscript.
31
6. Figures and Tables
Table 1. Physical and Chemical Characteristics of the selected CNTs
CNT
Type
Physical Characteristics
from SAA1
Relative Amount of Chemical Bonds from
XPS2
CPV3
(cm3 g-1)
SBET4
(m2 g-1)
C=C or
C-C5 C-O6 C=O7 COO8
1 0.598 446 77.75 8.56 2.70 1.83 2 1.267 837 73.83 10.25 2.90 1.09
3 0.163 104 78.55 7.07 2.98 1.45
4 0.627 426 75.09 8.53 3.90 2.23
5 0.296 171 76.89 7.86 2.65 2.11
6 0.541 298 78.17 7.72 2.88 1.73
7 0.135 92 80.85 6.76 1.81 1.97
8 0.442 265 78.40 7.80 2.18 1.98
9 0.471 262 77.13 7.45 3.00 1.91 1Quantachrome Nova 2200e Surface Area and Pore Size Analyzer; 2PHI 5000 VersaProbe x-ray photoelectron spectrometer, reported as the percent of total carbon bond types present and does not include shake-up features 3Cumulative Pore Volume; 4Surface area calculated using the Brunauer-Emmett-Teller (BET) model; 5Analyzed as total of C=C, C-C, and C-H bonds; 6Alcohol bonds; 7Carbonyl bonds; 8Carboxyl bonds
32
Table 2. Linear regression models of DBP ratio for TTHMFP, DHANFP and TONOFP
Independent
Variables1
TTHMFP Ratio DHANFP Ratio TONOFP Ratio
Coeff.2 p-value Coeff. p-value Coeff. p-value
DOC Ratio 0.618* 0.000 0.427* 0.005 1.667 0.097 UV254 Ratio 0.039 0.731 0.384* 0.003 -1.900** 0.016
Water Type3 -0.099** 0.000 0.050* 0.009 - -
CNT Dose (mg/L) -0.004** 0.000 -0.003** 0.006 -0.011** 0.001
Carbon-Carbon Bonds 0.018 0.441 0.002 0.918 -0.014 0.823
Alcohol Groups (%) 0.028 0.682 -0.081 0.264 0.445* 0.016
Carbonyl Groups (%) -0.007 0.859 0.026 0.537 -0.089 0.462
Carboxyl Groups (%) -0.112** 0.002 -0.212** 0.000 -0.246** 0.010
BET Surface Area (m2 -0.000 0.837 0.001 0.239 0.000 0.798
CPV4 (mL g-1) -0.096 0.679 -0.376 0.140 -2.246** 0.001
Constant -1.034 0.666 0.919 0.710 -0.042 0.994 *Positive significance (p < 0.05) **Negative significance (p < 0.05) 1Independent variables all represent terms in regression equations 2Regression coefficients 3Binary variable distinguishing between BL-RAW and WS-EFF samples, not applicable to TONO ratio 4Cumulative Pore Volume. ;lkj;lkj
33
Figure 1. Percent removal of TTHMFP (� 25 mg•L-1 CNT dose, ☐ 50 mg•L-1 CNT dose),
DHANFP (� 25 mg•L-1 CNT dose, ☐ 50 mg•L-1 CNT dose) and TONOFP (�25 mg•L-1 CNT
dose, ☐☐☐☐ 50 mg•L-1 CNT dose) by nine CNT types from Beaver Lake raw water (BL-RAW, Figure 1A) and West Side wastewater treatment plant effluent (WS-EFF, Figure 1B). Values above bars in Figure 1A correspond to the CPV (cm3•g-1) of each CNT Type and hold true in Figure 1B as well. For TTHMFP and DHANFP, 95% confidence intervals are shown based on triplicate samples on a molar basis. Average FP for untreated BL-RAW samples was 0.095- and 0.022 μmol•L-1 for TTHMs and DHANs respectively and 0.250- and 0.086 μmol•L-1 respectively in WS-EFF. TONOFP was measured for WS-EFF only in mass-based units as NDMA with an average concentration of 400 ng•L-1 as NDMA for untreated samples.
0%
20%
40%
60%
80%
100%
1 2 3 4 5 6 7 8 9
DB
PF
P R
em
ov
al
fro
m W
S-E
FF
CNT Type
0%
20%
40%
60%
80%
100%
1 2 3 4 5 6 7 8 9
DB
PF
P R
emo
val
fro
m B
L-R
AW
CNT TypeA
B
0.598 1.267
0.163
0.627
0.2960.541
0.135
0.442 0.471
34
Figure 2. Error variance of models for TTHMFP Ratio (Figure 2A), DHANFP Ratio (Figure 2B) and TONOFP (Figure 2C) and representations of model correlations with observed values of TTHMFP, DHANFP and TONOFP Ratios (Figures 2D-2F). Independent variables used to fit models of TTHMFP, DHANFP, and TONOFP Ratio are detailed in Table 2.
-0.2 0 0.2 0.4 0.6 0.8 1.0
0.10
0.05
0
-0.05
-0.10
0 0.2 0.4 0.6 0.8 1.0
0.10
0.08
0.06
0.04
0.02
0
-0.02TT
HM
FP
Rat
io R
esid
ual
s
TTHMFP Ratio Fitted Values TTHMFP Ratio Observed Values
TT
HM
FP
Rat
io F
itte
d V
alues
A
R2 = 0.92
R2 = 0.92
R2 = 0.96
B
C
D
E
F
0.10
0.05
0
-0.05
-0.10
0.10
0.05
0
-0.05
-0.10
0.10
0.08
0.06
0.04
0.02
0
-0.02
0.10
0.08
0.06
0.04
0.02
0
-0.02
DHANFP Ratio Fitted Values
TONOFP Ratio Fitted Values
DH
AN
FP
Rat
io R
esid
ual
sT
ON
OF
P R
atio
Res
idual
s
DH
AN
FP
Rat
io F
itte
d V
alues
TO
NO
FP
Rat
io F
itte
d V
alues
DHANFP Ratio Observed Values
TONOFP Ratio Observed Values
0 0.2 0.4 0.6 0.8 1.0
0 0.2 0.4 0.6 0.8 1.0
-0.2 0 0.2 0.4 0.6 0.8 1.0
-0.2 0 0.2 0.4 0.6 0.8 1.0
35
Figure 3. Significance of Cumulative Pore Volume (CPV) in linear regression models (see Table 2) of TTHMFP ratio (–), DHANFP ratio (–) and TONOFP ratio (–) as calculated by arbitrarily increasing the minimum pore widths used to calculate CPV for all nine types of carbon nanotubes. A p-value of 0.05 is included to illustrate the point below which CPV is statistically significant.
Minimum Pore Width (nm)
Sig
nif
ican
ce (
p-v
alu
e) o
f C
PV
0 5 10 15
0.7
0.5
0.5
0.4
0.3
0.2
0.1
0.0
36
Figure 4. Correlation coefficients for fluorescence intensities of WS-EFF samples in relation to TTHMFP (Figure 4A), DHANFP (Figure 4B) and TONOFP (Figure 4C) and of BL-RAW samples in relation to TTHMFP (Figure 4D) and DHANFP (Figure 4E).
600
550
500
450
400
350
300
240 280 320 360 400
1.0
0.8
0.6
0.4
0.2
0.0
Excitation (nm)
Em
issi
on (
nm
) Correlatio
n
Co
effecient (R
2)
A D
B E
C
600
550
500
450
400
350
300
600
550
500
450
400
350
300
240 280 320 360 400
Em
issi
on (
nm
)E
mis
sio
n (
nm
)
Excitation (nm)
37
7. References
Adeniran, B. and Mokaya, R., 2015. Low temperature synthesized carbon nanotube superstructures with superior CO2 and hydrogen storage capacity. Journal of Materials Chemistry A 3 (9), 5148-5161.
Ago, H., Kugler, T., Cacialli, F., Salaneck, W. R., Shaffer, M. S. P., Windle, A. H. and Friend, R. H., 1999. Work functions and surface functional groups of multiwall carbon nanotubes. Journal of Physical Chemistry B 103 (38), 8116-8121.
Andersen, C. M. and Bro, R., 2003. Practical aspects of PARAFAC modeling of fluorescence excitation-emission data. Journal of Chemometrics 17 (4), 200-215.
Apul, O. G. and Karanfil, T., 2015. Adsorption of synthetic organic contaminants by carbon nanotubes: A critical review. Water Research 68, 34-55.
Balasubramanian, K. and Burghard, M., 2005. Chemically functionalized carbon nanotubes. Small 1 (2), 180-192.
Birch, M. E., Ruda-Eberenz, T. A., Chai, M., Andrews, R. and Hatfield, R. L., 2013. Properties that influence the specific surface areas of carbon nanotubes and nanofibers. Annals of Occupational Hygiene 57 (9), 1148-1166.
Cho, H.-H., Smith, B. A., Wnuk, J. D., Fairbrother, D. H. and Ball, W. P., 2008. Influence of surface oxides on the adsorption of naphthalene onto multiwalled carbon nanotubes. Environmental Science & Technology 42 (8), 2899-2905.
Cory, R. M., Miller, M. P., McKnight, D. M., Guerard, J. J. and Miller, P. L., 2010. Effect of instrument-specific response on the analysis of fulvic acid fluorescence spectra. Limnology and Oceanography-Methods 8, 67-78.
Dai, N. and Mitch, W. A., 2013. Relative importance of N-nitrosodimethylamine compared to total N-nitrosamines in drinking waters. Environmental Science & Technology 47 (8), 3648-3656.
Dai, N., Shah, A. D., Hu, L. H., Plewa, M. J., McKague, B. and Mitch, W. A., 2012. Measurement of Nitrosamine and Nitramine Formation from NO Reactions with Amines during Amine-Based Carbon Dioxide Capture for Postcombustion Carbon Sequestration. Environmental Science & Technology 46 (17), 9793-9801.
38
Das, R., Hamid, S. B. A., Ali, M. E., Ismail, A. F., Annuar, M. S. M. and Ramakrishna, S., 2014. Multifunctional carbon nanotubes in water treatment: The present, past and future. Desalination 354, 160-179.
De Volder, M., Park, S., Tawfick, S. and Hart, A. J., 2014. Strain-engineered manufacturing of freeform carbon nanotube microstructures. Nature Communications 5.
Devore, J. L., 2004. Probability and statistics for engineering and the sciences, 6, Brooks/Cole, Thomson Learning, Belmont, CA.
Do, T. D., Chimka, J. R. and Fairey, J. L., 2015. Improved (and singular) disinfectant protocol for indirectly assessing organic precursor concentrations of trihalomethanes and dihaloacetonitriles. Environmental Science & Technology 49 (16), 9858-9865.
Draper, N. R. and Smith, H., 1998. Applied regression analysis, John Wiley & Sons, Inc., New York.
Eaton, A. D., Clesceri, L.S., Rice, E.W., Greenberg, A.E. (Eds.) (2005). Standard methods for the examination of water & wastewater, American Public Health Association, Washington, DC.
Hanigan, D., Zhang, J., Herckes, P., Krasner, S. W., Chen, C. and Westerhoff, P., 2012. Adsorption of N-nitrosodimethylamine precursors by powdered and granular activated carbon. Environmental Science & Technology 46 (22), 12630-12639.
Hanigan, D., Zhang, J., Herckes, P., Zhu, E., Krasner, S. and Westerhoff, P., 2015. Contribution and removal of watershed and cationic polymer N-nitrosodimethylamine precursors. Journal American Water Works Association 107 (3), 90-91.
Hrudey, S. E. and Charrois, J. W. A., Eds. (2012). Disinfection by-products and human health. IWA Publishing and Australian Water Association, London.
Huang, H., Fairbrother, H., Teychene, B., Ajmani, G., Chalew, T. A., Gallagher, M. J., Cho, H., Schwab, K. and Jacangelo, J., 2014. Carbon nanotube composite membranes for small 'designer' water treatment systems. Water Science and Technology-Water Supply 14 (5), 917-923.
39
Hudson, N., Baker, A. and Reynolds, D., 2007. Fluorescence analysis of dissolved organic matter in natural, waste and polluted waters - A review. River Research and Applications 23 (6), 631-649.
Iriarte-Velasco, U., Alvarez-Uriarte, J. I., Chimeno-Alanis, N. and Gonzalez-Velasco, J. R., 2008. Natural Organic Matter Adsorption onto Granular Activated Carbons: Implications in the Molecular Weight and Disinfection Byproducts Formation. Industrial & Engineering Chemistry Research 47 (20), 7868-7876.
Jafari, A., Mahvi, A. H., Nasseri, S., Rashidi, A., Nabizadeh, R. and Rezaee, R., 2015. Ultrafiltration of natural organic matter from water by vertically aligned carbon nanotube membrane. Journal of Environmental Health Science and Engineering 13, 51.
Karanfil, T., Cheng, W., Dastgheib, S., Guo, Y. and Song, H., 2007. DBP formation control by modified activated carbons, Awwa Research Foundation Denver, CO.
Karanfil, T., Erdogan, I. and Schlautman, M. A., 2003. Selecting filter membranes for measuring DOC and UV254. Journal American Water Works Association 95 (3), 86-100.
Komarova, N. y. S., Krivenko, A. G., Ryabenko, A. G., Naumkin, A. V., Maslakov, K. I. and Savilov, S. V., 2015. Functionalization and defunctionalization of single walled carbon nanotubes: Electrochemical and morphologic consequences. Journal of Electroanalytical Chemistry 738, 27-34.
Kovtyukhova, N. I., Mallouk, T. E., Pan, L. and Dickey, E. C., 2003. Individual single-walled nanotubes and hydrogels made by oxidative exfoliation of carbon nanotube ropes. Journal of the American Chemical Society 125 (32), 9761-9769.
Krasner, S. W., Mitch, W. A., McCurry, D. L., Hanigan, D. and Westerhoff, P., 2013. Formation, precursors, control, and occurrence of nitrosamines in drinking water: A review. Water Research 47 (13), 4433-4450.
Krasner, S. W., Weinberg, H. S., Richardson, S. D., Pastor, S. J., Chinn, R., Sclimenti, M. J., Onstad, G. D. and Thruston, A. D., 2006. Occurrence of a new generation of disinfection byproducts. Environmental Science & Technology 40 (23), 7175-7185.
Kristiana, I., Lethorn, A., Joll, C. and Heitz, A., 2014. To add or not to add: The use of quenching agents for the analysis of disinfection by-products in water samples. Water Research 59, 90-98.
40
Kulshrestha, P., McKinstry, K. C., Fernandez, B. O., Feelisch, M. and Mitch, W. A., 2010. Application of an optimized total N-nitrosamine (TONO) assay to pools: placing N-nitrosodimethylamine (NDMA) determinations into perspective. Environmental Science & Technology 44 (9), 3369-3375.
Kundu, S., Xia, W., Busser, W., Becker, M., Schmidt, D. A., Havenith, M. and Muhler, M., 2010. The formation of nitrogen-containing functional groups on carbon nanotube surfaces: a quantitative XPS and TPD study. Physical Chemistry Chemical Physics 12 (17), 4351-4359.
Liao, X. B., Wang, C. K., Wang, J., Zhang, X. J., Chen, C., Krasner, S. W. and Suffet, I. H., 2014. Nitrosamine precursor and DOM control in effluent-affected drinking water. Journal American Water Works Association 106 (7), 81-82.
Liu, Y., Zhao, Y., Sun, B. and Chen, C., 2013. Understanding the toxicity of carbon nanotubes. Accounts of Chemical Research 46 (3), 702-713.
Lu, C. Y. and Su, F. S., 2007. Adsorption of natural organic matter by carbon nanotubes. Separation and Purification Technology 58 (1), 113-121.
Mayer, L. M., Schick, L. L. and Loder, T. C., 1999. Dissolved protein fluorescence in two Maine estuaries. Marine Chemistry 64 (3), 171-179.
McKnight, D. M., Boyer, E. W., Westerhoff, P. K., Doran, P. T., Kulbe, T. and Andersen, D. T., 2001. Spectrofluorometric characterization of dissolved organic matter for indication of precursor organic material and aromaticity. Limnology and Oceanography 46 (1), 38-48.
McPhail, M. R., Sells, J. A., He, Z. and Chusuei, C. C., 2009. Charging nanowalls: adjusting the carbon nanotube isoelectric point via surface functionalization. Journal of Physical Chemistry C 113 (32), 14102-14109.
Mitch, W. A. and Dai, N. (2012). Water Research Foundation Report #4209: Development and application of a total nitrosamine assay for disinfected waters, Water Research Foundation.
Najm, I. N., Snoeyink, V. L., Lykins, B. W. and Adams, J. Q., 1991. USING POWDERED ACTIVATED CARBON - A CRITICAL-REVIEW. Journal American Water Works Association 83 (1), 65-76.
41
Niu, J. J., Wang, J. N., Jiang, Y., Su, L. F. and Ma, J., 2007. An approach to carbon nanotubes with high surface area and large pore volume. Microporous and Mesoporous Materials 100 (1-3), 1-5.
Okpalugo, T. I. T., Papakonstantinou, P., Murphy, H., McLaughlin, J. and Brown, N. M. D., 2005. High resolution XPS characterization of chemical functionalised MWCNTs and SWCNTs. Carbon 43 (1), 153-161.
Pan, B. and Xing, B., 2008. Adsorption mechanisms of organic chemicals on carbon nanotubes. Environmental Science & Technology 42 (24), 9005-9013.
Pehlivanoglu-Mantas, E. and Sedlak, D. L., 2008. Measurement of dissolved organic nitrogen forms in wastewater effluents: Concentrations, size distribution and NDMA formation potential. Water Research 42 (14), 3890-3898.
Pifer, A. D. and Fairey, J. L., 2012. Improving on SUVA254 using fluorescence-PARAFAC analysis and asymmetric flow-field flow fractionation for assessing disinfection byproduct formation and control. Water Research 46 (9), 2927-2936.
Pifer, A. D. and Fairey, J. L., 2014. Suitability of organic matter surrogates to predict trihalomethane formation in drinking water sources. Environmental Engineering Science 31 (3), 117-126.
Ramanathan, T., Fisher, F. T., Ruoff, R. S. and Brinson, L. C., 2005. Amino-functionalized carbon nanotubes for binding to polymers and biological systems. Chemistry of Materials 17 (6), 1290-1295.
Ren, X., Chen, C., Nagatsu, M. and Wang, X., 2011. Carbon nanotubes as adsorbents in environmental pollution management: A review. Chemical Engineering Journal 170 (2-3), 395-410.
Rook, J. J., 1976. Haloforms in drinking water. Journal American Water Works Association 68 (3), 168-172.
Russell, C. G., Blute, N. K., Via, S., Wu, X. and Chowdhury, Z., 2012. National assessment of nitrosamine occurrence and trends. Journal American Water Works Association 104 (3), E205-E217.
42
Sen, S., Haggard, B. E., Chaubey, I., Brye, K. R., Costello, T. A. and Matlock, M. D., 2007. Sediment phosphorus release at Beaver Reservoir, Northwest Arkansas, USA, 2002-2003: A preliminary investigation. Water, Air and Soil Pollution 179 (1-4), 67-77.
Shah, A. D. and Mitch, W. A., 2012. Halonitroalkanes, Halonitriles, Haloamides, and N-Nitrosamines: A Critical Review of Nitrogenous Disinfection Byproduct Formation Pathways. Environmental Science & Technology 46 (1), 119-131.
Shapiro, S. S. and Wilk, M. B., 1965. An analysis of variance test for normality (complete samples). Biometrika 52, 591-611.
Shih, Y.-h. and Li, M.-S., 2008. Adsorption of selected volatile organic vapors on multiwall carbon nanotubes. Journal of Hazardous Materials 154 (1-3), 21-28.
Sing, K. S. W., Everett, D. H., Haul, R. A. W., Moscou, L., Pierotti, R. A., Rouquerol, J. and Siemieniewska, T., 1985. Reporting physisorption data for gas solid systems with special reference to the determination of surface area and porosity (recommendations 1984). Pure and Applied Chemistry 57 (4), 603-619.
Singh, B., Fang, Y., Cowie, B. C. C. and Thomsen, L., 2014. NEXAFS and XPS characterisation of carbon functional groups of fresh and aged biochars. Organic Geochemistry 77, 1-10.
StataCorp (2009). Stata statistical software: release 11. College Station, TX, StataCorp LP.
Stedmon, C. A. and Bro, R., 2008. Characterizing dissolved organic matter fluorescence with parallel factor analysis: a tutorial. Limnology and Oceanography-Methods 6, 572-579.
Tawfick, S., De Volder, M., Copic, D., Park, S. J., Oliver, C. R., Polsen, E. S., Roberts, M. J. and Hart, A. J., 2012. Engineering of micro- and nanostructured surfaces with anisotropic geometries and properties. Advanced Materials 24 (13), 1628-1674.
Upadhyayula, V. K. K., Deng, S., Mitchell, M. C. and Smith, G. B., 2009. Application of carbon nanotube technology for removal of contaminants in drinking water: A review. Science of the Total Environment 408 (1), 1-13.
Wang, C. K., Zhang, X. J., Wang, J., Liu, S. M., Chen, C. and Xie, Y. F., 2013. Effects of organic fractions on the formation and control of N-nitrosamine precursors during conventional drinking water treatment processes. Science of the Total Environment 449, 295-301.
43
Wang, H., Zhou, A., Peng, F., Yu, H. and Yang, J., 2007. Mechanism study on adsorption of acidified multiwalled carbon nanotubes to Pb(II). Journal of Colloid and Interface Science 316 (2), 277-283.
Wang, X., Tao, S. and Xing, B., 2009. Sorption and competition of aromatic compounds and humic acid on multiwalled carbon nanotubes. Environmental Science & Technology 43 (16), 6214-6219.
Wang, Z. G., Cao, J. and Meng, F. G., 2015. Interactions between protein-like and humic-like components in dissolved organic matter revealed by fluorescence quenching. Water Research 68, 404-413.
Wei, G., Yu, H., Quan, X., Chen, S., Zhao, H. and Fan, X., 2014. Constructing all carbon nanotube hollow fiber membranes with improved performance in separation and antifouling for water treatment. Environmental Science & Technology 48 (14), 8062-8068.
Yan Yan, H. and Terentjev, E. M., 2012. Dispersion of carbon nanotubes: mixing, sonication, stabilization, and composite properties. Polymers 4 (1), 275-95.
Yang, C. M., Kim, D. Y. and Lee, Y. H., 2005. Single-walled carbon nanotube network with bimodal pore structures of uniform microporosity and mesoporosity. Journal of Nanoscience and Nanotechnology 5 (6), 970-974.
Yang, K. and Xing, B., 2009. Adsorption of fulvic acid by carbon nanotubes from water. Environmental Pollution 157 (4), 1095-1100.
Zepp, R. G., Sheldon, W. M. and Moran, M. A., 2004. Dissolved organic fluorophores in southeastern US coastal waters: correction method for eliminating Rayleigh and Raman scattering peaks in excitation-emission matrices. Marine Chemistry 89 (1-4), 15-36.
Zhang, S., Shao, T., Kose, H. S. and Karanfil, T., 2010. Adsorption of aromatic compounds by carbonaceous adsorbents: a comparative study on granular activated carbon, activated carbon fiber, and carbon nanotubes. Environmental Science & Technology 44 (16), 6377-6383.
Zhang, Y., Chen, C., Peng, L., Ma, Z., Zhang, Y., Xia, H., Yang, A., Wang, L., Su, D. S. and Zhang, J., 2015. Carboxyl groups trigger the activity of carbon nanotube catalysts for the oxygen reduction reaction and agar conversion. Nano Research 8 (2), 502-511.
44
Zhang, Z., Pfefferle, L. and Haller, G. L., 2014. Comparing characterization of functionalized multi-walled carbon nanotubes by potentiometric proton titration, NEXAFS, and XPS. Chinese Journal of Catalysis 35 (6), 856-863.
Zhu, Y. W., Murali, S., Stoller, M. D., Ganesh, K. J., Cai, W. W., Ferreira, P. J., Pirkle, A., Wallace, R. M., Cychosz, K. A., Thommes, M., Su, D., Stach, E. A. and Ruoff, R. S., 2011. Carbon-based supercapacitors produced by activation of graphene. Science 332 (6037), 1537-1541.
45
Appendix 1
Supplementary Information for
“Trihalomethane, Dihaloacetonitrile, and Total N-nitrosamine Precursor Adsorption by Carbon
Nanotubes: The Importance of Surface Oxides and Pore Volume”
46
List of Tables and Figures
Table S1. Raw Water Characteristics
Table S2. Manufacturer-specified properties of the selected carbon nanotubes
Table S3. Preliminary DBPFP Removal Testing
Table S4. Chlorine Residuals following filtration in batch studies
Table S5. Fluorescence maximum (FMAX) values
Table S6. Mean percent removal of each PARAFAC component
Table S7. Linear correlations (R) between components of BL-RAW and WS-EFF PARAFAC
Models
Figure S1. Gas adsorption isotherms for CNT Types 1-9
Figure S2. Pore volume distributions for CNT Types 1-9
Figure S3. Deconvolutions of carbon spectra from XPS measurements for CNT Types 1-9
Figure S4. Linear regression of fluorescence at RMAX2 excitation-emission wavelength pairs
Figure S5. PARAFAC component EEMs for Beaver Lake Raw Water
Figure S6. PARAFAC component EEMs for West Side WWTP Effluent
Figure S7. Linear regressions of DBPFP percent removal against percent removal of FMAX of
Components.
Figure S8. Sum of squared errors comparing PARAFAC models
Figure S9. Linear regressions of TTHM- and DHANFP against UV254
47
Methods
Dissolved organic carbon was measured for each filtered sample using a GE 5310C TOC
analyzer. Anion concentrations were measured for both BL-RAW and WS-EFF raw waters using
a Metrohm 850 Ion Chromatograph with conductivity and UV detectors. Fluorescence EEMs
were collected using a dual monochromator fluorescence detector (Agilent Technologies, Model
G1321A). Wavelengths used were 250 to 400 nm for excitation and 270 to 600 nm for emission,
both in 1 nm increments. A five-point standard curve of quinine sulfate in 0.1 M sulfuric acid
was used due to its distinct response at excitation and emission wavelengths of 350 and 450 nm,
respectively, and intensity measurements of all spectra were reported in quinine sulfate
equivalents (Cory et al., 2010). Absorbance scans were used to correct for inner-filter effects as
suggested by McKnight et al. (2001) and the MATLAB program Cleanscan (Zepp et al., 2004)
was used to correct EEMs for Raleigh and Raman scattering. Values of fluorescence intensity at
excitation and emission wavelengths of 345 nm and 425 nm, respectively, are strongly correlated
with TTHM precursors (Do et al., 2015) and are shown in Table S1 for both BL-RAW and WS-
EFF. Two models were developed using parallel factor (PARAFAC) analysis on arrays of EEMs
for each water type to reveal components with distinct excitation-emission signatures and their
maximum intensities, FMAX (Andersen and Bro, 2003).
Disinfection by-product formation potential (DBPFP) of the samples was measured using
the procedure detailed in Do et al. (2015) Samples were warmed to room temperature, amended
with 20 mM sodium bicarbonate, and adjusted to pH 7.0 using NaOH and/or HCl. Pre-formed 14
g⋅L-1 as Cl2 stock monochloramine solution was prepared immediately before chloramination as
detailed previously. The stock total chlorine and monochloramine concentrations were measured
on a representative sample volume, following 4,000-6,000 times dilution with Milli-Q water,
48
using Hach powder pillows with a UV-Vis 2450 spectrophotometer (Shimadzu) at wavelengths
of 655- and 552 nm, respectively. Samples were dosed with pre-formed monochloramine at 300
mg⋅L-1 as Cl2 and stored headspace-free in 1-L chlorine demand free amber glass bottles for 7
days in the dark at room temperature (25 ºC ± 2 ºC). Following the hold time, the
monochloramine and total chlorine residuals were measured and quenched with 20.1 g of a salt
mixture (mass ratio of 0.9 g ascorbic acid (C6H8O6): 1 g KH2PO4: 39 g Na2HPO4) added to each
1 L sample to halt DBP formation reactions as recommended by Kristiana et al. (2014). Total
trihalomethanes (TTHMs) and dihaloacetonitriles (DHANs) in the West Side wastewater
treatment plant effluent (WS-EFF) samples were quantified by GC-ECD using a 9-point standard
curve that ranged from 1- to 100 µg⋅L-1. Similarly, TTHMs and DHANs in the Beaver Lake raw
water (BL-RAW) samples were analyzed using a 12-point standard curve that ranged from 0.1-
to 100 µg⋅L-1. Blanks and check standards were run after every group of six samples.
The pH point of zero charge of the carbon nanotubes (CNTs) was not measured because a
stable suspension could not be achieved without CNT modification. Sonication of CNTs in pure
water was attempted despite the high probability of damage to the CNT structure (Yan Yan and
Terentjev, 2012), but failed to produce the stable suspension necessary for zeta potential
measurements.
49
PARAFAC Analysis
EEMs were analyzed by PARAFAC to further characterize the dissolved organic matter
and help generalize the precursor surrogate findings. Given the differences in the water types,
separate PARAFAC models were used for BL-RAW and WS-EFF samples, each originally
consisting of 57 EEMs. Two outliers were removed from the BL-RAW data set while no outliers
were found in WS-EFF samples. Split-half analyses showed that BL-RAW samples could be
adequately described by a two- or four-component model and the WS-EFF samples could be
described by a two- or three-component model. Models with the greatest number of components
(i.e., four components for BL-RAW and three components for WS-EFF) were chosen to explain
the data because they had the smallest sum of squared errors (Figure S8).
XPS Data Analysis
Binding energy scales were charge corrected using a C1s peak position of 284.4 eV (Ago
et al., 1999; McPhail et al., 2009). C1s peaks were deconvoluted with a Gaussian-Lorentzian mix
function, allowed to range from 70-80% Gaussian distribution, and a Shirley background
subtraction (McPhail et al., 2009; Zhang et al., 2014). An asymmetry parameter of 0.19 was
applied to the peak representing carbon-carbon bonds (Ago et al., 1999); other bonds assigned
were alcohols (C-O), carbonyls (C=O), and carboxyls (COO) with an additional peak fitted to the
shake-up features satellite located in the higher binding energy region. Peak locations chosen for
the carbon spectra deconvolutions were set as allowable ranges based on ranges found in the
literature. Actual peak locations were allowed to vary within the set range in order to achieve the
best fit determined by the chi-squared value of the model. The assymetric carbon peak
representing all types of carbon-carbon bonding was set to 284.38-285.50 eV (Ago et al., 1999;
Kovtyukhova et al., 2003; Okpalugo et al., 2005; Wang et al., 2007; Zhang et al., 2014).
50
Locations of various types of carbon-oxygen bonds are as follows: alcohol at 286.00-287.53 eV,
carbonyl at 286.45-288.03 eV, and carboxyl at 288.39-289.55 eV (Ago et al., 1999;
Kovtyukhova et al., 2003; Okpalugo et al., 2005; Ramanathan et al., 2005; Wang et al., 2007;
McPhail et al., 2009; Singh et al., 2014). Shake-up features associated with π-π* transitions were
fitted at 289.00-291.60 eV (Okpalugo et al., 2005). Each individual peak was allowed to vary
from 70- to 80% Gaussian distribution in order to find the best fit (McPhail et al., 2009; Kundu
et al., 2010; Zhang et al., 2014).
Model Verification and Permutations
Results in Table 2 are based on reasonable assumptions with respect to a normal
distribution of residuals and constant error variance. The results of the Wilk-Shapiro test
(Shapiro and Wilk, 1965) for TTHM (p = 0.788), DHAN (p = 0.066) and TONO (p = 0.339)
were all greater than p = 0.05; we therefore fail to reject a normal distribution of residuals.
Further investigation of the relationships between physical and chemical characteristics
of the nine CNT types through simple linear regressions revealed strong correlations between
percent alcohol groups and SBET (R2 = 0.95) and CPV (R2 = 0.90). Multiple linear regression
models of surface oxide groups and physical characteristics showed that alcohol groups were
significant to SBET and CPV when controlling for carbonyl and carboxyl groups. These findings
show that multicollinearity of alcohol groups and physical properties results in variance inflation
factors (VIF = (1 – R2)-1, where R2 is relevant to a multiple linear regression model of one
independent variable versus the other independent variables) greater than ten, which could make
it impossible to observe otherwise significant independent variables in models of DBP ratio. Of
the physical and chemical characteristics, carboxyl groups suffer least from variance inflation
(VIF = 1.27), and it is possible that this variable serves as a surrogate for significance of physical
51
characteristics. To further study possible significance of alcohol groups in the face of
multicollinearity, the carbonyl groups variable, which was insignificant in all models, was
deleted from models of TTHM and DHAN Ratios. This deletion revealed negative significance
of alcohol groups to DHAN ratio, indicating that an increase in alcohol groups improved
removal of DHAN precursors.
As further evidence of multicollinearity, linear regression between SBET and CPV
variables also results in a very strong correlation (R2 = 0.97). However, in the multivariate
analysis including both physical variables, only CPV was significant to changes in DBPFP Ratio
when controlling for surface area. The same cannot be said of SBET when controlling for CPV.
As the multivariate model is capable of providing a more comprehensive assessment of the
significance of variables than simple linear regression of variable pairs, it is reasonable to
conclude that CPV is a more relevant variable to discuss than SBET in terms of relationships to
chemical characteristics and DBPFP Ratio.
Nevertheless, Figure S4 shows the linear regressions for the wavelength pair associated with the
maximum R2 value for TTHM (I369/365) and DHAN (I379/356). Samples were included regardless
of DBP type (TTHM and DHAN only) or source water and an aggregate R2 value of 0.91
indicates that fluorescence measurements can be used as a reliable surrogate of organic precursor
concentrations for TTHM and DHAN. As detailed in the SI, UV254 was also assessed as a DBP
surrogate, but lacked sensitivity at low absorbance values (less than 0.05 cm-1).
Modeling CNT Wall Type
Of the nine types of CNTs studied, two are single-walled (SWCNTs) and seven are
multi-walled (MWCNTs). To explore the effects of these designations, a binary variable was
added to the model to distinguish between SWCNTs and MWCNTs in addition to their physical
52
and chemical characteristics (Table 1). This binary variable was significant in both TTHM and
DHAN models and showed that DBP ratios were significantly smaller in SWCNT-treated waters
(i.e., SWCNTs adsorbed more TTHM and DHAN precursors). Also, controlling for the new
binary variable, CPV had negative, significant effects on DBP ratio for DHAN in general (n =
36) and for TTHM in WS-EFF only (n = 18). However, without more observations of SWCNT
types and/or greater chemical and physical detail to distinguish between single- and multi-walled
CNTs, this study does not focus on the general difference in CNT wall type and its relationship
to other variables.
Removal of PARAFAC Components
The maxima locations of PARAFAC Components 1 and 3 in BL-RAW (Figures S5A and
S5C) and WS-EFF (Figures S6A and S6C) corresponded to locations previously characterized as
humic- and fulvic-like fluorophores (Pifer and Fairey, 2014). Similarly, the maxima locations of
Component 2 corresponded to protein-like fluorophores for BL-RAW (Figure S5B) and WS-EFF
(Figure S6B) (Hudson et al., 2007). Component 4 in the BL-RAW model was considered
negligible due to its location at maximum emission wavelengths and its low FMAX values, which
were insensitive to treatment. To gain further insight into the DBP precursors represented by
each PARAFAC component and their removal by the nine types of CNTs, mean percent
removals were calculated for each component (Table S6) based on FMAX values for BL-RAW
and WS-EFF (Table S5).
Using all nine possible combinations of triplicate samples for both raw and treated waters
for a given CNT type, a conservatively large range of percent removal values were determined
and used to calculate mean removals and 95% confidence intervals using the t-distribution
(Table S5) due to small sample estimates of standard deviation. Removal of Components 1, 2
53
and 3 in WS-EFF by the CNTs all show similar trends in CNT performance to those observed for
the removal of total THM formation potential (TTHMFP) and dihaloacetonitrile formation
potential (DHANFP) (Figure S7A and S7B). Additionally, removal of Components 1 and 3 show
strong correlations to DBPFP in BL-RAW (Figure S7D and S7E). Weak correlations were
observed for total N-nitrosamine (TONO) formation potential removal (Figure S7C) and
Components 2 and 4 in BL-RAW. For all nine CNT types in WS-EFF, Component 2 (protein-
like fluorophores) had the highest mean percent removal (32-80%) of the three components. For
six CNT types in BL-RAW, negative mean percent removals were calculated for Component 2,
which was attibuted to a combination of low concentrations of protein-like compounds in BL-
RAW source water and interferences of humic- and fulvic-like fluorophores skewing the
magnitude of the fluorescent response, similar to the findings of others (Mayer et al., 1999).
Additionally, the samples with negative mean percent removals also have relatively large 95%
confidence intervals (12-339%). These observations illustrated the need for further investigation
into the independence of individual PARAFAC components.
PARAFAC Component Correlations
Linear associations between PARAFAC components were tested for data sets
incorporating samples treated with both low and high doses of CNTs. Correlations may be
considered “weak” if R < 0.5, “strong” if R > 0.8, and “moderate” otherwise (Devore, 2004). As
shown in Table S7 for the BL-RAW samples, the correlation is strong between Components 1
and 3 and moderate between Component 1 and Components 2 and 4. In constrast, correlations
among Components 2, 3, and 4 are weak with R values between 0.43-0.49. For the WS-EFF
samples, all correlations were strong between the three components, with R values of 0.85, 0.94,
and 0.97. As such, even if protein-like fluorophore groups were the predominant precursors of
54
TONO, the influence of humic- and fulvic-like fluorophores would obscure this finding and
produce poor correlations such as those observed in Figure S7C.
UV254 as a DBP Precursor Surrogate
Performing selected linear comparisons between single dependent variables and DBPFP
revealed an interesting relationship between UV254 and TTHMFP (Figure S9A) and DHANFP
(Figure S9B). While strong linear correlations existed between UV254 for the WS-EFF samples
(TTHMFP, R2 = 0.74 and DHANFP, R2 = 0.78), those for BL-RAW samples had R2 values less
than 0.01, indicating the sensitivity of the absorbance scans were insufficient for characterization
of TTHM and DHAN precursors. The sensitivity of UV254 measurements could possibly be
improved by utilizing a 5 cm pathlength cuvette, instead of the 1-cm cuvette used in this study.
However, fluorescence measurements utilize a much smaller pathlength of 0.5 mm while still
maintaining a comparatively high sensitivity. This in addition to its usefulness across multiple
water types (Figure S4) indicates fluorescence is a more robust DBP precursor surrogate than
UV254.
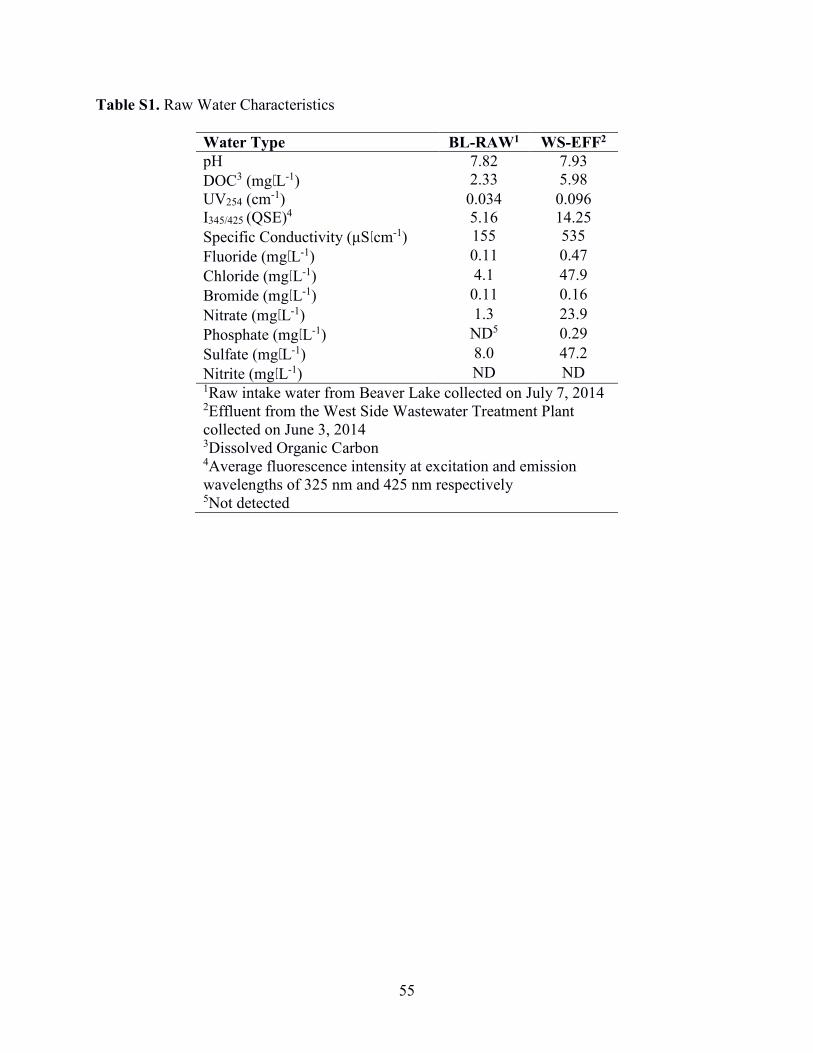
55
Table S1. Raw Water Characteristics
Water Type BL-RAW1 WS-EFF2
pH 7.82 7.93
DOC3 (mg⋅L-1) 2.33 5.98
UV254 (cm-1) 0.034 0.096 I345/425 (QSE)4 5.16 14.25
Specific Conductivity (μS⋅cm-1) 155 535
Fluoride (mg⋅L-1) 0.11 0.47
Chloride (mg⋅L-1) 4.1 47.9
Bromide (mg⋅L-1) 0.11 0.16
Nitrate (mg⋅L-1) 1.3 23.9
Phosphate (mg⋅L-1) ND5 0.29
Sulfate (mg⋅L-1) 8.0 47.2
Nitrite (mg⋅L-1) ND ND 1Raw intake water from Beaver Lake collected on July 7, 2014 2Effluent from the West Side Wastewater Treatment Plant collected on June 3, 2014 3Dissolved Organic Carbon 4Average fluorescence intensity at excitation and emission wavelengths of 325 nm and 425 nm respectively 5Not detected
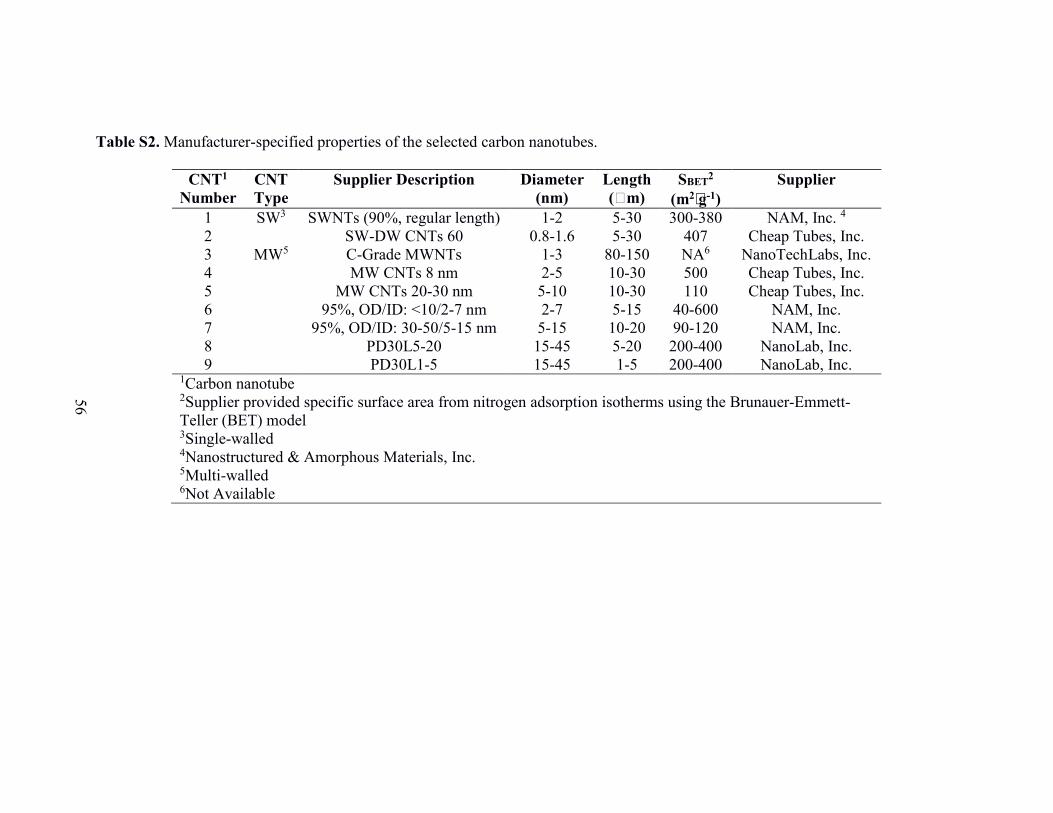
56
Table S2. Manufacturer-specified properties of the selected carbon nanotubes.
CNT1
Number
CNT
Type
Supplier Description Diameter
(nm)
Length
(m)
SBET2
(m2⋅g-1)
Supplier
1 SW3 SWNTs (90%, regular length) 1-2 5-30 300-380 NAM, Inc. 4 2 SW-DW CNTs 60 0.8-1.6 5-30 407 Cheap Tubes, Inc. 3 MW5 C-Grade MWNTs 1-3 80-150 NA6 NanoTechLabs, Inc. 4 MW CNTs 8 nm 2-5 10-30 500 Cheap Tubes, Inc. 5 MW CNTs 20-30 nm 5-10 10-30 110 Cheap Tubes, Inc. 6 95%, OD/ID: <10/2-7 nm 2-7 5-15 40-600 NAM, Inc. 7 95%, OD/ID: 30-50/5-15 nm 5-15 10-20 90-120 NAM, Inc. 8 PD30L5-20 15-45 5-20 200-400 NanoLab, Inc. 9 PD30L1-5 15-45 1-5 200-400 NanoLab, Inc.
1Carbon nanotube 2Supplier provided specific surface area from nitrogen adsorption isotherms using the Brunauer-Emmett-Teller (BET) model 3Single-walled 4Nanostructured & Amorphous Materials, Inc. 5Multi-walled 6Not Available
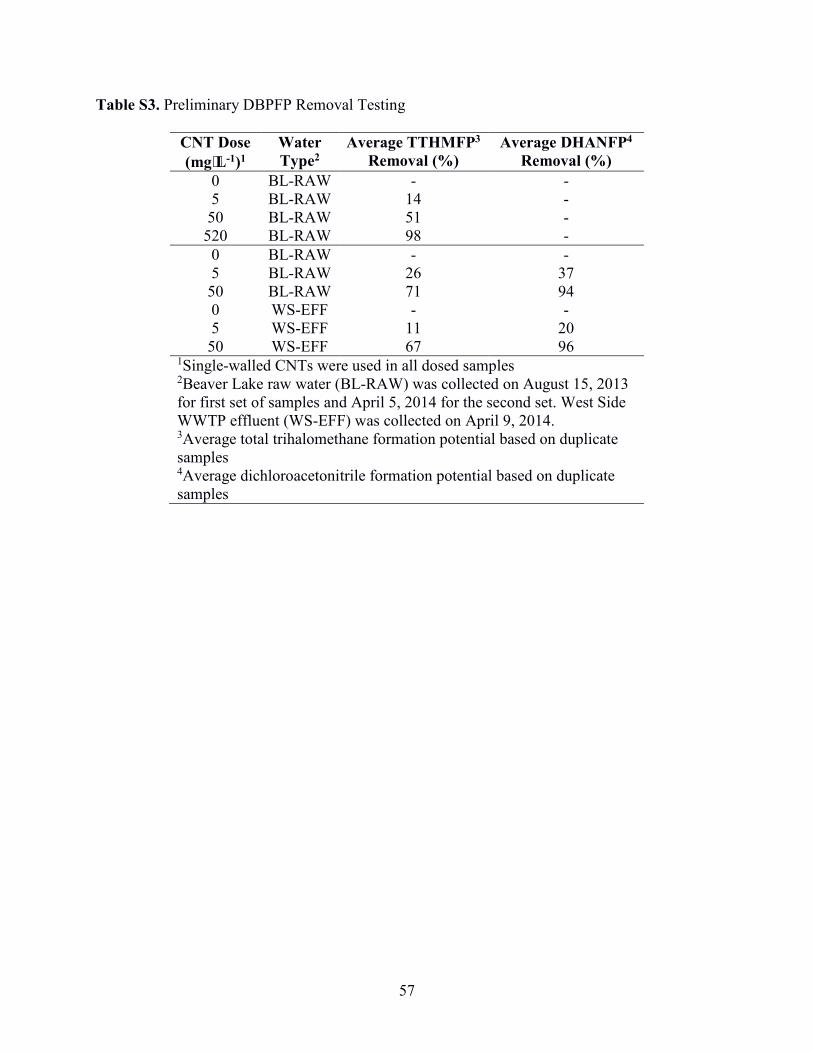
57
Table S3. Preliminary DBPFP Removal Testing
CNT Dose
(mg⋅L-1)1
Water
Type2
Average TTHMFP3
Removal (%)
Average DHANFP4
Removal (%)
0 BL-RAW - - 5 BL-RAW 14 -
50 BL-RAW 51 - 520 BL-RAW 98 -
0 BL-RAW - - 5 BL-RAW 26 37
50 BL-RAW 71 94 0 WS-EFF - - 5 WS-EFF 11 20
50 WS-EFF 67 96 1Single-walled CNTs were used in all dosed samples 2Beaver Lake raw water (BL-RAW) was collected on August 15, 2013 for first set of samples and April 5, 2014 for the second set. West Side WWTP effluent (WS-EFF) was collected on April 9, 2014. 3Average total trihalomethane formation potential based on duplicate samples 4Average dichloroacetonitrile formation potential based on duplicate samples
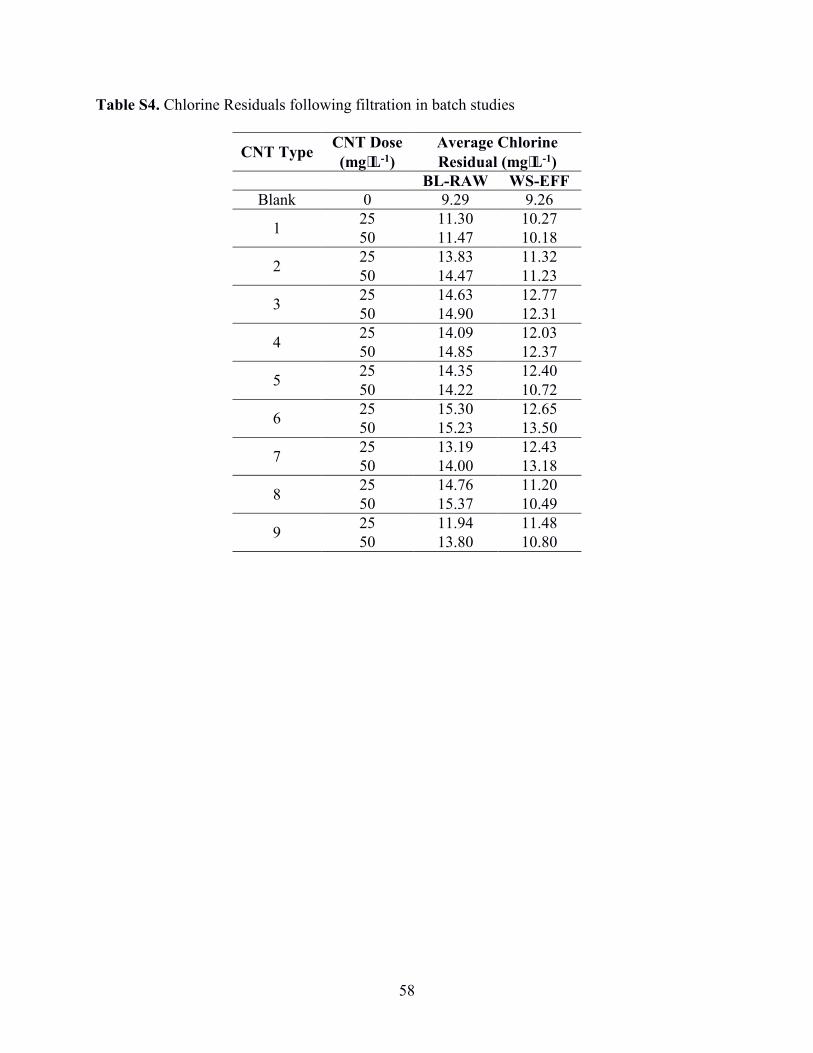
58
Table S4. Chlorine Residuals following filtration in batch studies
CNT Type CNT Dose
(mg⋅L-1)
Average Chlorine
Residual (mg⋅L-1)
BL-RAW WS-EFF
Blank 0 9.29 9.26
1 25 11.30 10.27
50 11.47 10.18
2 25 13.83 11.32
50 14.47 11.23
3 25 14.63 12.77
50 14.90 12.31
4 25 14.09 12.03
50 14.85 12.37
5 25 14.35 12.40
50 14.22 10.72
6 25 15.30 12.65
50 15.23 13.50
7 25 13.19 12.43
50 14.00 13.18
8 25 14.76 11.20
50 15.37 10.49
9 25 11.94 11.48
50 13.80 10.80
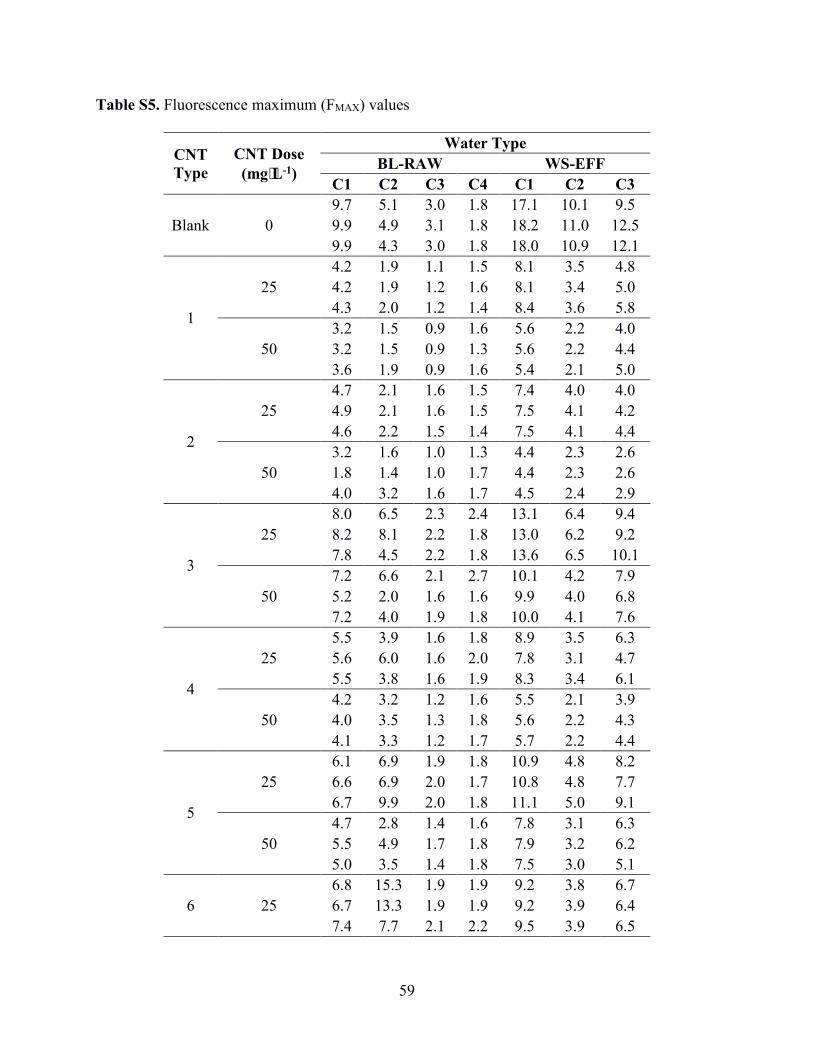
59
Table S5. Fluorescence maximum (FMAX) values
CNT
Type
CNT Dose
(mg⋅L-1)
Water Type
BL-RAW WS-EFF
C1 C2 C3 C4 C1 C2 C3
Blank 0
9.7 5.1 3.0 1.8 17.1 10.1 9.5
9.9 4.9 3.1 1.8 18.2 11.0 12.5
9.9 4.3 3.0 1.8 18.0 10.9 12.1
1
25
4.2 1.9 1.1 1.5 8.1 3.5 4.8
4.2 1.9 1.2 1.6 8.1 3.4 5.0
4.3 2.0 1.2 1.4 8.4 3.6 5.8
50
3.2 1.5 0.9 1.6 5.6 2.2 4.0
3.2 1.5 0.9 1.3 5.6 2.2 4.4
3.6 1.9 0.9 1.6 5.4 2.1 5.0
2
25
4.7 2.1 1.6 1.5 7.4 4.0 4.0
4.9 2.1 1.6 1.5 7.5 4.1 4.2
4.6 2.2 1.5 1.4 7.5 4.1 4.4
50
3.2 1.6 1.0 1.3 4.4 2.3 2.6
1.8 1.4 1.0 1.7 4.4 2.3 2.6
4.0 3.2 1.6 1.7 4.5 2.4 2.9
3
25
8.0 6.5 2.3 2.4 13.1 6.4 9.4
8.2 8.1 2.2 1.8 13.0 6.2 9.2
7.8 4.5 2.2 1.8 13.6 6.5 10.1
50
7.2 6.6 2.1 2.7 10.1 4.2 7.9
5.2 2.0 1.6 1.6 9.9 4.0 6.8
7.2 4.0 1.9 1.8 10.0 4.1 7.6
4
25
5.5 3.9 1.6 1.8 8.9 3.5 6.3
5.6 6.0 1.6 2.0 7.8 3.1 4.7
5.5 3.8 1.6 1.9 8.3 3.4 6.1
50
4.2 3.2 1.2 1.6 5.5 2.1 3.9
4.0 3.5 1.3 1.8 5.6 2.2 4.3
4.1 3.3 1.2 1.7 5.7 2.2 4.4
5
25
6.1 6.9 1.9 1.8 10.9 4.8 8.2
6.6 6.9 2.0 1.7 10.8 4.8 7.7
6.7 9.9 2.0 1.8 11.1 5.0 9.1
50
4.7 2.8 1.4 1.6 7.8 3.1 6.3
5.5 4.9 1.7 1.8 7.9 3.2 6.2
5.0 3.5 1.4 1.8 7.5 3.0 5.1
6 25
6.8 15.3 1.9 1.9 9.2 3.8 6.7
6.7 13.3 1.9 1.9 9.2 3.9 6.4
7.4 7.7 2.1 2.2 9.5 3.9 6.5
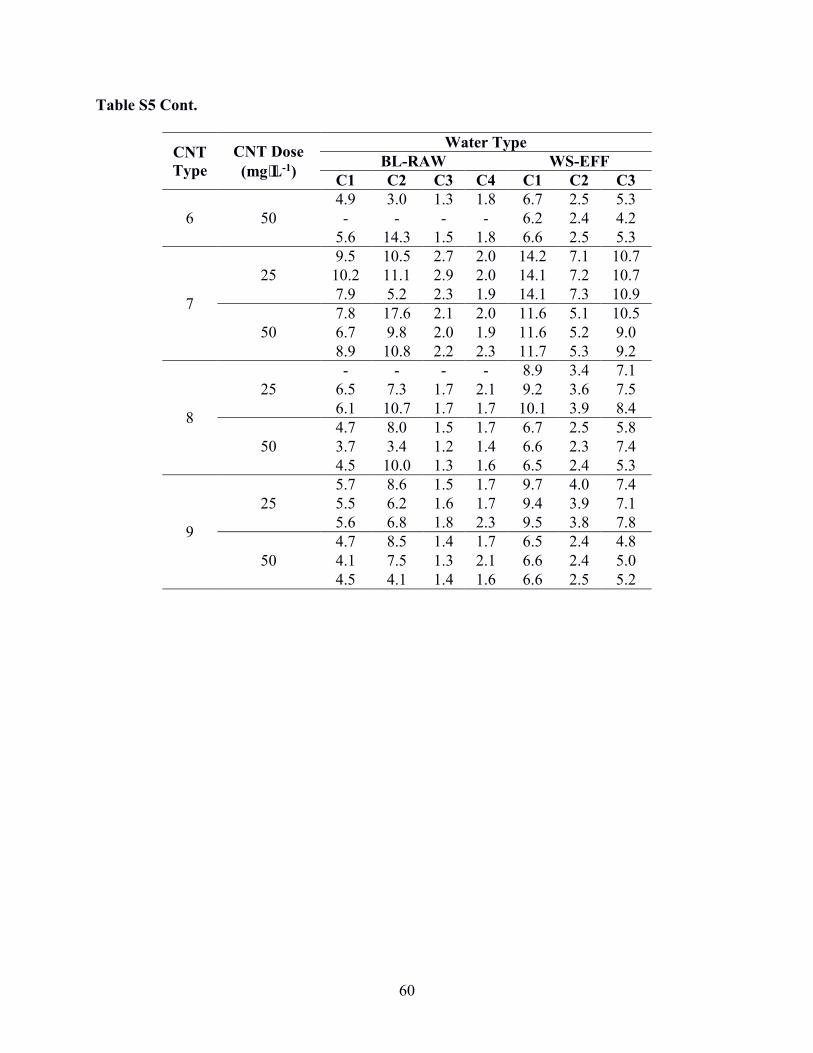
60
Table S5 Cont.
CNT
Type
CNT Dose
(mg⋅L-1)
Water Type
BL-RAW WS-EFF
C1 C2 C3 C4 C1 C2 C3
6 50
4.9 3.0 1.3 1.8 6.7 2.5 5.3
- - - - 6.2 2.4 4.2
5.6 14.3 1.5 1.8 6.6 2.5 5.3
7
25
9.5 10.5 2.7 2.0 14.2 7.1 10.7
10.2 11.1 2.9 2.0 14.1 7.2 10.7
7.9 5.2 2.3 1.9 14.1 7.3 10.9
50
7.8 17.6 2.1 2.0 11.6 5.1 10.5
6.7 9.8 2.0 1.9 11.6 5.2 9.0
8.9 10.8 2.2 2.3 11.7 5.3 9.2
8
25
- - - - 8.9 3.4 7.1
6.5 7.3 1.7 2.1 9.2 3.6 7.5
6.1 10.7 1.7 1.7 10.1 3.9 8.4
50
4.7 8.0 1.5 1.7 6.7 2.5 5.8
3.7 3.4 1.2 1.4 6.6 2.3 7.4
4.5 10.0 1.3 1.6 6.5 2.4 5.3
9
25
5.7 8.6 1.5 1.7 9.7 4.0 7.4
5.5 6.2 1.6 1.7 9.4 3.9 7.1
5.6 6.8 1.8 2.3 9.5 3.8 7.8
50
4.7 8.5 1.4 1.7 6.5 2.4 4.8
4.1 7.5 1.3 2.1 6.6 2.4 5.0
4.5 4.1 1.4 1.6 6.6 2.5 5.2
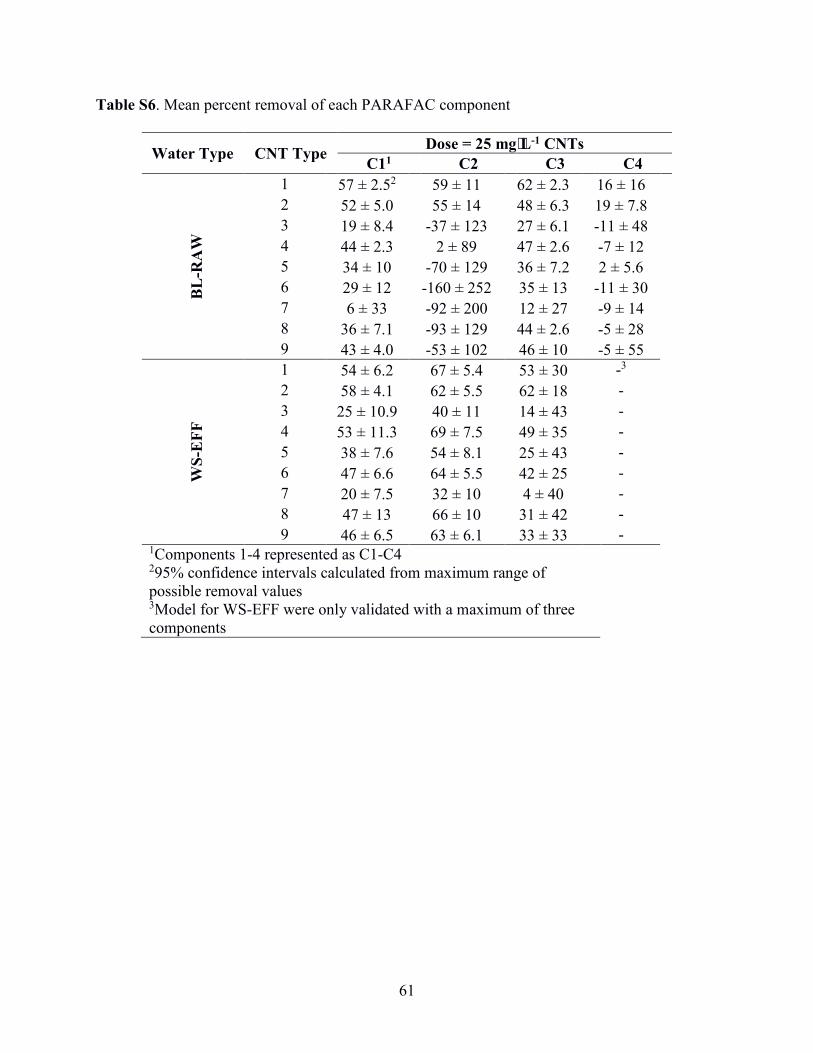
61
Table S6. Mean percent removal of each PARAFAC component
Water Type CNT Type Dose = 25 mg⋅L-1 CNTs
C11 C2 C3 C4
BL
-RA
W
1 57 ± 2.52 59 ± 11 62 ± 2.3 16 ± 16
2 52 ± 5.0 55 ± 14 48 ± 6.3 19 ± 7.8
3 19 ± 8.4 -37 ± 123 27 ± 6.1 -11 ± 48
4 44 ± 2.3 2 ± 89 47 ± 2.6 -7 ± 12
5 34 ± 10 -70 ± 129 36 ± 7.2 2 ± 5.6
6 29 ± 12 -160 ± 252 35 ± 13 -11 ± 30
7 6 ± 33 -92 ± 200 12 ± 27 -9 ± 14
8 36 ± 7.1 -93 ± 129 44 ± 2.6 -5 ± 28
9 43 ± 4.0 -53 ± 102 46 ± 10 -5 ± 55
WS
-EF
F
1 54 ± 6.2 67 ± 5.4 53 ± 30 -3
2 58 ± 4.1 62 ± 5.5 62 ± 18 -
3 25 ± 10.9 40 ± 11 14 ± 43 -
4 53 ± 11.3 69 ± 7.5 49 ± 35 -
5 38 ± 7.6 54 ± 8.1 25 ± 43 -
6 47 ± 6.6 64 ± 5.5 42 ± 25 -
7 20 ± 7.5 32 ± 10 4 ± 40 -
8 47 ± 13 66 ± 10 31 ± 42 -
9 46 ± 6.5 63 ± 6.1 33 ± 33 - 1Components 1-4 represented as C1-C4 295% confidence intervals calculated from maximum range of possible removal values 3Model for WS-EFF were only validated with a maximum of three components
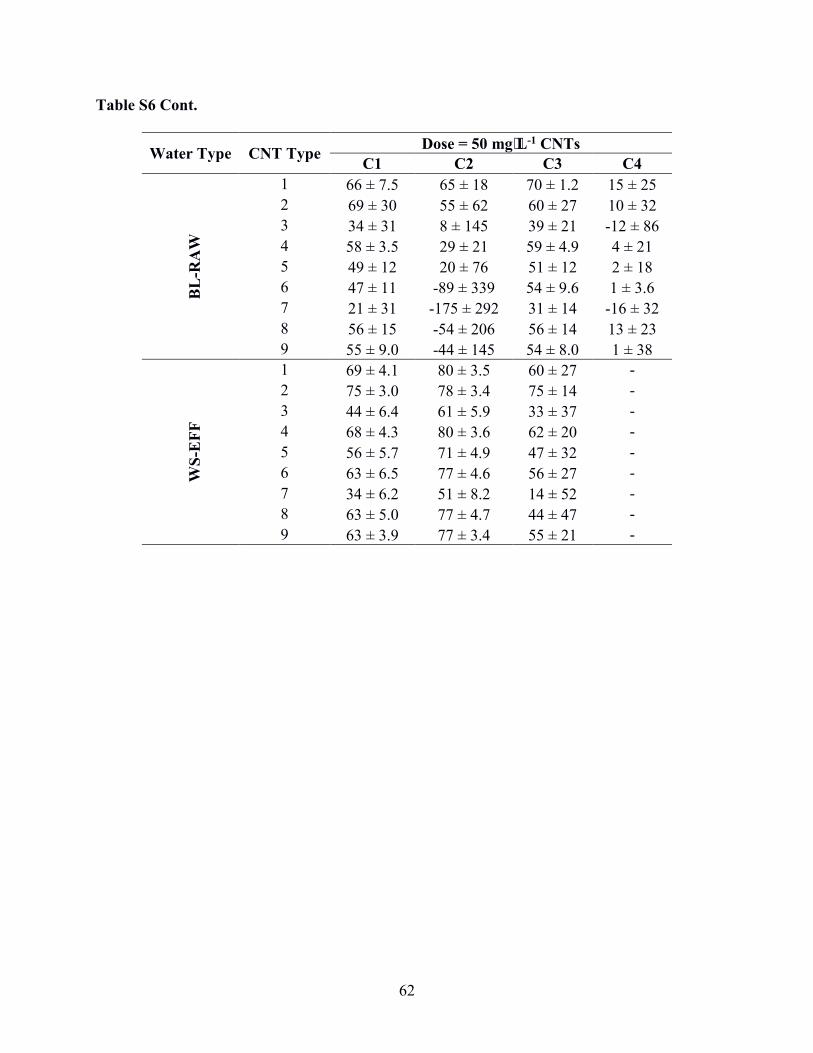
62
Table S6 Cont.
Water Type CNT Type Dose = 50 mg⋅L-1 CNTs
C1 C2 C3 C4
BL
-RA
W
1 66 ± 7.5 65 ± 18 70 ± 1.2 15 ± 25
2 69 ± 30 55 ± 62 60 ± 27 10 ± 32
3 34 ± 31 8 ± 145 39 ± 21 -12 ± 86
4 58 ± 3.5 29 ± 21 59 ± 4.9 4 ± 21
5 49 ± 12 20 ± 76 51 ± 12 2 ± 18
6 47 ± 11 -89 ± 339 54 ± 9.6 1 ± 3.6
7 21 ± 31 -175 ± 292 31 ± 14 -16 ± 32
8 56 ± 15 -54 ± 206 56 ± 14 13 ± 23
9 55 ± 9.0 -44 ± 145 54 ± 8.0 1 ± 38
WS
-EF
F
1 69 ± 4.1 80 ± 3.5 60 ± 27 -
2 75 ± 3.0 78 ± 3.4 75 ± 14 -
3 44 ± 6.4 61 ± 5.9 33 ± 37 -
4 68 ± 4.3 80 ± 3.6 62 ± 20 -
5 56 ± 5.7 71 ± 4.9 47 ± 32 -
6 63 ± 6.5 77 ± 4.6 56 ± 27 -
7 34 ± 6.2 51 ± 8.2 14 ± 52 -
8 63 ± 5.0 77 ± 4.7 44 ± 47 -
9 63 ± 3.9 77 ± 3.4 55 ± 21 -
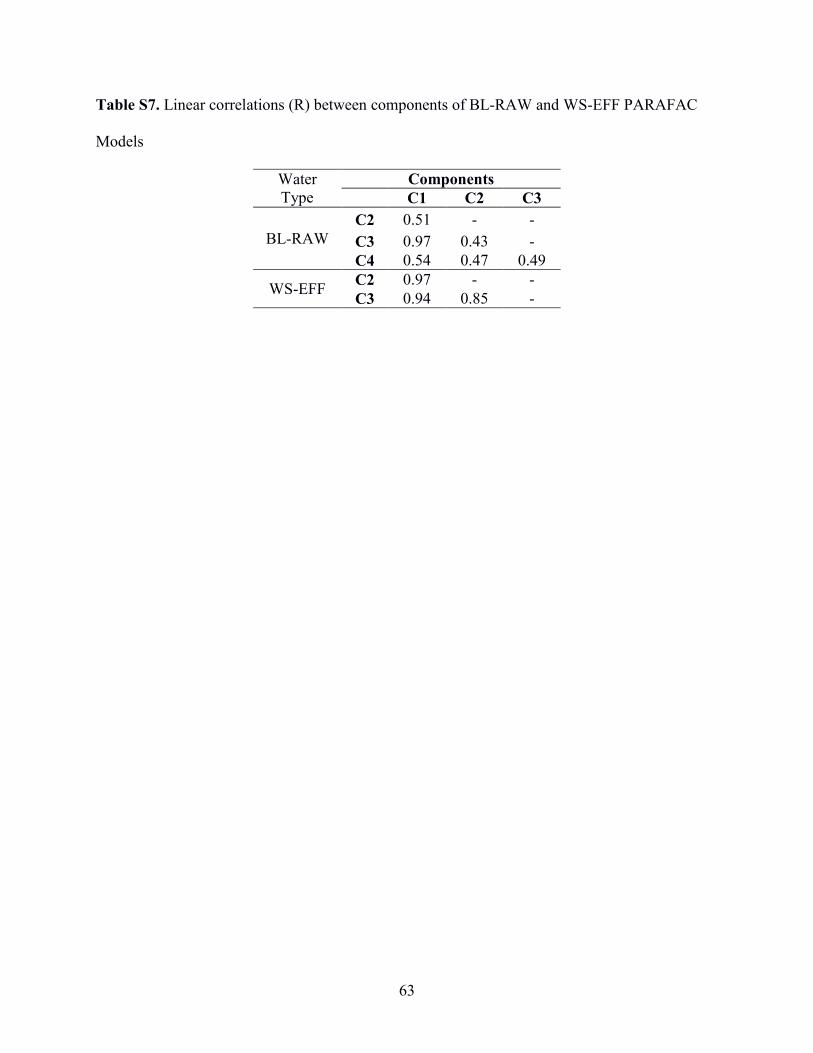
63
Table S7. Linear correlations (R) between components of BL-RAW and WS-EFF PARAFAC
Models
Water Type
Components
C1 C2 C3
BL-RAW
C2 0.51 - -
C3 0.97 0.43 -
C4 0.54 0.47 0.49
WS-EFF C2 0.97 - -
C3 0.94 0.85 -
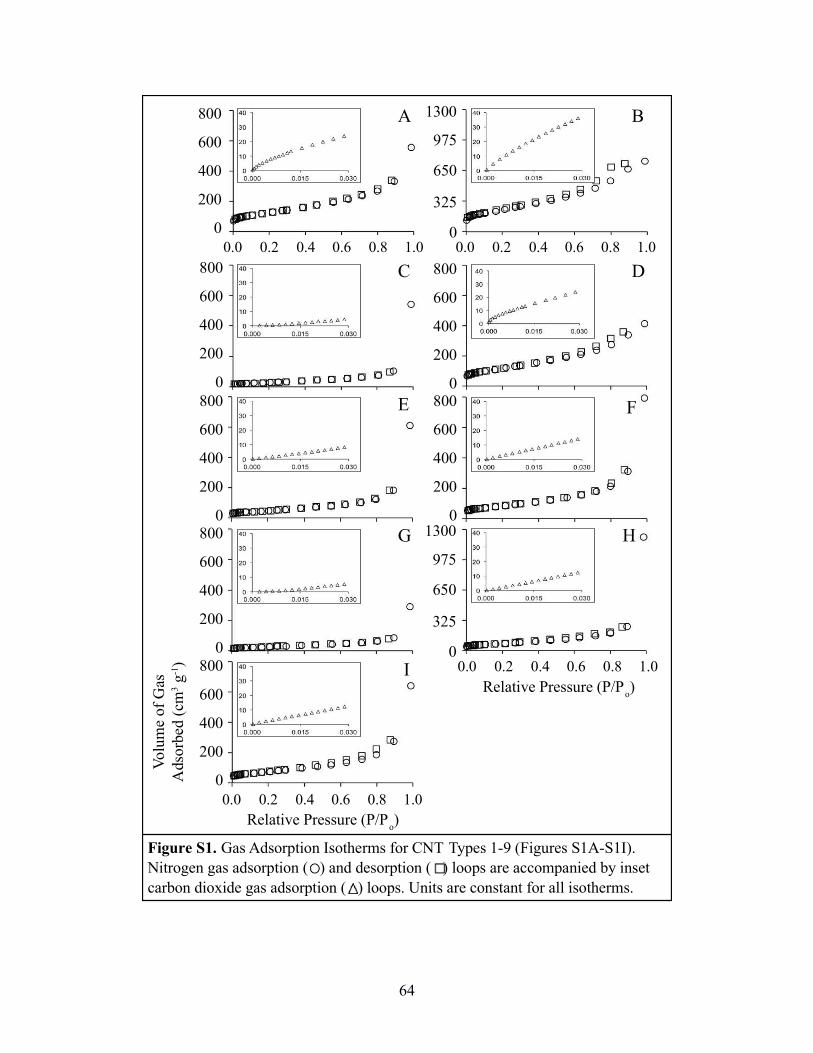
64
800
600
400
200
0
0.0 0.2 0.4 0.6 0.8 1.0
1300
975
650
325
0
Vo
lum
e of
Gas
Adso
rbed
(cm
3 g
-1)
Relative Pressure (P/Po)
Figure S1. Gas Adsorption Isotherms for CNT Types 1-9 (Figures S1A-S1I).
Nitrogen gas adsorption ( ) and desorption ( ) loops are accompanied by inset
carbon dioxide gas adsorption ( ) loops. Units are constant for all isotherms.
B
I
H
F
D
G
E
C
A
800
600
400
200
0
800
600
400
200
0800
600
400
200
0800
600
400
200
0
0.0 0.2 0.4 0.6 0.8 1.0
0.0 0.2 0.4 0.6 0.8 1.0
800
600
400
200
0800
600
400
200
01300
975
650
325
00.0 0.2 0.4 0.6 0.8 1.0
Relative Pressure (P/Po)
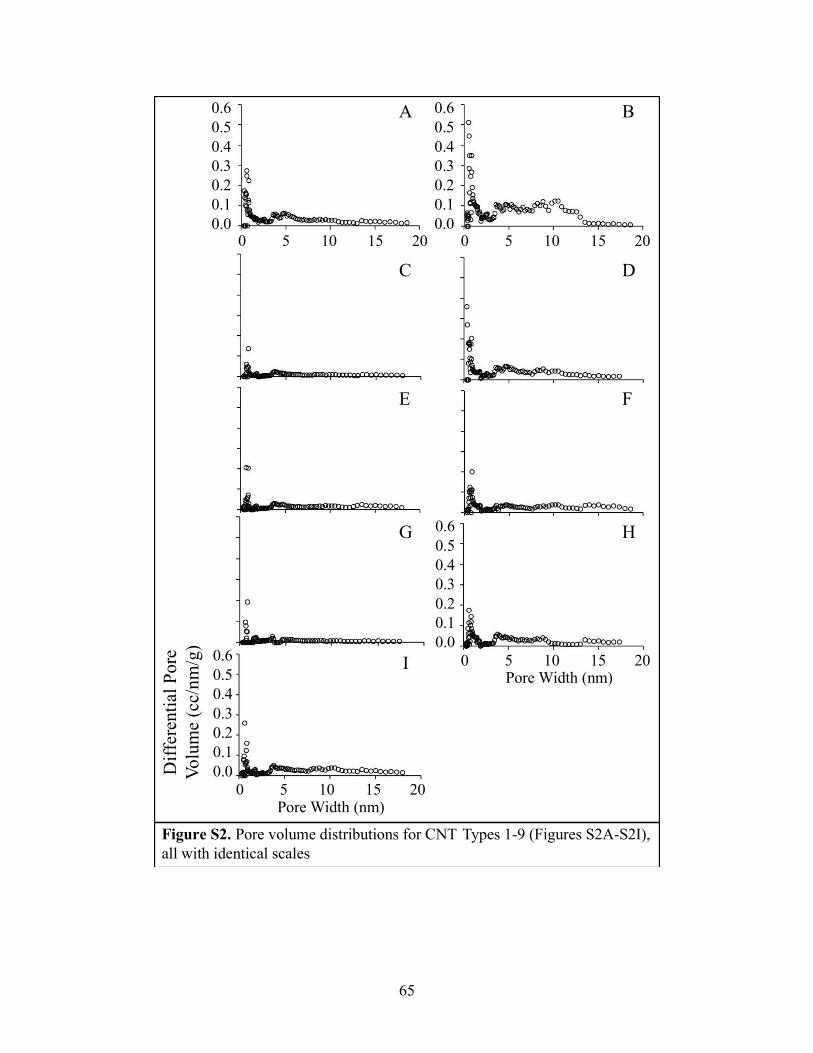
65
A B
DC
E F
G H
I
Dif
fere
nti
al P
ore
Vo
lum
e (c
c/n
m/g
)
Figure S2. Pore volume distributions for CNT Types 1-9 (Figures S2A-S2I),
all with identical scales
0 5 10 15 20
0.6
0.5
0.4
0.3
0.2
0.1
0.0
Pore Width (nm)
0.6
0.5
0.4
0.3
0.2
0.1
0.0
0.6
0.5
0.4
0.3
0.2
0.1
0.00.6
0.5
0.4
0.3
0.2
0.1
0.0
0 5 10 15 20
0 5 10 15 20
0 5 10 15 20Pore Width (nm)
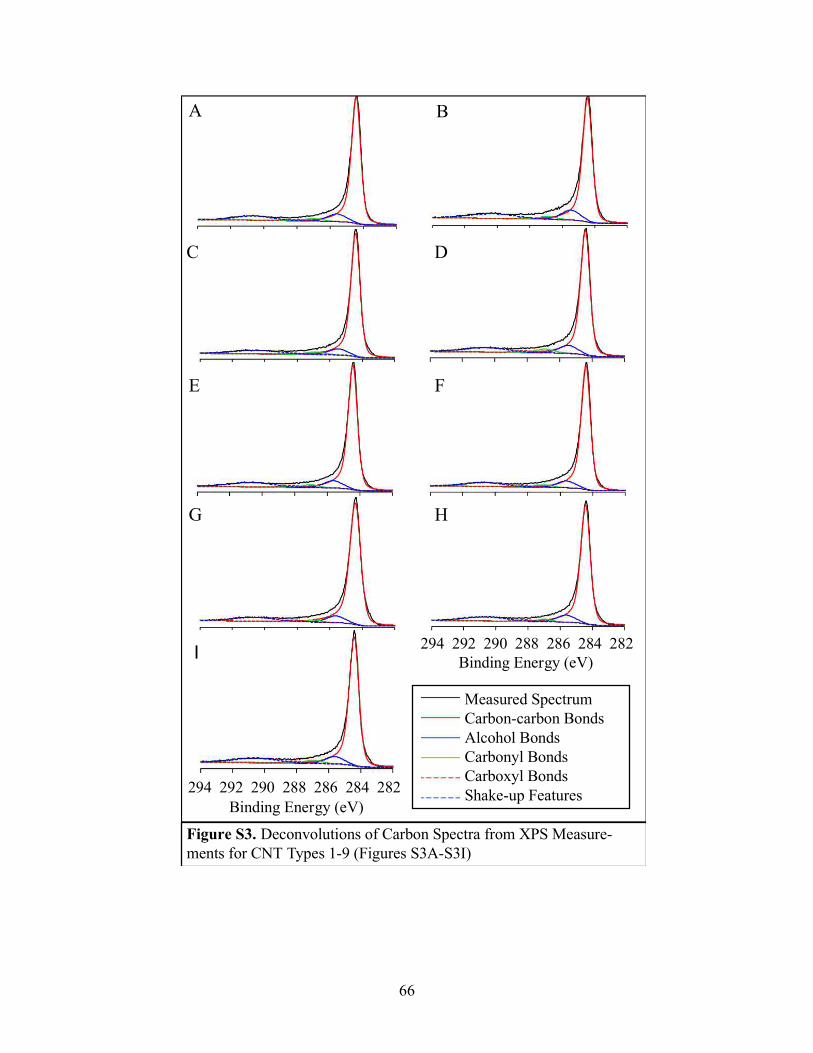
66
Binding Energy (eV)
Binding Energy (eV)
Figure S3. Deconvolutions of Carbon Spectra from XPS Measure-
ments for CNT Types 1-9 (Figures S3A-S3I)
Measured Spectrum
Carbon-carbon Bonds
Alcohol Bonds
Carbonyl Bonds
Carboxyl Bonds
Shake-up Features
A B
C D
E F
G H
I
294 292 290 288 286 284 282
294 292 290 288 286 284 282
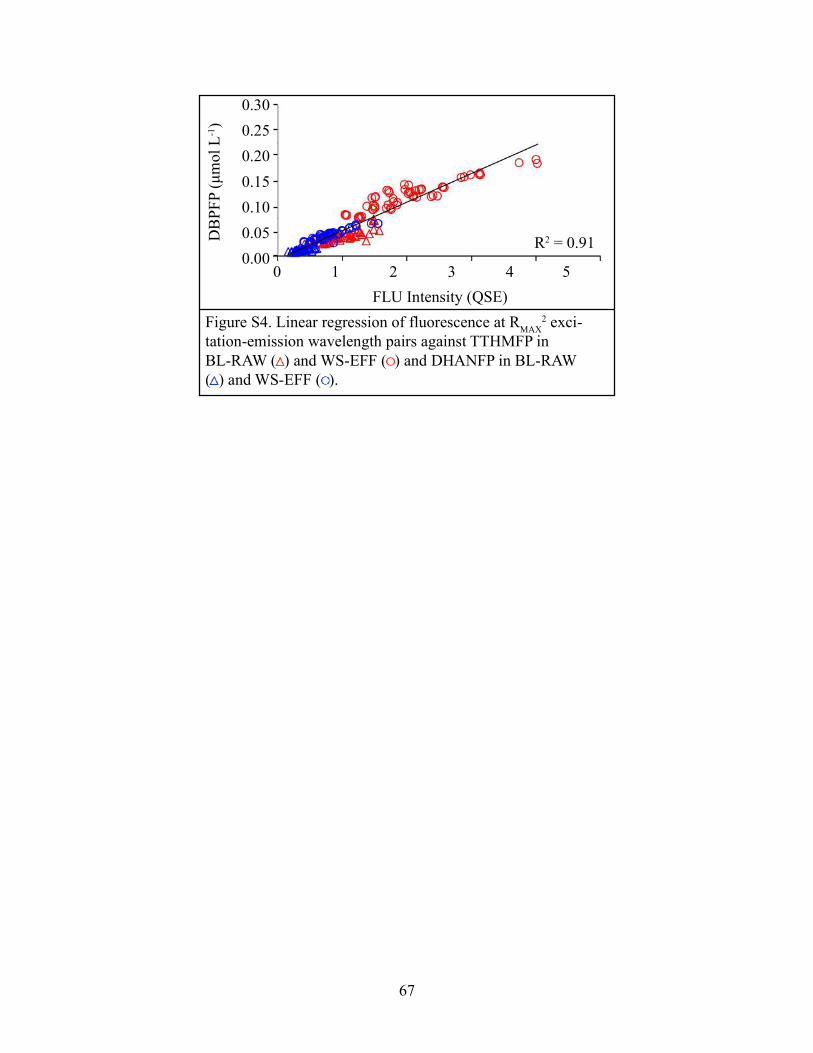
67
FLU Intensity (QSE)
DB
PF
P (
μm
ol
L-1)
Figure S4. Linear regression of fluorescence at RMAX
2 exci-
tation-emission wavelength pairs against TTHMFP in
BL-RAW ( ) and WS-EFF ( ) and DHANFP in BL-RAW
( ) and WS-EFF ( ).
R2 = 0.91
(( ))))))))))))(((( ))))
)))))))))))( ( ( ( (( (((
0.30
0.25
0.20
0.15
0.10
0.05
0.00 0 1 2 3 4 5
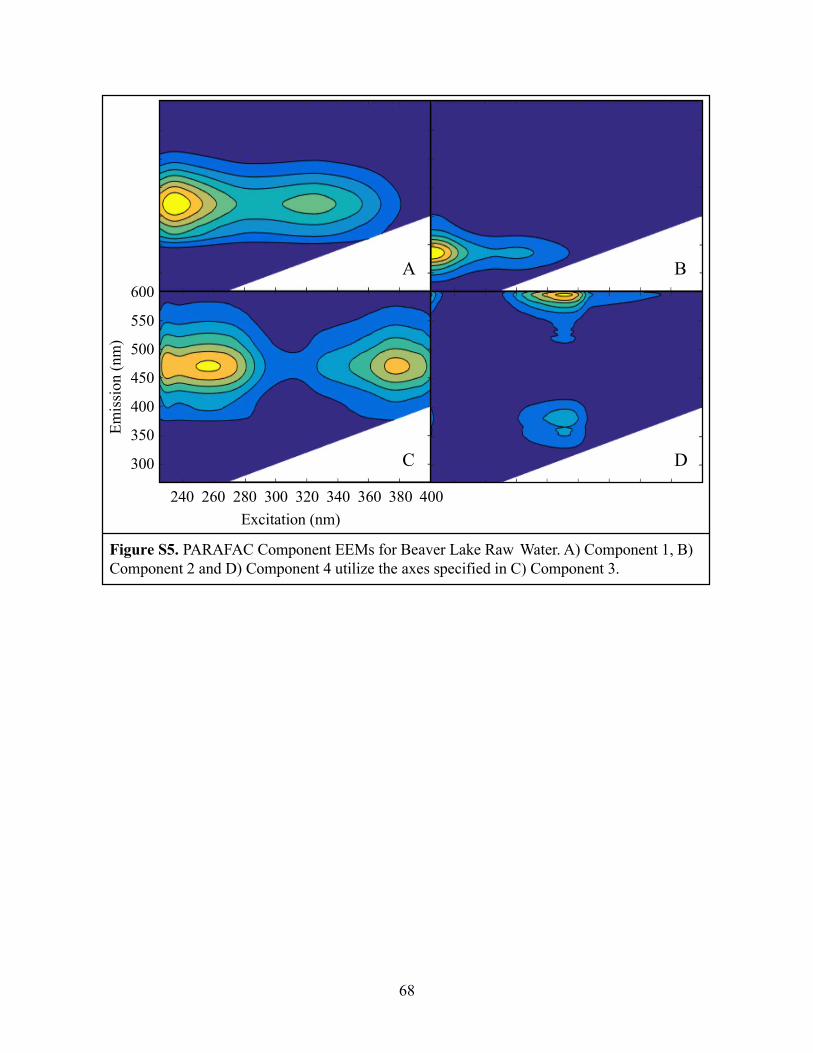
68
240 260 280 300 320 340 360 380 400
600
550
500
450
400
350
300
Excitation (nm)
Em
issi
on (
nm
)
Figure S5. PARAFAC Component EEMs for Beaver Lake Raw Water. A) Component 1, B)
Component 2 and D) Component 4 utilize the axes specified in C) Component 3.
A B
C D
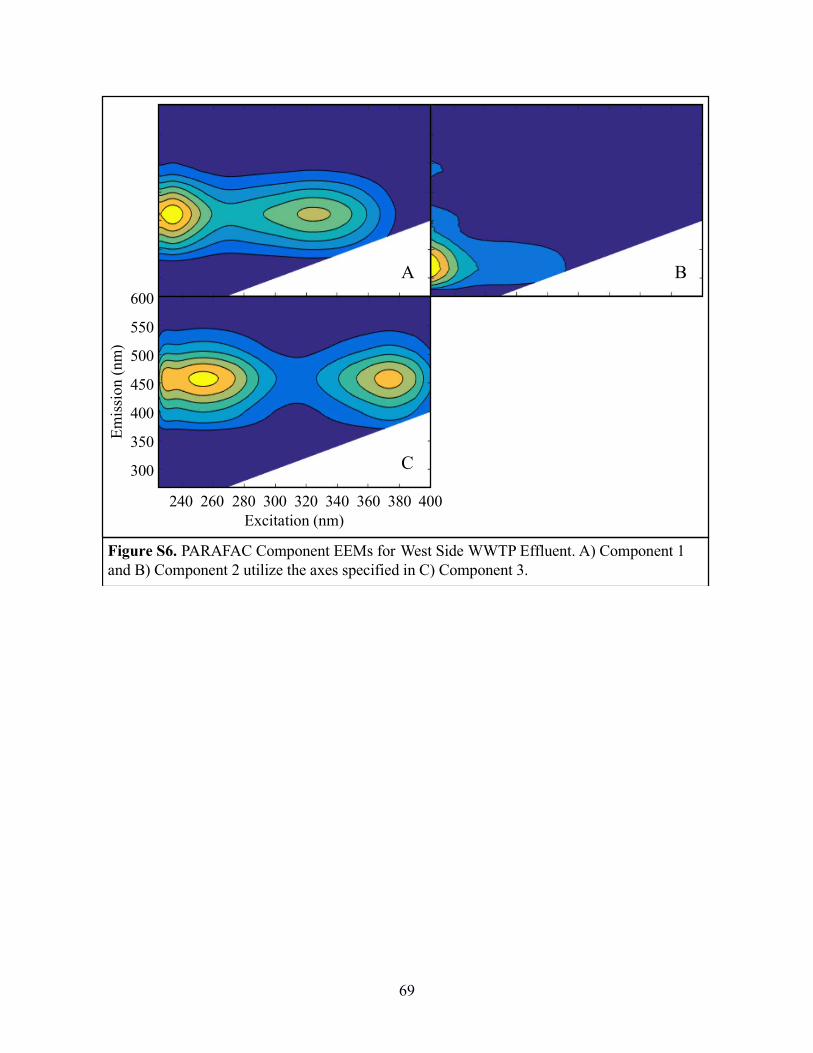
69
Em
issi
on
(n
m)
Excitation (nm)
Figure S6. PARAFAC Component EEMs for West Side WWTP Effluent. A) Component 1
and B) Component 2 utilize the axes specified in C) Component 3.
A B
C
600
550
500
450
400
350
300
240 260 280 300 320 340 360 380 400
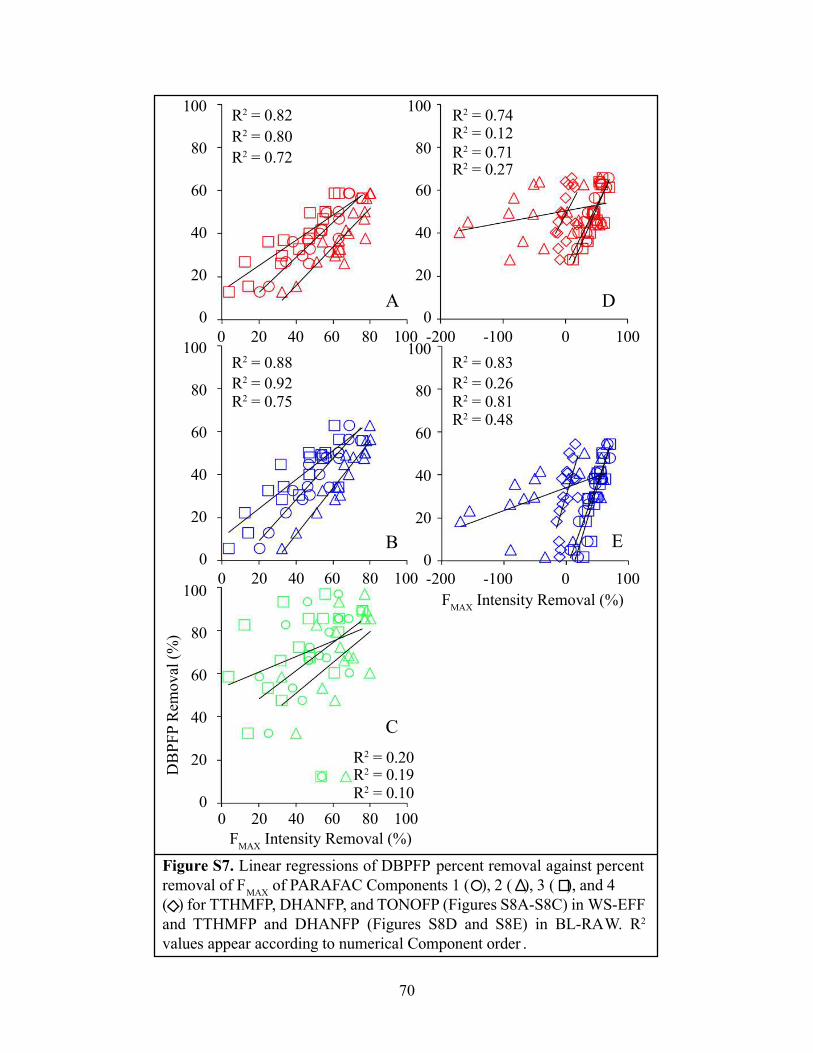
70
FMAX
Intensity Removal (%)
DB
PF
P R
emo
val
(%
)
FMAX
Intensity Removal (%)
Figure S7. Linear regressions of DBPFP percent removal against percent
removal of FMAX
of PARAFAC Components 1 ( ), 2 ( ), 3 ( ), and 4
( ) for TTHMFP, DHANFP, and TONOFP (Figures S8A-S8C) in WS-EFF
and TTHMFP and DHANFP (Figures S8D and S8E) in BL-RAW. R2
values appear according to numerical Component order .
E
A
B
C
D
100
80
60
40
20
0
R2 = 0.82
R2 = 0.80
R2 = 0.72
R2 = 0.88
R2 = 0.92R2 = 0.75
R2 = 0.20R2 = 0.19R2 = 0.10
R2 = 0.74R2 = 0.12
R2 = 0.71R2 = 0.27
R2 = 0.83
R2 = 0.26R2 = 0.81R2 = 0.48
0 20 40 60 80 100 -200 -100 0 100
0 20 40 60 80 100
0 20 40 60 80 100
100
80
60
40
20
0
100
80
60
40
20
0
100
80
60
40
20
0
-200 -100 0 100
100
80
60
40
20
0
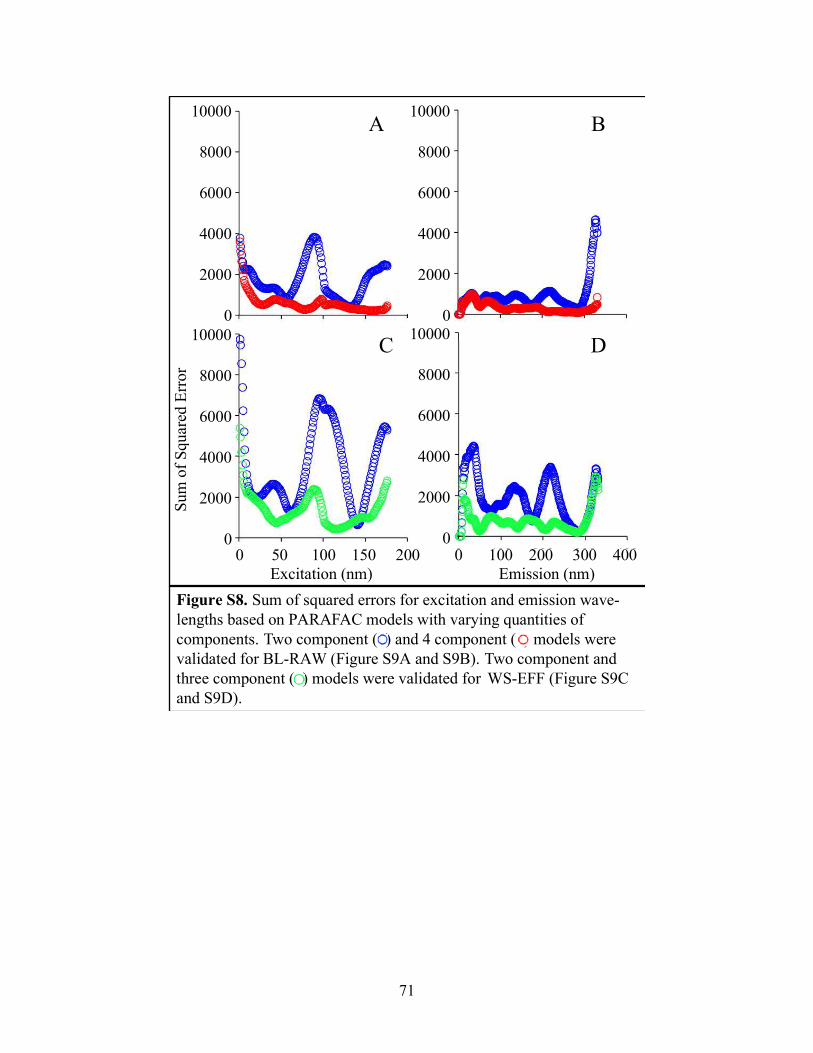
71
Sum
of
Squar
ed E
rror
Figure S8. Sum of squared errors for excitation and emission wave-
lengths based on PARAFAC models with varying quantities of
components. Two component ( ) and 4 component ( ) models were
validated for BL-RAW (Figure S9A and S9B). Two component and
three component ( ) models were validated for WS-EFF (Figure S9C
and S9D).
A B
( ((((((((((((( )))))))))))))
(((((((((((((((((( ))))))))))
(( )))))))))))))))))))))
q
DC
10000
8000
6000
4000
2000
0
10000
8000
6000
4000
2000
0
0 50 100 150 200 0 100 200 300 400
10000
8000
6000
4000
2000
0
10000
8000
6000
4000
2000
0
Excitation (nm) Emission (nm)
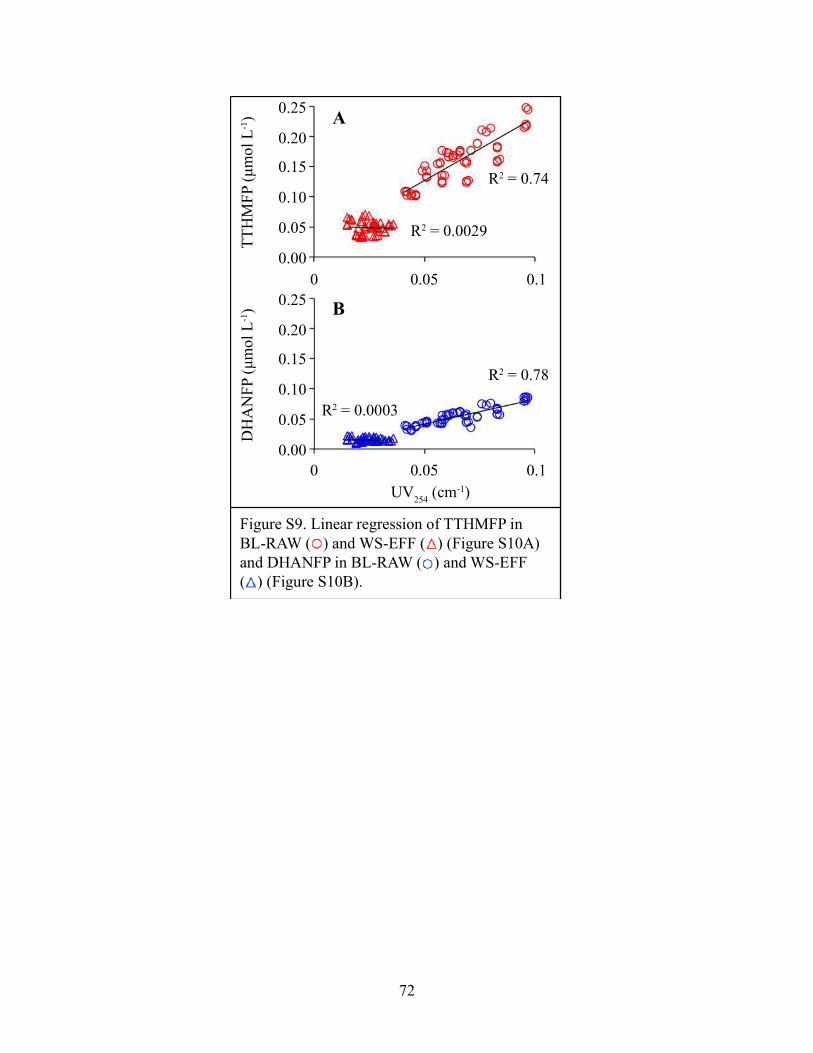
72
UV254
(cm-1)
TT
HM
FP
(μ
mol
L-1)
DH
AN
FP
(μ
mol
L-1)
Figure S9. Linear regression of TTHMFP in
BL-RAW ( ) and WS-EFF ( ) (Figure S10A)
and DHANFP in BL-RAW ( ) and WS-EFF
( ) (Figure S10B).
A
B
R2 = 0.74
R2 = 0.0003
R2 = 0.0029
R2 = 0.78
0 0.05 0.1
0 0.05 0.1
0.25
0.20
0.15
0.10
0.05
0.00
0.25
0.20
0.15
0.10
0.05
0.00
73
References
Ago, H., Kugler, T., Cacialli, F., Salaneck, W. R., Shaffer, M. S. P., Windle, A. H. and Friend, R. H., 1999. Work functions and surface functional groups of multiwall carbon nanotubes. Journal of Physical Chemistry B 103 (38), 8116-8121.
Andersen, C. M. and Bro, R., 2003. Practical aspects of PARAFAC modeling of fluorescence excitation-emission data. Journal of Chemometrics 17 (4), 200-215.
Cory, R. M., Miller, M. P., McKnight, D. M., Guerard, J. J. and Miller, P. L., 2010. Effect of instrument-specific response on the analysis of fulvic acid fluorescence spectra. Limnology and Oceanography-Methods 8, 67-78.
Devore, J. L., 2004. Probability and statistics for engineering and the sciences, 6, Brooks/Cole, Thomson Learning, Belmont, CA.
Do, T. D., Chimka, J. R. and Fairey, J. L., 2015. Improved (and singular) disinfectant protocol for indirectly assessing organic precursor concentrations of trihalomethanes and dihaloacetonitriles. Environmental Science & Technology 49 (16), 9858-9865.
Hudson, N., Baker, A. and Reynolds, D., 2007. Fluorescence analysis of dissolved organic matter in natural, waste and polluted waters - A review. River Research and Applications 23 (6), 631-649.
Kovtyukhova, N. I., Mallouk, T. E., Pan, L. and Dickey, E. C., 2003. Individual single-walled nanotubes and hydrogels made by oxidative exfoliation of carbon nanotube ropes. Journal of the American Chemical Society 125 (32), 9761-9769.
Kristiana, I., Lethorn, A., Joll, C. and Heitz, A., 2014. To add or not to add: The use of quenching agents for the analysis of disinfection by-products in water samples. Water Research 59, 90-98.
Kundu, S., Xia, W., Busser, W., Becker, M., Schmidt, D. A., Havenith, M. and Muhler, M., 2010. The formation of nitrogen-containing functional groups on carbon nanotube surfaces: a quantitative XPS and TPD study. Physical Chemistry Chemical Physics 12 (17), 4351-4359.
Mayer, L. M., Schick, L. L. and Loder, T. C., 1999. Dissolved protein fluorescence in two Maine estuaries. Marine Chemistry 64 (3), 171-179.
74
McKnight, D. M., Boyer, E. W., Westerhoff, P. K., Doran, P. T., Kulbe, T. and Andersen, D. T., 2001. Spectrofluorometric characterization of dissolved organic matter for indication of precursor organic material and aromaticity. Limnology and Oceanography 46 (1), 38-48.
McPhail, M. R., Sells, J. A., He, Z. and Chusuei, C. C., 2009. Charging nanowalls: adjusting the carbon nanotube isoelectric point via surface functionalization. Journal of Physical Chemistry C 113 (32), 14102-14109.
Okpalugo, T. I. T., Papakonstantinou, P., Murphy, H., McLaughlin, J. and Brown, N. M. D., 2005. High resolution XPS characterization of chemical functionalised MWCNTs and SWCNTs. Carbon 43 (1), 153-161.
Pifer, A. D. and Fairey, J. L., 2014. Suitability of organic matter surrogates to predict trihalomethane formation in drinking water sources. Environmental Engineering Science 31 (3), 117-126.
Ramanathan, T., Fisher, F. T., Ruoff, R. S. and Brinson, L. C., 2005. Amino-functionalized carbon nanotubes for binding to polymers and biological systems. Chemistry of Materials 17 (6), 1290-1295.
Shapiro, S. S. and Wilk, M. B., 1965. An analysis of variance test for normality (complete samples). Biometrika 52, 591-611.
Singh, B., Fang, Y., Cowie, B. C. C. and Thomsen, L., 2014. NEXAFS and XPS characterisation of carbon functional groups of fresh and aged biochars. Organic Geochemistry 77, 1-10.
Wang, H., Zhou, A., Peng, F., Yu, H. and Yang, J., 2007. Mechanism study on adsorption of acidified multiwalled carbon nanotubes to Pb(II). Journal of Colloid and Interface Science 316 (2), 277-283.
Yan Yan, H. and Terentjev, E. M., 2012. Dispersion of carbon nanotubes: mixing, sonication, stabilization, and composite properties. Polymers 4 (1), 275-95.
Zepp, R. G., Sheldon, W. M. and Moran, M. A., 2004. Dissolved organic fluorophores in southeastern US coastal waters: correction method for eliminating Rayleigh and Raman scattering peaks in excitation-emission matrices. Marine Chemistry 89 (1-4), 15-36.
75
Zhang, Z., Pfefferle, L. and Haller, G. L., 2014. Comparing characterization of functionalized multi-walled carbon nanotubes by potentiometric proton titration, NEXAFS, and XPS. Chinese Journal of Catalysis 35 (6), 856-863.
76
Chapter 3
Revealing a Size-Resolved Fluorescence-Based Metric to Track Oxidative Treatment of
Total N-nitrosamine Precursors in Wastewater-Derived Waters
77
Abstract
N-nitrosamines are a non-halogenated group of disinfection byproducts that form during
chloramination, particularly in drinking waters impacted by wastewater treatment plant (WWTP)
effluents. Here, we reveal a size-resolved fluorescence-based precursor surrogate to track total N-
nitrosamine formation potential (TONOFP) through oxidative treatment. Samples were collected
at seven WWTPs, at the finished effluent and prior to final disinfection (i.e., secondary effluent).
Asymmetric flow field-flow fractionation (AF4) with inline fluorescence detection at an
excitation-emission of 280/340 nm (i.e., I280/340) showed protein-rich natural organic matter
peaks between 10-445 kDa and 445-1,500 kDa. TONOFP was measured by chemiluminescence
on samples dosed with 250 mg⋅L-1-Cl2 monochloramine at pH 7 for seven days. Metrics from
AF4-I280/340 (i.e., area under the curve (AUC) and peak height) and I257/277 from whole water
excitation-emission matrices (EEMs) were leveraged in multivariate models to develop
correlations with TONOFP. The TONOFP of the finished effluent divided by that of the
secondary effluent (i.e., the TONOFP Ratio) was strongly correlated (R2 = 0.996, p = 0.000) to a
model of AUC for the 10-445 kDa peak, maximum peak height, and I257/277. This TONOFP
precursor surrogate requires 2 mL of sample and is transformational for assessing the impact of
oxidative treatments on N-nitrosamine precursor concentrations.
78
1. Introduction
Drinking water sources impacted by wastewater treatment plant (WWTP) discharges
contain natural organic matter (NOM) rich in organic nitrogen.1 Chloramination, and to a lesser
extent ozonation, chlorination, and chlorine dioxide disinfection (Sirivedhin and Gray, 2005), of
waters containing WWTP-derived NOM results in formation N-nitrosamines, a non-halogenated
group of disinfection byproducts (DBPs) (Krasner et al., 2013). Despite forming at low ng⋅L-1
levels, the high toxicity of N-nitrosamines has resulted in their consideration for regulation in
drinking water (Hrudey and Charrois, 2012). The most commonly occurring N-nitrosamine in
drinking waters is N-nitrosodimethylamine (NDMA), but studies by Mitch and colleagues have
shown that NDMA may only comprise ~5% of total N-nitrosamines (TONO) in chloramine
systems (Dai and Mitch, 2013).
Discovery of a spectroscopic surrogate for TONO precursors could be transformative for
developing treatment processes to curb N-nitrosamines. Typically, TONO measurement requires
0.5-1.0 L samples (Dai et al., 2012) and takes a week or two to perform, which limits assessment
of TONO precursor removal in lab-scale treatment processes. Similar to precursor surrogates for
trihalomethanes (TTHMs) (Pifer and Fairey, 2012) and dihaloacetonitriles (DHANs) (Do et al.,
2015), a useful surrogate would consist of spectroscopic measurement(s) on waters prior to
chloramination that strongly correlate with the TONO formation potential (TONOFP).
Preliminary work showed only moderate fluorescence-based correlations with TONOFP (R2 <
0.50) (Needham et al., 2016), but a recent study points to a possible improvement. Wang et al.
(2015) showed that the presence of humics led to underestimation of proteins (35-52%) due to
fluorescence quenching. This is notable because protein-like fluorophores are a likely source of
TONO precursors (Krasner et al., 2013; Liao et al., 2014; Needham et al., 2016).
79
To quantify the true (i.e., unquenched) proteins, Wang et al. (2015) recommended
separating the humic- and protein-like fractions by exploiting differences in their size
distributions. As proteins are larger in molecular weight than humics, size-based separation prior
to fluorescence measurement could facilitate more accurate assessments of protein-like
fluorophores. Asymmetric flow field-flow fractionation (AF4) is a flow driven separation
technology that has been used to measure NOM size distributions and requires no sample pre-
concentration and low sample volumes (~0.5 mL) (Pifer et al., 2011). AF4 hyphenated with
inline fluorescence detection (FLD) can potentially characterize protein-like fluorophores
following separation from interfering humics, but no studies to which the authors are aware have
employed this technique for assessing TONO precursors.
The objective of this study is to leverage AF4-based metrics of protein-like fluorophores
to develop a TONO precursor surrogate. AF4-FLD fractograms were collected on WWTP
effluents before and after oxidative treatments and lake waters with moderately high specific
ultraviolet absorbance (SUVA) (Weishaar et al., 2003). Following chloramination of these
samples, TONOFP was measured by chemiluminescence and correlations were sought using
single and multiple regression. The resultant TONO precursor surrogate can be leveraged to
assess the impact of oxidative treatments of N-nitrosamine precursor concentrations.
2. Materials and Methods
2.1. Sample Description and Water Quality Measurements
Fourteen sample waters were collected from seven WWTPs, from each plant effluent
(called finished effluent) and prior to the final disinfection process (called secondary effluent),
which included UV, ozonation, and chlorination. Lake waters were collected during the peak
algal growing season from six lakes as algal organic matter is a known TONO precursor (Dai
80
and Mitch, 2013). Details regarding the sample waters are provided in Table 1. Sample waters
were filtered with 0.45-μm polyethersulfone (PES) membranes pre-rinsed with 500 mL of Milli-
Q water and stored in low-density polyethylene carboys at 4°C in the dark prior to use. Raw
water characteristics were measured upon collection and are summarized in Tables 1, S1, and S2.
Fluorescence excitation-emission matrices (EEMs) and water quality parameters were measured
following Needham et al. (2016), with the exception of TDN, which is detailed in the SI.
Dissolved organic nitrogen (DON) was calculated as the difference in between TDN and
inorganic nitrogen (Table 1).
2.2. Experimental Procedures
2.2.1. DBPFP
DBP formation potential (DBPFP) was measured using the protocol developed by Do et
al. (2015), which was modified from Standard Methods 5710-B and D (Pifer and Fairey, 2012),
with a monochloramine dose of 250 mg⋅L-1 as Cl2 at pH 7. TTHMFP and DHANFP were
measured by gas chromatography with an electron capture detector to test the assumption that the
AF4-FLD metrics were most applicable to TONOFP. While formation potential tests at pH 7
may not maximize formation of NDMA (Schreiber and Mitch, 2006), it was selected to achieve
quantifiable concentrations of TONO while not incurring base-catalyzed destruction of DHAN
(Hua and Reckhow, 2012), which would inhibit assessment of these precursors (Do et al., 2015).
TONO analysis is preceded by solid phase extraction (SPE), modified from EPA Method 521,
and adapted from Needham et al. (2016) by acidifying samples to pH 2 using sulfamic acid (Dai
et al., 2012). An Eco Physics CLD 88sp chemiluminescence NO detector is used to quantify
TONO, following the approach detailed by Mitch and Dai (2012). As some TONO can exist in
81
WWTP samples prior to formation potential tests, TONO measurements were made on
secondary and finished effluent samples prior to chloramination.
2.2.2. AF4-FLD Fractograms
AF4-FLD fractograms were collected with a Postnova Analytics AF2000-MT AF4
system hyphenated with a dual monochromator fluorescence detector (Agilent Technologies). A
0.01 mM phosphate buffer at pH 7 was used as the system eluent. The AF4 separation channel
was backed with a 10 kDa regenerated cellulose membrane and had a length of 27.4 cm and its
width tapered from 2.0 cm near the inlet to 0.7 cm at the outlet. An autosampler was used to
inject 0.5 mL of pre-filtered sample water (0.45 µm PES) onto the membrane. The AF4 method
developed utilizes a combination of slot flow and high cross flow (Table S4). For the AF4
fractograms, fluorescence was measured at an excitation of 280 nm and a scan of emissions
wavelengths between 305-500 nm at 5 nm step sizes to target wavelengths associated with
protein-like fluorophores (Hudson et al., 2007). The fluorescence intensity excitation-emission
wavelength pair chosen for fractograms was 280 and 340 nm, respectively (i.e., I280/340), to
maximize the signal to noise ratio. Fractogram x-axes were converted from elution time to
molecular weight using a standard curve generated from measurements of polystyrene sulfonate
(PSS) standards ranging from 30- to 1,000 kDa (Figure S1). The standard curve was applied to
samples through an elution time of 25 minutes when the cross flow transitions to zero, after
which the molecular weight is no longer quantifiable. PSS standards with molecular weights of
2,000- and 3,200 kDa were also measured, but did not elute until after the cross flow ceased and
were not incorporated into the standard curve. They do, however, illustrate that this non-
quantifiable fraction is likely comprised of high molecular weight compounds (i.e., above 1,500
kDa).
82
2.3. AF4-FLD Processing
AF4-FLD fractograms were analyzed to develop variables to be assessed as TONO
precursor surrogates. Fractograms were divided into three sections beginning at an elution time
of 8.50 minutes, which corresponds to the end of the void peak. Section 1 covers 8.50 to 14.88
minutes of elution time, with the latter corresponding to a local minimum calculated as the
average of the elution times of the local minima of all fractograms. Section 2 covers 14.88 to 25
minutes, and Section 3 is the unquantifiable peak from 25 minutes through the end of the run.
The area under the curve (AUC) within the three sections was calculated as the variables AUC1,
AUC2, and AUC3. Additionally, the variable Max represents the maximum peak height in
Sections 1 and 2 taken together. Exploration of the maximum peak height in the individual
sections is included in the SI. An additional variable, Intensity, was utilized that originated from
the EEMs of the unfractionated samples. Specifically, the fluorescence intensity at all
wavelengths pairs was correlated to TONOFP to determine the point of maximum R2, which for
TONO was I225/301. However, the independent variable Intensity was chosen as I225/310 for TONO,
which was the closest pair to I225/301 that fell within previously reported ranges for nitrosamine
precursors (Hudson et al., 2007). This Intensity value was used to determine which multivariate
models showed promise, as detailed in Section 2.4. After significant models were identified, the
models were recalculated with each of the 57,750 wavelength pairs measured in the EEMs to
determine the best model. The wavelength pair corresponding to the best model is referred to as
Intensity*. Values of AUC1-3, Max, Intensity, and Intensity* for TONO are provided in Table S5
and discussion of Intensity and Intensity* for TTHM and DHAN are included in the SI.
2.4. Model Development
83
To assess correlations between TONOFP and AF4-FLD variables, several statistical
models were developed. Models were also developed to explore correlations to TTHMFP and
DHANFP and are detailed in the SI. Simple linear regression models were developed between
TONOFP and each of the AF4-FLD variables and DON. Multiple regression models were
formulated using combinations of AUC1-3, Max, Intensity, and DON. For all models,
independent variables were assumed to be nonzero and significant if their coefficients had p-
values less than 0.05. All R2 values presented are adjusted for the number of independent
variables to fairly compare models with differing numbers of variables (Montgomery, 2013).
Additionally, all model types were explored for their suitability to predict the impact of oxidative
treatment (i.e., chlorination, ozonation, and UV treatment) on DBPFP. Using only samples from
WWTPs, DBPFP Ratios were generated as the formation potential of the finished effluent
sample divided by that of the secondary effluent sample for each plant. These ratios indicate the
change in DBP precursors from oxidative treatment (n = 7). Similarly, ratios were calculated for
the independent variables from AF4-FLD, fluorescence EEMs, and water quality parameters,
which included AUC1-3, Max, Intensity, and DON. For example, AUC1 Ratio is the value of
AUC1 for the finished effluent of a given WWTP divided by the AUC1 of the secondary effluent
sample from the same plant, as shown in Figure S2.
3. Results and Discussion
3.1. AF4-FLD
Figure 1 shows AF4-FLD fractograms (at I280/340) for WWTP samples from the secondary
effluent and finished effluent. Lake water samples are shown in Figure S3C. The AF4-FLD
fractograms had peaks at approximately 11-, 20-, and 31 minutes, although precise peak maxima
locations varied amongst the samples. Using Figure S1, the first peak corresponds to 10-445 kDa,
84
the second peak to 445-1,500 kDa, and the final peak is unquantifiable but likely corresponds to
NOM larger than 1,500 kDa. For most of the WWTP samples, the intensity of these peaks
decreased following disinfection, indicating partial oxidation or removal of these NOM fractions.
However, in a few cases (i.e., Section 1 in Figure 1B, Sections 1-3 in Figure 1C, and Section 2 in
Figure 1F), peak heights increased following disinfection, possibly due to physical breakdown of
larger NOM (i.e., oxidation of material in Section 3 forming material in Section 1). The impact
of the oxidative treatments on TONOFP is explored in subsequent sections.
3.2. Model Development
Models were first generated for the entire data set of TONOFP values (Table 1, n = 20).
Neither simple linear or multivariate models produced strong correlations between TONOFP and
AF4-FLD metrics or DON, with the strongest linear correlation being to AUC1 (adjusted R2 =
0.22). A maximum adjusted R2 of 0.36 was obtained between TONOFP and Intensity (I225/310),
which was not an improvement over similar models in Needham et al. (2016).
Cursory comparison of TONOFP (Table 1) and AUC1 (Table S5) indicated three of the
four WWTPs utilizing UV disinfection had higher TONOFP in finished effluent samples
compared to the secondary effluent samples, two of which were mirrored by similar responses in
AUC1. This indicates that UV disinfection can generate TONO precursors, similar to the
findings of Dai et al. (2015), particularly with the presence of coagulant aid polymers (McCurry
et al., 2015). DON Ratio was not found to be significant in any multivariate models. While poor
correlations were observed between TONOFP and AUC1 in models comparing these values
directly, notable correlations emerge in models between TONOFP Ratio (i.e., TONOFP of the
finished effluent sample divided by that of the secondary effluent sample) and ratios of AF4-
FLD metrics and Intensity (Figure 2). Intensity in the TONOFP Ratio models corresponds to
85
I225/310, which falls in the region associated with protein-like fluorophores (Hudson et al., 2007).
Simple linear regression between TONOFP Ratio and AUC1 Ratio yields an adjusted R2 of 0.565
(Figure 2A). A multivariate model for AUC1 Ratio and Max Ratio (Figure 2B) has an adjusted
R2 of 0.847 and for AUC1-, Max-, and Intensity Ratio (Figure 2C) the adjusted R2 is 0.983. The
p-value of this model is 0.0008 indicating that the model is significant. A model of AUC1-, Max-,
and Intensity Ratio was further refined using each of the available 57,750 wavelength pairs in
each EEM for Intensity Ratio. The best-fitting correlation coefficient corresponded to I257/277,
with an adjusted R2 value of 0.996 (Figure 2D). While this pair is outside the range typically
reported for protein-like fluorophores, it is most closely adjacent to a subset of proteins,
specifically tryptophan-like fluorophores.(Coble, 1996) The distribution of data indicates the
model can predict TONOFP Ratios spanning from 0.136 to 1.701, encompassing both
destruction and formation of TONO precursors from oxidative treatment. Another test of the
model’s robustness was an inquiry into the influence of individual observations, which indicated
no single observation held undue influence on the model as a whole and is discussed further in
the SI. Further, as strong correlations were only found for models of TONOFP Ratio rather than
discrete values of TONOFP, the model cannot be utilized to predict individual values of
TONOFP, but rather can be leveraged to predict the effect of oxidative treatment on TONO
precursor concentrations.
To give further insight into the nature of the precursor surrogate, TONO was measured
on the WWTP samples prior to chloramination (Table S3). These data indicate background
TONO was present at concentrations ranging from 89-192 ng�L as NDMA, which comprised 7-
54% of the TONO measured following the DBPFP tests. However, no significant models were
generated excluding the background TONO (see details in the SI). This, coupled with the
86
strength of the models in which TONOFP Ratios were calculated including the background
TONO (Figure 2), suggests that the independent variables in the model likely characterize the
background TONO in addition to the protein-like TONO precursors that subsequently reacted
with chloramines in the DBPFP tests. As such, it is likely that the background TONO affected
the fluorescence-based metrics, a topic that should be studied systematically in future work.
The AF4-FLD method developed here is suitable for the separation and characterization
of protein-like fluorophores in samples from WWTPs and lake waters with moderately high
SUVA values. Following transformation of the data to indicate changes produced by oxidative
treatment, multivariate analysis revealed a strong size-resolved fluorescence-based TONO
precursor surrogate. With an adjusted R2 of 0.996, a combination of AF4-FLD metrics (AUC1
and Max) and fluorescence EEMs (I257/277) can predict TONOFP ratios across a wide range in
which TONO precursors were both created and destroyed.
3.3. Implications
As the fluorescence metrics require just 2 mL of sample, this TONO precursor surrogate
could be leveraged to develop treatment processes to assess N-nitrosamine precursor
concentrations. Upcoming studies include evaluation of this surrogate to assess other TONO
precursor removal processes (i.e. sorption) and characterization of the chemical moieties within
the 10-445 kDa and 445-1,500 kDa peaks. The novel AF4-FLD method could provide insights
into the nature of protein-rich NOM relevant to other areas of environmental science, including
membrane fouling and biofilm soluble microbial products.
87
4. Associated Content
Notes
The authors declare no competing financial interest.
Acknowledgements
Financial support from the National Science Foundation (CBET #1254350 to JLF) and the
University of Arkansas Doctoral Academy Fellowship (to EMN) is gratefully acknowledged.
The authors acknowledge Erik Pollock of the University of Arkansas Stable Isotopes Lab for
running the total nitrogen samples.
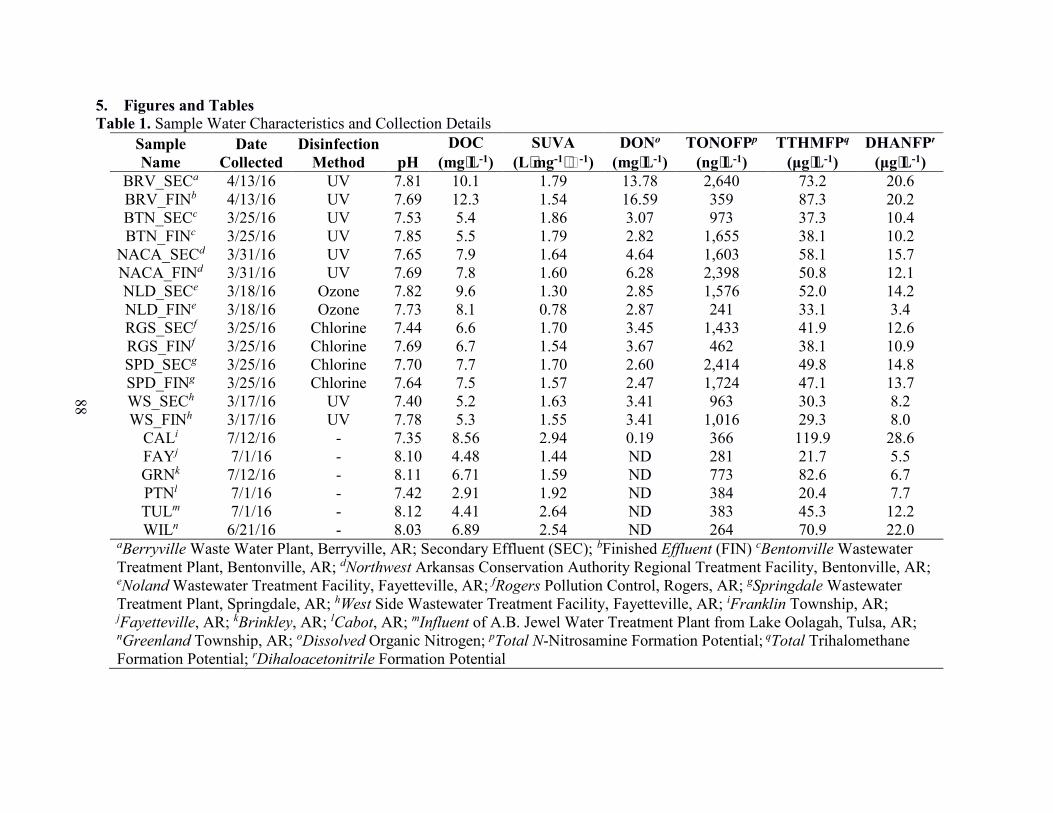
88
5. Figures and Tables
Table 1. Sample Water Characteristics and Collection Details
Sample
Name
Date
Collected
Disinfection
Method pH
DOC
(mg⋅L-1)
SUVA
(L⋅mg-1⋅-1)
DONo
(mg⋅L-1)
TONOFPp
(ng⋅L-1)
TTHMFPq
(μg⋅L-1)
DHANFPr
(μg⋅L-1)
BRV_SECa 4/13/16 UV 7.81 10.1 1.79 13.78 2,640 73.2 20.6 BRV_FINb 4/13/16 UV 7.69 12.3 1.54 16.59 359 87.3 20.2 BTN_SECc 3/25/16 UV 7.53 5.4 1.86 3.07 973 37.3 10.4 BTN_FINc 3/25/16 UV 7.85 5.5 1.79 2.82 1,655 38.1 10.2
NACA_SECd 3/31/16 UV 7.65 7.9 1.64 4.64 1,603 58.1 15.7 NACA_FINd 3/31/16 UV 7.69 7.8 1.60 6.28 2,398 50.8 12.1 NLD_SECe 3/18/16 Ozone 7.82 9.6 1.30 2.85 1,576 52.0 14.2 NLD_FINe 3/18/16 Ozone 7.73 8.1 0.78 2.87 241 33.1 3.4 RGS_SECf 3/25/16 Chlorine 7.44 6.6 1.70 3.45 1,433 41.9 12.6 RGS_FINf 3/25/16 Chlorine 7.69 6.7 1.54 3.67 462 38.1 10.9 SPD_SECg 3/25/16 Chlorine 7.70 7.7 1.70 2.60 2,414 49.8 14.8 SPD_FINg 3/25/16 Chlorine 7.64 7.5 1.57 2.47 1,724 47.1 13.7 WS_SECh 3/17/16 UV 7.40 5.2 1.63 3.41 963 30.3 8.2 WS_FINh 3/17/16 UV 7.78 5.3 1.55 3.41 1,016 29.3 8.0
CALi 7/12/16 - 7.35 8.56 2.94 0.19 366 119.9 28.6 FAYj 7/1/16 - 8.10 4.48 1.44 ND 281 21.7 5.5 GRNk 7/12/16 - 8.11 6.71 1.59 ND 773 82.6 6.7 PTNl 7/1/16 - 7.42 2.91 1.92 ND 384 20.4 7.7 TULm 7/1/16 - 8.12 4.41 2.64 ND 383 45.3 12.2 WILn 6/21/16 - 8.03 6.89 2.54 ND 264 70.9 22.0
aBerryville Waste Water Plant, Berryville, AR; Secondary Effluent (SEC); bFinished Effluent (FIN) cBentonville Wastewater Treatment Plant, Bentonville, AR; dNorthwest Arkansas Conservation Authority Regional Treatment Facility, Bentonville, AR; eNoland Wastewater Treatment Facility, Fayetteville, AR; fRogers Pollution Control, Rogers, AR; gSpringdale Wastewater Treatment Plant, Springdale, AR; hWest Side Wastewater Treatment Facility, Fayetteville, AR; iFranklin Township, AR; jFayetteville, AR; kBrinkley, AR; lCabot, AR; mInfluent of A.B. Jewel Water Treatment Plant from Lake Oolagah, Tulsa, AR; nGreenland Township, AR; oDissolved Organic Nitrogen; pTotal N-Nitrosamine Formation Potential; qTotal Trihalomethane Formation Potential; rDihaloacetonitrile Formation Potential
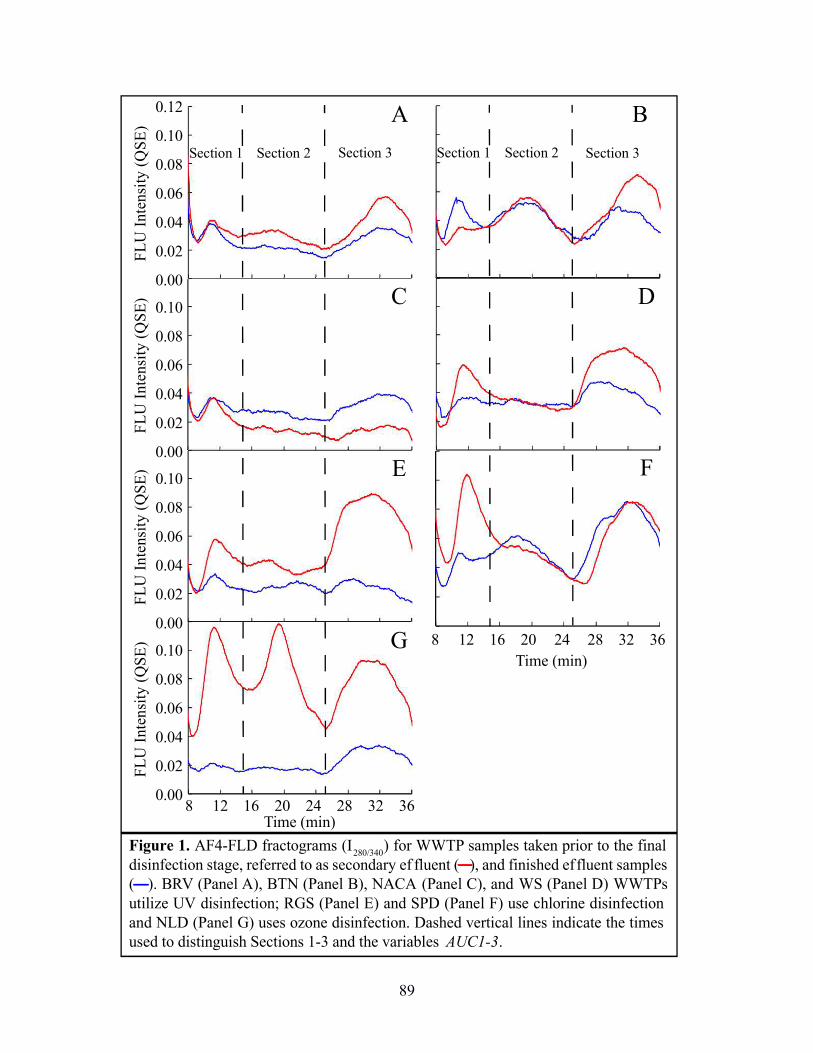
89
8 12 16 20 24 28 32 36
8 12 16 20 24 28 32 36
Time (min)
Time (min)
0.12
0.10
0.08
0.06
0.04
0.02
0.00
0.10
0.08
0.06
0.04
0.02
0.00
FL
U I
nte
nsi
ty (
QS
E)
FL
U I
nte
nsi
ty (
QS
E)
FL
U I
nte
nsi
ty (
QS
E)
FL
U I
nte
nsi
ty (
QS
E)
A B
C D
E F
G
Section 1 Section 2 Section 3 Section 1 Section 2 Section 3
Figure 1. AF4-FLD fractograms (I280/340
) for WWTP samples taken prior to the final
disinfection stage, referred to as secondary ef fluent ( ), and finished effluent samples
( ). BRV (Panel A), BTN (Panel B), NACA (Panel C), and WS (Panel D) WWTPs
utilize UV disinfection; RGS (Panel E) and SPD (Panel F) use chlorine disinfection
and NLD (Panel G) uses ozone disinfection. Dashed vertical lines indicate the times
used to distinguish Sections 1-3 and the variables AUC1-3.
0.10
0.08
0.06
0.04
0.02
0.00
0.10
0.08
0.06
0.04
0.02
0.00
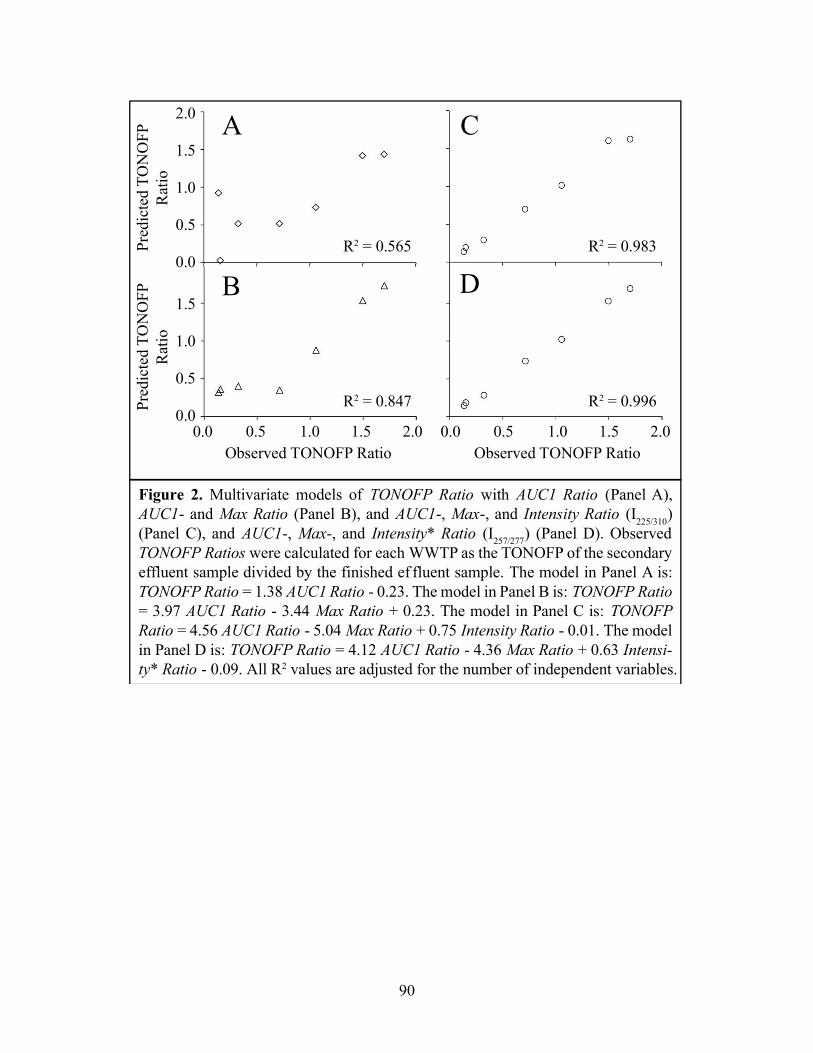
90
0.0 0.5 1.0 1.5 2.0
Observed TONOFP Ratio
2.0
1.5
1.0
0.5
0.0R2 = 0.565
R2 = 0.847
R2 = 0.983
A
B
CP
red
icte
d T
ON
OF
P
Rat
io
R2 = 0.996
D
Pre
dic
ted
TO
NO
FP
Rat
io
1.5
1.0
0.5
0.0
Figure 2. Multivariate models of TONOFP Ratio with AUC1 Ratio (Panel A),
AUC1- and Max Ratio (Panel B), and AUC1-, Max-, and Intensity Ratio (I225/310
)
(Panel C), and AUC1-, Max-, and Intensity* Ratio (I257/277
) (Panel D). Observed
TONOFP Ratios were calculated for each WWTP as the TONOFP of the secondary
effluent sample divided by the finished ef fluent sample. The model in Panel A is:
TONOFP Ratio = 1.38 AUC1 Ratio - 0.23. The model in Panel B is: TONOFP Ratio
= 3.97 AUC1 Ratio - 3.44 Max Ratio + 0.23. The model in Panel C is: TONOFP
Ratio = 4.56 AUC1 Ratio - 5.04 Max Ratio + 0.75 Intensity Ratio - 0.01. The model
in Panel D is: TONOFP Ratio = 4.12 AUC1 Ratio - 4.36 Max Ratio + 0.63 Intensi-
ty* Ratio - 0.09. All R2 values are adjusted for the number of independent variables.
0.0 0.5 1.0 1.5 2.0
Observed TONOFP Ratio
91
6. References
Coble, P. G., 1996. Characterization of marine and terrestrial DOM in seawater using excitation emission matrix spectroscopy. Marine Chemistry 51 (4), 325-346.
Dai, N. and Mitch, W. A., 2013. Relative importance of N-nitrosodimethylamine compared to total N-nitrosamines in drinking waters. Environmental Science & Technology 47 (8), 3648-3656.
Dai, N., Shah, A. D., Hu, L. H., Plewa, M. J., McKague, B. and Mitch, W. A., 2012. Measurement of Nitrosamine and Nitramine Formation from NO Reactions with Amines during Amine-Based Carbon Dioxide Capture for Postcombustion Carbon Sequestration. Environmental Science & Technology 46 (17), 9793-9801.
Dai, N., Zeng, T. and Mitch, W. A., 2015. Predicting N-Nitrosamines: N-Nitrosodiethanolamine as a Significant Component of Total N-Nitrosamines in Recycled Wastewater. Environmental Science & Technology Letters 2 (3), 54-58.
Do, T. D., Chimka, J. R. and Fairey, J. L., 2015. Improved (and singular) disinfectant protocol for indirectly assessing organic precursor concentrations of trihalomethanes and dihaloacetonitriles. Environmental Science & Technology 49 (16), 9858-9865.
Hrudey, S. E. and Charrois, J. W. A., Eds. (2012). Disinfection by-products and human health. IWA Publishing and Australian Water Association, London.
Hua, G. H. and Reckhow, D. A., 2012. Evaluation of bromine substitution factors of DBPs during chlorination and chloramination. Water Research 46 (13), 4208-4216.
Hudson, N., Baker, A. and Reynolds, D., 2007. Fluorescence analysis of dissolved organic matter in natural, waste and polluted waters - A review. River Research and Applications 23 (6), 631-649.
Krasner, S. W., Mitch, W. A., McCurry, D. L., Hanigan, D. and Westerhoff, P., 2013. Formation, precursors, control, and occurrence of nitrosamines in drinking water: A review. Water Research 47 (13), 4433-4450.
Liao, X. B., Wang, C. K., Wang, J., Zhang, X. J., Chen, C., Krasner, S. W. and Suffet, I. H., 2014. Nitrosamine precursor and DOM control in effluent-affected drinking water. Journal American Water Works Association 106 (7), 81-82.
92
McCurry, D. L., Krasner, S. W., von Gunten, U. and Mitch, W. A., 2015. Determinants of disinfectant pretreatment efficacy for nitrosamine control in chloraminated drinking water. Water Research 84, 161-170.
Mitch, W. A. and Dai, N. (2012). Water Research Foundation Report #4209: Development and application of a total nitrosamine assay for disinfected waters, Water Research Foundation.
Montgomery, D. C., 2013. Applied Statistics and Probability for Engineers, 6th Edition, John Wiley & Sons.
Needham, E. M., Sidney, S. M., Chimka, J. R. and Fairey, J. L., 2016. Trihalomethane, dihaloacetonitrile, and total N-nitrosamine precursor adsorption by carbon nanotubes: the importance of surface oxides and pore volume. Environmental Science-Water Research & Technology 2 (6), 1004-1013.
Pifer, A. D. and Fairey, J. L., 2012. Improving on SUVA254 using fluorescence-PARAFAC analysis and asymmetric flow-field flow fractionation for assessing disinfection byproduct formation and control. Water Research 46 (9), 2927-2936.
Pifer, A. D., Miskin, D. R., Cousins, S. L. and Fairey, J. L., 2011. Coupling asymmetric flow-field flow fractionation and fluorescence parallel factor analysis reveals stratification of dissolved organic matter in a drinking water reservoir. Journal of Chromatography A 1218 (27), 4167-4178.
Schreiber, I. M. and Mitch, W. A., 2006. Nitrosamine formation pathway revisited: The importance of chloramine speciation and dissolved oxygen. Environmental Science & Technology 40 (19), 6007-6014.
Sirivedhin, T. and Gray, K. A., 2005. 2. Comparison of the disinfection by-product formation potentials between a wastewater effluent and surface waters. Water Research 39 (6), 1025-1036.
Wang, Z. G., Cao, J. and Meng, F. G., 2015. Interactions between protein-like and humic-like components in dissolved organic matter revealed by fluorescence quenching. Water Research 68, 404-413.
Weishaar, J. L., Aiken, G. R., Bergamaschi, B. A., Fram, M. S., Fujii, R. and Mopper, K., 2003. Evaluation of specific ultraviolet absorbance as an indicator of the chemical composition

93
and reactivity of dissolved organic carbon. Environmental Science & Technology 37 (20), 4702-4708
94
Appendix 2
Supplementary Information for
“Revealing a Size-Resolved Fluorescence-Based Metric to Track Oxidative Treatment of Total
N-nitrosamine Precursors in Wastewater-Derived Waters”
95
List of Supporting Information
Dissolved Organic Nitrogen Method and Calculations
Fractogram Peak Maxima
Models of TTHMFP and DHANFP
Background TONO
Influence of Individual Observations
TONOFP Method Development
Table S1. Raw Water Anion and Cation Concentrations
Table S2. Total Dissolved Nitrogen
Table S3. TONO in WWTP Samples Prior to Formation Potential Tests
Table S4. AF4 Method Details
Figure S1. AF4-FLD Standard Curve
Table S5. Raw Data for Variables in Model of TONOFP Ratio
Figure S2. Derivation of Variables from AF4-FLD Fractograms and Fluorescence EEMs
Figure S2. AF4-FLD Fractograms for All Samples
Table S6. Multivariate Models of TONOFP-, TTHMFP-, and DHANFP Ratio
Table S7. Influence of Observations
Figure S3. SPE Standard Curves
Figure S4. TONO Reaction Chamber Degradation
96
Dissolved Organic Nitrogen Method and Calculations
Total dissolved nitrogen (TDN) was measured using a Shimadzu TOC/TN analyzer with
a 6-point standard curve and is given in Table S2. Dissolved organic nitrogen was calculated as
the difference between the measured TDN and the sum of nitrate, nitrite, and ammonium
expressed as mg•L-1 as N (Table S1) and is reported in Table 1.
Fractogram Peak Maxima
The variable Max utilized in the significant model of TONOFP Ratio against AUC1-,
Max-, and Intensity Ratio is derived from the maximum peak height of Sections 1 and 2 of the
AF4-FLD fractograms. The variables AUC1-3 are specific to Sections 1-3, but Max is calculated
from the range of Sections 1 and 2 together. The variables Max1 Ratio and Max2 Ratio were also
calculated as the maximum peak height in Sections 1 and 2, respectively. These variables were
used in place of Max Ratio in the same model with three independent variables that was
previously significant. However, the inclusion of either Max1 Ratio or Max2 Ratio made all of
the variables in the model insignificant and the adjusted R2 values drop from 0.988 to 0.339 and
0.352, respectively.
Models of TTHMFP and DHANFP
Similarly to the determination of Intensity for TONOFP, initial wavelength pairs were
determined based on simple linear correlations between TTHMFP or DHANFP and fluorescence
EEMs. For TTHMFP, the best linear correlations existed at I226/421 and the best correlations for
DHANFP were at I227/592, both of which are similar to values found in the literature (Hudson et
al., 2007). Using these Intensity values for TTHMFP and DHANFP, no multivariate models
could be developed in which all independent variables were significant (Table S6). Maximum
linear correlations to AF4-FLD metrics for TTHMFP (adjusted R2 = -0.05) and DHANFP
97
(adjusted R2 = -0.03) were also weak. This is an expected result given that protein-like
fluorophores (i.e., those characterized by the AF4-FLD technique employed in this study) are not
likely precursors of TTHMs and DHANs. Rather, humic substances are widely considered to be
precursors of these groups of DBPs, which have been shown to be approximately 0.1-8 kDa in
size (Her et al., 2002). This range is smaller than the pore size of the 10 kDa regenerated
cellulose membrane used for AF4 separation and the size range for AUC1 (10-445 kDa), one of
the significant variables in the TONOFP Ratio model. As such, it is likely that the weak
correlation coefficients with TTHMFP and DHANFP indicate that the AF4 method is not
measuring the humic-like precursors of these DBP types, but only the larger protein-like
precursors of TONO. The data analysis method described in Section 2.3, in which models
including EEM intensity are generated for each of the 57,750 wavelength pairs, was also applied
to models of TTHMFP Ratio and DHANFP Ratio. In single variable models of DBPFP Ratio
against all Intensity values, the best correlation was I226/596 for TTHMFP Ratio and I225/531 for
DHANFP Ratio. These models had adjusted R2 values of 0.899 and 0.990, respectively. If
variables such as AUC1 Ratio and Max Ratio (as are used in the best multivariate model of
TONOFP Ratio) are applied to models of TTHMFP- and DHANFP Ratio, the adjusted R2 values
can be improved to 0.990 and 0.998, respectively. However, the modest improvement on already
strong models confirms the previous assumption that the AF4-FLD method is not likely relevant
to precursors of TTHMs and DHANs.
Background TONO
TONO in WWTP samples was measured prior to the formation potential tests (referred to
as background TONO) and following chloramination (referred to as TONOFP in Table 1, but
these values include the background TONO) by solid phase extraction (SPE) and
98
chemiluminescence detection (Table S3). The background TONO was subtracted out to
determine the amount of TONO that formed from chloramination in the formation potential tests
(referred to as the adjusted TONOFP). Additional models were generated with these adjusted
TONOFP values; the models used the same values of A1 Ratio, Max Ratio, and Intensity Ratio.
A model of Adjusted TONOFP Ratio against only A1 Ratio had an adjusted R2 value of -0.058.
When Adjusted TONOFP Ratio was modeled against A1 Ratio and Max Ratio, the adjusted R2
value was -0.222. Finally, a model of A1-, Max-, and Intensity Ratio against Adjusted TONOFP
Ratio yielded an adjusted R2 value of -0.291. The correlation coefficients of the same variables
modeled against TONOFP Ratio (rather than Adjusted TONOFP Ratio) yielded adjusted R2
values of 0.565, 0.847, and 0.983, respectively. Ultimately, there is no correlation between the
AF4-FLD and fluorescence EEM metrics and the TONOFP when the background TONO in the
samples is corrected for and excellent correlations exist when values of TONOFP include
background TONO and TONO formed during formation potential tests. This indicates that it is
likely that the independent variables in the model incorporate information about both the TONO
precursors and the background N-nitrosamines in the untreated water.
Influence of Individual Observations
To test the robustness of the model of TONOFP Ratio against AUC1-, Max-, and
Intensity Ratio, the data set was manipulated by removing the observations from each WWTP
one at a time and observing the effect on the correlation coefficient and significance of the model.
This process was conducted for models of TONO, TTHM, and DHAN and the results are given
in Table S8. The intent of the test is to observe changes in the model resulting from the removal
of a given observation and determine if that observation has comparatively more influence than
the other six observations. For the model of TONO, the adjusted R2 is 0.983 when using all
99
seven observations and ranges from 0.983-0.996 when each of the points is removed from the
data set. Similarly, the p-value is initially 0.0008 and ranges from 0.0027-0.0102 during the test.
For comparison, the model of TTHM has an initial adjusted R2 value of 0.680, but ranges from
0.007 to 0.950 if select points are removed. Similarly, the model of DHAN varies from its initial
adjusted R2 of 0.810 to a range of -0.254 to 0.994. In essence, the models of TTHM and DHAN
show large variation when only one observation is removed, in contrast to the small variations
observed in the model for TONO.
TONOFP Method Development
Published studies involving TONO measurements do not fully address the issues of
sample injection volume and reaction chamber degradation. In cases where the maximum
injection volumes are provided (Mitch and Dai, 2012), they are not accompanied by a fulsome
explanation as to why certain volumes were selected. Similarly, degradation of the reaction
chamber sensitivity over time and due to sample injection volume is also not discussed in detail.
Additionally, TONO standard curves are not prepared in the same manner as samples, but
instead injected directly into the reaction chamber without first being subjected to the SPE
process.
The first step to address these issues was to develop a method for running NDMA
standards through the same SPE process as unknown samples. Standards consisting of NDMA
were diluted in 500 mL volumes of water (i.e., the same used for unknown samples) and
analyzed using the process described in Needham et al. (2016). Figure S4 shows six standard
curves generated from the SPE-TONO procedure, which were used in six different TONO runs.
The differences between each standard curve in Figure S4 were attributed to differing reaction
chamber compositions, but all had strong linear relationships as indicated by the high R2 values
100
(R2 > 0.98). Subjecting standards to the SPE process is preferred for future TONO analyses due
to the variation amongst these standard curves.
Experience with the TONO reaction chamber shows that the detector response decreases
with increasing cumulative injection volume. Additionally, the resultant concentrations can vary
with changes in the injection volumes, which is undesirable for unknown samples. Based on
injections of identical masses of NDMA using varying injection volumes, an ideal range of
injection volumes was identified (50-200 μL), which balances the needs to achieve adequate
NDMA recovery while minimizing disturbances to the detector baseline or changes in peak
width. To account for degradation of the reaction chamber, standards that have undergone the
SPE process are impractical given the time and resource requirements needed. Instead, direct
inject (D-Inj) standards were used, in which NDMA standards prepared in methanol were
pretreated with 20 g⋅L-1 mercuric chloride in Milli-Q water and 50 g⋅L-1 sulfanilamide in 1 N
HCl and injected directly into the TONO reaction chamber without going through the SPE
process. A TONO run was conducted with alternating 100 μL injections of standards subjected to
SPE and D-Inj standards of similar mass (Figure S5). Detector response appears roughly constant
for both D-Inj and SPE standards until a cumulative injection volume of approximately 900 μL.
Thereafter, the response of both standards decreases linearly through the end of the run. Based
on preliminary data, recent TONO measurements included D-Inj standard injections at the
beginning of each run, after the standard curve, and at the end of each run. These data indicate a
similar phenomenon that is reminiscent of a piecewise mathematical function. While the slopes
of the decreasing portions of each data set in Figure S5 are not equal, their similarity allows for
some correction for detector response degradation using periodic D-Inj standards throughout
TONO runs. This method is preferable to the use of SPE standards due to the time and labor
101
required to obtain them. While imperfect, this method was deemed an appropriate signal
adjustment technique, in contrast to an assumption that chamber degradation does not occur, and
was adopted for use before and after the standard curve and after the unknown samples in the run,
to allow the sample concentrations to be corrected for the degradation of the TONO reaction
chamber.
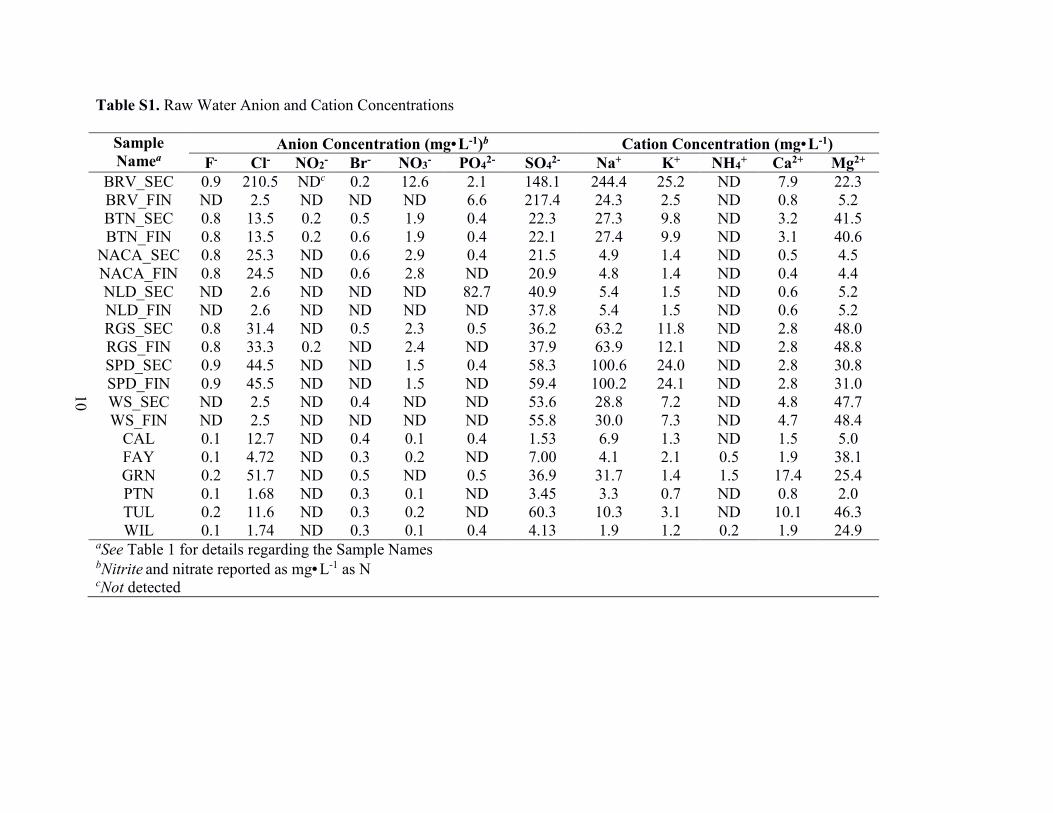
10
Table S1. Raw Water Anion and Cation Concentrations
Sample
Namea Anion Concentration (mg•L-1)b Cation Concentration (mg•L-1)
F- Cl- NO2- Br- NO3
- PO42- SO4
2- Na+ K+ NH4+ Ca2+ Mg2+
BRV_SEC 0.9 210.5 NDc 0.2 12.6 2.1 148.1 244.4 25.2 ND 7.9 22.3 BRV_FIN ND 2.5 ND ND ND 6.6 217.4 24.3 2.5 ND 0.8 5.2 BTN_SEC 0.8 13.5 0.2 0.5 1.9 0.4 22.3 27.3 9.8 ND 3.2 41.5 BTN_FIN 0.8 13.5 0.2 0.6 1.9 0.4 22.1 27.4 9.9 ND 3.1 40.6
NACA_SEC 0.8 25.3 ND 0.6 2.9 0.4 21.5 4.9 1.4 ND 0.5 4.5 NACA_FIN 0.8 24.5 ND 0.6 2.8 ND 20.9 4.8 1.4 ND 0.4 4.4 NLD_SEC ND 2.6 ND ND ND 82.7 40.9 5.4 1.5 ND 0.6 5.2 NLD_FIN ND 2.6 ND ND ND ND 37.8 5.4 1.5 ND 0.6 5.2 RGS_SEC 0.8 31.4 ND 0.5 2.3 0.5 36.2 63.2 11.8 ND 2.8 48.0 RGS_FIN 0.8 33.3 0.2 ND 2.4 ND 37.9 63.9 12.1 ND 2.8 48.8 SPD_SEC 0.9 44.5 ND ND 1.5 0.4 58.3 100.6 24.0 ND 2.8 30.8 SPD_FIN 0.9 45.5 ND ND 1.5 ND 59.4 100.2 24.1 ND 2.8 31.0 WS_SEC ND 2.5 ND 0.4 ND ND 53.6 28.8 7.2 ND 4.8 47.7 WS_FIN ND 2.5 ND ND ND ND 55.8 30.0 7.3 ND 4.7 48.4
CAL 0.1 12.7 ND 0.4 0.1 0.4 1.53 6.9 1.3 ND 1.5 5.0 FAY 0.1 4.72 ND 0.3 0.2 ND 7.00 4.1 2.1 0.5 1.9 38.1 GRN 0.2 51.7 ND 0.5 ND 0.5 36.9 31.7 1.4 1.5 17.4 25.4 PTN 0.1 1.68 ND 0.3 0.1 ND 3.45 3.3 0.7 ND 0.8 2.0 TUL 0.2 11.6 ND 0.3 0.2 ND 60.3 10.3 3.1 ND 10.1 46.3 WIL 0.1 1.74 ND 0.3 0.1 0.4 4.13 1.9 1.2 0.2 1.9 24.9
aSee Table 1 for details regarding the Sample Names bNitrite and nitrate reported as mg•L-1 as N cNot detected
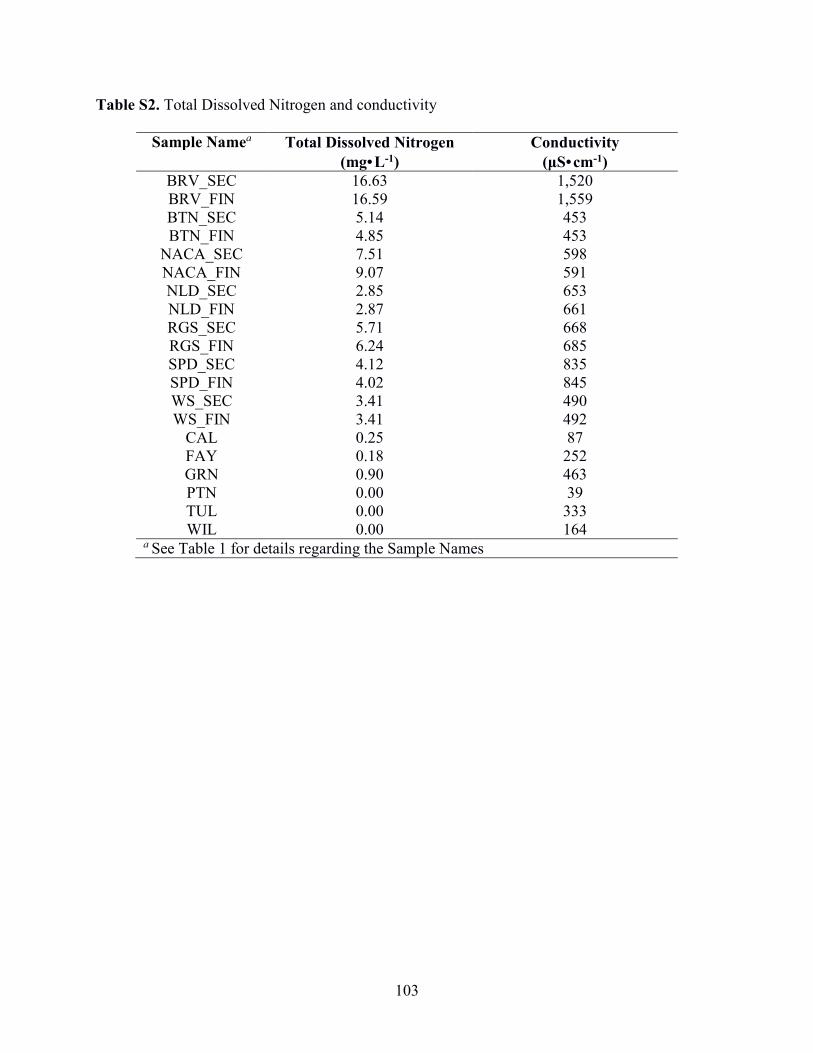
103
Table S2. Total Dissolved Nitrogen and conductivity
Sample Namea Total Dissolved Nitrogen
(mg•L-1)
Conductivity
(μS•cm-1)
BRV_SEC 16.63 1,520 BRV_FIN 16.59 1,559 BTN_SEC 5.14 453 BTN_FIN 4.85 453
NACA_SEC 7.51 598 NACA_FIN 9.07 591 NLD_SEC 2.85 653 NLD_FIN 2.87 661 RGS_SEC 5.71 668 RGS_FIN 6.24 685 SPD_SEC 4.12 835 SPD_FIN 4.02 845 WS_SEC 3.41 490 WS_FIN 3.41 492
CAL 0.25 87 FAY 0.18 252 GRN 0.90 463 PTN 0.00 39 TUL 0.00 333 WIL 0.00 164
a See Table 1 for details regarding the Sample Names
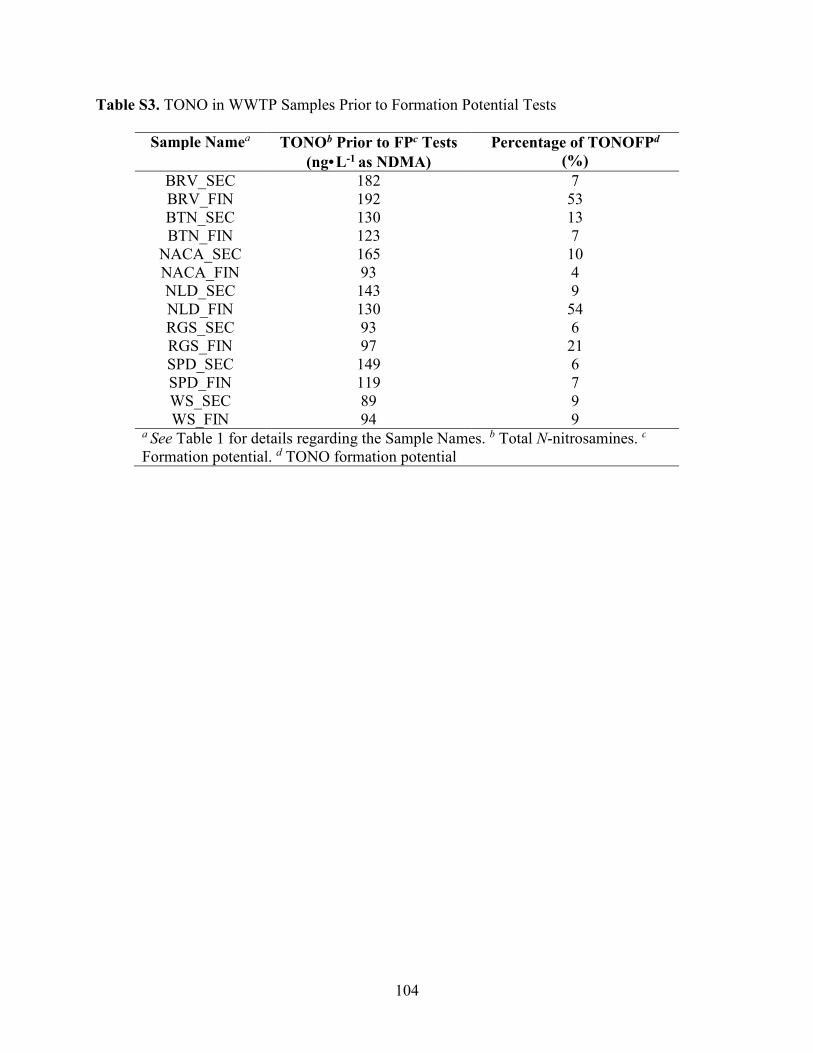
104
Table S3. TONO in WWTP Samples Prior to Formation Potential Tests
Sample Namea TONOb Prior to FPc Tests
(ng•L-1 as NDMA)
Percentage of TONOFPd
(%)
BRV_SEC 182 7 BRV_FIN 192 53 BTN_SEC 130 13 BTN_FIN 123 7
NACA_SEC 165 10 NACA_FIN 93 4 NLD_SEC 143 9 NLD_FIN 130 54 RGS_SEC 93 6 RGS_FIN 97 21 SPD_SEC 149 6 SPD_FIN 119 7 WS_SEC 89 9 WS_FIN 94 9
a See Table 1 for details regarding the Sample Names. b Total N-nitrosamines. c Formation potential. d TONO formation potential
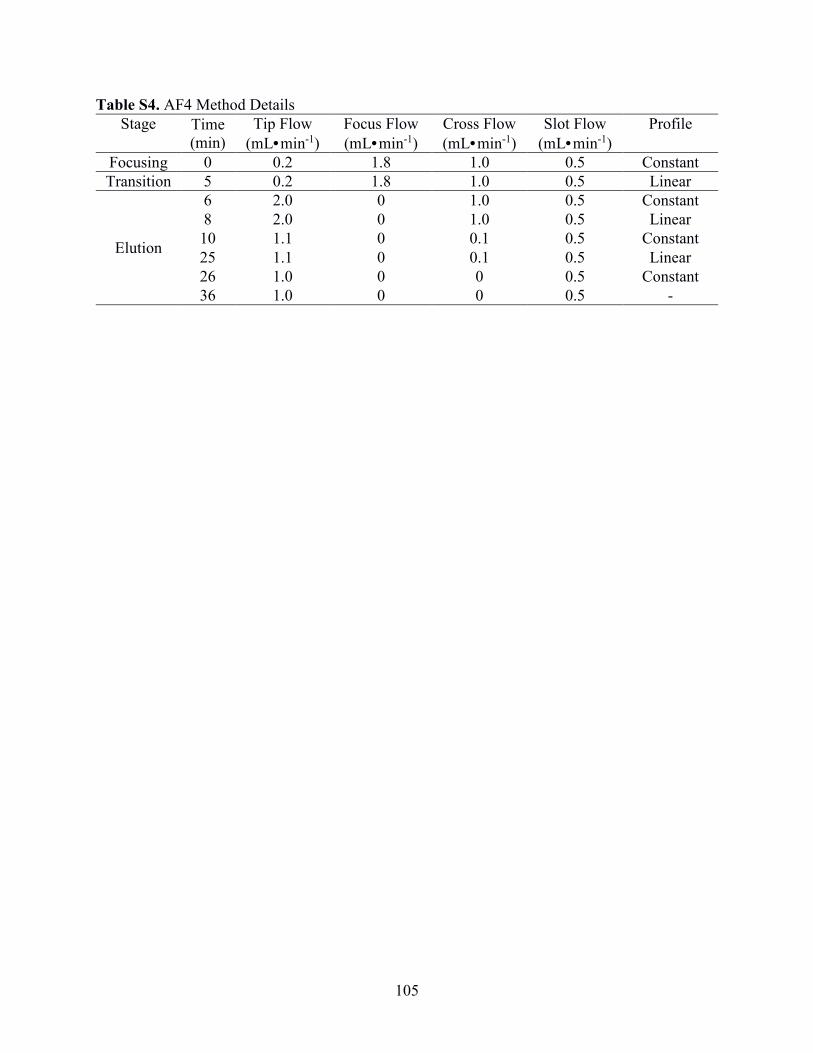
105
Table S4. AF4 Method Details
Stage Time (min)
Tip Flow
(mL•min-1)
Focus Flow
(mL•min-1)
Cross Flow
(mL•min-1)
Slot Flow
(mL•min-1)
Profile
Focusing 0 0.2 1.8 1.0 0.5 Constant
Transition 5 0.2 1.8 1.0 0.5 Linear
Elution
6 2.0 0 1.0 0.5 Constant
8 2.0 0 1.0 0.5 Linear
10 1.1 0 0.1 0.5 Constant
25 1.1 0 0.1 0.5 Linear
26 1.0 0 0 0.5 Constant
36 1.0 0 0 0.5 -
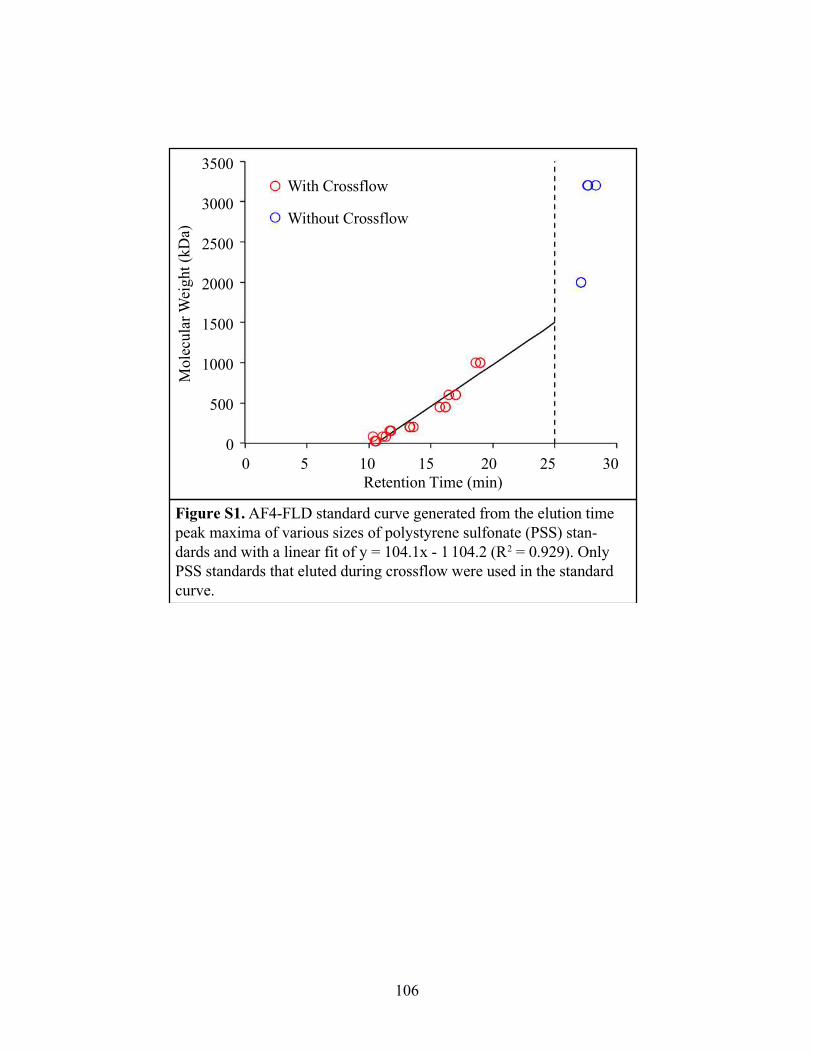
106
With Crossflow
Without Crossflow
0 5 10 15 20 25 30
3500
3000
2500
2000
1500
1000
500
0
Mole
cula
r W
eig
ht
(kD
a)
Retention Time (min)
Figure S1. AF4-FLD standard curve generated from the elution time
peak maxima of various sizes of polystyrene sulfonate (PSS) stan-
dards and with a linear fit of y = 104.1x - 1 104.2 (R2 = 0.929). Only
PSS standards that eluted during crossflow were used in the standard
curve.
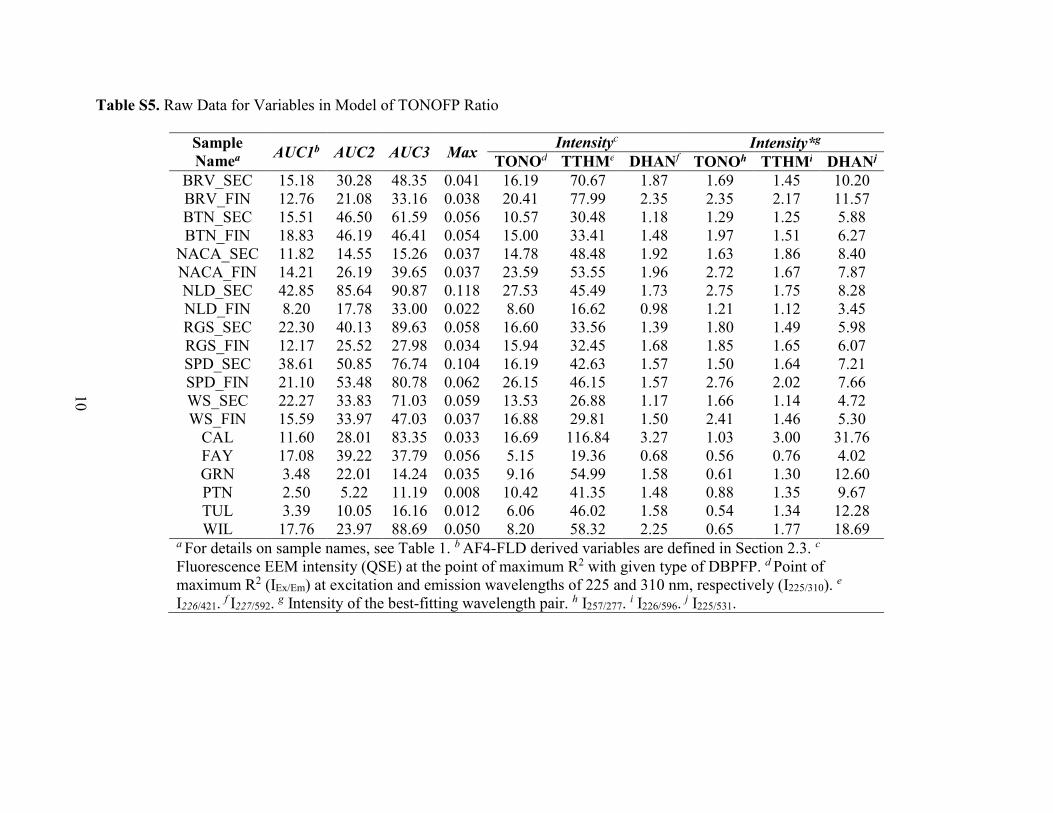
10
Table S5. Raw Data for Variables in Model of TONOFP Ratio
Sample
Namea AUC1b AUC2 AUC3 Max
Intensityc Intensity*g
TONOd TTHMe DHANf TONOh TTHMi DHANj
BRV_SEC 15.18 30.28 48.35 0.041 16.19 70.67 1.87 1.69 1.45 10.20 BRV_FIN 12.76 21.08 33.16 0.038 20.41 77.99 2.35 2.35 2.17 11.57 BTN_SEC 15.51 46.50 61.59 0.056 10.57 30.48 1.18 1.29 1.25 5.88 BTN_FIN 18.83 46.19 46.41 0.054 15.00 33.41 1.48 1.97 1.51 6.27
NACA_SEC 11.82 14.55 15.26 0.037 14.78 48.48 1.92 1.63 1.86 8.40 NACA_FIN 14.21 26.19 39.65 0.037 23.59 53.55 1.96 2.72 1.67 7.87 NLD_SEC 42.85 85.64 90.87 0.118 27.53 45.49 1.73 2.75 1.75 8.28 NLD_FIN 8.20 17.78 33.00 0.022 8.60 16.62 0.98 1.21 1.12 3.45 RGS_SEC 22.30 40.13 89.63 0.058 16.60 33.56 1.39 1.80 1.49 5.98 RGS_FIN 12.17 25.52 27.98 0.034 15.94 32.45 1.68 1.85 1.65 6.07 SPD_SEC 38.61 50.85 76.74 0.104 16.19 42.63 1.57 1.50 1.64 7.21 SPD_FIN 21.10 53.48 80.78 0.062 26.15 46.15 1.57 2.76 2.02 7.66 WS_SEC 22.27 33.83 71.03 0.059 13.53 26.88 1.17 1.66 1.14 4.72 WS_FIN 15.59 33.97 47.03 0.037 16.88 29.81 1.50 2.41 1.46 5.30
CAL 11.60 28.01 83.35 0.033 16.69 116.84 3.27 1.03 3.00 31.76 FAY 17.08 39.22 37.79 0.056 5.15 19.36 0.68 0.56 0.76 4.02 GRN 3.48 22.01 14.24 0.035 9.16 54.99 1.58 0.61 1.30 12.60 PTN 2.50 5.22 11.19 0.008 10.42 41.35 1.48 0.88 1.35 9.67 TUL 3.39 10.05 16.16 0.012 6.06 46.02 1.58 0.54 1.34 12.28 WIL 17.76 23.97 88.69 0.050 8.20 58.32 2.25 0.65 1.77 18.69
a For details on sample names, see Table 1. b AF4-FLD derived variables are defined in Section 2.3. c
Fluorescence EEM intensity (QSE) at the point of maximum R2 with given type of DBPFP. d Point of maximum R2 (IEx/Em) at excitation and emission wavelengths of 225 and 310 nm, respectively (I225/310). e
I226/421. f I227/592. g Intensity of the best-fitting wavelength pair. h I257/277. i I226/596. j I225/531.
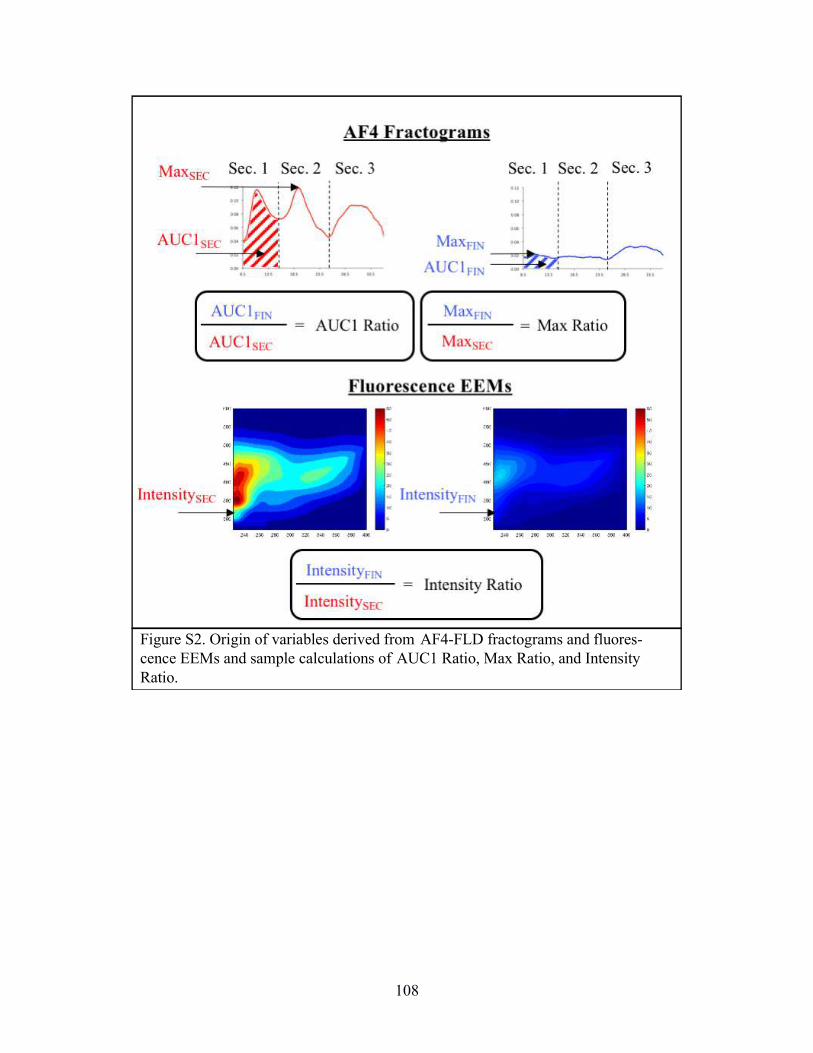
108
Figure S2. Origin of variables derived from AF4-FLD fractograms and fluores-
cence EEMs and sample calculations of AUC1 Ratio, Max Ratio, and Intensity
Ratio.
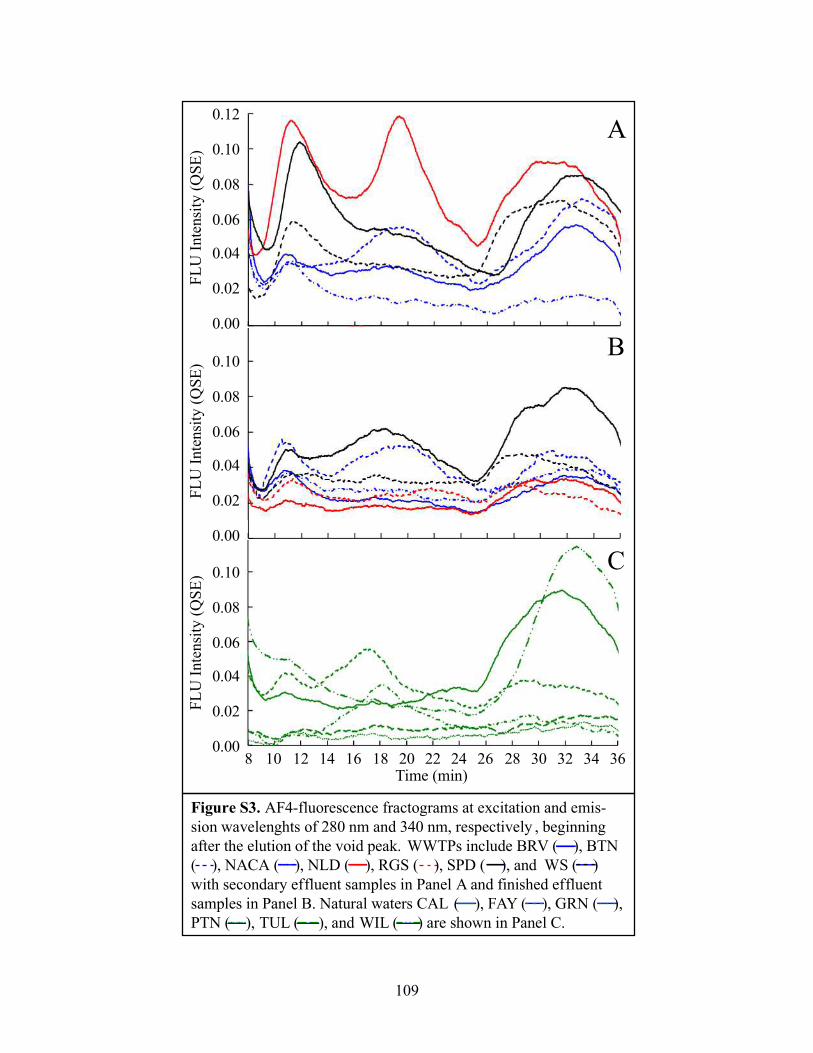
109
0.00
0.00
Figure S3. AF4-fluorescence fractograms at excitation and emis-
sion wavelenghts of 280 nm and 340 nm, respectively , beginning
after the elution of the void peak. WWTPs include BRV ( ), BTN
( ), NACA ( ), NLD ( ), RGS ( ), SPD ( ), and WS ( )
with secondary effluent samples in Panel A and finished effluent
samples in Panel B. Natural waters CAL ( ), FAY ( ), GRN ( ),
PTN ( ), TUL ( ), and WIL ( ) are shown in Panel C.
A
B
C
8 10 12 14 16 18 20 22 24 26 28 30 32 34 36Time (min)
0.12
0.10
0.08
0.06
0.04
0.02
0.00
0.10
0.08
0.06
0.04
0.02
0.00
0.10
0.08
0.06
0.04
0.02
0.00
FL
U I
nte
nsi
ty (
QS
E)
FL
U I
nte
nsi
ty (
QS
E)
FL
U I
nte
nsi
ty (
QS
E)
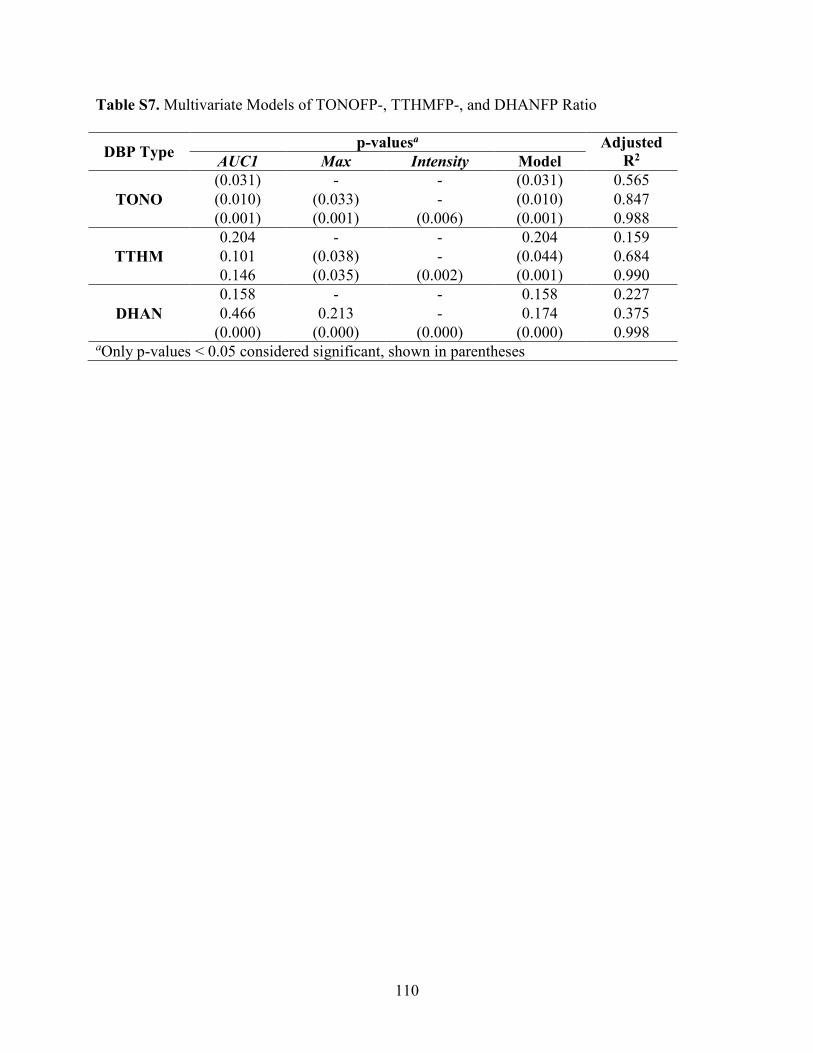
110
Table S7. Multivariate Models of TONOFP-, TTHMFP-, and DHANFP Ratio
DBP Type p-valuesa Adjusted
R2 AUC1 Max Intensity Model
TONO
(0.031) - - (0.031) 0.565
(0.010) (0.033) - (0.010) 0.847
(0.001) (0.001) (0.006) (0.001) 0.988
TTHM
0.204 - - 0.204 0.159
0.101 (0.038) - (0.044) 0.684
0.146 (0.035) (0.002) (0.001) 0.990
DHAN
0.158 - - 0.158 0.227
0.466 0.213 - 0.174 0.375
(0.000) (0.000) (0.000) (0.000) 0.998 aOnly p-values < 0.05 considered significant, shown in parentheses
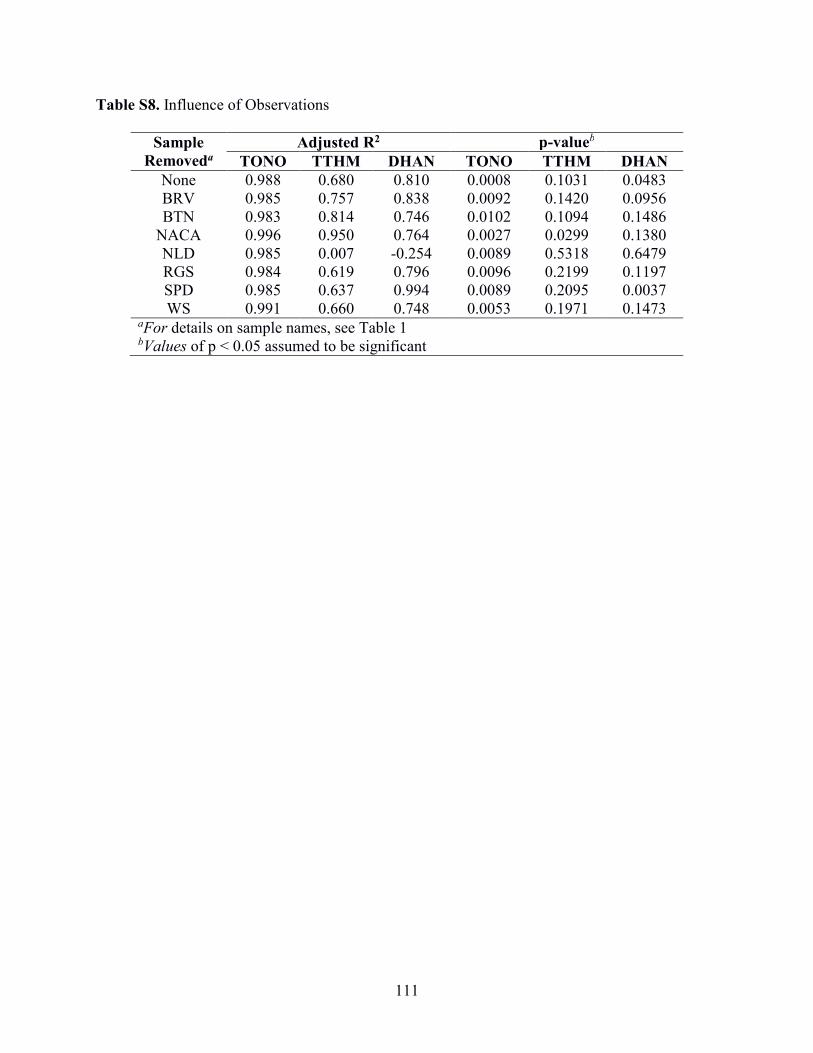
111
Table S8. Influence of Observations
Sample
Removeda
Adjusted R2 p-valueb
TONO TTHM DHAN TONO TTHM DHAN
None 0.988 0.680 0.810 0.0008 0.1031 0.0483 BRV 0.985 0.757 0.838 0.0092 0.1420 0.0956 BTN 0.983 0.814 0.746 0.0102 0.1094 0.1486
NACA 0.996 0.950 0.764 0.0027 0.0299 0.1380 NLD 0.985 0.007 -0.254 0.0089 0.5318 0.6479 RGS 0.984 0.619 0.796 0.0096 0.2199 0.1197 SPD 0.985 0.637 0.994 0.0089 0.2095 0.0037 WS 0.991 0.660 0.748 0.0053 0.1971 0.1473
aFor details on sample names, see Table 1 bValues of p < 0.05 assumed to be significant
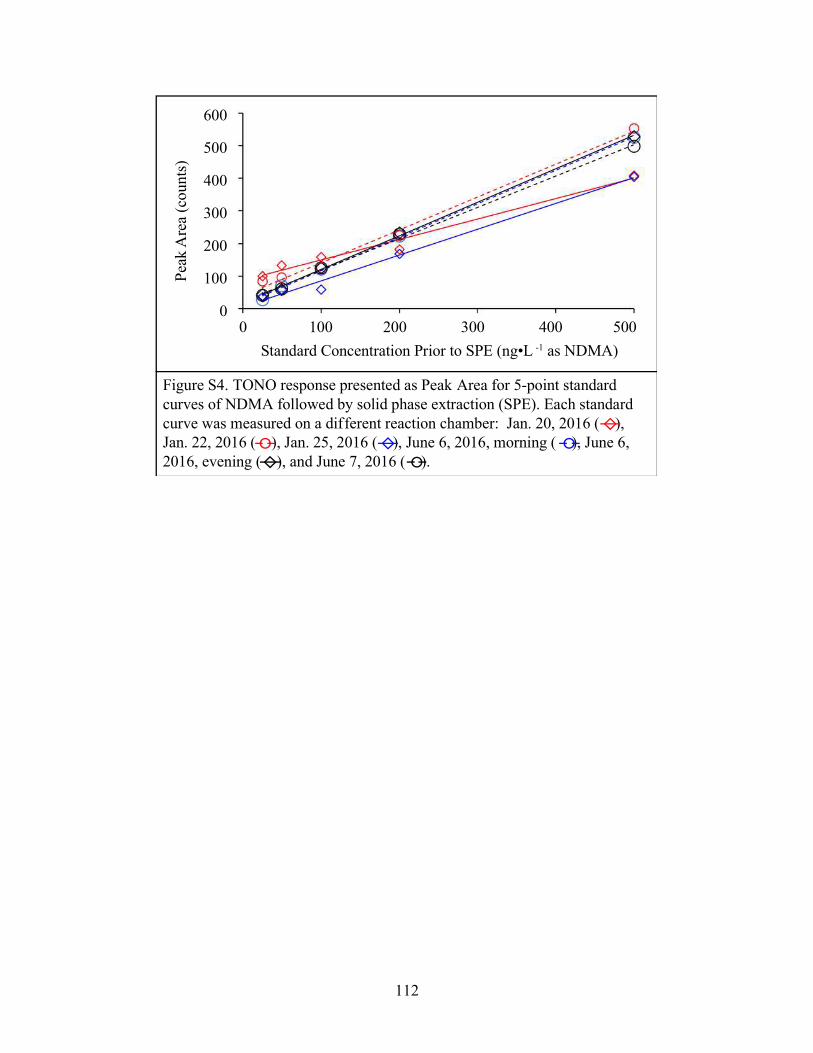
112
Figure S4. TONO response presented as Peak Area for 5-point standard
curves of NDMA followed by solid phase extraction (SPE). Each standard
curve was measured on a different reaction chamber: Jan. 20, 2016 ( ),
Jan. 22, 2016 ( ), Jan. 25, 2016 ( ), June 6, 2016, morning ( ), June 6,
2016, evening ( ), and June 7, 2016 ( ).
0 100 200 300 400 500
Standard Concentration Prior to SPE (ng•L -1 as NDMA)
600
500
400
300
200
100
0
Pea
k A
rea
(co
un
ts)
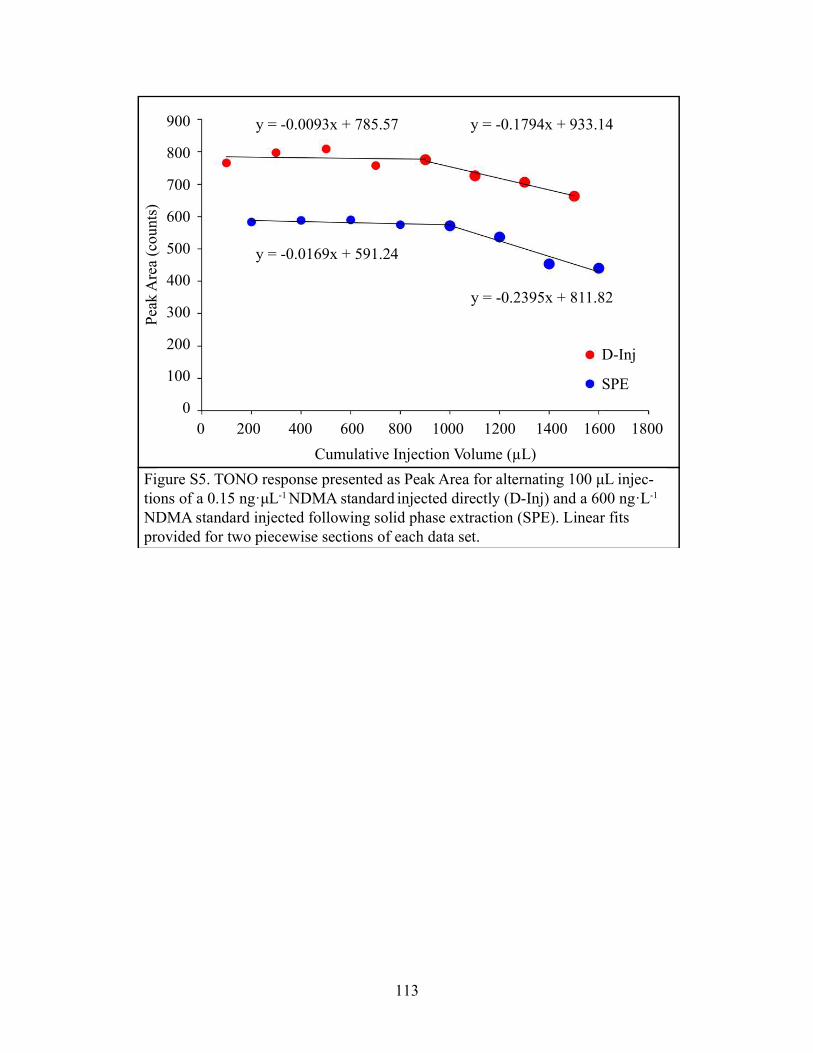
113
D-Inj
SPE
0 200 400 600 800 1000 1200 1400 1600 1800
Cumulative Injection Volume (µL)
y = -0.2395x + 811.82
y = -0.1794x + 933.14
y = -0.0169x + 591.24
y = -0.0093x + 785.57900
800
700
600
500
400
300
200
100
0
Pea
k A
rea
(co
un
ts)
Figure S5. TONO response presented as Peak Area for alternating 100 μL injec-
tions of a 0.15 ng·μL-1 NDMA standard injected directly (D-Inj) and a 600 ng·L-1
NDMA standard injected following solid phase extraction (SPE). Linear fits
provided for two piecewise sections of each data set.
114
References
Her, N., Amy, G., Foss, D. and Cho, J. W., 2002. Variations of molecular weight estimation by HP-size exclusion chromatography with UVA versus online DOC detection. Environmental Science & Technology 36 (15), 3393-3399.
Hudson, N., Baker, A. and Reynolds, D., 2007. Fluorescence analysis of dissolved organic matter in natural, waste and polluted waters - A review. River Research and Applications 23 (6), 631-649.
Mitch, W. A. and Dai, N. (2012). Water Research Foundation Report #4209: Development and application of a total nitrosamine assay for disinfected waters, Water Research Foundation.
Needham, E. M., Sidney, S. M., Chimka, J. R. and Fairey, J. L., 2016. Trihalomethane, dihaloacetonitrile, and total N-nitrosamine precursor adsorption by carbon nanotubes: the importance of surface oxides and pore volume. Environmental Science-Water Research & Technology 2 (6), 1004-1013
115
Chapter 4
Trihalomethane, Dihaloacetonitrile, and Total N-nitrosamine Precursor Adsorption by
Modified Carbon Nanotubes (CNTs) and Freeform CNT Microstructures
116
Abstract
N-nitrosamines are a non-halogenated group of disinfection byproducts that form during
chloramination, particularly in drinking waters impacted by wastewater treatment plant (WWTP)
effluents. Here, we reveal a size-resolved fluorescence-based precursor surrogate to track total N-
nitrosamine formation potential (TONOFP) through oxidative treatment. Samples were collected
at seven WWTPs, at the finished effluent and prior to final disinfection (i.e., secondary effluent).
Asymmetric flow field-flow fractionation (AF4) with inline fluorescence detection at an
excitation-emission of 280/340 nm (i.e., I280/340) showed protein-rich natural organic matter
peaks between 10-445 kDa and 445-1,500 kDa. TONOFP was measured by chemiluminescence
on samples dosed with 250 mgL-1-Cl2 monochloramine at pH 7 for seven days. Metrics from
AF4-I280/340 (i.e., area under the curve (AUC) and peak height) and I257/277 from whole water
excitation-emission matrices (EEMs) were leveraged in multivariate models to develop
correlations with TONOFP. The TONOFP of the finished effluent divided by that of the
secondary effluent (i.e., the TONOFP Ratio) was strongly correlated (R2 = 0.996, p = 0.000) to a
model of AUC for the 10-445 kDa peak, maximum peak height, and I257/277. This TONOFP
precursor surrogate requires 2 mL of sample and is transformational for assessing the impact of
oxidative treatments on N-nitrosamine precursor concentrations.
117
1. Introduction
In drinking water treatment plants (DWTPs) and distribution systems, free chlorine or
chloramines react with natural organic matter (NOM) in source water to form disinfection
byproducts (DBPs), such as trihalomethanes (THMs) (Rook, 1976) and dihaloacetonitriles
(DHANs) (Krasner et al., 2006). N-nitrosamines, a non-halogenated group of DBPs, can also
form, particularly in waters impacted by wastewater treatment plant (WWTP) effluents (Krasner
et al., 2013) that are disinfected with chloramines (Mitch et al., 2003). As such, formation of N-
nitrosamines is a particular concern in direct potable reuse (Zeng et al., 2016) and DWTPs using
less pristine source waters (Dai and Mitch, 2013). N-nitrosamines exert high toxicity relative to
regulated DBPs and, as such, are under consideration for regulation in drinking water (Hrudey
and Charrois, 2012). Most N-nitrosamine research has focused on N-nitrosodimethylamine
(NDMA) as it is the most commonly occurring N-nitrosamine present in drinking water systems
(Russell et al., 2012). However, NDMA has been shown to comprise just ~5% of total N-
nitrosamines (TONO) in chloramine systems (Dai and Mitch, 2013) but little information exists
regarding removal/transformation of TONO precursors. To address this important research gap,
this study focuses on the removal of TONO precursors by engineered sorbents, with an emphasis
on carbon nanotubes (CNTs) and presents a novel application scheme for CNTs to curb TONO
formation in finished drinking waters.
CNTs have been shown to adsorb THM, DHAN, and TONO precursors in batch
applications (Needham et al., 2016) and can be manufactured with varying size
(Balasubramanian and Burghard, 2005), shape (De Volder et al., 2014), texture (Birch et al.,
2013), and functionalities (Cho et al., 2008) to suit a particular application. The versatility of
available CNT properties makes them a potentially valuable sorbent for use in DBP control. A
118
recent study by this research group showed that CNTs can have high affinity for total N-
nitrosamine (TONO) precursors, which was in part attributed to electrostatic attractive forces
between negatively charged CNT surface oxides and positively charged amine groups within the
TONO precursors (Needham et al., 2016). Further, enhanced adsorption of DBP (i.e., TTHM,
DHAN, and TONO) precursors was attributed to increased CNT cumulative pore volume, which
was created by electrostatic repulsive forces between negatively charged CNT surface oxides.
This finding contrasts studies with activated carbon that have shown negatively charged surface
oxides decrease DOM adsorption (and concomitantly DBP precursors, presumably) because of
electrostatic repulsion (Dastgheib et al., 2004). As such, the association of increased CPV and
negatively charged surface oxides was explored further in this present study.
Due to the high cost of CNTs relative to sorbents such as activated carbon, the
application mode and utility of CNTs as a DBP precursor adsorbent needs significant
development before use in DWTPs could be considered. Packed-bed reactors are impractical due
to high headloss in filters produced by small CNT particle sizes; batch treatments would be
compromised by fate and toxicity concerns associated with unrecovered CNTs (Liu et al., 2013;
Das et al., 2014) and low precursor loadings (i.e., equilibrium with effluent precursor
concentrations). On the other hand, freeform CNT microstructures can be grown on and affixed
to substrates with precise control of size, shape, surface chemistry, and porosity (De Volder et al.,
2014). These structures are typically referred to as patterned CNT forests and could potentially
be manufactured in large sheets, several meters in length and width. We envision these sheets
(referred to herein as “CNT mats”) in stacked arrays through which water flows between the
CNT mat layers. As part of a proof-of-concept for this application, six unique CNT mats were
acquired, each between 0.2-0.4 cm2 in area, and tested in bench scale studies. As this area is too
119
small to practically generate sufficient samples volume for DBPFP tests (~550 mL), DBP
precursor surrogates are needed to assess performance. Metrics from fluorescence excitation-
emission matrices (EEMs) are known surrogates of TTHM and DHAN precursors (Do et al.,
2015). For TONO, metrics from EEMs coupled with asymmetric flow field-flow fractionation
hyphenated with inline fluorescence detection (AF4-FLD) have been shown to be a strong
surrogate (R2 = 0.996) for tracking changes in TONO precursors due to oxidative treatment
(Needham et al., 2017). Importantly, the TONO precursor surrogate requires only 2 mL of
sample volume, instead of the 500 mL required to measure TONO directly. However, this
TONO precursor surrogate has not been tested with adsorption processes, which was done as
part of the present study.
The objective of this study is to identify physicochemical properties of surface-modified
CNTs for enhanced TTHM-, DHAN, and TONO-precursor adsorption. Twelve commercially
available CNTs were selected and screened based on their physical and chemical characteristics.
Specific surface area and pore volume distributions were determined by gas adsorption isotherms
and the distribution of surface functional groups was acquired using x-ray photoelectron
spectroscopy (XPS). Three CNT types – selected to include a suite of characteristics – and an
activated carbon used widely at DWTPs – were tested in batch studies over a range of sorbent
doses and pH conditions to reveal mechanistic insights into the sorption process. Removal of
TTHM-, DHAN-, and TONO-precursors was indirectly measured using a modified DBP
formation potential (DBPFP) test (Do et al., 2015). Numerical models were developed to assess
the importance of physicochemical properties relevant to the adsorption of TTHM-, DHAN-, and
TONO-precursors. Additionally, continuous flow studies with CNT mats were completed as part
120
of a proof-of-concept of this novel application and assessed by leveraging DBP precursor
surrogates from fluorescence EEMs and AF4-FLD fractograms.
2. Materials and Methods
2.1. Site Description and Sample Collection
WWTP effluent enriched with TONO precursors (Needham et al., 2016) was chosen for
use in batch sorption experiments with bulk CNTs and continuous flow-through tests with CNT
mats. Source water was collected from the West Side WWTP (Fayetteville, AR) on October 11,
2016 for batch samples and January 5, 2017 for continuous flow tests. The plant practices
biological nutrient removal and depth filtration followed by ultraviolet disinfection, which has
been shown previously to produce TONO precursor concentrations (Needham et al., 2017). and
effluent aeration. Raw water characteristics of the West Side WWTP effluent (WS-EFF)
including pH, conductivity, dissolved organic carbon (DOC), major anions and cations, and
UV254 were measured upon collection and are detailed in Table S1. Waters were stored in low-
density polyethylene carboys at 4° C in the dark prior to use.
2.2. Batch Adsorbent Selection
Twelve types of commercially available modified CNTs were purchased from four
manufacturers and are detailed in Table 1. To build upon previous work (Needham et al., 2016),
CNTs selected for screening for the batch experiments span wide ranges in oxygen-containing
functional groups, total surface oxygen content (0.4-15%), and CPV (1.2-8.3 cm3�g-1), which
were determined as follows. The Brunauer-Emmett-Teller surface area (SBET) and the pore
volume distributions of the CNTs were measured with a Quantachrome Nova 2200e Surface
Area and Pore Size Analyzer using combined N2 and CO2 gas adsorption isotherms at 77 K and
273 K, respectively. Adsorption isotherms spanned partial pressures of 0.005-0.99 with 0.011-
121
0.095 step sizes. Density functional theory models assuming cylindrical pore geometries were
utilized to develop pore volume distributions and calculate CPV. Surface chemistry was
quantified via XPS measurements on a PHI 5000 VersaProbe spectrometer with an AlKα source.
A comparison of the relative areas of the carbon and oxygen peaks yielded the oxygen content
(%) on the surface. Methods for carbon spectra deconvolution were based on previous work
(Needham et al., 2016) and are detailed in the SI. From the carbon peak, relative percentages of
alcohol, carbonyl, and carboxyl groups were determined.
Three CNT types were selected for batch tests based on their physical and chemical CNT
characteristics. Specifically, CNT types with dissimilar CPV, oxygen content, and percentage of
carboxyl groups were selected, as these characteristics have been associated with increased
adsorption of TONO precursors (Needham et al., 2016). Of the three CNT types chosen, one was
from Carbon Solutions, Inc. – a single-walled P3 (CNT-1); the other two types chosen were from
Nanostructured and Amorphous Materials, Inc – a multi-walled, carboxyl group functionalized
CNT (CNT-2) and a single-walled, alcohol-group functionalized CNT (CNT-3). Calgon
Filtrasorb 400 powdered activated carbon (PAC, 60×140 U.S. Mesh fraction) was also used in
batch experiments to compare the performance of CNTs to a commonly used adsorbent in water
treatment. Table 1 summarizes the physical and chemical characteristics of each sorbent that was
screened, including the four chosen for batch application.
2.3. Characterizations of Patterned CNT Forests
Freeform CNT microstructures grown on a catalyst underlayer (previously introduced as
CNT mats) were obtained from Michael De Volder of the Institute for Manufacturing at the
University of Cambridge. The patterned CNT forests are manufactured through strain-engineered
growth of vertically aligned CNTs on a silicon wafer (De Volder et al., 2014). As the CNTs are
122
affixed to a substrate, physical characterization via gas adsorption isotherms was not possible.
However, some physical attributes including the size and shape of the microstructures were
observed via scanning electron microscopy (SEM) using a Philips XL30 ESEM (Figure 1A-D).
Chemical characteristics were quantified via XPS using the methods described in Section 2.2 and
results shown in Table 1; individual CNT mat dimensions are given in Table S2.
2.4. Experimental Procedures
2.4.1. Bottle-point Isotherms
Two groups of batch experiments were conducted, one with varying sorbent dose and the
other with varying pH at a set sorbent dose. For the dose-varying experiments, sorbent doses of
5-, 10-, 20-, 35-, and 50 mg�L-1 were tested and the pH was not adjusted (pH = 8.0). For the pH-
varying experiments, the sorbent dose was set at 20 mg�L-1 and the initial pH was adjusted to 4.0,
6.0, 8.0, and 10.0. To achieve these pH set points, sample waters were buffered with 1 mM with
glacial acetic acid for pH 4.0, 5 mM phosphate for pH 6.0, and 1 mM borate for both pH 8.0 and
10.0. CNTs were added to the WS-EFF (after pH adjustment in the case of pH-varying samples)
and tumbled for 3 days to allow samples to reach equilibrium (Needham et al., 2016). Following
the 3-day equilibration period, the pH drift was less than 0.2 pH units all pH-adjusted samples.
Next, the samples were filtered through a pre-rinsed 0.45-micron polyethersulfone (PES)
membrane (Karanfil et al., 2003) and stored at 4° C in the dark for up to 30 days prior to NOM
characterizations and DBPFP tests.
2.4.2. DBPFP
The DBPFP of all batch samples was quantified using the method developed by Do et al.
(2015) utilizing a 250 mg�L-1 as Cl2 dose of preformed monochloramine at pH 7.0. Total
trihalomethane formation potential (TTHMFP) and dihaloacetonitrile formation potential
123
(DHANFP) were measured using pentane extraction and gas chromatography (GC, Shimadzu
2010) as detailed in Needham et al. (2016). TONOFP was measured via solid phase extraction
(SPE) with EPA Method 521 activated carbon cartridges followed by chemiluminescence
detection as detailed in Needham et al. (2017).
2.4.3. Continuous Flow Experiments with CNT Mats
A polycarbonate flow-through cell was fabricated with a dropped chamber to hold a
single CNT mat to which a syringe pump was used to continuously flow water over the topside
of the mat (Figure 1E). CNT mats were rinsed by pumping Milli-Q water through the cell at flow
rates ranging from 0.2-4 mL�hr-1, which corresponded to empty bed contact times between 0.4-
7.5 hours, to remove impurities that could interfere with UV and fluorescence measurements
prior to continuous flow experiments with WS-EFF. A full UV spectrum from 225-600 nm was
measured for the flow-through cell effluent to confirm that CNT mats were sufficiently rinsed
(UV254 < 0.01 a.u. with a 1-cm pathlength quartz cuvette) before switching the water source to
WS-EFF. Preliminary experiments were conducted with CNT-Mat-1 to determine an appropriate
flow rate for future tests, which was determined to be 0.2 mL�hr-1, a flow rate intended to
balance the needs to achieve adsorption of TTHM and TONO precursors while facilitating
sample collection in 24-hour intervals. Additional details regarding selection of this flow rate is
provided in Section 3.3. Following tests with CNT-Mat-4 at 0.2 mL�hr-1, flow rates of 4, 40, and
400 mL�hr-1 were run in an attempt to assess rate-limiting sorption mechanisms.
2.4.4. AF4-FLD
A Postnova Analytics AF2000-MT AF4 system hyphenated with a dual monochromator
fluorescence detector (Agilent Technologies) was used to collect AF4-FLD fractograms for
samples from the batch and the continuous flow-through cell experiments. The AF4 system

124
eluent was 0.01 mM phosphate buffer at pH 7 and the separation channel was backed with a 10
kDa regenerated cellulose membrane. The AF4 method, which combines slot flow and high
cross flow (Table S3), has been shown to separate humic and protein-like fluorophores in
WWTP effluent. As in Needham et al. (2017), the AF4-FLD fractograms were collected at a
fluorescence excitation-emission wavelength pair of 280 and 340 nm, respectively, as this pair is
associated with protein-like fluorophores and maximizes the signal to noise ratio. Each
fractogram was divided into three sections: Section 1 from 8.50-14.55 minutes elution time
corresponding to NOM 10-445 kDa, Section 2 from 14.55-25.00 minutes corresponding to NOM
445-1,500 kDa, and Section 3 from 25.00 minutes to the end of the run at 37.00 minutes
corresponding to NOM larger than 1,500 kDa (Needham et al., 2017). The area under the curves
in Sections 1, 2, and 3 (AUC1, AUC2, and AUC3) were calculated as well as the maximum
intensity in Sections 1 and 2 (Max) for use in developing numerical models of DBP precursor
adsorption.
2.4.5. Fluorescence EEMs
Fluorescence EEMs were collected on all batch-treated samples and flow-through cell
samples following filtration with pre-rinsed 0.45-micron PES membranes. EEMs were run on
whole water samples that had not been fractionated following the methodology in Needham et al.
(2016). The fluorescence intensity at an excitation wavelength of 225 nm and an emission
wavelength of 310 nm (I225/310) has been associated with protein-like fluorophores (Hudson et al.,
2007) and was represented as the variable Intensity in subsequent models.
2.5. Data Modeling
Multivariate analysis was used to assess the physical and chemical characteristics
controlling DBP precursor sorption using a similar statistical approach to Needham et al. (2016).
125
Samples varying sorbent dose and pH were modeled separately and, within each of those
categories, individual models were developed for each DBP type (TTHM, DHAN and TONO).
The independent variables used in models of dose-varying samples include CPV, SBET, oxygen
content, and the sorbent dose. Samples with varying pH were modeled against the same
independent variables with the exception of adsorbent dose, as this was held constant at 20
mg�L-1. To fairly compare models with differing numbers of variables, all R2 values presented
are adjusted for the number of independent variables (Montgomery, 2013).
Multivariate models were also generated from the dose-varying batch samples to identify
potential TONOFP precursor surrogates describing changes in TONOFP due to sorption. To
develop these models, TONOFP values of batch samples were correlated to all available
combinations of independent variables derived from AF4-FLD fractograms and whole water
fluorescence EEMs (AUC1-3, Max, and Intensity). Models with one, two, and three variables
were explored and evaluated based on their significance (p-value) and correlation coefficient
(adjusted R2 value). Once significant models were elucidated, any containing the variable
Intensity were rerun using all 57,750 wavelength pairs in the EEMs to determine the pair for
which the best correlation coefficient existed (called Intensity*).
3. Results and Discussion
3.1. Batch Adsorption Models
Figures 2A-C show the fractional removals of TTHM-, DHAN-, and TONOFP from WS-
EFF at sorbent doses of 5-, 10-, 20-, 35-, and 50 mg�L-1 for three CNT types and PAC at an
unadjusted pH of 8.0. Decreases in the DBPFP are attributed to adsorption of the DBP precursors.
For TTHM precursors (Fig. 2A), CNT 3 and PAC performed similarly to one another and better
than CNTs 1 and 2, with 0.04-0.23 more fractional removal. For the DHAN precursors (Fig. 2B),
126
CNT 3 outperformed PAC and CNT 2, which performed similarly to one another, but better than
CNT 1. CNT 3 had 0.01-0.08 more fractional removal than CNT 2 or PAC and 0.08-0.19 more
than CNT 1. For both TTHM and DHAN precursors, CNT 1 did not perform as well as the other
three sorbents. In contrast, CNT 1 removed the greatest fractions of TONO precursors (Fig. 2C)
and outperformed PAC at every sorbent dose. CNTs 2 and 3 also outperformed PAC in terms of
TONO precursor removal at all doses except 35 mg�L-1. Taken together, the results in Figs. 2A-
C suggest that TONO precursors have dissimilar sorbate characteristics compared to TTHM and
DHAN precursors (together referred to as carbonaceous DBP precursors), and the sorbents tested
have contrasting affinities for these differing precursor types. The physicochemical properties
driving enhanced sorption of the various DBP precursors is explored below.
Figures 2D-F show the fractional removals of TTHM-, DHAN-, and TONOFP for each
of the four sorbents at pH 4, 6, 8, and 10. In these experiments, the sorbent dose was 20 mg�L-1.
For TTHM precursors (Fig. 2D), all CNT types performed the best at pH 4 and similarly to one
another at pH 6, 8, and 10. For DHAN precursors (Fig. 2E), CNT types 1 and 3 performed best at
pH 4. Of the oxygen-containing functional groups on the CNT surfaces, only carboxyl groups
have a pKa (~5) (Suggs, 2002) within the pH range of these experiments. The samples at pH 4
are the only ones for which the pH is below the pKa of the carboxyl groups, which suggests that
negatively charged carboxyl functional groups impaired removal of TTHM precursors, albeit
only modestly (with a maximum of 0.15 more fractional removal at pH 4 compared to the other
pH values), and DHAN precursors to a lesser extent. Removal of TTHMFP and DHANFP by
PAC did not exhibit strong trends with pH, although the lowest removals were observed at pH 10.
Fig. 2F shows TONO precursor removal as a function sorbent type at pH 4, 6, 8, and 10.
However, aberrant trends are apparent, such as the three instances of negative fractional
127
removals (i.e., the TONOFP was up to 40% higher in the sorbent-treated samples compared to
the untreated samples). It is possible that the pH perturbations interfered with the TONO
measurement, and, as such, it was concluded that the data presented in Fig. 2F were unreliable.
Importantly, however, these data point to the need for a robust study of the impact of pH and
buffer type on TONO measurements by SPE followed by chemiluminescence.
The multivariate analysis of both dose-varying and pH-varying samples for each DBP
type yielded models of each (Figures 3 and S1) with regression coefficients and p-values given
in Table 2. Independent variables were assumed to be nonzero and to be significant in models of
DBPFP if their p-value was less than 0.05, controlling for other variables in the model. For the
models of DBPFP in which adsorbent dose was varied, strong correlations were found for
TTHMFP (R2 = 0.92, Figure 3A) and DHANFP (R2 = 0.88, Figure 3B). As expected, sorbent
dose was a significant variable controlling the DBPFP of the samples. Additionally, SBET was
significant (p = 0.029) in the model of TTHMFP and was nearly significant (p = 0.079) in the
model of DHANFP, indicating the importance of sorbent surface area for removal of THM and
DHAN precursors. In contrast, SBET was insignificant in the model of TONOFP (p = 0.667).
Only moderate correlations were found for the model of TONOFP (R2 = 0.65, Figure 3C) and the
surface oxygen content came close to significance (p = 0.054). Data regarding the removal of
TONOFP in samples varying adsorbent dose showed a few samples that were not consistent with
typical adsorption behavior thereby prompting the search for potential outliers in the TONOFP
data set. Among all the samples (n = 20), only three had absolute errors larger than 1 nmol�L-1 as
NDMA (noted by asterisks in Figure 2C). The model of TONOFP was recalculated without these
samples and resulted in an R2 of 0.91 and a model in which all of the independent variables were
significant (Figure 3D and Table 2), particularly CPV (p = 0.007) and the surface oxygen content
128
(p = 0.000). Taken together, the results of the multivariate models of dose-varying samples
indicate that SBET controls the adsorption of TTHM and DHAN precursors while CPV and
oxygen content control the adsorption of TONO precursors. This finding for TONO is similar to
previous work indicating that CPV and negatively charged oxygen groups (such as carboxyl
groups) control the adsorption of precursors (Needham et al., 2016), however the models in this
study were developed with CNTs that spanned larger ranges of CPV, SBET, and various types of
surface oxygen (Table 1).
Of the models developed from samples in which the pH was varied (Figure S1A-C), only
the model of TTHMFP was significant (R2 = 0.58), indicating SBET was again the
physiochemical variable most strongly correlated to adsorption of TTHM precursors. Models of
DHAN (Fig. S1B) and TONO (Fig. S1C) developed with the pH-varying samples were not
significant and, as such, cannot be used to draw additional conclusions about factors controlling
adsorption of their precursors.
3.2. TONO Precursor Surrogate Development
The recently developed precursor surrogate (R2 = 0.996) for tracking formation and
destruction of TONO precursors through various oxidation processes leveraged metrics from
AF4-FLD fractograms and whole water fluorescence EEMs (Needham et al., 2017). Similar
models were sought for a TONOFP precursor surrogate (also based on metrics from AF4-FLD
fractograms, shown in Figure S2, and fluorescence EEMs) to describe the efficacy of sorption
processes, rather than oxidation. An illustrative representation of the independent variables is
shown in Figure S3 and the raw data used to generate the multivariate model are in Table S4. Of
all the possible combinations of the five independent variables from AF4-FLD and fluorescence
EEMs, the significant model with the best correlation coefficient (R2 = 0.55) was a multivariate
129
model of AUC1, AUC2, and Intensity. All three variables were significant in addition to the
model as a whole (p = 0.001). AUC1 and AUC2 are associated with protein-like organic matter
measured by the AF4-FLD in the 10-445 kDa and 445-1,500 kDa ranges, respectively (Needham
et al., 2017). Intensity (I225/310) is based on a wavelength pair associated with the protein-like
region of the whole water fluorescence EEMs. This model was then explored further to
determine at which wavelength pair the best correlation coefficient existed (Intensity*) by
running multivariate models of TONOFP with AUC1, AUC2, along with each of the 57,750
wavelength pairs from the EEMs. Intensity* was determined to be I225/300 and the model of AUC1,
AUC2, and Intensity* had an improved adjusted R2 value of 0.576. The moderate fit of the model
(Figure 4) is based on TONOFP removal from sorption processes onto three types of CNTs and
one activated carbon. While this model is not as strong as our previously developed model
describing TONOFP oxidation (R2 = 0.996) (Needham et al., 2017), its moderate fit facilitated
estimation of TONO precursor breakthrough profiles in the continuous flow CNT mat testing.
3.3. Continuous Flow CNT Mat Testing
As the sample volumes generated from the CNT mat tests were small due to low
flowrates (typically 0.05 to 4 mL�hr-1), breakthrough curves were generated using DBP
precursor surrogates only. For TONO, the precursor surrogate discussed in Section 3.2 and
Figure 4 was used, while for TTHM, UV254 was used (Do et al., 2015). Preliminary tests with
CNT-Mat 1 used an initial flow rate of 4 mL�hr-1, and both the TTHM and TONO precursor
surrogates stabilized at a C/C0 of approximately 0.8 after 2.5 bed volumes (Figure 5A-B). During
sample collection at 4 mL�hr-1, both surrogates increased indicating decreasing sorption of
TTHM and TONO precursors. This result is proof-of-concept that the CNT mats can be used to
sorb these precursors. Next, the flow rate was decreased to 0.2 mL�hr-1 at 2.5 bed volumes and
130
finally to 0.05 mL�hr-1 at 4.5 bed volumes, but the effluent profiles were unaffected, suggesting
that film diffusion was not limiting (Fairey et al., 2010). Based on these results and as a matter of
convenience, a flow rate of 0.2 mL�hr-1 was chosen for the subsequent CNT mat tests, as this
flow rate facilitated collection of a larger number of samples prior to breakthrough.
Continuous flow tests with CNT-Mat-2 (Figure 5C-D) and CNT-Mat-3 (Figure 5E-F)
revealed several notable trends. TONO precursors increased initially and then stabilized near
breakthrough (C/C0 ≈ 1). Unexpectedly, TONO precursors surpassed a C/C0 of 1 (i.e., the
effluent exceeded the influent concentration), indicative of a chromatographic effect (Benjamin
and Lawler, 2013), suggesting that sorbed TONO precursors were displaced by more strongly
sorbing compounds and released into the effluent. It is unlikely that THM precursors were these
preferentially sorbing compounds, given their rapid breakthrough (Figures 5D and F). This CNT-
Mat-4 (Figure 5G-H) was run longer than the other three CNT Mats (~235 bed volumes) as the
TONO precursor surrogate concentration did not stabilize, varying between C/C0 values of 0.5-
1.4. In contrast the TTHM precursor surrogate stabilized and achieved breakthrough after the
first sample. This may be due to the smaller diameter of the CNT microstructures in CNT-Mat-4
compared to those of the other three CNT mats (see Figure 1). Additionally, the flow rate
increases from 0.2 mL�hr-1 to 4 mL�hr-1 and then to 40 mL�hr-1 did not appear to impact the
TONO precursor surrogate concentration, again indicating the lack of a film diffusion limitation.
Assessing the importance of CNT surface chemistry is not possible in these experiments, given
that SBET and pore volume distributions could not be measured. However, these data
demonstrate a proof-of-concept for this novel sorption mode, making such measurements
worthwhile in future studies. Importantly, visual assessment of effluent and SEM images of CNT
mats after continuous flow experiments, indicate that vertically aligned freeform CNTs remained
131
attached to the substrate even under high surface loading rates. As a whole, continuous flow tests
have revealed that attached growth CNTs have the ability to remove TONO precursors.
Future work with CNT mats would benefit from the ability to measure DBPFP of the
samples directly, rather than relying on precursor surrogates. Under these flow conditions, we
estimate the CNT mats would need to be approximately 100 times larger (~3125 mm2) to obtain
sufficient sample volumes in practical periods of time (24 hours or less). If physical
characteristics could also be calculated despite the CNTs being attached to a substrate, numerical
models similar to those used for batch adsorption studies could be generated to determine the
importance of CNT physical and chemical characteristics for DBP precursor adsorption. These
models should also include variables to quantify the shape of the CNT microstructures such as
height, diameter, or microstructure spacing to determine if the adsorption of particular types of
DBP precursors is impacted by these variables.
4. Conclusions
Modified CNTs were selected for their potential to remove DBP precursors, with an
emphasis on TONO precursors. Batch experiments with modified CNTs and a PAC
encompassing a wide range of physical and chemical characteristics were conducted with various
sorbent doses and at a range of pH values. Multivariate models of TTHMFP, DHANFP, and
TONOFP with physiochemical characteristics revealed that specific surface area controls the
adsorption of TTHM and DHAN precursors, while CPV and surface oxygen content control the
adsorption of TONO precursors. Additional models were generated for TONOFP with metrics
from AF4-FLD fractograms and fluorescence EEMs. The best-fit model utilized intensity values
at I225/300 and had an adjusted R2 value of 0.576 resulting in a usable TONO precursor surrogate.
This surrogate, along with UV254, which was used as TTHM precursor surrogate, was applied to
132
continuous-flow tests of CNT mats. These tests demonstrated that TONO precursors could be
sorbed, providing a proof-of-concept for this novel method of application. CNT mats would
benefit from future studies with larger sample volumes, physical property characterizations, and
the development of numerical models to determine factors controlling DBP precursor adsorption.
133
5. Associated Content
Notes
The authors declare no competing financial interest.
Acknowledgements
The authors acknowledge Adrian Fernandez de Luis Maldonado for his assistance with the
statistical analysis as well as Michael De Volder from the Institute of Manufacturing at the
University of Cambridge for manufacturing the CNT mats. Financial support from the National
Science Foundation (CBET #1254350 to JLF) and the University of Arkansas Doctoral Academy
Fellowship (to EMN) is gratefully acknowledged.
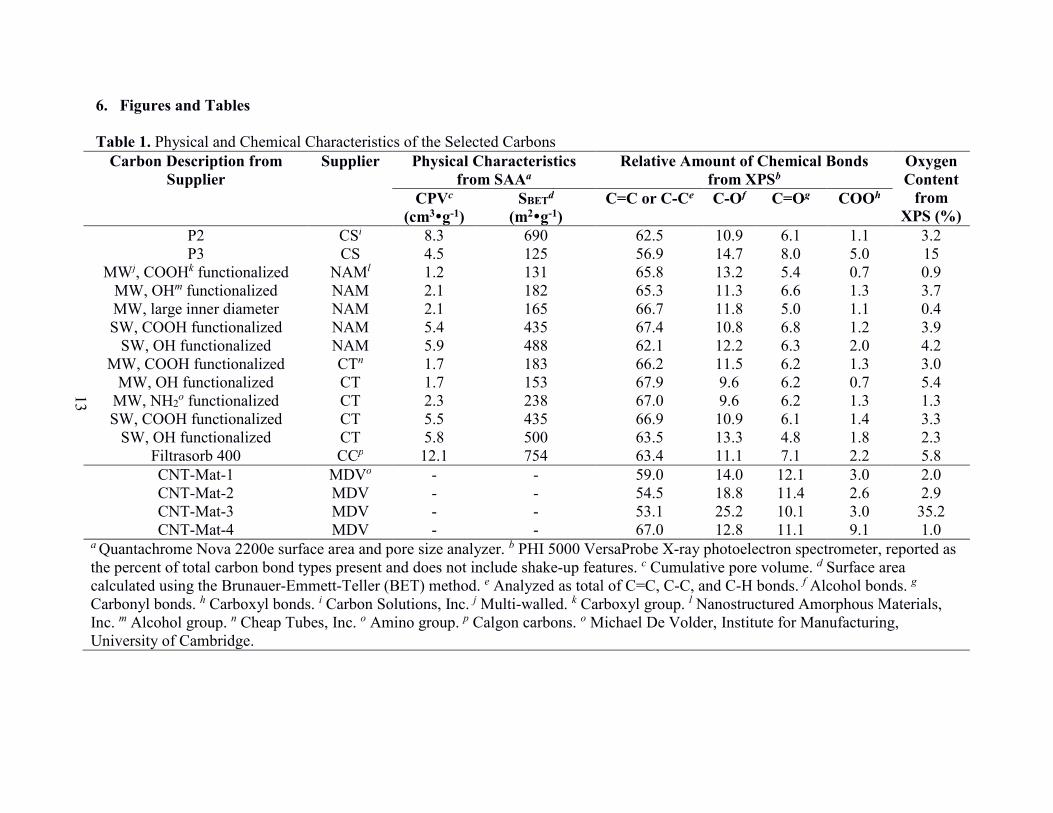
13
6. Figures and Tables
Table 1. Physical and Chemical Characteristics of the Selected Carbons
Carbon Description from
Supplier
Supplier Physical Characteristics
from SAAa
Relative Amount of Chemical Bonds
from XPSb
Oxygen
Content
from
XPS (%) CPVc
(cm3�g-1)
SBETd
(m2�g-1)
C=C or C-Ce C-Of C=Og COOh
P2 CSi 8.3 690 62.5 10.9 6.1 1.1 3.2 P3 CS 4.5 125 56.9 14.7 8.0 5.0 15
MWj, COOHk functionalized NAMl 1.2 131 65.8 13.2 5.4 0.7 0.9 MW, OHm functionalized NAM 2.1 182 65.3 11.3 6.6 1.3 3.7 MW, large inner diameter NAM 2.1 165 66.7 11.8 5.0 1.1 0.4 SW, COOH functionalized NAM 5.4 435 67.4 10.8 6.8 1.2 3.9
SW, OH functionalized NAM 5.9 488 62.1 12.2 6.3 2.0 4.2 MW, COOH functionalized CTn 1.7 183 66.2 11.5 6.2 1.3 3.0
MW, OH functionalized CT 1.7 153 67.9 9.6 6.2 0.7 5.4 MW, NH2
o functionalized CT 2.3 238 67.0 9.6 6.2 1.3 1.3 SW, COOH functionalized CT 5.5 435 66.9 10.9 6.1 1.4 3.3
SW, OH functionalized CT 5.8 500 63.5 13.3 4.8 1.8 2.3 Filtrasorb 400 CCp 12.1 754 63.4 11.1 7.1 2.2 5.8
CNT-Mat-1 MDVo - - 59.0 14.0 12.1 3.0 2.0 CNT-Mat-2 MDV - - 54.5 18.8 11.4 2.6 2.9 CNT-Mat-3 MDV - - 53.1 25.2 10.1 3.0 35.2 CNT-Mat-4 MDV - - 67.0 12.8 11.1 9.1 1.0
a Quantachrome Nova 2200e surface area and pore size analyzer. b PHI 5000 VersaProbe X-ray photoelectron spectrometer, reported as the percent of total carbon bond types present and does not include shake-up features. c Cumulative pore volume. d Surface area calculated using the Brunauer-Emmett-Teller (BET) method. e Analyzed as total of C=C, C-C, and C-H bonds. f Alcohol bonds. g Carbonyl bonds. h Carboxyl bonds. i Carbon Solutions, Inc. j Multi-walled. k Carboxyl group. l Nanostructured Amorphous Materials, Inc. m Alcohol group. n Cheap Tubes, Inc. o Amino group. p Calgon carbons. o Michael De Volder, Institute for Manufacturing, University of Cambridge.
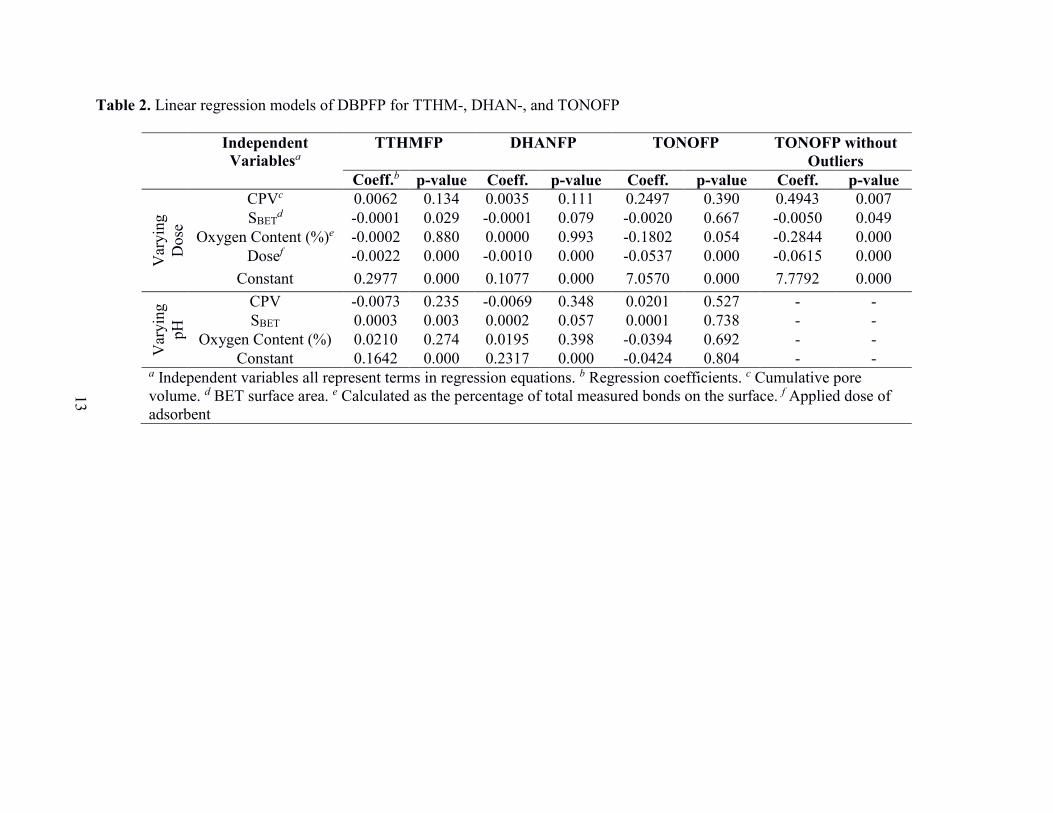
13
Table 2. Linear regression models of DBPFP for TTHM-, DHAN-, and TONOFP
Independent
Variablesa
TTHMFP DHANFP TONOFP TONOFP without
Outliers
Coeff.b p-value Coeff. p-value Coeff. p-value Coeff. p-value
Var
yin
g
Dose
CPVc 0.0062 0.134 0.0035 0.111 0.2497 0.390 0.4943 0.007
SBETd -0.0001 0.029 -0.0001 0.079 -0.0020 0.667 -0.0050 0.049
Oxygen Content (%)e -0.0002 0.880 0.0000 0.993 -0.1802 0.054 -0.2844 0.000
Dosef -0.0022 0.000 -0.0010 0.000 -0.0537 0.000 -0.0615 0.000
Constant 0.2977 0.000 0.1077 0.000 7.0570 0.000 7.7792 0.000
Var
yin
g
pH
CPV -0.0073 0.235 -0.0069 0.348 0.0201 0.527 - -
SBET 0.0003 0.003 0.0002 0.057 0.0001 0.738 - -
Oxygen Content (%) 0.0210 0.274 0.0195 0.398 -0.0394 0.692 - -
Constant 0.1642 0.000 0.2317 0.000 -0.0424 0.804 - - a Independent variables all represent terms in regression equations. b Regression coefficients. c Cumulative pore volume. d BET surface area. e Calculated as the percentage of total measured bonds on the surface. f Applied dose of adsorbent
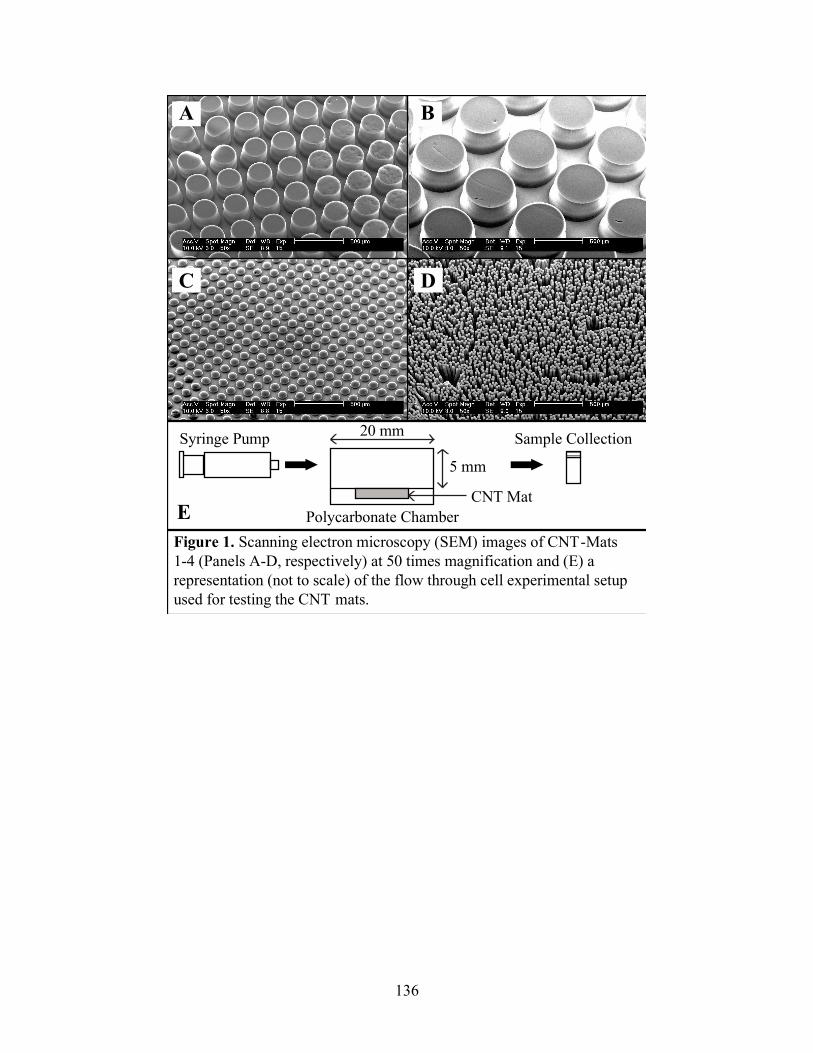
136
20 mm
CNT Mat
Syringe Pump Sample Collection
Polycarbonate Chamber
5 mm
E
Figure 1. Scanning electron microscopy (SEM) images of CNT-Mats
1-4 (Panels A-D, respectively) at 50 times magnification and (E) a
representation (not to scale) of the flow through cell experimental setup
used for testing the CNT mats.
D
BA
C
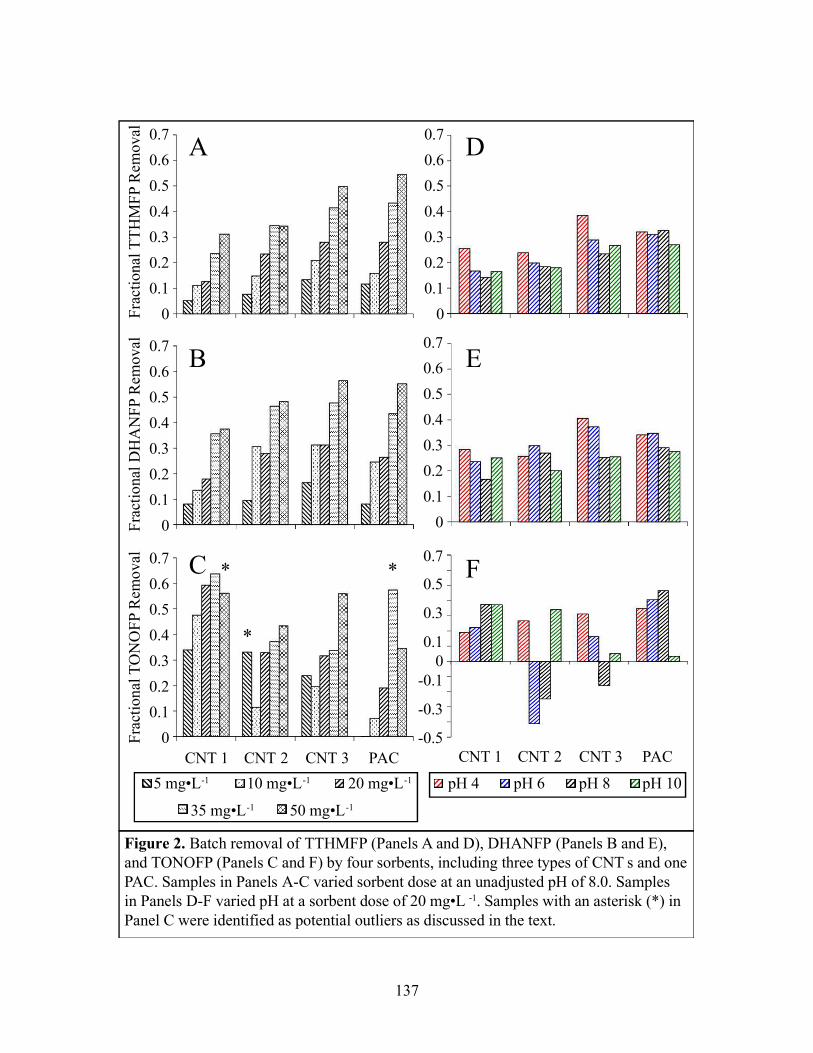
137
0.7
0.6
0.5
0.4
0.3
0.2
0.1
0
0.7
0.6
0.5
0.4
0.3
0.2
0.1
0
0.7
0.6
0.5
0.4
0.3
0.2
0.1
0
0.7
0.5
0.3
0.1
0
-0.1
-0.3
-0.5
CNT 1 CNT 2 CNT 3 PAC CNT 1 CNT 2 CNT 3 PAC
C *
*
*
A
B
D
E
F
Fra
ctio
nal
TT
HM
FP
Rem
oval
Fra
ctio
nal
DH
AN
FP
Rem
oval
Fra
ctio
nal
TO
NO
FP
Rem
oval
5 mg•L-1 10 mg•L-1 20 mg•L-1
35 mg•L-1 50 mg•L-1
pH 4 pH 6 pH 8 pH 10
Figure 2. Batch removal of TTHMFP (Panels A and D), DHANFP (Panels B and E),
and TONOFP (Panels C and F) by four sorbents, including three types of CNT s and one
PAC. Samples in Panels A-C varied sorbent dose at an unadjusted pH of 8.0. Samples
in Panels D-F varied pH at a sorbent dose of 20 mg•L -1. Samples with an asterisk (*) in
Panel C were identified as potential outliers as discussed in the text.
0.7
0.6
0.5
0.4
0.3
0.2
0.1
0
0.7
0.6
0.5
0.4
0.3
0.2
0.1
0
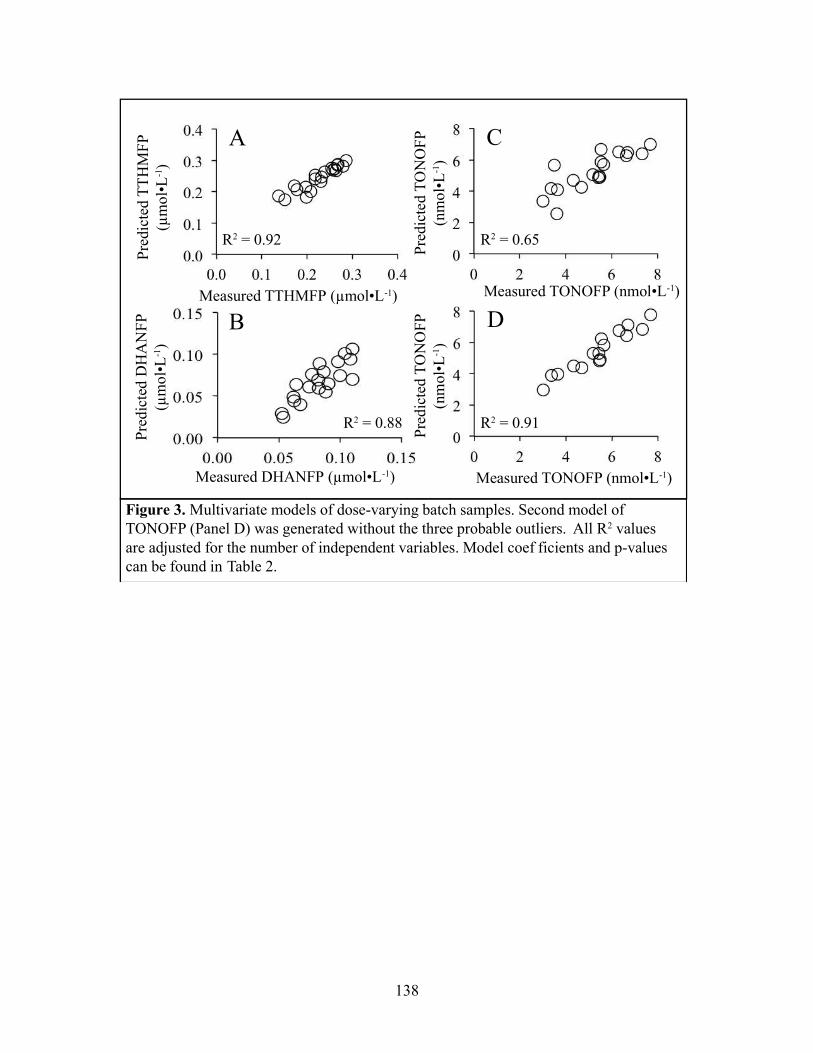
138
Measured TONOFP (nmol•L-1)
Measured TTHMFP (µmol•L-1)
Measured DHANFP (µmol•L-1)
Pre
dic
ted
DH
AN
FP
(µm
ol•
L-1)
Pre
dic
ted T
TH
MF
P
(µm
ol•
L-1)
Figure 3. Multivariate models of dose-varying batch samples. Second model of
TONOFP (Panel D) was generated without the three probable outliers. All R2 values
are adjusted for the number of independent variables. Model coef ficients and p-values
can be found in Table 2.
A
B
R2 = 0.92
R2 = 0.88
Measured TONOFP (nmol•L-1)
Pre
dic
ted T
ON
OF
P
(nm
ol•
L-1)
C
Pre
dic
ted
TO
NO
FP
(nm
ol•
L-1)
D
R2 = 0.65
R2 = 0.91
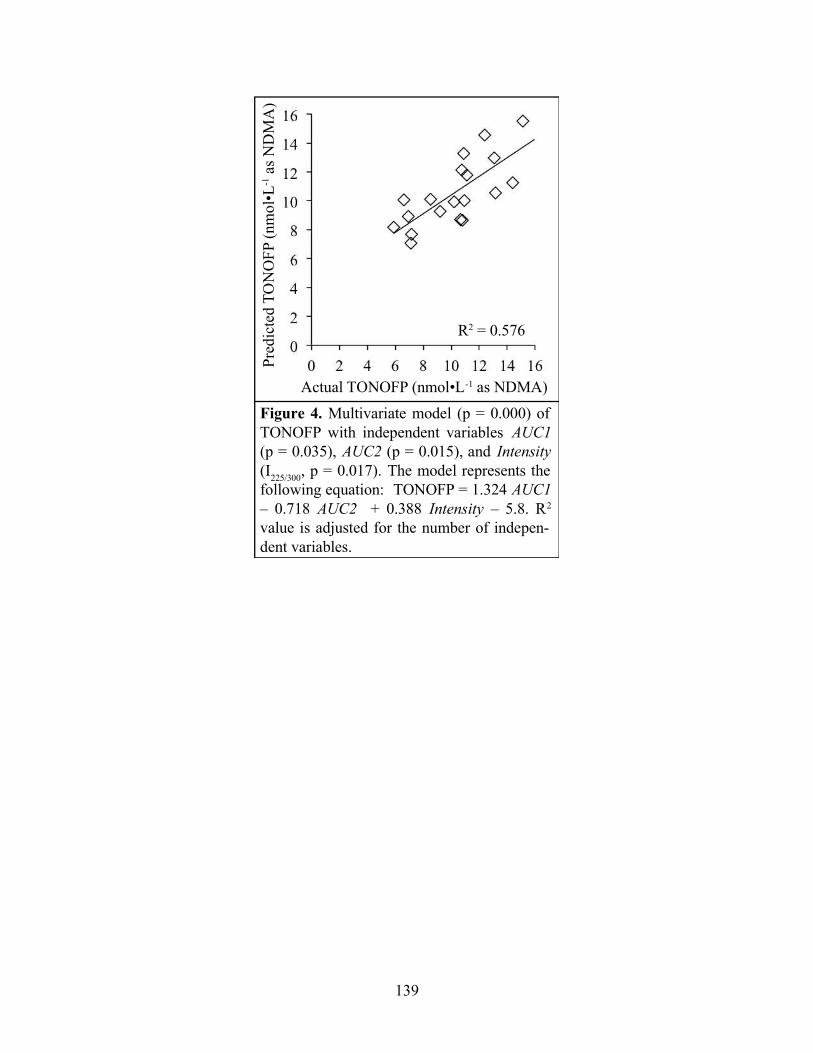
139
R2 = 0.576
Figure 4. Multivariate model (p = 0.000) of
TONOFP with independent variables AUC1
(p = 0.035), AUC2 (p = 0.015), and Intensity
(I225/300
, p = 0.017). The model represents the
following equation: TONOFP = 1.324 AUC1
– 0.718 AUC2 + 0.388 Intensity – 5.8. R2
value is adjusted for the number of indepen-
dent variables.
Actual TONOFP (nmol•L-1 as NDMA)
Pre
dic
ted
TO
NO
FP
(n
mo
l•L
-1 a
s N
DM
A)
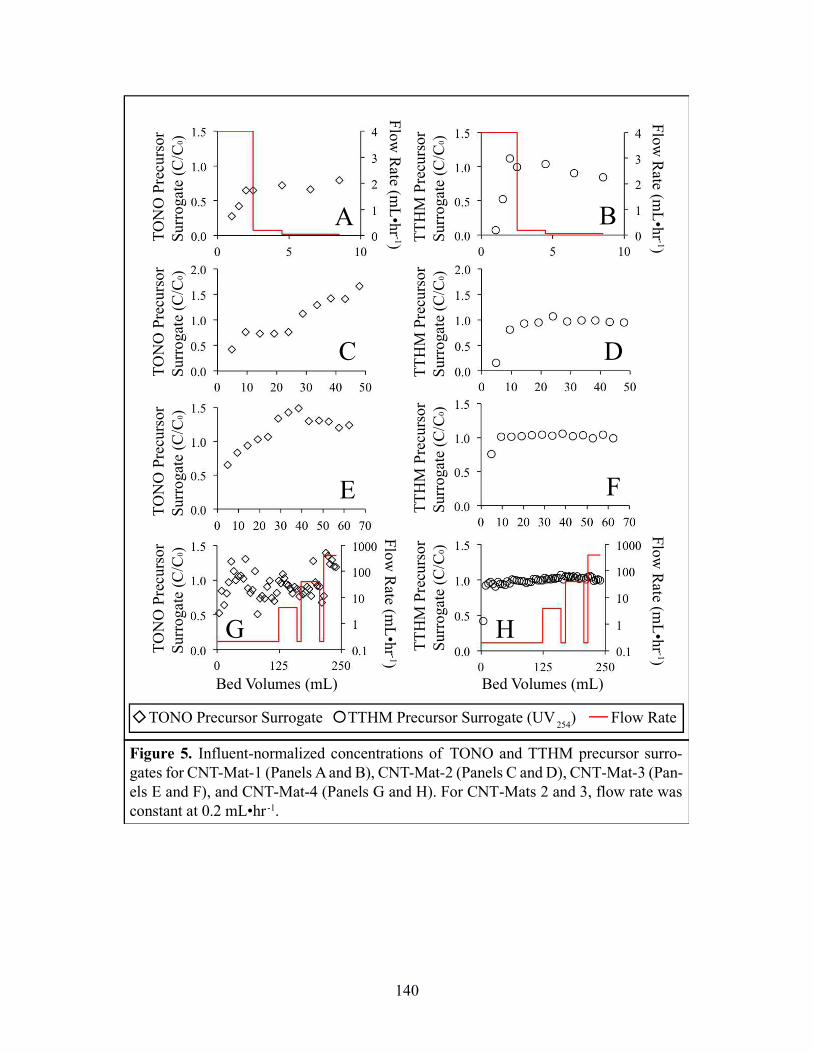
140
TO
NO
Pre
curs
or
Surr
ogat
e (C
/C0)
TO
NO
Pre
curs
or
Surr
ogat
e (C
/C0)
TO
NO
Pre
curs
or
Surr
ogat
e (C
/C0)
TO
NO
Pre
curs
or
Surr
ogat
e (C
/C0)
TT
HM
Pre
curs
or
Surr
ogat
e (C
/C0)
TT
HM
Pre
curs
or
Surr
ogat
e (C
/C0)
TT
HM
Pre
curs
or
Surr
ogat
e (C
/C0)
TT
HM
Pre
curs
or
Surr
ogat
e (C
/C0)
Flo
w R
ate (mL
•hr
-1)
Figure 5. Influent-normalized concentrations of TONO and TTHM precursor surro-
gates for CNT-Mat-1 (Panels A and B), CNT-Mat-2 (Panels C and D), CNT-Mat-3 (Pan-
els E and F), and CNT-Mat-4 (Panels G and H). For CNT-Mats 2 and 3, flow rate was
constant at 0.2 mL•hr -1.
Bed Volumes (mL)
TONO Precursor Surrogate TTHM Precursor Surrogate (UV254
) Flow Rate
Flo
w R
ate (mL
•hr
-1)
Flo
w R
ate (mL
•hr
-1)
Flo
w R
ate (mL
•hr
-1)
Bed Volumes (mL)
A B
C D
E F
G H
141
7. References
Balasubramanian, K. and Burghard, M., 2005. Chemically functionalized carbon nanotubes. Small 1 (2), 180-192.
Benjamin, M. M. and Lawler, D. F., 2013. Water Quality Engineering: Physical/Chemical Treatment Processes, John Wiley & Sons, Inc., Hoboken, NJ.
Birch, M. E., Ruda-Eberenz, T. A., Chai, M., Andrews, R. and Hatfield, R. L., 2013. Properties that influence the specific surface areas of carbon nanotubes and nanofibers. Annals of Occupational Hygiene 57 (9), 1148-1166.
Cho, H.-H., Smith, B. A., Wnuk, J. D., Fairbrother, D. H. and Ball, W. P., 2008. Influence of surface oxides on the adsorption of naphthalene onto multiwalled carbon nanotubes. Environmental Science & Technology 42 (8), 2899-2905.
Dai, N. and Mitch, W. A., 2013. Relative importance of N-nitrosodimethylamine compared to total N-nitrosamines in drinking waters. Environmental Science & Technology 47 (8), 3648-3656.
Das, R., Hamid, S. B. A., Ali, M. E., Ismail, A. F., Annuar, M. S. M. and Ramakrishna, S., 2014. Multifunctional carbon nanotubes in water treatment: The present, past and future. Desalination 354, 160-179.
Dastgheib, S. A., Karanfil, T. and Cheng, W., 2004. Tailoring activated carbons for enhanced removal of natural organic matter from natural waters. Carbon 42 (3), 547-557.
De Volder, M., Park, S., Tawfick, S. and Hart, A. J., 2014. Strain-engineered manufacturing of freeform carbon nanotube microstructures. Nature Communications 5, 4512.
De Volder, M., Park, S., Tawfick, S. and Hart, A. J., 2014. Strain-engineered manufacturing of freeform carbon nanotube microstructures. Nature Communications 5.
Do, T. D., Chimka, J. R. and Fairey, J. L., 2015. Improved (and singular) disinfectant protocol for indirectly assessing organic precursor concentrations of trihalomethanes and dihaloacetonitriles. Environmental Science & Technology 49 (16), 9858-9865.
142
Fairey, J. L., Wahman, D. G. and Lowry, G. V., 2010. Effects of Natural Organic Matter on PCB-Activated Carbon Sorption Kinetics: Implications for Sediment Capping Applications. Journal of Environmental Quality 39 (4), 1359-1368.
Hrudey, S. E. and Charrois, J. W. A., Eds. (2012). Disinfection by-products and human health. IWA Publishing and Australian Water Association, London.
Hudson, N., Baker, A. and Reynolds, D., 2007. Fluorescence analysis of dissolved organic matter in natural, waste and polluted waters - A review. River Research and Applications 23 (6), 631-649.
Karanfil, T., Erdogan, I. and Schlautman, M. A., 2003. Selecting filter membranes for measuring DOC and UV254. Journal American Water Works Association 95 (3), 86-100.
Krasner, S. W., Mitch, W. A., McCurry, D. L., Hanigan, D. and Westerhoff, P., 2013. Formation, precursors, control, and occurrence of nitrosamines in drinking water: A review. Water Research 47 (13), 4433-4450.
Krasner, S. W., Weinberg, H. S., Richardson, S. D., Pastor, S. J., Chinn, R., Sclimenti, M. J., Onstad, G. D. and Thruston, A. D., 2006. Occurrence of a new generation of disinfection byproducts. Environmental Science & Technology 40 (23), 7175-7185.
Liu, Y., Zhao, Y., Sun, B. and Chen, C., 2013. Understanding the toxicity of carbon nanotubes. Accounts of Chemical Research 46 (3), 702-713.
Mitch, W. A., Sharp, J. O., Trussell, R. R., Valentine, R. L., Alvarez-Cohen, L. and Sedlak, D. L., 2003. N-nitrosodimethylamine (NDMA) as a drinking water contaminant: A review. Environmental Engineering Science 20 (5), 389-404.
Montgomery, D. C., 2013. Applied Statistics and Probability for Engineers, 6th Edition, John Wiley & Sons.
Needham, E. M., Fernandez de Luis, A. M., Chimka, J. R. and Fairey, J. L., 2017. Revealing a size-resolved fluorescence-based metric to track oxidative treatment of total N-nitrosamine precursors in wastewater-derived waters. Environmental Science & Technology Letters In Revision.
Needham, E. M., Sidney, S. M., Chimka, J. R. and Fairey, J. L., 2016. Trihalomethane, dihaloacetonitrile, and total N-nitrosamine precursor adsorption by carbon nanotubes:
143
the importance of surface oxides and pore volume. Environmental Science: Water Research & Technology 2, 1004-1013.
Needham, E. M., Sidney, S. M., Chimka, J. R. and Fairey, J. L., 2016. Trihalomethane, dihaloacetonitrile, and total N-nitrosamine precursor adsorption by carbon nanotubes: the importance of surface oxides and pore volume. Environmental Science-Water Research & Technology 2 (6), 1004-1013.
Rook, J. J., 1976. Haloforms in drinking water. Journal American Water Works Association 68 (3), 168-172.
Russell, C. G., Blute, N. K., Via, S., Wu, X. and Chowdhury, Z., 2012. National assessment of nitrosamine occurrence and trends. Journal American Water Works Association 104 (3), E205-E217.
Suggs, J. W., 2002. Organic Chemistry, Barron's Educational Series.
Zeng, T., Plewa, M. J. and Mitch, W. A., 2016. N-Nitrosamines and halogenated disinfection byproducts in US Full Advanced Treatment trains for potable reuse. Water Research 101, 176-186.
144
Appendix 3
Supplementary Information for
“Trihalomethane, Dihaloacetonitrile, and Total N-nitrosamine Precursor Adsorption by Modified
Carbon Nanotubes (CNTs) and Freeform CNT Microstructures”
145
List of Supporting Information
Carbon Spectra Deconvolution
Table S1. Raw Water Characteristics
Table S2. CNT Mat Dimensions
Table S3. AF4 Method
Figure S1. Multivariate Models of pH-Varying Batch Samples
Figure S2. AF4-FLD Fractograms for Dose-Varying Batch Samples
Figure S3. Illustration of Variables for TONO Surrogate Model
Table S4. AF4-FLD and Fluorescence EEM Data for TONOFP Surrogate Model
146
Carbon Spectra Deconvolution
Carbon spectra were deconvoluted using a similar method to Needham et al. (2016). The
binding energy was charge corrected based on a C1s peak position of 284.4 eV, C1s peaks were
deconvoluted with a Gaussian-Lorentzian mix function, and a Shirley background subtraction
was applied. The peak corresponding to carbon-carbon bonds was modified with an asymmetry
parameter of 0.19 and other peaks were assigned for alcohols (C-O), carbonyls (C=O), and
carboxyls (COO) with a final peak corresponding to the shake-up features satellite in the higher
binding energy region of the spectra. Carbon-carbon bonding was set to a binding energy of
284.4 eV. Alcohol, carbonyl, and carboxyl groups were represented by peaks located at 285.35,
286.84, and 288.58 eV, respectively. The peak associated with shake-up features was located at
290.4 eV.
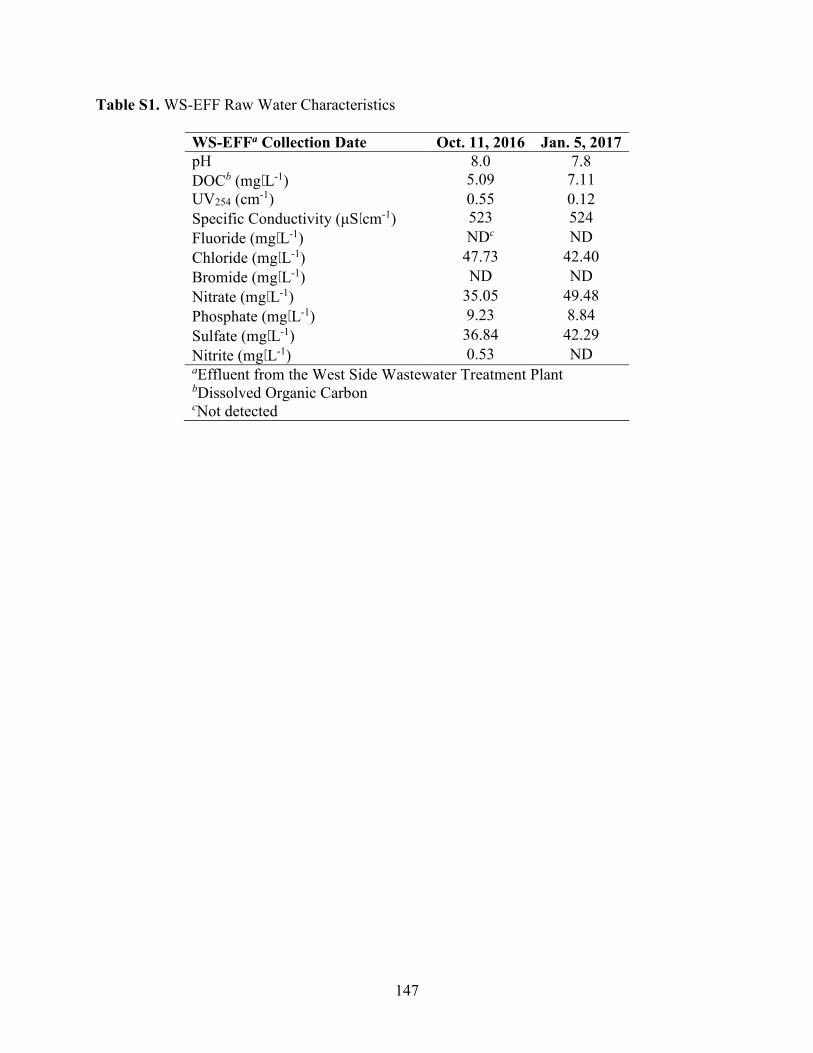
147
Table S1. WS-EFF Raw Water Characteristics
WS-EFFa Collection Date Oct. 11, 2016 Jan. 5, 2017
pH 8.0 7.8
DOCb (mg⋅L-1) 5.09 7.11
UV254 (cm-1) 0.55 0.12
Specific Conductivity (μS⋅cm-1) 523 524
Fluoride (mg⋅L-1) NDc ND
Chloride (mg⋅L-1) 47.73 42.40
Bromide (mg⋅L-1) ND ND
Nitrate (mg⋅L-1) 35.05 49.48
Phosphate (mg⋅L-1) 9.23 8.84
Sulfate (mg⋅L-1) 36.84 42.29
Nitrite (mg⋅L-1) 0.53 ND aEffluent from the West Side Wastewater Treatment Plant bDissolved Organic Carbon cNot detected
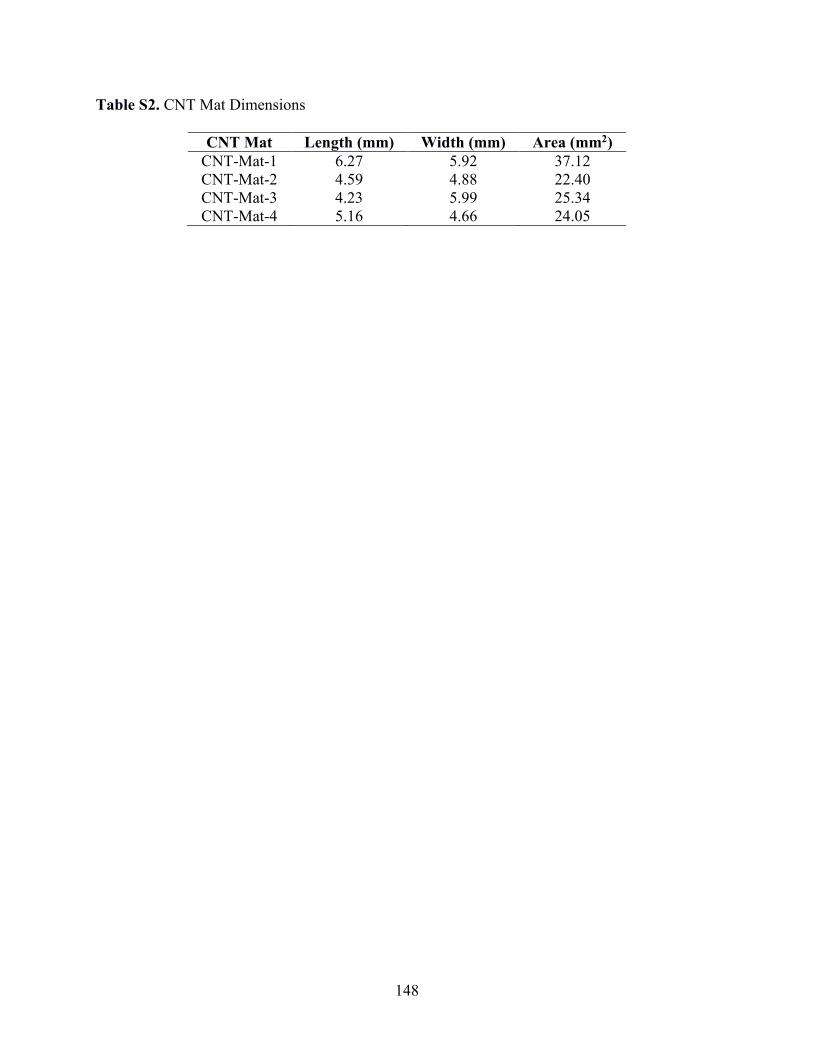
148
Table S2. CNT Mat Dimensions
CNT Mat Length (mm) Width (mm) Area (mm2)
CNT-Mat-1 6.27 5.92 37.12 CNT-Mat-2 4.59 4.88 22.40 CNT-Mat-3 4.23 5.99 25.34 CNT-Mat-4 5.16 4.66 24.05
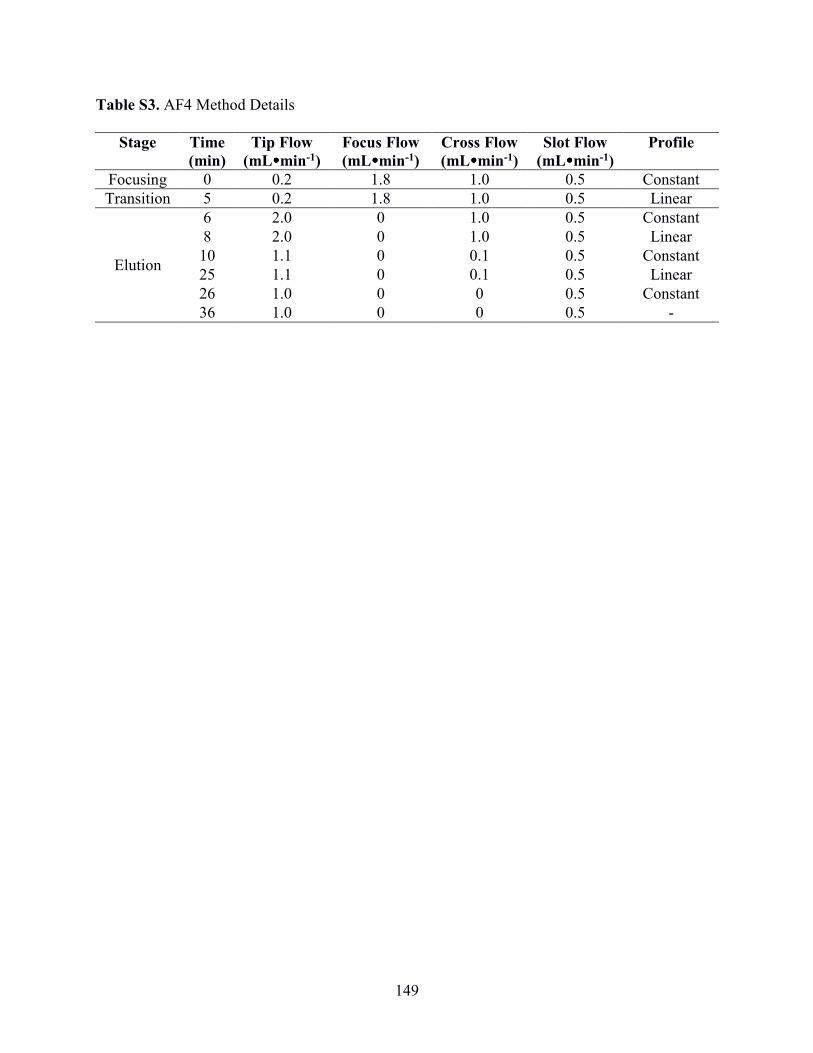
149
Table S3. AF4 Method Details
Stage Time
(min)
Tip Flow
(mL����min-1)
Focus Flow
(mL����min-1)
Cross Flow
(mL����min-1)
Slot Flow
(mL����min-1)
Profile
Focusing 0 0.2 1.8 1.0 0.5 Constant
Transition 5 0.2 1.8 1.0 0.5 Linear
Elution
6 2.0 0 1.0 0.5 Constant
8 2.0 0 1.0 0.5 Linear
10 1.1 0 0.1 0.5 Constant
25 1.1 0 0.1 0.5 Linear
26 1.0 0 0 0.5 Constant
36 1.0 0 0 0.5 -
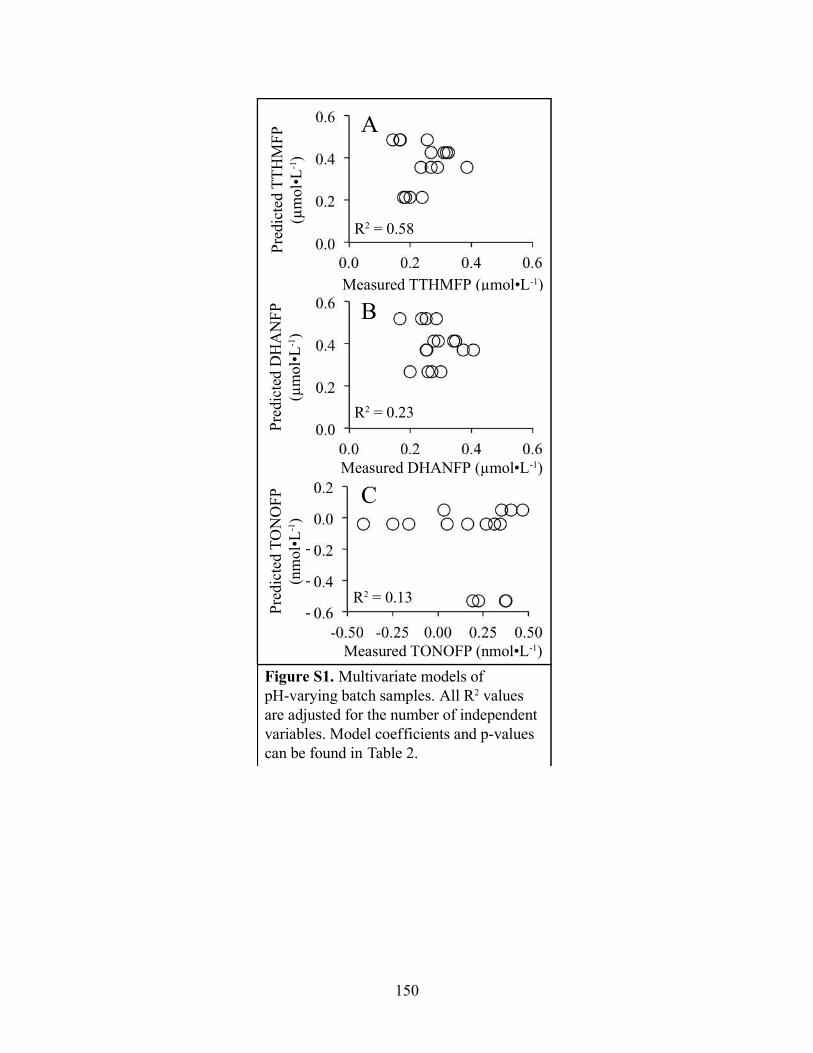
150
Measured TTHMFP (µmol•L-1)
Measured DHANFP (µmol•L-1)
Measured TONOFP (nmol•L-1)
A
((µµ ))
B
1
C
R2 = 0.58
R2 = 0.23
R2 = 0.13
Figure S1. Multivariate models of
pH-varying batch samples. All R2 values
are adjusted for the number of independent
variables. Model coefficients and p-values
can be found in Table 2.
-
-
-
Pre
dic
ted T
TH
MF
P
(µm
ol•
L-1)
Pre
dic
ted D
HA
NF
P
(µm
ol•
L-1)
Pre
dic
ted T
ON
OF
P
(nm
ol•
L-1)
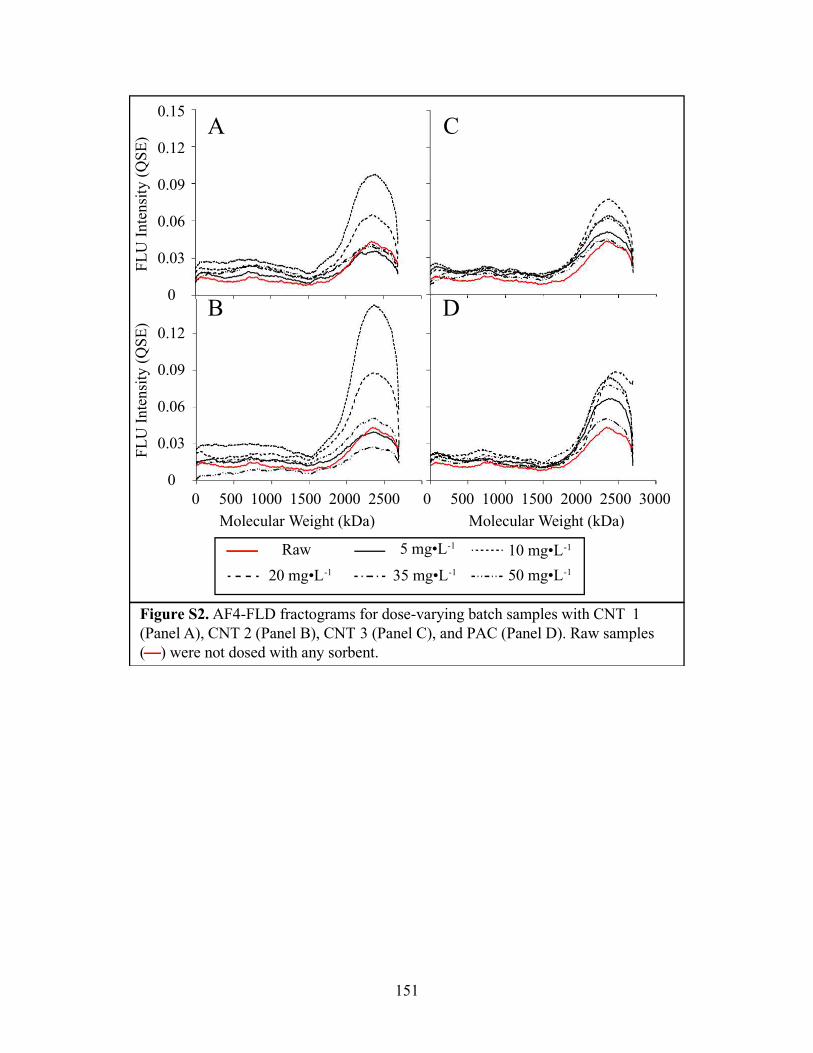
151
Figure S2. AF4-FLD fractograms for dose-varying batch samples with CNT 1
(Panel A), CNT 2 (Panel B), CNT 3 (Panel C), and PAC (Panel D). Raw samples
( ) were not dosed with any sorbent.
A0.15
0.12
0.09
0.06
0.03
0
0.12
0.09
0.06
0.03
0
0 500 1000 1500 2000 2500 0 500 1000 1500 2000 2500 3000
B
C
D
Molecular Weight (kDa) Molecular Weight (kDa)
FL
U I
nte
nsi
ty (
QS
E)
FL
U I
nte
nsi
ty (
QS
E)
Raw 5 mg•L-1 10 mg•L-1
20 mg•L-1 35 mg•L-1 50 mg•L-1
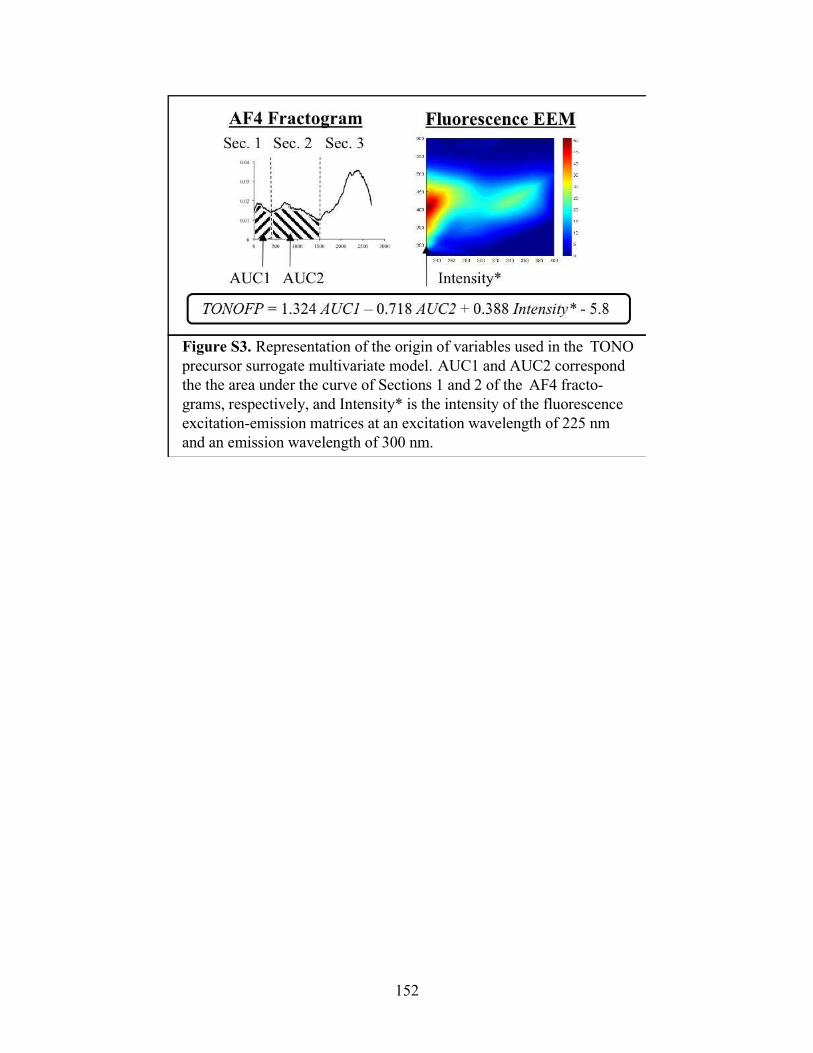
152
Figure S3. Representation of the origin of variables used in the TONO
precursor surrogate multivariate model. AUC1 and AUC2 correspond
the the area under the curve of Sections 1 and 2 of the AF4 fracto-
grams, respectively, and Intensity* is the intensity of the fluorescence
excitation-emission matrices at an excitation wavelength of 225 nm
and an emission wavelength of 300 nm.

153
Table S4. AF4-FLD and Fluorescence EEM Data for TONOFP Surrogate Model
Sample Name Carbon Type Dose
(mg⋅⋅⋅⋅L-1)
AUC1a AUC2a Intensity*b
Raw - 0 5.67 12.02 22.78 C1-5 CNT 1 5 7.20 15.73 20.86
C1-10 CNT 1 10 11.72 26.49 20.09 C1-20 CNT 1 20 9.38 20.76 17.42 C1-35 CNT 1 35 7.99 21.57 18.78 C1-50 CNT 1 50 7.50 20.82 16.20 C2-5 CNT 2 5 7.14 16.60 25.68
C2-10 CNT 2 10 12.75 28.38 23.04 C2-20 CNT 2 20 8.86 21.30 20.13 C2-35 CNT 2 35 6.85 17.15 18.99 C2-50 CNT 2 50 2.06 8.27 17.23 C3-5 CNT 3 5 8.75 17.84 25.72
C3-10 CNT 3 10 9.69 20.53 23.35 C3-20 CNT 3 20 8.40 19.50 22.87 C3-35 CNT 3 35 7.11 18.91 18.07 C3-50 CNT 3 50 5.72 15.64 14.25 C4-5 PAC 5 8.64 16.09 25.45
C4-10 PAC 10 8.35 14.37 23.19 C4-20 PAC 20 8.89 21.13 21.01 C4-35 PAC 35 8.25 19.05 15.08 C4-50 PAC 50 7.01 15.45 12.11
a For a description of the variables AUC1 and AUC2, see Section 2.4.4 of the manuscript. b Fluorescence intensity at I225/300 detailed in Section 2.5 of the manuscript.
154
References
Needham, E. M., Sidney, S. M., Chimka, J. R. and Fairey, J. L., 2016. Trihalomethane, dihaloacetonitrile, and total N-nitrosamine precursor adsorption by carbon nanotubes: the importance of surface oxides and pore volume. Environmental Science-Water Research & Technology 2 (6), 1004-1013.

155
Chapter 5
Conclusion
156
1. Summary
Chapter 2 utilized batch application of CNTs to demonstrate their efficacy to remove
precursors of TTHMs, DHANs, and TONO, thereby addressing Objective 1. Additionally,
numerical modeling of adsorption of DBP precursors from multiple water types indicated that
carboxyl functional groups on the CNT surfaces led to increased cumulative pore volume, which
resulted in enhanced DBP precursor adsorption. These conclusions informed the experimental
design of the adsorption studies in Chapter 4.
Chapter 3 addressed Objective 2 through the development of an AF4-FLD method to
characterize protein-like NOM in EfOM-enriched samples from local WWTPs. QA/QC practices
for TONO measurement were further developed through the use of SPE standard curves and an
adjustment to account for TONO chamber degradation. The TONO precursor surrogate
developed based on metrics from fluorescence EEMs and the AF4-FLD method is capable of
tracking changes in TONOFP from oxidative treatment processes (R2 = 0.996). Beyond this
research effort, this TONO precursor surrogate is transformational for the future development of
strategies to curb TONO formation.
Objective 3 was addressed in Chapter 4 in which physical and chemical CNT
characteristics identified in Chapter 2 informed the selection of 12 CNT types for screening and
ultimately three CNTs for use in batch adsorption studies to assess removal of TONO, TTHM,
and DHAN precursors. Numerical modeling of batch adsorption data yielded information about
physiochemical properties controlling DBP precursor adsorption. Primarily, specific surface area
controlled the adsorption of TTHM and DHAN precursors while cumulative pore volume and
surface oxygen content controlled the adsorption of TONO precursors. Batch sorption data was
also used to successfully develop a TONO precursor surrogate based on metrics from AF4-FLD
157
and fluorescence EEMs that describe TONO precursor removal through sorption processes (R2 =
0.576). This TONO precursor surrogate was utilized to determine that CNT mats – consisting of
freeform CNT microstructures affixed to a silicon substrate – can sorb TONO precursors in
continuous flow through mode, providing a proof-of-concept for this novel application.
2. Significance and Future Work
The findings from this work provide mechanistic insights into DBP precursor adsorption
by CNTs, and reveal the importance of tuning surface chemistry differently for TONO as
compared to TTHMs and DHANs. As CNTs have not yet been considered for use in drinking
water treatment plants, this work demonstrates their potential for DBP precursor adsorption and
the need for their continued development, particularly in applications in which they are affixed to
substrates to minimize fate and toxicity concerns. The use of numerical modeling to understand
the experimental data collected in this study highlighted physical and chemical properties of
CNTs that should be modified to enhance DBP precursor adsorption. Future work should include
adsorption studies with freeform CNTs, with surface chemistries specifically designed to target
particular types of DBP precursors.
A novel AF4-FLD method was developed that, in combination with metrics from whole
water fluorescence EEMs, can predict changes in TONO precursors from oxidative treatment
processes. A similar metric was developed to assess adsorption of TONO precursors with CNTs.
Future studies should be completed with an extensive suite of waters (i.e., varying DBP
precursor concentrations) that have been subjected to a diverse array of treatment processes to
further develop and refine TONO precursor surrogates. Insights from the development of such
surrogates can also be used in future work to explore the physicochemical properties of TONO
158
precursors, to help optimize treatment processes and curb formation of N-Nitrosamines in
drinking water systems.