total productive maintenance - vietnam world class ... · total productive maintenance (tpm) is the...
TRANSCRIPT
1 © 2009 Strategos, Inc.
www.strategosinc.comC O N S U L T A N T S E N G I N E E R S S T R A T E G I S T S
Total Productive Maintenance
TPM
By Quarterman Lee, P.E.
Strategos, Inc.
06 January 2009
Strategos, Inc. 3916 Wyandotte Kansas City MO 64111 USA 816-931-1414
2 © 2009 Strategos, Inc.
Total Productive Maintenance Quarterman Lee
26 July 2008
Introduction Total Productive Maintenance (TPM) is the maintenance sub-system of Lean Manufacturing. TPM improves manufacturing performance by reducing cost, improving quality and increasing productivity.
As with other parts of Lean, TPM borrows tools and techniques from other disciplines as well as previously developed and proven maintenance techniques. The combination, integrated as a system and further integrated with the larger Lean system, produces results far beyond the individual techniques; i.e., the system is more than the sum of its parts.
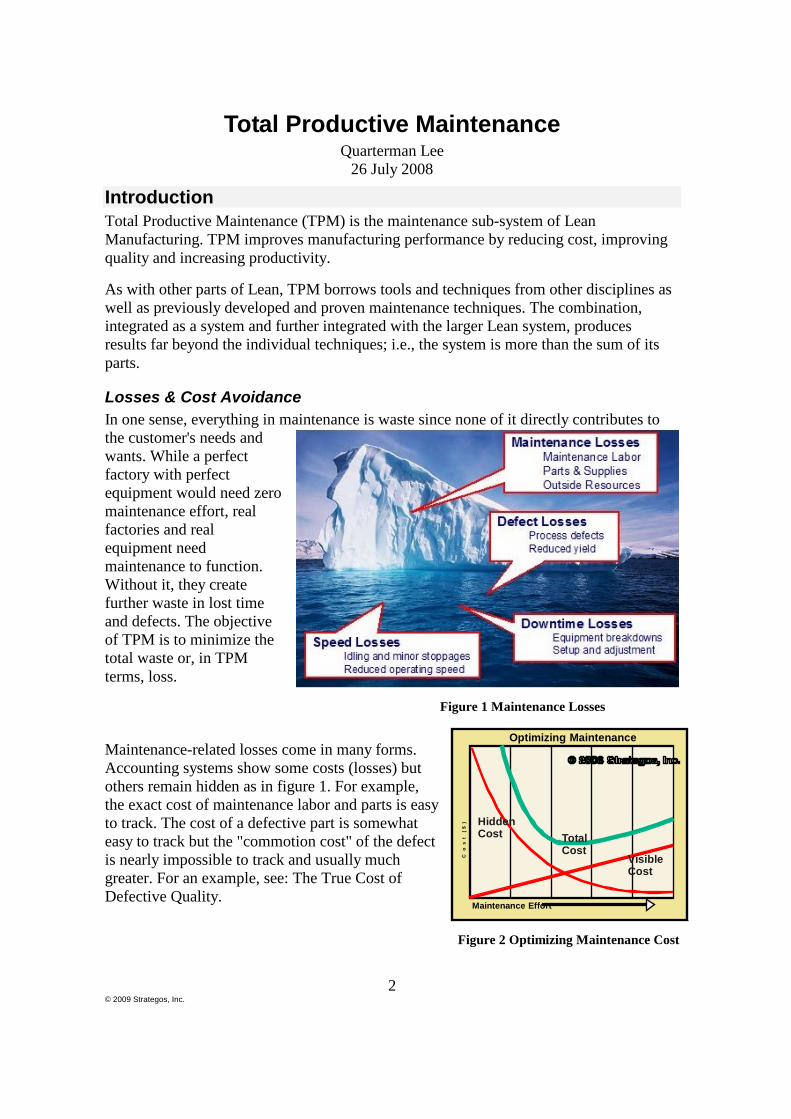
Losses & Cost Avoidance In one sense, everything in maintenance is waste since none of it directly contributes to the customer's needs and wants. While a perfect factory with perfect equipment would need zero maintenance effort, real factories and real equipment need maintenance to function. Without it, they create further waste in lost time and defects. The objective of TPM is to minimize the total waste or, in TPM terms, loss.
Figure 1 Maintenance Losses
Maintenance-related losses come in many forms. Accounting systems show some costs (losses) but others remain hidden as in figure 1. For example, the exact cost of maintenance labor and parts is easy to track. The cost of a defective part is somewhat easy to track but the "commotion cost" of the defect is nearly impossible to track and usually much greater. For an example, see: The True Cost of Defective Quality.
Figure 2 Optimizing Maintenance Cost
Optimizing Maintenance
Co
st
($
)
Maintenance Effort
VisibleCost
TotalCost
HiddenCost
3 © 2009 Strategos, Inc.
The trick is to find the balance between direct maintenance expenditures and the hidden costs while ensuring that maintenance resources are effectively used. Analytically and quantitatively, this is very difficult. From this author's experience and observation, however, few (if any) factories spend too much on maintenance. Most operate far to the left on the total Cost Curve of figure 2. Well-managed maintenance is nearly always a good investment.
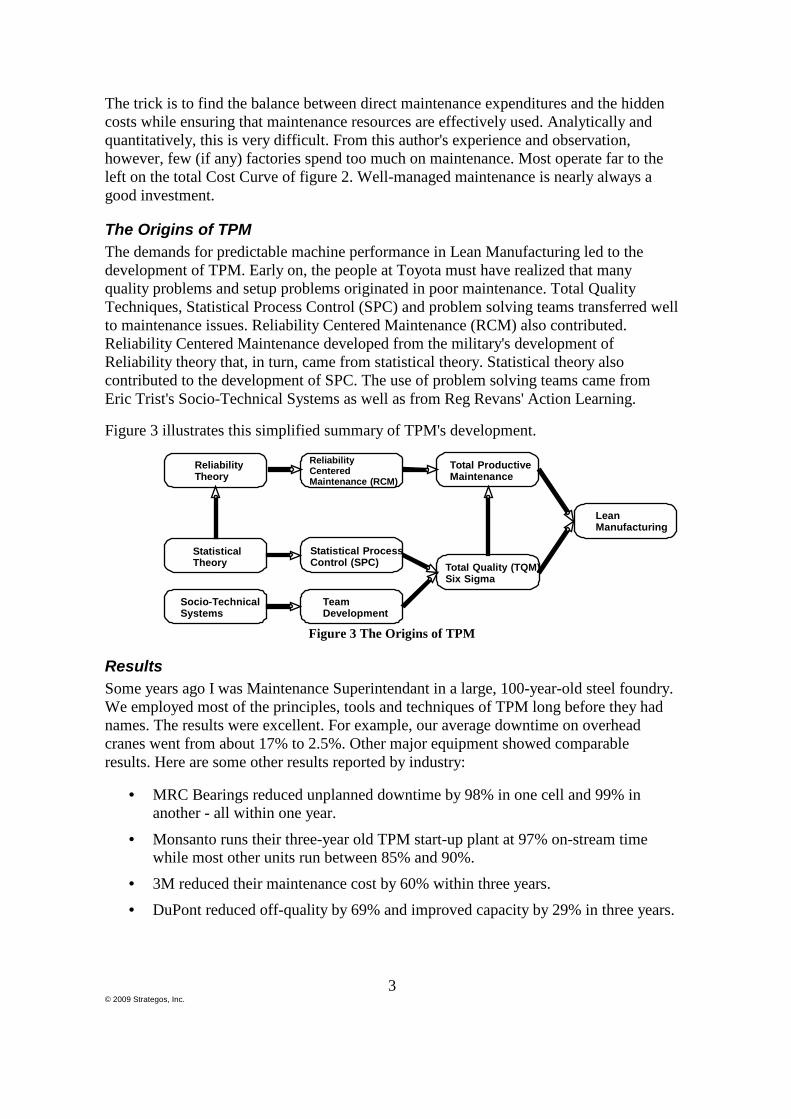
The Origins of TPM The demands for predictable machine performance in Lean Manufacturing led to the development of TPM. Early on, the people at Toyota must have realized that many quality problems and setup problems originated in poor maintenance. Total Quality Techniques, Statistical Process Control (SPC) and problem solving teams transferred well to maintenance issues. Reliability Centered Maintenance (RCM) also contributed. Reliability Centered Maintenance developed from the military's development of Reliability theory that, in turn, came from statistical theory. Statistical theory also contributed to the development of SPC. The use of problem solving teams came from Eric Trist's Socio-Technical Systems as well as from Reg Revans' Action Learning.
Figure 3 illustrates this simplified summary of TPM's development.
Figure 3 The Origins of TPM
Results Some years ago I was Maintenance Superintendant in a large, 100-year-old steel foundry. We employed most of the principles, tools and techniques of TPM long before they had names. The results were excellent. For example, our average downtime on overhead cranes went from about 17% to 2.5%. Other major equipment showed comparable results. Here are some other results reported by industry:
• MRC Bearings reduced unplanned downtime by 98% in one cell and 99% in another - all within one year.
• Monsanto runs their three-year old TPM start-up plant at 97% on-stream time while most other units run between 85% and 90%.
• 3M reduced their maintenance cost by 60% within three years. • DuPont reduced off-quality by 69% and improved capacity by 29% in three years.
Socio-TechnicalSystems
Statistical ProcessControl (SPC)
TeamDevelopment
Total Quality (TQM)Six Sigma
StatisticalTheory
Total ProductiveMaintenance
ReliabilityCenteredMaintenance (RCM)
ReliabilityTheory
LeanManufacturing
4 © 2009 Strategos, Inc.
• Harley-Davidson estimates that the ROI from TPM has been ten-fold to the cost of implementation.
• Kodak reported a $5 million investment in TPM that resulted in a $16 million increase in profits.
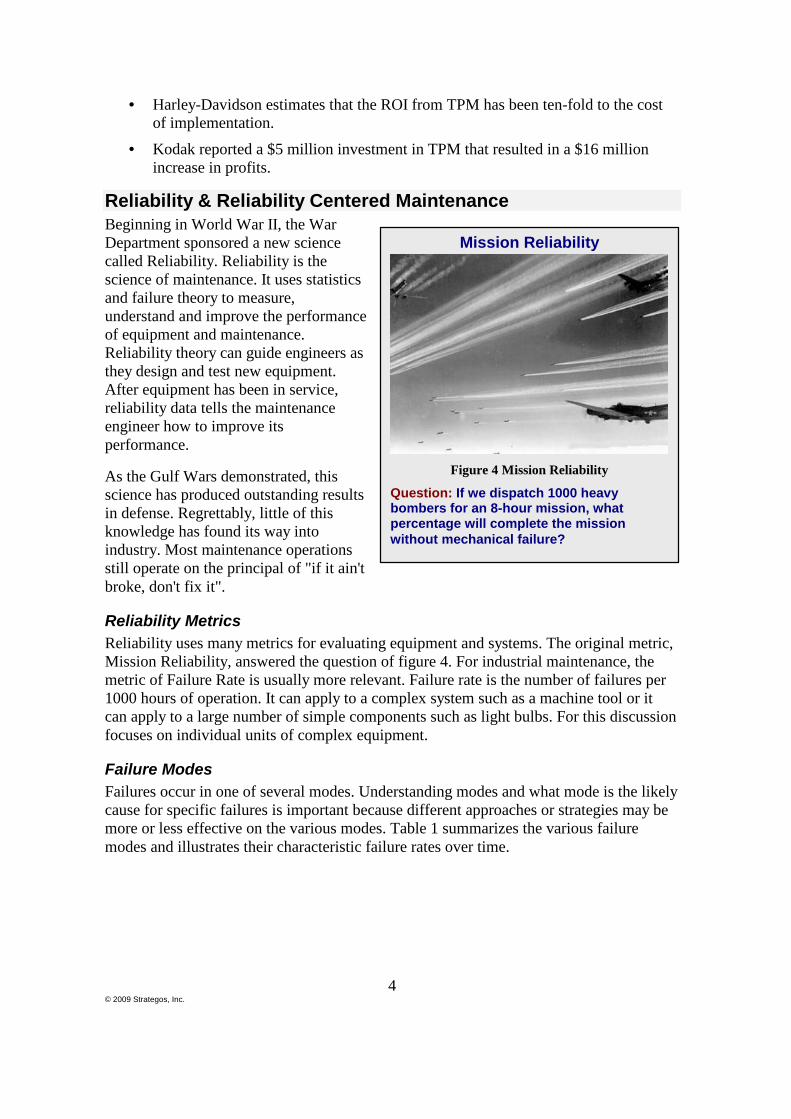
Reliability & Reliability Centered Maintenance Beginning in World War II, the War Department sponsored a new science called Reliability. Reliability is the science of maintenance. It uses statistics and failure theory to measure, understand and improve the performance of equipment and maintenance. Reliability theory can guide engineers as they design and test new equipment. After equipment has been in service, reliability data tells the maintenance engineer how to improve its performance.
As the Gulf Wars demonstrated, this science has produced outstanding results in defense. Regrettably, little of this knowledge has found its way into industry. Most maintenance operations still operate on the principal of "if it ain't broke, don't fix it".
Reliability Metrics Reliability uses many metrics for evaluating equipment and systems. The original metric, Mission Reliability, answered the question of figure 4. For industrial maintenance, the metric of Failure Rate is usually more relevant. Failure rate is the number of failures per 1000 hours of operation. It can apply to a complex system such as a machine tool or it can apply to a large number of simple components such as light bulbs. For this discussion focuses on individual units of complex equipment.
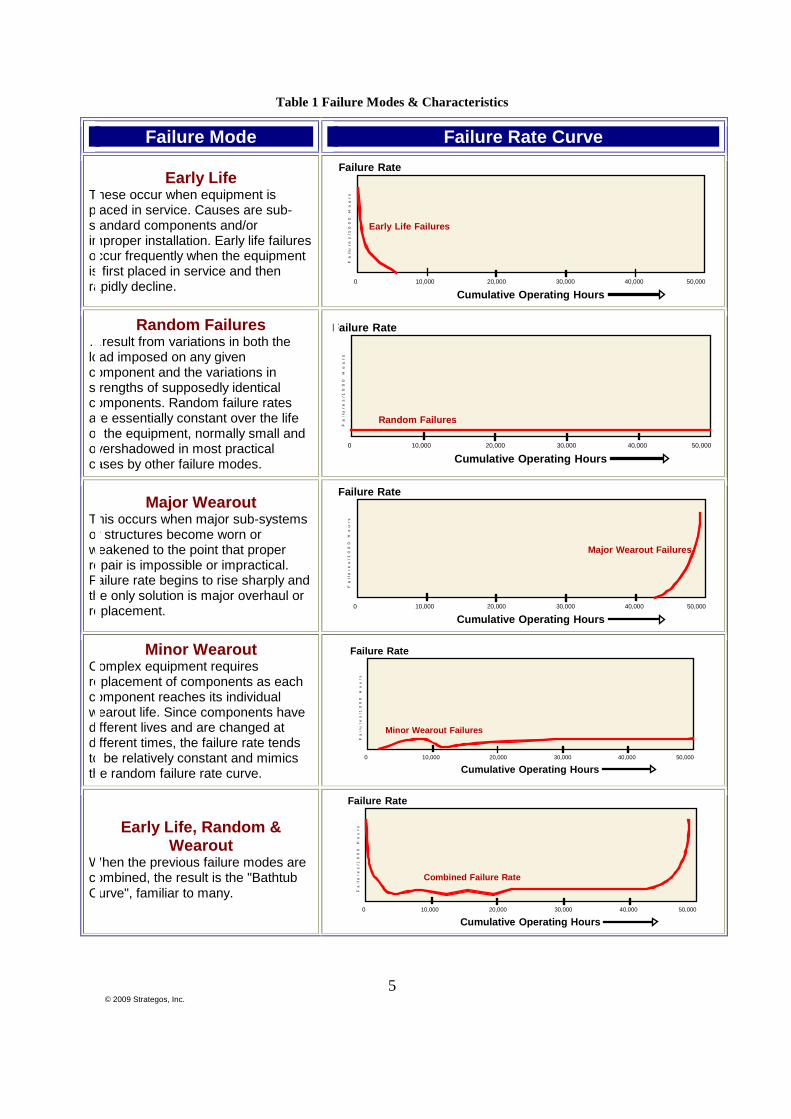
Failure Modes Failures occur in one of several modes. Understanding modes and what mode is the likely cause for specific failures is important because different approaches or strategies may be more or less effective on the various modes. Table 1 summarizes the various failure modes and illustrates their characteristic failure rates over time.
Mission Reliability
Figure 4 Mission Reliability
Question: If we dispatch 1000 heavy bombers for an 8-hour mission, what percentage will complete the mission without mechanical failure?
5 © 2009 Strategos, Inc.
Table 1 Failure Modes & Characteristics
Failure Mode Failure Rate Curve
Early Life These occur when equipment is placed in service. Causes are sub-standard components and/or improper installation. Early life failures occur frequently when the equipment is first placed in service and then rapidly decline. 10,000
Cumulative Operating Hours
Failure Rate
Fa
ilu
res
/10
00
Ho
ur
s
20,000 30,000 40,000 50,0000
Early Life Failures
Random Failures …result from variations in both the load imposed on any given component and the variations in strengths of supposedly identical components. Random failure rates are essentially constant over the life of the equipment, normally small and overshadowed in most practical cases by other failure modes.
10,000
Cumulative Operating Hours
Failure RateF
ail
ur
es
/10
00
Ho
ur
s
20,000 30,000 40,000 50,0000
Random Failures
Major Wearout This occurs when major sub-systems or structures become worn or weakened to the point that proper repair is impossible or impractical. Failure rate begins to rise sharply and the only solution is major overhaul or replacement. 10,000
Cumulative Operating Hours
Failure Rate
Fa
ilu
re
s/1
00
0H
ou
rs
20,000 30,000 40,000 50,0000
Major Wearout Failures
Minor Wearout Complex equipment requires replacement of components as each component reaches its individual wearout life. Since components have different lives and are changed at different times, the failure rate tends to be relatively constant and mimics the random failure rate curve.
10,000
Cumulative Operating Hours
Failure Rate
Fa
ilu
res
/10
00
Ho
urs
20,000 30,000 40,000 50,0000
Minor Wearout Failures
Early Life, Random & Wearout
When the previous failure modes are combined, the result is the "Bathtub Curve", familiar to many.
10,000
Cumulative Operating Hours
Failure Rate
Fa
ilu
re
s/1
00
0H
ou
rs
20,000 30,000 40,000 50,0000
Combined Failure Rate
6 © 2009 Strategos, Inc.
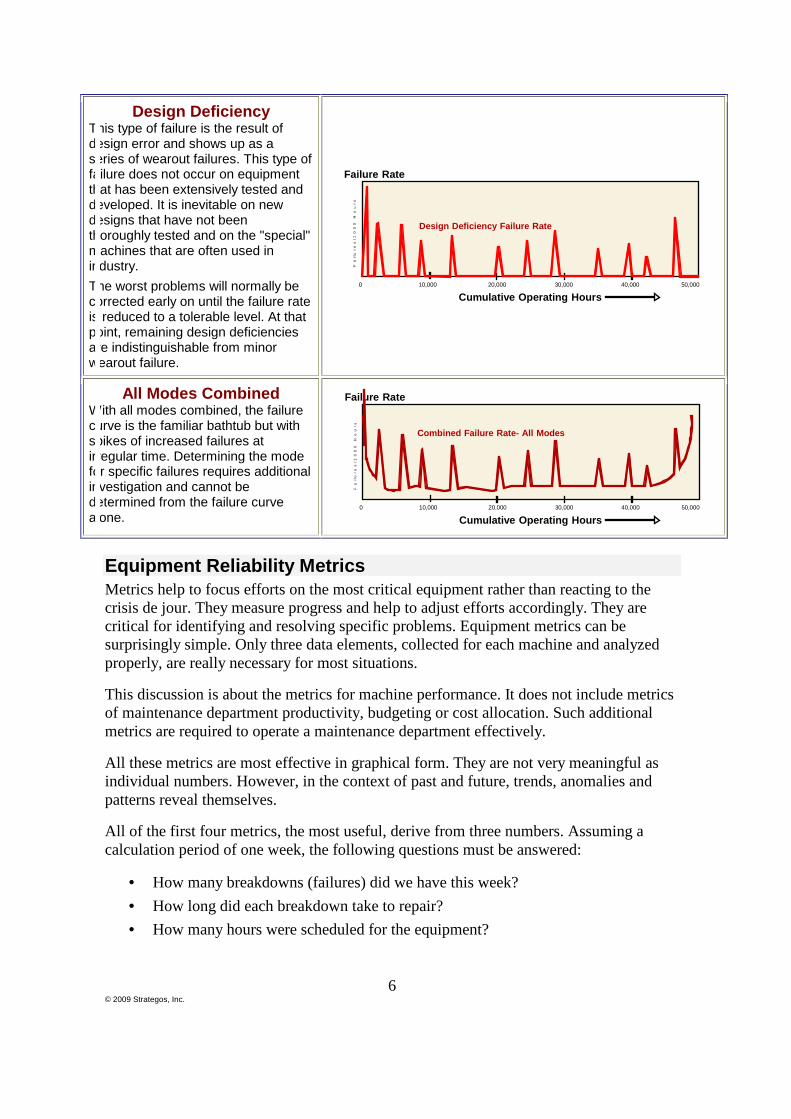
Design Deficiency This type of failure is the result of design error and shows up as a series of wearout failures. This type of failure does not occur on equipment that has been extensively tested and developed. It is inevitable on new designs that have not been thoroughly tested and on the "special" machines that are often used in industry. The worst problems will normally be corrected early on until the failure rate is reduced to a tolerable level. At that point, remaining design deficiencies are indistinguishable from minor wearout failure.
10,000
Cumulative Operating Hours
Failure Rate
Fa
ilu
re
s/1
00
0H
ou
rs
20,000 30,000 40,000 50,0000
Design Deficiency Failure Rate
All Modes Combined With all modes combined, the failure curve is the familiar bathtub but with spikes of increased failures at irregular time. Determining the mode for specific failures requires additional investigation and cannot be determined from the failure curve alone.
10,000
Cumulative Operating Hours
Failure Rate
Fa
ilu
re
s/1
00
0H
ou
rs
20,000 30,000 40,000 50,0000
Combined Failure Rate- All Modes
Equipment Reliability Metrics Metrics help to focus efforts on the most critical equipment rather than reacting to the crisis de jour. They measure progress and help to adjust efforts accordingly. They are critical for identifying and resolving specific problems. Equipment metrics can be surprisingly simple. Only three data elements, collected for each machine and analyzed properly, are really necessary for most situations.
This discussion is about the metrics for machine performance. It does not include metrics of maintenance department productivity, budgeting or cost allocation. Such additional metrics are required to operate a maintenance department effectively.
All these metrics are most effective in graphical form. They are not very meaningful as individual numbers. However, in the context of past and future, trends, anomalies and patterns reveal themselves.
All of the first four metrics, the most useful, derive from three numbers. Assuming a calculation period of one week, the following questions must be answered:
• How many breakdowns (failures) did we have this week? • How long did each breakdown take to repair? • How many hours were scheduled for the equipment?
7 © 2009 Strategos, Inc.
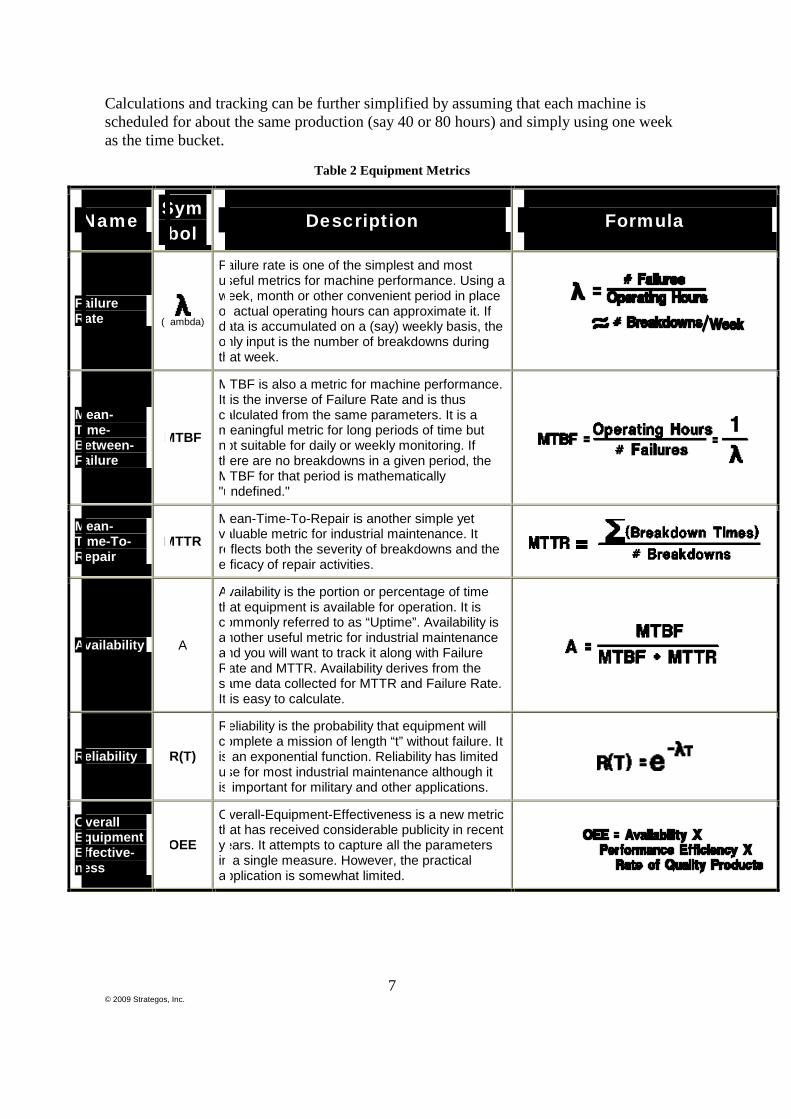
Calculations and tracking can be further simplified by assuming that each machine is scheduled for about the same production (say 40 or 80 hours) and simply using one week as the time bucket.
Table 2 Equipment Metrics
Name Symbol
Description Formula
Failure Rate
(Lambda)
Failure rate is one of the simplest and most useful metrics for machine performance. Using a week, month or other convenient period in place of actual operating hours can approximate it. If data is accumulated on a (say) weekly basis, the only input is the number of breakdowns during that week.
Mean-Time-Between-Failure
MTBF
MTBF is also a metric for machine performance. It is the inverse of Failure Rate and is thus calculated from the same parameters. It is a meaningful metric for long periods of time but not suitable for daily or weekly monitoring. If there are no breakdowns in a given period, the MTBF for that period is mathematically "undefined."
Mean-Time-To-Repair
MTTR
Mean-Time-To-Repair is another simple yet valuable metric for industrial maintenance. It reflects both the severity of breakdowns and the efficacy of repair activities.
Availability A
Availability is the portion or percentage of time that equipment is available for operation. It is commonly referred to as “Uptime”. Availability is another useful metric for industrial maintenance and you will want to track it along with Failure Rate and MTTR. Availability derives from the same data collected for MTTR and Failure Rate. It is easy to calculate.
Reliability R(T)
Reliability is the probability that equipment will complete a mission of length “t” without failure. It is an exponential function. Reliability has limited use for most industrial maintenance although it is important for military and other applications.
Overall Equipment Effective-ness
OEE
Overall-Equipment-Effectiveness is a new metric that has received considerable publicity in recent years. It attempts to capture all the parameters in a single measure. However, the practical application is somewhat limited.
8 © 2009 Strategos, Inc.
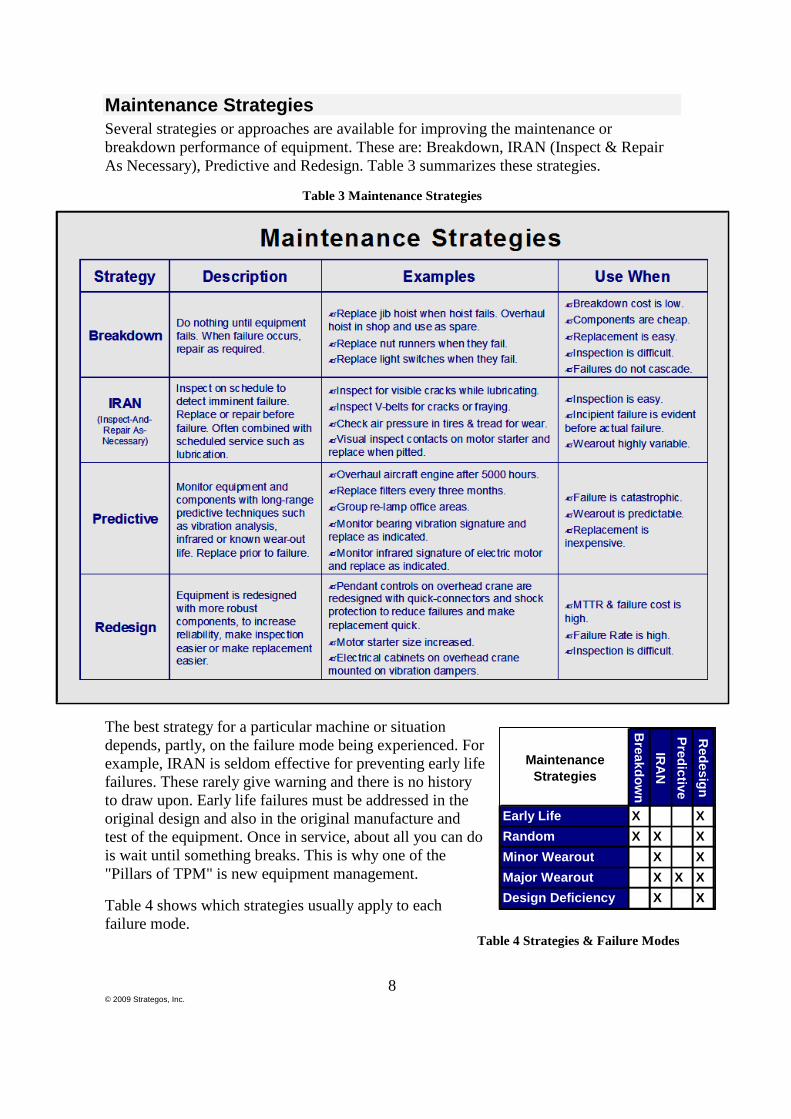
Maintenance Strategies Several strategies or approaches are available for improving the maintenance or breakdown performance of equipment. These are: Breakdown, IRAN (Inspect & Repair As Necessary), Predictive and Redesign. Table 3 summarizes these strategies.
Table 3 Maintenance Strategies
The best strategy for a particular machine or situation depends, partly, on the failure mode being experienced. For example, IRAN is seldom effective for preventing early life failures. These rarely give warning and there is no history to draw upon. Early life failures must be addressed in the original design and also in the original manufacture and test of the equipment. Once in service, about all you can do is wait until something breaks. This is why one of the "Pillars of TPM" is new equipment management.
Table 4 shows which strategies usually apply to each failure mode.
Table 4 Strategies & Failure Modes
Maintenance Strategies
Breakdow
nIR
AN
Predictive
Redesign
Early Life X XRandom X X XMinor Wearout X XMajor Wearout X X XDesign Deficiency X X
9 © 2009 Strategos, Inc.
Note that the redesign (design) strategy applies to all failure modes. Throughout the equipment life, proper design and then redesign as required is the most critical element for ensuring equipment performance. Yet capital equipment is often purchased using price as the primary decision factor.
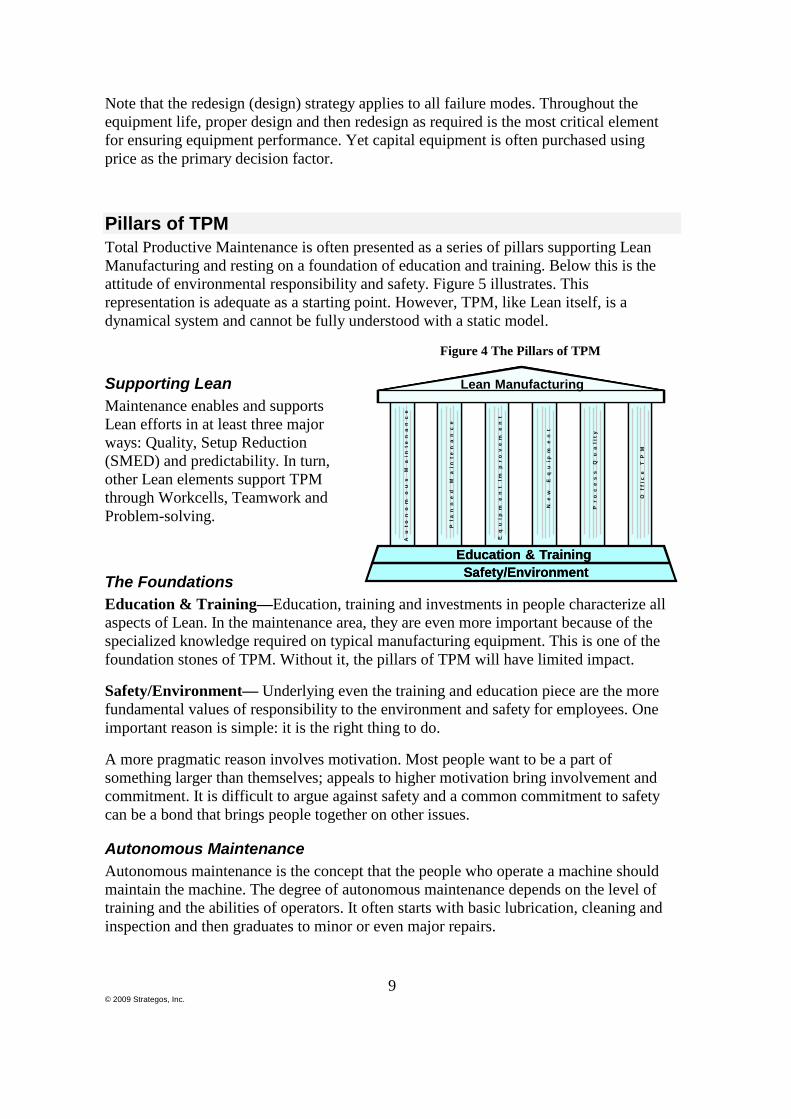
Pillars of TPM Total Productive Maintenance is often presented as a series of pillars supporting Lean Manufacturing and resting on a foundation of education and training. Below this is the attitude of environmental responsibility and safety. Figure 5 illustrates. This representation is adequate as a starting point. However, TPM, like Lean itself, is a dynamical system and cannot be fully understood with a static model.
Figure 4 The Pillars of TPM
Supporting Lean Maintenance enables and supports Lean efforts in at least three major ways: Quality, Setup Reduction (SMED) and predictability. In turn, other Lean elements support TPM through Workcells, Teamwork and Problem-solving.
The Foundations Education & Training—Education, training and investments in people characterize all aspects of Lean. In the maintenance area, they are even more important because of the specialized knowledge required on typical manufacturing equipment. This is one of the foundation stones of TPM. Without it, the pillars of TPM will have limited impact.
Safety/Environment— Underlying even the training and education piece are the more fundamental values of responsibility to the environment and safety for employees. One important reason is simple: it is the right thing to do.
A more pragmatic reason involves motivation. Most people want to be a part of something larger than themselves; appeals to higher motivation bring involvement and commitment. It is difficult to argue against safety and a common commitment to safety can be a bond that brings people together on other issues.
Autonomous Maintenance Autonomous maintenance is the concept that the people who operate a machine should maintain the machine. The degree of autonomous maintenance depends on the level of training and the abilities of operators. It often starts with basic lubrication, cleaning and inspection and then graduates to minor or even major repairs.
Au
ton
om
ou
sM
ain
ten
an
ce
Pla
nn
ed
Ma
inte
na
nc
e
Eq
uip
me
nt
Imp
ro
ve
me
nt
Ne
wE
qu
ipm
en
t
Pr
oc
es
sQ
ua
lit
y
Off
ice
TP
M
Education & TrainingSafety/Environment
Lean ManufacturingA
uto
no
mo
us
Ma
inte
na
nc
e
Pla
nn
ed
Ma
inte
na
nc
e
Eq
uip
me
nt
Imp
ro
ve
me
nt
Ne
wE
qu
ipm
en
t
Pr
oc
es
sQ
ua
lit
y
Off
ice
TP
M
Education & TrainingSafety/Environment
Lean Manufacturing
10 © 2009 Strategos, Inc.
For example, in the foundry where this author worked, machinists repaired and overhauled their own machine tools. A trained and competent machinist is certainly capable of overhauling a gearbox. And, as the users, they tended to know the equipment intimately. In the military, everyone cleans their own weapon. When their life depends on proper functioning, people take more care.
Autonomous maintenance frees resources in the maintenance department for the other activities such as equipment improvement or major overhauls. It amplifies the maintenance efforts and involves the operators who then take better care of the equipment.
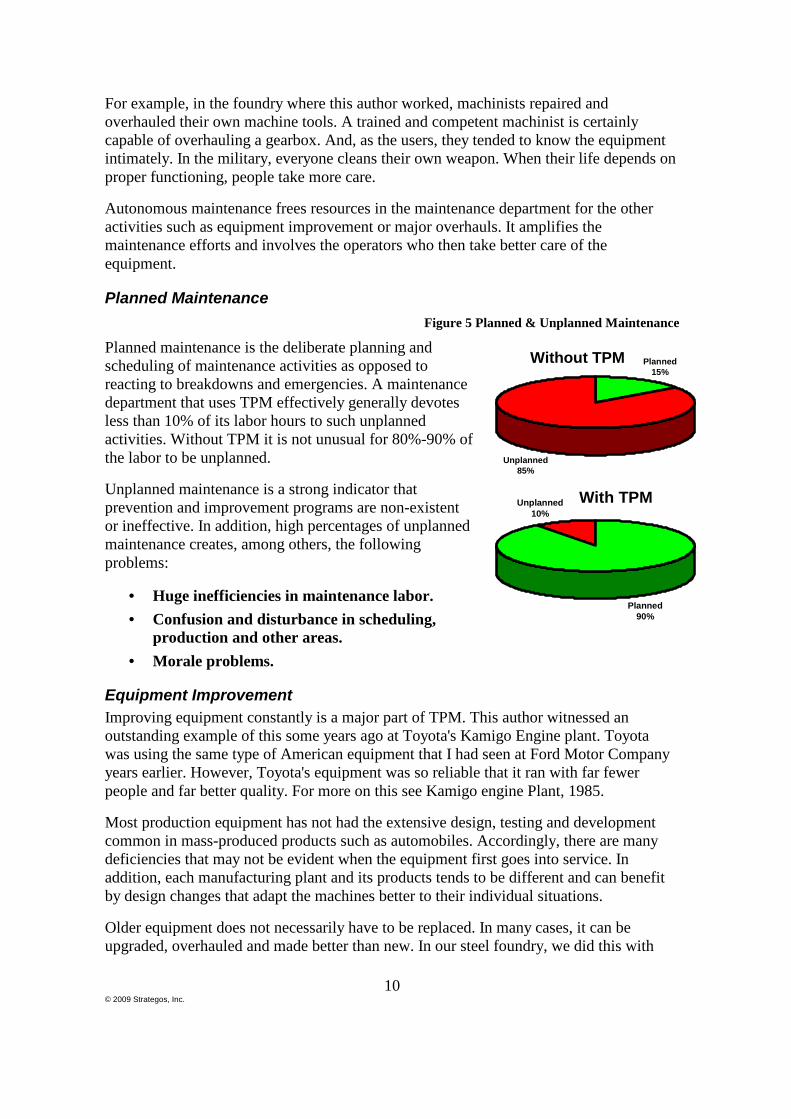
Planned Maintenance Figure 5 Planned & Unplanned Maintenance
Planned maintenance is the deliberate planning and scheduling of maintenance activities as opposed to reacting to breakdowns and emergencies. A maintenance department that uses TPM effectively generally devotes less than 10% of its labor hours to such unplanned activities. Without TPM it is not unusual for 80%-90% of the labor to be unplanned.
Unplanned maintenance is a strong indicator that prevention and improvement programs are non-existent or ineffective. In addition, high percentages of unplanned maintenance creates, among others, the following problems:
• Huge inefficiencies in maintenance labor. • Confusion and disturbance in scheduling,
production and other areas. • Morale problems.
Equipment Improvement Improving equipment constantly is a major part of TPM. This author witnessed an outstanding example of this some years ago at Toyota's Kamigo Engine plant. Toyota was using the same type of American equipment that I had seen at Ford Motor Company years earlier. However, Toyota's equipment was so reliable that it ran with far fewer people and far better quality. For more on this see Kamigo engine Plant, 1985.
Most production equipment has not had the extensive design, testing and development common in mass-produced products such as automobiles. Accordingly, there are many deficiencies that may not be evident when the equipment first goes into service. In addition, each manufacturing plant and its products tends to be different and can benefit by design changes that adapt the machines better to their individual situations.
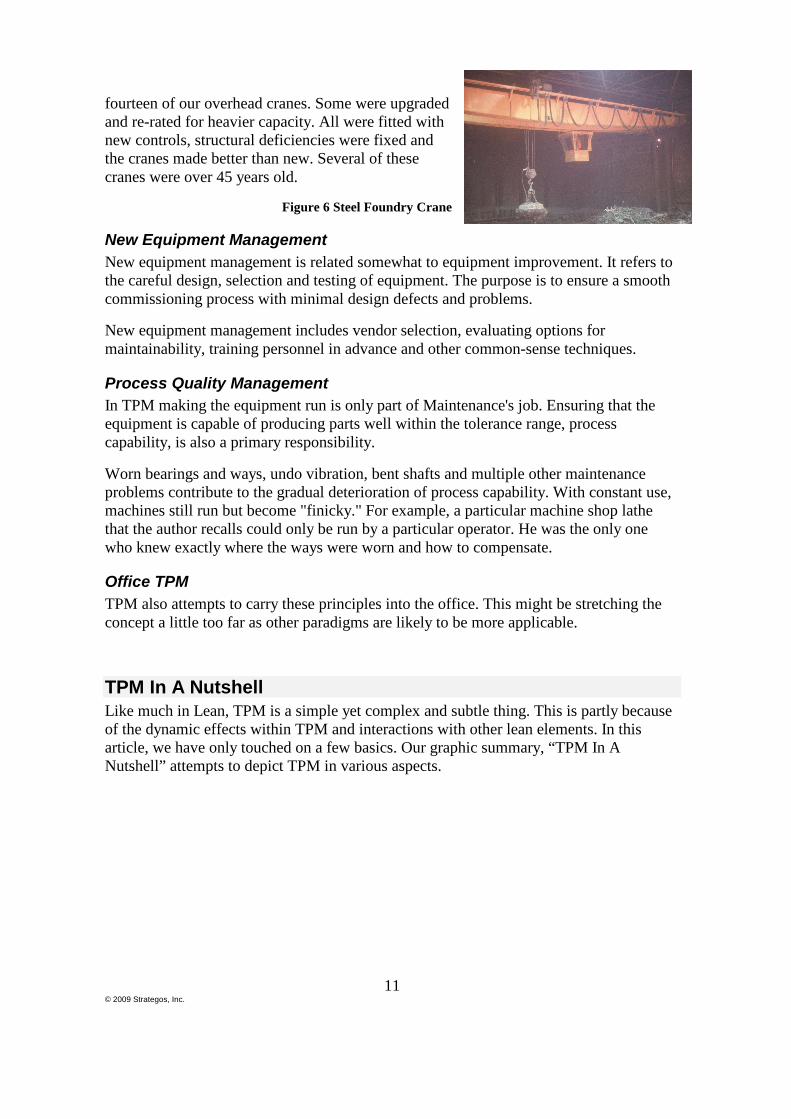
Older equipment does not necessarily have to be replaced. In many cases, it can be upgraded, overhauled and made better than new. In our steel foundry, we did this with
With TPM
Planned90%
Unplanned10%
Without TPM Planned15%
Unplanned85%
11 © 2009 Strategos, Inc.
fourteen of our overhead cranes. Some were upgraded and re-rated for heavier capacity. All were fitted with new controls, structural deficiencies were fixed and the cranes made better than new. Several of these cranes were over 45 years old.
Figure 6 Steel Foundry Crane
New Equipment Management New equipment management is related somewhat to equipment improvement. It refers to the careful design, selection and testing of equipment. The purpose is to ensure a smooth commissioning process with minimal design defects and problems.
New equipment management includes vendor selection, evaluating options for maintainability, training personnel in advance and other common-sense techniques.
Process Quality Management In TPM making the equipment run is only part of Maintenance's job. Ensuring that the equipment is capable of producing parts well within the tolerance range, process capability, is also a primary responsibility.
Worn bearings and ways, undo vibration, bent shafts and multiple other maintenance problems contribute to the gradual deterioration of process capability. With constant use, machines still run but become "finicky." For example, a particular machine shop lathe that the author recalls could only be run by a particular operator. He was the only one who knew exactly where the ways were worn and how to compensate.
Office TPM TPM also attempts to carry these principles into the office. This might be stretching the concept a little too far as other paradigms are likely to be more applicable.
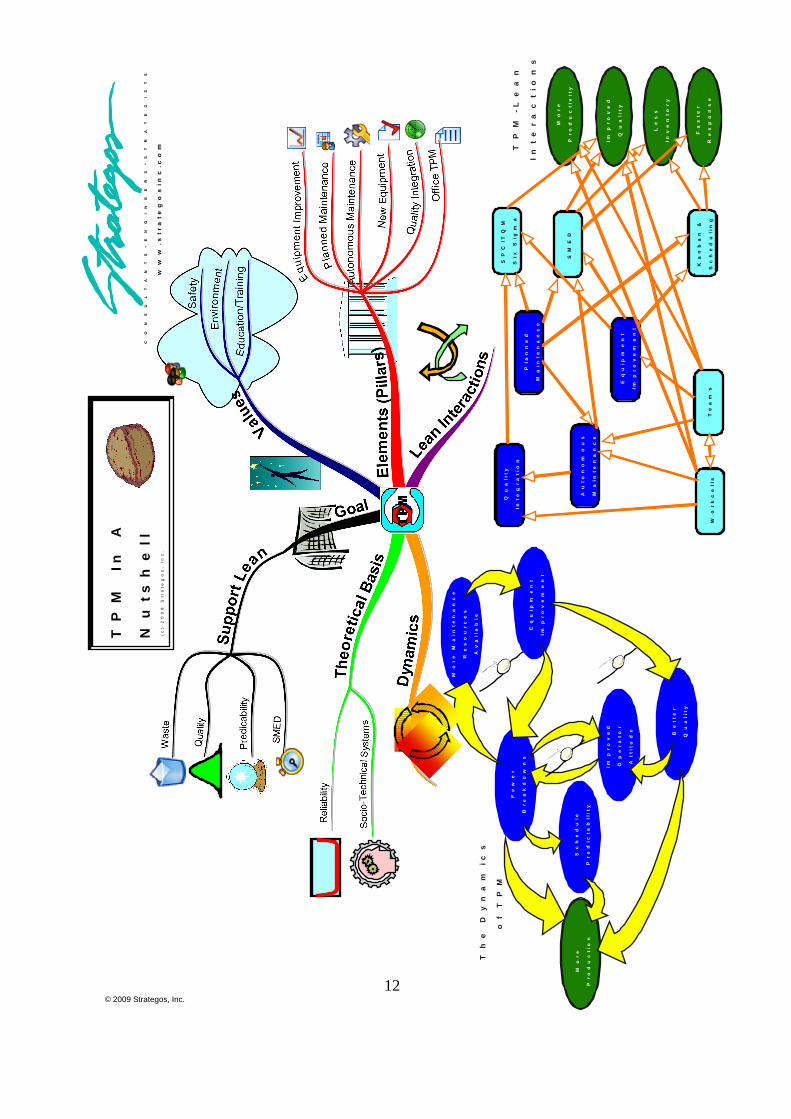
TPM In A Nutshell Like much in Lean, TPM is a simple yet complex and subtle thing. This is partly because of the dynamic effects within TPM and interactions with other lean elements. In this article, we have only touched on a few basics. Our graphic summary, “TPM In A Nutshell” attempts to depict TPM in various aspects.
12 © 2009 Strategos, Inc.
Fe
we
r
Br
ea
kd
ow
ns
Mo
re
Ma
int
en
an
ce
Re
so
ur
ce
s
Av
ail
ab
le
Eq
uip
me
nt
Imp
ro
ve
me
nt
Mo
re
Pr
od
uc
tio
n
Be
tt
er
Qu
ali
ty
Sc
he
du
le
Pr
ed
icta
bil
ity
Imp
ro
ve
d
Op
er
at
or
At
titu
de
Th
eD
yn
am
ics
of
TP
M
TP
MIn
A
Nu
tsh
ell
(c)
20
08
Str
ate
go
s,
Inc
.w
ww
.st
ra
te
go
sin
c.c
om
CO
NS
UL
TA
NT
S•
EN
GI
NE
ER
S•
ST
RA
TE
GI
ST
S
Mo
re
Pr
od
uc
tiv
ity
TP
M-
Le
an
In
te
ra
ct
io
ns
SM
ED
Ka
nb
an
&
Sc
he
du
lin
gW
or
kc
ell
sT
ea
ms
SP
C/T
QM
Six
Sig
ma
Pla
nn
ed
Ma
int
en
an
ce
Eq
uip
me
nt
Imp
ro
ve
me
nt
Au
ton
om
ou
s
Ma
int
en
an
ce
Qu
ali
ty
Int
eg
ra
tio
n
Imp
ro
ve
d
Qu
ali
ty
Le
ss
Inv
en
to
ry
Fa
st
er
Re
sp
on
se