total revenue change - columbia university in the city of ...df2446/files/petsmart.pdf ·...
TRANSCRIPT

Highlights
Recommendation
We initiate coverage of PetSmart (PETM) stock with a HOLD rating. PetSmart is a fundamentally strong
company with excellent future revenue expectations, the largest industry market share, solid cost controls, and
good competitive positioning. However, these factors are fully reflected in the current stock price.
Industry: The pet industry is part of the consumer discretionary sector, but unlike many companies
in this sector, PetSmart has continued to perform well as pet owners have been unwilling to cut back
on spending for their animals. During this period, pet spending has increased, and we forecast this
increase will continue at a rate of 4-7% per year. The increased humanization of pets will continue to
drive positive comparables for pet spending as pet owners strive to improve the quality of their pet‟s
lives. With these trends, PetSmart will continue to maintain value for shareholders.
Competitive Advantages: PetSmart‟s goal is to provide for the lifetime needs of pets and pet
parents. PetSmart differentiates from competitors by offering merchandise and services under one
roof for pet owners, while catering to the needs of premium, niche, and mass retail customers. It has
established several exclusive partnerships, products, and proprietary consumable options. With
PetSmart‟s superior understanding of customer needs and its PetPerks program, PetSmart has
tailored its services and product offerings to maximize repeat patronage, customer satisfaction, and
desired products. Overall, PetSmart is well positioned in the current market to outperform its major
competitors.
Revenues: Through its advertising and promotions throughout the store, PetSmart cross-sells
customers from grocery brands like “Pedigree” to propriety, organic, and premium brands of pet
food and high revenue margin services like grooming, training, and boarding, PetSmart is ensuring
prolonged revenue growth despite the current economic conditions. These will create increasing
profit margins and same store sales over the coming years.
Company: PetSmart has effectively controlled costs and capital expenditures, allowing it to
maximize profits. Given PetSmart‟s strong financial position, the company has been able to use the
recent market decline as an opportunity to enter new geographical markets.
Risks: Risks include the rate at which new stores are opened, adverse effects on the company‟s
supply chain, loss of key management, and competition. PetSmart faces a risk to losing market
share to its competitors in the industry, particularly big box retailers such as Wal-Mart and Target.
Regional supermarkets also pose a threat to PetSmart, especially for customers who are willing to
buy generic pet food. Smaller pet specialty suppliers pose a threat to the firm as well, especially
online businesses such as Vitahound.com and Pet Meds Express, which have lower overhead due to
a lack of brick-and-mortar establishments.
While these concerns are valid, Wal-Mart announced its intention to gain a 30% market share
several years ago. Today it controls 25% of the Pet Product and Supply market. During this time,
PetSmart consistently increased its market share and year-over-year revenue change percentage in
excess of the industry, demonstrating its rightful place as the top pet specialty retailer. See Total
Revenue Change chart at left.
.
PETM YTD Chart,Source: Google Finance
Total Revenue Change Year over Year
Year
Industry %
Change
PetSmart %
Change
Capture
Rate
2003 9.83% 7.76% -2.07%
2004 6.17% 11.16% 4.99%
2005 5.52% 12.26% 6.74%
2006 6.06% 11.80% 5.74%
2007 7.01% 12.59% 5.57%
2008 4.85% 10.36% 5.51%
2009 5.32% 8.40% 3.08%
2010 4.84% 5.35% 0.52%
U.S Specialty Retailer
NYSE ticker: PETM
Recommendation: HOLD
Current Price: $40.55 (3/16/11)
Target Price: $38-$42
2 Four Peaks Wealth Management
Business Description
The Company
PetSmart, Inc., together with its subsidiaries, provides products, services, and solutions for lifetime needs of
pet owners and is an industry leader with $5.3 billion in revenue for 2010.
Founded in 1986 and headquartered in Phoenix, Arizona, PetSmartemploys 45,000 associates within its 1,149
retail stores, 162 PetsHotels, 740 hospitals under the Banfield and The Pet Hospital trademarks, and 12
Canadian pet hospitals (administered by third parties). It intends to increase the presence of veterinary
services to all PetSmart stores. Through its PetPerks program, PetSmart tracks the needs of its consumers.
Management
In an interview with PetSmart Co-Founder Michael Manson, who worked with Philip L. Francis and Robert
Moran, the management practices and corporate culture was discussed. PetSmart empowers its employees in a
variety of ways.
According to Mr. Manson, store level managers are given the responsibility and authority to make independent
decisions. This allows capable leaders to develop and decreases the risk of any one manager leaving. Both
Philip Francis and Robert Moran maintained this culture and empowerment practice.
PetSmart also provides training classes for its associates. This grants associates transferable skills and, if they
complete all the courses, qualifies them as a Veterinary Assistant. This employee empowerment and
knowledge base improves PetSmart‟s customer service capabilities, and therefore, customer satisfaction.
Most importantly, Mr. Manson discussed the situation in PetSmart at the time that Mr. Francis and Mr. Moran
entered management at PetSmart. The company was rapidly approaching failure, its stock price had
plummeted, and significant changes were required for recovery. The new management team was able to
overcome these obstacles and return PetSmart to profitability.
In addition to capable leadership, PetSmart‟s management team encompasses diverse skill sets and extensive
retail experience.
Executive Chairman Philip L. Francis was the chief executive from 1998 to 2009. Before PetSmart, Mr.
Francis was president and chief executive officer of J. Sainsbury plc. subsidiary, Shaw‟s Supermarkets.
Earlier, he was corporate vice president of Roundy‟s, a wholesale grocery distribution company, from 1988 to
1991.
CEO Robert F. Moran joined PetSmart in July 1999 as president of North American store operations. In
December of 2001, he was appointed president and chief operating officer, and he was named president
andchief executive officer in June 2009. Moran came to PetSmart from Toys „R‟ Us, Ltd., Canada, where he
was president. Prior to that, he spent 20 years with Sears, Roebuck and Company in a variety of financial and
merchandising positions, including president and chief executive officer of Sears de Mexico. From 1991 to
1993, Moran was CFO of GaleriasPreciados, a Spanish department store chain.
Chip Molloy joined PetSmart in October 2007 as the Chief Financial Officer and remains in that position
currently. Prior to joining PetSmart, he held various financial leadership roles with Circuit City, Inc. including
the CFO of Retail Stores. Molloy‟s other finance positions include corporate planning at Capital One
Financial, private equity with AGL Capital Investments, and consulting with Deloitte Consulting. Prior to
entering the private sector, Molloy served in the US Navy as a fighter pilot subsequently retiring as a
Commander from the Naval Reserve.
CMO John Alpaugh was appointed Senior Vice President, Chief Marketing Officer in February 2010. He
joined PetSmart in 1999 and has served in several leadership roles including Vice President of Marketing,
Vice President of Specialty Merchandising, and most recently as Vice President of Strategic Planning and
Business Development. Prior to joining PetSmart, Alpaugh worked in Brand Management for Procter &
Gamble Europe and in Financial Planning and Analysis for IBM.
Stores
PetSmart‟s stores range in size from 14,000 to 27,500 square feet. While all the same services and products are
being offered, most new stores designs have changed, decreasing to about 14,000 square feet in response to
current location choices. Smaller locations provide lower overhead costs while maximizing sales per square
foot.PetSmart is limiting its new store opening to about 40 stores per year for two reasons. First, finding
profitable locations in excess of 40 per year is difficult. Second, this rate of growth allows management to
maximize each location‟s profitability and efficiency. The current real estate climate provides PetSmart
opportunities for lower lease rates and entry into new urban and rural areas as demonstrated by their newest
store openings in New York, New York and Kingman, Arizona.
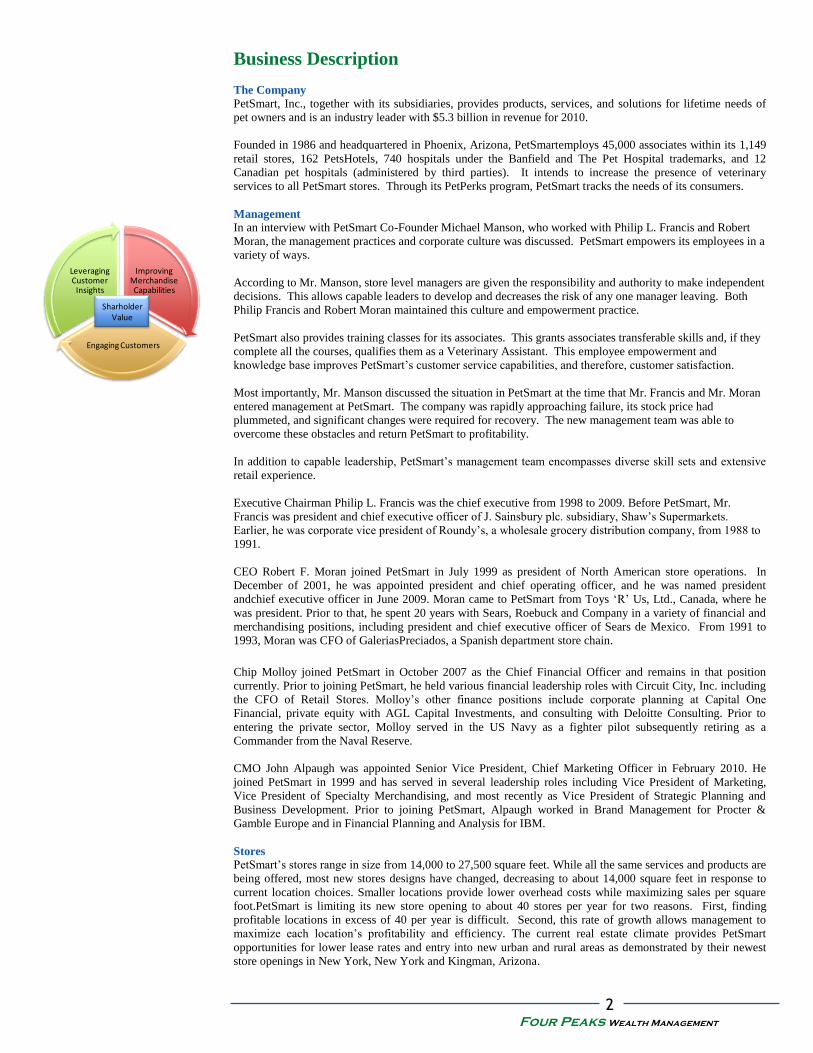
Improving Merchandise Capabilities
Engaging Customers
Leveraging Customer
Insights
SharholderValue
3 Four Peaks Wealth Management
Products
PetSmart offers over 10,000 products. This gives the customer an unparalleled selection of pet products and
services at one location. These products include brand name, customer-requested, proprietary, and private
label products.
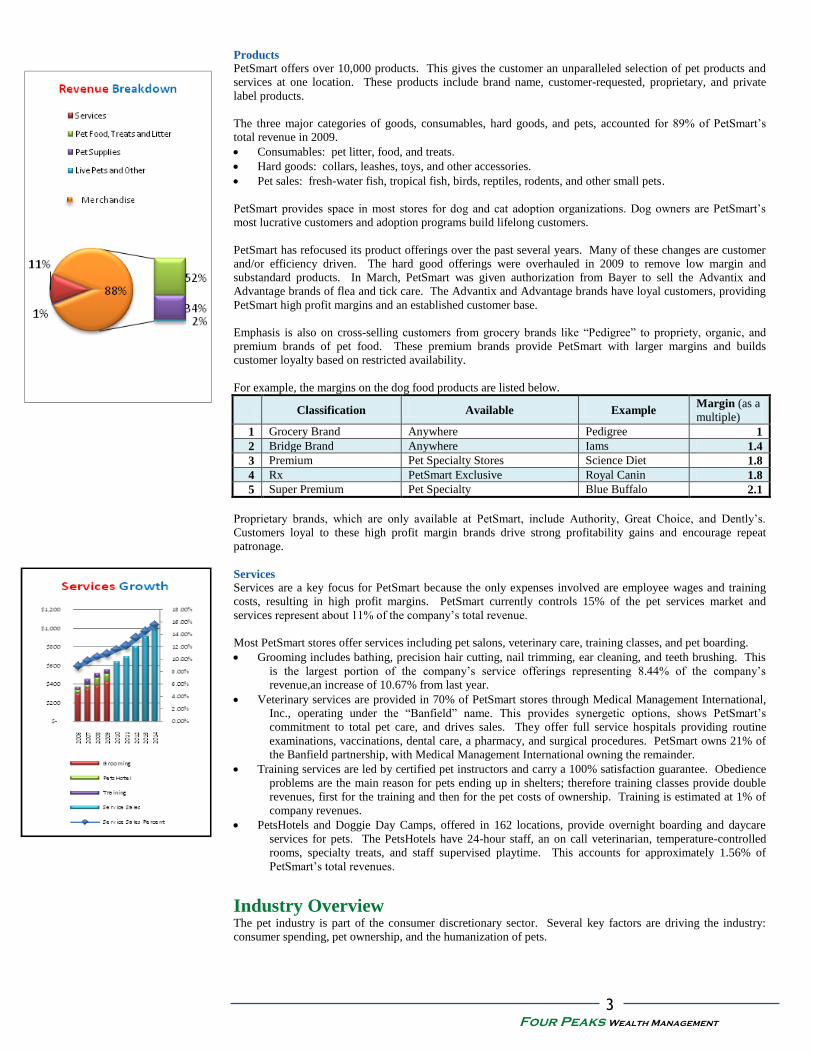
The three major categories of goods, consumables, hard goods, and pets, accounted for 89% of PetSmart‟s
total revenue in 2009.
Consumables: pet litter, food, and treats.
Hard goods: collars, leashes, toys, and other accessories.
Pet sales: fresh-water fish, tropical fish, birds, reptiles, rodents, and other small pets.
PetSmart provides space in most stores for dog and cat adoption organizations. Dog owners are PetSmart‟s
most lucrative customers and adoption programs build lifelong customers.
PetSmart has refocused its product offerings over the past several years. Many of these changes are customer
and/or efficiency driven. The hard good offerings were overhauled in 2009 to remove low margin and
substandard products. In March, PetSmart was given authorization from Bayer to sell the Advantix and
Advantage brands of flea and tick care. The Advantix and Advantage brands have loyal customers, providing
PetSmart high profit margins and an established customer base.
Emphasis is also on cross-selling customers from grocery brands like “Pedigree” to propriety, organic, and
premium brands of pet food. These premium brands provide PetSmart with larger margins and builds
customer loyalty based on restricted availability.
For example, the margins on the dog food products are listed below.
Classification Available Example
Margin (as a
multiple)
1 Grocery Brand Anywhere Pedigree 1
2 Bridge Brand Anywhere Iams 1.4
3 Premium Pet Specialty Stores Science Diet 1.8
4 Rx PetSmart Exclusive Royal Canin 1.8
5 Super Premium Pet Specialty Blue Buffalo 2.1
Proprietary brands, which are only available at PetSmart, include Authority, Great Choice, and Dently‟s.
Customers loyal to these high profit margin brands drive strong profitability gains and encourage repeat
patronage.
Services
Services are a key focus for PetSmart because the only expenses involved are employee wages and training
costs, resulting in high profit margins. PetSmart currently controls 15% of the pet services market and
services represent about 11% of the company‟s total revenue.
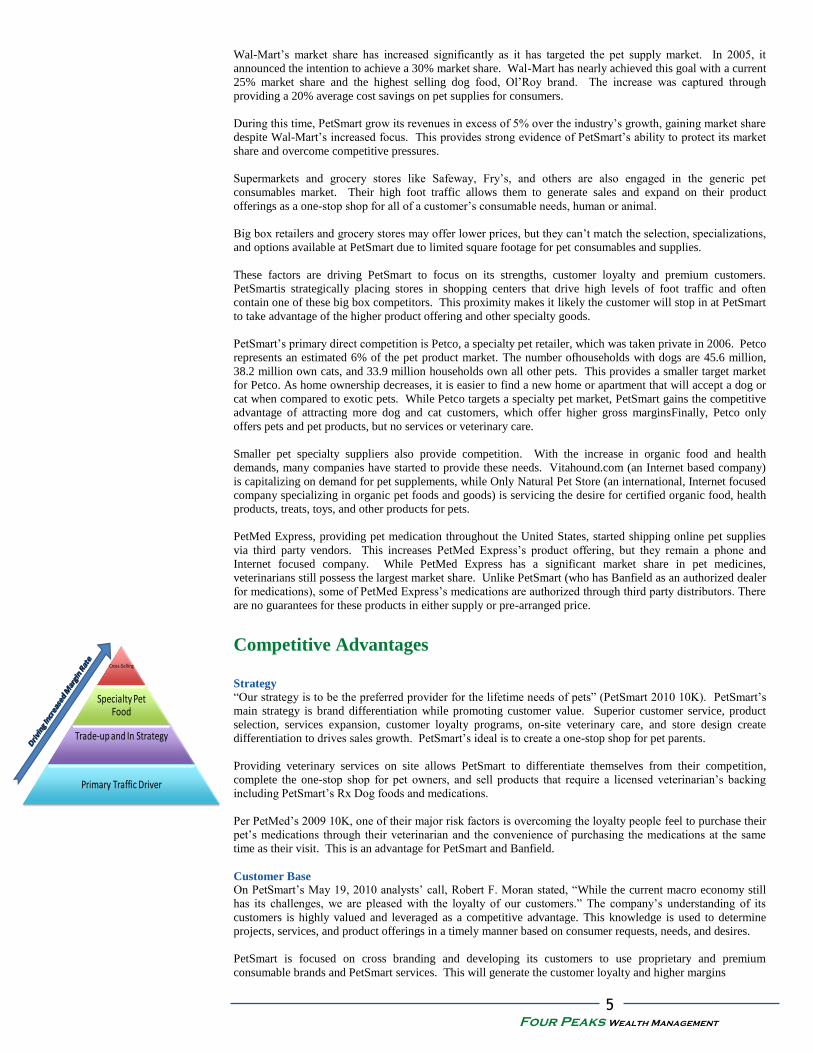
Most PetSmart stores offer services including pet salons, veterinary care, training classes, and pet boarding.
Grooming includes bathing, precision hair cutting, nail trimming, ear cleaning, and teeth brushing. This
is the largest portion of the company‟s service offerings representing 8.44% of the company‟s
revenue,an increase of 10.67% from last year.
Veterinary services are provided in 70% of PetSmart stores through Medical Management International,
Inc., operating under the “Banfield” name. This provides synergetic options, shows PetSmart‟s
commitment to total pet care, and drives sales. They offer full service hospitals providing routine
examinations, vaccinations, dental care, a pharmacy, and surgical procedures. PetSmart owns 21% of
the Banfield partnership, with Medical Management International owning the remainder.
Training services are led by certified pet instructors and carry a 100% satisfaction guarantee. Obedience
problems are the main reason for pets ending up in shelters; therefore training classes provide double
revenues, first for the training and then for the pet costs of ownership. Training is estimated at 1% of
company revenues.
PetsHotels and Doggie Day Camps, offered in 162 locations, provide overnight boarding and daycare
services for pets. The PetsHotels have 24-hour staff, an on call veterinarian, temperature-controlled
rooms, specialty treats, and staff supervised playtime. This accounts for approximately 1.56% of
PetSmart‟s total revenues.
Industry Overview The pet industry is part of the consumer discretionary sector. Several key factors are driving the industry:
consumer spending, pet ownership, and the humanization of pets.

4 Four Peaks Wealth Management
14%
46%
26%
10%4%
Pet Supplies and Products
PetSmart Mass
Grocery Other Pet Specialty
Independent
Consumer Spending
Consumers are cutting back on personal spending budgets rather than decreasing their pet spending; thus
driving continued sales growth through the current financial difficulties.
The American Pet Products Association (APPA) shows consistent consumer spending in the pet industry,
starting in 1994 at approximately $17 billion and growing to $45.5 billion in 2009. This growth is expected to
continue as projections for fiscal year 2010 estimate $47.7 billion in industry revenue. The average annual
growth for the industry is in excess of 6.5% annually.
Despite the recession, pet product retailers are among top performers in the retail industry. Since the real
estate collapse of 2007 pet spending growth is down about 1% to 2% annually, but the industry is still growing
at solid 5% year over year for the past three years.
Humanization
Humanization is treating pets as family members in all legal, emotional, and logistical ways. Eighty-eight
percent of pet owners consider their animals to be members of the family. This drives the willingness of
consumers to spend more on their pets, which affects the industry.
Services According to the American Pet Products Association (APPA) $3.2 billion was spent on pet services in 2008
and $3.4 billion in 2009, establishing a growth trend. For PetSmart, pet services such as grooming and
training represents a high profit margin offering.
Health Care
Veterinary service is a growing industry. Pet parents want the same quality of healthcare they require for
themselves for their pets. Partially due to the increasing costs of veterinary care, interest is increasing for pet
health maintenance products, creating a demand for organic pet food and additional vitamin supplements.
Animal supplements increased 7.4% to $1.4 billion in 2008, making up half of U.S. natural animal nutritional
sales. PetSmart‟s new line of GNC/PetSmart exclusive pet supplements has just been introduced to meet this
demand.
Pet Ownership
Pet ownership is the key driver to PetSmart‟s business. Pet product sales correlate to the number of households
with pets. The APPA‟s 2009/2010 National Pet Owner Survey found that 62% of U.S. households own a pet,
equating to 71.4 million homes (APPA‟s 2009/2010 National Pet Owners Survey, 2010). However, pet
ownership is down from the 2008/2009 totals, based on decreased home ownership and high foreclosures.
Fifty-two percent of adults age 62 and older own at least one pet, 58% of this demographic own more than two
pets, and 10% own six pets or more. This is a significant portion of the pet industry that has the time, desire,
and financial resources for pets.
The U.S. Census Bureau‟s 2009 report “Income, Poverty, and Health Coverage in the United States” shows a
decrease of 0.8% in the total poverty for people age 65 or older. It also shows the change between 2008 and
2009 in real median income per household for people 65 and older increasing by 5.8%. Discretionary income
for baby-boomer pet owners is expected to continue increasing, resulting in job creation for animal care
professionals. According to the Animal Care and Service Workers section of the 2010-2011 Occupational
Outlook Handbook, employment of animal care and service workers is expected to grow 21 percent over the
2008-2018 decade, faster than all other occupations (Bureau of Labor Statistics, 2009).
As the U.S. population ages, pets are taking the place of grown children. This influences pet ownership and
results in higher pet spending on pet products and services given this demographics‟ higher disposable income.
Competitive Positioning
Market Share
PetSmart is the largest pet specialty retailer with approximately 11.2% market share in the pet specialty
industry comprising 14% of the Products and Supplies market, 15% of the Services market. PetSmart has a
synergetic portion of the veterinary market through Banfield, control of their expenses, nationwide distribution
capabilities, and sound management.
Competition
Big box retailers like Wal-Mart, Target, and others have focused on this market recently with the intention of
undercutting pet specialty store prices. This type of store can leverage its size to decrease its prices and
provide an excellent one-stop shopping solution for customers.
38%
23%
27%
5%7%
Industry Spending by Category
Food Supplies
Medical Care Animal Purchases
Services
020406080
100120140160180200
Mill
ion
s o
f P
ets
Total Owned Pets
45.6
38.2
13.3
6 5.3 4.7 3.90.7
05
101520253035404550
Mill
ion
s o
f H
om
es
Pet Type
Homes with Pets
5 Four Peaks Wealth Management
Wal-Mart‟s market share has increased significantly as it has targeted the pet supply market. In 2005, it
announced the intention to achieve a 30% market share. Wal-Mart has nearly achieved this goal with a current
25% market share and the highest selling dog food, Ol‟Roy brand. The increase was captured through
providing a 20% average cost savings on pet supplies for consumers.
During this time, PetSmart grow its revenues in excess of 5% over the industry‟s growth, gaining market share
despite Wal-Mart‟s increased focus. This provides strong evidence of PetSmart‟s ability to protect its market
share and overcome competitive pressures.
Supermarkets and grocery stores like Safeway, Fry‟s, and others are also engaged in the generic pet
consumables market. Their high foot traffic allows them to generate sales and expand on their product
offerings as a one-stop shop for all of a customer‟s consumable needs, human or animal.
Big box retailers and grocery stores may offer lower prices, but they can‟t match the selection, specializations,
and options available at PetSmart due to limited square footage for pet consumables and supplies.
These factors are driving PetSmart to focus on its strengths, customer loyalty and premium customers.
PetSmartis strategically placing stores in shopping centers that drive high levels of foot traffic and often
contain one of these big box competitors. This proximity makes it likely the customer will stop in at PetSmart
to take advantage of the higher product offering and other specialty goods.
PetSmart‟s primary direct competition is Petco, a specialty pet retailer, which was taken private in 2006. Petco
represents an estimated 6% of the pet product market. The number ofhouseholds with dogs are 45.6 million,
38.2 million own cats, and 33.9 million households own all other pets. This provides a smaller target market
for Petco. As home ownership decreases, it is easier to find a new home or apartment that will accept a dog or
cat when compared to exotic pets. While Petco targets a specialty pet market, PetSmart gains the competitive
advantage of attracting more dog and cat customers, which offer higher gross marginsFinally, Petco only
offers pets and pet products, but no services or veterinary care.
Smaller pet specialty suppliers also provide competition. With the increase in organic food and health
demands, many companies have started to provide these needs. Vitahound.com (an Internet based company)
is capitalizing on demand for pet supplements, while Only Natural Pet Store (an international, Internet focused
company specializing in organic pet foods and goods) is servicing the desire for certified organic food, health
products, treats, toys, and other products for pets.
PetMed Express, providing pet medication throughout the United States, started shipping online pet supplies
via third party vendors. This increases PetMed Express‟s product offering, but they remain a phone and
Internet focused company. While PetMed Express has a significant market share in pet medicines,
veterinarians still possess the largest market share. Unlike PetSmart (who has Banfield as an authorized dealer
for medications), some of PetMed Express‟s medications are authorized through third party distributors. There
are no guarantees for these products in either supply or pre-arranged price.
Competitive Advantages
Strategy
“Our strategy is to be the preferred provider for the lifetime needs of pets” (PetSmart 2010 10K). PetSmart‟s
main strategy is brand differentiation while promoting customer value. Superior customer service, product
selection, services expansion, customer loyalty programs, on-site veterinary care, and store design create
differentiation to drives sales growth. PetSmart‟s ideal is to create a one-stop shop for pet parents.
Providing veterinary services on site allows PetSmart to differentiate themselves from their competition,
complete the one-stop shop for pet owners, and sell products that require a licensed veterinarian‟s backing
including PetSmart‟s Rx Dog foods and medications.
Per PetMed‟s 2009 10K, one of their major risk factors is overcoming the loyalty people feel to purchase their
pet‟s medications through their veterinarian and the convenience of purchasing the medications at the same
time as their visit. This is an advantage for PetSmart and Banfield.
Customer Base
On PetSmart‟s May 19, 2010 analysts‟ call, Robert F. Moran stated, “While the current macro economy still
has its challenges, we are pleased with the loyalty of our customers.” The company‟s understanding of its
customers is highly valued and leveraged as a competitive advantage. This knowledge is used to determine
projects, services, and product offerings in a timely manner based on consumer requests, needs, and desires.
PetSmart is focused on cross branding and developing its customers to use proprietary and premium
consumable brands and PetSmart services. This will generate the customer loyalty and higher margins
Cross-Selling
Specialty Pet Food
Trade-up and In Strategy
Primary Traffic Driver

6 Four Peaks Wealth Management
Smart with Heart Smart Mart
% of PetSmart
Customers 10% 50% 40%
% of Total Sales 50% 45% 5%
% of Total margin 46% 48% 6%
Average
Transactions Per
Year 17.1 4.1* 1.2
Average Annual
Spend per
Customer $757 $136 $18
Mass Retailer 10% 24% 32%
PetPerks Members 79% 57% 36%
discussed earlier. Currently, PetSmart divides their customers into three categories: the Mart, Smart, and
Smart with Heart customers.
Mart
The Mart customer visits a PetSmart store about once a year spending $18 per visit and driving only 5% of
total revenues and 6% of their profit margin. These customers are about 40% of the PetSmart foot traffic
butfocus on convenience and costs (as evidenced by their shopping patterns with other pet supply vendors)
rather than quality and services.
Smart The Smart customer is the target of its cross-branding and development strategy. The intention is to increase
customer frequency of visits by of updating store layout and cross selling products and services through in-
store advertising and promotions to increase overall spending of Smart customers. This customer shops
PetSmart on average once a quarter spending about $136 annually. About 57% are PetPerks Members and
represent 50% of PetSmart‟s total foot traffic. They drive 45% of total revenues and 48% of the margins
spending.
Smart with Heart
The final category comprises only 10% of PetSmart‟s total patronage, but generates 50% of the total profits.
They visit PetSmart on average 17 times a year and spend over $750 per customer annually. This group uses
services and often exclusive or premium products. About 80% are PetPerks members. The implied revenue
margin is 4.6 times the costs of goods sold. Changing consumer spending patterns from “Smart” to “Smart
with Heart” will greatly increase PetSmart‟s net profits.
Exclusive Products
The company‟s use of exclusive products serves as a powerful competitive advantage. PetSmart offers
exclusive products from Martha Stewart, GNC, Fisher Price, and others. They have developed exclusive
brands of pet food for various needs and customer desires including prescription pet foods. PetSmart, as
partnered with Banfield, is the only retailer to offer this type of food because of veterinary restrictions.
GNC is offering PetSmart exclusive dietary pet supplements for dogs and cats in PetSmart stores. According
to GNC Executive Vice President Tom Dowd, “the new pet vitamins represent a true consumer-driven
innovation.” Increasing pet supplement demand is rapidly increasing based on the desire to maintain the pet‟s
health and decrease veterinary costs.
Investment Summary Our analysis shows a 12 month target price for PetSmart of $38-$42 per share. The recent increase in
PetSmart‟s stock price (30% year-to-date) as consumed the previously undervalued stock price making it fairly
valued at this time.
To arrive at this target price, we used three valuation models:
Dividend Discount Valuation
Free Cash Flow Valuation
Enterprise Value Multiple Valuation
Given PetSmart‟s short dividend history, the Free Cash Flow and Enterprise Value methods were given the
most weight in our analysis.
Sensitivity analysis was conducted for each model through the changing of the key inputs. Changing the
stated growth estimates or the cost of capital to determine the sensitivity of our analysis to these key variables.
PetSmart carries no long-term debt (only its capital leases), maintains control over its costs, and is profitable
through existing and new stores. While the industry and company are expected to grow, the market has
already accounted for these factors.
Valuation Several key inputs affect every the valuation models used for PetSmart. They are the cost of capital and the
growth assumptions used to create the pro forma statements. These vital components are discussed below, and
detailed financial data can be found in the appendix.
Components
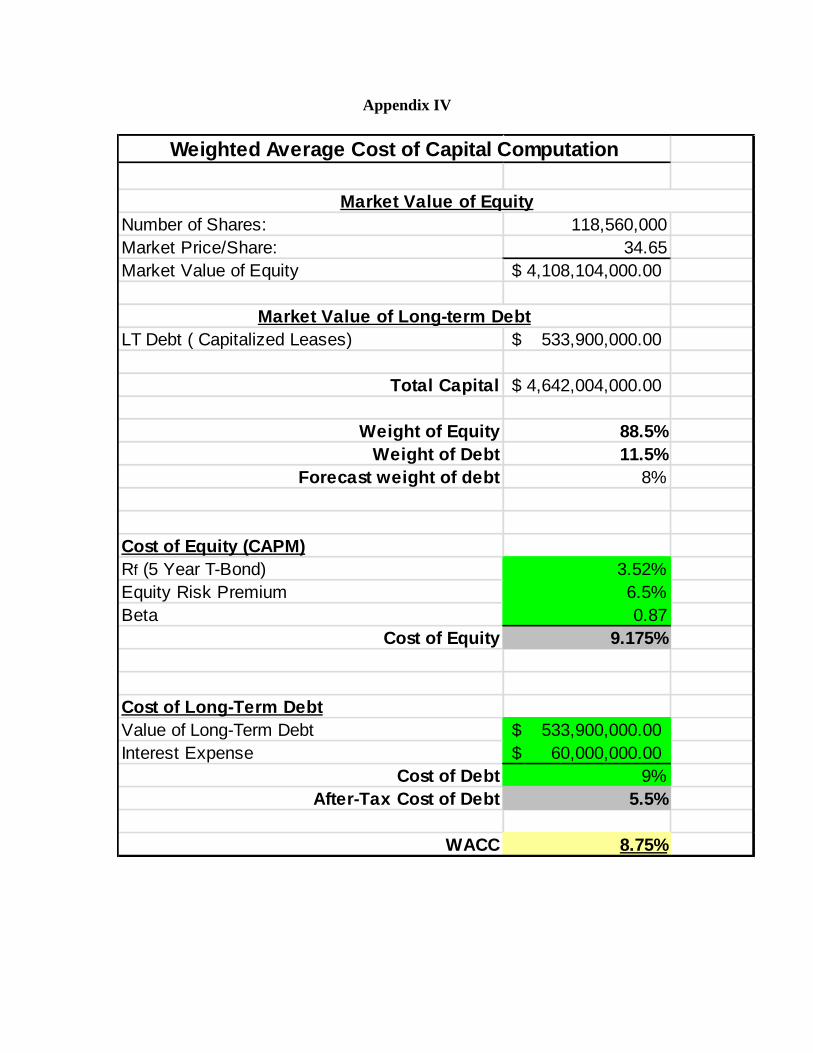
Weighted Average Cost of Capital
PetSmart‟s weighted average cost of capital is 8.75%. The projected cost of equity is 9.17%,. See appendix
for the detailed derivations of this cost.

7 Four Peaks Wealth Management
One key item in our analysis was the adjustment of the 10-year Treasury rate used as our risk-free proxy. The
current 10-year Treasury note is at a historically low 2.56%. This is below the historical average and not an
appropriate measure for a long-term risk free rate. After further research, the 3.53% long-term composite rate
was used. This statistic provides a current, quantitatively relevant measure for the risk free rate, which more
accurately represents the increasing U.S. bond rate changes that will occur as the economy recovers.
While PetSmart has no long-term debt, its lease obligations carry an implied interest rate of 11%. Based on the
decreasing real-estate market, PetSmart‟s new and renegotiated leases will be executed at lower costs to the
companies. Most of PetSmart‟s recent expansions occurred at the peak of the real-estate market bubble,
causing the implied 11% rate to be artificially inflated and unrealistic for projection purposes. Therefore, the
cost of debt used was modified to 9%.
Growth Rates
PetSmart‟s historical average growth rates over the past 10 years are as follows:
10.67% Revenue growth
20% Net income growth
35% Dividend Growth (Over 8 years)
The pro forma sheets are based on data gathered from management, historical growth rates, and qualitative
research. Total revenue was projected based on the optimal store openings, services growth, and a time series
analysis for product sales independent of management guidance.
The resulting revenue growth rate of 7%, 3.67% below PetSmart‟s historical growth rate, is directly in line
with management estimates. PetSmart management estimates same store revenues to increase 2% to 4%
annually, with new stores contributing 2% to 3% total growth. This results in an average annual revenue
projection of 4% to 7%.
Models
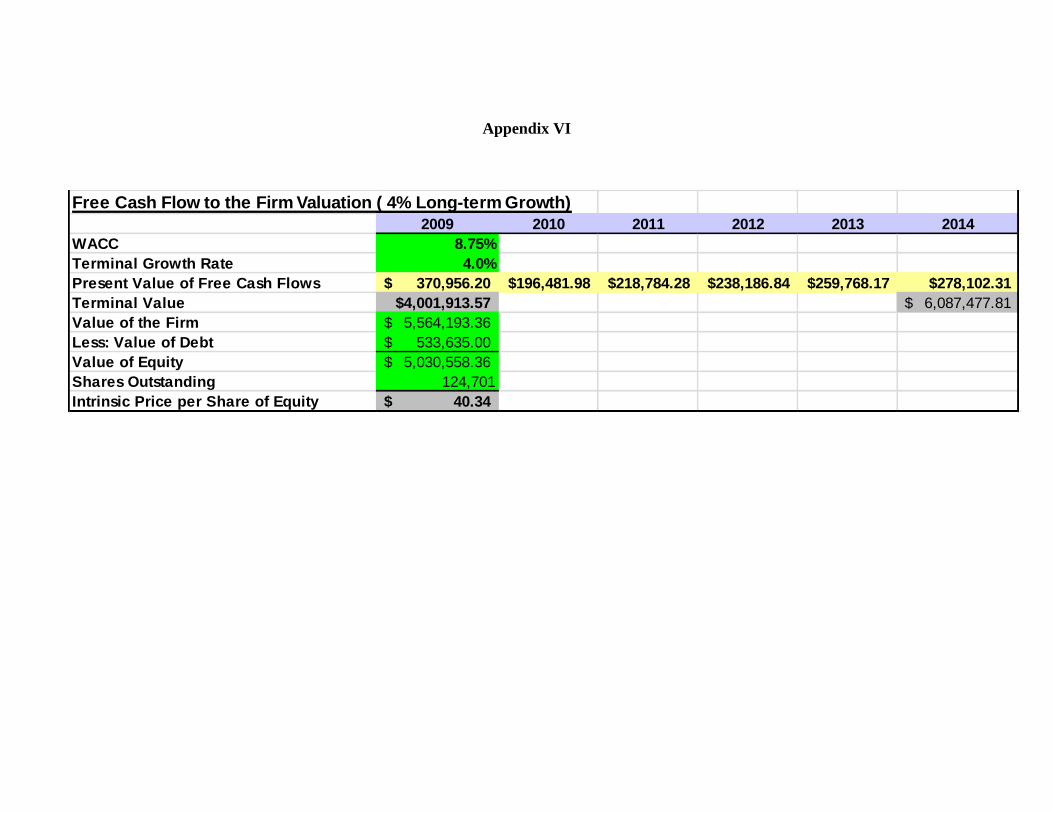
Free Cash Flow Model
The free cash flow model analyzes future cash flows to the firm resulting in the stock price of $40.04. The free
cash flows method is a more accurate way of establishing a target stock price, because PetSmart has
experienced very rapid dividend growth since the original disbursement in 2005. The calculated WACC of
8.75% was used when calculating the present value of future cash flows. After close analysis of capital
expenditures, FCFF is estimated to increase 10% year over year ultimately reaching a target price of a $40.04
EV/EBITDA Multiple
EBITDA allows for another valuable method of forecasting a company‟s future stock price. Rather than
looking at the bottom line cash flows, the EBITDA method focuses on establishing an enterprise value
multiple using the total invested capital less cash and short term investments. After analysis of past statements,
we noticed an increasing trend in historical EV multiples for PetSmart. The calculated 2009 multiple was 9 (a
2% increase over 2008) continuing an increasing trend. Comparable companies are also higher multiples.
Assuming, for sensitivity purposes, a future PetSmart‟s EV multiple of 10 and discounting at the WACC, the
EV/EBITDA model allows us to establish a stock value of $38-40 per share.
Because PetSmart is the only publicly traded pet specialty retail company in the industry, a correlation analysis
on the variations of stock prices over the past five years was conducted on specialty retailers. Comparing
similar operating, growth, as well as marginal and seasonal trends to PetSmart resulted in a high correlation
with Home Depot, Dick‟s Sporting Goods, and Cabelas. Like PetSmart, Home Depot, Cabelas, and Dick‟s
Sporting Goods provide goods and services to a single industry. All strive to provide a one-stop shop solution
for their industry through massive product differentiation.
Year 2009 2010 2011 2012 2013 2014
Open Stores 1164 1206 1239 1270 1302
New Stores 42 33 31 32 36
Year Ending Stores 1164 1206 1239 1270 1302 1338
Year 2009 2010 2011 2012 2013 2014
Net Sales Per Sq/ft 206.04 208.16 216.95 228.67 241.51 254.65 Cost of Sales per
Sq/ft 198.38 201.37 209.66 220.68 232.71 244.97
Net Income per Sq/ft 7.66 6.79 7.29 7.99 8.8 9.68
8 Four Peaks Wealth Management
Decreased home ownership directly affects Home Depot because renovations, repairs, and remodels are paid
for by homeowners, regardless of who performs the physical labor. Pet ownership is directly correlated to
home ownership. Therefore, fewer homes equal fewer customers for both Home Depot and PetSmart.
Proper exercise and health maintenance reduces medical costs for people and pets. This justifies the continued
spending on premium pet foods and pet supplements through a recession, just as people will spend a little on
vitamins and proper running shoes for their own health and all the inherent benefits.
While major home projects are often placed on hold, new pet acquisitions slow, and expensive exercise
equipment sales decline because of economic recession, these industries are recession resistant. Current and
remaining pet and home owners will maintain their spending practices. Sport participants still need equipment
and athletic clothing to partake in their activities. Pets will eat and have treats throughout a recession, just as a
house will get painted and repaired, and sports participants will continue to play and exercise.
Home Depot‟s 2009 EV multiple is 9.19, Cabelas is 10.05, and Dick‟s Sporting Goods multiple is 10.42.
Considering PetSmart‟s historical EV/EBITDA multiples for 2008 (8.67), 2009 (9.00), and estimated 2010
(9.13), there is a direct growth trend created by increased revenues and profits. Given PetSmart‟s recent
EV/EBITDA multiple trend and the higher EV/EBITDA multiples of comparable companies‟, PetSmart‟s
multiple will increase. An estimated forward multiple of 10 was established and used to calculate the target
price range of $38-$40.
Discounted Dividend Model
PetSmart started paying dividends in 2005 at $.03 per share. These have increased to $.33 per share in 2009
and are projected to be $.45 per share for 2010. The historical dividend growth rate based on PetSmart‟s
dividend history is 35%. This growth rate is not sustainable long-term, so assumptions of declining growth
rates were made. Based on past patterns and our analysis of available free cash flow, a dividend growth rate of
22% was forecast until 2014. This rate then was reduced to 16% until 2019, and finally leveling out at a
terminal growth rate of 5.5%. This resulted in a target stock value of $32.30.
Financial Analysis
Net Sales
Over the past 10 years, PetSmart has seen a very steady revenue increase. Historically, PetSmart‟s sales grew
by 10.67% annually. During our analysis, we observed a strong seasonal pattern displaying stronger sales
during the holidays, especially Christmas. Taking into consideration PetSmart‟s seasonal sales patterns as well
as dependency of events and employing time-series analysis, we were able to forecast a compounding growth
rate of 7-8% year over year over the next 5 years.
Net sales are composed of merchandise and service sales. Merchandise sales represent 88% of the total
revenues in 2009 and will continue to increase at 7% annually. Since service sales carry much higher margins
than merchandise, PetSmart has made a significant effort to grow the service portion of their business. We
forecast service growth to outpace merchandise and will decrease as an overall percentage of total sales going
forward.
Cost Control
PetSmart has focused on cutting costs and increasing efficiency. This streamlined its distribution network,
removed low margin hard goods, maximized new store profitability, and set a capital expenditure limit. The
only places left to reduce costs are advertising and employment, neither of which is desired nor currently
needed. Management has reduced costs to the extent possible driving profit growth over the recessionary
period. We were not able to identify areas of further reduction, so increased future profitability growth must
come from higher sales which will be difficult to accomplish in this competitive environment.
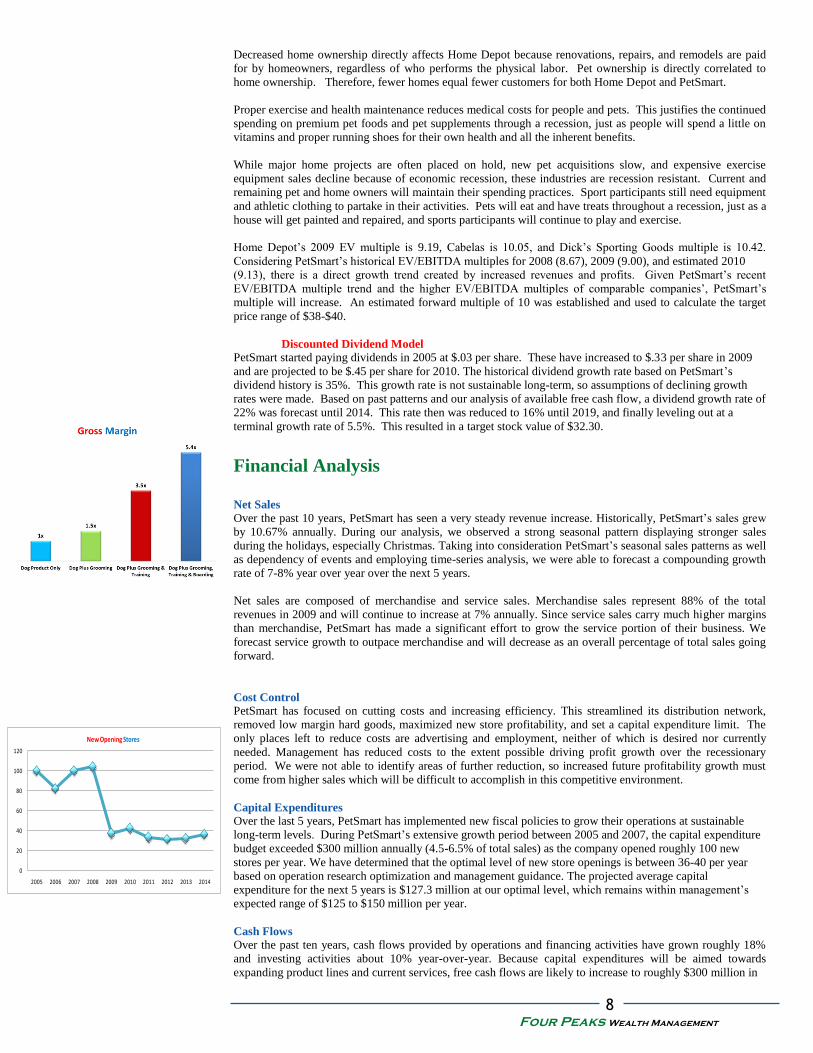
Capital Expenditures
Over the last 5 years, PetSmart has implemented new fiscal policies to grow their operations at sustainable
long-term levels. During PetSmart‟s extensive growth period between 2005 and 2007, the capital expenditure
budget exceeded $300 million annually (4.5-6.5% of total sales) as the company opened roughly 100 new
stores per year. We have determined that the optimal level of new store openings is between 36-40 per year
based on operation research optimization and management guidance. The projected average capital
expenditure for the next 5 years is $127.3 million at our optimal level, which remains within management‟s
expected range of $125 to $150 million per year.
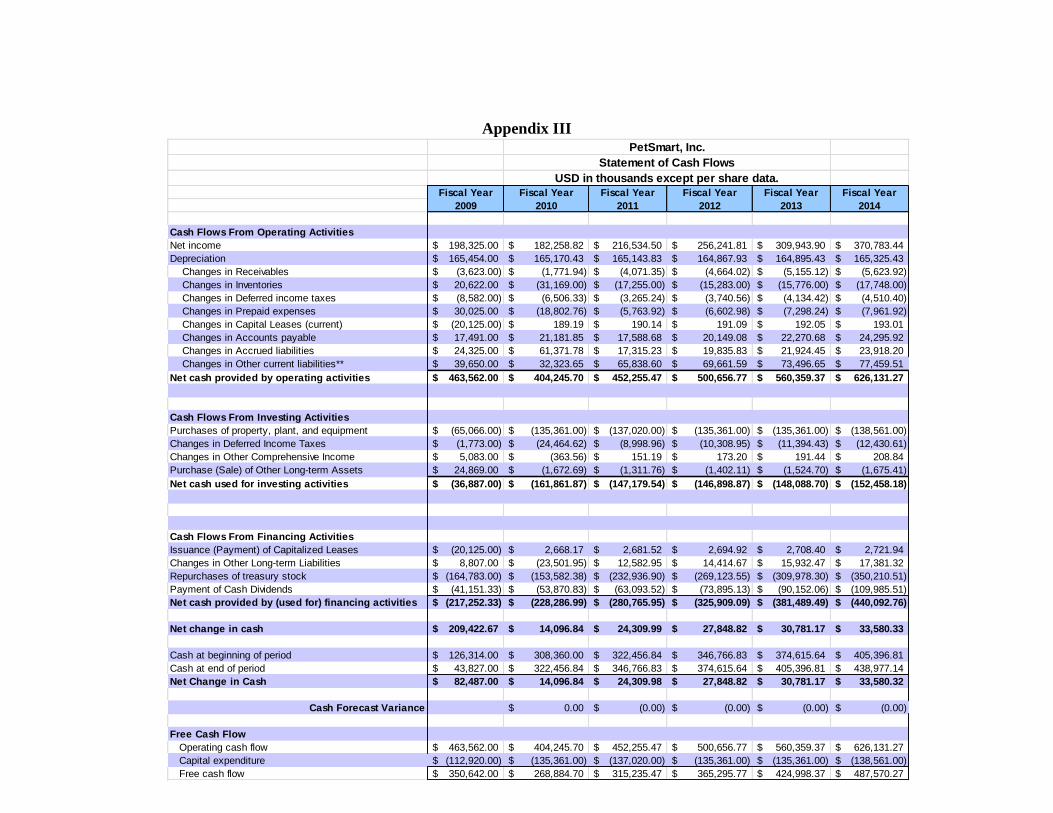
Cash Flows
Over the past ten years, cash flows provided by operations and financing activities have grown roughly 18%
and investing activities about 10% year-over-year. Because capital expenditures will be aimed towards
expanding product lines and current services, free cash flows are likely to increase to roughly $300 million in
0
20
40
60
80
100
120
2005 2006 2007 2008 2009 2010 2011 2012 2013 2014
New Opening Stores

9 Four Peaks Wealth Management
2010. By generating strong operating cash flow, the firm does not need to issue any short-term or long-term
debt.
Earnings
Over the last five years PetSmart has seen a very steady increase in the companies‟ earnings. In 2010 net sales
reached 5.6 billion up from 5.3 billion in 2009. Due to decreased spending and increased efficiencies, we
forecast earnings to grow at 7-8% annually. Key revenue drivers for PetSmart are their partnership with
Banfield, expanding services, and new exclusive vendor contracts. We expect the company‟s EPS to reach
$3.36 by 2015. This represents a 55% upside from their 2009 $1.59 EPS figure. The company has
implemented a share buyback program which is having positive impacts on their future EPS.
Investment Risk
Market
International Operations
PetSmart‟s Canadian operations are subject to currency exchange rate fluctuations, certain tariffs, and foreign
legal compliance.
Recession
Unemployment, reduced discretionary income, possible double dip recession, and other factors can and do
influence consumer spending practices. Continued business success for PetSmart is predicated on customer
spending habits. Material profit loss for PetSmart is possible based on these major economic factors forcing
customers to lower-margin products, less expensive supplies, discontinuing services, or giving up their pets
altogether.
Housing Depression and/or recession will decrease pet ownership due to decreased home ownership. Currently 14% of
all residential real estate is currently in or at risk of foreclosure. Under dire economic conditions, home
purchases decrease and foreclosures increase. With pets unauthorized or governed by restrictive policies in
many apartments, total pet ownership will decrease.
Industry
Preferences
Changes in customer preferences are a risk because of the time lag between identifying the change and
implementing measures to meet the customer‟s needs. Even if the need is identified in time, implementation of
the product or service could require too much time or resources. In an economic downturn, customers are
reluctant to spend on premium products. PetSmart addressed this by establishing in-house brands that offer a
premium product at a lower cost, taking advantage of increased margins. Failure to meet customer needs
and/or desires could hurt customer relationships, market share, and profitability.
Competitors
Given the high competition in the pet supply industry, key competitors seek to gain higher market shares
through their competitive advantages. Competing big box retailers like Walmart and Target are expanding
their pet product selection to capture market share, and due to leveraging, are able to offer lower prices on
similar products. PetSmart faces the risk of lowering their prices to remain competitive and defend their
market share.
Company
New Stores
Growth through new stores has three risks. First, some of the sales are cannibalized from existing PetSmart
store locations to the new location. Second, failing to control costs, manage inventory, and implement
marketing plans can harm sales and vendor relationships. Finally, new store openings require several factors
to be met including: the ability to enter new markets, finding locations that provide reasonable investment
returns, and negotiating terms with landlords.
Furthermore, PetSmart signs new property leases about 15 months before the projected store opening.
Significant economic changes can occur during this time affecting the success of the new store.
Supply Chain
Future expansion could require additions to PetSmart‟s distribution network in order to support the new stores
and customer demands. If this is impeded, then sales and inventory control will be affected.
Disruption of current transportation, warehousing, vendor capabilities, and/or changes in vendor relationships
will affect sales and inventories. The two largest vendors accounted for 22.4% of PetSmart sales. If these
relationships ended or the vendor‟s products were made available to competitors, then PetSmart‟s profits could
be significantly impacted.
10 Four Peaks Wealth Management
Management
PetSmart has strong and capable management. Maintaining this caliber of management is important to their
continued success. If management was to leave or their situations change, then PetSmart‟s revenue and
efficiency could be affected.

Fiscal Year Fiscal Year Fiscal Year Fiscal Year Fiscal Year Fiscal Year
Assets 5 Yr. % of Sales 2009 2010 2011 2012 2013 2014
Current assets
Cash and cash equivalents 3.2% 308,360.00$ 322,456.84$ 346,766.83$ 374,615.64$ 405,396.81$ 438,977.14$
Restricted cash 15.6% 48,172.00$ 50,374.21$ 54,171.91$ 58,522.46$ 63,331.09$ 68,577.01$
Receivables 1.0% 52,232.00$ 54,003.94$ 58,075.30$ 62,739.32$ 67,894.44$ 73,518.36$
Inventories 11.0% 563,389.00$ 594,558.00$ 611,813.00$ 627,096.00$ 642,872.00$ 660,620.00$
Deferred income taxes 0.8% 36,805.00$ 43,311.33$ 46,576.57$ 50,317.13$ 54,451.56$ 58,961.95$
Prepaid expenses & other current assets 1.4% 57,652.00$ 76,454.76$ 82,218.67$ 88,821.65$ 96,119.89$ 104,081.80$
Total current assets 1,066,610.00$ 1,141,159.08$ 1,199,622.28$ 1,262,112.20$ 1,330,065.78$ 1,404,736.26$
Non-current assets:
Property, plant and equipment
Property and equipment, at cost 2,342,979.00$ 2,478,340.00$ 2,615,360.00$ 2,750,721.00$ 2,886,082.00$ 3,024,643.00$
Accumulated Depreciation (1,141,122.00)$ (1,306,292.43)$ (1,471,436.26)$ (1,636,304.19)$ (1,801,199.61)$ (1,966,525.04)$
Equity and other investments 0.1% 32,486.00$ 32,486.00$ 32,486.00$ 32,486.00$ 32,486.00$ 32,486.00$
Goodwill 0.6% 42,200.00$ 42,200.00$ 42,200.00$ 42,200.00$ 42,200.00$ 42,200.00$
Deferred income taxes 2.1% 94,901.00$ 119,365.62$ 128,364.58$ 138,673.53$ 150,067.97$ 162,498.58$
Other long-term assets 1.1% 23,932.00$ 25,604.69$ 26,916.46$ 28,318.57$ 29,843.27$ 31,518.69$
Total non-current assets 1,395,376.00$ 1,391,703.88$ 1,373,890.78$ 1,356,094.91$ 1,339,479.62$ 1,326,821.22$
Total assets 2,461,986.00$ 2,532,862.97$ 2,573,513.06$ 2,618,207.11$ 2,669,545.41$ 2,731,557.48$
Liabilities and stockholders' equity
Liabilities
Current liabilities
Capital leases 0.1% 37,839.00$ 38,028.20$ 38,218.34$ 38,409.43$ 38,601.47$ 38,794.48$
Accounts payable 4.2% 212,121.00$ 233,302.85$ 250,891.52$ 271,040.60$ 293,311.28$ 317,607.20$
Accrued liabilities 4.1% 168,304.00$ 229,675.78$ 246,991.02$ 266,826.85$ 288,751.30$ 312,669.50$
Other current liabilities 2.2% 146,965.00$ 124,079.46$ 133,433.80$ 144,149.86$ 155,994.27$ 168,915.78$
Total current liabilities 565,229.00$ 625,086.29$ 669,534.67$ 720,426.73$ 776,658.32$ 837,986.95$
Non-current liabilities
Capital leases 533,635.00$ 536,303.18$ 538,984.69$ 541,679.61$ 544,388.01$ 547,109.95$
Other long-term liabilities 190,407.00$ 166,905.05$ 179,488.00$ 193,902.67$ 209,835.14$ 227,216.46$
Total non-current liabilities 724,042.00$ 703,208.23$ 718,472.69$ 735,582.29$ 754,223.15$ 774,326.41$
Total liabilities 1,289,271.00$ 1,328,294.51$ 1,388,007.37$ 1,456,009.02$ 1,530,881.47$ 1,612,313.36$
Stockholders' equity
Common stock 16.00$ 16.00$ 16.00$ 16.00$ 16.00$ 16.00$
Additional paid-in capital 1,148,228.00$ 1,205,639.40$ 1,265,921.37$ 1,329,217.44$ 1,395,678.31$ 1,465,462.23$
Retained earnings 1,093,708.00$ 1,222,095.99$ 1,375,536.97$ 1,557,883.66$ 1,777,675.50$ 2,038,473.42$
Treasury stock (1,071,606.00)$ (1,225,188.38)$ (1,458,125.28)$ (1,727,248.83)$ (2,037,227.13)$ (2,387,437.64)$
Accumulated other comprehensive income 0.0% 2,369.00$ 2,005.44$ 2,156.63$ 2,329.83$ 2,521.26$ 2,730.11$
Total stockholders' equity 1,172,715.00$ 1,204,568.45$ 1,185,505.69$ 1,162,198.09$ 1,138,663.94$ 1,119,244.12$
Total liabilities and stockholders' equity 47.4% 2,461,986.00$ 2,532,862.96$ 2,573,513.06$ 2,618,207.11$ 2,669,545.41$ 2,731,557.48$
Excess Cash (or EFN) -$ (0.00)$ 0.00$ 0.00$ 0.00$ 0.00$
Cash Surplus Usage -$ 1,225,188.38$ 1,458,125.28$ 1,727,248.83$ 2,037,227.13$ 2,387,437.64$
Dividends (53,870.83)$ (63,093.52)$ (73,895.13)$ (90,152.06)$ (109,985.51)$
Treasury Stock 1,279,059.21$ 1,521,218.80$ 1,801,143.96$ 2,127,379.19$ 2,497,423.15$
Total Funds Used 1,225,188.38$ 1,458,125.28$ 1,727,248.83$ 2,037,227.13$ 2,387,437.64$
PetSmart, Inc.
Pro Forma Balance Sheet
USD in thousands except per share data.
Appendix I

Fiscal Year Fiscal Year Fiscal Year Fiscal Year Fiscal Year Fiscal Year
% of Sales 2009 2010 2011 2012 2013 2014
Merchandise sales 4,761,039$ 4,962,874$ 5,310,275$ 5,681,995$ 6,079,734$ 6,505,316$
Services sales 575,353 617,474 690,775 800,999 935,950 1,091,500
Net sales 100.0% 5,336,392$ 5,580,348$ 6,001,050$ 6,482,994$ 7,015,684$ 7,596,816$
Cost of merchandise sales 71.5% 3,402,021 3,546,243 3,770,295 4,011,488 4,255,814 4,514,689
Cost of services sales 72.2% 415,154$ 445,816$ 493,213$ 562,301$ 644,869$ 738,946$
Total cost of sales 69.8% 3,817,175 3,992,059 4,263,508 4,573,790 4,900,683 5,253,635
Gross profit 30.2% 1,519,217$ 1,588,289$ 1,737,541$ 1,909,204$ 2,115,001$ 2,343,181$
Total operating expenses 22.7% 1,150,138 1,264,342 1,359,660 1,468,855 1,589,546 1,721,214
Operating income (EBIT) 369,079$ 323,947$ 377,881$ 440,350$ 525,454$ 621,967$
Interest Expense 59,748 58,993 59,288 59,585 59,883 60,182
Other income (expense) 0.5% 29,996$ 32,257$ 34,848$ 37,711$ 40,835$
Income before income taxes (EBT) 7.0% 309,331 294,949 350,850 415,613 503,283 602,620
Provision for income taxes 2.6% 117,554$ 115,030$ 136,831$ 162,089$ 196,280$ 235,022$
Other income 0.0% 6,548 2,340 2,516 2,718 2,942 3,185
Net income 198,325$ 182,259$ 216,535$ 256,242$ 309,944$ 370,783$
Dividends 41,151 53,871 63,094 73,895 90,152 109,986
Retained Earnings 157,174$ 128,388$ 153,441$ 182,347$ 219,792$ 260,798$
Shares Outstanding 124,701$ 119,713$ 114,924$ 110,327$ 110,327$ 110,327$
Earning Per Share 1.59 1.52 1.88 2.32 2.81 3.36
Dividends Per Share $0.33 $0.45 $0.55 $0.67 $0.82 $1.00
Net Sales Per Sq/Ft 206.04$ 208.16$ 217.71$ 229.61$ 242.53$ 255.74$
Net Income per sq/ft 7.66$ 6.80$ 7.86$ 9.08$ 10.71$ 12.48$
Sales per store 4,644.38$ 4,794.11$ 4,975.99$ 5,224.01$ 5,515.47$ 5,825.78$
Net Income per store 7.66 6.80 7.86 9.08 10.71 12.48
PetSmart, Inc.
Pro Forma Income Statement
USD in thousands except per share data.
Appendix II
Fiscal Year Fiscal Year Fiscal Year Fiscal Year Fiscal Year Fiscal Year
2009 2010 2011 2012 2013 2014
Cash Flows From Operating Activities
Net income 198,325.00$ 182,258.82$ 216,534.50$ 256,241.81$ 309,943.90$ 370,783.44$
Depreciation 165,454.00$ 165,170.43$ 165,143.83$ 164,867.93$ 164,895.43$ 165,325.43$
Changes in Receivables (3,623.00)$ (1,771.94)$ (4,071.35)$ (4,664.02)$ (5,155.12)$ (5,623.92)$
Changes in Inventories 20,622.00$ (31,169.00)$ (17,255.00)$ (15,283.00)$ (15,776.00)$ (17,748.00)$
Changes in Deferred income taxes (8,582.00)$ (6,506.33)$ (3,265.24)$ (3,740.56)$ (4,134.42)$ (4,510.40)$
Changes in Prepaid expenses 30,025.00$ (18,802.76)$ (5,763.92)$ (6,602.98)$ (7,298.24)$ (7,961.92)$
Changes in Capital Leases (current) (20,125.00)$ 189.19$ 190.14$ 191.09$ 192.05$ 193.01$
Changes in Accounts payable 17,491.00$ 21,181.85$ 17,588.68$ 20,149.08$ 22,270.68$ 24,295.92$
Changes in Accrued liabilities 24,325.00$ 61,371.78$ 17,315.23$ 19,835.83$ 21,924.45$ 23,918.20$
Changes in Other current liabilities** 39,650.00$ 32,323.65$ 65,838.60$ 69,661.59$ 73,496.65$ 77,459.51$
Net cash provided by operating activities 463,562.00$ 404,245.70$ 452,255.47$ 500,656.77$ 560,359.37$ 626,131.27$
Cash Flows From Investing Activities
Purchases of property, plant, and equipment (65,066.00)$ (135,361.00)$ (137,020.00)$ (135,361.00)$ (135,361.00)$ (138,561.00)$
Changes in Deferred Income Taxes (1,773.00)$ (24,464.62)$ (8,998.96)$ (10,308.95)$ (11,394.43)$ (12,430.61)$
Changes in Other Comprehensive Income 5,083.00$ (363.56)$ 151.19$ 173.20$ 191.44$ 208.84$
Purchase (Sale) of Other Long-term Assets 24,869.00$ (1,672.69)$ (1,311.76)$ (1,402.11)$ (1,524.70)$ (1,675.41)$
Net cash used for investing activities (36,887.00)$ (161,861.87)$ (147,179.54)$ (146,898.87)$ (148,088.70)$ (152,458.18)$
Cash Flows From Financing Activities
Issuance (Payment) of Capitalized Leases (20,125.00)$ 2,668.17$ 2,681.52$ 2,694.92$ 2,708.40$ 2,721.94$
Changes in Other Long-term Liabilities 8,807.00$ (23,501.95)$ 12,582.95$ 14,414.67$ 15,932.47$ 17,381.32$
Repurchases of treasury stock (164,783.00)$ (153,582.38)$ (232,936.90)$ (269,123.55)$ (309,978.30)$ (350,210.51)$
Payment of Cash Dividends (41,151.33)$ (53,870.83)$ (63,093.52)$ (73,895.13)$ (90,152.06)$ (109,985.51)$
Net cash provided by (used for) financing activities (217,252.33)$ (228,286.99)$ (280,765.95)$ (325,909.09)$ (381,489.49)$ (440,092.76)$
Net change in cash 209,422.67$ 14,096.84$ 24,309.99$ 27,848.82$ 30,781.17$ 33,580.33$
Cash at beginning of period 126,314.00$ 308,360.00$ 322,456.84$ 346,766.83$ 374,615.64$ 405,396.81$
Cash at end of period 43,827.00$ 322,456.84$ 346,766.83$ 374,615.64$ 405,396.81$ 438,977.14$
Net Change in Cash 82,487.00$ 14,096.84$ 24,309.98$ 27,848.82$ 30,781.17$ 33,580.32$
Cash Forecast Variance 0.00$ (0.00)$ (0.00)$ (0.00)$ (0.00)$
Free Cash Flow
Operating cash flow 463,562.00$ 404,245.70$ 452,255.47$ 500,656.77$ 560,359.37$ 626,131.27$
Capital expenditure (112,920.00)$ (135,361.00)$ (137,020.00)$ (135,361.00)$ (135,361.00)$ (138,561.00)$
Free cash flow 350,642.00$ 268,884.70$ 315,235.47$ 365,295.77$ 424,998.37$ 487,570.27$
USD in thousands except per share data.
PetSmart, Inc.
Statement of Cash Flows
Appendix III
Number of Shares: 118,560,000
Market Price/Share: 34.65
Market Value of Equity 4,108,104,000.00$
LT Debt ( Capitalized Leases) 533,900,000.00$
Total Capital 4,642,004,000.00$
Weight of Equity 88.5%
Weight of Debt 11.5%
Forecast weight of debt 8%
Cost of Equity (CAPM)
Rf (5 Year T-Bond) 3.52%
Equity Risk Premium 6.5%
Beta 0.87
Cost of Equity 9.175%
Cost of Long-Term Debt
Value of Long-Term Debt 533,900,000.00$
Interest Expense 60,000,000.00$
Cost of Debt 9%
After-Tax Cost of Debt 5.5%
WACC 8.75%
Market Value of Equity
Market Value of Long-term Debt
Weighted Average Cost of Capital Computation
Appendix IV

2009 2010 2011 2012 2013 2014 2015 2016 2017 2018 2019
Dividends Per Share 0.33$ 0.45$ 0.55$ 0.67$ 0.82$ 1.00$ 1.16$ 1.34$ 1.56$ 1.81$ 2.09$
Present Value of Dividends 0.330$ 0.414$ 0.464$ 0.521$ 0.584$ 0.655$ 0.699$ 0.746$ 0.795$ 0.848$ 0.905$
Terminal Value $29.38 67.97$
Growth Rate: 2010 to 2014 22%
Second Stage Growth 2015 to 2019 16%
Terminal Growth Rate after 2014 5.5%
Cost of Equity 8.75%
Intrinsic Value of Equity 36.34$
Discounted Cash Flow Model: Three Stage Growth Model
Appendix V
Free Cash Flow to the Firm Valuation ( 4% Long-term Growth)
2009 2010 2011 2012 2013 2014
WACC 8.75%
Terminal Growth Rate 4.0%
Present Value of Free Cash Flows 370,956.20$ $196,481.98 $218,784.28 $238,186.84 $259,768.17 $278,102.31
Terminal Value $4,001,913.57 6,087,477.81$
Value of the Firm 5,564,193.36$
Less: Value of Debt 533,635.00$
Value of Equity 5,030,558.36$
Shares Outstanding 124,701
Intrinsic Price per Share of Equity 40.34$
Appendix VI

EBITDA Fiscal Year Fiscal Year Fiscal Year Fiscal Year Fiscal Year
Stock 2010 2011 2012 2013 2014
Net Income 182,258.82$ 216,534.50$ 256,241.81$ 309,943.90$ 370,783.44$
Interest 58,993.35$ 59,288.32$ 59,584.76$ 59,882.68$ 60,182.09$
Taxes 115,030.26$ 136,831.44$ 162,088.89$ 196,280.22$ 235,021.85$
Depreciation 165,170.43$ 165,143.83$ 164,867.93$ 164,895.43$ 165,325.43$
Amortization -$ -$ -$ -$ -$
EBITDA 521,452.86$ 577,798.09$ 642,783.39$ 731,002.22$ 831,312.82$
9.00
WACC 8.75%
EV Forecast 4,693,075.71$ 5,200,182.79$ 5,785,050.54$ 6,579,020.01$ 7,481,815.34$
Cash 322,456.84$ 346,766.83$ 374,615.64$ 405,396.81$ 438,977.14$
Value of Debt (536,303.18)$ (538,984.69)$ (541,679.61)$ (544,388.01)$ (547,109.95)$
Value of Equity 4,479,229.38$ 5,007,964.92$ 5,617,986.57$ 6,440,028.81$ 7,373,682.52$
Shares Outstanding 119,712.96 114,924.44 110,327.46 110,327.46 110,327.46
Future Equity Prices 37.42$ 43.58$ 50.92$ 58.37$ 66.83$
Intrinsic Price/Share $37.42 $36.85 $39.59 $41.73 $43.94
10.00
WACC 8.75%
EV Forecast 5,214,528.57$ 5,777,980.88$ 6,427,833.93$ 7,310,022.23$ 8,313,128.15$
Cash 322,456.84$ 346,766.83$ 374,615.64$ 405,396.81$ 438,977.14$
Value of Debt (536,303.18)$ (538,984.69)$ (541,679.61)$ (544,388.01)$ (547,109.95)$
Value of Equity 5,000,682.23$ 5,585,763.01$ 6,260,769.96$ 7,171,031.03$ 8,204,995.34$
Shares Outstanding 119,712.96 114,924.44 110,327.46 110,327.46 110,327.46
Future Equity Prices 41.77$ 48.60$ 56.75$ 65.00$ 74.37$
Intrinsic Price/Share $38.41 $41.10 $44.12 $46.47 $48.89
Enterprise Value Multiple
Enterprise Value Multiple
PetSmart Enterprise Multiple Valuation
Appendix VII