touchstone innovations plc · pdf filetouchstone innovations plc ... with 63% of all funds...
TRANSCRIPT
Page 1 TOUCHSTONE INNOVATIONS INTERIM REPORT AND ACCOUNTS 2017
31 March 2017
Touchstone Innovations plc
Increased partnership activity drives value growth as unlisted portfolio companies mature
Touchstone Innovations plc (AIM: IVO, “Innovations” or “the Group”), a leading technology commercialisation and investment group, has published its results for the six months ended 31 January 2017.
Portfolio
Strong dealflow and notable pick-up in activity in maturing accelerated growth portfolio:
o PsiOxus Therapeutics signed licence agreement with Bristol-Myers Squibb for up to US $936.0 million
o Crescendo Biologics signed collaboration and licence agreement with Takeda Pharmaceutical for up
to US $790.0 million
o Circassia signed $230.0 million collaboration with AstraZeneca (March 2017)
o Cell Medica completed £60.0 million funding round (March 2017)
Number of maturing unlisted portfolio companies approaching inflexion points and potential realisations
Profitable cash realisations: disposal of Oxford Immunotec Global plc and Permasense raised £11.3 million
and £3.7 million respectively
Financial highlights
Net portfolio value up by £47.7 million to £382.8 million (FY 2016: £335.1 million)
o Unquoted portfolio value up 16% to £340.3 million (FY 2016: £292.2 million)
Pre-tax profit of £16.0 million (H1 2016: loss of £5.9 million) including £26.5 million in net fair value gains:
o Unquoted portfolio - net fair value gain of £23.1 million
o Quoted portfolio - marked to market net fair value gain of £3.4 million
£29.0 million invested in 18 companies (H1 2016: £27.5 million in 17 companies)
o Continuing to back portfolio: £23.0 million invested into 14 existing portfolio companies
o Investing for the future: £6.0 million invested in four new unquoted companies
o Further £11.6 million invested since half year end - total invested in financial year £40.6 million
Net assets increased to £472.4 million (FY 2016: £455.9 million), NAV per share £2.93
£163.3 million available for investment and operations, including £50.0 million loan facility from European
Investment Bank, which was drawn down post period end
Russ Cummings, Chief Executive of Touchstone Innovations, said:
“Our patient and focussed approach to investing for the long-term is now showing real results with a number of substantial transactions endorsing our model – notably the recent PsiOxus Therapeutics’ and Crescendo Biologics’ collaborations worth potentially $936.0 million and $790.0 million respectively. More recently Cell Medica and Pulmocide completed material funding rounds and Circassia agreed a $230.0 million collaboration with AstraZeneca.
“We have a dozen companies of material scale and considerable potential. Most of our larger and maturing unlisted companies made significant progress and are approaching key inflexion points. We have great depth to our portfolio, with another 20 portfolio companies or so making significant progress and showing rapid development.
“This not only reflects the fruits of ten years of investment, but also the more recent acceleration of capital deployment, with 63% of all funds invested by Innovations being made within the last three and a half years. The vast majority of this capital has gone into existing portfolio companies that we know well.
“We are actively involved in discussions about partnerships, licensing and other corporate developments across a number of our larger unlisted portfolio companies. Despite the macro-economic backdrop, we have the people, platform and skills to continue to build on our successful investments for the long-term. Furthermore, our participation in the UCL Technology
Page 2 TOUCHSTONE INNOVATIONS INTERIM REPORT AND ACCOUNTS 2017
Fund and Apollo Therapeutics, means we are in a great position to access and invest in some of the best IP coming out of the Golden Triangle.”
A pdf copy of the results is available at http://www.touchestoneinnovations.com/interim2017
For further information contact:
Touchstone Innovations plc 020 3053 8834
Russ Cummings, Chief Executive Officer
Jon Davies, Director of Communications
Instinctif Partners 020 7457 2020 Adrian Duffield/Melanie Toyne-Sewell/Chantal Woolcock
J.P. Morgan Cazenove (Nominated Adviser) 020 7742 4000
Michael Wentworth-Stanley/Alec Pratt
RBC Capital Markets 020 7653 4000
Darrell Uden/Marcus Jackson/Laura White
About Touchstone Innovations – www.touchstoneinnovations.com
Touchstone Innovations plc (formerly Imperial Innovations Group plc or just “Innovations”) creates, builds and invests in pioneering technology companies and licensing opportunities developed from outstanding
scientific research from the 'Golden Triangle', the geographical region broadly bounded by London, Cambridge and Oxford.
This area has an unrivalled cluster of outstanding academic research and technology businesses, and is home to four of the world’s top 10 universities, as well as leading research institutions, the cream of the
UK’s science and technology businesses and many of its leading investors.
Innovations supports scientists and entrepreneurs in the commercialisation of their ideas through protecting
and licensing out intellectual property (through its Technology Transfer subsidiary, Imperial Innovations Limited), by leading the formation of new companies, by recruiting high calibre management teams and by
providing investment and encouraging co-investment. Innovations remains an active investor over the life of its portfolio companies, with the majority of Innovations’ investment going into businesses in which it is
already a shareholder.
Since becoming a public company in 2006, Innovations has raised more than £440 million of equity from
investors, which has enabled it to invest in some of the most exciting spin-outs to come out of UK academic research. In addition, post period end the Group has drawn down the outstanding £50.0 million from the
European Investment Bank (EIB) taking the total loan to £80.0 million.
Between Innovations’ admission to AIM (August 2006) and 31 January 2017, Innovations has invested a
total of £335.7 million across its portfolio companies, which have collectively raised investment of £1.5 billion.

Page 3 TOUCHSTONE INNOVATIONS INTERIM REPORT AND ACCOUNTS 2017
CONTENTS Page
Chief Executive’s Report 4 Financial Review 12
Consolidated Interim Statement of Comprehensive Income 15 Consolidated Interim Balance Sheet 16
Consolidated Interim Cash Flow Statement 17
Consolidated Interim Statement of Changes in Equity 18 Notes to the Consolidated Interim Financial Statements 19
Independent Review Report 37 Company Information 38
Page 4 TOUCHSTONE INNOVATIONS INTERIM REPORT AND ACCOUNTS 2017
Chief Executive’s Report
Overview The fundamentals of the Group’s business remain very strong. Innovations has a strong and diverse portfolio of 47 accelerated growth companies with the Group’s top 10 assets accounting for 61% of net portfolio
value. Many of these portfolio companies made significant technical, clinical and commercial progress during the period.
Significantly, the keen interest in the portfolio has continued to build; and a number of portfolio companies announced high value partnership and licensing agreements, with further discussions ongoing.
The two most notable of these were signed by PsiOxus Therapeutics and Crescendo Biologics, with potential
deal values up to US$936.0 million and US$790.0 million respectively. These values are subject to achievement of preclinical and clinical milestones, but the size of these transactions is a clear indication of
the value that global pharma companies have placed on the underlying technology developing.
The strategic partnerships signed this time last year to broaden the Group’s visibility of intellectual property
from the elite universities within the ‘Golden Triangle’ are beginning to bear fruit, with both Apollo Therapeutics and UCL Technology Fund now fully established and actively reviewing and funding their first
projects.
Innovations continues to back its portfolio companies both financially and also with the insights and skills of
its people. In the period, nearly 80% of investments were made into existing portfolio companies. The Group expects to continue to allocate a broadly similar proportion of its investments into existing companies
in the future, as it continues to back selected companies within its accelerated growth portfolio from
inception to maturity. Five years ago this portfolio comprised three companies in which the Group had invested more than £5.0 million, now there are 19 companies with this level of investment illustrating both
the acceleration in the Group’s investment activity and increasing maturity of its portfolio.
Visibility of new investment opportunities from the academic, research and entrepreneurial community within the ‘Golden Triangle’ remains high. The quality and experience of the Group’s team means its ability to
identify potential stars is continually improving. Innovations is excited by the quality of investments made
and the opportunities that it continues to see. As the Group is only looking to add 6-8 new companies to the portfolio per annum, it takes a rigorous and measured approach to growing the portfolio, with a resolute
focus on quality over quantity.
The Group added four new companies to its accelerated growth portfolio and generated net proceeds to
Innovations of £3.7 million from the disposal of Permasense. Innovations’ equity stake was largely derived from early commercial support provided to the founders by Innovations’ Technology Transfer Office and was
acquired at nil cost.
Other notable developments included the opening of a new corporate office in Air Street, London and the change of name from Imperial Innovations Group plc to Touchstone Innovations plc, both of which were
completed in early January 2017. The Group also secured a new five-year contract to run the incubator at
the I-HUB, a new building at Imperial College London’s new White City Campus.
The Group’s overall net portfolio value increased by £47.7 million to £382.8 million (FY 2016: £335.1 million) driven by a combination of increased investment and net fair value gains in its portfolio.
The increase comprises investments of £29.0 million across 18 companies and fair value gains of £36.5 million, offset by fair value losses of £10.0 million and disposals of £7.8 million. The net fair value gain of
£26.5 million represents a 7.9% increase on opening net portfolio value.
As at 31 January 2017, the Group’s portfolio consisted of holdings in 112 companies.
The Group’s quoted portfolio comprised four companies (Circassia Pharmaceuticals plc, Abzena plc, Oxford
Immunotec Global plc and IXICO plc) and was marked to market at close of trading on 31 January 2017 and valued at £42.5 million. Fair value gains of £5.0 million, were mostly attributable to Oxford Immunotec, as
the Group took advantage of the strong share price to crystallise value in its holding. Post period end the Group sold the balance of its holding in Oxford Immunotec, generating total proceeds of £11.3 million. This
Page 5 TOUCHSTONE INNOVATIONS INTERIM REPORT AND ACCOUNTS 2017
represents a 1.5 times return on its original investment and generated a fair value gain of £5.0 million in this financial year.
The Group’s unquoted portfolio increased in value by £48.1 million (16%) to £340.3 million (31 July 2016:
£292.2 million). The increase includes investments of £29.0 million and fair value gains of £31.5 million. Most of the net fair value gain (£21.9 million) was attributable to an increase in the value of PsiOxus
Therapeutics following its worldwide licencing agreement with Bristol-Myers Squibb (BMS). Other notable
fair value gains included Crescendo Biologics (£3.7 million) and Autifony Therapeutics (£4.3 million). The gain was offset by fair value losses of £8.4 million, largely resulting from a full write down in the value of
Kesios Therapeutics of £6.2 million, as the underlying technology failed to live up to expectations. In addition, the portfolio value decreased by £4.0 million as a result of disposals, most notably from the sale
of Permasense, which accounted for £3.4 million.
As of 31 January 2017, the Group had £163.3 million (FY 2016: £198.3 million) available for investment and
operations, including the £50.0 million second loan facility from European Investment Bank (EIB) which was drawn down post period end.
Operational review
Partnerships, collaborations and exits
As reported in the last set of results, there is growing evidence of keen partnership interest in Innovations’
portfolio, both from corporate venture investors and industry, with collaboration an increasing feature of the
business.
In October 2016, Crescendo signed a multi-target collaboration and licence agreement with Takeda Pharmaceutical worth up to US $790.0 million, subject to successful completion of milestones. Crescendo
will use its proprietary transgenic platform and engineering expertise to discover and optimally configure Humabody® candidates (drug conjugates and immuno-oncology therapeutics) against multiple targets
selected by Takeda.
Under the terms of the agreement, Crescendo is eligible to receive up to $36 million, in a combination of an
upfront payment, investment, research funding and preclinical milestones. Takeda will have the right to develop and commercialise any Humabody®-based therapeutics resulting from the collaboration. Crescendo
is also eligible to receive further clinical development, regulatory and sales-based milestone payments of up
to $754 million over the years post preclinical development, and in addition, will be eligible to receive royalties on Humabody®-based product sales by Takeda. In the light of this significant agreement
Innovations is reporting a net fair value gain of £3.7 million in its investment in Crescendo.
In December 2016, PsiOxus signed an exclusive worldwide licence agreement with BMS for the rights to a
single pre-clinical product, NG-348, PsiOxus’ first “armed” oncolytic virus. The agreement comprises an upfront payment of US$50.0 million to PsiOxus, but is potentially worth up to US $886.0 million in
development, regulatory and sales-based milestones, subject to successful completion of milestones. BMS will also be responsible for providing PsiOxus funding to support activities related to the preclinical
development of NG-348.
Albeit that there is a high degree of risk associated with clinical trials, the size of this transaction, and the fact
that it is for a single preclinical product, demonstrates the potential value of PsiOxus’ platform technology. This is the second collaboration that PsiOxus has signed with BMS and follows on from the first clinical
collaboration of PsiOxus’ oncolytic adenovirus therapeutic enadenotucirev, in combination with BMS’s Immuno-Oncology (I-O) agent Opdivo® (nivolumab) to treat a range of tumour types in late-stage cancer
patients (announced in June 2016).
The combination of the initial upfront payment of US$50 million and the potential value of the licensing
agreement for NG-348 has resulted in the Group reporting a net fair value gain of £21.9 million in its investment in PsiOxus.
Abzena plc is continuing to see interest in its novel site-specific ThioBridge(TM) antibody drug conjugate (ADC)
linker technology, which links antibodies and other proteins to drugs. In January 2017, the company
announced a licensing agreement with a San Diego-based biopharmaceutical company covering the use of ThioBridge(TM) in up to 10 Antibody Drug Conjugates (ADCs) across a wide range of indications. The
Page 6 TOUCHSTONE INNOVATIONS INTERIM REPORT AND ACCOUNTS 2017
agreement has the potential to reach over US $300 million to Abzena, comprising licence fees and milestone payments.
This is Abzena’s biggest ever technology deal and is the second major partnership for its ThioBridge(TM)
antibody drug conjugate (ADC) linker technology, following a similar licensing agreement worth up to US$150.0 million announced in January 2016.
Post period-end on 17 March 2017, Circassia announced that it had entered an agreement with AstraZeneca to secure certain U.S. commercial rights to two chronic obstructive pulmonary disease products, Tudorza®
and Duaklir®, for a maximum total consideration of US$230 million. These products represent a clear strategic fit with Circassia's focus on respiratory medicines and provide the company with an opportunity to
transform its product portfolio and expand its commercial infrastructure in the USA. The transaction thus
allows Circassia to accrue the benefits of a broader product portfolio as well as significant infrastructure expansion. The collaboration is anticipated to be earnings enhancing for Circassia after one year and broadly
cash neutral for three years, then cash generative.
Significantly, the deal is structured such that there is with no funding requirement from Circassia
shareholders. Instead, Circassia will issue AstraZeneca US$50.0 million in Ordinary Shares on completion of the transaction, followed by a deferred non-contingent consideration of U.S.$100 million and a second
payment of up to a further $80.0 million should Circassia decide to exercise an option to sub-license the commercial rights to Tudorza® in the US.
In October, Permasense Limited was acquired by Emerson Electric, a Fortune 500 company, for an initial
consideration of £30.6 million, with further amounts of up to £7.7 million subject to the Permasense business
achieving certain performance targets over the subsequent 13 months.
Permasense is the world leader in the field of continuous integrity monitoring for the oil & gas production, refining and power industries and provides a great example of Innovations’ added value when working with
Imperial College to commercialise IP over and above the Group’s venture investment activity. The company
was co-founded by Innovations in 2008 to develop and commercialise technology originally developed at the College and Innovations' 23.0% equity stake was largely derived from early commercial support provided
to the founders by Innovations' Technology Transfer Office, as well as from licensing the founding intellectual property.
Permasense generated revenues, rapidly becoming self-financing, and hence did not require funding as part
of the Group's investment portfolio. Innovations 'IP Equity' stake was therefore acquired at nil cost. In the
sale to Emerson Electric, the initial consideration generated net proceeds to Innovations of £3.7 million and in addition, an equal payment of £3.7 million for Imperial College as part of the revenue share agreement.
Putting Innovations’ capital to work
Innovations continued to deploy its substantial capital resources into its investment portfolio, investing £29.0
million in 18 companies (H1 2016: £27.5 million in 17 companies). Of this, 79.3% (£23.0 million) was invested into existing portfolio companies, with the balance being invested in four new unquoted accelerated
growth companies. These four new companies comprise two additions to the therapeutics portfolio (Artios Pharma and ApcinteX Ltd) and two new ICT & digital companies (ThisWay Global and Resolving Limited).
Of the £29.0 million invested in the period, 72.4% (£21.0 million) was made into the healthcare portfolio reflecting the higher capital demands of these companies. This included £3.9 million invested in MISSION
Therapeutics as part of the company’s £60.0 million funding round (announced on 2 February 2016); £3.3 million invested in Inivata, £2.8 million invested in Veryan Medical and £2.5 million invested in Ieso Digital
Health.
The Group is continuing to develop its investment portfolio by scaling its activities in non-therapeutics sectors
and invested in seven technology companies during the period, including significant investments in Cortexica (£2.6 million), Import.IO (£1.7 million), Plaxica (£1.0 million), Yoyo Wallet (£0.9 million) and ThisWay Global
(£0.9m).
As at 31 January 2017, the Group’s accelerated growth portfolio comprised 47 companies (FY2016: 45
companies) which collectively account for 99% of the portfolio by value. Post period end the Group completed the sale of its holding in Oxford Immunotec, so that the accelerated growth portfolio now
comprises 46 companies.
Page 7 TOUCHSTONE INNOVATIONS INTERIM REPORT AND ACCOUNTS 2017
Post period-end, the Group invested a further £11.6 million to funding rounds in Garrison Technology (£3.9
million), Resolving (£0.6 million), Concirrus (£0.6 million), Pulmocide (£1.5 million), Wave Optics (£0.5 million) and Cell Medica (£4.6 million) taking the total invested in this financial year to £40.6 million.
Building the pipeline for future value creation
Whilst the vast majority of Innovations investment capital is deployed in existing portfolio companies that
have been substantially de-risked and validated over time, the Group continues to selectively add a small number of new portfolio companies per annum. Four new companies were added during the period:
Artios Pharma Limited: a new Cambridge-based private biotech company, focused on the
development of novel DNA Damage Response (DDR) cancer therapies formed from assets from
Cancer Research Technology Ltd. In September 2016, Innovations committed £5.1 million to the
£25.0 million Series A funding round alongside an impressive syndicate of leading European and US life science investors including SV Life Sciences, Merck Ventures, Arix Bioscience PLC, CRT Pioneer
Fund (managed by Sixth Element Capital) and AbbVie Ventures.
ApcinteX: a University of Cambridge spin-out company that is developing a new therapy for
haemophilia. Innovations and Medicxi co-led a £14.0 million Series A funding round alongside
Cambridge Enterprise, who helped in ApcinteX’s formation, licensing key intellectual property to the company. Innovations committed £7.0 million to the round, investing £2.7 million during the period.
ThisWay Global Limited: a Cambridge-based technology company that is developing an innovative
software platform for the recruitment industry that uses machine learning to streamline the
recruitment process by matching high-qualitycandidates to the most appropriate job opportunities.
In September 2016, Innovations led a£1.6 million funding round alongside US-based Jetstream
Ventures and Grupa Pracuj, a global recruitment technology company with a dedicated investment arm for emerging HR tech companies.
Resolving Limited: this is the parent company of Resolver.co.uk a website dedicated to making it
easier for consumers to make complaints or raise issues with brands, companies and organisations.
During the period Innovations committed £0.5 million as the first part of a £1.1 million commitment to a £2.9 million funding round announced on 14 March 2017. Innovations invested alongside Draper
Esprit.
UCL Technology Fund and Apollo Therapeutics In January 2016, the Group completed two new initiatives aimed at expanding its licence portfolio and
broadening its visibility of, and access to, intellectual property from the elite universities within the ‘Golden
Triangle’. Both of these initiatives are now up and running and productive.
The first of these was participation in the new £50.0 million UCL Technology Fund LP. This is the first investment fund that University College London (UCL) has created to commercialise its multidisciplinary
research. Participation in this fund has significantly increased Innovations’ access to deal-flow from one of
the world’s leading universities, and is already beginning to bear fruit.
In the first year of its formation, this fund has now completed a detailed review of 54 projects which fitted funding criteria and approved 13 investment projects at a cost of £7.0 million. These included seven Proof
of Concept (PoC) projects, four spin-out opportunities and two licensing projects.
The second initiative was Innovations’ contribution of £3.3 million to Apollo Therapeutics, a new £40.0 million
joint venture between Innovations, Cambridge Enterprise (the technology transfer office of the University of Cambridge), UCLB (the technology commercialisation company of UCL) and three of the world’s leading
pharma companies, AstraZeneca, GlaxoSmithKline and Johnson & Johnson.
This new venture was created to foster the translation of outstanding academic therapeutic science into
innovative new medicines by combining the skills of the university academics with industry expertise at an early stage. The ultimate aim of the fund being to speed up the development of new medicines, as well as
reducing the cost and improving the attrition rate of potential opportunities, whilst sharing the risk of early development.
After evaluating initial opportunities across all three universities, Apollo has now approved funding for and launched its first four drug discovery projects. This included two projects from the University of Cambridge
Page 8 TOUCHSTONE INNOVATIONS INTERIM REPORT AND ACCOUNTS 2017
and one each from Imperial College London and UCL. These initial projects represent novel and compelling drug discovery projects, emerging from academic research in areas of high medical need for which Apollo’s
Drug Discovery Team saw a clear route to value creation. A total of £8.5 million has been committed in milestoned project plans. Two further projects are currently being finalised, with multiple others in the
evaluation process across all three academic institutions.
These two key strategic partnerships are delivering in line with expectations, and in time, the Group expects
that they will deliver incremental opportunities for it to deploy its investment capital.
Continuing momentum in the portfolio Since IPO in 2006 the Group has co-founded and invested in 106 portfolio companies. Of these, 23
companies have completed successful exits, generating an average return of 2.7x cash invested. A further
37 companies have been sold or written down to recover value. The balance of 46 companies comprises the accelerated growth portfolio which provide the investment opportunity and value potential, and
collectively account for 99% of the portfolio by value.
The Group’s Top 10 investee companies all have net investment carrying values between £10.0 million and
£45.0 million spread across the Group’s four specialist sectors. None of these companies have a disproportional weighting, with the largest, PsiOxus, representing 11.6% of net portfolio value. Nine of the
Top 10 are private companies with an average age of 10.3 years. These are well-managed and well-capitalised businesses which have been de-risked and validated to varying degrees through the due diligence
of our co-investors. They have raised an average of £39.3 million each.
Portfolio highlights include:
Abingdon Health: Abingdon has developed and commercialised its own range of rapid tests for
haematology oncology specifically in the area of B-cell dyscrasias which are diseases caused by
disorders of plasma cells. The Seralite® Free Light Chain product range is used as an aid in the diagnosis and management of multiple myeloma. On 10 October 2016, Abingdon announced that the
latest addition to the range, Seralite®-FLC ELISA had secured a CE mark. In June 2016, Abingdon
announced a global distribution agreement with Sebia, a world leader in electrophoresis products, for Seralite®– FLC Serum. This partnership is progressing well, as is its collaboration agreement with
Sumitomo Chemical Co. Ltd (“Sumitomo Chemical”) to develop a next generation multiplexed point of care biosensor device.
Abzena: As previously mentioned Abzena plc is continuing to see interest in its novel site-specific
ThioBridge(TM) antibody drug conjugate (ADC) linker technology and in January 2017, announced a substantial licensing agreement with a San Diego-based biopharmaceutical company with the
potential to reach over $300 million in licence fees and milestone payments. In addition, the company
is seeing good progress both within its services business and across its 'Abzena inside' portfolio with a further Composite Human Antibody™ product being taken into clinical development by a US biotech
company. This takes the number of 'Abzena inside' products at a clinical stage to 12. The most advanced of these is GS-5745 in gastric cancer. Interim data for this Phase III trial is expected in late
2017.
Autifony: In August 2016, Autifony announced the successful completion of a Phase I study of
AUT00206, its first-in-class Kv3 modulator for schizophrenia. This was followed in January 2017 with news of a Phase 1a study providing further encouraging confirmation of human target engagement,
and support for the progression of AUT00206 in schizophrenia. At the same time the company announced the start of two Phase Ib studies with the molecule. Meanwhile, the Quick+fire study in
adult cochlear implant users, which started in July 2016 and will test AUT00063 in a population of patients with different hearing difficulties is continuing. On 15 March 2017, Autifony announced that
it had secured £1.3 million in funding from Innovate UK and the Dementia Discovery Fund to explore
novel approach to treatment of dementia based on its expertise in ion channel drug discovery.
Cell Medica: continues to strike new partnerships to expand its capabilities in cellular immunotherapy
and on 24 August 2016, announced a research collaboration with UCL which will see the company
utilise UCL’s novel T cell receptor (TCR) technology to generate leading-edge modified TCR products for the treatment of cancer. The collaboration also provides Cell Medica with an exclusive worldwide
option and licence agreement for these technologies, as well as TCR gene sequences for the
development and commercialisation of specific products. On 10 November 2016, Cell Medica announced that it had expanded its partnership with Baylor College of Medicine (‘Baylor’) to develop
an off-the-shelf allogeneic cell therapy, taking advantage of the unique aspects of invariant natural
Page 9 TOUCHSTONE INNOVATIONS INTERIM REPORT AND ACCOUNTS 2017
killer T (NKT) cells which mean that they are not prone to serious side effect called graft versus host disease (GvHD) that is common in other allogenic treatments. Post period-end, on 16 March 2017,
Cell Medica completed a £60.0 million funding round, with Innovations committing £13.7 million to the round alongside co-investors Invesco Asset Management and Woodford Investment Management.
Circassia Pharmaceuticals: Notwithstanding the disappointing results of its Phase III cat allergy trial,
on 27 September 2016, Circassia reported its interim results for the six months to 30 June 2016, noting substantially increased revenues from its asthma management products, robust growth in its
respiratory portfolio and an expansion of its commercial footprint. The company also reported
encouraging results from its Phase II birch allergy study but will wait for the results of its large-scale (700 patients enrolled) house dust mite field study which are due in spring 2017, before reassessing
the wider strategy for its allergy immunotherapy portfolio. Post period-end on 17 March 2017, Circassia announced that it had entered into an agreement with AstraZeneca to secure certain U.S.
commercial rights to two chronic obstructive pulmonary disease products, Tudorza® and Duaklir®, for
a maximum total consideration of US$230 million. These products represent a clear strategic fit with Circassia's focus on respiratory medicines and provide the company with an opportunity to transform
its product portfolio and expand its commercial infrastructure in the USA. – see Partnerships, collaborations and exits for further details.
Cortexica Visual Systems: Cortexica is continuing to make commercial progress with its proprietary
findSimilar™ technology being used by a growing list of global retailers including Macy’s, Zalando and John Lewis. Cortexica is also working with Hammerson, the shopping centre group, to integrate
findSimilar™ into the retailer’s location-based mobile application, which is in use in 22 shopping
centres across Europe. Cortexica is also diversifying its operations with the development of new applications for its visual search technology in other applications such as Health and Safety, and Clean
Room environments.
Crescendo Biologics: Crescendo is discovering and developing potent, highly differentiated mono- and
multi-specific Humabody® therapeutics in oncology based on its unique, patent protected, transgenic
mouse platform. This platform, combined with the company’s engineering expertise, could lead to
the development of multiple drug candidates making it very attractive to pharma companies. In October 2016 Crescendo signed a multi-target collaboration and licence agreement with Takeda
Pharmaceutical worth up to US $790 million (subject to successful completion of milestones) – see Partnerships, collaborations and exits for further details.
Featurespace: is continuing to make good progress in the USA, following the announcement in May
2016 of its partnership with TSYS Inc, one of the world’s largest payment solutions and services
companies. As a result of this partnership Featurespace’s adaptive behavioural analytics platform will be used to reduce fraud and false positives for TSYS’ clients. Featurespace’s solution is being
implemented at the first two TSYS customers with very positive results, with the technology proving to be significantly better than existing systems. TSYS plans to roll out Featurespace's solution to many
more of its customers, starting in Q2 this year.
MISSION Therapeutics: Having raised £60.0 million from investors in February 2016, MISSION is well
placed to continue to develop its world-leading platform for the discovery and development of first-
in-class, small molecule drugs that selectively target deubiquitinating enzymes (‘DUBs’) – an
emerging, and hitherto intractable drug class that is attracting significant commercial interest. On 5 December 2016, MISSION appointed Dr Colin Goddard as non-executive Chairman, with former
Chairman Michael Moore moving to the position of Deputy Chairman. Prior to joining Mission Therapeutics, Dr Goddard was Chief Executive Officer of OSI Pharmaceuticals, which he led from
being a technology platform services company into a profitable fully integrated biopharmaceutical
organisation.
Nexeon: With the benefit of the additional £30.0 million equity funding round completed in May 2016,
Nexeon is continuing to optimise its silicon materials for the blended carbon/silicon anode applications
currently being demanded by the battery industry. Nexeon is increasingly being recognised as the “go to” company for silicon materials in the battery space, which is presenting exciting commercial
opportunities. The company recently signed a joint development agreement with an automotive company and is actively sampling kilogram quantities of its products to several tier 1 battery
companies. On 11 October 2016, Nexeon announced the opening of a new office and development
laboratory in Yokohama, close to many of the company’s development partners and prospective customers in the electronics and automotive sectors. This allows Nexeon to directly support
customers in a territory where more than 90% batteries are currently made and has enabled the company to attract local talent, which will accelerate commercialisation.
Page 10 TOUCHSTONE INNOVATIONS INTERIM REPORT AND ACCOUNTS 2017
PsiOxus Therapeutics: PsiOxus’ first generation oncolytic virus Enadenotucirev and the company's
proprietary Tumor-Specific Immuno-Gene Therapy (T-SIGn) platform technology continues to garner significant interest from pharma companies. As a combination therapy Enadenotucirev could
potentially expand the market for blockbuster checkpoint inhibitor drugs by increasing the range of cancer types for which they are effective, whereas the T-SIGn platform could potentially outperform
new immuno-oncology platforms such as CAR-T by providing an off-the-shelf product that does not require the selection of a specific tumour antigen. In December 2016, PsiOxus announced an
exclusive worldwide licence agreement with BMS for NG-348, its first “armed” oncolytic virus, in a
transaction worth up to US $936 million (subject to successful completion of milestones) – see Partnerships, collaborations and exits for further details.
TopiVert: is continuing to see good progress with the development of narrow spectrum kinase
inhibitors (NSKIs) as novel, locally-acting medicines for the local treatment of chronic inflammatory diseases of the gastrointestinal tract and eye. TopiVert’s most advanced drug candidate, TOP1288
for the treatment of ulcerative colitis (UC), has successfully completed Phase I development and on
6 October 2016, the company announced that the first patients had been dosed in its Phase IIa proof-of-concept study. In November 2016, the company announced that its Investigational New Drug
(IND) application for the evaluation of TOP1630 ophthalmic solution as a treatment of patients with dry eye syndrome (DES) has been approved by the US Food and Drug Administration (FDA). Post
period end on the 22 February 2017, TopiVert announced the successful dosing of the first patients in this trial. This was followed on the 28 February with the news of the successful dosing of the first
subjects in a Phase 1 study of its oral formulation of TOP1288 for the treatment of UC. Results from
both oral and rectal studies of TOP1288 are expected in the second half of 2017.
Veryan Medical: In October 2016, Veryan completed enrolment into the MIMICS2 clinical study of its
BioMimics 3D® Self-Expanding Stent System (BioMimics 3D). This has been designed to evaluate
the safety and effectiveness of BioMimics 3D in the treatment of patients with symptomatic femoropopliteal disease with a view to provide safety and effectiveness data that are intended to
support future marketing applications for BioMimics 3D in both the USA and Japan. Enrolment
concluded with a total of 271 patients who were enrolled across 47 investigational sites in Germany, the USA and Japan. In February 2017, Veryan secured a further £13.5 million of funding in the form
of new equity funding secured from existing investors (including Innovations) supported with a €5.0 million loan from Silicon Valley Bank. The new investment will allow the company to continue its
progress towards US and Japanese regulatory approvals for its patented a three-dimensional stent,
BioMimics 3D™ which secured European approval in late 2012.
Yoyo Wallet: is continuing to see firm traction for its mobile payments and loyalty application. The
‘app’ was launched in early 2014 across 32 food and drink outlets at Imperial College London and at
31 January 2017, the company had signed more than 40 universities as customers and deployed the solution at 110 head office corporate catering locations. Yoyo is now targeting high-street retail
chains and in November 2016 the company announced it had been selected by Caffè Nero as the coffee chain's mobile payment and loyalty strategy partner. The roll-out to the retailer’s network of
more than 600 stores will begin spring 2017.
Not all companies performed to expectations and the Group reported £8.3 million of impairments from its
unquoted portfolio.
More than 75% of this impairment is attributable to a £6.2 million write down in the value of Kesios
Therapeutics. Disappointingly the underlying technology failed to live up to expectations and the decision was made with Kesios’ management team to wind the company down. The £6.2 million loss on Kesios
represents 1.9% of opening net portfolio value.
Outlook The healthy balance sheet combined with the Group’s policy of building strong investor syndicates, means
that Innovations remains well positioned to create value for shareholders. In particular, the Group has the
ability to scale up its investment in the significant opportunities within the maturing portfolio, whilst maximising the new opportunities expected from the new alliances with UCL Technology Fund and Apollo.
Overall, the Group expects to maintain its current rate of investment for the full year. Meanwhile, cash realisations are expected to be higher than the prior year, which may reduce net cash outflow. This is a
further demonstration of how the portfolio is maturing.
Page 11 TOUCHSTONE INNOVATIONS INTERIM REPORT AND ACCOUNTS 2017
The majority of the investment capital will continue to be deployed in companies that Innovations has co-founded and knows intimately. Additionally, the Group will maintain its new business creation activity to
build longevity in the portfolio, by selectively adding 6-8 new companies per annum.
Innovations plans to continue to balance its portfolio by proactively growing its investment in non-therapeutics businesses, whilst building further capacity in its tech ventures team. Over the last 2.5 years
the ICT & Digital portfolio has grown from £18.3 million (7.3% of net portfolio value) to £41.5 million (11.7%
of net portfolio value), whilst over the same period generating an additional £5.3 million of realisations.
The quality of new opportunities that the Group is seeing from the academic, research and entrepreneurial community within the ‘Golden Triangle’ remains high, with a healthy stream of new investment opportunities.
The UCL Technology Fund and Apollo Therapeutics Fund are both now fully operational and productive and will provide additional opportunities for the Group to invest, in addition to strengthening our relationships
with the participating universities and pharma companies.
The Board remains confident that Innovations’ business model and key principles of attracting world class
management, building stakes in selected portfolio companies alongside appropriate co-investors, and having the patience and capital resources to hold for the long-term, will generate attractive shareholder returns.
Russell Cummings Chief Executive Officer
Page 12 TOUCHSTONE INNOVATIONS INTERIM REPORT AND ACCOUNTS 2017
Financial review Summary
The Group generated a profit during the period of £16.0 million (H1 2016: £5.9 million loss, FY 2016: £63.1
million loss). This was primarily driven by fair value gains in the quoted and unquoted portfolio. The cash balance remains healthy.
Net assets at the period end of £472.4 million (H1 2016: £415.9 million, FY 2016: £455.9 million) increased
by £16.5 million from 31 July 2016, primarily as a result of the net fair value gain.
Cash and short-term liquidity investments At 31 January 2017, the Group’s cash and short term liquidity investments moved to £113.3 million (H1 2016: £91.6 million, FY 2016: £148.3 million). The key driver of this movement was the Group’s
investment activity.
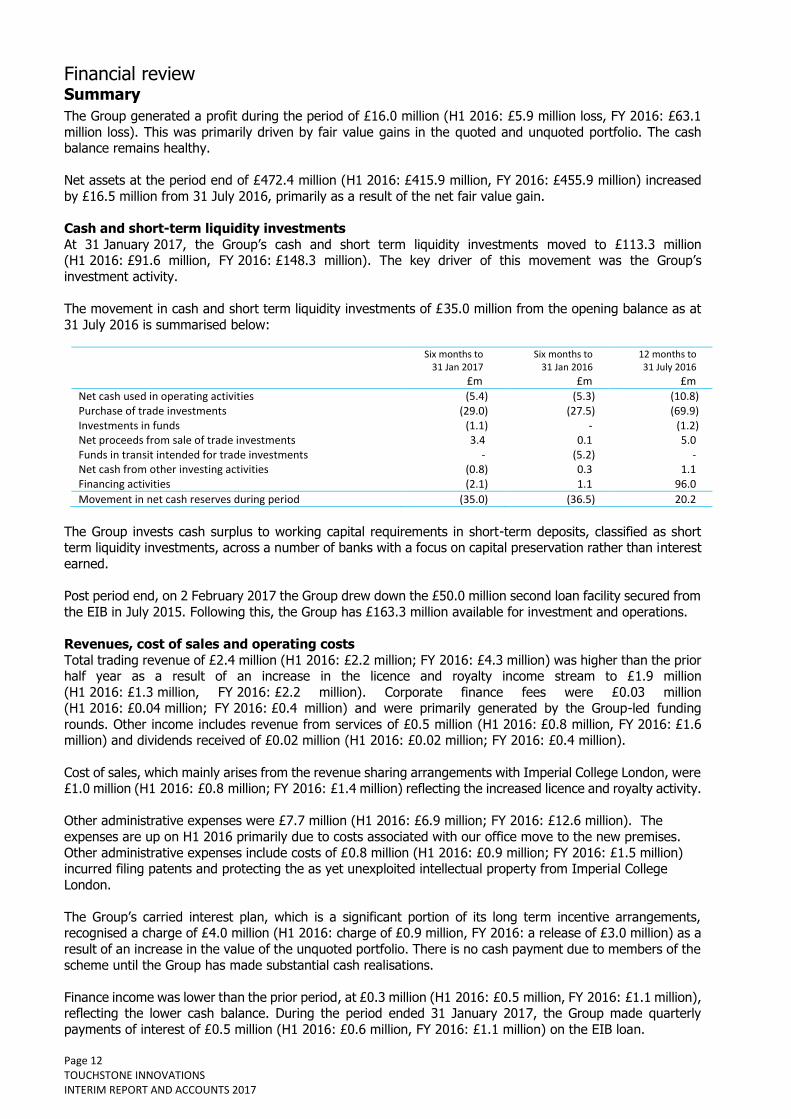
The movement in cash and short term liquidity investments of £35.0 million from the opening balance as at
31 July 2016 is summarised below:
Six months to 31 Jan 2017
Six months to 31 Jan 2016
12 months to 31 July 2016
£m £m £m
Net cash used in operating activities (5.4) (5.3) (10.8) Purchase of trade investments (29.0) (27.5) (69.9) Investments in funds (1.1) - (1.2) Net proceeds from sale of trade investments 3.4 0.1 5.0 Funds in transit intended for trade investments - (5.2) - Net cash from other investing activities (0.8) 0.3 1.1 Financing activities (2.1) 1.1 96.0
Movement in net cash reserves during period (35.0) (36.5) 20.2
The Group invests cash surplus to working capital requirements in short-term deposits, classified as short term liquidity investments, across a number of banks with a focus on capital preservation rather than interest
earned.
Post period end, on 2 February 2017 the Group drew down the £50.0 million second loan facility secured from
the EIB in July 2015. Following this, the Group has £163.3 million available for investment and operations.
Revenues, cost of sales and operating costs
Total trading revenue of £2.4 million (H1 2016: £2.2 million; FY 2016: £4.3 million) was higher than the prior half year as a result of an increase in the licence and royalty income stream to £1.9 million
(H1 2016: £1.3 million, FY 2016: £2.2 million). Corporate finance fees were £0.03 million (H1 2016: £0.04 million; FY 2016: £0.4 million) and were primarily generated by the Group-led funding
rounds. Other income includes revenue from services of £0.5 million (H1 2016: £0.8 million, FY 2016: £1.6 million) and dividends received of £0.02 million (H1 2016: £0.02 million; FY 2016: £0.4 million).
Cost of sales, which mainly arises from the revenue sharing arrangements with Imperial College London, were £1.0 million (H1 2016: £0.8 million; FY 2016: £1.4 million) reflecting the increased licence and royalty activity.
Other administrative expenses were £7.7 million (H1 2016: £6.9 million; FY 2016: £12.6 million). The
expenses are up on H1 2016 primarily due to costs associated with our office move to the new premises.
Other administrative expenses include costs of £0.8 million (H1 2016: £0.9 million; FY 2016: £1.5 million) incurred filing patents and protecting the as yet unexploited intellectual property from Imperial College
London.
The Group’s carried interest plan, which is a significant portion of its long term incentive arrangements, recognised a charge of £4.0 million (H1 2016: charge of £0.9 million, FY 2016: a release of £3.0 million) as a
result of an increase in the value of the unquoted portfolio. There is no cash payment due to members of the
scheme until the Group has made substantial cash realisations.
Finance income was lower than the prior period, at £0.3 million (H1 2016: £0.5 million, FY 2016: £1.1 million), reflecting the lower cash balance. During the period ended 31 January 2017, the Group made quarterly
payments of interest of £0.5 million (H1 2016: £0.6 million, FY 2016: £1.1 million) on the EIB loan.
Page 13 TOUCHSTONE INNOVATIONS INTERIM REPORT AND ACCOUNTS 2017
The Group reported a profit before tax of £16.0 million (H1 2016: £5.9 million loss, FY 2016: £63.1 million loss). The Group’s basic profit per share was 10.0p (H1 2016: basic loss per share 4.3p, FY 2016: basic loss
per share 43.2p). The Group did not pay a dividend (H1 2016: nil, FY 2016: nil).
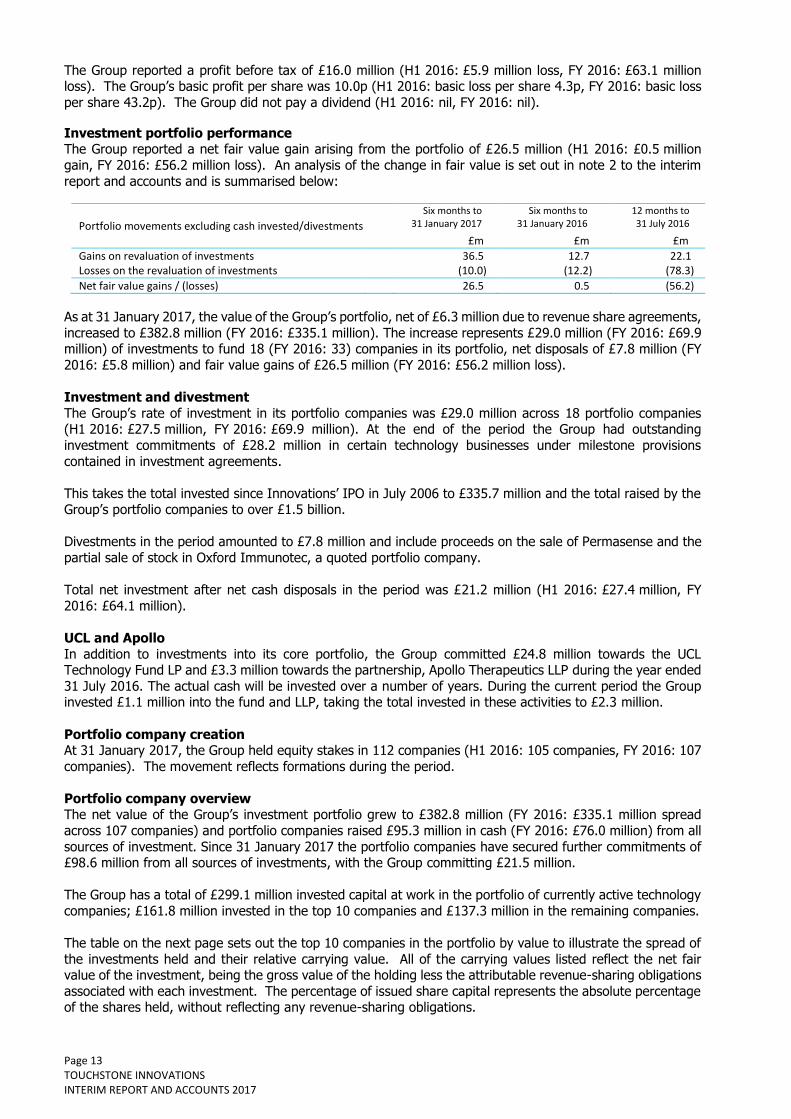
Investment portfolio performance The Group reported a net fair value gain arising from the portfolio of £26.5 million (H1 2016: £0.5 million
gain, FY 2016: £56.2 million loss). An analysis of the change in fair value is set out in note 2 to the interim
report and accounts and is summarised below:
Portfolio movements excluding cash invested/divestments
Six months to 31 January 2017
Six months to 31 January 2016
12 months to 31 July 2016
£m £m £m
Gains on revaluation of investments 36.5 12.7 22.1 Losses on the revaluation of investments (10.0) (12.2) (78.3)
Net fair value gains / (losses) 26.5 0.5 (56.2)
As at 31 January 2017, the value of the Group’s portfolio, net of £6.3 million due to revenue share agreements,
increased to £382.8 million (FY 2016: £335.1 million). The increase represents £29.0 million (FY 2016: £69.9 million) of investments to fund 18 (FY 2016: 33) companies in its portfolio, net disposals of £7.8 million (FY
2016: £5.8 million) and fair value gains of £26.5 million (FY 2016: £56.2 million loss).
Investment and divestment
The Group’s rate of investment in its portfolio companies was £29.0 million across 18 portfolio companies (H1 2016: £27.5 million, FY 2016: £69.9 million). At the end of the period the Group had outstanding
investment commitments of £28.2 million in certain technology businesses under milestone provisions
contained in investment agreements.
This takes the total invested since Innovations’ IPO in July 2006 to £335.7 million and the total raised by the Group’s portfolio companies to over £1.5 billion.
Divestments in the period amounted to £7.8 million and include proceeds on the sale of Permasense and the
partial sale of stock in Oxford Immunotec, a quoted portfolio company.
Total net investment after net cash disposals in the period was £21.2 million (H1 2016: £27.4 million, FY
2016: £64.1 million).
UCL and Apollo
In addition to investments into its core portfolio, the Group committed £24.8 million towards the UCL Technology Fund LP and £3.3 million towards the partnership, Apollo Therapeutics LLP during the year ended
31 July 2016. The actual cash will be invested over a number of years. During the current period the Group invested £1.1 million into the fund and LLP, taking the total invested in these activities to £2.3 million.
Portfolio company creation At 31 January 2017, the Group held equity stakes in 112 companies (H1 2016: 105 companies, FY 2016: 107
companies). The movement reflects formations during the period.
Portfolio company overview The net value of the Group’s investment portfolio grew to £382.8 million (FY 2016: £335.1 million spread
across 107 companies) and portfolio companies raised £95.3 million in cash (FY 2016: £76.0 million) from all
sources of investment. Since 31 January 2017 the portfolio companies have secured further commitments of £98.6 million from all sources of investments, with the Group committing £21.5 million.
The Group has a total of £299.1 million invested capital at work in the portfolio of currently active technology
companies; £161.8 million invested in the top 10 companies and £137.3 million in the remaining companies.
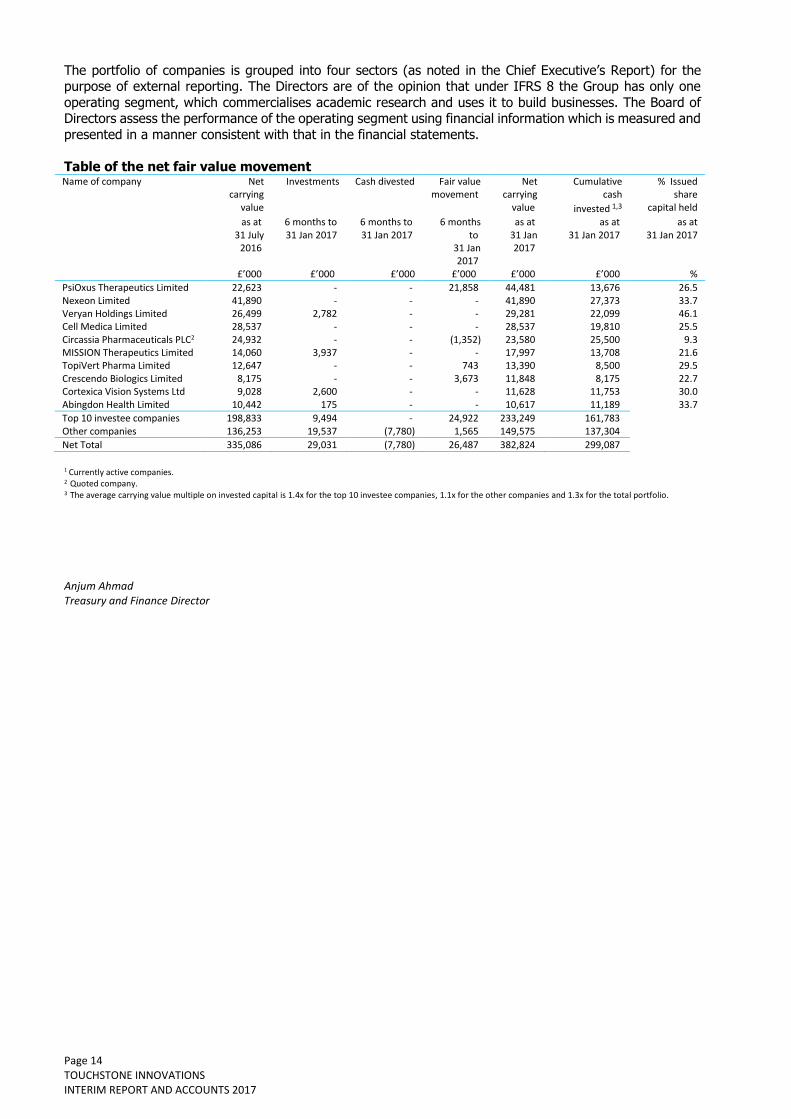
The table on the next page sets out the top 10 companies in the portfolio by value to illustrate the spread of
the investments held and their relative carrying value. All of the carrying values listed reflect the net fair value of the investment, being the gross value of the holding less the attributable revenue-sharing obligations
associated with each investment. The percentage of issued share capital represents the absolute percentage of the shares held, without reflecting any revenue-sharing obligations.
Page 14 TOUCHSTONE INNOVATIONS INTERIM REPORT AND ACCOUNTS 2017
The portfolio of companies is grouped into four sectors (as noted in the Chief Executive’s Report) for the purpose of external reporting. The Directors are of the opinion that under IFRS 8 the Group has only one
operating segment, which commercialises academic research and uses it to build businesses. The Board of Directors assess the performance of the operating segment using financial information which is measured and
presented in a manner consistent with that in the financial statements.
Table of the net fair value movement Name of company Net
carrying value
Investments Cash divested Fair value movement
Net carrying
value
Cumulative cash
invested 1,3
% Issued share
capital held
as at 31 July
2016
6 months to 31 Jan 2017
6 months to 31 Jan 2017
6 months to
31 Jan 2017
as at 31 Jan 2017
as at 31 Jan 2017
as at 31 Jan 2017
£’000 £’000 £’000 £’000 £’000 £’000 %
PsiOxus Therapeutics Limited 22,623 - - 21,858 44,481 13,676 26.5 Nexeon Limited 41,890 - - - 41,890 27,373 33.7 Veryan Holdings Limited 26,499 2,782 - - 29,281 22,099 46.1 Cell Medica Limited 28,537 - - - 28,537 19,810 25.5 Circassia Pharmaceuticals PLC2 24,932 - - (1,352) 23,580 25,500 9.3 MISSION Therapeutics Limited 14,060 3,937 - - 17,997 13,708 21.6 TopiVert Pharma Limited 12,647 - - 743 13,390 8,500 29.5 Crescendo Biologics Limited 8,175 - - 3,673 11,848 8,175 22.7 Cortexica Vision Systems Ltd 9,028 2,600 - - 11,628 11,753 30.0 Abingdon Health Limited 10,442 175 - - 10,617 11,189 33.7
Top 10 investee companies 198,833 9,494 - 24,922 233,249 161,783 Other companies 136,253 19,537 (7,780) 1,565 149,575 137,304
Net Total 335,086 29,031 (7,780) 26,487 382,824 299,087
1 Currently active companies. 2 Quoted company. 3 The average carrying value multiple on invested capital is 1.4x for the top 10 investee companies, 1.1x for the other companies and 1.3x for the total portfolio.
Anjum Ahmad Treasury and Finance Director
Page 15 TOUCHSTONE INNOVATIONS INTERIM REPORT AND ACCOUNTS 2017
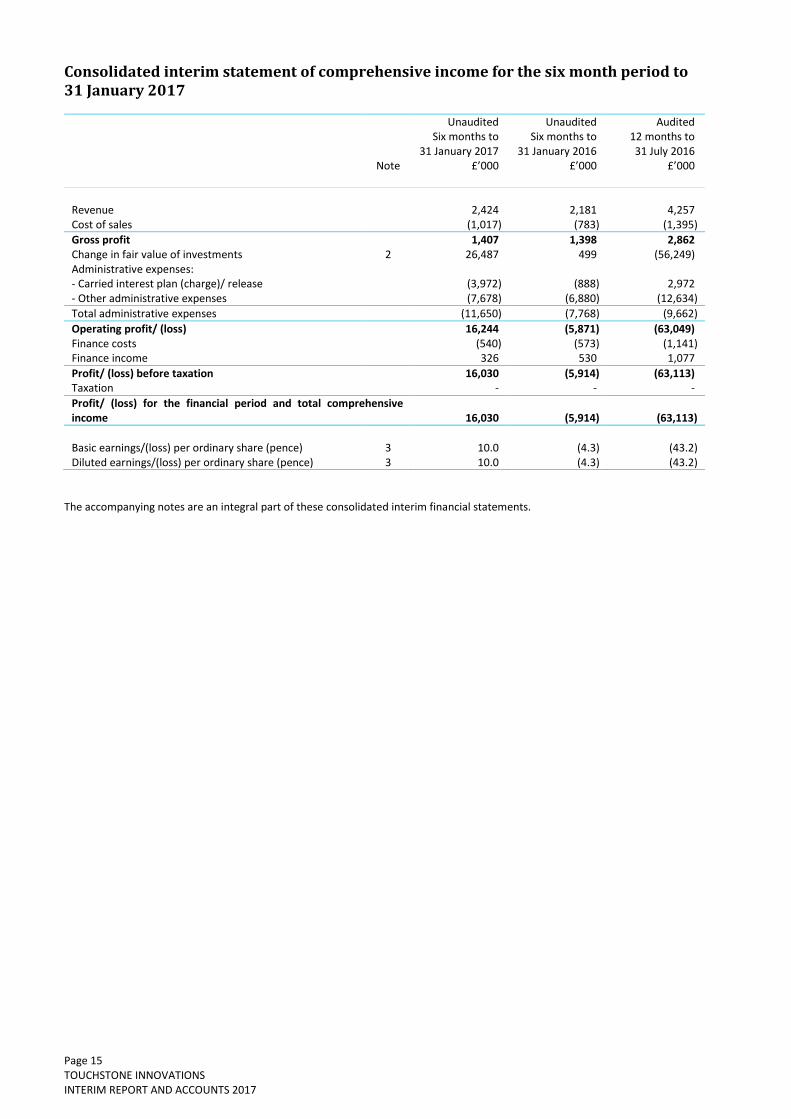
Consolidated interim statement of comprehensive income for the six month period to 31 January 2017
Unaudited Unaudited Audited Six months to
31 January 2017 Six months to
31 January 2016 12 months to 31 July 2016
Note £’000 £’000 £’000
Revenue 2,424 2,181 4,257 Cost of sales (1,017) (783) (1,395)
Gross profit 1,407 1,398 2,862 Change in fair value of investments 2 26,487 499 (56,249) Administrative expenses: - Carried interest plan (charge)/ release (3,972) (888) 2,972 - Other administrative expenses (7,678) (6,880) (12,634)
Total administrative expenses (11,650) (7,768) (9,662)
Operating profit/ (loss) 16,244 (5,871) (63,049) Finance costs (540) (573) (1,141) Finance income 326 530 1,077
Profit/ (loss) before taxation 16,030 (5,914) (63,113) Taxation - - -
Profit/ (loss) for the financial period and total comprehensive income
16,030
(5,914)
(63,113)
Basic earnings/(loss) per ordinary share (pence) 3 10.0 (4.3) (43.2) Diluted earnings/(loss) per ordinary share (pence) 3 10.0 (4.3) (43.2)
The accompanying notes are an integral part of these consolidated interim financial statements.
Page 16 TOUCHSTONE INNOVATIONS INTERIM REPORT AND ACCOUNTS 2017
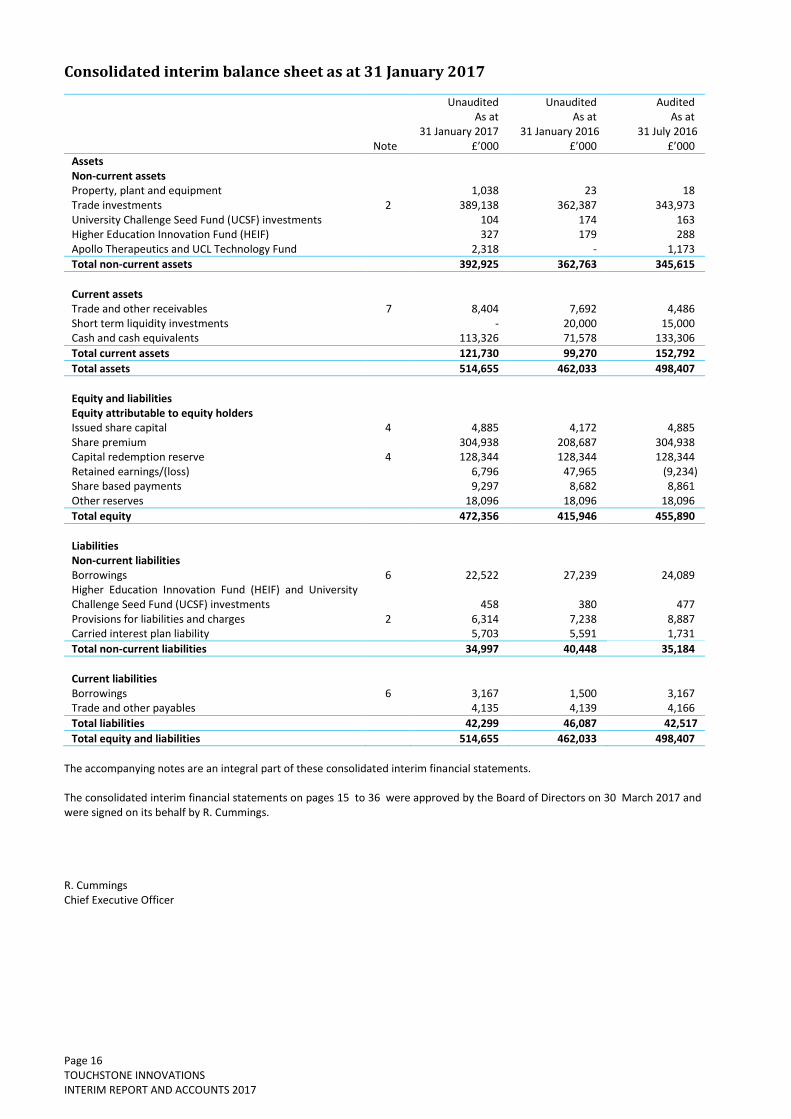
Consolidated interim balance sheet as at 31 January 2017
Unaudited Unaudited Audited As at
31 January 2017 As at
31 January 2016 As at
31 July 2016 Note £’000 £’000 £’000
Assets Non-current assets Property, plant and equipment 1,038 23 18 Trade investments 2 389,138 362,387 343,973 University Challenge Seed Fund (UCSF) investments 104 174 163 Higher Education Innovation Fund (HEIF) 327 179 288 Apollo Therapeutics and UCL Technology Fund 2,318 - 1,173
Total non-current assets 392,925 362,763 345,615
Current assets Trade and other receivables 7 8,404 7,692 4,486 Short term liquidity investments - 20,000 15,000 Cash and cash equivalents 113,326 71,578 133,306
Total current assets 121,730 99,270 152,792
Total assets 514,655 462,033 498,407
Equity and liabilities Equity attributable to equity holders Issued share capital 4 4,885 4,172 4,885 Share premium 304,938 208,687 304,938 Capital redemption reserve 4 128,344 128,344 128,344 Retained earnings/(loss) 6,796 47,965 (9,234) Share based payments 9,297 8,682 8,861 Other reserves 18,096 18,096 18,096
Total equity 472,356 415,946 455,890
Liabilities Non-current liabilities Borrowings 6 22,522 27,239 24,089 Higher Education Innovation Fund (HEIF) and University Challenge Seed Fund (UCSF) investments
458
380 477
Provisions for liabilities and charges 2 6,314 7,238 8,887 Carried interest plan liability 5,703 5,591 1,731
Total non-current liabilities 34,997 40,448 35,184
Current liabilities Borrowings 6 3,167 1,500 3,167 Trade and other payables 4,135 4,139 4,166
Total liabilities 42,299 46,087 42,517
Total equity and liabilities 514,655 462,033 498,407
The accompanying notes are an integral part of these consolidated interim financial statements. The consolidated interim financial statements on pages 15 to 36 were approved by the Board of Directors on 30 March 2017 and were signed on its behalf by R. Cummings. R. Cummings Chief Executive Officer
Page 17 TOUCHSTONE INNOVATIONS INTERIM REPORT AND ACCOUNTS 2017
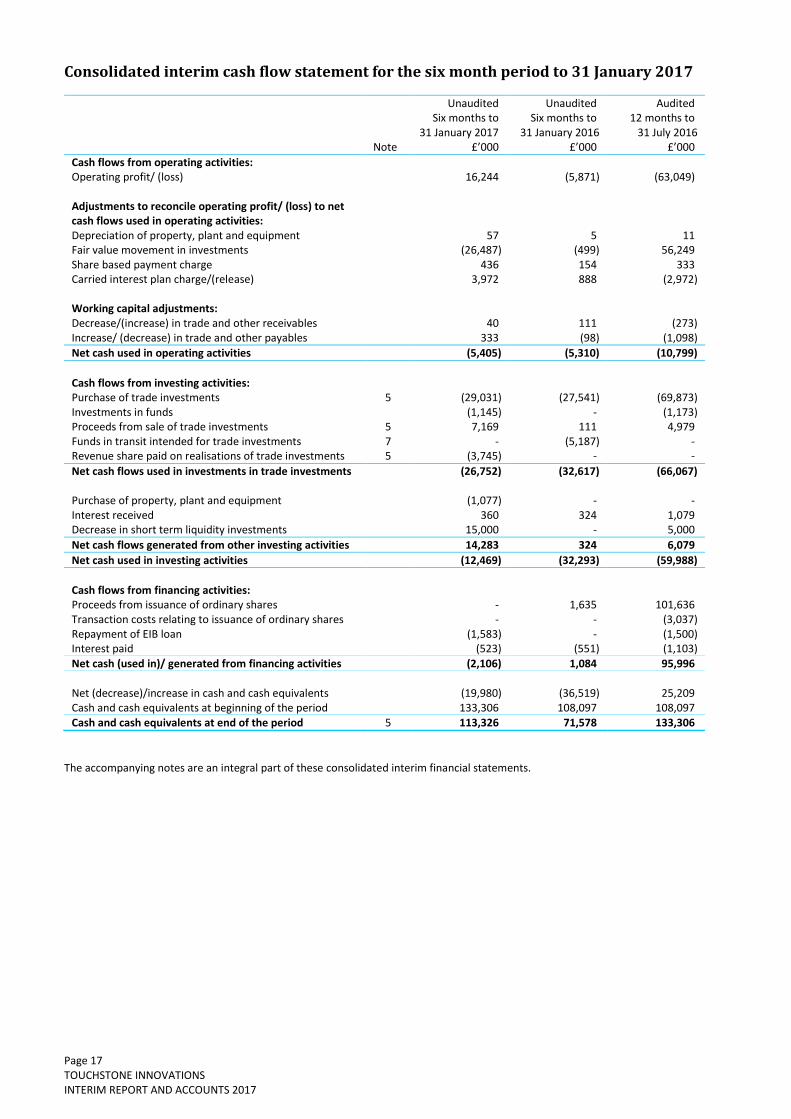
Consolidated interim cash flow statement for the six month period to 31 January 2017
Unaudited Unaudited Audited Six months to
31 January 2017 Six months to
31 January 2016 12 months to
31 July 2016 Note £’000 £’000 £’000
Cash flows from operating activities: Operating profit/ (loss) 16,244 (5,871) (63,049) Adjustments to reconcile operating profit/ (loss) to net cash flows used in operating activities: Depreciation of property, plant and equipment 57 5 11 Fair value movement in investments (26,487) (499) 56,249 Share based payment charge 436 154 333 Carried interest plan charge/(release) 3,972 888 (2,972) Working capital adjustments: Decrease/(increase) in trade and other receivables 40 111 (273) Increase/ (decrease) in trade and other payables 333 (98) (1,098)
Net cash used in operating activities (5,405) (5,310) (10,799)
Cash flows from investing activities: Purchase of trade investments 5 (29,031) (27,541) (69,873) Investments in funds (1,145) - (1,173) Proceeds from sale of trade investments 5 7,169 111 4,979 Funds in transit intended for trade investments 7 - (5,187) - Revenue share paid on realisations of trade investments 5 (3,745) - -
Net cash flows used in investments in trade investments (26,752) (32,617) (66,067) Purchase of property, plant and equipment (1,077) - - Interest received 360 324 1,079 Decrease in short term liquidity investments 15,000 - 5,000
Net cash flows generated from other investing activities 14,283 324 6,079
Net cash used in investing activities (12,469) (32,293) (59,988)
Cash flows from financing activities: Proceeds from issuance of ordinary shares - 1,635 101,636 Transaction costs relating to issuance of ordinary shares - - (3,037) Repayment of EIB loan (1,583) - (1,500) Interest paid (523) (551) (1,103)
Net cash (used in)/ generated from financing activities (2,106) 1,084 95,996 Net (decrease)/increase in cash and cash equivalents (19,980) (36,519) 25,209 Cash and cash equivalents at beginning of the period 133,306 108,097 108,097 Cash and cash equivalents at end of the period 5 113,326 71,578 133,306
The accompanying notes are an integral part of these consolidated interim financial statements.
Page 18 TOUCHSTONE INNOVATIONS INTERIM REPORT AND ACCOUNTS 2017
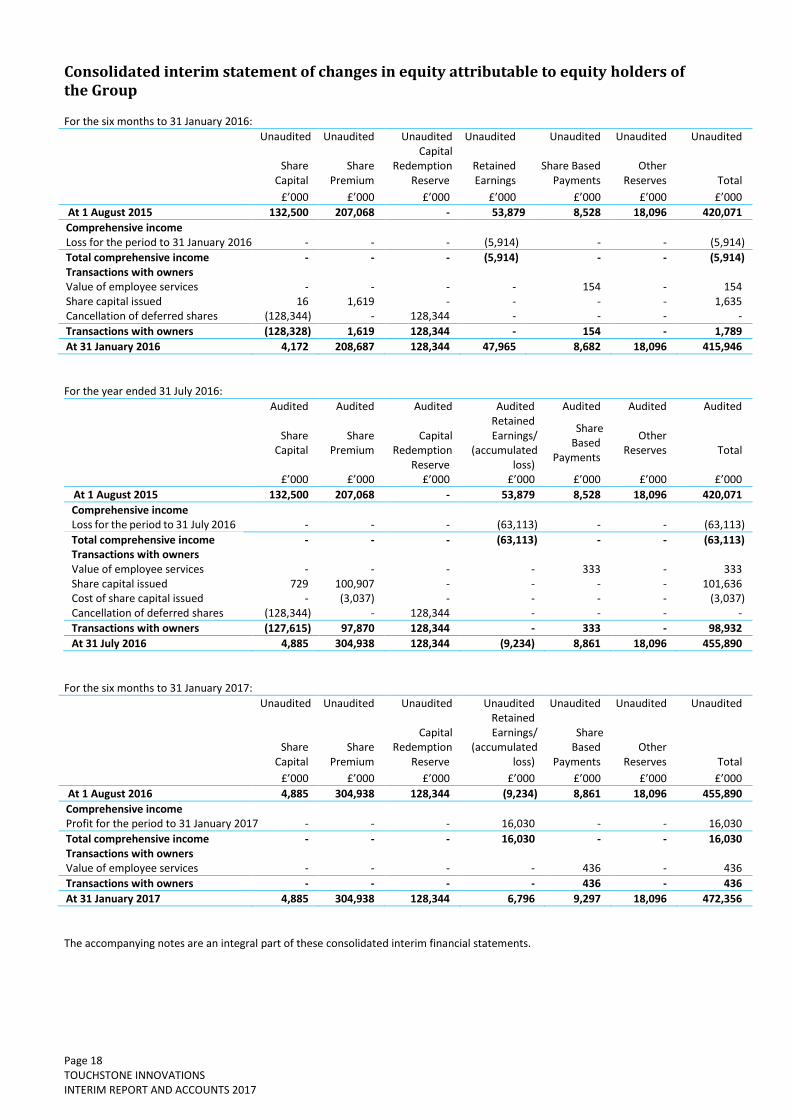
Consolidated interim statement of changes in equity attributable to equity holders of the Group For the six months to 31 January 2016:
Unaudited Unaudited Unaudited Unaudited Unaudited Unaudited Unaudited
Share
Capital Share
Premium
Capital Redemption
Reserve Retained Earnings
Share Based Payments
Other Reserves
Total
£’000 £’000 £’000 £’000 £’000 £’000 £’000
At 1 August 2015 132,500 207,068 - 53,879 8,528 18,096 420,071
Comprehensive income Loss for the period to 31 January 2016 - - - (5,914) - - (5,914)
Total comprehensive income - - - (5,914) - - (5,914) Transactions with owners Value of employee services - - - - 154 - 154 Share capital issued 16 1,619 - - - - 1,635 Cancellation of deferred shares (128,344) - 128,344 - - - -
Transactions with owners (128,328) 1,619 128,344 - 154 - 1,789
At 31 January 2016 4,172 208,687 128,344 47,965 8,682 18,096 415,946
For the year ended 31 July 2016:
Audited Audited Audited Audited Audited Audited Audited
Share Capital
Share Premium
Capital Redemption
Reserve
Retained Earnings/
(accumulated loss)
Share Based
Payments
Other Reserves
Total
£’000 £’000 £’000 £’000 £’000 £’000 £’000
At 1 August 2015 132,500 207,068 - 53,879 8,528 18,096 420,071
Comprehensive income Loss for the period to 31 July 2016 - - - (63,113) - - (63,113)
Total comprehensive income - - - (63,113) - - (63,113) Transactions with owners Value of employee services - - - - 333 - 333 Share capital issued 729 100,907 - - - - 101,636 Cost of share capital issued - (3,037) - - - - (3,037) Cancellation of deferred shares (128,344) - 128,344 - - - -
Transactions with owners (127,615) 97,870 128,344 - 333 - 98,932
At 31 July 2016 4,885 304,938 128,344 (9,234) 8,861 18,096 455,890
For the six months to 31 January 2017:
Unaudited Unaudited Unaudited Unaudited Unaudited Unaudited Unaudited
Share
Capital Share
Premium
Capital Redemption
Reserve
Retained Earnings/
(accumulated loss)
Share Based
Payments Other
Reserves
Total
£’000 £’000 £’000 £’000 £’000 £’000 £’000
At 1 August 2016 4,885 304,938 128,344 (9,234) 8,861 18,096 455,890
Comprehensive income Profit for the period to 31 January 2017 - - - 16,030 - - 16,030
Total comprehensive income - - - 16,030 - - 16,030 Transactions with owners Value of employee services - - - - 436 - 436
Transactions with owners - - - - 436 - 436
At 31 January 2017 4,885 304,938 128,344 6,796 9,297 18,096 472,356
The accompanying notes are an integral part of these consolidated interim financial statements.

Page 19 TOUCHSTONE INNOVATIONS INTERIM REPORT AND ACCOUNTS 2017
Notes to the consolidated interim financial statements 1. Basis of preparation These unaudited consolidated interim financial statements have been prepared in accordance with the AIM Rules and European Union endorsed International Financial Reporting Standards and International Financial Reporting Interpretation Committee Interpretations. These comprise the consolidated interim statement of comprehensive income, the consolidated interim balance sheet, the consolidated interim cash flow statement, the consolidated interim statement of changes in equity and the related notes (“the consolidated interim financial statements”). The Group adopted IAS 34, “Interim Financial Reporting”, in the preparation of these consolidated interim financial statements. These consolidated interim financial statements have been prepared on a going concern basis under the historical cost convention, as modified by the revaluation of certain financial assets at fair value, as required by IAS 39, “Financial instruments: Recognition and Measurement”. The accounting policies adopted are consistent with those of the annual financial statements for the year ended 31 July 2016, as described in those financial statements, with the exception of the following new standards which have been applied for the first time during the year commencing 1 August 2016: (a) New Standards, amendments and interpretations adopted by the Group There are no new standards and interpretations adopted by the EU in the period which would have a material financial impact on or disclosure requirement for the Group’s interim report. (b) New standards, amendments and interpretations not yet adopted
IFRS 9 – Financial Instruments (effective for reporting periods commencing on or after 1 January 2018).
IFRS 15 – Revenue (effective for reporting periods commencing on or after 1 January 2018).
IFRS 16 – Leases (effective for reporting periods commencing on or after 1 January 2019).
Amendments to IFRS 10 and IAS 28 on investment entities applying the consolidation exemption – effective for annual periods beginning on or after 1 January 2016.
Amendment to IAS 1 ‘Presentation of Financial Statements’ on the disclosure initiative – effective for annual periods beginning on or after 1 January 2016.
Amendments to IAS 16 ‘Property, Plant and Equipment’ and IAS 38 ‘Intangible Assets’ on depreciation and amortisation –effective for annual periods beginning on or after 1 January 2016.
Amendments to IAS 27 ‘Separate Financial Statements’ on the equity method – effective for annual periods beginning on or after 1 January 2016.
Annual Improvements to IFRS 2014 cycle – effective for annual periods beginning on or after 1 January 2016.
IAS Amendments to IAS 7, Statement of cash flows on disclosure initiative – effective for annual periods beginning on or after 1 January 2017.
Amendments to IAS 12,’Income taxes’ on Recognition of deferred tax assets for unrealised losses (effective 1 January 2017) – effective for annual periods beginning on or after 1 January 2016.
Amendments to IFRS 11 ‘Joint Arrangements’ on acquisition of an interest in a joint operation – effective for annual periods beginning on or after 1 January 2016.
The Directors do not anticipate that the adoption of these standards, amendments and interpretations, where relevant, in future periods will have a material impact on the Group’s financial statements, however the Group continue to assess the impact of IFRS 16. There are no other IFRSs or IFRIC interpretations that are not yet effective that would be expected to have a material impact on the Group. These consolidated interim financial statements do not comprise statutory accounts within the meaning of Section 434 of the Companies Act 2006. Statutory accounts for the year ended 31 July 2016 were approved by the Board of Directors on 12 October 2016 and delivered to the Registrar of Companies. The report of the auditors on those accounts was unqualified, did not contain an emphasis of matter paragraph and did not contain any statement under Section 498 of the Companies Act 2006.

Notes to the consolidated interim financial statements (continued)
Page 20 TOUCHSTONE INNOVATIONS INTERIM REPORT AND ACCOUNTS 2017
2. Net change in fair value of trade investments held at fair value through profit or loss Net change in fair value for the period represents the change in fair value less the revenue share charge on these fair value movements. Included within the net fair value movement recognised in the Consolidated Statement of Comprehensive Income are provisions for liabilities and charges. These are made up of the revenue sharing provision which represents a fair value estimate of monies due to Imperial College London and other third parties such as co-funders of research work and the Appointee Directors’ Pool. The provision will be payable upon the eventual realisation of investments held by the Group under the revenue sharing arrangements of the Technology Pipeline Agreement (TPA) and in recognition of Imperial College London’s right to call for a transfer of its share of the Group’s holding in investments. The timing and amount of the realisation of the provision is dependent on the timing of the disposal of investments, which is uncertain as this is determined by the investment strategy.
HEIF funded investment and University Challenge Seed Fund The University Challenge Seed Fund (UCSF) reflects an award made by the UK government and third parties and must be deployed according to the conditions of that award. The purpose of the fund covers seed investment and funds for proof of concept awards. These terms include a restriction on distribution of monies from UCSF investments until the fund size has reached a multiple of three times the original investment of £4.15 million, excluding donations from industry parties. The corresponding creditor balance is reflected on the balance sheet under ‘non-current liabilities’. The Higher Education Innovations Fund (HEIF) reflects an award made by the UK government and must be deployed according to the conditions of that award. The purpose of the fund covers seed investment and funds for proof of concept awards. These terms include a restriction on distribution of monies. Realisation must be paid back to the fund for re-deployment. The corresponding creditor balance is reflected on the balance sheet under ‘non-current liabilities’.
Non-current investments All equity investments held by the Group are defined as financial assets under International Accounting Standard (IAS) 32 ‘Financial Instruments: Disclosure and Presentation’ and are classified as financial assets held at fair value under IAS 39, ‘Financial Instruments: Recognition and Measurement’. This includes all UCSF equity investments. Under IAS 39 the carrying value of all investments is measured at fair value with changes in fair value between accounting periods being charged or credited to the Consolidated Statement of Comprehensive Income. The following tables in this note set out how the net fair value gains recognised in the Consolidated Statement of Comprehensive Income for each of the periods is generated. The tables exclude any UCSF or HEIF related investments as returns are repayable to the respective funds based on the above terms.
Notes to the consolidated interim financial statements (continued)
Page 21 TOUCHSTONE INNOVATIONS INTERIM REPORT AND ACCOUNTS 2017
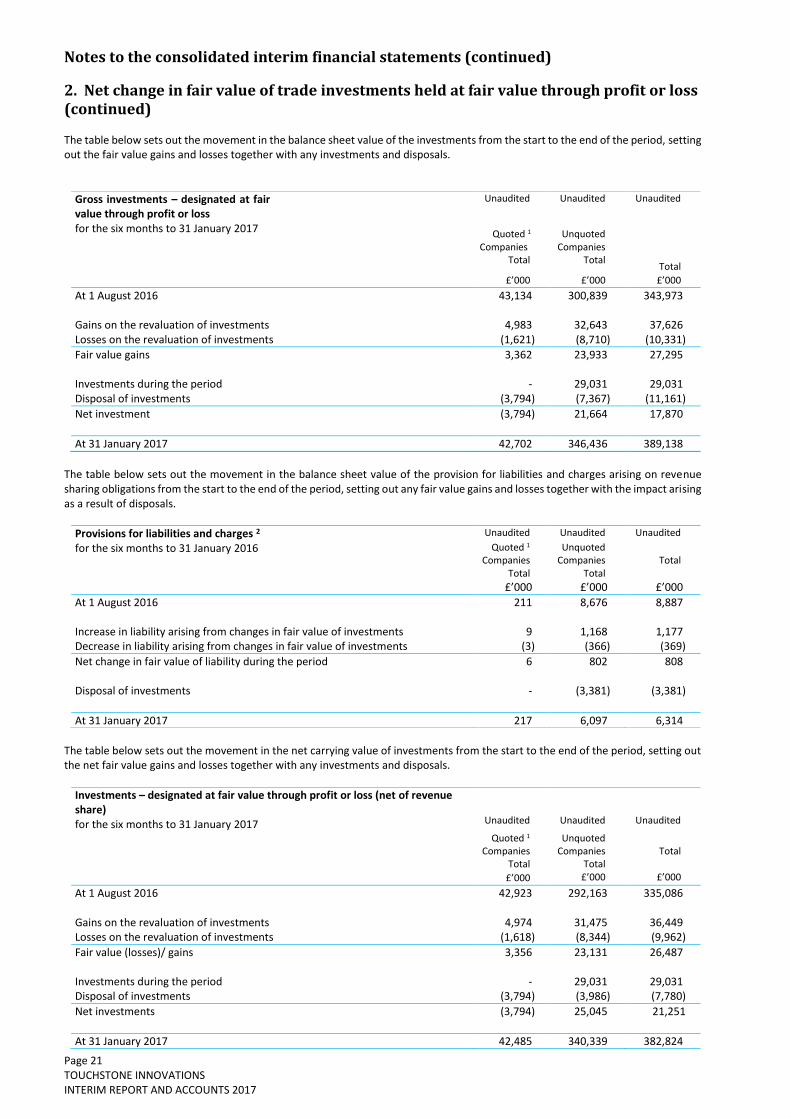
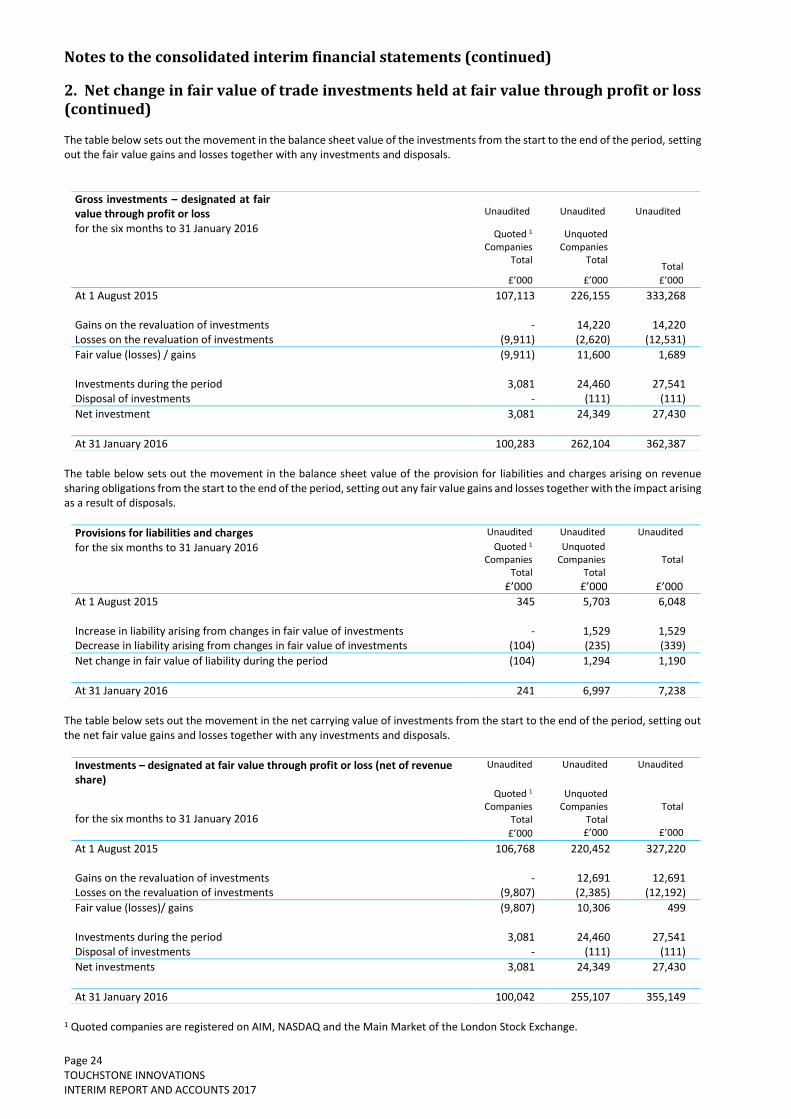
2. Net change in fair value of trade investments held at fair value through profit or loss (continued) The table below sets out the movement in the balance sheet value of the investments from the start to the end of the period, setting out the fair value gains and losses together with any investments and disposals.
The table below sets out the movement in the balance sheet value of the provision for liabilities and charges arising on revenue sharing obligations from the start to the end of the period, setting out any fair value gains and losses together with the impact arising as a result of disposals.
The table below sets out the movement in the net carrying value of investments from the start to the end of the period, setting out the net fair value gains and losses together with any investments and disposals.
Gross investments – designated at fair value through profit or loss
Unaudited Unaudited Unaudited
for the six months to 31 January 2017 Quoted 1 Companies
Total
Unquoted Companies
Total
Total
£’000 £’000 £’000
At 1 August 2016 43,134 300,839 343,973 Gains on the revaluation of investments 4,983 32,643 37,626 Losses on the revaluation of investments (1,621) (8,710) (10,331)
Fair value gains 3,362 23,933 27,295 Investments during the period - 29,031 29,031 Disposal of investments (3,794) (7,367) (11,161)
Net investment (3,794) 21,664 17,870
At 31 January 2017 42,702 346,436 389,138
Provisions for liabilities and charges 2 Unaudited Unaudited Unaudited
for the six months to 31 January 2016 Quoted 1 Companies
Total
Unquoted Companies
Total Total
£’000 £’000 £’000
At 1 August 2016 211 8,676 8,887 Increase in liability arising from changes in fair value of investments 9 1,168 1,177 Decrease in liability arising from changes in fair value of investments (3) (366) (369)
Net change in fair value of liability during the period 6 802 808 Disposal of investments - (3,381) (3,381)
At 31 January 2017 217 6,097 6,314
Investments – designated at fair value through profit or loss (net of revenue share) for the six months to 31 January 2017
Unaudited
Unaudited
Unaudited
Quoted 1 Companies
Total
Unquoted Companies
Total Total
£’000 £’000 £’000
At 1 August 2016 42,923 292,163 335,086 Gains on the revaluation of investments 4,974 31,475 36,449 Losses on the revaluation of investments (1,618) (8,344) (9,962)
Fair value (losses)/ gains 3,356 23,131 26,487 Investments during the period - 29,031 29,031 Disposal of investments (3,794) (3,986) (7,780)
Net investments (3,794) 25,045 21,251
At 31 January 2017 42,485 340,339 382,824
Notes to the consolidated interim financial statements (continued)
Page 22 TOUCHSTONE INNOVATIONS INTERIM REPORT AND ACCOUNTS 2017
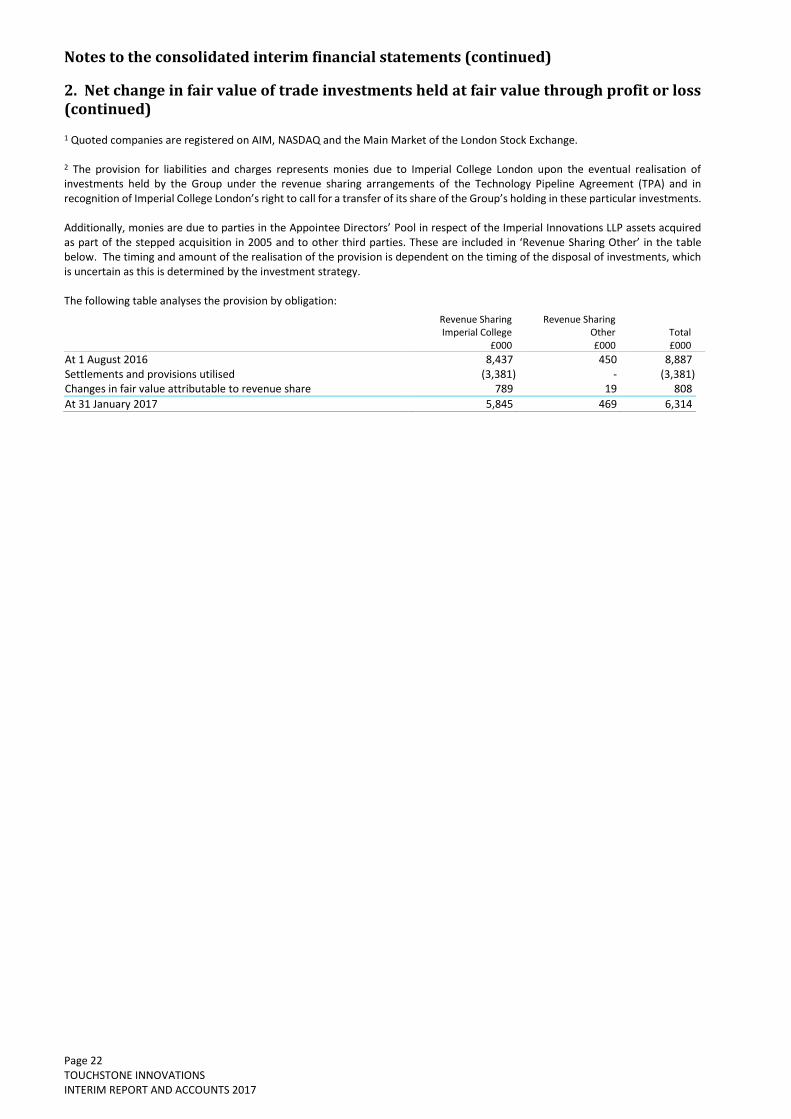
2. Net change in fair value of trade investments held at fair value through profit or loss (continued) 1 Quoted companies are registered on AIM, NASDAQ and the Main Market of the London Stock Exchange. 2 The provision for liabilities and charges represents monies due to Imperial College London upon the eventual realisation of investments held by the Group under the revenue sharing arrangements of the Technology Pipeline Agreement (TPA) and in recognition of Imperial College London’s right to call for a transfer of its share of the Group’s holding in these particular investments. Additionally, monies are due to parties in the Appointee Directors’ Pool in respect of the Imperial Innovations LLP assets acquired as part of the stepped acquisition in 2005 and to other third parties. These are included in ‘Revenue Sharing Other’ in the table below. The timing and amount of the realisation of the provision is dependent on the timing of the disposal of investments, which is uncertain as this is determined by the investment strategy. The following table analyses the provision by obligation:
Revenue Sharing Imperial College
£000
Revenue Sharing Other £000
Total £000
At 1 August 2016 8,437 450 8,887 Settlements and provisions utilised (3,381) - (3,381) Changes in fair value attributable to revenue share 789 19 808
At 31 January 2017 5,845 469 6,314
Notes to the consolidated interim financial statements (continued)
Page 23 TOUCHSTONE INNOVATIONS INTERIM REPORT AND ACCOUNTS 2017
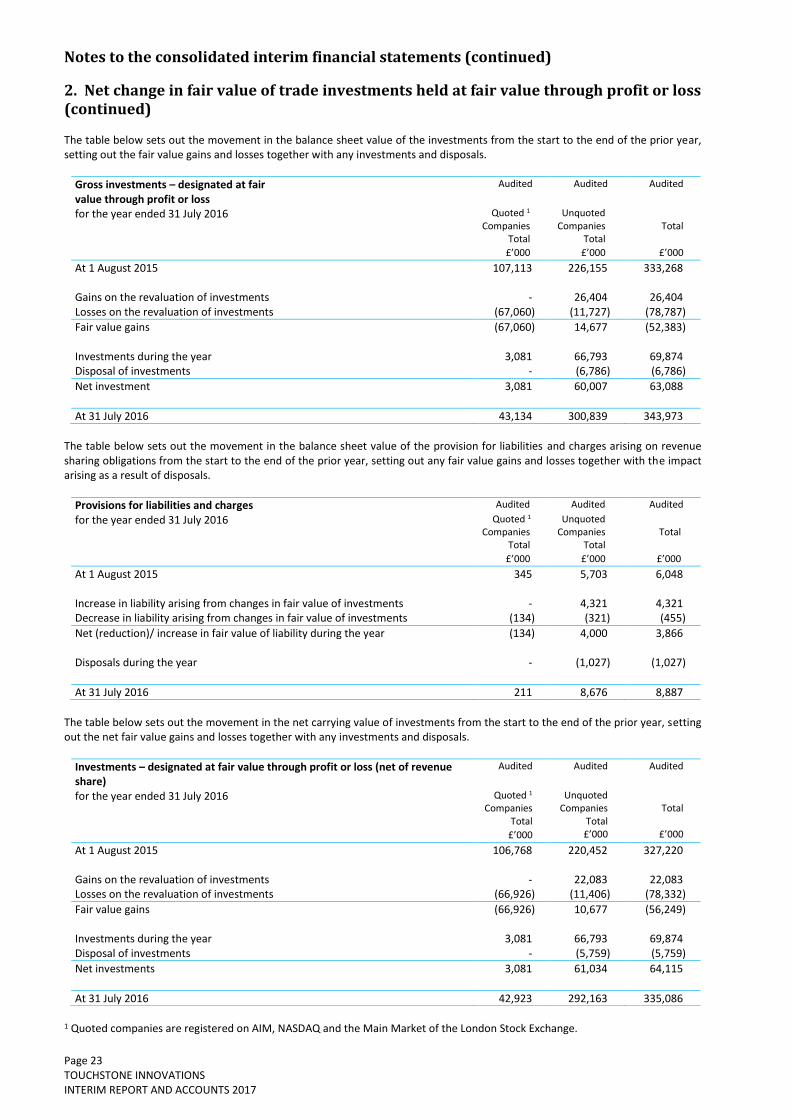
2. Net change in fair value of trade investments held at fair value through profit or loss (continued) The table below sets out the movement in the balance sheet value of the investments from the start to the end of the prior year, setting out the fair value gains and losses together with any investments and disposals.
The table below sets out the movement in the balance sheet value of the provision for liabilities and charges arising on revenue sharing obligations from the start to the end of the prior year, setting out any fair value gains and losses together with the impact arising as a result of disposals.
The table below sets out the movement in the net carrying value of investments from the start to the end of the prior year, setting out the net fair value gains and losses together with any investments and disposals.
1 Quoted companies are registered on AIM, NASDAQ and the Main Market of the London Stock Exchange.
Gross investments – designated at fair value through profit or loss
Audited Audited Audited
for the year ended 31 July 2016 Quoted 1 Companies
Total
Unquoted Companies
Total Total
£’000 £’000 £’000
At 1 August 2015 107,113 226,155 333,268 Gains on the revaluation of investments - 26,404 26,404 Losses on the revaluation of investments (67,060) (11,727) (78,787)
Fair value gains (67,060) 14,677 (52,383) Investments during the year 3,081 66,793 69,874 Disposal of investments - (6,786) (6,786)
Net investment 3,081 60,007 63,088
At 31 July 2016 43,134 300,839 343,973
Provisions for liabilities and charges Audited Audited Audited
for the year ended 31 July 2016 Quoted 1 Companies
Total
Unquoted Companies
Total Total
£’000 £’000 £’000
At 1 August 2015 345 5,703 6,048 Increase in liability arising from changes in fair value of investments - 4,321 4,321 Decrease in liability arising from changes in fair value of investments (134) (321) (455)
Net (reduction)/ increase in fair value of liability during the year (134) 4,000 3,866 Disposals during the year - (1,027) (1,027)
At 31 July 2016 211 8,676 8,887
Investments – designated at fair value through profit or loss (net of revenue share)
Audited Audited Audited
for the year ended 31 July 2016 Quoted 1 Companies
Total
Unquoted Companies
Total Total
£’000 £’000 £’000
At 1 August 2015 106,768 220,452 327,220 Gains on the revaluation of investments - 22,083 22,083 Losses on the revaluation of investments (66,926) (11,406) (78,332)
Fair value gains (66,926) 10,677 (56,249) Investments during the year 3,081 66,793 69,874 Disposal of investments - (5,759) (5,759)
Net investments 3,081 61,034 64,115
At 31 July 2016 42,923 292,163 335,086
Notes to the consolidated interim financial statements (continued)
Page 24 TOUCHSTONE INNOVATIONS INTERIM REPORT AND ACCOUNTS 2017
2. Net change in fair value of trade investments held at fair value through profit or loss (continued) The table below sets out the movement in the balance sheet value of the investments from the start to the end of the period, setting out the fair value gains and losses together with any investments and disposals.
The table below sets out the movement in the balance sheet value of the provision for liabilities and charges arising on revenue sharing obligations from the start to the end of the period, setting out any fair value gains and losses together with the impact arising as a result of disposals.
The table below sets out the movement in the net carrying value of investments from the start to the end of the period, setting out the net fair value gains and losses together with any investments and disposals.
1 Quoted companies are registered on AIM, NASDAQ and the Main Market of the London Stock Exchange.
Gross investments – designated at fair value through profit or loss
Unaudited
Unaudited
Unaudited
for the six months to 31 January 2016 Quoted 1 Companies
Total
Unquoted Companies
Total
Total
£’000 £’000 £’000
At 1 August 2015 107,113 226,155 333,268 Gains on the revaluation of investments - 14,220 14,220 Losses on the revaluation of investments (9,911) (2,620) (12,531)
Fair value (losses) / gains (9,911) 11,600 1,689 Investments during the period 3,081 24,460 27,541 Disposal of investments - (111) (111)
Net investment 3,081 24,349 27,430
At 31 January 2016 100,283 262,104 362,387
Provisions for liabilities and charges Unaudited Unaudited Unaudited
for the six months to 31 January 2016 Quoted 1 Companies
Total
Unquoted Companies
Total Total
£’000 £’000 £’000
At 1 August 2015 345 5,703 6,048 Increase in liability arising from changes in fair value of investments - 1,529 1,529 Decrease in liability arising from changes in fair value of investments (104) (235) (339)
Net change in fair value of liability during the period (104) 1,294 1,190
At 31 January 2016 241 6,997 7,238
Investments – designated at fair value through profit or loss (net of revenue share)
Unaudited Unaudited Unaudited
for the six months to 31 January 2016
Quoted 1 Companies
Total
Unquoted Companies
Total Total
£’000 £’000 £’000
At 1 August 2015 106,768 220,452 327,220 Gains on the revaluation of investments - 12,691 12,691 Losses on the revaluation of investments (9,807) (2,385) (12,192)
Fair value (losses)/ gains (9,807) 10,306 499 Investments during the period 3,081 24,460 27,541 Disposal of investments - (111) (111)
Net investments 3,081 24,349 27,430
At 31 January 2016 100,042 255,107 355,149
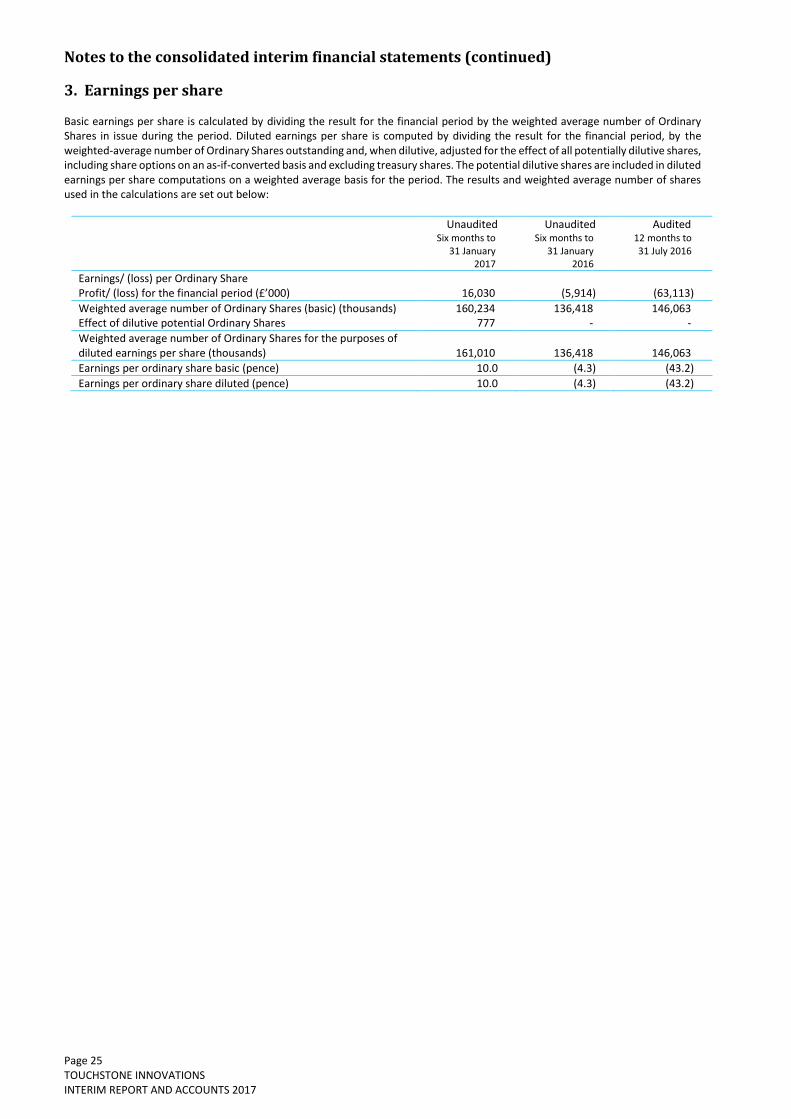
Notes to the consolidated interim financial statements (continued)
Page 25 TOUCHSTONE INNOVATIONS INTERIM REPORT AND ACCOUNTS 2017
3. Earnings per share Basic earnings per share is calculated by dividing the result for the financial period by the weighted average number of Ordinary Shares in issue during the period. Diluted earnings per share is computed by dividing the result for the financial period, by the weighted-average number of Ordinary Shares outstanding and, when dilutive, adjusted for the effect of all potentially dilutive shares, including share options on an as-if-converted basis and excluding treasury shares. The potential dilutive shares are included in diluted earnings per share computations on a weighted average basis for the period. The results and weighted average number of shares used in the calculations are set out below:
Unaudited Unaudited Audited
Six months to
31 January 2017
Six months to 31 January
2016
12 months to 31 July 2016
Earnings/ (loss) per Ordinary Share Profit/ (loss) for the financial period (£’000) 16,030 (5,914) (63,113)
Weighted average number of Ordinary Shares (basic) (thousands) 160,234 136,418 146,063 Effect of dilutive potential Ordinary Shares 777 - -
Weighted average number of Ordinary Shares for the purposes of diluted earnings per share (thousands) 161,010 136,418 146,063
Earnings per ordinary share basic (pence) 10.0 (4.3) (43.2)
Earnings per ordinary share diluted (pence) 10.0 (4.3) (43.2)
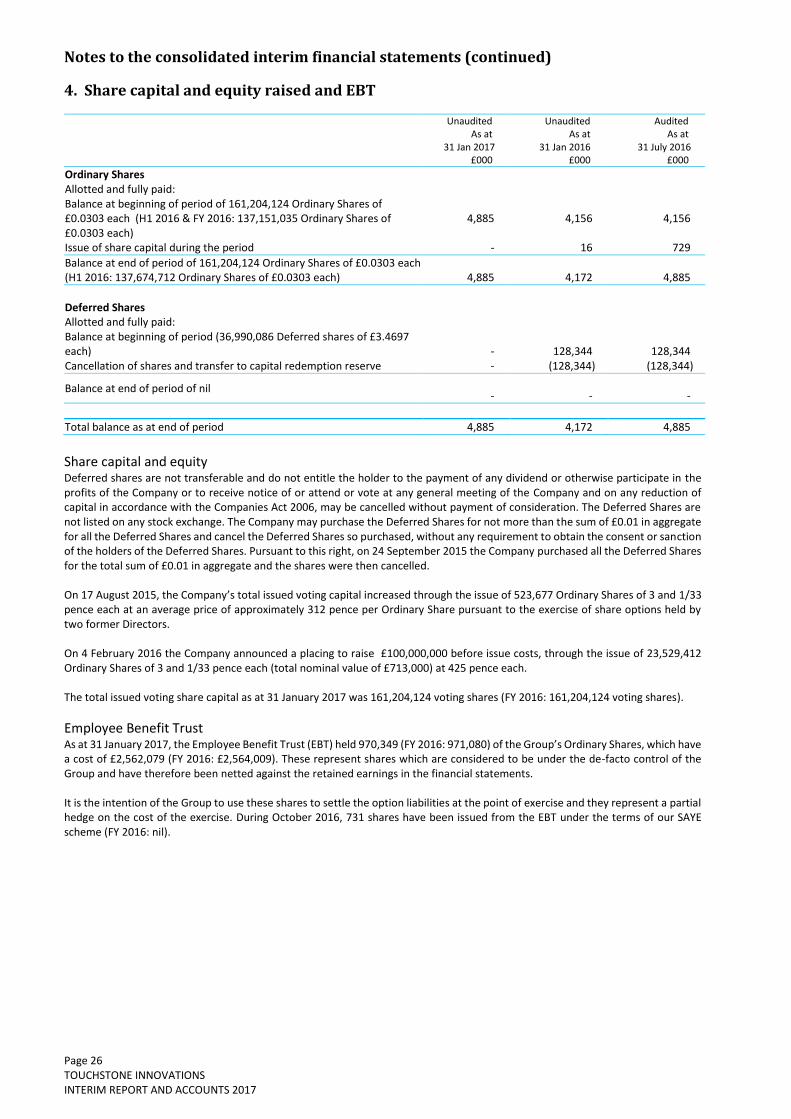
Notes to the consolidated interim financial statements (continued)
Page 26 TOUCHSTONE INNOVATIONS INTERIM REPORT AND ACCOUNTS 2017
4. Share capital and equity raised and EBT
Unaudited As at
31 Jan 2017 £000
Unaudited As at
31 Jan 2016 £000
Audited As at
31 July 2016 £000
Ordinary Shares Allotted and fully paid: Balance at beginning of period of 161,204,124 Ordinary Shares of £0.0303 each (H1 2016 & FY 2016: 137,151,035 Ordinary Shares of £0.0303 each)
4,885
4,156
4,156
Issue of share capital during the period - 16 729
Balance at end of period of 161,204,124 Ordinary Shares of £0.0303 each (H1 2016: 137,674,712 Ordinary Shares of £0.0303 each)
4,885
4,172
4,885
Deferred Shares Allotted and fully paid: Balance at beginning of period (36,990,086 Deferred shares of £3.4697 each)
-
128,344
128,344
Cancellation of shares and transfer to capital redemption reserve - (128,344) (128,344)
Balance at end of period of nil
-
-
-
Total balance as at end of period 4,885 4,172 4,885
Share capital and equity Deferred shares are not transferable and do not entitle the holder to the payment of any dividend or otherwise participate in the profits of the Company or to receive notice of or attend or vote at any general meeting of the Company and on any reduction of capital in accordance with the Companies Act 2006, may be cancelled without payment of consideration. The Deferred Shares are not listed on any stock exchange. The Company may purchase the Deferred Shares for not more than the sum of £0.01 in aggregate for all the Deferred Shares and cancel the Deferred Shares so purchased, without any requirement to obtain the consent or sanction of the holders of the Deferred Shares. Pursuant to this right, on 24 September 2015 the Company purchased all the Deferred Shares for the total sum of £0.01 in aggregate and the shares were then cancelled. On 17 August 2015, the Company’s total issued voting capital increased through the issue of 523,677 Ordinary Shares of 3 and 1/33 pence each at an average price of approximately 312 pence per Ordinary Share pursuant to the exercise of share options held by two former Directors. On 4 February 2016 the Company announced a placing to raise £100,000,000 before issue costs, through the issue of 23,529,412 Ordinary Shares of 3 and 1/33 pence each (total nominal value of £713,000) at 425 pence each. The total issued voting share capital as at 31 January 2017 was 161,204,124 voting shares (FY 2016: 161,204,124 voting shares).
Employee Benefit Trust As at 31 January 2017, the Employee Benefit Trust (EBT) held 970,349 (FY 2016: 971,080) of the Group’s Ordinary Shares, which have a cost of £2,562,079 (FY 2016: £2,564,009). These represent shares which are considered to be under the de-facto control of the Group and have therefore been netted against the retained earnings in the financial statements. It is the intention of the Group to use these shares to settle the option liabilities at the point of exercise and they represent a partial hedge on the cost of the exercise. During October 2016, 731 shares have been issued from the EBT under the terms of our SAYE scheme (FY 2016: nil).
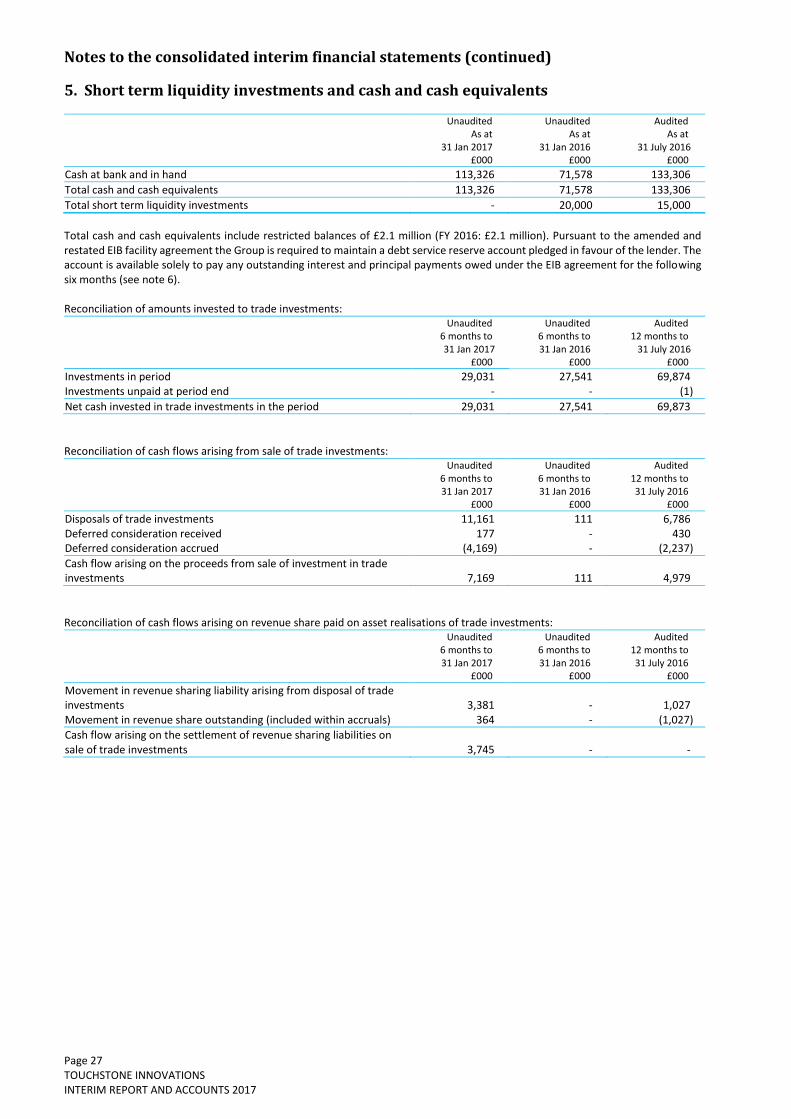
Notes to the consolidated interim financial statements (continued)
Page 27 TOUCHSTONE INNOVATIONS INTERIM REPORT AND ACCOUNTS 2017
5. Short term liquidity investments and cash and cash equivalents
Unaudited As at
31 Jan 2017 £000
Unaudited As at
31 Jan 2016 £000
Audited As at
31 July 2016 £000
Cash at bank and in hand 113,326 71,578 133,306
Total cash and cash equivalents 113,326 71,578 133,306
Total short term liquidity investments - 20,000 15,000
Total cash and cash equivalents include restricted balances of £2.1 million (FY 2016: £2.1 million). Pursuant to the amended and restated EIB facility agreement the Group is required to maintain a debt service reserve account pledged in favour of the lender. The account is available solely to pay any outstanding interest and principal payments owed under the EIB agreement for the following six months (see note 6). Reconciliation of amounts invested to trade investments:
Unaudited 6 months to 31 Jan 2017
£000
Unaudited 6 months to 31 Jan 2016
£000
Audited 12 months to
31 July 2016 £000
Investments in period 29,031 27,541 69,874 Investments unpaid at period end - - (1)
Net cash invested in trade investments in the period 29,031 27,541 69,873
Reconciliation of cash flows arising from sale of trade investments:
Unaudited 6 months to 31 Jan 2017
£000
Unaudited 6 months to 31 Jan 2016
£000
Audited 12 months to 31 July 2016
£000
Disposals of trade investments 11,161 111 6,786 Deferred consideration received 177 - 430 Deferred consideration accrued (4,169) - (2,237)
Cash flow arising on the proceeds from sale of investment in trade investments 7,169 111 4,979
Reconciliation of cash flows arising on revenue share paid on asset realisations of trade investments:
Unaudited 6 months to 31 Jan 2017
£000
Unaudited 6 months to 31 Jan 2016
£000
Audited 12 months to 31 July 2016
£000
Movement in revenue sharing liability arising from disposal of trade investments 3,381 - 1,027 Movement in revenue share outstanding (included within accruals) 364 - (1,027)
Cash flow arising on the settlement of revenue sharing liabilities on sale of trade investments 3,745 - -
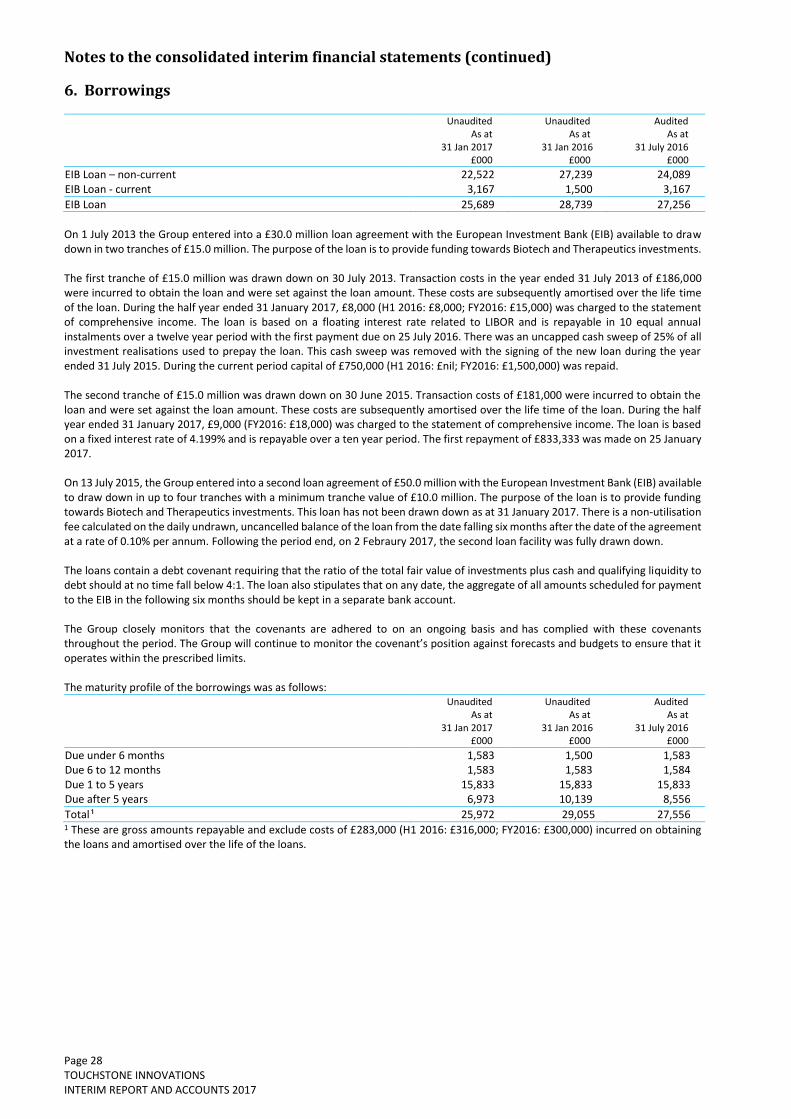
Notes to the consolidated interim financial statements (continued)
Page 28 TOUCHSTONE INNOVATIONS INTERIM REPORT AND ACCOUNTS 2017
6. Borrowings
Unaudited As at
31 Jan 2017 £000
Unaudited As at
31 Jan 2016 £000
Audited As at
31 July 2016 £000
EIB Loan – non-current 22,522 27,239 24,089 EIB Loan - current 3,167 1,500 3,167
EIB Loan 25,689 28,739 27,256
On 1 July 2013 the Group entered into a £30.0 million loan agreement with the European Investment Bank (EIB) available to draw down in two tranches of £15.0 million. The purpose of the loan is to provide funding towards Biotech and Therapeutics investments. The first tranche of £15.0 million was drawn down on 30 July 2013. Transaction costs in the year ended 31 July 2013 of £186,000 were incurred to obtain the loan and were set against the loan amount. These costs are subsequently amortised over the life time of the loan. During the half year ended 31 January 2017, £8,000 (H1 2016: £8,000; FY2016: £15,000) was charged to the statement of comprehensive income. The loan is based on a floating interest rate related to LIBOR and is repayable in 10 equal annual instalments over a twelve year period with the first payment due on 25 July 2016. There was an uncapped cash sweep of 25% of all investment realisations used to prepay the loan. This cash sweep was removed with the signing of the new loan during the year ended 31 July 2015. During the current period capital of £750,000 (H1 2016: £nil; FY2016: £1,500,000) was repaid. The second tranche of £15.0 million was drawn down on 30 June 2015. Transaction costs of £181,000 were incurred to obtain the loan and were set against the loan amount. These costs are subsequently amortised over the life time of the loan. During the half year ended 31 January 2017, £9,000 (FY2016: £18,000) was charged to the statement of comprehensive income. The loan is based on a fixed interest rate of 4.199% and is repayable over a ten year period. The first repayment of £833,333 was made on 25 January 2017. On 13 July 2015, the Group entered into a second loan agreement of £50.0 million with the European Investment Bank (EIB) available to draw down in up to four tranches with a minimum tranche value of £10.0 million. The purpose of the loan is to provide funding towards Biotech and Therapeutics investments. This loan has not been drawn down as at 31 January 2017. There is a non-utilisation fee calculated on the daily undrawn, uncancelled balance of the loan from the date falling six months after the date of the agreement at a rate of 0.10% per annum. Following the period end, on 2 Febraury 2017, the second loan facility was fully drawn down. The loans contain a debt covenant requiring that the ratio of the total fair value of investments plus cash and qualifying liquidity to debt should at no time fall below 4:1. The loan also stipulates that on any date, the aggregate of all amounts scheduled for payment to the EIB in the following six months should be kept in a separate bank account. The Group closely monitors that the covenants are adhered to on an ongoing basis and has complied with these covenants throughout the period. The Group will continue to monitor the covenant’s position against forecasts and budgets to ensure that it operates within the prescribed limits. The maturity profile of the borrowings was as follows:
Unaudited As at
31 Jan 2017 £000
Unaudited As at
31 Jan 2016 £000
Audited As at
31 July 2016 £000
Due under 6 months 1,583 1,500 1,583 Due 6 to 12 months 1,583 1,583 1,584 Due 1 to 5 years 15,833 15,833 15,833 Due after 5 years 6,973 10,139 8,556
Total ¹ 25,972 29,055 27,556 1 These are gross amounts repayable and exclude costs of £283,000 (H1 2016: £316,000; FY2016: £300,000) incurred on obtaining the loans and amortised over the life of the loans.
Notes to the consolidated interim financial statements (continued)
Page 29 TOUCHSTONE INNOVATIONS INTERIM REPORT AND ACCOUNTS 2017
7. Financial risk management
Financial risk factors In the normal course of business, the Group uses certain financial instruments including cash, trade and other receivables, equity rights, equity investments and loans to investee companies. The Group’s financial liabilities include loans from the European Investment Bank and trade and other payables.
Monies provided by way of UCSF grants are loaned to individual technology businesses. These loans are repayable in cash or convertible to equity, at a rate mutually agreed by the Group and technology business, at the earliest opportunity after the technology business’ formation. Loans are treated on the same basis as equity for valuation purposes.
Risk management objectives The Group is exposed to a number of risks through the performance of its normal operations. The most significant are liquidity and market price risk. Income from surplus funds is dependent on market interest rates and expose the Group to interest rate risk.
The Group’s main objective in using financial instruments is to promote the commercialisation of intellectual property held by technology businesses through the raising and investing of funds for this purpose. The Group’s policies in calculating the nature, amount and timing of investments’ equity fundraisings are determined by planned future investment activity.
Due to the nature of the Group’s activities, the Directors may consider it necessary to use derivative financial instruments to hedge the Group’s exposure to fluctuations in exchange rates, where these exposures have been significant.
(a) Financial Risk Factors The Group is exposed to price risk in respect of equity rights, equity investments and loans to the technology businesses held by the Group and classified on the balance sheet as at fair value through profit or loss. The Group seeks to manage this risk by routinely monitoring the performance of these investments. The Group employs stringent investment appraisal processes prior to deciding on investment. Regular reports are made to the Board on the status and valuation of investments and significant disposals require Board approval. The value of the investment portfolio can be affected by the performance of the international equity markets and the carrying value is likely to be adversely affected by material declines in these markets. Furthermore, the ability to liquidate market positions will be affected by weak equity markets.
The consolidated interim financial statements do not include all financial risk management information and disclosures required in the annual financial statements; they should be read in conjunction with the group’s annual financial statements as at 31 July 2016. There have been no changes in the risk management department or in any risk management policies since the year end.
(b) Liquidity risk The Group seeks to manage financial risk, and in particular liquidity risk, ensuring that sufficient liquidity is available to meet foreseeable requirements and to invest surplus cash in low risk instruments with reputable institutions.
Compared to year end, there was no material change in the contractual undiscounted cash out flows for financial liabilities. On 2 February 2017 the Group drew down the £50.0 million second loan facility secured from the EIB in July 2015. Following this, the Group has £163.3 million available for investment and operations.
(c) Credit risk Credit risk is managed on a Group basis. Credit risk arises from cash and cash equivalents and short-term liquidity investments as well as credit exposures to trade and other receivables.
There have been no changes in the Credit risk profile or any credit risk management since year end.
(d) Capital risk management The Group is funded by equity finance and a long term loan. Total capital is calculated as ‘total equity’ as shown in the consolidated interim balance sheet.
The Group’s objectives when managing capital are to safeguard the Group’s ability to continue as a going concern in order to provide returns for shareholders and benefits for other stakeholders and to maintain an optimal capital structure to reduce the cost of capital. In order to maintain or adjust the capital structure, the Group may adjust the amount of dividends paid to shareholders, return capital to shareholders, issue new shares or sell assets to reduce debt. The Group maintains a maturity analysis profile for short-term liquidity investments.
There have been no changes in the capital risk management since year end.
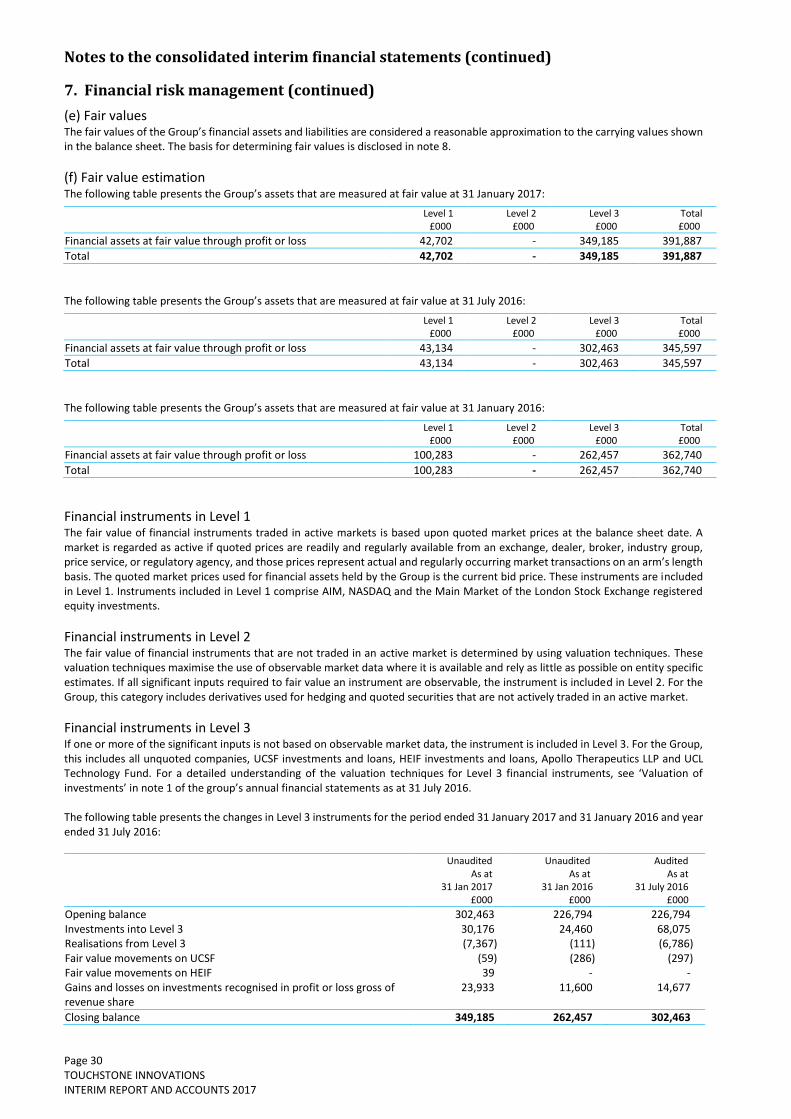
Notes to the consolidated interim financial statements (continued)
Page 30 TOUCHSTONE INNOVATIONS INTERIM REPORT AND ACCOUNTS 2017
7. Financial risk management (continued)
(e) Fair values The fair values of the Group’s financial assets and liabilities are considered a reasonable approximation to the carrying values shown in the balance sheet. The basis for determining fair values is disclosed in note 8.
(f) Fair value estimation The following table presents the Group’s assets that are measured at fair value at 31 January 2017:
Level 1
£000 Level 2
£000 Level 3
£000 Total £000
Financial assets at fair value through profit or loss 42,702 - 349,185 391,887
Total 42,702 - 349,185 391,887
The following table presents the Group’s assets that are measured at fair value at 31 July 2016:
Level 1
£000 Level 2
£000 Level 3
£000 Total £000
Financial assets at fair value through profit or loss 43,134 - 302,463 345,597
Total 43,134 - 302,463 345,597
The following table presents the Group’s assets that are measured at fair value at 31 January 2016:
Level 1
£000 Level 2
£000 Level 3
£000 Total £000
Financial assets at fair value through profit or loss 100,283 - 262,457 362,740
Total 100,283 - 262,457 362,740
Financial instruments in Level 1 The fair value of financial instruments traded in active markets is based upon quoted market prices at the balance sheet date. A market is regarded as active if quoted prices are readily and regularly available from an exchange, dealer, broker, industry group, price service, or regulatory agency, and those prices represent actual and regularly occurring market transactions on an arm’s length basis. The quoted market prices used for financial assets held by the Group is the current bid price. These instruments are included in Level 1. Instruments included in Level 1 comprise AIM, NASDAQ and the Main Market of the London Stock Exchange registered equity investments.
Financial instruments in Level 2 The fair value of financial instruments that are not traded in an active market is determined by using valuation techniques. These valuation techniques maximise the use of observable market data where it is available and rely as little as possible on entity specific estimates. If all significant inputs required to fair value an instrument are observable, the instrument is included in Level 2. For the Group, this category includes derivatives used for hedging and quoted securities that are not actively traded in an active market.
Financial instruments in Level 3 If one or more of the significant inputs is not based on observable market data, the instrument is included in Level 3. For the Group, this includes all unquoted companies, UCSF investments and loans, HEIF investments and loans, Apollo Therapeutics LLP and UCL Technology Fund. For a detailed understanding of the valuation techniques for Level 3 financial instruments, see ‘Valuation of investments’ in note 1 of the group’s annual financial statements as at 31 July 2016.
The following table presents the changes in Level 3 instruments for the period ended 31 January 2017 and 31 January 2016 and year ended 31 July 2016:
Unaudited As at
31 Jan 2017 £000
Unaudited As at
31 Jan 2016 £000
Audited As at
31 July 2016 £000
Opening balance 302,463 226,794 226,794 Investments into Level 3 30,176 24,460 68,075 Realisations from Level 3 (7,367) (111) (6,786) Fair value movements on UCSF (59) (286) (297) Fair value movements on HEIF 39 - - Gains and losses on investments recognised in profit or loss gross of revenue share
23,933 11,600 14,677
Closing balance 349,185 262,457 302,463
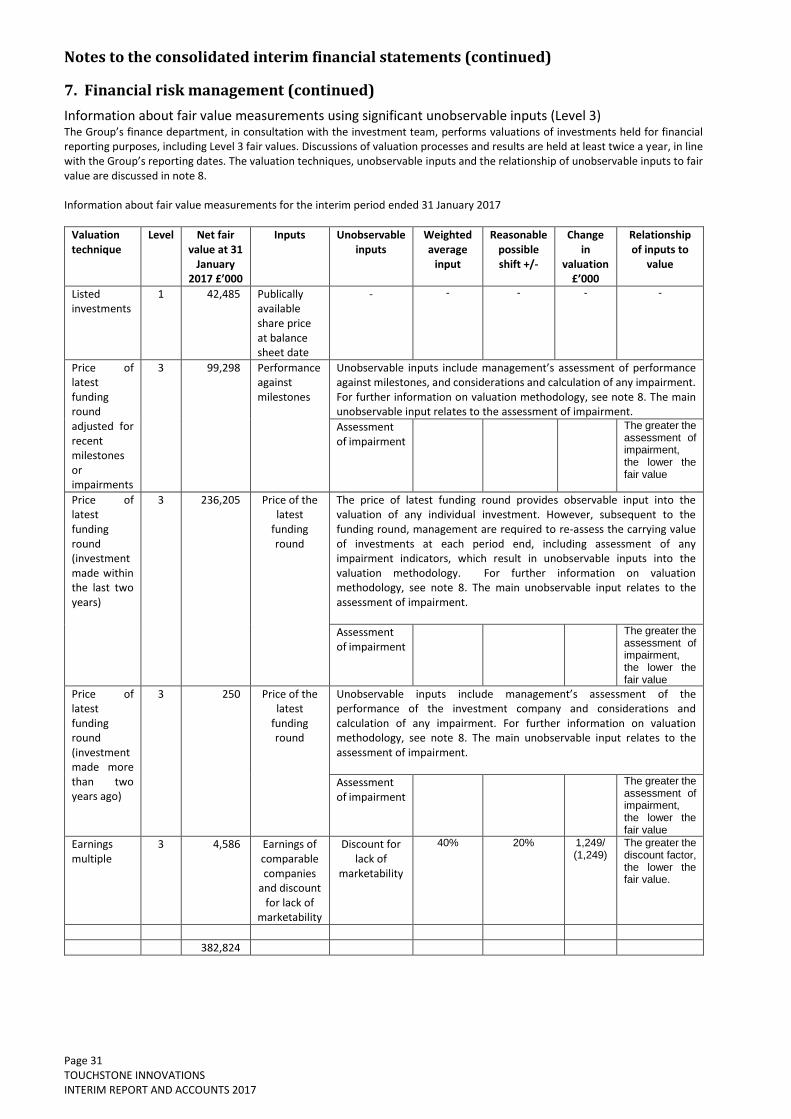
Notes to the consolidated interim financial statements (continued)
Page 31 TOUCHSTONE INNOVATIONS INTERIM REPORT AND ACCOUNTS 2017
7. Financial risk management (continued)
Information about fair value measurements using significant unobservable inputs (Level 3) The Group’s finance department, in consultation with the investment team, performs valuations of investments held for financial reporting purposes, including Level 3 fair values. Discussions of valuation processes and results are held at least twice a year, in line with the Group’s reporting dates. The valuation techniques, unobservable inputs and the relationship of unobservable inputs to fair value are discussed in note 8.
Information about fair value measurements for the interim period ended 31 January 2017
Valuation technique
Level Net fair value at 31
January 2017 £’000
Inputs Unobservable inputs
Weighted average
input
Reasonable possible shift +/-
Change in
valuation £’000
Relationship of inputs to
value
Listed investments
1 42,485 Publically available share price at balance sheet date
- - - - -
Price of latest funding round adjusted for recent milestones or impairments
3 99,298 Performance against milestones
Unobservable inputs include management’s assessment of performance against milestones, and considerations and calculation of any impairment. For further information on valuation methodology, see note 8. The main unobservable input relates to the assessment of impairment.
Assessment of impairment
The greater the assessment of impairment, the lower the fair value
Price of latest funding round (investment made within the last two years)
3 236,205 Price of the latest
funding round
The price of latest funding round provides observable input into the valuation of any individual investment. However, subsequent to the funding round, management are required to re-assess the carrying value of investments at each period end, including assessment of any impairment indicators, which result in unobservable inputs into the valuation methodology. For further information on valuation methodology, see note 8. The main unobservable input relates to the assessment of impairment.
Assessment of impairment
The greater the assessment of impairment, the lower the fair value
Price of latest funding round (investment made more than two years ago)
3 250 Price of the latest
funding round
Unobservable inputs include management’s assessment of the performance of the investment company and considerations and calculation of any impairment. For further information on valuation methodology, see note 8. The main unobservable input relates to the assessment of impairment.
Assessment of impairment
The greater the assessment of impairment, the lower the fair value
Earnings multiple
3 4,586 Earnings of comparable companies
and discount for lack of
marketability
Discount for lack of
marketability
40% 20% 1,249/ (1,249)
The greater the discount factor, the lower the fair value.
382,824

Notes to the consolidated interim financial statements (continued)
Page 32 TOUCHSTONE INNOVATIONS INTERIM REPORT AND ACCOUNTS 2017
7. Financial risk management (continued)
Information about fair value measurements for the year ended 31 July 2016
Valuation technique
Level Net fair value at 31 July 2016
£’000
Inputs Unobservable inputs
Weighted average
input
Reasonable possible shift +/-
Change in
valuation £’000
Relationship of inputs to
value
Listed investments
1 42,923 Publically available share price at balance sheet date
- - - - -
Price of latest funding round adjusted for recent milestones or impairments
3 41,405 Performance against milestones
Unobservable inputs include management’s assessment of performance against milestones, and considerations and calculation of any impairment. For further information on valuation methodology, see note 8. The main unobservable input relates to the assessment of impairment.
Assessment of impairment
The greater the assessment of impairment, the lower the fair value
Price of latest funding round (investment made within the last two years)
3 246,150 Price of the latest
funding round
The price of latest funding round provides observable input into the valuation of any individual investment. However, subsequent to the funding round, management are required to re-assess the carrying value of investments at each period end, including assessment of any impairment indicators, which result in unobservable inputs into the valuation methodology. For further information on valuation methodology, see note 8. The main unobservable input relates to the assessment of impairment.
Assessment of impairment
The greater the assessment of impairment, the lower the fair value
Price of latest funding round (investment made more than two years ago)
3 250 Price of the latest
funding round
Unobservable inputs include management’s assessment of the performance of the investment company and considerations and calculation of any impairment. For further information on valuation methodology, see note 8. The main unobservable input relates to the assessment of impairment.
Assessment of impairment
The greater the assessment of impairment, the lower the fair value
Earnings multiple
3 4,358 Earnings of comparable companies
and discount for lack of
marketability
Discount for lack of
marketability
40% 20% 1,249/ (1,249)
The greater the discount factor, the lower the fair value.
335,086
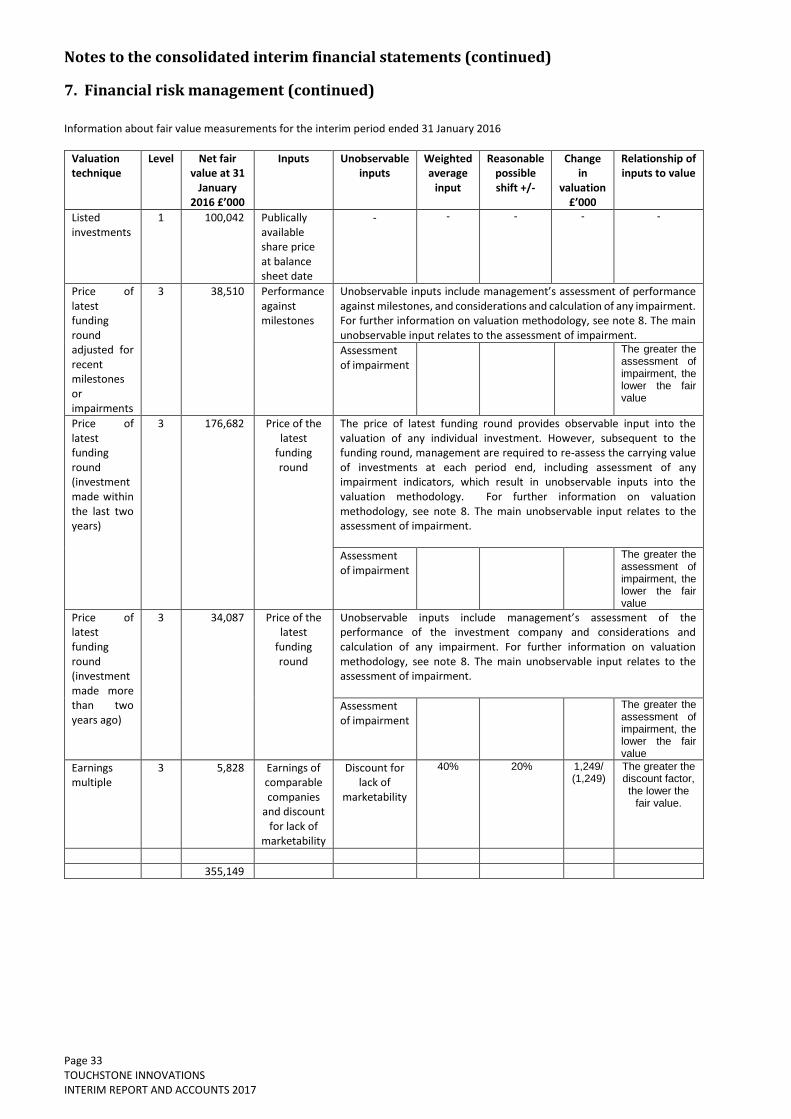
Notes to the consolidated interim financial statements (continued)
Page 33 TOUCHSTONE INNOVATIONS INTERIM REPORT AND ACCOUNTS 2017
7. Financial risk management (continued)
Information about fair value measurements for the interim period ended 31 January 2016
Valuation technique
Level Net fair value at 31
January 2016 £’000
Inputs Unobservable inputs
Weighted average
input
Reasonable possible shift +/-
Change in
valuation £’000
Relationship of inputs to value
Listed investments
1 100,042 Publically available share price at balance sheet date
- - - - -
Price of latest funding round adjusted for recent milestones or impairments
3 38,510 Performance against milestones
Unobservable inputs include management’s assessment of performance against milestones, and considerations and calculation of any impairment. For further information on valuation methodology, see note 8. The main unobservable input relates to the assessment of impairment.
Assessment of impairment
The greater the assessment of impairment, the lower the fair value
Price of latest funding round (investment made within the last two years)
3 176,682 Price of the latest
funding round
The price of latest funding round provides observable input into the valuation of any individual investment. However, subsequent to the funding round, management are required to re-assess the carrying value of investments at each period end, including assessment of any impairment indicators, which result in unobservable inputs into the valuation methodology. For further information on valuation methodology, see note 8. The main unobservable input relates to the assessment of impairment.
Assessment of impairment
The greater the assessment of impairment, the lower the fair value
Price of latest funding round (investment made more than two years ago)
3 34,087 Price of the latest
funding round
Unobservable inputs include management’s assessment of the performance of the investment company and considerations and calculation of any impairment. For further information on valuation methodology, see note 8. The main unobservable input relates to the assessment of impairment.
Assessment of impairment
The greater the assessment of impairment, the lower the fair value
Earnings multiple
3 5,828 Earnings of comparable companies
and discount for lack of
marketability
Discount for lack of
marketability
40% 20% 1,249/ (1,249)
The greater the discount factor, the lower the
fair value.
355,149
Notes to the consolidated interim financial statements (continued)
Page 34 TOUCHSTONE INNOVATIONS INTERIM REPORT AND ACCOUNTS 2017
8. Critical accounting estimates and judgements
The Directors have made the following judgements and estimates that have had the most significant effect on the carrying amounts of the assets and liabilities in the financial statements.
The Group has concluded that it is not an investment company as identified by IFRS10.
Valuation of unquoted equity investments The judgements required to determine the appropriate valuation methodology of unquoted equity investments means there is a risk of material adjustment to the carrying amounts of assets and liabilities. These judgements include a decision whether or not to increase or decrease investment valuations.
The fair value of unlisted securities is established using International Private Equity and Venture Capital Valuation Guidelines (IPEVCVG). The valuation methodology used most commonly by the Group is the ‘price of recent investment’ or a ‘milestone analysis’ approach. Given the nature of the Group’s investments in seed, start-up and early-stage companies, where there are often no current and no short-term future earnings or positive cash flows, it can be difficult to gauge the probability and financial impact of the success or failure of development or research activities and to make reliable cash flow forecasts.
Consequently, the most appropriate approach to determine fair value is a methodology that is based on market data, that being the price of a recent investment. The Group considers that fair value estimates that are based entirely on observable market data will be of greater reliability than those based on assumptions and accordingly where there has been any recent investment by third parties, the price of that investment will generally provide a basis of the valuation.
Where the Group considers that the price of recent investment, unadjusted, is no longer relevant and there are limited or comparable companies or transactions from which to infer value, the Group carries out an enhanced assessment based on milestone analysis and/or industry and sector analysis. In applying the milestone analysis approach to investments in companies in early or development stages the Group seeks to determine whether there is an indication of change in fair value based on a consideration of performance against any milestones that were set at the time of the original investment decision, as well as taking into consideration the key market drivers of the investee company and the overall economic environment. When considered appropriate, the Group may use external valuers to assess the reasonableness of any change in fair value estimated by management.
The following considerations are used when calculating the fair value:
where the investment being valued was itself made recently, its cost will generally provide a good indication of fair value unless there is objective evidence that the investment has since been impaired, such as observable data suggesting a deterioration of the financial, technical, or commercial performance of the underlying business;
where there has been any recent investment by third parties, the price of that investment will provide a basis of the valuation;
if there is no readily ascertainable value from following the ‘price of recent investment’ methodology, the Group considers alternative methodologies in the IPEVCVG guidelines, being principally discounted cash flows and price-earnings multiples requiring management to make assumptions over the timing and nature of future earnings and cash flows when calculating fair value;
where a fair value cannot be estimated reliably, the investment is reported at the carrying value at the previous reporting date unless there is evidence that the investment has since been impaired;
all recorded values of investments are regularly reviewed for any indication of impairment and adjusted accordingly;
the length of period for which it remains appropriate to use the price of recent investment depends on the specific circumstances of the investment and the stability of the external environment. During this period the Group considers whether any changes or events subsequent to the transaction would imply a change in the fair value of the investment may be required; where the Group considers that there is an indication that the fair value has changed, an estimation is made of the required amount of any adjustment from the last price of recent investment. Wherever possible, this adjustment is based on objective data from the investee company and the experience and judgement of the Group. However any adjustment is, by its very nature, subjective. Where deterioration in value has occurred, the Group reduces the carrying value of the investment to reflect the estimated decrease. If there is evidence of value creation, the Group may consider increasing the carrying value of the investment. However, in the absence of additional financing rounds or profit generation it can be difficult to determine the value that a purchaser may place on positive developments given the potential outcome and the costs and risks to achieving that outcome;
factors which the Group considers include, inter alia, technical measures such as product development phases and patent approvals, financial measures such as cash burn rate and profitability expectations, and market and sales measures such as testing phases, product launches and market introduction; and
where the equity structure of a portfolio company involves different class rights in a sale or liquidity event, the Group takes these different rights into account when forming a view of the value of its investment.
Notes to the consolidated interim financial statements (continued)
Page 35 TOUCHSTONE INNOVATIONS INTERIM REPORT AND ACCOUNTS 2017
8. Critical accounting estimates and judgements (continued)
Valuation of Carried Interest Plan liability For several years, the Group has maintained a long term incentive arrangement known as the Carried Interest Plan. It is the intention of the Group to continue to use the Carried Interest Plan as part of the Group’s long term incentive arrangements, alongside the introduction of share options.
The provision is measured by reference to the fair value of the relevant investments. The judgements required to determine the appropriate valuation methodology of unquoted equity investments means there is a corresponding risk of material adjustment to the carrying amounts of the Carried Interest Plan liability. The additional considerations used when calculating the Carried Interest Plan liability include estimates for an appropriate discount rate, leaver provisions and year of realisation.
9. Related party disclosures
The Group does not have an ultimate parent company.
The Group’s ultimate parent company was Imperial College London (Imperial College of Science, Technology and Medicine, South Kensington Campus, London, SW7 2AZ, United Kingdom) by virtue of its shareholding in the Group, until the equity raise in 2011. The Group has a Technology Pipeline Agreement (TPA) with Imperial College London which stipulates the terms for sharing revenue generated from the commercialisation of Imperial College London intellectual property which is assigned to Imperial Innovations Limited. The Group has agreements with Imperial College London across a range of services, including an operating lease for office premises (from June 2010 at 52 Princes Gate, Exhibition Road) as disclosed in note 23 of the group’s annual financial statements as at 31 July 2016 and an agreement covering information technology and intellectual property advice (services agreement). In addition, following the June 2014 placing, Imperial College London has the right to nominate one member to sit on the Board of Touchstone Innovations plc (down from two members prior to the placing). On this basis, the Directors have considered that Imperial College London continues to be a related party.
Transactions with Appointee Directors are excluded as these are not considered to exert influence on the Group, with the exception of Dr Martin Knight (in the prior year) where disclosures have been made on page 143 of the group’s annual financial statements as at 31 July 2016.
The Group has considered whether Invesco Limited, Woodford Investment Management, and Landsdowne with their significant shareholdings in the Group (albeit in a number of different funds), are related parties under IAS 24, ‘Related party disclosures’. As these shareholders cannot take part in financial or operating policy decisions, have no right to appoint a Board member, and do not exert significant influence over the Group, the Group has taken the view that they are not Related Parties under IAS 24,‘Related party disclosures’.
Under the AIM rules, shareholders with a shareholding of more than 10% are considered to be related parties and therefore investments with the above shareholders are disclosed below. Given the substantial shareholdings, the Board of Directors manages the relationship with the relevant shareholders carefully to ensure that any co-investments are conducted on an arm’s length basis.
Although the Group may have significant influence over an investee company, ultimately the investee company makes the final decision regarding the investors as part of a fundraising. Where the Group leads a fundraising all co-investors are responsible for their own evaluation and due diligence with no preferential treatment afforded to any particular investor.
During the period Invesco invested £2.1 million in total in Veryan (FY2016: £20.6 million in Cell Medica, Nexeon and Veryan).
During the year the Lansdowne partners invested nil (FY2016: nil).
During the year the Woodford Investment Management LLP invested £9.6 million in Mission and Inivata (FY2016: £39.1 million in in Cell Medica, Inivata, Mission, Nexeon and Econic).

Notes to the consolidated interim financial statements (continued)
Page 36 TOUCHSTONE INNOVATIONS INTERIM REPORT AND ACCOUNTS 2017
9. Related party disclosures (continued)
Transactions with related parties are laid out in the tables below.
Sale of goods and services (including recovery of costs)
As at 31 Jan 2017
£000
As at 31 Jan 2016
£000
As at 31 July 2016
£000
Trading with Imperial College London 165 121 512 Government grants received via Imperial College London 61 319 867 Trading with portfolio companies 1,097 557 925 1,323 997 2,304
Purchases of goods and services
As at 31 Jan 2017
£000
As at 31 Jan 2016
£000
As at 31 July 2016
£000 Rent paid to Imperial College London 193 120 314 Revenue share and other expenditure with Imperial College London 5,205 671 1,783
5,398 791 2,097
Year end balances arising from sales/purchases of goods / services
As at 31 Jan 2017
£000
As at 31 Jan 2016
£000
As at 31 July 2016
£000
Receivables from portfolio companies 167 52 73 Receivables from Imperial College London 681 282 896 Payables to Imperial College London (1,031) (935) (1,609)
(183) (601) (640)
The receivables from related parties arise mainly from sale transactions and are due one month after the date of sale. The receivables are unsecured in nature and bear no interest. The payables to related parties arise mainly from purchase transactions and are due one month after the date of purchase. The payables bear no interest.
Convertible loans to portfolio companies are expected to convert to equity and are of a long term investment nature. As a result, they are included within non-current investments (see note 2). Where the Group has a representative on the board of a portfolio company, this is considered a related party and the aggregate balance is shown below.
Loans to portfolio companies
As at 31 Jan 2017
£000
As at 31 Jan 2016
£000
As at 31 July 2016
£000 Beginning of the year 22,185 18,219 18,219 Loans advanced 11,288 862 7,876 Loans disposed (4,629) - (296) Loans converted or exchanged from debt to equity (1,675) (2,046) (3,746) Revaluation/(impairment) of loans - 132 132 27,169 17,167 22,185
Transactions with Directors
The Group considers all members of the Board to be key management and their remuneration is disclosed in note 21 of the group’s annual financial statements as at 31 July 2016. Directors’ shareholdings in the Group are disclosed in the Directors’ Remuneration Report of the group’s annual financial statements as at 31 July 2016.
Independent review report to Touchstone Innovations plc
Page 37 TOUCHSTONE INNOVATIONS INTERIM REPORT AND ACCOUNTS 2017
Report on the consolidated interim financial statements Our conclusion We have reviewed Touchstone Innovations plc's consolidated interim financial statements (the "interim financial statements") in the Interim Report and Accounts of Touchstone Innovations plc for the 6 month period ended 31 January 2017. Based on our review, nothing has come to our attention that causes us to believe that the interim financial statements are not prepared, in all material respects, in accordance with International Accounting Standard 34, ‘Interim Financial Reporting’, as adopted by the European Union and the AIM Rules for Companies.
What we have reviewed The interim financial statements comprise:
the consolidated interim balance sheet as at 31 January 2017;
the consolidated interim statement of comprehensive income for the period then ended;
the consolidated interim cash flow statement for the period then ended;
the consolidated interim statement of changes in equity for the period then ended; and
the explanatory notes to the interim financial statements.
The interim financial statements included in the Interim Report and Accounts have been prepared in accordance with International Accounting Standard 34, ‘Interim Financial Reporting’, as adopted by the European Union and the AIM Rules for Companies. As disclosed in note 1 to the interim financial statements, the financial reporting framework that has been applied in the preparation of the full annual financial statements of the Group is applicable law and International Financial Reporting Standards (IFRSs) as adopted by the European Union.
Responsibilities for the interim financial statements and the review Our responsibilities and those of the directors The Interim Report and Accounts, including the interim financial statements, is the responsibility of, and has been approved by, the directors. The directors are responsible for preparing the Interim Report and Accounts in accordance with the AIM Rules for Companies which require that the financial information must be presented and prepared in a form consistent with that which will be adopted in the company’s annual financial statements. Our responsibility is to express a conclusion on the interim financial statements in the Interim Report and Accounts based on our review. This report, including the conclusion, has been prepared for and only for the company for the purpose of complying with the AIM Rules for Companies and for no other purpose. We do not, in giving this conclusion, accept or assume responsibility for any other purpose or to any other person to whom this report is shown or into whose hands it may come save where expressly agreed by our prior consent in writing.
What a review of interim financial statements involves We conducted our review in accordance with International Standard on Review Engagements (UK and Ireland) 2410, ‘Review of Interim Financial Information Performed by the Independent Auditor of the Entity’ issued by the Auditing Practices Board for use in the United Kingdom. A review of interim financial information consists of making enquiries, primarily of persons responsible for financial and accounting matters, and applying analytical and other review procedures. A review is substantially less in scope than an audit conducted in accordance with International Standards on Auditing (UK and Ireland) and, consequently, does not enable us to obtain assurance that we would become aware of all significant matters that might be identified in an audit. Accordingly, we do not express an audit opinion. We have read the other information contained in the Interim Report and Accounts and considered whether it contains any apparent misstatements or material inconsistencies with the information in the interim financial statements. PricewaterhouseCoopers LLP Chartered Accountants Cambridge 30 March 2017 (a) The maintenance and integrity of the Touchstone Innovations plc website is the responsibility of the directors; the work carried
out by the auditors does not involve consideration of these matters and, accordingly, the auditors accept no responsibility for any changes that may have occurred to the interim financial statements since they were initially presented on the website.
(b) Legislation in the United Kingdom governing the preparation and dissemination of financial statements may differ from
legislation in other jurisdictions.

Page 38 TOUCHSTONE INNOVATIONS INTERIM REPORT AND ACCOUNTS 2017
Company Information
Directors David Newlands (Chairman) Russ Cummings (Chief Executive Officer) Dr Nigel Pitchford (Chief Investment Officer) Tony Hickson (Managing Director – Technology Transfer) Professor David Begg (Non-Executive Director) Dr Linda Wilding (Non-Executive Director) Dr Robert Easton (Non-Executive Director)
Company Secretary William Rayner
Registered Office 7 Air Street London W1B 5AD
Independent Auditors PricewaterhouseCoopers LLP Abacus House Castle Park Cambridge CB3 0AN
Principal Bankers National Westminster Bank plc P O Box No 592 18 Cromwell Place London SW7 2LB
Solicitors Mayer Brown International LLP 201 Bishopsgate London EC2M 3AF
Nomad and Joint Brokers J. P. Morgan Cazenove 25 Bank Street Canary Wharf London E14 5JP
Joint Brokers RBC Capital Markets Riverbank House 2 Swan Lane London EC2R 3BF
Share Registrars Equiniti Limited Aspect House Spencer Road Lancing West Sussex BN99 6DA