tourism and water use: supply, demand, and security. … · progress in tourism management tourism...
TRANSCRIPT
lable at ScienceDirect
Tourism Management 33 (2012) 1e15
Contents lists avai
Tourism Management
journal homepage: www.elsevier .com/locate/ tourman
Progress in Tourism Management
Tourism and water use: Supply, demand, and security. An international review
Stefan Gössling a,b,*, Paul Peeters c, C. Michael Hall d, Jean-Paul Ceron e, Ghislain Dubois f,La Vergne Lehmann g, Daniel Scott h
a Linnaeus University, School of Business and Economics, Box 882, 391 82 Kalmar, SwedenbWestern Norway Research Institute, Research Centre for Sustainable Tourism, Box 163, 6851 Sogndal, NorwaycNHTV Breda University of Applied Sciences, Centre for Sustainable Tourism and Transport, P.O. Box 3917, 4800 DX Breda, The NetherlandsdDepartment of Management, College of Business & Economics, University of Canterbury, Private Bag 4800, Christchurch 8140, New ZealandeCRIDEAU, Université de Limoges, Francef Tourisme Environnement Consultants (TEC), Marseille, FrancegWater In Drylands Collaborative Research Program (WIDCORP), University of Ballarat, Horsham Campus, Baillie St, PO Box 300, Horsham 3402, Victoria, AustraliahDepartment of Geography and Environmental Management, University of Waterloo, 200 University Ave. West, Waterloo, Ontario N2L 3G1, Canada
a r t i c l e i n f o
Article history:Received 31 December 2010Accepted 30 March 2011
Keywords:Climate changeTourismWater consumptionWater securityWater stressWater qualitySustainability
* Corresponding author. Western Norway ResearchSustainable Tourism, Box 163, 6851 Sogndal, Norway.
E-mail address: [email protected] (S. Gössling
0261-5177/$ e see front matter � 2011 Elsevier Ltd.doi:10.1016/j.tourman.2011.03.015
a b s t r a c t
This article reviews direct freshwater consumption in tourism from both quantitative and qualitativeviewpoints to assess the current water demand of the tourism sector and to identify current and futuremanagement challenges. The article concludes that even though tourism increases global waterconsumption, direct tourism-relatedwater use is considerably less than 1% of global consumption, andwillnot become significant even if the sector continues to grow at anticipated rates of around 4% per year(international tourist arrivals). The situation differs at the regional level because tourism concentratestraveller flows in time and space, and often-in dry destinations where water resources are limited.Furthermore, the understanding of tourism’s indirect water requirements, including the production offood, building materials and energy, remains inadequately understood, but is likely to be more substantialthan direct water use. The article concludes that with expected changes in global precipitation patternsdue to climate change, it is advisable in particular for already water scarce destinations to engage inproactive water management. Recommendations for managing tourism’s water footprint are made.
� 2011 Elsevier Ltd. All rights reserved.
1. Introduction
In the last 50 years global water use has tripled (CarbonDisclosure Project, 2010a). Water stress affects a large andgrowing share of humanity, with an estimated 450 million peoplealready living under severewater stress in 1995 (Vörösmarty, Green,Salisbury, & Lammers, 2000). An additional 1.4e2.1 billion peoplelive in water-stressed basins in northern Africa, the Mediterraneanregion, the Middle East, the Near East, southern Asia, northernChina, Australia, the USA, Mexico, north eastern Brazil and the westcoast of South America (Arnell, 2004; Vörösmarty et al., 2000), andup to 3.2 billion peoplewould facewater stress by 2100 under a 4 �Cglobal climate change scenario (Parry et al., 2009a; Parry, Lowe, &Hanson, 2009b). These figures underline the importance of watermanagement for humanity and are even more significant whenbearing in mind the Millennium Development Goal target to halve,
Institute, Research Centre forTel.: þ46 480 497194.).
All rights reserved.
by 2015, the proportion of peoplewithout sustainable access to safedrinking water and basic sanitation (United Nations DevelopmentProgramme, 2007).
Water stress is a function of renewable fresh water availability,abstraction rates and the share of consumptive use. Global water useis increasing due to population and economic growth, changes inlifestyles, technologies and international trade, and the expansion ofwater supply systems. The most water-consuming activity is irriga-tion for agriculture, which accounts for 70 per cent of total waterwithdrawals and more than 90 per cent of consumptive water use(Bates, Kundzewicz, Wu, &Palutikof, 2008). Agriculture is also themost important factor in the future growth of water consumption(Bates et al., 2008; UNESCO, 2009). While strong growth in waterdemand can thus be expected, available water resources will declinein many regions because of the depletion of non-renewable fossilwater resources (both groundwater and glacial ice), pollution ofwater bodies and groundwater sources, and climate change leadingto declining precipitation levels and increased frequency of drought,increased evaporation, and changes in patterns of runoff (IPCC, 2007;Parry et al., 2009a; Parry et al., 2009b). The Carbon Disclosure Project

Table 1Selected water use and tourism parameters.
Country Total naturalrenewablewater resources(millionm3/year)
Desalinatedwater(millionm3(note 2)
Reusedtreatedwastewater(millionm3/year)(note 2)
Totalwater usein 2000(millionm3/year)
Totalhouseholdwater use(10^6 L/yr)
% ofrenewablewaterused
InternationalTouristarrivals2000(’000)
Growthratetouristarrivals
InternationalTouristarrivals2020 (’000)
Averagelengthof stay,2000
Water useper touristper day(note 6)
Total Int.t.-relatedwater use,2000(million m3)
Mauritius 2210 0 0 612 16 27.7% 761 5.3 2138 10.4 400 3.17Cyprus 780 0 11 244 62 31.3% 2470 2.5 4047 11 400 10.87Malta 51 31.4 1.6 55 33 107.8% 1171 2 1740 8.4 400 3.93Barbados 80 0 0 84 24 105.0% 548 4.3 1272 10.1 400 2.21Spain 111,500 e e 35,635 4576 32.0% 55,916 2.6 93,429 12.9 400 288.53France 203,700 e e 39,959 5814 19.6% 75,910 2.3 119,622 7.5 400 227.73Switzerland 53,500 e e 2571 276 4.8% 7229 1.7 10,127 8.1 150 8.78Greece 74,250 e e 7759 870 10.4% 14,276 2.1 21,633 8.1 400 46.25Uruguay 139,000 0 0 3146 42 2.3% 1808 5.3 5079 6.9 150 1.87Tunisia 4560 8.3 20 2726 364 59.8% 7106 3.1 13,086 6.6 400 18.76Indonesia 2,838,000 0 0 82,773 4458 2.9% 5002 7.7 22,052 12.3 300 18.46India 1,907,760 0 0 645,837 25,000 33.9% 3915 5.9 12,321 31.2 150 18.32Ireland 52,000 e e 1129 128 2.2% 7333 3.8 15,461 7.4 150 8.14Israel 1670 e e 2041 624 122.2% 1903 2.3 2999 15 300 8.56Cape Verde 300 0 0 28 13 9.3% 198 3.6 402 7 300 0.42Thailand 409,944 0 0 87,065 1655 21.2% 9579 6.9 36,381 7.8 300 22.41United
Kingdom147,000 0 0 9541 2360 6.5% 29,970 3.4 58,492 8.1 200 48.55
Italy 191,300 e e 44,372 7980 23.2% 36,513 2.1 55,330 8.1 400 118.30Denmark 6000 e e 1267 360 21.1% 4699 3.8 9907 8.1 200 7.61Portugal 77,400 e e 11,263 1095 14.6% 12,097 2.1 18,331 6.7 400 32.42Germany 154,000 e e 47,052 5093 30.6% 21,500 1.2 27,293 8.1 200 34.83Finland 110,000 e e 2478 264 2.3% 3140 3.8 6620 5.9 150 2.78Brazil 8,233,000 0 0 59,298 11,529 0.7% 5358 5 14,216 12.1 300 19.45South Africa 50,000 0 0 15,306 2261 30.6% 7518 8 35,041 8.1 300 18.27Turkey 231,700 0.5 0 37,519 5680 16.2% 20,273 5.5 59,152 10 400 81.09Bahrain 116 44.1 8 299 53 257.8% 3914 6.6 14,053 2.4 200 1.88Dominican
Republic20,995 0 0 3386 913 16.1% 3691 5 9793 10 400 14.76
Norway 382,000 e e 2185 400 0.6% 3859 3.8 8136 8.1 150 4.69China 2,896,569 e e 630289 26,275 21.8% 46,809 7.8 210,235 8.1 200 75.83Morocco 29,000 3.4 0 12,758 1150 44.0% 5843 4.9 15,211 9 200 10.52Hungary 104,000 e e 7641 612 7.3% 10,048 0.7 11,552 8.1 200 16.28Netherlands 91,000 e e 7944 390 8.7% 10,012 1.9 14,588 2.7 150 4.05Saudi Arabia 2400 714 217 17,320 1530 721.7% 9100 5.3 25,563 8.1 200 14.74Austria 77,700 e e 2112 792 2.7% 19,952 1.2 25,328 4.6 150 13.77Japan 430,000 0 0 88,432 17,366 20.6% 6728 4.5 16,226 8 200 10.76United States 3,069,400 e e 479,293 60,749 15.6% 49,402 3.5 98,300 8.1 300 120.05United Arab
Emirates150 385 108 2306 504 1537.3% 3907 7.1 15,404 8.1 200 6.33
Malaysia 580,000 0 0 9016 1397 1.6% 16,431 5 43,596 5.8 200 19.06Sweden 174,000 e e 2965 1044 1.7% 3133 3.8 6606 8.1 150 3.81Trinidad
& Tobago3840 0 0 305 204 7.9% 399 4.3 926 8.1 400 1.29
Philippines 479,000 0 0 28,520 4432 6.0% 2623 7.7 11,564 8.8 300 6.92Egypt 86,800 25 200 68,653 4620 79.1% 8244 7.4 34,373 6 400 19.79Chile 922,000 0 0 12539 1015 1.4% 2027 4.7 5079 10.1 200 4.09Bulgaria 21,300 e e 10,498 417 49.3% 4837 4.6 11,891 8.4 150 6.09Mexico 457,222 0 0 78,219 13,226 17.1% 21,915 3.6 44,457 9.9 300 65.09Australia 492,000 e e 23,932 9490 4.9% 5020 6.4 17,359 26 300 39.16Republic
of Korea69,700 0 0 18,590 6162 26.7% 6023 4.1 13,453 8.1 200 9.76
Poland 61,600 e e 16,201 1599 26.3% 15,200 4.2 34,610 4.8 150 10.94Cuba 38,120 0 0 8204 2548 21.5% 2261 9.2 13,145 10.5 300 7.12Argentina 814,000 0 0 29,072 4576 3.6% 3895 5.1 10,533 9.9 150 5.78Russian
Federation4,507,250 0 0 76,686 14,649 1.7% 21,169 6.8 78,909 8.1 150 25.72
Czech Republic 13,150 e e 2566 1107 19.5% 6336 4 13,883 3.5 200 4.44Canada 2,902,000 e e 45,974 8118 1.6% 18,768 3.6 38,073 5.2 150 14.64Ukraine 139,550 0 0 37,523 4680 26.9% 4406 4.2 10,032 5.3 150 3.50Romania 211,930 e e 23,176 2080 10.9% 1430 2.8 2484 2.5 150 0.54Totals 34,076,497 1212 566 2,886,364 272,674 8.5% 653,575 4.2% 1,501,535 8.5 286 1593
1) WTO (2001): 2) WTO (2001) regional average; 3) WTO (2001): 4) extrapolation based on growth rate; 5) weighted average; 6) Estimate by Gössling (2006). Categories:countries with i) high share of friends & relative related tourism, high percentage of small accommodation establishments or city hotels, high share of mountain tourism:150 L per tourist per day (t/d), ii) Mediterranean & countries with high percentage of resort hotels: 400 L t/d, iii) other, individual judgement: 200e300 L t/d; 7)extrapolation does not consider increases/decreases in per tourist water use estimates; 8) Peeters and Dubois (2010): 9) source: Dorling (2007); *global average applied inabsence of national data, calculation in Gössling (2002a). Table originally presented in Gössling (2006), and based on FAO (2003); WTO (2001, 2003); UNTWO (2010);UNWTOeUNEPeWMO (2008); WWF (2001, 2004).
S. Gössling et al. / Tourism Management 33 (2012) 1e152

Total Inttourism-relatedwater use2020(million m3)
Int.Tourism-relatedwater useas % of total 2000
Int.Tourism-relatedwater useas % oftotal 2020
Share ofdomesticwater forint. tourism2000
Domesticwateruse(note 9)
Domestictourism(trips,note 8)
Net domestictourismwater useper night
Totaldomestictourismwater(million m3)
TotalTourismwater use
Domestictourism shareof domesticwater use
Internationaltourismshare ofdomesticwater
Totalshare
8.89 0.52% 1.45% 20.17% 13 632380 197 3.08 6.25 19.64% 20.17% 39.81%17.81 4.45% 7.30% 17.43% 78 258138 184 1.24 12.11 1.99% 17.43% 19.42%5.85 7.15% 10.63% 11.89% 83 212068 183 0.78 4.71 2.35% 11.89% 14.24%5.14 2.64% 6.12% 9.40% 78 162749 184 0.72 2.93 3.06% 9.40% 12.46%
482.10 0.81% 1.35% 6.31% 112 47853461 178 260.46 548.99 5.69% 6.31% 12.00%358.87 0.57% 0.90% 3.92% 97 110581890 181 355.60 583.33 6.12% 3.92% 10.03%12.30 0.34% 0.48% 3.18% 38 13174153 67 17.06 25.85 6.18% 3.18% 9.36%70.09 0.60% 0.90% 5.32% 79 8782982 184 31.12 77.37 3.58% 5.32% 8.89%5.26 0.06% 0.17% 4.46% 12 1453856 73 1.73 3.60 4.11% 4.46% 8.57%
34.55 0.69% 1.27% 5.15% 38 4010240 192 12.10 30.86 3.32% 5.15% 8.48%81.37 0.02% 0.10% 0.41% 21 79200275 146 337.50 355.96 7.57% 0.41% 7.98%57.66 0.00% 0.01% 0.07% 24 359906297 70 1872.88 1891.21 7.49% 0.07% 7.56%17.16 0.72% 1.52% 6.36% 33 1094255 68 1.32 9.46 1.03% 6.36% 7.39%13.49 0.42% 0.66% 1.37% 99 6826685 130 31.66 40.22 5.07% 1.37% 6.45%0.84 1.49% 3.01% 3.16% 26 176207 145 0.42 0.84 3.22% 3.16% 6.38%
85.13 0.03% 0.10% 1.35% 27 28396535 145 76.10 98.51 4.60% 1.35% 5.95%94.76 0.51% 0.99% 2.06% 40 51729235 92 91.55 140.11 3.88% 2.06% 5.94%
179.27 0.27% 0.40% 1.48% 139 102717268 172 340.31 458.62 4.26% 1.48% 5.75%16.05 0.60% 1.27% 2.11% 67 7739837 87 12.90 20.51 3.58% 2.11% 5.70%49.13 0.29% 0.44% 2.96% 110 7312650 178 20.72 53.14 1.89% 2.96% 4.85%44.21 0.07% 0.09% 0.68% 62 118930724 88 200.48 235.31 3.94% 0.68% 4.62%5.86 0.11% 0.24% 1.05% 51 10128860 65 9.20 11.98 3.49% 1.05% 4.54%
51.61 0.03% 0.09% 0.17% 65 116616298 137 458.80 478.25 3.98% 0.17% 4.15%85.15 0.12% 0.56% 0.81% 50 27165910 140 73.11 91.37 3.23% 0.81% 4.04%
236.61 0.22% 0.63% 1.43% 81 33131820 184 144.64 225.73 2.55% 1.43% 3.97%6.75 0.63% 2.26% 3.57% 75 158505 85 0.08 1.96 0.15% 3.57% 3.72%
39.17 0.44% 1.16% 1.62% 106 4309247 179 18.29 33.06 2.00% 1.62% 3.62%
9.89 0.21% 0.45% 1.17% 89 8525806 57 9.38 14.07 2.35% 1.17% 3.52%340.58 0.01% 0.05% 0.29% 20 455490233 96 840.58 916.41 3.20% 0.29% 3.49%27.38 0.08% 0.21% 0.91% 38 13141443 92 25.94 36.46 2.26% 0.91% 3.17%18.71 0.21% 0.24% 2.66% 62 1251864 88 2.11 18.39 0.34% 2.66% 3.00%5.91 0.05% 0.07% 1.04% 24 16682315 70 7.50 11.56 1.92% 1.04% 2.96%
41.41 0.09% 0.24% 0.96% 65 15882165 87 26.57 41.31 1.74% 0.96% 2.70%17.48 0.65% 0.83% 1.74% 98 10888857 55 6.59 20.36 0.83% 1.74% 2.57%25.96 0.01% 0.03% 0.06% 136 300132715 73 414.86 425.62 2.39% 0.06% 2.45%
238.87 0.03% 0.05% 0.20% 209 625357944 108 1302.09 1422.14 2.14% 0.20% 2.34%24.95 0.27% 1.08% 1.26% 174 4206132 65 5.28 11.61 1.05% 1.26% 2.30%
50.57 0.21% 0.56% 1.36% 58 8778800 88 10.68 29.74 0.76% 1.36% 2.13%8.03 0.13% 0.27% 0.36% 117 17711966 52 17.56 21.37 1.68% 0.36% 2.05%3.00 0.42% 0.98% 0.63% 157 869956 169 2.82 4.11 1.38% 0.63% 2.02%
30.53 0.02% 0.11% 0.16% 56 28072134 139 81.38 88.30 1.84% 0.16% 1.99%82.50 0.03% 0.12% 0.43% 66 26114735 187 69.54 89.33 1.51% 0.43% 1.93%10.26 0.03% 0.08% 0.40% 65 7133925 87 14.88 18.98 1.47% 0.40% 1.87%14.98 0.06% 0.14% 1.46% 52 1086473 65 1.40 7.49 0.34% 1.46% 1.80%
132.04 0.08% 0.17% 0.49% 130 54439380 124 158.79 223.87 1.20% 0.49% 1.69%135.40 0.16% 0.57% 0.41% 487 27840371 53 90.53 129.69 0.95% 0.41% 1.37%21.79 0.05% 0.12% 0.16% 130 43960097 74 62.57 72.33 1.02% 0.16% 1.17%
24.92 0.07% 0.15% 0.68% 41 8983700 67 6.83 17.78 0.43% 0.68% 1.11%41.41 0.09% 0.50% 0.28% 225 6065600 105 15.87 22.99 0.62% 0.28% 0.90%15.64 0.02% 0.05% 0.13% 120 27991886 51 33.51 39.29 0.73% 0.13% 0.86%95.87 0.03% 0.13% 0.18% 102 69776802 55 73.37 99.09 0.50% 0.18% 0.68%
9.72 0.17% 0.38% 0.40% 109 2881736 78 1.88 6.31 0.17% 0.40% 0.57%29.70 0.03% 0.06% 0.18% 259 45477126 23 12.99 27.63 0.16% 0.18% 0.34%7.98 0.01% 0.02% 0.07% 96 13706940 56 9.64 13.14 0.21% 0.07% 0.28%0.93 0.00% 0.00% 0.03% 93 7203059 56 2.41 2.95 0.12% 0.03% 0.14%
3531.48 0.06% 0.12% 0.58% 2992316683 143 7681.43 9274.56 2.82% 0.58% 3.40%
S. Gössling et al. / Tourism Management 33 (2012) 1e15 3
S. Gössling et al. / Tourism Management 33 (2012) 1e154
(2010b) reports that futurewater shortages are an increasing concernfor the world’s largest companies, with more than half of the firmsresponding to a survey expecting problems with water in the nextfive years, including disruption from drought or flooding, decliningwater quality, increases in water prices, and fines and litigationrelating to pollution incidents.
Tourism is both dependent on fresh water resources and animportant factor in freshwater use. Tourists need and consumewaterwhen washing or using the toilet, when participating in activitiessuch as ski or golf tourism (snowmaking and irrigation), when usingspas,wellness areas or swimmingpools. Freshwater is alsoneeded tomaintain the gardens and landscaping of hotels and attractions, andis embodied in tourism infrastructure development, food and fuelproduction (Chapagain &Hoekstra, 2008; Gössling, 2001;Hoekstra &Hung, 2002; Pigram,1995;Worldwatch Institute, 2004). Recreationalactivities such as swimming, sailing, kayaking, canoeing, diving, orfishing are take place at lakes and rivers, which also form importantelements of the landscapes visited by tourists (Gössling, 2006; Hall &Härkönen, 2006; Prideaux & Cooper, 2009). Many forms of tourismare also indirectly dependent onwater, including, for instance,wintertourism (white winter landscapes), agritourism or wildlife tourism.Changes in the availability or quality of water resources can conse-quently have a concomitant detrimental impact on tourism, withmany documented examples indicating the enormous costs associ-ated with the ecological restoration of ecosystems such as the Ever-glades or Great Lakes in North America (UNESCO, 2009).
In light of this, the article examines tourism-related freshwateruse and its significance for the sustainable use of freshwaterresources. Tourism is typically overlooked as a salient sector in globalscale discussions of water use and this paper examines whether thisis justified by using a review of tourism-related water use studies toestimate fresh water consumption in tourism at the country level.The paper also provides a review of the wide range of fresh wateruses in tourism, documented use conflicts, and discusses manage-ment issues related to water provision, abstraction, and efficient useof fresh water.
2. Water availability and use by country and sector
Fresh water availability is unevenly distributed between coun-tries and within countries, where water scarce and water abundantwatersheds can be only a hundred kilometres apart. For example,renewable per capita water resources range from 10 m3 per year inKuwait to more than 1,500,000 m3 in the State of Alaska in the USA(in 2000; Food and Agriculture Organization (FAO), 2010). Whilemany countries have vast water resources, desalination has becomeof major importance in some large industrialized countries such asthe United States, Italy, Spain, as well as a range of island states.Some countries, particularly islands, have also started to importfresh water with tanker ships, including Bahamas, Antigua andBarbuda, Mallorca, the Greek Islands, South Korea, Japan, Taiwan,Nauru, Fiji and Tonga (Black & King, 2009; UNESCO, 2009).
The FAO distinguishes agricultural, domestic and industrial freshwater consumption. On global average, approximately 70 per cent ofwater use is for agriculture, 20 per cent for industrial and 10 per centfor domestic purposes, including households, municipalities,commercial establishments and public services (UNESCO, 2009; seealso Bates et al., 2008). Considerable differences in these shares existwithin countries and on an averaged per capita basis. For example,daily domestic water use varies between 12 L per capita in Bhutan (in2000) and 1226 L (in 2005) per capita in Australia. On a globalaverage, domestic water use is in the order of 160 L per capita per day(Gössling, 2006; based on WRI, 2003).
However, the impact of water use is dependent on abstractionrates in comparison to renewable water resources, and the share of
consumptive uses. For instance, only about 10% of water used forsnowmaking will sublimate or evaporate, while 90% will return tothe regional water cycle (Smart & Fleming, 1985). In cases wherewater can be re-used, as is often the case with grey water, changedwater properties (temperature, toxic components) can be morerelevant in sustainability terms than the amount of water actuallyconsumed.
As shown in Table 1, great differences exist between the mostimportant tourism countries in terms of renewable water resources,desalination capacity, use of treated wastewater, and overall wateruse. Forexample, in countries suchasBahrain, Barbados, Israel,Malta,Saudi Arabia and the United Arab Emirates, water use exceedsrenewable water resources by up to a factor 15. In many othercountries, such as Poland, Republic of Korea, Ukraine, Mauritius,Germany, South Africa, Cyprus, Spain, India, Morocco, Bulgaria orTunisia, a significant share of renewable water resources is used. Inthese, as well as other countries, considerable problems can beexpected in the future, when water consumption is likely to grow.Furthermore, the values inTable 1mask that inmany countrieswaterscarcity exists at the regional and local scale, but is not reflected innational water use statistics.
Table 1 also shows that international tourism generally accountsfor less than1per cent of nationalwater use. Barbados (2.6 per cent),Cyprus (4.8 per cent) and Malta (7.3 per cent) are exceptions, andindicate that islands with high tourist arrival numbers and limitedwater resources aremore likely to facewater conflicts. This becomeseven more obvious when calculating the share of tourism-relatedwater consumption in comparison to domestic water use, andwhen water consumption by domestic tourism is also considered.As shown in Fig. 1, the proportion of water consumption by thetourism sector is typically below 5 per cent of domestic water use,but can be as high as 40 per cent (Mauritius). In the 54 countriesincluded in this analysis, comprising the world’s most importanttourism countries (by arrivals) and a sample of highly tourism-dependent islands (high percentage of GDP), the tourism sectorwas found to represent greater than 10 per cent of domestic wateruse in 19 of them. This finding suggests that national-scale discus-sions of water security should not overlook tourism as a sector.
By 2020, tourism’s contribution to water use is likely toincrease with i) increased tourist numbers, ii) higher hotel standardsand iii) the increased water-intensity of tourism activities (cf.UNWTOeUNEPeWMO, 2008, see also Tables 2 and 5 below). TheWorld Tourism Organization (2003) maintains projections of itsTourism 2020 Vision (WTO, 2001) and forecasts over 1.56 billioninternational arrivals by the year 2020. To thesefigures, about 5 timesthe number of domestic tourism trips would have to be added,assuming the current (2005) ratio of international to domestictourism (cf. UNWTOeUNEPeUNWTO, 2008). Higher average hotelstandards, identified as a trend byUNWTOeUNEPeWMO(2008), arelikely to go alongwith increasingwater use, because of spas, wellnessareas, or swimming pools, but also greater indirect water demandsfor higher-order foods and an increase in average fossil fuel use pertrip. Growth inwater-intense tourismactivities, such as golf or skiing,will also lead to greater water consumption in the sector. Forexample, the US and EU countries added over 3000 new golf courseseach between 1985 and 2010, with much of this development inareas with limitedwater resources (e.g., Arizona, Texas, Spain) (Scott,Hall, & Gössling, 2011). Future development of new courses is antic-ipated to be strongest in China, the Mid-East, South East Asia, SouthAfrica and Eastern Europe; many of which are expected to face watershortages in the decades ahead (Arnell, 2004; Bates et al., 2008).Although the number of ski areas and skiable terrain has increasedslowly over the past 25 years (with the exception of some emergingmarkets such as China), the proportion of skiable terrain covered bysnowmaking has grown substantially (OECD, 2007; Scott, 2005) and
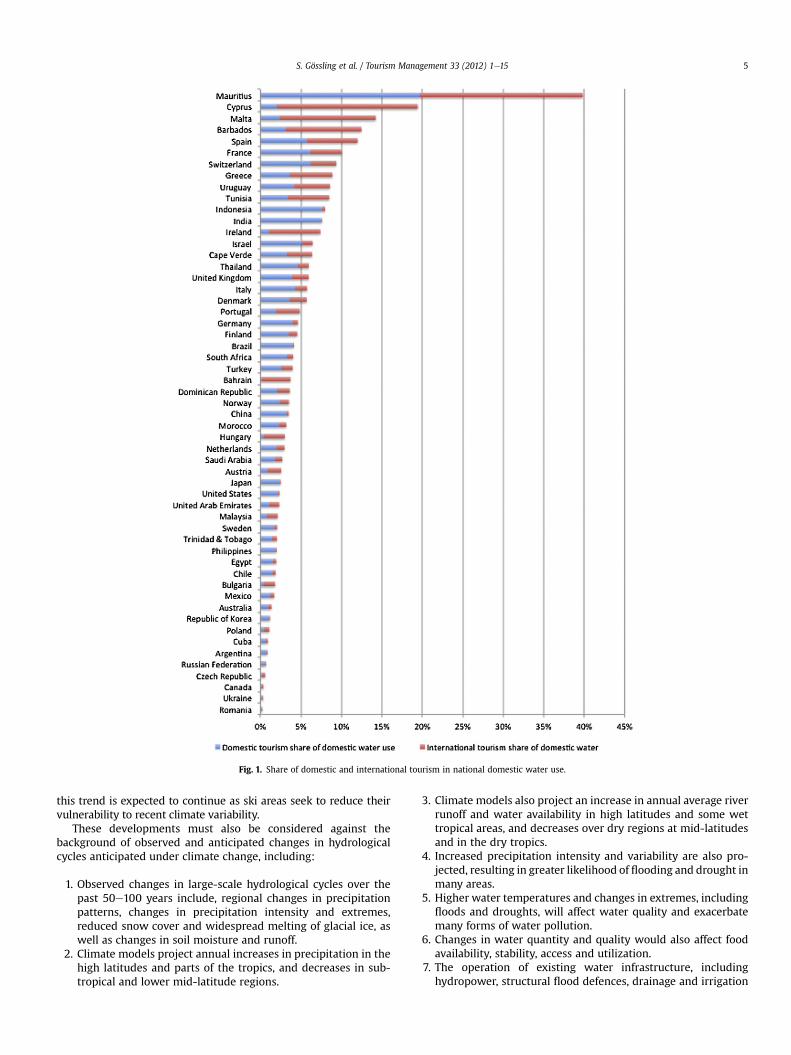
Fig. 1. Share of domestic and international tourism in national domestic water use.
S. Gössling et al. / Tourism Management 33 (2012) 1e15 5
this trend is expected to continue as ski areas seek to reduce theirvulnerability to recent climate variability.
These developments must also be considered against thebackground of observed and anticipated changes in hydrologicalcycles anticipated under climate change, including:
1. Observed changes in large-scale hydrological cycles over thepast 50e100 years include, regional changes in precipitationpatterns, changes in precipitation intensity and extremes,reduced snow cover and widespread melting of glacial ice, aswell as changes in soil moisture and runoff.
2. Climate models project annual increases in precipitation in thehigh latitudes and parts of the tropics, and decreases in sub-tropical and lower mid-latitude regions.
3. Climate models also project an increase in annual average riverrunoff and water availability in high latitudes and some wettropical areas, and decreases over dry regions at mid-latitudesand in the dry tropics.
4. Increased precipitation intensity and variability are also pro-jected, resulting in greater likelihood of flooding and drought inmany areas.
5. Higher water temperatures and changes in extremes, includingfloods and droughts, will affect water quality and exacerbatemany forms of water pollution.
6. Changes in water quantity and quality would also affect foodavailability, stability, access and utilization.
7. The operation of existing water infrastructure, includinghydropower, structural flood defences, drainage and irrigation

Table 2Water use per tourist per day, various tourism contexts.
Country/region Accommodation type Water use per touristper day
References
Mediterranean Mostly hotels 250 L Grenon and Batisse (1991), quoted in GFANC (1997)Mediterranean Campsites 145 L Scherb (1975), quoted in GFANC (1997)Mediterranean All accommodation 440e880 L WWF (2004)Benidorm, Spain Campsites 84 L Rico-Amoros, Olcina-Cantos, and Sauri (2009)Benidorm, Spain 1 star hotel 174 L Rico-Amoros (2009)Benidorm, Spain 2 star hotel 194 L Rico-Amoros (2009)Benidorm, Spain 3 star hotel 287 L Rico-Amoros (2009)Benidorm, Spain 4 star hotel 361 L Rico-Amoros (2009)Tunisia Hotels 466 L Eurostat (2009)Morocco Apartment 180 L Eurostat (2009)Morocco 3 star hotel, or villa 300 L Eurostat (2009)Morocco 4 star hotel 400 L Eurostat (2009)Morocco 5 star hotel 500 L Eurostat (2009)Morocco Luxury 5 star hotel 600 L Eurostat (2009)Sarigerme, Turkey 4 star hotel 400 Le>1000 L Antakyali et al. (2008)
Sharm El Sheikh, Egypt Hotels/resorts �500 L (per bed) Hafez & El Manharawy (2002)Sharm El Sheikh, Egypt 5 star hotels 1410e2190 L (per room) Lamei et al. (2006) in Lamei (2009)Sharm El Sheikh, Egypt Hotels 400 L Lamei, Tilmant, et al. (2009) and
Lamei, von Münch, et al. (2009)
Zanzibar, Tanzania Guesthouses 248 L Gössling (2001)Zanzibar, Tanzania Hotels 931 L Gössling (2001)Zanzibar, Tanzania Hotels & guesthouses 685 L (weighted average) Gössling (2001)
Jamaica Unclear 527e1596 L (average 980 L) Meade and del Monaco (1999), quoted inBohdanowicz and Martinac (2007), andAntakyali et al. (2008)
Thailand 913e3423 L (per room) CUC and AIT (1998), quoted in Bohdanowiczand Martinac (2007)
Philippines 4 star hotel 1802 L (per room) Alexander (2002)Philippines Unclear 1499 L (per room) Alexander and Kennedy (2002), quoted in
Bohdanowicz and Martinac (2007)Hong Kong Hotels 336e3198 L (per room) Deng and Burnett (2002)
Australia Hotels 750 L (per room) Australian Institute of Hotel Engineers (1993),quoted in Bohdanowicz and Martinac 2007
Australia Large Hotels 300 L (per room) The Natural Edge Project (2008)Melbourne, Australia Various 227e435 L City West Water (2006)
USA Unclear 382e787 L (per room) Davies and Cahill (2000), quoted in Bohdanowiczand Martinac (2007)
Las Vegas, USA Hotels/resorts 303L Cooley, Hutchins-Cabibi, Cohen, Gleick, and Heberger (2007)Seattle, USA Hotels e various 378e1514L (per room) O’Neill, Siegelbaum and The RICE Group (2002)
Germany Unclear 90e900 L (average 340 L) Despretz (2001), quoted in Bohdanowicz & Martinac 2007and Antakyali et al. (2008)
Germany Unclear 275 L Nattrass and Altomare (1999), quoted inBohdanovicz and Martinac (2007)
Scandinavia Hilton chain 516 L Bohdanovicz and Martinac (2007)Scandinavia Scandic chain 216 L Bohdanovicz and Martinac (2007)Coastal Normandy, France Second home 102 L Langumier and Ricou (1995)Coastal Normandy, France Campsite 92 L Langumier and Ricou (1995)Coastal Normandy, France Hotel-restaurant 259 L Langumier and Ricou (1995)Coastal Normandy, France Hotel 175 Langumier and Ricou (1995)Coastal Normandy, France Other tourist accommodation 115 L Langumier and Ricou (1995)Coastal Normandy, France Main home 114 L Langumier and Ricou (1995)
S. Gössling et al. / Tourism Management 33 (2012) 1e156
systems, and water supply and treatments systems will beaffected by these ongoing and future climate-induced hydro-logical changes. (Bates et al., 2008)
Examination of the countries where tourism represents a moresubstantive sectoral user of water, i.e. the 19 countries in Table 1where tourism represents >5% of total use, revealed that 12 of 19are projected to have lower annual precipitation and lower annualrunoff under climate change (a 15model ensemblemean for the SRESA1B scenario for the 2080s e IPCC, 2007). When increased evapo-ration is also considered, 15 of 19 countries are projected to havereduced annual soil moisture. While further analysis is needed toexamine whether the seasonal timing of increased precipitation in 7
of the 19 countries coincides with peak tourism arrivals and couldtherefore potentially contribute to alleviating tourism-inducedwateruse pressure, in the majority of countries where tourism is a moresignificant sectoral water user, climate change is projected to exac-erbate current water demand and scarcity problems. Sub-nationalscale analysis reveals additional climate change-induced waterchallenges emerge for some prominent and emerging tourismdestinations, including in the southwestern USA, southern Australia,central-coastal Brazil, the Middle East, and central and southernChina.
Throughout many of the regions where reduced runoff and soilmoisture are projected, drought frequency and intensity are alsoprojected, which will further test water supply systems in extreme

S. Gössling et al. / Tourism Management 33 (2012) 1e15 7
years. For example, in large parts of the European Mediterranean,the current 1 in 100 year drought is projected to occur oncea decade in the latter part of the 21st century (IPCC, 2007).Furthermore, Black and King (2009) identify a range of importanttourism countries that will be chronically short of water by 2050,including Tunisia, Malta, Morocco, South Africa, Cyprus, Maldives,Singapore, Antigua and Barbuda, St. Kitts and Nevis, Dominica, andBarbados.
Overall, these figures illustrate that even though water use inthe tourism sector is typically less than 1 per cent of national wateruse, the situationmay be different on the regional level, particularlywhere water may already be scarce and the number of tourists issubstantial. In the future, tourism in many regions will faceconsiderably greater problems with regard towater availability andquality due to increasing water use and climate change. As thesechanges are likely to affect individual tourism businesses in waterscarce regions in particular, the following section will review wateruses in tourism to establish the major categories of water use (andwhere water management initiatives might best be focused) andprovide a better understanding of the water footprints of varioustypes of holidays.
3. Water use by tourists
In comparison to other economic sectors, such as agriculture,there are no specific regional or national water use statistics fortourism, and tourism-related water use is still under investigated.The following sections discuss the range of estimates for direct(Accommodation, Activities) and indirect water use (fossil fuel usefor transports, food, infrastructure) available in the literature.
3.1. Accommodation
The literature suggests water consumption rates in a rangebetween 84 and 2000 L per tourist per day, or up to 3423 L perbedroom per day (Table 2). A considerable share of these volumescan be staff related, with for instance Lamei, Tilmant, van der Zaag,and Imam (2009) and Lamei, von Münch, van der Zaag, and Imam(2009) reporting use values of 250 L per day per person in staffhousing and 30 L per day for each staff during working hours.Overall, there is a tendency for higher-standard accommodation toconsume significantly higher water volumes, with Bohdanowiczand Martinac (2007) finding highest water use rates in hotels withspas and large ormultiple swimming pools (see alsoTable 5).Water-intensive facilities typically have landscaped grounds, requiringirrigation. Higher laundry volumes per guest per day are a result ofsport and health centres, as well as affected by textile quality and/orweight of laundry items, including very large towels for spa facilitiesor beach use. On global average, it has been suggested that aninternational tourist consumes 222 L per day (Gössling, 2005), butevidence from the newer studies summarized in Table 2 suggeststhis estimate should be considered conservative.
With regard to water use categories and shares, various factorsare found to influence water use, including the geographical loca-tion of accommodation establishments (climate zone, urban-rural)as well as the hotel structure (high-rise, resort style) and comfortstandard (e.g. campsite, 1e5-star hotel). According to one study ofhotels in a tropical environment (Zanzibar, Tanzania e Gössling,2001), most water in hotels was used for continuous irrigation ofgardens (50 per cent, or a weighted average of 465 L per tourist perday), a result of the poor storage capacity of the soils, high evapo-ration, and plant species not adapted to arid conditions. In contrast,in guesthouses, the second dominant accommodation category,irrigation accounted for only 15 per cent of the total water use (37 Lper tourist per day). The major proportion of water in guesthouses
was spent for direct uses including taking showers, flushing thetoilet, and the use of tap water (55 per cent, 136 L per tourist perday), with a corresponding consumption of 20 per cent or 186 L pertourist per day in hotels. The higher demand of hotel guests wasfound to be a result of additional showers taken after swimming,and more luxurious bathroom facilities. Swimming pools repre-sented another important factor of water use, accounting for about15 per cent of the water demand of hotels (140 L per tourist perday). Indirectly, swimming pools added to laundry, for examplewhen additional towels were handed out to guests. Guesthouses inthe study area did not have swimming pools, which can partiallyexplain lower water use rates. Laundry accounts for about 10 percent (25 L per tourist per day) of the water used in guesthouses and5 per cent (47 L per tourist per day) in hotels. Cleaning adds 5 percent to the water demand in both guesthouses (12 L per tourist perday) and hotels (47 L per tourist per day). Finally, restaurants inguesthouses account for 15 per cent of the water used in guest-houses (37 L per tourist per day) and for 5 per cent (47 L per touristper day) in hotels (Gössling, 2001).
Considerably different results were presented by Smith,Hargroves, Desha, and Stasinopoulos (2009) for hotels in Australia,where major areas of water usage included guest rooms (42%), fol-lowed by kitchens (16%), laundry (15%), public toilets (12%), coolingtowers (10%), irrigation (3%) and swimming pools (2%; no absolutewater use figures presented). Yet another study of two hotels inSeattle, USA identified kitchens and public areas as the major factorinwater use, followedbyguest showers, guest toilets, laundry, leaks,cooling towers, guest floor ice and guest sinks (O’Neill, Siegelbaum,& the RICE Group, 2002). Finally, a study of water use in the IberotelSarigeme Park hotel in Turkey found that kitchen and laundrytogether constituted the largestwater use (30 per cent), followed byswimming pools (20e25 per cent), and guest rooms (12 per cent)(Antakyali, Krampe, & Steinmetz, 2008).
Deng and Burnett (2002) undertook a study of water use inhotels in Hong Kong, assessing water use performance by usinga Water Use Index (WUI, m3/m2), which is defined as the totalannual water consumption divided by the total floor area of a hotel.The study found:
� The WUIs varied significantly from one hotel to another, themaximum 7.7 m3/m2 and the minimum 2.1 m3/m2, with theaverage being 4.5 m3/m2. This reflects the diversified water usesituations in Hong Kong hotels.
� The averaged WUI for the ten hotels with an in-house laundrywas significantly higher (5.1 m3/m2) than that for the otherseven hotels (3.6 m3/m2).
� The average WUI for five-star hotels was 5.1 m3/m2, and thosefor four-star and three-star hotels were 4.1 and 3.3 m3/m2,respectively. This again confirms that higher-class hotelsconsume more water than lower-class hotels.
3.2. Activities
Various tourist activities add to water use, with prominentexamples being golf and skiing where snowmaking is utilized. Theconsumption of water by golf courses varies considerably,depending on soils, climate and golf course size (Baillon & Ceron,1991; Ceron & Kovacs, 1993; Throssell, Lyman, Johnson, Stacey, &Brown, 2009). For instance, a standard golf course may have anannual consumption of 80,000 m3e100,000 m3 in the North ofFrance and 150,000 m3e200,000 m3 in Southern France. Muchhigher values can be found in dry and warm climates. For instance,Van der Meulen and Salman (1996) report that an 18-hole golfcourse in a Mediterranean sand dune system is sprinkled with
Table 3Water use categories and estimated use per tourist per day.
Water use category e direct L per tourist per day
Accommodation 84e2000Activities 10e30Water use category - indirect L per tourist per dayInfrastructure n.a.Fossil fuels 750 (per 1000 km by air/car)Biofuels 2500 (per 1 L)Food 2000e5000Total per tourist per day Estimated range: 2000e7500
S. Gössling et al. / Tourism Management 33 (2012) 1e158
0.5e1 million m3 of fresh water per year. In a large-scale study ofgolf courses in the USA, Throssell et al. (2009) found annual wateruse varied from an average of 52,000 m3 in the Northeast to566,000 m3 in the desert states of the Southwest. Likewise,snowmaking can be highly water intense. In France, for instance,snowmaking accounted for 19 million m3 of water use in 2007, ofwhich about 70 per cent is runoff (Badré, Prime, & Ribière, 2009).Snowmaking in the US in 2004/05 was estimated to use approxi-mately 60 million m3 (Scott et al., 2011), but could be substantiallyhigher as the assumptions used in the analysis were conservative.
Convention, event and attractions infrastructure can add towater demand (e.g. Meyer & Chaffee, 1997; Sebake & Gibberd,2008; Zaizen, Urakawa, Mutsumoto, & Takai, 2000). For example,a study of the Millennium Dome in London indicated that in 2000,each of the six million visitors used about 22 L of water, 48 per centof this for toilet flushing, 32 per cent for cleaning and canteen use,13 per cent for hand washing, and 7 per cent for urinal flushing(Hills, Briks, & McKenzie, 2002).
3.3. Infrastructure
Although there is insufficient research of water within the life-cycle of tourism infrastructure, Roselló-Batie, Molá, Cladera, andMartinez (2010) report that the use and construction of buildingsare responsible for 17 per cent of water consumptionworldwide. Ina life cycle analysis of three hotels in the Balearic Islands they foundthat water accounted for about 5 per cent of the total mass of theconstruction materials. According to Low (2005), concrete is thesecond most consumed material in the world after water, with VanOss and Padovani (2003) estimating that the annual worldwidewater consumption for cement hydration is approximately onebillion m3 of water. Tourism’s contribution to this is likely to besubstantial given that the major end uses of concrete are residentialbuildings (31 per cent), highways and roads (26 per cent) andindustrial and commercial buildings (18 per cent) with increasingsecond home ownership being a significant driver of increaseddemand in building materials (Low, 2005).
3.4. Fuel use
As outlined by UNESCO (2009) energy and water use are inter-linked, as water is needed for energy production (e.g. thermo-electric cooling, hydropower, minerals extraction and mining, fuelproduction, emission controls). Energy is also used for waterproduction (pumping, transport, treatment, desalination). Inparticular fuel production is water-intense, with the WorldwatchInstitute (2004) reporting that it takes 18 L of water to produce1 L of gasoline. As air travel entails an average energy consumptionof 4.1 L of fuel per passenger for every 100 km of flight distance(UNWTOeUNEPeWMO 2008), the average international air-basedtourist trip over 7600 km (return distance) would consequentlylead to embodied, “virtual” water use of 5600 L. This would beequivalent of the direct water use associatedwith a stay in a higher-standard resort hotel over a 14-day period (at 400 L per tourist perday).
Biofuels, currently seen by industry as having the greatestpotential for providing sustainable fuels, in particular for air trans-port (e.g. IATA, 2009), will also increase water use. For instance,UNESCO (2009: 11) reports that 44 km3 or 2 per cent of all irrigationwater are already allocated to biofuel production, with the realiza-tion of all current national biofuel policies and plans requiring anadditional 180 km3 of irrigationwater. Water use for the productionof bioethanol from sugarcane, corn, sugar beet, wheat and sorghumtripled between 2000 and 2007, and production of biodiesel fromoil- and tree-seeds such as rapeseed, sunflower, soybean, palm oil,
coconut and jatropha even increased 11-fold between 2000 and2007. The production of 1 L of liquid biofuels currently takes onglobal average 2500 L of water. Most of these biofuels are consumedin the European Union, the United States and Brazil, now including23 per cent ofmaize production in theUS (ethanol production) or 47per cent of vegetable oil produced in the EU (biodiesel) - andnecessitating higher imports of vegetable oil to meet domesticconsumption needs. Yet, biodiesel accounts for only 3 per cent offuel use in the European Union so far (UNESCO, 2009).
3.5. Food
Considerable amounts of water are also embodied in foodconsumption. UNESCO (2009) reports, for instance, that dependingon local climate, cop varieties and agricultural practices, it takes400e2000 L of water to produce 1 kg of wheat or 1000 to 20,000 Lof water to produce one kg of meat, depending on animal, feed andmanagement. Based on these figures, it is estimated that dailywater requirements to support human diets range from 2000 to5000 L of water per person per day, with an estimate of 1 L of waterfor 1 kcal of food. Of importance in the context of tourism is the factthat tourists may consume a greater share of higher-order, protein-rich foods with greater water footprints, while also requiringadditional energy for transport by air over large distances, forinstance in the case of small islands (Gössling Garrod, Aall, Hille, &Peeters, 2011). In conclusion, a 14-day holiday may involve wateruse for food exceeding 70 m3 of water.
Overall, water use in tourism can be considerable, and higherthan currently assumed in the literature. As shown in Table 3,indirect water use is likely to be more relevant than direct uses,within particular food consumption and fuel use constitutingimportant consumption categories e also because a higher share ofthis water use appears to be consumptive, i.e. lost to regional watercycles and unavailable for re-use, for instance as grey water.Moreover, Table 3 reveals that overall water use embodied ina holiday will vary considerably, depending in particular on hotelstandard, distance to the destination, as well as the type andamount of food consumed. These results would indicate that watermanagement in tourism should look beyond direct water use, andhave a close look at “sustainable” solutions currently seen aspromising, such as the greater use of biofuels in global transports.
4. Further aspects of tourism and water consumption
The following sections examine in more detail three importantaspects of the sustainability of global tourism-related water use,including i) spatial and temporal aspects of water use, ii) changes inwater quality, and iii) competing water uses.
The world’s major tourism flows occur between six regions,North America, the Caribbean, Northern and Southern Europe,North East Asia and South East Asia (WTO, 2003). Of the 715millioninternational tourist arrivals in 2002, 58 per cent took place within
S. Gössling et al. / Tourism Management 33 (2012) 1e15 9
Europe, 16 per cent in North and South East Asia and 12 per cent inNorth America. Together they represent 86 per cent of all interna-tional tourist arrivals. Within sub-regions, about 87 per cent of allinternational arrivals in Europe are from Europe itself (some 350million arrivals), while 71 per cent of international arrivals areregionally in the Americas (92 million), and 77 per cent in the AsiaPacific region (88 million). Six major tourist flows characterizeinternational travel: Northern Europe to the Mediterranean (116million), North America to Europe (23 million), Europe to NorthAmerica (15million), North East Asia to South East Asia (10million),North East Asia to North America (8 million) and North America tothe Caribbean (8 million).
Because tourists use more water when on holiday, here esti-mated at an average of 300 L per day (direct water use), than athome (160 L per day), tourism increases global water use; anargument also supported by Eurostat (2009: 16):
Water consumption by hotels is far higher than householdconsumption, due largely to the collective consumption of waterin hotels (watering of gardens that must be kept attractive, dailycleaning of rooms, filling of swimming pools, kitchen and aboveall, doing the laundry). Furthermore, holidaymakers havea ‘pleasure’ approach to the shower or bath and generally usemore water than they would normally.
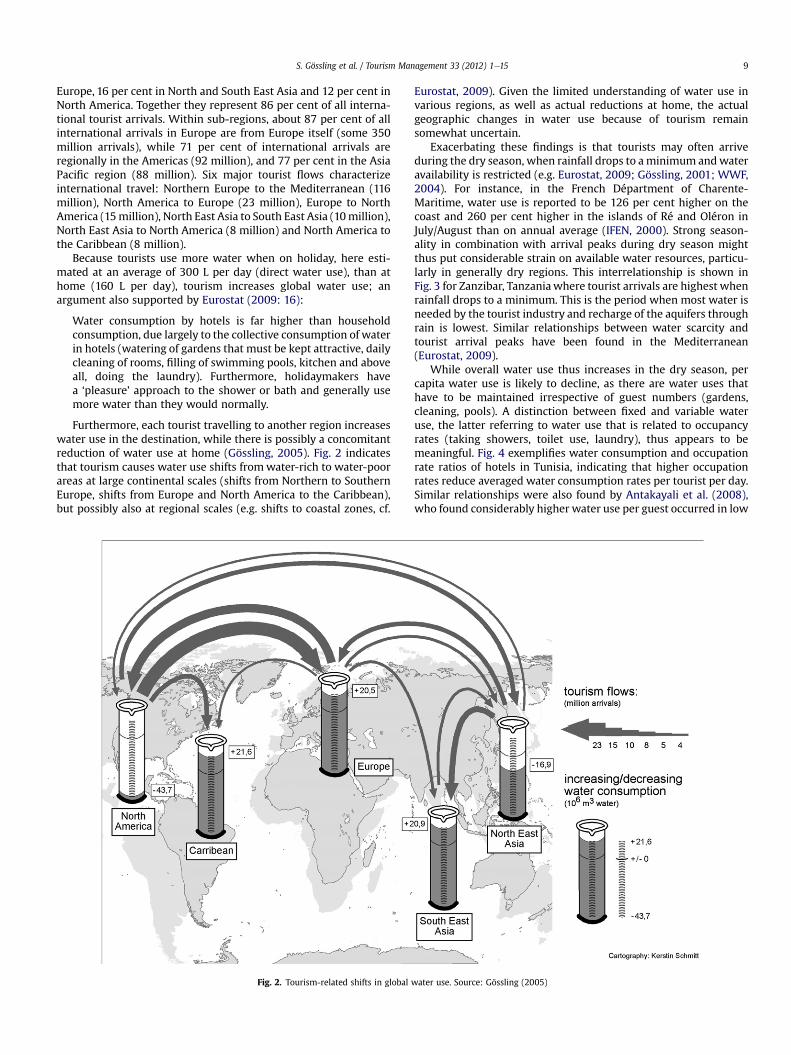
Furthermore, each tourist travelling to another region increaseswater use in the destination, while there is possibly a concomitantreduction of water use at home (Gössling, 2005). Fig. 2 indicatesthat tourism causes water use shifts fromwater-rich to water-poorareas at large continental scales (shifts from Northern to SouthernEurope, shifts from Europe and North America to the Caribbean),but possibly also at regional scales (e.g. shifts to coastal zones, cf.
Fig. 2. Tourism-related shifts in global
Eurostat, 2009). Given the limited understanding of water use invarious regions, as well as actual reductions at home, the actualgeographic changes in water use because of tourism remainsomewhat uncertain.
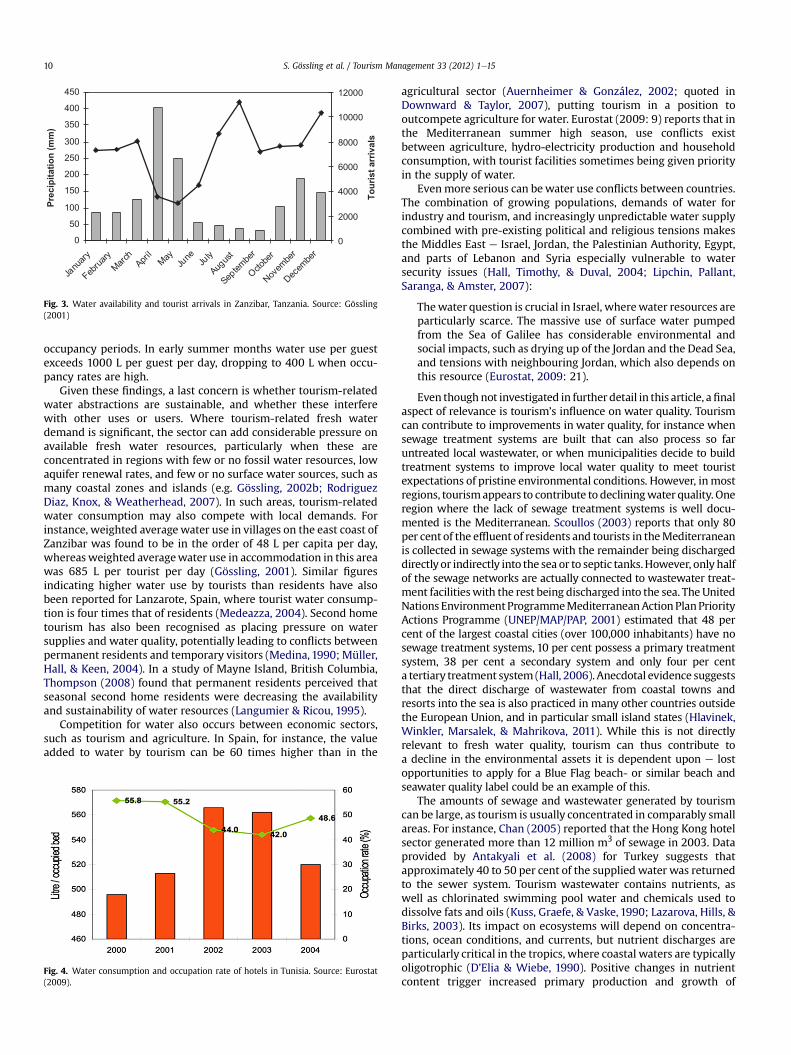
Exacerbating these findings is that tourists may often arriveduring the dry season, when rainfall drops to aminimum andwateravailability is restricted (e.g. Eurostat, 2009; Gössling, 2001; WWF,2004). For instance, in the French Départment of Charente-Maritime, water use is reported to be 126 per cent higher on thecoast and 260 per cent higher in the islands of Ré and Oléron inJuly/August than on annual average (IFEN, 2000). Strong season-ality in combination with arrival peaks during dry season mightthus put considerable strain on available water resources, particu-larly in generally dry regions. This interrelationship is shown inFig. 3 for Zanzibar, Tanzaniawhere tourist arrivals are highest whenrainfall drops to a minimum. This is the period when most water isneeded by the tourist industry and recharge of the aquifers throughrain is lowest. Similar relationships between water scarcity andtourist arrival peaks have been found in the Mediterranean(Eurostat, 2009).
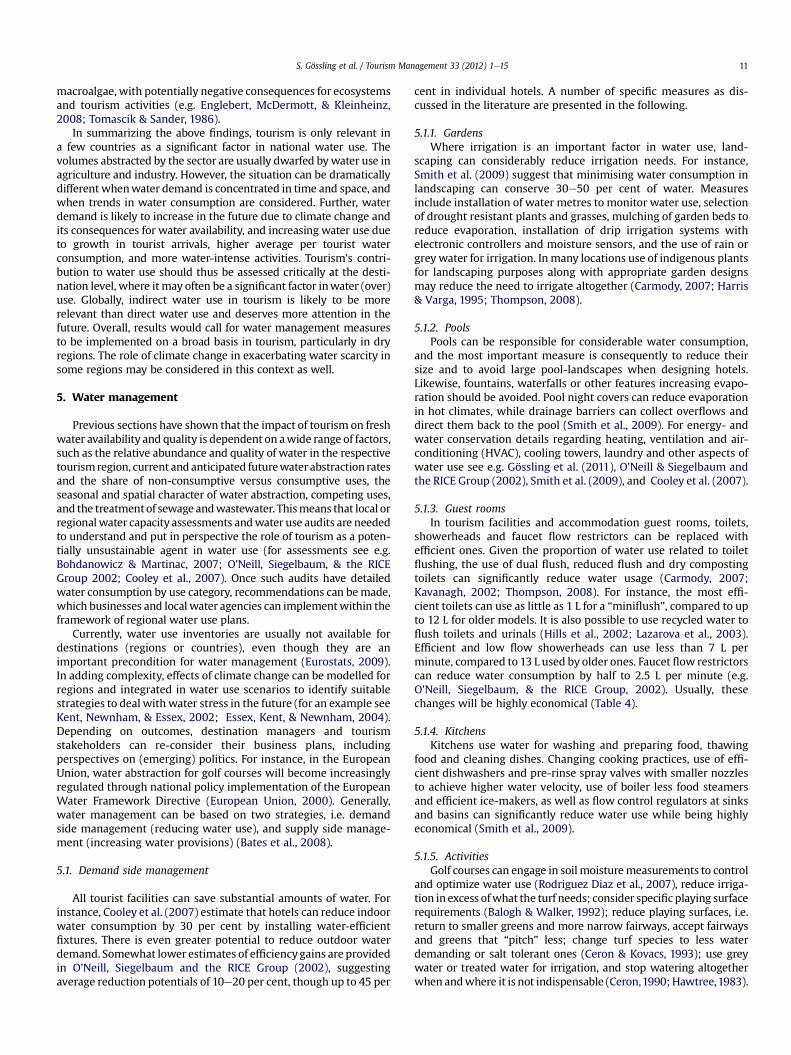
While overall water use thus increases in the dry season, percapita water use is likely to decline, as there are water uses thathave to be maintained irrespective of guest numbers (gardens,cleaning, pools). A distinction between fixed and variable wateruse, the latter referring to water use that is related to occupancyrates (taking showers, toilet use, laundry), thus appears to bemeaningful. Fig. 4 exemplifies water consumption and occupationrate ratios of hotels in Tunisia, indicating that higher occupationrates reduce averaged water consumption rates per tourist per day.Similar relationships were also found by Antakayali et al. (2008),who found considerably higher water use per guest occurred in low
water use. Source: Gössling (2005)
0
50
100
150
200
250
300
350
400
450
January
FebruaryMarch Ap
ril MayJune Ju
ly
August
September
October
November
December
Pre
cip
ita
tio
n (
mm
)
0
2000
4000
6000
8000
10000
12000
To
uris
t a
rriv
als
Fig. 3. Water availability and tourist arrivals in Zanzibar, Tanzania. Source: Gössling(2001)
S. Gössling et al. / Tourism Management 33 (2012) 1e1510
occupancy periods. In early summer months water use per guestexceeds 1000 L per guest per day, dropping to 400 L when occu-pancy rates are high.
Given these findings, a last concern is whether tourism-relatedwater abstractions are sustainable, and whether these interferewith other uses or users. Where tourism-related fresh waterdemand is significant, the sector can add considerable pressure onavailable fresh water resources, particularly when these areconcentrated in regions with few or no fossil water resources, lowaquifer renewal rates, and few or no surface water sources, such asmany coastal zones and islands (e.g. Gössling, 2002b; RodriguezDiaz, Knox, & Weatherhead, 2007). In such areas, tourism-relatedwater consumption may also compete with local demands. Forinstance, weighted averagewater use in villages on the east coast ofZanzibar was found to be in the order of 48 L per capita per day,whereas weighted averagewater use in accommodation in this areawas 685 L per tourist per day (Gössling, 2001). Similar figuresindicating higher water use by tourists than residents have alsobeen reported for Lanzarote, Spain, where tourist water consump-tion is four times that of residents (Medeazza, 2004). Second hometourism has also been recognised as placing pressure on watersupplies and water quality, potentially leading to conflicts betweenpermanent residents and temporary visitors (Medina, 1990; Müller,Hall, & Keen, 2004). In a study of Mayne Island, British Columbia,Thompson (2008) found that permanent residents perceived thatseasonal second home residents were decreasing the availabilityand sustainability of water resources (Langumier & Ricou, 1995).
Competition for water also occurs between economic sectors,such as tourism and agriculture. In Spain, for instance, the valueadded to water by tourism can be 60 times higher than in the
Fig. 4. Water consumption and occupation rate of hotels in Tunisia. Source: Eurostat(2009).
agricultural sector (Auernheimer & González, 2002; quoted inDownward & Taylor, 2007), putting tourism in a position tooutcompete agriculture for water. Eurostat (2009: 9) reports that inthe Mediterranean summer high season, use conflicts existbetween agriculture, hydro-electricity production and householdconsumption, with tourist facilities sometimes being given priorityin the supply of water.
Evenmore serious can bewater use conflicts between countries.The combination of growing populations, demands of water forindustry and tourism, and increasingly unpredictable water supplycombined with pre-existing political and religious tensions makesthe Middles East e Israel, Jordan, the Palestinian Authority, Egypt,and parts of Lebanon and Syria especially vulnerable to watersecurity issues (Hall, Timothy, & Duval, 2004; Lipchin, Pallant,Saranga, & Amster, 2007):
Thewater question is crucial in Israel, wherewater resources areparticularly scarce. The massive use of surface water pumpedfrom the Sea of Galilee has considerable environmental andsocial impacts, such as drying up of the Jordan and the Dead Sea,and tensions with neighbouring Jordan, which also depends onthis resource (Eurostat, 2009: 21).
Even thoughnot investigated in further detail in this article, afinalaspect of relevance is tourism’s influence on water quality. Tourismcan contribute to improvements in water quality, for instance whensewage treatment systems are built that can also process so faruntreated local wastewater, or when municipalities decide to buildtreatment systems to improve local water quality to meet touristexpectations of pristine environmental conditions. However, inmostregions, tourismappears to contribute to decliningwater quality. Oneregion where the lack of sewage treatment systems is well docu-mented is the Mediterranean. Scoullos (2003) reports that only 80per cent of the effluent of residents and tourists in theMediterraneanis collected in sewage systems with the remainder being dischargeddirectly or indirectly into the sea or to septic tanks.However, only halfof the sewage networks are actually connected to wastewater treat-ment facilitieswith the rest being discharged into the sea. The UnitedNations EnvironmentProgrammeMediterraneanActionPlanPriorityActions Programme (UNEP/MAP/PAP, 2001) estimated that 48 percent of the largest coastal cities (over 100,000 inhabitants) have nosewage treatment systems, 10 per cent possess a primary treatmentsystem, 38 per cent a secondary system and only four per centa tertiary treatment system (Hall, 2006). Anecdotal evidence suggeststhat the direct discharge of wastewater from coastal towns andresorts into the sea is also practiced in many other countries outsidethe European Union, and in particular small island states (Hlavinek,Winkler, Marsalek, & Mahrikova, 2011). While this is not directlyrelevant to fresh water quality, tourism can thus contribute toa decline in the environmental assets it is dependent upon e lostopportunities to apply for a Blue Flag beach- or similar beach andseawater quality label could be an example of this.
The amounts of sewage and wastewater generated by tourismcan be large, as tourism is usually concentrated in comparably smallareas. For instance, Chan (2005) reported that the Hong Kong hotelsector generated more than 12 million m3 of sewage in 2003. Dataprovided by Antakyali et al. (2008) for Turkey suggests thatapproximately 40 to 50 per cent of the supplied water was returnedto the sewer system. Tourism wastewater contains nutrients, aswell as chlorinated swimming pool water and chemicals used todissolve fats and oils (Kuss, Graefe, & Vaske, 1990; Lazarova, Hills, &Birks, 2003). Its impact on ecosystems will depend on concentra-tions, ocean conditions, and currents, but nutrient discharges areparticularly critical in the tropics, where coastal waters are typicallyoligotrophic (D’Elia & Wiebe, 1990). Positive changes in nutrientcontent trigger increased primary production and growth of
S. Gössling et al. / Tourism Management 33 (2012) 1e15 11
macroalgae, with potentially negative consequences for ecosystemsand tourism activities (e.g. Englebert, McDermott, & Kleinheinz,2008; Tomascik & Sander, 1986).
In summarizing the above findings, tourism is only relevant ina few countries as a significant factor in national water use. Thevolumes abstracted by the sector are usually dwarfed bywater use inagriculture and industry. However, the situation can be dramaticallydifferentwhenwater demand is concentrated in time and space, andwhen trends in water consumption are considered. Further, waterdemand is likely to increase in the future due to climate change andits consequences for water availability, and increasing water use dueto growth in tourist arrivals, higher average per tourist waterconsumption, and more water-intense activities. Tourism’s contri-bution to water use should thus be assessed critically at the desti-nation level, where itmay often be a significant factor inwater (over)use. Globally, indirect water use in tourism is likely to be morerelevant than direct water use and deserves more attention in thefuture. Overall, results would call for water management measuresto be implemented on a broad basis in tourism, particularly in dryregions. The role of climate change in exacerbating water scarcity insome regions may be considered in this context as well.
5. Water management
Previous sections have shown that the impact of tourism on freshwater availability and quality is dependent on awide range of factors,such as the relative abundance and quality of water in the respectivetourismregion, current andanticipated futurewaterabstraction ratesand the share of non-consumptive versus consumptive uses, theseasonal and spatial character of water abstraction, competing uses,and the treatmentof sewage andwastewater. Thismeans that local orregionalwater capacity assessments andwater use audits are neededto understand and put in perspective the role of tourism as a poten-tially unsustainable agent in water use (for assessments see e.g.Bohdanowicz & Martinac, 2007; O’Neill, Siegelbaum, & the RICEGroup 2002; Cooley et al., 2007). Once such audits have detailedwater consumption by use category, recommendations can bemade,which businesses and local water agencies can implementwithin theframework of regional water use plans.
Currently, water use inventories are usually not available fordestinations (regions or countries), even though they are animportant precondition for water management (Eurostats, 2009).In adding complexity, effects of climate change can be modelled forregions and integrated in water use scenarios to identify suitablestrategies to deal with water stress in the future (for an example seeKent, Newnham, & Essex, 2002; Essex, Kent, & Newnham, 2004).Depending on outcomes, destination managers and tourismstakeholders can re-consider their business plans, includingperspectives on (emerging) politics. For instance, in the EuropeanUnion, water abstraction for golf courses will become increasinglyregulated through national policy implementation of the EuropeanWater Framework Directive (European Union, 2000). Generally,water management can be based on two strategies, i.e. demandside management (reducing water use), and supply side manage-ment (increasing water provisions) (Bates et al., 2008).
5.1. Demand side management
All tourist facilities can save substantial amounts of water. Forinstance, Cooley et al. (2007) estimate that hotels can reduce indoorwater consumption by 30 per cent by installing water-efficientfixtures. There is even greater potential to reduce outdoor waterdemand. Somewhat lower estimates of efficiencygains are providedin O’Neill, Siegelbaum and the RICE Group (2002), suggestingaverage reduction potentials of 10e20 per cent, though up to 45 per
cent in individual hotels. A number of specific measures as dis-cussed in the literature are presented in the following.
5.1.1. GardensWhere irrigation is an important factor in water use, land-
scaping can considerably reduce irrigation needs. For instance,Smith et al. (2009) suggest that minimising water consumption inlandscaping can conserve 30e50 per cent of water. Measuresinclude installation of water metres to monitor water use, selectionof drought resistant plants and grasses, mulching of garden beds toreduce evaporation, installation of drip irrigation systems withelectronic controllers and moisture sensors, and the use of rain orgrey water for irrigation. In many locations use of indigenous plantsfor landscaping purposes along with appropriate garden designsmay reduce the need to irrigate altogether (Carmody, 2007; Harris& Varga, 1995; Thompson, 2008).
5.1.2. PoolsPools can be responsible for considerable water consumption,
and the most important measure is consequently to reduce theirsize and to avoid large pool-landscapes when designing hotels.Likewise, fountains, waterfalls or other features increasing evapo-ration should be avoided. Pool night covers can reduce evaporationin hot climates, while drainage barriers can collect overflows anddirect them back to the pool (Smith et al., 2009). For energy- andwater conservation details regarding heating, ventilation and air-conditioning (HVAC), cooling towers, laundry and other aspects ofwater use see e.g. Gössling et al. (2011), O’Neill & Siegelbaum andthe RICE Group (2002), Smith et al. (2009), and Cooley et al. (2007).
5.1.3. Guest roomsIn tourism facilities and accommodation guest rooms, toilets,
showerheads and faucet flow restrictors can be replaced withefficient ones. Given the proportion of water use related to toiletflushing, the use of dual flush, reduced flush and dry compostingtoilets can significantly reduce water usage (Carmody, 2007;Kavanagh, 2002; Thompson, 2008). For instance, the most effi-cient toilets can use as little as 1 L for a “miniflush”, compared to upto 12 L for older models. It is also possible to use recycled water toflush toilets and urinals (Hills et al., 2002; Lazarova et al., 2003).Efficient and low flow showerheads can use less than 7 L perminute, compared to 13 L used by older ones. Faucet flow restrictorscan reduce water consumption by half to 2.5 L per minute (e.g.O’Neill, Siegelbaum, & the RICE Group, 2002). Usually, thesechanges will be highly economical (Table 4).
5.1.4. KitchensKitchens use water for washing and preparing food, thawing
food and cleaning dishes. Changing cooking practices, use of effi-cient dishwashers and pre-rinse spray valves with smaller nozzlesto achieve higher water velocity, use of boiler less food steamersand efficient ice-makers, as well as flow control regulators at sinksand basins can significantly reduce water use while being highlyeconomical (Smith et al., 2009).
5.1.5. ActivitiesGolf courses can engage in soil moisturemeasurements to control
and optimize water use (Rodriguez Diaz et al., 2007), reduce irriga-tion in excess ofwhat the turf needs; consider specific playing surfacerequirements (Balogh & Walker, 1992); reduce playing surfaces, i.e.return to smaller greens and more narrow fairways, accept fairwaysand greens that “pitch” less; change turf species to less waterdemanding or salt tolerant ones (Ceron & Kovacs, 1993); use greywater or treated water for irrigation, and stop watering altogetherwhen andwhere it is not indispensable (Ceron,1990;Hawtree,1983).

Table 4Typical water-savings per guest room of a hotel in Australia.
Component Best Practice ExistingUsage
Saving per room Supply & installationCost
Description Payback Period(years)
kL/year $/year
Showers 9 L/min(AAA Rated)
15 L/min 28 $100 $50e$120 New showerhead, plus optionof flow control
0.5e2
Toilet 6/3 dual flush 11 L 17 $30 $400 New pan and cistern >5Basin 6 L/min 12 L/min 5.3 1$5 $20e$40 Flow control in spout or in taps 1.3e2.6Cleaning e e 3.7 $10 0 Typical saving 0Total: 54 $155 $470e$560 e 0e2.6
Source: Sydney Water (2001), quoted in Smith et al. (2009)
S. Gössling et al. / Tourism Management 33 (2012) 1e1512
Treated wastewater can also be used for watering parks and gardensas well as snowmaking (Tonkovic & Jeffcoat, 2002).
5.1.6. ManagementManagement can focus on educational programmes for staff,
and informative signs on how to save water, addressing tourists.Measuring water consumption and establishing benchmarks(Table 5) can help to better understand consumption patterns.Withregard to indirect water use, destinations can seek to reduceaverage travel distances and to increase the average length of stay,as well as to consider the choice of foods offered. Water-savingmeasures will also help to reduce sewage, for which treatmentwith closed organic matter flow cycles should be the standard(Appasamy, 1993). Greater use of recycled water for non-potableuses is also a way of reducing pressure on water supplies and isattracting increased interest from water management authoritiesand tourism businesses (Gikas & Tchobanoglous, 2009a, 2009b;Hills et al., 2002; Lazarova et al., 2003).
Overall, reducing water use will usually be economical. Fortuny,Soler, Cánovas, & Sánchez (2008) show, for instance, that manywater-saving technologies such asflow limiters on taps and showers,or lavatory cisterns with reduced flush options have short paybacktimes between 0.1 and 9.6 years, making them economicallyattractive (see alsoTable 4). However, as pointed out by Prettenthalerand Dalla-Via (2007), low water costs are a potential barrier toaction, which have, for instance, been quantified at 0.6 per cent ofturnover in Steiermark, Austria (Prettenthaler & Dalla-Via, 2007) or1.6 per cent of turnover inMorocco (Eurostat, 2009). This needs to beconsidered in water politics, which may focus on steeringconsumption through increases in costs, and where considerableincreases in water prices may be demanded to raise awareness andto engage stakeholders pro-actively in water-saving measures.
5.1.7. Supply side managementVarious technical options are available to increase available water
capacities. For instance, prospecting and extracting groundwater cansupply additional water in situations where sufficient waterresources are available while further attention can be given to usingrecycled water for non-potable urban uses such as toilet flushing(Lazarova et al., 2003). In the case of small islands, this may alsoinclude water abstraction from further inland, and distribution to
Table 5Benchmarks for hotel managers of the ACCOR group.
Consumption(m3)
Per occupiedroom
Per meal Gardens(per m2)
Formule 1 0.14 n.a. 0.3Etap 0.20 n.a. 0.3Ibis 0.26 0.05 0.3Mercure 0.34 0.08 0.3Novotel 0.31 0.08 0.3Sofitel 0.58 0.15 0.3
Source: ACCOR (1998).
coastal zones through pipelines (e.g. Bates et al., 2008; Gössling,2001). However, groundwater is extremely vulnerable to waterpollution as a result of poor sewage and water treatment infra-structure, while many coastal aquifers are also increasingly vulner-able to salinification as a result of sea-level rise often associated withground subsidence, itself due to excessive use of groundwater.Reservoirs and dams can increase storage capacities for areas orentire regions, while rainwater storage in cisterns can be a viablealternative for smaller hotels. Where only limited amounts of waterare used, sealed plant beds can be used to remove nutrients fromwastewater (cf. Gössling et al., 2011: 140e141). Desalination andwastewater reuse have been advocated as the best technologicalalternatives for arid region destinations such as Lis Cabos, Baja Cal-ifornia Sur, Mexico (Pombo, Brecada, & Aragón, 2008).
Desalination might currently be the most widely consideredoption to enhance water resources, but it increases energyconsumption and, in many areas not connected to the national grid,the dependence on imports of fuels to run generators, leading toconsiderable additional emissions of greenhouse gases. Desalinationis also costly, and can involve energy use of 3e12.5 kWh of electricity,corresponding to emissions of 1e10 kg CO2 per m3 of water, withlower values referring to state-of-the-art desalination plants (Gude,Nirmalakhandan, & Deng, 2010; Sadhwani & Veza, 2008). Someforms of desalination, such as distillation, can even involve energyuse of 25e200 kWh of electricity per m3 (Black & King, 2009). Gudeet al. (2010) argue that using renewable energy sources for desali-nation may not always be economical, particularly when involvingsmall-scale installations, while combined grid-renewable energyplants can produce freshwater with lower emissions and atcompetitive costs. Bermudez-Contreras, Thomson, and Infield (2008)consider renewable energy powered desalination systems aseconomically viable in water-scarce areas (for costs see alsoKavanagh, 2002).
More generally, the costs of dealing with current and futurewater demands under serious climate change scenarios are likely tobe considerable. Downward and Taylor (2007), for instance, reportthat meeting southern Spain’s anticipated water requirements ofan additional 1.063 billion m3 per year will cost V3.8 billion. InAustralia, actual and anticipated payments for national waterinitiatives, treatment plants to supply recycled water, pipelines anddrought aid payments to communities will total US$4.75 billion inthe period 2001e2015 (Bates et al., 2008). Globally, Parry et al.(2009a) estimate that dealing with water scarcity because ofclimate change will cost an additional US$9e11 billion per year.While Parry et al. (2009a) emphasise that this is likely to be anunder-estimate of the costs for adaptation, it is worth noting thatthe sum does not include costs to tourism-related lost assets suchas lakes, rivers and streams, lowering or loss of amenity values, ordeteriorating water quality (e.g. Blakemore & Williams, 2008;Englebert et al., 2008; Oliveira & Pereira, 2008). Even if onlya share of these costs would fall on tourism, these would never-theless advocate serious climate policy to curb emissions andgreater efforts in water management by businesses.

S. Gössling et al. / Tourism Management 33 (2012) 1e15 13
As outlined, many tourism stakeholders are likely to perceiveadaptation to climate change as being less costly, given that they onlydeal with direct operational costs. For instance, new seawater desali-nation plants can produce freshwater at costs as low asV0.45eV0.52per m3 over the 15e20 year design life of the facility (Albiac et al.,2003; cited in Downward & Taylor, 2007). This would indicate thatadditional costs inwater scarce areas for providing even high levels ofwater to tourists is not likely to act as an incentive for water conser-vation in coastal areas, as per tourist per day costs may on averageincrease by less than V1. Consequently, it is important for tourismstakeholders to understand that the overall costs of inaction are fargreater than technical adaptation costs, because theymay irreversiblyaffect important tourist assets and create unstable socio-economicsituations in many parts of the world.
6. Discussion and concluding remarks
Tourism depends to a considerable degree on water, which isboth a resource needed to provide services related to basic humanneeds, such as hygiene or food, as well as a precondition for fuelproduction, and an asset essential for a wide range of touristactivities, such as swimming in lakes or pools, or golf and wintersports. Furthermore, water is a central element of tourism land-scapes in various forms, from irrigated hotel gardens to whitewinter landscapes, to lakes and streams embedded in park land-scapes. Limited water availability, poor water quality or mediaportrayal of a water crisis can consequently do great harm to theimage of tourism destinations (Hall, 2010; Hall & Stoffels, 2006).
In comparison to water use in other economic sectors, tourism isusually less relevant, because in virtually all countries of the world,agriculture dwarfs tourism-related water consumption. However, insome countries, as well as regionally, tourism can be the main factorin water consumption. In such areas, it can increase direct pressureon already diminished water resources and compete with othereconomic sectors as well as the subsistence needs of local pop-ulations (Thiel, 2010). In addition, tourism can also contribute toa decline in downstream or destination water quality and potablewater supplies as a result of poor or no treatment of wastewater,which then enters aquifers and the water system (Dillon, 1997;Kocasoy, Mutlu, & Aylin Zeren Alagöz, 2008). Significantly, ina number of increasingly water-scarce regions such as the Mediter-ranean, the concentration of tourism in time and space as a result ofseasonal tourist demand, canplace enormous pressures on domesticand industrial water supplies as well as wastewater infrastructure,often at a period when they are least able to cope. Such situationsalso highlight the importance of analysing tourism’s water demandsat an appropriate temporal and spatial scale rather than just relyingon assessments conducted on an annual or national basis.
Results provided in this article suggest that direct water use intourism is anything from 80 to 2000 L per tourist per day, witha tendency for larger, resort-style hotels to use significantly morewater than smaller, less luxurious establishments. Depending ongeographical location and environmental and/or climate conditions,themainwater-consuming factors are irrigated gardens, swimmingpools, spa andwellness facilities, as well as golf courses, followed bycooling towers (where used), guest rooms and kitchens. However,while direct water use is more relevant for water management inthe destination, indirect water use is responsible for a greatercontribution to the overall amount of water used. In particular, foodand fuel production have been shown to have comparably largewater footprints: transport to the destination alone can more thandouble directwater use. Food is, perhaps, themost relevant factor inwater use, though people eat whether they travel or not, and theaddition tourism makes to water use through the consumption ofhigher-order food is not as yet identified.
Given the global growth in tourism, the trend towards higher-standard accommodation and more water-intense activities, whichare likely to coincide with changes in the global climate systemleading to declining water resources in many regions, pressure onwater resources and related water conflicts are bound to increase inmany destinations. As a consequence, tourism development inmanyareas of theworldmay become less sustainable or no longer feasible.This may be due to foregone opportunities to carry out certaintourism activities, declining water levels or lack of fresh wateravailability, costs associated with provisions of fresh water, ordeclining water quality. Impacts will ultimately depend on severalfactors, including the relative scarcity of freshwater in tourism areas,also with regard to seasonal aspects, competition with othereconomic sectors such as agriculture (e.g. Downward & Taylor, 2007),institutional contexts such as water policies, as well as the structureof the water industry (profit or social benefits) and of the touristindustry (small guesthouses or large resort hotels). Such situationswill clearly require a more integrated approach to tourism’s role inwatermanagement at a catchment level thanwhat has hitherto beenthe case (Hall & Härkönen, 2006; Matias, Gago, & Boavida, 2008).Furthermore, the increasing competition between tourism and otherusers, including the water rights and the food and water security oflocal people in a number of destinations raises fundamental ques-tions about the ethics and politics of water access.
In order to adapt to inevitable changes in water availability, aswell as to mitigate its own contribution to climate change and itspressure on limited water resources, tourism needs to engage inenergy and water management, focusing on policy (e.g. compliancewith national greenhouse gas reduction goals, building codes,measurement and charging of water consumption), management(e.g. including measures to reduce water use, treat sewage and reusewater), research and development (e.g. to implement renewableenergy-driven desalination; understanding the religious, philo-sophical and ethical issues of wastewater recycling and reuse), aswell as education and behavioural change to encourage tourists andstaff to engage in water-saving measures.
Even though a clear picture of the overall costs associated withunsustainable water use in tourism still has to emerge, it seemsbeyond doubt that most of the measures that can reduce water useare economical and that investments to ensure sustainable waterusewill help to secure a future for tourism. In the sameway that lifecycle analysis is beginning to investigate the full energy andemissions impacts of tourism infrastructure and transportation, soit also needs to be conductedwith water consumption. Investmentsin sustainable technologies and water conservation managementare thus key strategies to be pursued. However, it is likely thatstrong policy environments are required to achieve this, includingthe expanded use of economic incentives and appropriate waterpricing to encourage water conservation. This is because thetourism industry is not likely to make water use a key priority byitself, given the low cost of water in comparison to other opera-tional costs.
Acknowledgement
Part of this paper was developed through work done for theUNEP Green Economy Report, which is gratefully acknowledged.
References
ACCOR. (1998). Guide environnement. Paris.Albiac, J., Uche, J., Valero, A., Serra, L., Meyer, A., & Tapia, J. (2003). The economic
unsustainability of the Spanish National Hydrological Plan. Water ResourcesDevelopment, 19, 437e458.
Alexander, S. (2002). Green hotels: Opportunities and resources for success. ZeroWaste Alliance.
S. Gössling et al. / Tourism Management 33 (2012) 1e1514
Antakyali, D., Krampe, J., & Steinmetz, H. (2008). Practical application of wastewaterreuse in tourist resorts. Water Science and Technology, 57, 2051e2057.
Appasamy, P. (1993). Water supply and waste disposal strategies for Madras. Ambio,22(7), 442e448.
Arnell, N. W. (2004). Climate change and global water resources: SRES emissionsand socio-economic scenarios. Global Environmental Change, 14, 31e52.
Auernheimer, C., & González, G. (2002). Repercussions of the national hydrologicalplan on the Spanish Mediterranean coast (water versus tourism and agricul-ture). In: Presented at Agriculture and Urbanisation in the Mediterranean Region eEnabling Policies for Sustainable Development, Rabat, Morocco, 25e30th April2002.
Badré, M., Prime, J., & Ribière, G. (2009). Neige de culture: etat des lieux et impactenvironnementeaux. Note socio-economique. Paris: Conseil Général de l’Envir-onnement et du Développement Durable.
Baillon, J., & Ceron, J. (1991). L’essor du golf. Grenoble: Presses Universitaires deGrenoble.
Balogh, J. C., & Walker, W. J. (Eds.). (1992). Golf course management and construction.Environmental issues. Chelsea: Lewis publishers.
Bates, B. C., Kundzewicz, Z. W., Wu, S., & Palutikof, J. P. (2008). Climate change andwater. Technical paper of the intergovernmental panel on climate change. Geneva:IPCC Secretariat.
Bermudez-Contreras, A., Thomson, M., & Infield, D. G. (2008). Renewable energypowered desalination in Baja California Sur, Mexico. Desalination, 220, 431e440.
Black, M., & King, J. (2009). The atlas of water, mapping the world’s most criticalresource. London: Earthscan.
Blakemore, F., & Williams, A. (2008). British tourists’ valuation of a Turkish beachusing contingent valuation and travel cost methods. Journal of Coastal Research,24(6), 1469e1480.
Bohdanowicz, P., & Martinac, I. (2007). Determinants and benchmarking of resourceconsumption in hotels e case study of Hilton International and Scandic inEurope. Energy and Buildings, 39, 82e95.
Carbon Disclosure Project. (2010a). Carbon Disclosure Project reveals waterconstraints now a boardroom issue for global corporations. London: CarbonDisclosure Project. Media Release, 12 November, 2010.
Carbon Disclosure Project. (2010b). CDP Water Disclosure 2010 global report. Onbehalf of 137 investors with assets of US$16 trillion. Report written for CarbonDisclosure Project by ERM. London: Carbon Disclosure Project.
Carmody, J. A. (2007). Specialist accommodation operations in North Queensland:Environmental management, environmental attitudes and ecological sustainability.Unpublished PhD thesis, James Cook University.
Ceron, J. (1990). Composer avec la nature. Des parcours de golf “naturels” ou “rus-tiques”. Quels équipements pour quels prix? Golf et Développement local, Utopies etréalités. Paris: Ecole Nationale des Ponts et Chaussées.
Ceron, J., & Kovacs, J. C. (1993). Golf et environnement: un aperçu des principauxproblèmes. Le golf et le respect de l’en, vironnement. Les Arcs, France: Fédérationfrançaise de golf.
Chan, W. W. (2005). Partial analysis of the environmental costs generated by hotelsin Hong Kong. International Journal of Hospitality Management, 24, 517e531.
Chapagain, A. K., &Hoekstra, A. Y. (2008). The global component of freshwater demandand supply: an assessment of virtual water flows between nations as a result oftrade in agricultural and industrial products.Water International, 33(1), 19e32.
City West Water. (2006). Benchmarking fact sheets. Melbourne: City West Water.Cooley, H., Hutchins-Cabibi, T., Cohen, M., Gleick, P. H., & Heberger, M. (2007).
Hidden oasis. Water conservation and efficiency in Las Vegas. Boulder, Colorado:Pacific Institute, Oakland, California, and Western Resource Advocates.
D’Elia, C. F., & Wiebe, W. J. (1990). Biochemical nutrient cycles in coral reef ecosys-tems. In E. Dubinsky (Ed.), Ecosystems of the world. Coral reefs, Vol. 25 (pp. 49e74).New York: Elsevier Science Publishers.
Deng, S.-M., & Burnett, J. (2002). Water use in hotels in Hong Kong. InternationalJournal of Hospitality Management, 21, 57e66.
Dillon, P. (1997). Groundwater pollution by sanitation on tropical islands. Interna-tional Hydrological Programme. Paris: UNESCO.
Dorling, D. (2007). Worldmapper dataset 324: Domestic water use SASI. University ofSheffield. http://www.sheffield.ac.uk/sasi.
Downward, S. R., & Taylor, R. (2007). An assessment of Spain’s Programa AGUA andits implications for sustainable water management in the province of Almería,southeast Spain. Journal of Environmental Management, 82, 277e289.
Englebert, E. T., McDermott, C., & Kleinheinz, G. T. (2008). Effects of the nuisancealgae, Clophora, on Escherichia coli at recreational beaches in Wisconsin. Scienceof the Total Environment, 404, 10e17.
Essex, S., Kent, M., & Newnham, R. (2004). Tourism development in Mallorca. Iswater supply a constraint? Journal of Sustainable Tourism, 12(1), 4e28.
European Union. (2000). Directive 2000/60/EC of the European Parliament and of thecouncil establishing a framework for the community action in the field of water policy.Available from: http://ec.europa.eu/environment/water/water-framework/index_en.html.
Eurostat. (2009). Medstat II: ‘Water and tourism’ pilot study. Eurostat, EuropeanCommission. Available from: http://epp.eurostat.ec.europa.eu/cache/ITY_OFFPUB/KS-78-09-699/EN/KS-78-09-699-EN.PDF.
Food and Agriculture Organization (FAO). (2003). Review of water resource statisticsby country. Available at http://www.fao.org/ag/agl/aglw/aquastat/water_res/index.stm Accessed 09.08.04.
Food and Agriculture Organization (FAO). (2010). Summary table: Renewable waterresources in the world by country. Available from. http://www.fao.org/nr/water/aquastat/water_res/waterres_tab.htm Accessed 13.04.10.
Fortuny, M., Soler, R., Cánovas, C., & Sánchez, A. (2008). Technical approach fora sustainable tourism development. Case study in the Balearic Islands. Journal ofCleaner Production, 16, 860e869.
GFANC (German Federal Agency for Nature Conservation). (Ed.). (1997). Biodiversityand tourism: Conflicts on the world’s seacoasts and strategies for their solution.Berlin: Springer-Verlag.
Gikas, P., & Tchobanoglous, G. (2009a). The role of satellite and decentralizedstrategies in water resources management. Journal of Environmental Manage-ment, 90(1), 144e152.
Gikas, P., & Tchobanoglous, G. (2009b). Sustainable use of water in the AegeanIslands. Journal of Environmental Management, 90(8), 2601e2611.
Gössling, S. (2001). The consequences of tourism for sustainable water use ona tropical island: Zanzibar, Tanzania. Journal of Environmental Management,61(2), 179e191.
Gössling, S. (2002a). Global environmental consequences of tourism. Global Envi-ronmental Change, 12(4), 283e302.
Gössling, S. (2002b). Causes and consequences of groundwater use: Zanzibar,Tanzania. International Journal of Water, 2(2), 49e56.
Gössling, S. (2005). Tourism’s contribution to global environmental change: space,energy, disease and water. In C. M. Hall, & J. Higham (Eds.), Tourism recreationand climate change: International perspectives (pp. 286e300). Clevedon: ChannelView Publications.
Gössling, S. (2006). Tourism and water. In S. Gössling, & C. M. Hall (Eds.), Tourism &Global environmental change: Ecological, social, economic and political interrela-tionships (pp. 180e194). Abingdon: Routledge.
Gössling, S., Garrod, B., Aall, C., Hille, J., & Peeters, P. (2011). Food management intourism. Reducing tourism’s carbon ‘foodprint’. Tourism Management, 32,534e543.
Grenon, M., & Batisse, M. (1991). Futures for the Mediterranean Basin: The Blue Plan.New York: Oxford University Press.
Gude, G., Nirmalakhandan, N., & Deng, S. (2010). Renewable and sustainableapproaches for desalination. Renewable and Sustainable Energy Reviews, 14(9),2641e2654.
Hafez, A., & El Manharawy, S. (2002). Economics of seawater RO desalination in theRed Sea region, Egypt. Part 1. A case study. Desalination, 153, 335e347.
Hall, C. M. (2006). Tourism urbanization and global environmental change. InS. Gössling, & C. M. Hall (Eds.), Tourism and global environmental change:Ecological, economic, social and political interrelationships (pp. 142e156). Lon-don: Routledge.
Hall, C. M. (2010). Crisis events in tourism: subjects of crisis in tourism. CurrentIssues in Tourism, 13, 401e417.
Hall, C. M., & Härkönen, T. (Eds.). (2006). Lake tourism: An integrated approach tolacustrine tourism systems. Clevedon: Channel View Publications.
Hall, C.M.,&Stoffels,M. (2006). Lake tourisminNewZealand: sustainablemanagementissues. In C. M. Hall, & T. Härkönen (Eds.), Lake tourism: An integrated approach tolacustrine tourism systems (pp. 182e206). Clevedon: Channelview Press.
Hall, C. M., Timothy, D., & Duval, D. (2004). Security and tourism: towards a newunderstanding? Journal of Travel and Tourism Marketing, 15, 1e18.
Harris, R., & Varga, D. (1995). Jemby-Ringah lodge. In R. Harris, & N. Leiper (Eds.),Sustainable tourism: An Australian perspective. Chatswood: Butterworth-Heinemann.
Hawtree, F. W. (1983). The golf course. planning, design, construction and mainte-nance. London: Spon.
Hills, S., Birks, R., & McKenzie, B. (2002). The Millennium Dome “Watercycle”experiment: to evaluate water efficiency and customer perception at a recyclingscheme for 6 million visitors. Water Science and Technology, 46(6e7), 233e240.
Hlavinek, P., Winkler, I., Marsalek, J., & Mahrikova, I. (Eds.). (2011). Advancedwater supply and wastewater treatment: A road to safer society and environ-ment. Dortrecht: Springer Science.
Hoekstra, A. Y., & Hung, P. Q. (2002). Virtual water trade: a quantification of virtualwater flows between nations in relation to international crop trade. InValue ofwater research report series, No. 11. Delft, the Netherlands: UNESCO-IHE.
IATA (International Air Transport Association). (2009). The IATA technology roadmapreport. Available from. http://www.iata.org/NR/rdonlyres/8FC59023-919D-4719-8CEE-F20FF1BAB181/0/Technology_Roadmap_May2009.pdf.
IFEN. (2000). Tourisme, environnement, territoires: les indicateurs. Orléans: IFEN.IPCC. (2007). Climate change 2007: impacts, adaptation and vulnerability. In
M. L. Parry, O. F. Canziani, J. P. Palutikof, P. J. van der Linden, & C. E. Hanson (Eds.),Contribution of working group II to the fourth assessment report of the intergov-ernmental panel on climate change. Cambridge: Cambridge University Press.
Kavanagh, L. J. (2002). Water management and sustainability at Queensland touristresorts. Gold Coast: CRC for Sustainable Tourism.
Kent, M., Newnham, R., & Essex, S. (2002). Tourism and sustainable water supply inMallorca: a geographical analysis. Applied Geography, 22, 351e374.
Kocasoy, G., Mutlu, H._I, & Aylin Zeren Alagöz, B. (2008). Prevention of marineenvironment pollution at the tourism regions by the application of a simplemethod for the domestic wastewater. Desalination, 226(1e3), 21e37.
Kuss, F. R., Graefe, A. R., & Vaske, J. J. (1990). Visitor impact management. A review ofresearch (Vol. 1). Washington D.C.: National Parks and Conservation Association.
Lamei, A. (2009). A technical economic model for integrated water resourcesmanagement in tourism dependent arid coastal regions; the case of Sharm ElSheikh, Egypt. AK Leiden: CRC Press/Balkema.
Lamei, A., Tilmant, A., van der Zaag, P., & Imam, E. (2009). Dynamic programming ofcapacity expansion for reverse osmosis desalination plant: Sharm El Sheikh,Egypt. Water Science and Technology: Water Supply, 9, 233e246.
S. Gössling et al. / Tourism Management 33 (2012) 1e15 15
Lamei, A., von Münch, E., Imam, E., & van der Zaag, P. (2006). A model for calculationof water demand by the tourism industry. In: Integrated Water ResourcesManagement Conference and Challenges of the Sustainable Development (MoroccanCommittee of the International Association of Hydrogeologists), Marrakech,Morocco, 23e25 May.
Lamei, A., von Münch, E., van der Zaag, P., & Imam, E. (2009). Optimum contractedfor potable water supply for hotels in arid coastal regions. Water Science andTechnology, 59(8), 1541e1550.
Langumier, A., & Ricou, C. (1995). Le fonctionnement estival des services d’eau dans lescommunes du littoral normand. Analyse de l’impact des populations et activitéssaisonnières. Paris: Agence de l’eau Seine Normandie.
Lazarova, V., Hills, S., & Birks, R. (2003). Using recycled water for non-potable, urbanuses: a review with particular reference to toilet flushing. Water Science andTechnology: Water Supply, 3(4), 69e77.
Lipchin, C., Pallant, E., Saranga, D., & Amster, A. (Eds.). (2007). Integrated waterresources management and security in the Middle East. Dordrecht: Springer.
Low, M.-S. (2005).Material flow analysis of concrete in the United States. UnpublishedMaster of Science in Building Technology thesis, Massachusetts: Institute ofTechnology.
Matias, N.-G., Gago, J., & Boavida, M.-J. (2008). Catchment consultation for watermanagement: the case of two Portuguese reservoirs with different waterquality. International Journal of Environmental Studies, 65, 737e754.
von Medeazza, G. M. (2004). Water desalination as a long-term sustainable solutionto alleviate global freshwater scarcity? A northesouth approach. Desalination,169, 287e301.
Medina, A. L. (1990). Possible effects of residential development on streamflow,riparian plant communities, and fisheries on small mountain streams in centralArizona. Forest Ecology and Management, 33-34, 351e361.
Meyer, A., & Chaffee, C. (1997). Life-cycle analysis for design of the Sydney OlympicStadium. Renewable Energy, 10, 169e172.
Müller, D., Hall, C. M., & Keen, D. (2004). Second home tourism: impact, manage-ment and planning issues. In C. M. Hall, & D. K. Müller (Eds.), Tourism, mobilityand second homes: Between elite landscape and common ground (pp. 15e32).Clevedon: Channelview Publications.
O’Neill, Siegelbaum, & The RICE Group. (2002). Hotel water conservation, A Seattledemonstration. Seattle: Seattle Public Utilities Resource Conservation Section.
Oliveira, P., & Pereira, P. T. (2008). Who values what in a tourism destination? Thecase of Madeira Island. Tourism Economics, 14(1), 155e168.
Organization for Economic Co-operation and Development. (2007). “Climate changeimpacts and adaptation in winter tourism,” climate change in the European Alps:Adapting winter tourism and natural hazards management. Paris: Organizationfor Economic Co-operation and Development. 25e60.
Parry, M., Arnell, N., Berry, P., Dodman, D., Fankhauser, S., Hope, C., et al. (2009a).Assessing the costs of adaptation to climate change: A review of the UNFCCC andother recent estimates. London: International Institute for Environment andDevelopment and Grantham Institute for Climate Change.
Parry, M., Lowe, J., & Hanson, C. (2009b). Overshoot, adapt and recover. Nature, 485,1102e1103.
Peeters, P. M., & Dubois, G. (2010). Exploring tourism travel under climate changemitigation constraints. Journal of Transport Geography, 18, 447e457.
Pigram, J. J. J. (1995). Resource constraints on tourism: water resources andsustainability. In R. W. Butler, & D. Pearce (Eds.), Change in tourism: People,places, processes (pp. 208e228). London: Routledge.
Pombo, A., Brecada, A., & Aragón, A. V. (2008). Desalinization and wastewater reuseas technological alternatives in an arid, tourism booming region of Mexico.Frontera Norte, 20(39), 191e216.
Prettenthaler, F., & Dalla-Via, A. (Eds.). (2007).Wasser und Wirtschaft im Klimawandel.Konkrete Ergebnisse am Beispiel der sensiblen Region Oststeiermark. Studien zumKlimawandel in Österreich. Vienna: Austrian Academy of Sciences Press.
Prideaux, B., & Cooper, M. (Eds.). (2009). River tourism. Wallingford: CABI.Rico-Amoros, A. M., Olcina-Cantos, J., & Sauri, D. (2009). Tourist land use patterns
and water demand: evidence from the western Mediterranean. Land Use Policy,26, 493e501.
Rodriguez Diaz, J. A., Knox, J. W., & Weatherhead, E. K. (2007). Competing demandsfor irrigation water: golf and agriculture in Spain. Irrigation and Drainage, 56,541e549.
Roselló-Batie, B., Molá, A., Cladera, A., & Martinez, V. (2010). Energy use, CO2emissions and waste throughout the life cycle of a sample of hotels in theBalearic Islands. Energy and Buildings, 42, 547e558.
Sadhwani, J. J., & Veza, J. M. (2008). Desalination and energy consumption in CanaryIslands. Desalination, 221, 143e150.
Scherb, K. (1975). Die Abwasserbeseitigung auf Campingplätzen. InWasser für dieErholungslandschaft. Münchner Beiträge zur Abwasser-Fischerei und Flußbiologie,Vol. 26. München: Bayerische Versuchsanstalt München.
Scott, D. (2005). Global environmental change and mountain tourism. In S. Gössling,& C. M. Hall (Eds.), Tourism and global environmental change: ecological, social,economic and political interrelationships (pp. 54e75). London: Routledge.
Scott, D., Hall, C. M., & Gössling, S. (2011). Climate change and tourism: Impacts,adaptation and mitigation. London: Routledge.
Scoullos, M. J. (2003). Impact of anthropogenic activities in the coastal region ofthe Mediterranean Sea. In: International Conference on the SustainableDevelopment of the Mediterranean and Black Sea Environment, May, Thessa-loniki, Greece.
Sebake, T. N., & Gibberd, J. T. (2008). Assessing the sustainability performance of the2010 FIFA World Cup stadia using the sustainable building assessment tool(SBAT) for stadia. In: 5th Post Graduate Conference on Construction IndustryDevelopment, Bloemfontein, South Africa, 16e18 March 2008, Available at: http://researchspace.csir.co.za/dspace/handle/10204/3238.
Smart, A. W., & Fleming, W. M. (1985). Consumptive water use in artificial snow-making. Santa Fe ski area, New Mexico. New Mexico State Engineer Office,Technical Report #45. Available from: http://www.ose.state.nm.us/PDF/Publications/Library/TechnicalReports/TechReport-045.PDF.
Smith, M., Hargroves, K., Desha, C., & Stasinopoulos, P. (2009). Water transformed eAustralia: Sustainable water solutions for climate change adaptation. Australia: TheNatural Edge Project (TNEP). Available at: http://wwwnaturaledgeproject.net/Sustainable_Water_Solutions_Portfolio.aspx.
Sydney Water. (2001). Save water, money & the environment e Hotels. Australia.The Natural Edge Project. (2008). Sustainable water factsheet. Canberra: Tourism
Australia.Thiel, A. (2010). Constructing a strategic, national resource: European policies and
the up-scaling of water services in the Algarve, Portugal. EnvironmentalManagement, 46, 44e59.
Throssell, C. S., Lyman, G. T., Johnson, M. E., Stacey, G. A., & Brown, C. D. (2009). Golfcourse environmental profile measures water use, source, cost, quality, andmanagement and conservation strategies. Online. Applied Turfgrass Science.doi:10.1094/ATS-2009-0129-01-RS.
Thompson, S. (2008). Assessing water resource management in a small island lifestylecommunity. Unpublished Masters of Resource Management (Planning) researchproject. School of Resource and Environmental Management, Simon FraserUniversity.
Tomascik, T., & Sander, F. (1986). Effects of eutrophication on reefbuilding corals. II.Structure of scleractinian coral communities on fringing reefs, Barbados, WestIndies. Marine Biology, 94, 53e75.
Tonkovic, Z., & Jeffcoat, S. (2002). Wastewater reclamation for use in snow-makingwithin an alpine resort in Australia e resource rather than waste. Water Science& Technology, 46(6/7), 297e303.
UNDP (United Nations Development Programme). (2007). Human developmentreport 2007/2008. Fighting climate change: Human solidarity in a divided world.New York: UNDP.
UNESCO. (2009). United Nations world water development report 3. Water ina Changing World. Available from. http://www.unesco.org/water/wwap/wwdr/wwdr3/pdf/WWDR3_Water_in_a_Changing_World.pdf.
United Nations Environment Programme Mediterranean Action Plan PriorityActions Programme (UNEP/MAP/PAP). (2001). White paper: Coastal zonemanagement in the Mediterranean. Split: Priority Actions Programme.
United Nations World Tourism Organization (UNWTO) (2010). Compendium oftourism statistics (2010 ed.) Madrid World Tourism Organization.
UNWTO, UNEP and WMO (UN World Tourism Organization, United Nations Envi-ronment Programme and World Meteorological Organization). (2008). Climatechange and tourism: Responding to global challenges. Paris & Madrid: UNWTO &UNEP.
Van der Meulen, F., & Salman, A. H. P. M. (1996). Management of Mediterraneancoastal dunes. Ocean and Coastal Management, 30(2e3), 177e195.
Van Oss, H. G., & Padovani, A. C. (2003). Cement manufacture and the environment.Part II. Environmental challenges and opportunities. Journal of IndustrialEcology, 7(1), 93e126.
Vörösmarty, C. J., Green, P., Salisbury, J., & Lammers, R. B. (2000). Global waterresources: vulnerability from climate change and population growth. Science,289, 284e288.
World Resources Institute (WRI). (2003). World resources 2002e2004, data tables.Available at: http://www.wri.org.
World Tourism Organization (WTO). (2001). Tourism 2020 vision. Madrid: WorldTourism Organization.
World Tourism Organization (WTO). (2003). Compendium of tourism statistics, 2003edition. Madrid: World Tourism Organization.
World Wide Fund for Nature (WWF). (2001). Tourism threats in the Mediterranean.Gland, WWF Switzerland: WWF Background Information.
WorldWideFundforNature (WWF). (2004).FreshwaterandtourismintheMediterranean.Available at: http://www.panda.org/downloads/europe/medpotourismreportfinal_ofnc.pdf.
Worldwatch Institute. (2004). Rising impacts of water use. http://www.worldwatch.org/topics/consumption/sow/trendsfacts/2004/03/03/.
Zaizen, M., Urakawa, T., Matsumoto, Y., & Takai, H. (2000). The collection of rain-water from dome stadiums in Japan. Urban Water, 1, 355e359.